designing a decision support system for the best employee
TRANSCRIPT
International Journal of Engineering and Emerging Technology, Vol. 3, No. 2, July—December 2018
(p-issn: 2579-5988, e-issn: 2579-597X)
51
Designing a Decision Support System for the Best
Employee Selection Using AHP Method Case Study
PT. Z Bali
I Gusti Ngurah Wira Partha1*, Philipus Novenando Mamang Weking2, and Yanu Prapto Sudarmojo3
1,2 Department of Electrical and Computer Engineering, Post Graduate Program, Udayana University
3 Department of Electrical and Computer Engineering, Udayana University *Email : [email protected]
Abstract—The chairman and owner of PT.
Z Bali considers the employees who work in
his company to be very important for the
continuity of the industry in his company, so
he is very concerned about what the employees
need. His attention to the needs of his
employees is realized by giving bonuses to
employees who have the best performance in
the company. Periodically he assigns tasks to
the Human Resources Department (HRD) in
his company to process the best employee
selection or employees who have good quality
work.
But the best employee selection process at
PT. Z Bali is still done manually and only
based on the subjectivity of the HRD, this led
to the HRD has trouble making decisions, so
sometimes there is an employee who obtained
the title of the best people by just looking at
the first criteria, but these employees have not
been certainly excelled on some other criteria.
Therefore, the purpose of this research is to
Designing a Decision Support System for the
Best Employee Selection Using AHP Method
Case Study PT. Z Bali to be able to help the
difficulties that are being faced by the Human
Resources Department (HRD) at PT. Z Bali.
Keywords—Decision Support System,
Employee, Best Employee Selection, AHP.
I. INTRODUCTION
Along with the development of technology and
the demands of the development of the times, the
company's need for quality employees is also
increasing. One way to improve the quality of
employees of the company is by giving bonuses
to employees who have given their best
contribution and ability to the company.
This was also applied by the chairman and
owner of PT. Z Bali. He gives bonuses to
employees who have good performance in their
company. Periodically he gives assignments to
the Human Resources Department (HRD) in his
company to process the best employee selection
or employees who have good quality work.
But the best employee selection process at PT.
Z Bali is still done manually and only based on
the subjectivity of the HRD, this led to the HRD
has trouble making decisions, so sometimes there
is an employee who obtained the title of the best
people by just looking at the first criteria, but
these employees have not been certainly excelled
on some other criteria.
To overcome this problem there needs to be a
renewal in the process of assessing existing
employees. One of the steps to renewal is by
Designing a Decision Support System for the Best
Employee Selection Using the AHP Method Case
Study PT. Z Bali. This system is expected to
provide a structured and accurate assessment. The
HRD will have a system that will assist in the
assessment of employee performance, so that the
decision will be stronger because it is supported
by a system that provides detailed assessments.
Likewise with employees, employees will be
more satisfied in accepting the decision of the
HRD, because the employee gets a clear
assessment and feels the decision given by the
HRD is not unilateral.
(p-issn: 2579-5988, e-issn: 2579-597X)
52
II. THEORETICAL BASIS
A. Waterfall Method
The waterfall method is often called the
classical life cycle, where it describes a
systematic and sequential approach to software
development, starting with the specification of
user needs and then going through the stages of
planning, modeling, construction, and the
delivery of the system to customers / users, which
ends with support for the complete software
produced (Pressman, 2012). The stages of the
waterfall method of the system to be designed
and built are as follows :
1. Requirement Analysis
At this stage the system developer will
communicate with the user who aims to
understand the software that is expected by the
user and the limitations of the software. This
information is obtained through interviews,
discussions or direct surveys. Information is
analyzed to obtain data needed by the user.
2. System Design
The specification of requirements from the
previous stage will be studied and in this phase
the design of the system will be prepared. System
design helps in determining hardware, system
requirements, and also helps in defining the
overall system architecture.
3. Implementation
At this stage, the system was first developed
in a small program called the unit, which was
integrated in the next stage. Each unit is
developed and tested for functionality called unit
testing.
4. Integration & Testing
All units developed in the implementation
phase will be integrated into the system after
testing carried out by each unit. After integration
the entire system is tested to check for any
failures or errors.
5. Operation & Maintenance
The final stage in the waterfall model.
Software that has been created, carried out and
carried out maintenance. Maintenance includes
repairing errors not found in the previous step..
B. PIECES Analysis
To identify problems, an analysis of
performance, information, economy, application
security, efficiency and services must be carried
out. This guide is known as PIECES analysis
(Performance, Information, Economy, Control,
Efficiency, Service). Through this analysis that
will come to the surface is not the main problem,
but only the symptoms of the main problem.
The following are the main components in the
PIECES analysis of the best employee selection
system that is still running at PT. Z Bali:
1. Performance
The best selection of employees is done
manually and uses assessment criteria that are not
standardized so as to produce unsatisfactory
ratings for employees.
2. Information
Information about the results of selecting the
best employees is considered less transparent,
less accurate, and less satisfying by employees
because it is only based on the subjectivity of the
HRD only.
3. Economy
The costs incurred by the company for the
process of selecting the best employees are quite
high, this is because the process uses a lot of
paper and various kinds of Office Stationery.
4. Control
Employee selection data are still vulnerable to
manipulation by irresponsible people because the
process is still manual and has not used consistent
selection criteria.
5. Efficiency
The process of selecting the best employees is
quite complicated so it requires a long time for
HRD to provide the best employee election report
to the owner and employees, so that this is
considered inefficient for some parties because a
lot of time is wasted just to complete the process.
6. Service
There are often mistakes in the best employee
selection data processing process, resulting in
(p-issn: 2579-5988, e-issn: 2579-597X)
53
inaccurate, inconsistent and unsatisfactory
decisions for employees.
C. Decision Support Systems
Decision Support System is a system that
works as a problem solving team, which supports
a person or a small group of managers in finding
solutions to semi-structured problems that work
as problem solving teams, by providing
information relating to specific decisions.
The concept of this decision support system
was first put forward by Michael S. Scoott
Morton in the early 1970s by Micheal S. Scott
Morton with the term Decision Management
System. Marton defined the DSS as "Interactive
Computer-Based System, which helps decision
makers to use data and various models to solve
unstructured problems".
The use of AHP begins by making a
hierarchical structure of the problem
(decomposition), comparing the variables
between variables, doing analysis / evaluation,
and determining the best alternatives (Saaty,
1993).
D. AHP (Analytical Hierarchy Process)
The decision making process is basically
choosing an alternative. The main equipment of
the Analytical Hierarchy Process (AHP) is a
functional hierarchy with the main input of
human perception. With hierarchy, a complex
and unstructured problem is solved into groups.
Then the groups are organized into a hierarchical
form.
Analytical Hierarchy Process (AHP) or
Analytical Hierarchy Process is a device for
decision making. The form is simple, flexible and
powerful (powerful) to support a multi-criteria
decision process, multi-purpose and full of
complex situations. This device is also often used
to make choices from various difficult
alternatives.
AHP is widely used because it can develop a
person's ability to use logic in dealing with
complex and complex problems. This is possible
because AHP provides a procedure for
prioritizing rigid choices, whether it is alternative
action, planning or policy.
AHP works based on a combination of inputs
sharing considerations from decision makers
based on information about the supporting
elements of the decision, namely to determine a
set of priority measurements in order to evaluate
various alternatives to be taken in a product
decision.
III. METHODOLOGY
A. Research Location
The author conducted research at PT. Z Bali.
The author conducts research using the
observation method on the work process that
occurs in HRD, and during the observation
process the author also collects the data needed
during the research at that location by using the
documentation method, then the author collects
information through interviews with HRD from
PT. Z Bali.
B. Data Sources
Data collection method is a method used to
collect data needed in research. The method used
in this study is:
1. Primary Data
The primary data used in this study are
observational data from the system and work
processes that occur at the study site and data
from interviews with HRD from PT. Z Bali.
2. Secondary Data
Secondary data used in this study are books,
journals, documentation data from research
locations both in the form of documents, images,
photographs and electronics, as well as data from
various sources that support the basic concepts of
information systems, internet, websites, software,
and databases.
C. Data Collection Techniques
1. Observation
The author made observations at PT. Z Bali.
The author observes the work process at PT. Z
Bali is in the process of selecting the best
employees who will be entitled to get a bonus
from the company..
2. Interview
In this interview the author needs to get data
on the type of program or application that is in
accordance with the needs of the owner and the
HRD so that the best employee selection process
at PT. Z Bali is faster, more effective, the
calculations are more valid and the results
(p-issn: 2579-5988, e-issn: 2579-597X)
54
obtained are more accurate. The author
interviewed HRD from PT. Z Bali.
3. Literature
The data and information obtained from the
literature come from books, journals and data
from various sources that support the basic
concepts of information systems, the internet,
websites, software, and databases.
D. Research Materials
The research material is in the form of data
obtained through data collection techniques that
have been carried out.
E. Research Instruments
The research tool used by researcher to
Designing a Decision Support System for the
Best Employee Selection Using the AHP Method
Case Study PT. Z Bali is an Acer Aspire laptop
with the following details as a specification of a
research tool:
1. Hardware
a. Processor : intel Core i3
b. Memory : 2 GB DDR3
c. Hard Disk : 500 GB
2. Software
a. Operating System : Windows 7
Ultimate
b. Data Processing : Microsoft Office
2016
c. System Design : Visual Studio 2010
F. Research Flow
The following are the steps in the research,
starting from defining the problem to drawing
conclusions:
1. Defining the problem of the system created.
2. Collecting data and library studies related
to decision support systems, and AHP
(Analytical Hierarchy Process) methods.
3. Learn and understand the processes that
occur in the system created.
4. Designing the user interface of the
Decision Support System for the Best
Employee Selection Using the AHP
Method Case Study PT. Z Bali.
5. Taking conclusions.
G. System Analysis
System analysis is done by the author to
determine the process that must be done to solve
the existing problems. The goal that is carried out
after the system analysis stage is to ensure that
the system analysis is on the right track.
The best selection of employees is a way to
improve employee performance in the company.
Selection of the best employees at PT. Z Bali is
one way to improve employee performance, not
only performance but also motivates employees
to work and develop the company where they
work. Selection of the best employees at PT. Z
Bali is done by giving an assessment in
accordance with the criteria set by the company.
The name of the criteria at PT. Z Bali, can be seen
in Table 3.1.
No. Criteria Name of
Criteria
1 C1 Discipline
2 C2 Responsible
3 C3 Skill
4 C4 Cooperation
Table 3.1 Criteria Name of the Best Employee
Staff
Selection of the best employees at PT. Z Bali
is done by giving an assessment to each employee
of the criteria that have been set then added up.
For employees who have the highest value, the
employee is entitled to be awarded as the best
employee.
H. Analysis of the New System
The new system that will be built utilizes a
decision support system in determining the final
outcome and the decision in determining the best
employee, because the decision support system
can solve the problem with the existing criteria.
In the system, the calculation process of pairing
is done between criteria, looking for consistency
index values, consistency ratio values, priority
(p-issn: 2579-5988, e-issn: 2579-597X)
55
weight values which are processes with the AHP
method.
I. Data Analysis
At this stage analysis of the data used in
building a database so that the system can run as
expected. The data that will be entered into the
system are interrelated between one data and the
other data. Existing data relations will become a
single unified database. The data needed by the
system are as follows:
1. Account Data (admin).
2. Data on user access rights to the system..
3. Alternative data (department, position,
employee).
4. Criteria data
Criteria data explain the criteria used as
employee evaluations, namely:
a. Discipline
on time, attendance and comply with
regulations and SOPs.
b. Responsible
carry out the tasks given by the boss.
c. Skill
ability possessed.
d. Cooperation
ability to work well together with superiors,
fellow employees and other colleagues.
5. Alternative weight data
In the form of data on the weight of
employee values against existing criteria.
6. Criteria weighting data
Data in the form of weight values of
importance of criteria one compared to
other criteria.
7. Data involved in the AHP calculation
process.
It is the result of processing master data
(criteria, departments, positions and
employees) with value weight data from
each master data (alternative weights and
criteria weights) with the AHP process.
The AHP process describes data:
1. Comparison of AHP paired matrices
(criteria and alternatives),
2. Eigen value (criteria),
3. Lamda max value,
4. CI value,
5. CR value where CR <0.1,
6. Alternative weight matrix of criteria,
7. Decision matrix.
J. AHP
After the data is entered (company data,
department data, job data, employee data, and
criteria data), a calculation is performed using the
AHP method. The problem that must be
formulated in carrying out calculations using the
AHP method is to determine the value of Priority,
CI and CR of the criteria and sub criteria, which
will later be used as the basis for evaluating each
employee. This assessment is the most important
decision in determining the best employees,
because the determination of the best employees
is the goal to be achieved in building this system.
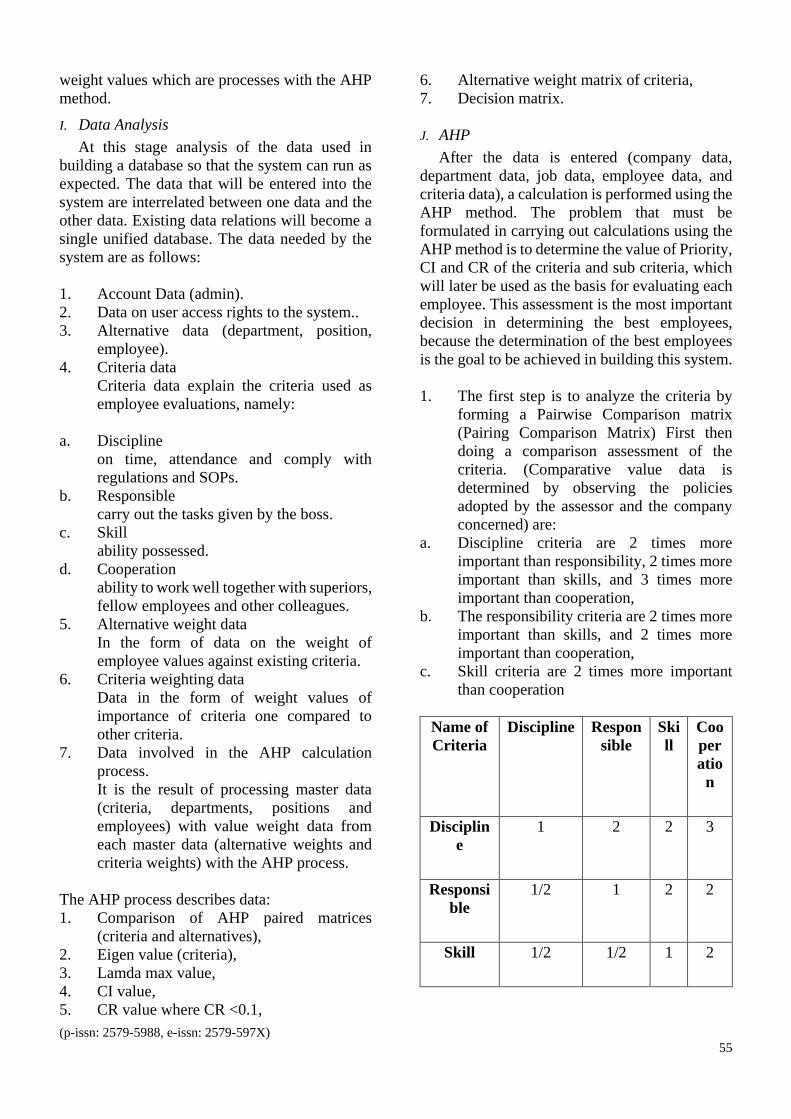
1. The first step is to analyze the criteria by
forming a Pairwise Comparison matrix
(Pairing Comparison Matrix) First then
doing a comparison assessment of the
criteria. (Comparative value data is
determined by observing the policies
adopted by the assessor and the company
concerned) are:
a. Discipline criteria are 2 times more
important than responsibility, 2 times more
important than skills, and 3 times more
important than cooperation,
b. The responsibility criteria are 2 times more
important than skills, and 2 times more
important than cooperation,
c. Skill criteria are 2 times more important
than cooperation
Name of
Criteria
Discipline Respon
sible
Ski
ll
Coo
per
atio
n
Disciplin
e
1 2 2 3
Responsi
ble
1/2 1 2 2
Skill 1/2 1/2 1 2
(p-issn: 2579-5988, e-issn: 2579-597X)
56
Cooperat
ion
1/3 1/2 1/2 1
Table 3.2 Pairwise Comparison Matrix
How to get the values from the Pairing
Comparison Matrix is by comparing the columns
located at the far left with each second, third and
fourth column.
Comparison of itself will produce a value of 1.
So the value of one will appear diagonally.
(Discipline of Discipline, Responsibility for
Responsibility, Skill for Skills, and Cooperation
on Cooperation).
Comparison of the left column with the next
columns. For example, value 2, obtained from the
ratio of discipline which is 2 times more
important than responsibility (see the value of the
comparison above).
Comparison of the left column with the next
columns. Suppose the value 1/2 is obtained from
a comparison of Responsibilities with Discipline
(remember, Discipline is 2 times more important
than Responsibility so that the value of
Responsibility is 1/2 of Discipline).
2. The second step is to determine the ranking
criteria in the form of priority vector (also
called normalized eigen vector). Change
the Pairwise Comparison matrix to a
decimal form and add up each column.
Name of
Criteria
Disciplin
e
Respon
sible
Ski
ll
Coo
per
atio
n
Disciplin
e
1 2 2 3
Responsi
ble
0,5 1 2 2
Skill 0,5 0,5 1 2
Cooperat
ion
0,33 0,5 0,5 1
Total of
Columns
2,33 4 5,5 8
Table 3.3 Summing of Pairwise Comparison
Matrix (Decimal)
3. The third step is to divide the elements of
each column with the corresponding
number of columns and calculate the
normalized Vector Eigen (Priority) of the
matrix.
Nam
e of
Crit
eria
Disc
iplin
e
Res
pons
ible
Skill Coo
pera
tion
Tota
l
Prio
rity
Disc
iplin
e
0,43 0,5 0,36 0,38 1,67 0,42
Res
pons
ible
0,21 0,25 0,36 0,25 1,08 0,27
Skill 0,21 0,13 0,18 0,25 0,77 0,19
Coo
pera
tion
0,14 0,13 0,09 0,13 0,48 0,12
Table 3.4 Criteria Value Matrix
How to get Value 0.43 is the result of the
division between the value 1.00 / 2.33 etc. Then
the Amount column is obtained through the sum
of each row of criteria, then the Priority value
0.42 is obtained from the Discipline Row 1.67
divided by the number of criteria (n) and so on
that all rows and columns are filled. The number
of criteria in this case is 4.
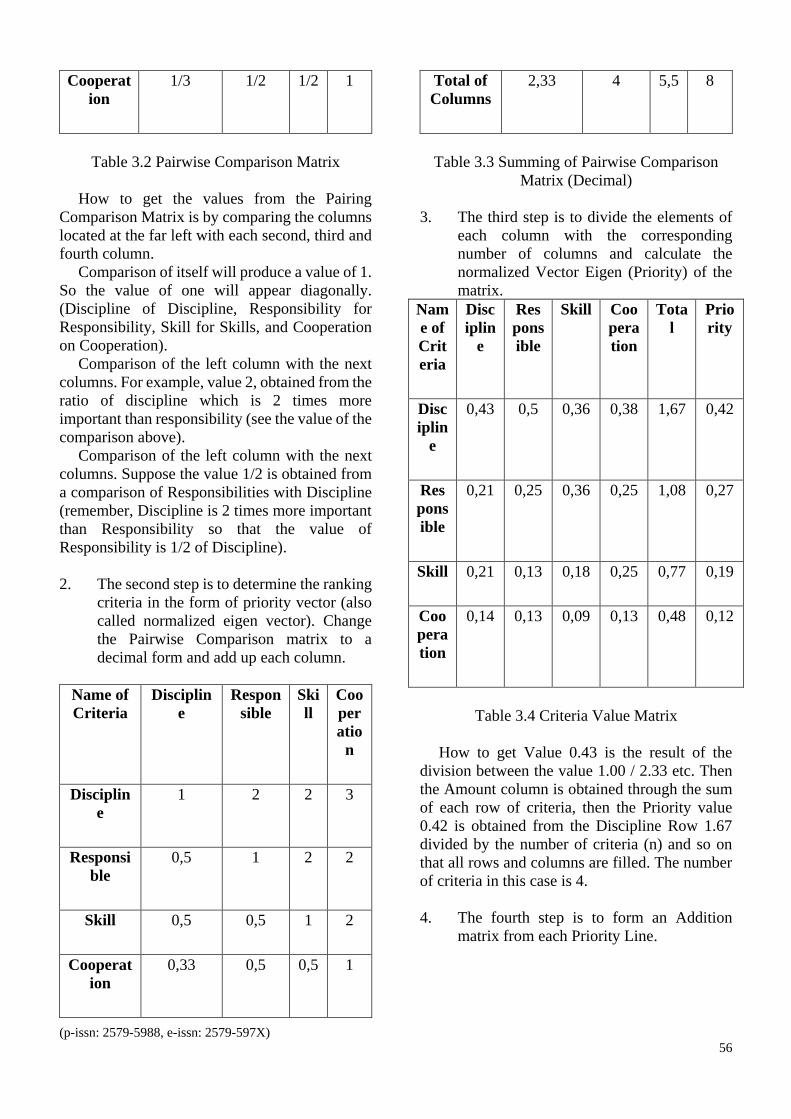
4. The fourth step is to form an Addition
matrix from each Priority Line.
(p-issn: 2579-5988, e-issn: 2579-597X)
57
Name
of
Crite
ria
Disci
pline
Respo
nsible
Skill Coop
eratio
n
Total
Disci
pline
0,42 0,54 0,39 0,36 1,7
Respo
nsible
0,21 0,27 0,39 0,24 1,1
Skill 0,21 0,13 0,19 0,24 0,78
Coop
eratio
n
0,14 0,13 0,1 0,12 0,5
Table 3.5 Addition Matrix of Each Priority Line
How to get a Value of 0.42 from the
Discipline, ie multiplying the Priority from the
Discipline line from the Criteria Value Matrix
(Table 3.4) which is 0.42 with the disciplinary
value of the Summaries of the Pairing
Comparison Matrix (Table 3.3) 1 and then all
rows and columns are filled. Then each row is
summed and produces the Amount column which
is 1.7.
5. The fifth step is to make a Consistency
Ratio Calculation Matrix which will be
used as a basis for calculating the
Consistency Ratio Value.
Name of
Criteria
Total per
line
Priori
ty
Resu
lt
Discipline 1,7 0,42 2,12
Responsible 1,1 0,27 1,37
Skill 0,78 0,19 0,97
Cooperation 0,5 0,12 0,62
Total
5,08
Table 3.6 The Consistency Ratio Calculation
Matrix
Columns and Values of Number of rows are
obtained from Column and Value of Amount in
the Addition Matrix of Each Priority Row (Table
3.5).
Columns and Values from Row Priorities are
obtained from Columns and Values from
Priorities in the Criteria Value Matrix (Table
3.4).
Then Column and Value Results are obtained
from the sum of each row of the Amount per Row
and Priority column. Then all the result columns
are summed so as to produce Amount 5.08.
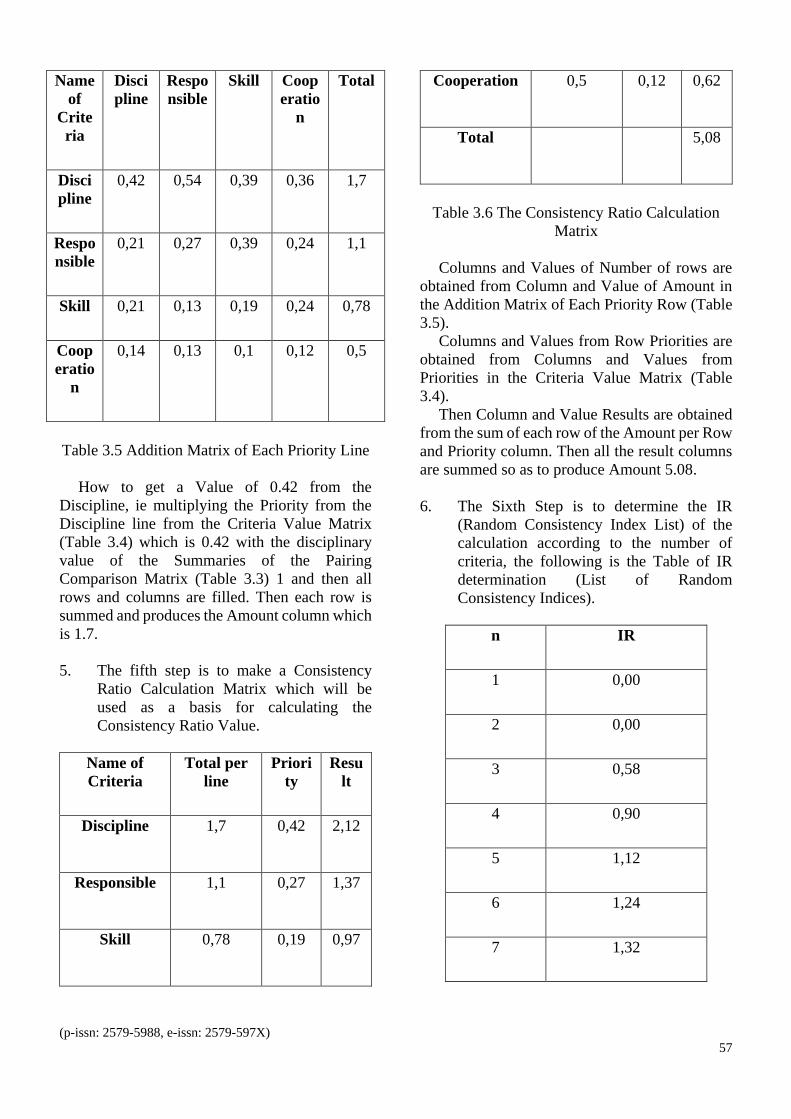
6. The Sixth Step is to determine the IR
(Random Consistency Index List) of the
calculation according to the number of
criteria, the following is the Table of IR
determination (List of Random
Consistency Indices).
n IR
1 0,00
2 0,00
3 0,58
4 0,90
5 1,12
6 1,24
7 1,32
(p-issn: 2579-5988, e-issn: 2579-597X)
58
8 1,41
9 1,45
10 1,49
11 1,51
12 1,48
13 1,56
14 1,57
15 1,59
Table 3.7 List of Random Consistency (IR)
Indices
Because in this case we use 4 criteria so that
the IR value we use is 0.90.
The next step is to calculate the consistency
ratio value to find out whether the comparison of
criteria is consistent or not.
Total 5,08
n 4
λ max (Total/n) 1,27
CI ((λ max-n)/n) -0,68
CR (CI/IR) -0,76
Table 3.8 Results of Calculation of Consistency
Ratio Value
a. The amount is the sum of the Result
Columns in the Consistency Ratio
Calculation Matrix (Table 3.6).
b. (n) is the number of criteria in this
calculation.
c. λ max obtained from the Amount of Results
of Calculation of Matrix Calculation
Consistency Ratio is divided by the number
of criteria from the calculation. This can be
written with the following formula: (total /
n).
d. CI is obtained from the results of max λ
calculation minus the number of criteria,
then the reduction results are further
divided by the number of criteria, this can
be written with the formula ((λ max-n) / n).
e. CR is obtained from the calculation of CI
divided by the List of Random Consistency
Index (IR) that we have set before, which is
0.90. This can be written by the formula (CI
/ IR).
f. Furthermore, from the results of these
calculations if the value of CR ≥ 0.1, the
consistency ratio value is inconsistent or
does not meet the requirements and must be
repeated from the comparison matrix until
the CR value meets the specified
conditions.
Because the Consistency Ratio we get from
this calculation is -0.76 and meets the CR
requirements <0.100, so the Consistency Ratio
Value is Consistent. generate Amount of 5.08.
7. After the Consistency Ratio of the Criteria
Analysis is Consistent, then the Sub
Criteria Analysis is carried out, do the steps
in the analysis of this sub-criterion the same
and in accordance with the criteria analysis,
namely the first step by forming a Pairwise
Comparison matrix (Pairwise Comparison
Matrix) First, then make a comparative
assessment of the criteria. (Comparative
value data is determined by observing the
policies adopted by the assessor and the
company concerned).
Criteria Good Enough Less
Good 1 3 5
Enough 1/3 1 3
Less 1/5 1/3 1

(p-issn: 2579-5988, e-issn: 2579-597X)
59
Table 3.9 Pairwise Comparison Matrix of
Disciplinary Sub Criteria
8. The second step is the same as in Table 3.3
which is to determine the ranking of criteria
in the form of priority vectors Change the
Pairwise Comparison matrix (Paired
Comparison Matrix) to decimal form and
add up each column.
Criteria Good Enough Less
Good 1 3 5
Enough 0,33 1 3
Less 0,2 0,33 1
Total of Columns 1,53 4,33 9
Table 3.10 Addition of Pairwise Comparison
Matrix (Decimal) Disciplinary Sub Criteria
9. The third step is the same as in Table 3.4,
which is to divide the elements of each
column with the number of columns in
question and calculate the normalized
Vector Eigen (Priority) of the matrix.
Crit
eria
Goo
d
Eno
ugh
Less Tota
l
Prio
rity
Sub
Prio
rity
Goo
d
0,65 0,69 0,56 1,9 0,63 1
Eno
ugh
0,22 0,23 0,33 0,78 0,26 0,41
Less 0,13 0,08 0,11 0,32 0,11 0,17
Table 3.11 Criteria Value Matrix Disciplinary
Sub Criteria
10. The fourth step is the same as in Table 3.5,
which forms an Addition matrix from each
Priority Line.
Criteria Good Enough Less Total
Good 0,63 0,78 0,55 1,96
Enough 0,21 0,26 0,33 0,8
Less 0,13 0,09 0,11 0,33
Table 3.12 Addition Matrix of Each Priority
Row of the Disciplinary Sub Criteria
11. The fifth step is the same as Table 3.6,
namely making a Consistency Ratio
Calculation Matrix which will be used as a
basis for calculating the Consistency Ratio
Value.
Criteria Total per line Priority Result
Good 1,96 0,63 2,59
Enough 0,8 0,26 1,06
Less 0,33 0,11 0,44
Total
4,09
Table 3.13 Matrix of Calculation of the
Subcritical Disciplinary Ratio Consistency
Then the next step is to calculate the
consistency ratio value to find out whether the
comparison of the disciplinary sub criteria is
consistent or not.
Total 4,09
n 3
λ max (Total/n) 1,36
(p-issn: 2579-5988, e-issn: 2579-597X)
60
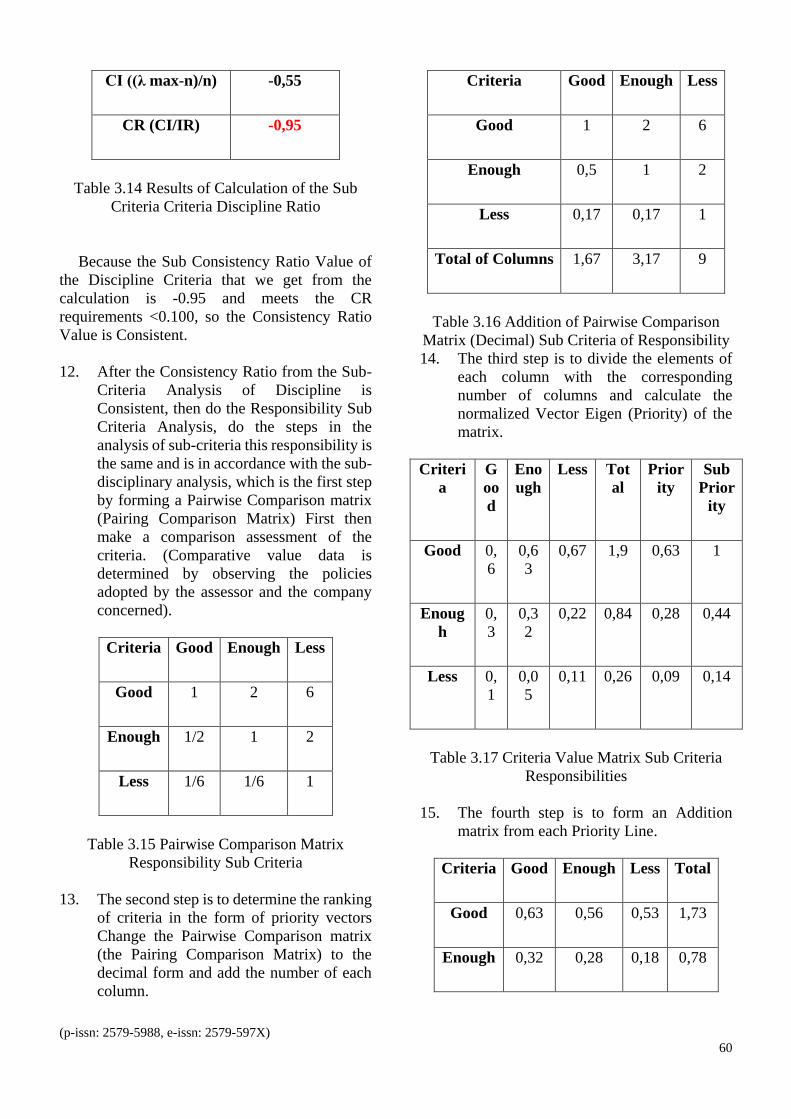
CI ((λ max-n)/n) -0,55
CR (CI/IR) -0,95
Table 3.14 Results of Calculation of the Sub
Criteria Criteria Discipline Ratio
Because the Sub Consistency Ratio Value of
the Discipline Criteria that we get from the
calculation is -0.95 and meets the CR
requirements <0.100, so the Consistency Ratio
Value is Consistent.
12. After the Consistency Ratio from the Sub-
Criteria Analysis of Discipline is
Consistent, then do the Responsibility Sub
Criteria Analysis, do the steps in the
analysis of sub-criteria this responsibility is
the same and is in accordance with the sub-
disciplinary analysis, which is the first step
by forming a Pairwise Comparison matrix
(Pairing Comparison Matrix) First then
make a comparison assessment of the
criteria. (Comparative value data is
determined by observing the policies
adopted by the assessor and the company
concerned).
Criteria Good Enough Less
Good 1 2 6
Enough 1/2 1 2
Less 1/6 1/6 1
Table 3.15 Pairwise Comparison Matrix
Responsibility Sub Criteria
13. The second step is to determine the ranking
of criteria in the form of priority vectors
Change the Pairwise Comparison matrix
(the Pairing Comparison Matrix) to the
decimal form and add the number of each
column.
Criteria Good Enough Less
Good 1 2 6
Enough 0,5 1 2
Less 0,17 0,17 1
Total of Columns 1,67 3,17 9
Table 3.16 Addition of Pairwise Comparison
Matrix (Decimal) Sub Criteria of Responsibility
14. The third step is to divide the elements of
each column with the corresponding
number of columns and calculate the
normalized Vector Eigen (Priority) of the
matrix.
Criteri
a
G
oo
d
Eno
ugh
Less Tot
al
Prior
ity
Sub
Prior
ity
Good 0,
6
0,6
3
0,67 1,9 0,63 1
Enoug
h
0,
3
0,3
2
0,22 0,84 0,28 0,44
Less 0,
1
0,0
5
0,11 0,26 0,09 0,14
Table 3.17 Criteria Value Matrix Sub Criteria
Responsibilities
15. The fourth step is to form an Addition
matrix from each Priority Line.
Criteria Good Enough Less Total
Good 0,63 0,56 0,53 1,73
Enough 0,32 0,28 0,18 0,78
(p-issn: 2579-5988, e-issn: 2579-597X)
61
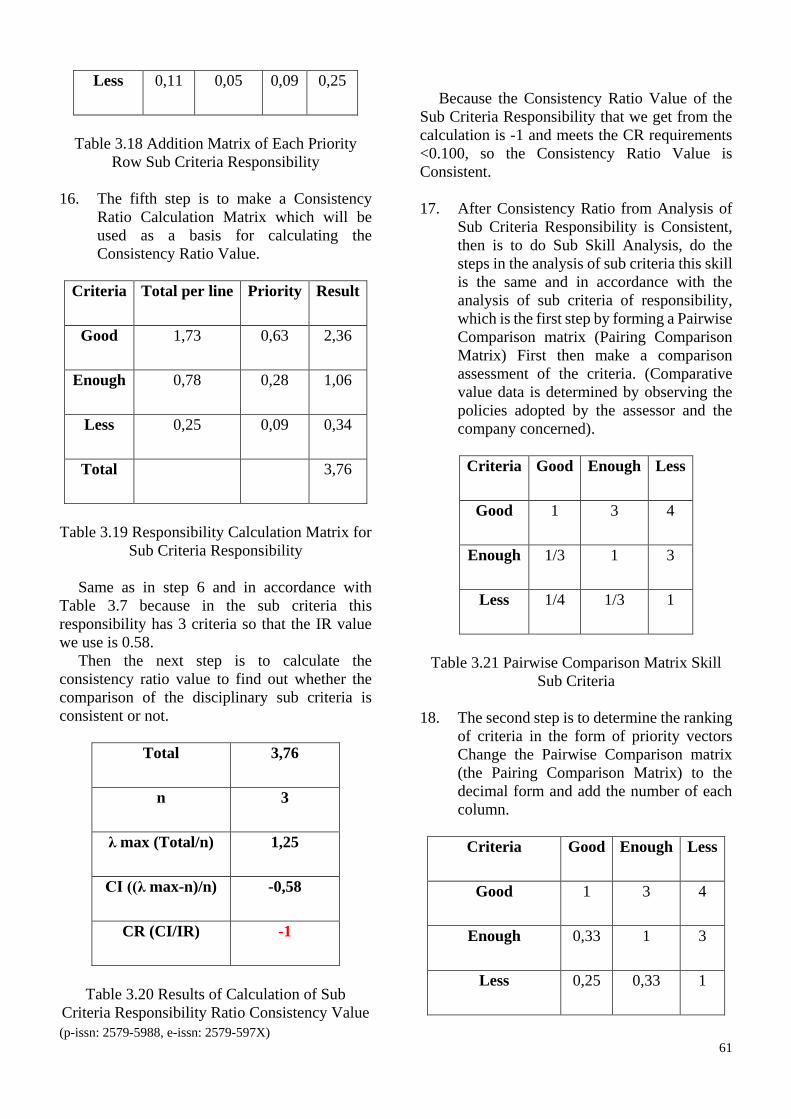
Less 0,11 0,05 0,09 0,25
Table 3.18 Addition Matrix of Each Priority
Row Sub Criteria Responsibility
16. The fifth step is to make a Consistency
Ratio Calculation Matrix which will be
used as a basis for calculating the
Consistency Ratio Value.
Criteria Total per line Priority Result
Good 1,73 0,63 2,36
Enough 0,78 0,28 1,06
Less 0,25 0,09 0,34
Total
3,76
Table 3.19 Responsibility Calculation Matrix for
Sub Criteria Responsibility
Same as in step 6 and in accordance with
Table 3.7 because in the sub criteria this
responsibility has 3 criteria so that the IR value
we use is 0.58.
Then the next step is to calculate the
consistency ratio value to find out whether the
comparison of the disciplinary sub criteria is
consistent or not.
Total 3,76
n 3
λ max (Total/n) 1,25
CI ((λ max-n)/n) -0,58
CR (CI/IR) -1
Table 3.20 Results of Calculation of Sub
Criteria Responsibility Ratio Consistency Value
Because the Consistency Ratio Value of the
Sub Criteria Responsibility that we get from the
calculation is -1 and meets the CR requirements
<0.100, so the Consistency Ratio Value is
Consistent.
17. After Consistency Ratio from Analysis of
Sub Criteria Responsibility is Consistent,
then is to do Sub Skill Analysis, do the
steps in the analysis of sub criteria this skill
is the same and in accordance with the
analysis of sub criteria of responsibility,
which is the first step by forming a Pairwise
Comparison matrix (Pairing Comparison
Matrix) First then make a comparison
assessment of the criteria. (Comparative
value data is determined by observing the
policies adopted by the assessor and the
company concerned).
Criteria Good Enough Less
Good 1 3 4
Enough 1/3 1 3
Less 1/4 1/3 1
Table 3.21 Pairwise Comparison Matrix Skill
Sub Criteria
18. The second step is to determine the ranking
of criteria in the form of priority vectors
Change the Pairwise Comparison matrix
(the Pairing Comparison Matrix) to the
decimal form and add the number of each
column.
Criteria Good Enough Less
Good 1 3 4
Enough 0,33 1 3
Less 0,25 0,33 1
(p-issn: 2579-5988, e-issn: 2579-597X)
62
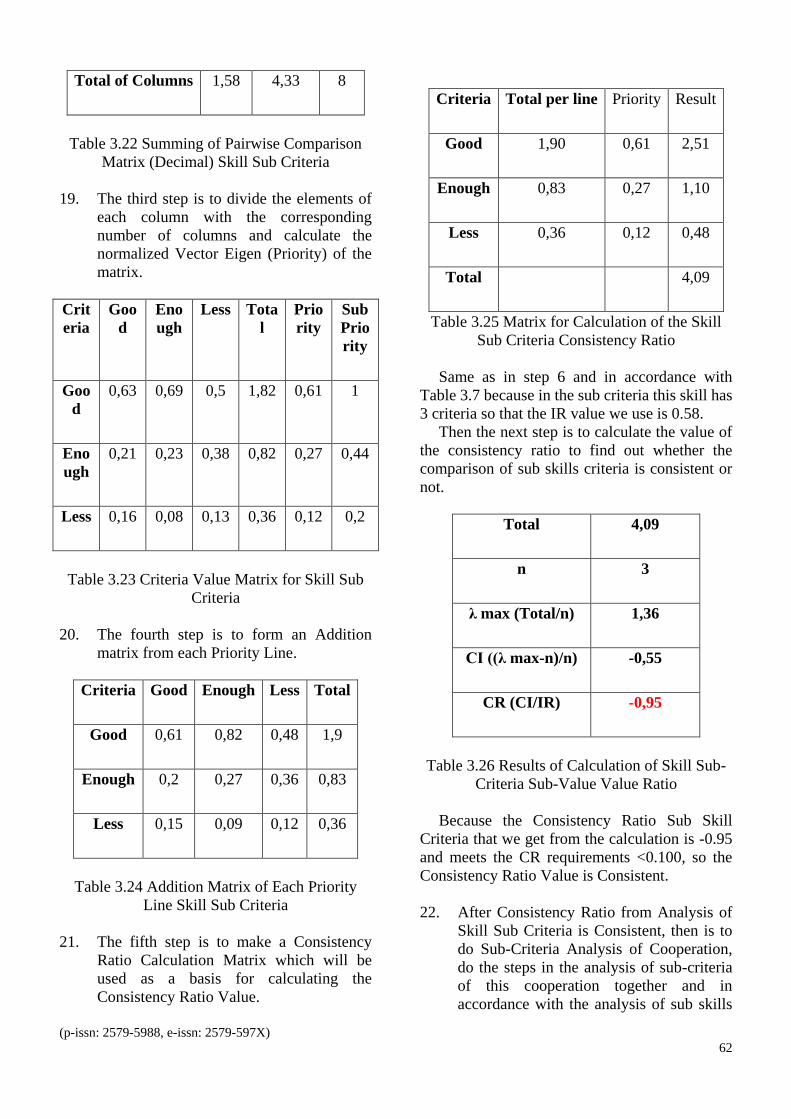
Total of Columns 1,58 4,33 8
Table 3.22 Summing of Pairwise Comparison
Matrix (Decimal) Skill Sub Criteria
19. The third step is to divide the elements of
each column with the corresponding
number of columns and calculate the
normalized Vector Eigen (Priority) of the
matrix.
Crit
eria
Goo
d
Eno
ugh
Less Tota
l
Prio
rity
Sub
Prio
rity
Goo
d
0,63 0,69 0,5 1,82 0,61 1
Eno
ugh
0,21 0,23 0,38 0,82 0,27 0,44
Less 0,16 0,08 0,13 0,36 0,12 0,2
Table 3.23 Criteria Value Matrix for Skill Sub
Criteria
20. The fourth step is to form an Addition
matrix from each Priority Line.
Criteria Good Enough Less Total
Good 0,61 0,82 0,48 1,9
Enough 0,2 0,27 0,36 0,83
Less 0,15 0,09 0,12 0,36
Table 3.24 Addition Matrix of Each Priority
Line Skill Sub Criteria
21. The fifth step is to make a Consistency
Ratio Calculation Matrix which will be
used as a basis for calculating the
Consistency Ratio Value.
Criteria Total per line Priority Result
Good 1,90 0,61 2,51
Enough 0,83 0,27 1,10
Less 0,36 0,12 0,48
Total
4,09
Table 3.25 Matrix for Calculation of the Skill
Sub Criteria Consistency Ratio
Same as in step 6 and in accordance with
Table 3.7 because in the sub criteria this skill has
3 criteria so that the IR value we use is 0.58.
Then the next step is to calculate the value of
the consistency ratio to find out whether the
comparison of sub skills criteria is consistent or
not.
Total 4,09
n 3
λ max (Total/n) 1,36
CI ((λ max-n)/n) -0,55
CR (CI/IR) -0,95
Table 3.26 Results of Calculation of Skill Sub-
Criteria Sub-Value Value Ratio
Because the Consistency Ratio Sub Skill
Criteria that we get from the calculation is -0.95
and meets the CR requirements <0.100, so the
Consistency Ratio Value is Consistent.
22. After Consistency Ratio from Analysis of
Skill Sub Criteria is Consistent, then is to
do Sub-Criteria Analysis of Cooperation,
do the steps in the analysis of sub-criteria
of this cooperation together and in
accordance with the analysis of sub skills
(p-issn: 2579-5988, e-issn: 2579-597X)
63
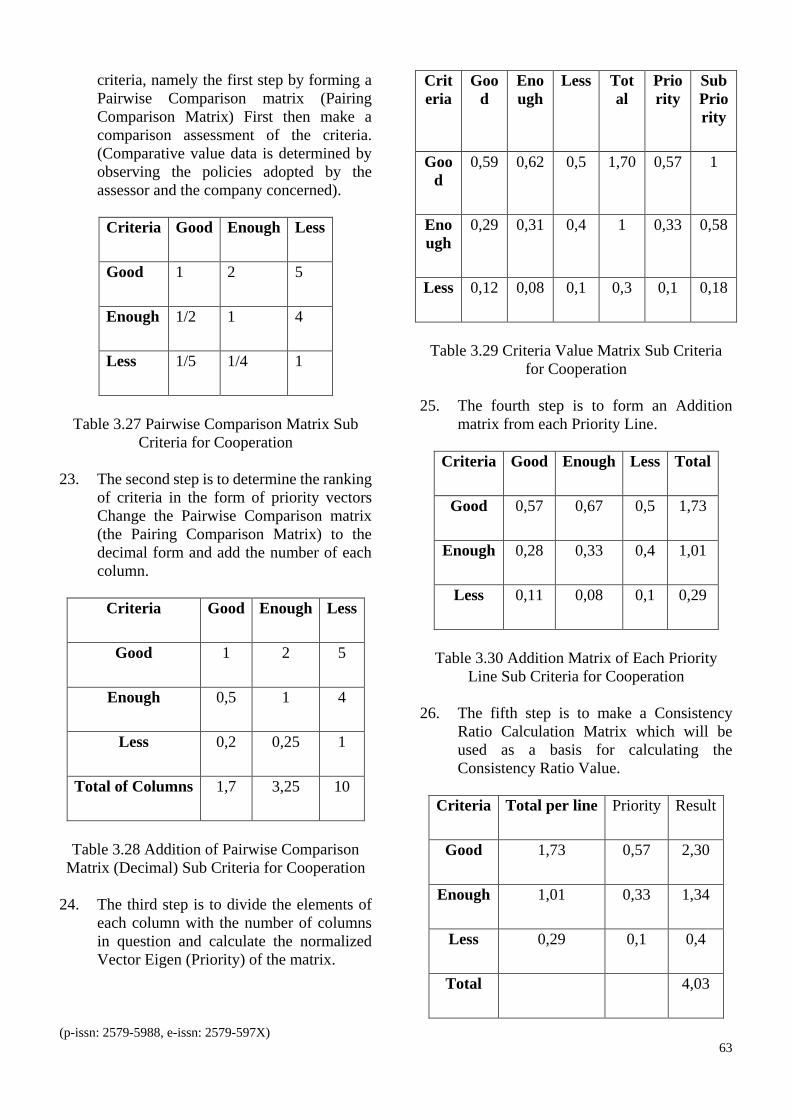
criteria, namely the first step by forming a
Pairwise Comparison matrix (Pairing
Comparison Matrix) First then make a
comparison assessment of the criteria.
(Comparative value data is determined by
observing the policies adopted by the
assessor and the company concerned).
Criteria Good Enough Less
Good 1 2 5
Enough 1/2 1 4
Less 1/5 1/4 1
Table 3.27 Pairwise Comparison Matrix Sub
Criteria for Cooperation
23. The second step is to determine the ranking
of criteria in the form of priority vectors
Change the Pairwise Comparison matrix
(the Pairing Comparison Matrix) to the
decimal form and add the number of each
column.
Criteria Good Enough Less
Good 1 2 5
Enough 0,5 1 4
Less 0,2 0,25 1
Total of Columns 1,7 3,25 10
Table 3.28 Addition of Pairwise Comparison
Matrix (Decimal) Sub Criteria for Cooperation
24. The third step is to divide the elements of
each column with the number of columns
in question and calculate the normalized
Vector Eigen (Priority) of the matrix.
Crit
eria
Goo
d
Eno
ugh
Less Tot
al
Prio
rity
Sub
Prio
rity
Goo
d
0,59 0,62 0,5 1,70 0,57 1
Eno
ugh
0,29 0,31 0,4 1 0,33 0,58
Less 0,12 0,08 0,1 0,3 0,1 0,18
Table 3.29 Criteria Value Matrix Sub Criteria
for Cooperation
25. The fourth step is to form an Addition
matrix from each Priority Line.
Criteria Good Enough Less Total
Good 0,57 0,67 0,5 1,73
Enough 0,28 0,33 0,4 1,01
Less 0,11 0,08 0,1 0,29
Table 3.30 Addition Matrix of Each Priority
Line Sub Criteria for Cooperation
26. The fifth step is to make a Consistency
Ratio Calculation Matrix which will be
used as a basis for calculating the
Consistency Ratio Value.
Criteria Total per line Priority Result
Good 1,73 0,57 2,30
Enough 1,01 0,33 1,34
Less 0,29 0,1 0,4
Total
4,03
(p-issn: 2579-5988, e-issn: 2579-597X)
64
Table 3.31 Matrix of Calculation of Consistency
Ratio of Sub Criteria of Cooperation
Same as in step 6 and in accordance with
Table 3.7 because in the sub-criteria of this
cooperation has 3 criteria so that the IR value we
use is 0.58.
Then the next step is to calculate the value of
the consistency ratio to find out whether the
comparative assessment of cooperation criteria is
consistent or not.
Total 4,03
n 3
λ max (Total/n) 1,34
CI ((λ max-n)/n) -0,55
CR (CI/IR) -0,95
Table 3.32 Results of Calculation of
Consistency Ratio Value for Sub Criteria of
Cooperation
Because the Consistency Ratio Value of the
Cooperation Criteria Sub we get from the
calculation is -0.95 and meets the CR
requirements <0.100, so the Consistency Ratio
Value is Consistent.
After all the consistency ratio values of the
criteria and sub criteria are obtained, then next we
will create an assessment table where this table
will be used as a reference in evaluating the best
employees.
Disciplin
e
Responsi
ble
Skill Cooperat
ion
0,42 0,27 0,19 0,12
Good Good Good Good
1 1 1 1
Enough Enough Enough Enough
0,41 0,44 0,44 0,58
Less Less Less Less
0,17 0,14 0,2 0,18
Table 3.33 Assessment Table
The value of 0.42 from the disciplinary
column is obtained from the priority values that
exist in the discipline line in the Criteria Value
Matrix (Table 3.4), as well as the responsibility,
skill and cooperation columns obtained from
each row of sub-criteria in the matrix.
Furthermore for Good Value: 1, Enough: 0.41
and Less: 0.17 which is in the Discipline column
obtained from the Priority Value Sub which is in
the Discipline Criteria Value Matrix (Table 3.11),
for the responsibility column obtained from the
Responsibility Criteria Value Matrix Answer
(Table 3.17), for the skill column obtained from
the Skill Criteria Value Matrix (Table 3.23), and
for the collaboration column obtained from the
Cooperation Criteria Value Matrix (Table 3.9).
IV. RESULTS
Based on the research that has been done, there
are 4 criteria used in the process of selecting the
best employees at PT. Z Bali, which is discipline,
responsibility, skill and cooperation. Then,
various results of calculations that have been
obtained through the AHP method were adapted
and applied to the system that has been designed,
resulting in the Design of the Decision Support
System for the Best Employee Selection Using
the AHP Method Case Study of PT. Z Bali.
Here are some views of the results of the
interface Design of the Decision Support System
for the Best Employee Selection Using the AHP
Method Case Study PT. Z Bali.
(p-issn: 2579-5988, e-issn: 2579-597X)
65
Figure 4.1 Design of the Employee Data Form
In Figure 4.1, the employee data page
interface design, this employee data page can be
used by the user to input, change, delete and
search for employee data in the system.
Figure 4.2 Design of the Best Employee
Assessment Form
In Figure 4.2 is the design of the best employee
rating page interface, the best employee rating
page can be used by the user to input assessment
data according to the month and year of the
assessment that he selected, change, delete and
search for the best employee assessment data in
the system.
Figure 4.3 Design of the Best Employee
Assessment Report Form
In Figure 4.3 is the design of the interface of
the best employee assessment report page, the
best employee assessment report page can be
used by the user to display the results of the best
employee appraisal process at PT. Z Bali.
A. User Experience (UX)
Decision Support System for the Best
Employee Selection Using AHP Method Case
Study PT. Z Bali is designed so because it aims
to facilitate the user in using this system (user
friendly), so that it will provide a good experience
to the user in using this system, so that this system
can be utilized optimally.
B. User Interface (UI)
Decision Support System for the Best
Employee Selection Using AHP Method Case
Study PT. Z Bali is designed with the position of
menus, buttons, and tables that are good, clear,
and not confusing, so that this system can be used
easily by user (easy-to-use).
V. CONCLUSION AND RECOMMENDATION
A. Conclusion
In Making of the Design of the Decision
Support System for the Best Employee Selection
Using AHP Method Case Study PT. Z Bali it can
be concluded that:
1. The calculation process in selecting the best
employees can be done using the AHP
method which has a better accuracy value
than using manual calculations.
2. The Design of the Decision Support System
for the Best Employee Selection has been
successfully designed and built for PT. Z Bali
in the selection of the best employees to
produce better, satisfying, computerized
decisions and reduce the occurrence of
human errors.
B. Recommendation
Recommendations that can be given by the
author for further development is that it is
expected that the Design of Decision Support
System for the Best Employee Selection Using
AHP Method Case Study PT. Z Bali can be
applied to web and mobile based programs
(p-issn: 2579-5988, e-issn: 2579-597X)
66
REFERENCES
Al Fatta, Hanif. Buku Analisis dan
Perancangan Sistem Informasi,
Publisher : Andi.
Fatta. 2008. Analisis dan Perancangan Sistem
Informasi. Yogyakarta: Publisher ANDI.
Fitria, Yeni. 2011. Sistem Pendukung
Keputusan Pemilihan Karyawan
Berprestasi Menggunakan Metode
AHP dan TOPSIS (Studi Kasus: PT.
Mitra Beton Mandiri). Fakultas Sains
dan Teknologi Universitas Islam Negeri
Sultan Syarif Kasim Riau Pekanbaru.
Herman Firdaus, Indra, Gunawan Abdillah, Faiza
Renaldi. 2016. Sistem Pendukung
Keputusan Penentuan Karyawan
TerGood Menggunakan Metode AHP
dan TOPSIS. Seminar Nasional
Teknologi Informasi dan Komunikasi
2016 (SENTIKA 2016) Yogyakarta.
Kusrini. 2007. Konsep dan Aplikasi Sistem
Pendukung Keputusan. Yogyakarta:
Publisher Andi.
Lathifah, Siti. 2008. Prinsip prinsip dasar
Analitycal Hierarchy Process.
M. Azman Maricar, Wahyudin, Made Sudarma.
2016. Decision Support System of the
Employees Acceptance using
Analytical Hierarchy Process (AHP)
and Multi Factor Evaluation Process
(MFEP), IJEET Teknik Elektro, Fakultas
Teknik, Universitas Udayana.
Pressman, Roger S. 2012. Rekayasa Perangkat
Lunak – Buku Satu, Pendekatan
Praktisi (Edisi 7). Yogyakarta: Andi.
Scott, George M. 2004. Prinsip-prinsip sistem
informasi manajemen, (diterjemahkan
oleh Budiman, Achmad Nashir), Raja
Grafindo Persada, Jakarta.
Thomas L Saaty. 2008. Decision Making With
The Analytic Hierarchy Process. Int J
Services Sciences Vol 1, No. 1.