design of part families for reconfigurable machining systems based on manufacturability feedback
TRANSCRIPT

Design of part family robust-to-production plan variations basedon quantitative manufacturability evaluation
Byungwoo Lee, Kazuhiro Saitou
Abstract This paper presents a systematic method fordesigning part families whose production costs areinsensitive to changes in production plans due tomarket demand fluctuations. A unified feature-basedrepresentation of functional geometry and manufactu-rability has been developed to manipulate and evaluatepart designs. Based on this information and productionplans for multiple periods, an optimization-basedmethod provides alternative part designs. The manu-facturability of the part designs is quantitativelyestimated by the facility cost of the manufacturingsystem best configured for a given part family and theaverage cycle time estimated by the discrete eventsimulation of production scenarios. Redesign suggestionsare made on datum definitions of the original parts.Two case studies of a family of prismatic parts and thatof turned parts are given to demonstrate the effective-ness of the proposed method.
Keywords Part family, Design optimization, Design formanufacturing, Genetic algorithm
1IntroductionDesign for manufacturing (DFM) methods have beenwidely applied to various decisions throughout the designprocess such as the choice of material, shape, tolerances,standardization and assembly design (Bralla 1999; Booth-royd et al. 1999). According to van Vliet et al. (1999), thereare three phases in manufacturability evaluation: verifi-cation, quantification and optimization. Among thosethree phases, methods for the second and third phase,especially for multiple products, are not well establishedcompared with their counterparts for a single product.This is partly due to the difficulty in evaluating the
manufacturability and in generating alternative designs ofa product family. Because of the tight sharing of manu-facturing resources among multiple product types, a slightchange in a design feature can have a dramatic impact onthe manufacturing cost. The generation of alternative de-signs and their quantitative manufacturability evaluationis therefore essential for the effective implementation ofDFM for product family design.
In addition to variations in design, variations in pro-duction plans because of fluctuating market demand areanother challenge to industry. In order to comply withthis changing market demand, every decision regardingdesign and manufacturing should not only considercurrent market demand but also the long-term forecast ofthe production plan. Setting aside production planchanges, much effort has been made to reduce produc-tion cost by manipulating process planning, resourceallocating and scheduling algorithms. Consideringdesign’s large impact on manufacturing cost, it is obviousthat manufacturing cost would be reduced significantly ifwe make design decisions robust to production planvariations. Robustness to production plan variationsrepresents, in this paper, achieving lower production costwith unchanged design of a part family throughoutperiods in the production plan.
In this work, a method is proposed to design productfamilies that are robust to production plan variations,based on the quantitative evaluation of manufacturability,so that a designer can estimate the rough cost of pro-duction at the very early stage of the design process andobtain redesign suggestions. The proposed method aidsthe design of a family of machined products, i.e. partfamily, for a particular manufacturing system. It searchesfor a lower production cost by suggesting the best datumallocation for each member of a part family. Assuming thatthe geometry of a part is fixed by engineering require-ments, datum definition has been chosen as the designvariable, since the datum definition for geometric dimen-sions and tolerances is crucial to functional achievementand subsequent manufacturing processes of machinedproducts. Suggesting the best datum allocation for eachmember of a part family can be justified when the cost toaccommodate differently defined datum definitions isnegligible compared to the reduction in the productioncost for multiple production periods. Throughout thispaper, a part family of a few members under mass pro-duction is considered.
Two examples are given to illustrate the effectiveness ofthe method. In each example, two slightly different prod-
Research in Engineering Design 13 (2002) 199–212
DOI 10.1007/s00163-002-0018-9
199
Received: 9 July 2001 / Revised: 18 June 2002Accepted: 21 June 2002 / Published online: 14 August 2002� Springer-Verlag 2002
B. Lee, K. Saitou (&)University of Michigan,Department of Mechanical Engineering,2350 Hayward, Ann Arbor, MI 48109-2125, USAE-mail: [email protected]: +1-734-6473170
We gratefully acknowledge financial support from the EngineeringResearch Center for Reconfigurable Machining Systems established bythe National Science Foundation.

ucts are given along with production plans for certainperiods of time. Alternative datum definitions are pre-sented as a result of the proposed method.
2Related workVarious methods to reduce the production cost of productfamilies have been proposed. Whitney (1993) reported acase study of various strategic design methods to achieveflexibility against mixed models. Increasing the quantifiedcommonality among a variety of assembled products hasalso been studied (Ishii et al. 1995; Kota et al. 2000).Adapting modularity and sharing platforms among prod-ucts have also reduced design and manufacturing costs(Ulrich and Eppinger 1995; Fujita et al. 1998; Gonzalez-Zugasti et al. 1998; Simpson et al. 1999; Nelson et al. 1999).However, the above work does not optimize the design of aproduct family to simultaneously minimize the facility costand cycle time.
Grouping a wide variety of parts into part families hasalways been a research focus of studies related to grouptechnology and cellular manufacturing systems. Never-theless, few works in this area discuss redesign suggestionsbased on manufacturability feedback (Suresh and Kay1998).
Hernandez et al. (1998) considered cycle time and marketdemand to design product families. Their method, however,has limits for direct application to machined products,where the analysis of function and geometrical tolerance ofproducts are essential. Herrmann and Chincholkar (2000)have suggested the ‘design for production’ (DFP) method,where designers evaluate product designs by comparingtheir manufacturing requirements with an available pro-duction capacity and an estimated cycle time. Kusiak and He(1998) have suggested four ‘design for agility’ rules forproduct designs that are robust against the changes in thecharacteristics of production schedules. Although thesemethods suggest the reconsideration of specific designfeatures, they cannot automatically generate redesignsuggestions because of the lack of automated reasoning onthe design features essential to the product function.
While numerous works have focused on automatedmanufacturability analysis (Gupta et al. 1997), a few ofthem addressed the automated generation of redesignsuggestions. Das et al. (1994, 1996) proposed a method-ology that proposes redesign suggestions of less setup timethan original designs. By generating alternative machiningfeatures, the approach creates an extended feature set,combinations of which are evaluated in terms of setuptime. Hayes and Sun (1995) utilized constraint networks(CN) and a knowledge-based system to analyze a ma-chined product. They developed a system that generatesdesign modification in terms of tolerance and datum se-lections with minimal processing time, including setups.The method was successively applied for shape-changingredesign suggestions (Hayes 1996). Although these meth-ods generate redesign suggestions by evaluating multiplechoices of feature recognition and process planning, theywere not extended to application for the production of partfamilies. Figure 1 summarizes the past work done onredesign suggestions for machined parts.
3ApproachWhen two or more products are being produced within amanufacturing system, process plans of those productswith minimal setup and processing time do not necessarilyresult in minimal cycle time and manufacturing systemconfiguration. For this reason, unlike most DFM methods,the proposed framework quantitatively evaluates themanufacturability of the part designs based on the facilitycost and cycle time for production, which are estimated bythe discrete event simulation of part production duringmultiple periods. Given initial designs of parts in a familyand variations of production plan (volume ratio of theproduct mix), the method generates redesign suggestionsrealizing lower production and facility costs based on thefollowing four steps (Fig. 2). As shown in Fig. 2, each stepincorporates several substeps over a span of a decision treeinvolved in design and manufacturing. This simplifieddecision tree consists of several steps in which multiplechoices are typically available from one step to the next.Eventually, the best decisions throughout the tree will beidentified to provide redesign suggestions to the initialdesigns. Each step will be fully described in the followingsubsections.
1. Feature recognition: transform the initial designs intothe constraint networks (CN) of tolerance s amongmachining features by extracting the precedence rela-tionship among machining features within the nodes inthe graphical representation of the initial designs.While in general a design can be transformed to mul-tiple CN (Das et al. 1994, 1996), we assume a design istransformed to a unique CN. This is because we con-centrate on subsequent steps, which are essential forevaluating the manufacturability of a part family, tokeep the size of problem manageable.
2. Generation of alternative designs: generate alternativedesigns (i.e. CN) for the part family, which are candi-dates for redesign suggestion. These alternative designssatisfy the functional requirement of the original de-signs and the generic tolerance rules. In this paper, thefunctional requirement for a part is referred to as the
Fig. 1. A map of the past work on redesign suggestions for machinedparts
Res Eng Design 13 (2002)
200

core datum relationship, which is indispensable for thepart to satisfy its role by itself or in the assembly towhich it belongs.
3. Manufacturing cost estimation: estimate the manufac-turing cost for each set of CN of the part family generatedin step 2. Based on the process precedence imposed bythe alternative CN, estimate the lowest production andfacility cost of the part family under a given productionplan by optimizing process plans, resource allocation(mapping from manufacturing features to machine sta-tions) and firing sequence (the order of product types tobe fed into the manufacturing system). A simple discrete-event model of manufacturing systems is used to evaluatethe production cycle time.
4. Redesign suggestion: find a new CN that gives thelowest manufacturing cost estimation obtained in step 3for the given production plan variations. Update initialdesigns with the new CN.
3.1Feature recognition
3.1.1Graphical representation of product informationA compact, graph-based representation of product geome-try and tolerances has been utilized to evaluate and ma-nipulate product designs. The graph consists of a modifiedattributed adjacency graph (AAG, proposed by Joshi andChang 1988) representing the geometry information, over-lapped with the directed edges representing the toleranceand datum relationships among geometry primitives.
A node represents a geometry primitive such as a cy-lindrical face, and an undirected edge between nodesrepresents a physical edge that those nodes share. Uponthe geometry information, tolerance and datum informa-tion is added in the form of directed edges with toleranceinformation, because the dimension for a geometry featureto be processed is defined from a reference feature with aproper tolerance level. The graph described above can bedefined as a sextuple:
G ¼ V;U;D;Av;Au;Adð Þ ; ð1Þ
where V is the set of nodes, U is the set of undirectededges, D is the set of directed edges, Av={PF,CF,...} is theset of attributes to node set V, Au={c+,c–,s+,s–,...} is theset of attributes to undirected edge set U and Ad={x2,y2,z2,p2,...} is the set of attributes to directed edge set D.
Every node v in V is assigned an attribute av in Av,such as av=‘PF’ for a planar face. Every undirected edge uin U is assigned an attribute au in Au, such as au=‘c+’ fora cylindrical edge that forms a convex angle and au=‘s–’for a straight edge that forms a concave angle. Most ofthese notations including node indices have been bor-rowed from Fu and dePennington (1994). Likewise, everydirected edge d in D is assigned an attribute ad in Ad, suchas ad=‘x2’ for the positional tolerance with level of thesecond decimal point and ad=‘p2’ for perpendicularitywith the same level of tolerance.
Figure 3 shows a simple L-shaped bracket and itsgraphical representation. For example, in Fig. 3a thevertical face defined as datum ‘B’ shares a straight convexedge with the horizontal face defined as datum ‘A’. Thisrelationship is represented in Fig. 3b, where PF1 (verticalface) and PF6 (horizontal face) are connected with anundirected edge with attribute is ‘s+’ (straight convex).Also, the perpendicularity between those faces in Fig. 3a isrepresented as a directed edge of ‘p2’ attribute in Fig. 3b.In this example, the constraints with tolerance looser thanthe second decimal point and the reference dimensions areignored, assuming they can be met from the stock materialbefore machining operations. For the same reason, facesused as datums are recognized as planar faces that requiremilling operations, even if they do not have obvious vol-umetric machining features. The number in a node afterthe attribute is the node index.
3.1.2Constraint network after feature recognitionFrom the geometry and tolerance information a featurerecognition method transforms an AAG representation ofthe product into a CN defined among manufacturing
Fig. 2. Computationalframework for redesign sug-gestion system. The lowerpart of the figure shows the‘design and manufacturing’decision tree for a part familyof two members
B. Lee, K. Saitou: Design of part family robust-to-production plan variations based on quantitative manufacturability evaluation
201

features. This constraint network provides the precedencerelationship among manufacturing features for the processplanning. The constraint network can be defined as a four-tuple:
CN ¼ F;T;Af ;Atð Þ ; ð2Þ
where F is the set of nodes, T is the set of directed edges, Afis the set of attributes to node F and At is the set of at-tributes to directed edge T.
A node represents a manufacturing feature, and a di-rected edge represents the tolerance and datum informa-tion inherited from the graph G. Each node has attributessuch as the volume of metal to be removed, the orientationof tool approach and the type of feature for the processplanning.
Figure 4 shows a constraint network after feature rec-ognition is applied to the graph shown in Fig. 3b. Notethat cylindrical face ‘CF1’ on the vertical plane (see Fig. 3)is recognized as a through hole (‘TH1’) and a set of parallelholes ‘CF2’ and ‘CF3’ on the lower place is recognized asparallel holes (‘PH1’) to simplify the problem, assuming adouble-spindle drilling machine is available.
3.2Generation of alternative designsThis section describes generating alternative datum se-lections that give better cycle times, based on the frame-work illustrated in Fig. 2. The functional requirements ofmachined parts are often achieved by the tolerance rela-tionship of features. For example, if two products are as-sembled using bracket holes shown in Fig. 3, and if theirrelative location in the x-direction is important, the rela-tive location of the two bracket holes must be kept precise,which necessarily means tight tolerance among the holes.When the initial designs are provided, we assume that alltolerance relationships are indispensable for functionalrequirements. Alternative datum selections are searchedfor among the choices that conform to the functionalrequirements of the products. The system searches forsuch alternative datums based on following sequence(Fig. 5).
1. The functional requirements (Fig. 5b) are extractedfrom the initial CN (Fig. 5a), where a dashed line meansthere exists a path with the designated attribute be-tween the two nodes connected by the line, or thereexists another node other than the two nodes fromwhich paths to the two nodes exist.
2. The system randomly selects only one manufacturingfeature (node in CN) for one type of geometry tolerance(Fig. 5c). For example, in a prismatic part the positionaltolerances in the x-direction may have one planar face
Fig. 3. a Solid model of a part and b its graphical representation
Fig. 4. Constraint network among manufacturing features obtainedfrom the AAG of the product in Fig. 3
Fig. 5a–d. Steps to generate alternative designs
Res Eng Design 13 (2002)
202

as the only datum whose normal vector is parallel to thex-axis. This rule is reasonable and conventional fortypical parts if they are not highly complicated.
3. The system recomposes the CN to be consistent withthe functional requirements and the selected datums.
In addition, the following three rules are strictly keptwhile manipulating the CN in order to guarantee that allfeatures within the CN are well constrained in terms oftolerance. Alternative designs generated according to theprocedure described above satisfy the first two of threerules automatically; the designs that do not satisfy thethird rule are discarded.
1. An isolated node, that is, an unconstrained feature,should not exist in a CN, because it is assumed thattolerances looser than some degree are met by the rawmaterial. Nodes with self-referenced tolerance such asflatness are exceptions to the rules.
2. A node is not allowed to have more than one incomingedge with the same type of tolerance. Otherwise, thefeature is over-constrained or one of the incomingedges with looser degree is redundant.
3. A loop is not allowed in a CN. When a loop is formed,every node within the loop has at least one incomingedge coming from another node within the same loop,hence any edge cannot be processed unless one of themhas been processed. Loops that consist of only one nodeare allowed and processed as self-referenced tolerances.
The rules discussed above can be found in a slightlydifferent form in Tsai and Cutkosky (1997), where moreinformation about the representation and reasoning ofgeometrical tolerances is provided in depth.
3.3Manufacturing cost estimation
3.3.1Modeling of process planning, manufacturing systemconfiguration and firing sequenceFor a given set of two or more product designs and pro-duction plans for a time period, the system searches for thebest process plans, manufacturing system configurationsand firing sequence to obtain minimal cycle time and facilitycost. The process plan specifies a sequence of manufacturingfeatures that satisfies the precedence condition representedin the constraint network. In order to build manufacturingsystem configurations, we also need to decide the allocationof manufacturing features in the process plan to machinestations in the manufacturing system configuration, whichcan be represented as a mapping from manufacturing fea-tures to machine stations.
Let F be a set of manufacturing features and S that ofmachines. A process plan can be represented as a sequencep, which includes every node f�F as its componentswithout duplication. Resource allocation can be repre-sented by Corr:F´S. It is assumed that a mapping Corrhas following characteristics:
Corr maps a manufacturing feature f�F to a machines�S with the matching attribute. For example, it will
assign a through hole to a drilling machine but not to amilling machine.Corr maps a manufacturing feature f�F to a uniquemachine s�S. In other words, a process is assigned toa unique machine. This implies that a product is al-lowed to pass the manufacturing system via a uniqueroute, prohibiting ‘loops’ in the transfer line.
When the process plan and the machine allocation aredecided, we can build a manufacturing system configura-tion by linking machines and assigning attributes to them.The manufacturing system configuration is defined as afour-tuple:
Config p;Corrð Þ ¼ S;E;As;Aeð Þ ; ð3Þ
where S is the set of nodes, E is the set of directed edges, Asis the set of attributes to nodes in S and Ae is the set ofattributes to directed edges in E.
A node in S represents a machine station, and a di-rected edge in E represents a transfer line. An attribute of anode represents the type of machine such as face millingor drilling. An attribute of a directed edge represents theproduct type that can be accepted by the transfer linerepresented by the directed edge. Since it is assumed thatautomated transfer lines are installed between machinesand no intermediate buffer is allowed for the simplicity ofproblem, a product is allowed to visit a machine only onceduring the production (i.e. no ‘cyclic’ production) to avoidsystem deadlock.
In addition, since there is no buffer assumed betweenmachine stations, no scheduling rule is necessary exceptfor the firing sequence at the start buffer of the manu-facturing system. The firing sequence is a finite sequenceof the product types that are waiting to enter a machine.For instance, if the production plan, which is the volumeratio of two products A and B, is 1:3 and the cycle ofsequence is 8, the firing sequence could be ABBBBABB.The firing sequence can be denoted by sequence s, whosecomponents are the elements of the attribute set Ae ofConfig.
3.3.2Discrete event simulation for cycle time estimationOnce the process planning, manufacturing system con-figuration and firing sequence are decided, a discrete eventsimulation is run to estimate the average cycle time. Theaverage cycle time means the average time span spent toobtain a completed product after obtaining the previousone.
CN of two products and the corresponding process plansand manufacturing system configurations are depicted inFigs. 6a, 6b and 6c, respectively. In Fig. 6c, the start bufferwill fire a raw material of product A to a empty node ormachine station, which is in this case the node marked ‘FM’,where the outgoing edge with attribute ‘A’ is pointing. Theamount of time for a manufacturing feature to spend on itscorresponding machine is decided by the volume of materialto be removed divided by the material removal rate of themachine, plus setup time if orientation of tool approach isdifferent from that of the previous feature (Huang et al.1997). As the computed time passes, the product A is ready
B. Lee, K. Saitou: Design of part family robust-to-production plan variations based on quantitative manufacturability evaluation
203

to leave to the next node. If the next node is empty, theproduct A is delivered to the next station ‘DR’ via the edgewhose attribute ae=‘A’. The discrete event simulation al-gorithm is based on colored Petri nets (Alla et al. 1985)implemented for our previous work on manufacturingsystem optimization (Saitou and Malpathak 1999).
Time is measured from when a product arrives at thefinal buffer for the first time to when the number ofproducts contained in the final buffer reaches the specifiedsequence cycle. Then the measured time is divided by thesequence cycle to obtain the average cycle time tc.
3.3.3Simultaneous optimization of process planning,manufacturing system configurationand firing sequenceFor each set of CN generated in Sect. 3.3.2 and a pro-duction plan, the lowest manufacturing cost is estimatedby simultaneously optimizing the process plans, manu-facturing system configuration and firing sequence. Theproduction plan for a given period of time is specified asthe fraction of each type of products and the amount oftime s for which the production plan is kept. The time s isassumed to be on the order of a few years; hence the costfor reconfiguration of the manufacturing system can beignored. Let n be the number of types of products and thefraction be ai, where 0 £ a1 £ N for i=1,2,...,n andPn
i¼1 ai ¼ N for some constant N, or collectively be an-dimensional vector a. Therefore, a production plan canbe defined as a function of time span s and the fractionvector a, which we shall call q(s,a).
Our objective is to minimize facility cost whileachieving efficient production. Facility cost is assumed toinclude the running cost of machines and the interest ofinvestment and depreciation, and to be simply dependenton the number of machines, i.e. the number of nodes |S| inConfig. Efficiency of production is assumed to be mea-sured simply by the production cycle time. Hence, theoverall cost for production of a product family for a
production plan can be estimated as the product ofamount of time period s for a production plan and thesummation of the number of machines |S| and the averagecycle time tc weighted by a set of constants.
3.4Redesign suggestion robust to variationsof production planThis is the final step to find and suggest alternative designswith reduced cost. Assuming that the forecasts on pro-duction plans for multiple periods of time of interest areavailable as a sequence of m production plans q(sj,aj) forj=1,2,...,m, we search for a set of CN of n products thatminimizes gross cost throughout the time periods of in-terest. Product designs remain the same for m periods,while the manufacturing system configuration and firingsequence are varied to provide the lowest manufacturingcost for each period. Then the manufacturing cost for eachperiod weighted by the amount of each time period s issummed to obtain the gross cost.
In summary, the whole procedure, including routinesdescribed in Sect. 3.3.3 and this section to find the optimaldatum selections that are robust to the variations in theproduction plans, can be stated as follows:
given: initial constraint network CNi0;
production plan variations q sjaj
� �and
lengths of firing sequence sj
����;
ð4Þ
find : constraint networks CNi;
process plans pij;
mappings Corrij;
mfg system configurations Configj and
firing sequences sj
ð5Þ
satisfying :
functional requirements;
tolerance rules
ð6Þ
that minimize :
grosscost ¼Xm
j¼1sj � wp � tcj þ wf � Configj
��
��
� �;
where wp and wf are weights for i ¼ 1; 2; . . . ; n
and for j ¼ 1; 2; . . . ;m:
ð7Þ
Redesigns are suggested based on the best set of CN for nproducts obtained from this procedure. Tolerance rela-tionships of original designs are then updated with thesesuggested CN.
4Software implementationBecause the problem is highly complex, a multistage op-timization scheme utilizing a genetic algorithm (Holland1975; Goldberg 1989) is adopted (Fig. 7). At the top level ofthe scheme, candidate CN are generated at the first-stage
Fig. 6. a Constraint network of product A; b constraint network ofproduct B; c corresponding manufacturing system configuration andfiring sequence that produces products A and B simultaneously
Res Eng Design 13 (2002)
204

genetic algorithm (GA) according to functionalrequirement and tolerance rules as described in Sect. 3.2.Then they are passed into the second-stage GA, where theroutine described in Sect. 3.3.3 is initiated to estimate thelowest manufacturing cost for the set of CN. At this stage,if no loop is detected, candidate pairs of a process plan-ning and a manufacturing system configuration are passedinto the third-stage GA, where the firing sequence withminimum average cycle time is decided through thediscrete event simulation system. For each set of alterna-tive CN, the second-stage GA and below is repeated mtimes to obtain the manufacturing cost for each volumeratio specified in the production plan variations. Whenthis iteration is complete for all alternative CN, the systemhas estimated gross manufacturing cost for every set ofalternative CN. Then the first-stage GA decides the best setof CN with which to update original designs. Automaticfeature recognition and updating of original designs arenot incorporated into system and remain as future work.
Since this scheme excludes infeasible solutions at eachstep without running the whole procedure for everycandidate solution, it allows a faster evaluation. However,it should be noted that the generated solution is notguaranteed optimal due to the multistage optimizationformulation and the stochastic nature of the geneticalgorithm. The computer software is written in C++ withthe intensive use of data types and algorithms of LEDA(Mehlhorn and Naher 1999) developed at Max PlanckInstitut fur Informatik, (Saarbrucken, Germany). Also, thegenetic algorithm within the software is implementedusing GAlib1. developed at MIT CADLAB.
5ExamplesIn this section, two simple case studies are provided toshow the effectiveness of our method with simulation re-sults. In each case study production plan variation forthree periods (m=3) is considered and a set of redesignsuggestions for two products (n=2) are suggested at theend of the results.
5.1Example 1: L-shaped bracketsThe initial CAD model and graphical representation fortwo products A and B are depicted in Figs. 8 and 9, re-spectively. Also, CN of products A and B can be found inFigs. 6a and 6b, respectively, in which the datum defini-tions for the two products are quite similar except for thepositional tolerance of two holes in the x-direction. Thisresemblance comes from a common design practice, thatis, when more than two similar designs are launched to-gether or when one product is designed after the other,their datum definitions are similar to reduce cost forproduction plan changes and to utilize existing fixtures.
All nodes and attributes of edges (type of tolerance) areassumed to be essential to fulfill functional requirements.Then the functional requirements for the two products canbe described as two graphs with dashed edges (Fig. 10),where a dashed line means there exists a path between the
Fig. 8. Original design of product A in example 1
Fig. 9. Original design of product B in example 1
Fig. 7. Software implementation. Numbers indicate steps describedin Sect. 3
1Documentation of this library is available at http://lancet.mit.edu/ga/
B. Lee, K. Saitou: Design of part family robust-to-production plan variations based on quantitative manufacturability evaluation
205

two nodes it connects, or there exists another node otherthan the two nodes from which paths to the two nodesexist, as described in Sect. 3.2.
Production plans for the three periods and the length ofthe sequence cycle are given as follows: q(s1,a1)=q(1,(9,1)),q(s2,a2)=q(3,(5,5)), q(s3,a3)=q(3,(2,8)) and |sj|=10 for all j.Figure 11 diagrams the production plan variations. Theweight for the cycle time and the weight for the number ofmachines are set to wp=10 and wf=65, respectively, so thatthe number of machines of optimum solutions does notreach its lower or upper bound. The material volume to beremoved for each manufacturing feature in products A andB is listed in Table 1. We use PF to represent a planar face,TH to represent a through-hole and PH to represent a pairof parallel holes. The material removal rate is given as 2, 4and 7 for the face mill, drill and parallel drills, respectively.
A set of optimized CN for two products, Config forthree periods and the accompanying six process plansobtained after running the routine described in Eqs. (4),(5), (6) and (7) are presented in Figs. 12 and 13, respec-tively. Two black edges in the CN for product A (Fig. 12a)indicate that they are reversed as a result of the search forminimum cost. No modification of product B has beensuggested (every edge in the CN for product B shown inFig. 12b is colored gray). Figure 14 shows the updateddesign with the modified CN of product A. The estimatedcosts are also given in Table 2 and are compared with theresults for the original designs with same production planvariations. Although the total processing time and thenumber of setups has not decreased in this case (Table 3),reversing the two datum definitions has achieved a costreduction of 3.7% (see gross cost in Table 2).
Figure 13 shows process plans and manufacturingsystem configurations for three periods and modified de-signs. For the first period of the production plan when thevolume ratio between A and B is 9:1, product A is routed
through four machines, while product B uses two ma-chines. For the second period when the volume ratio is 5:5,the number of machines that each product uses changes to3 versus 2. And for the third period, it is 4 versus 4. Al-though product A uses four machines for this period, thenumber of machines only for product A is 1. From thisobservation, it is obvious that a higher-volume productdominates the configuration of the manufacturing system.
To show that redesign suggestions can differ accordingto production plan variations, we generated three sets ofoptimal redesign suggestions for each volume ratio in theproduction plans shown in Fig. 11. Each pair of CN pre-sented in Fig. 15 is a better solution than the robust so-lution depicted in Fig. 12, as far as each production plangoes. For example, if production plan of 5:5 (period 2) iskept throughout the time periods, the solution in Fig. 15b
Fig. 10. Representation of functional requirement for example 1
Fig. 11. Production plan variations for example 1
Table 1. Material volume to beremoved for manufacturingfeatures in example 1
Product A Feature PF1 PF6 TH1 PH1 –Volume 20 22 50 90 –
Product B Feature PF8 PF1 PF6 PH1 PH2Volume 10 22 20 90 90
Fig. 12a, b. Redesign suggestion of constraint networks of product Aand B in example 1. Black edges represent reversed edges from theoriginal CN
Fig. 13a–c. Process plans and manufacturing system configurationcorresponding to three periods of production plan (Fig. 11) and theredesign suggestions (Fig. 12)
Res Eng Design 13 (2002)
206

will cost less than the solution. Since example 1 is verysimple and is limited in terms of choices of datum sources,all process plans of Fig. 15 and those of the robust solutionconverged to production plans with the minimum numberof setups, which is crucial to shorter cycle times. In fact,the solution for period 1 is identical to the robust solution,which shows that the design space is very limited and thereare not many candidates with the minimum number ofsetups.
5.2Example 2: oscillator housingsMore complicated turned parts are studied in example 2.A CAD model and graphical representation for twoproducts A and B are depicted in Figs. 16 and 17, re-spectively. Also, CN of products A and B can be found inFig. 18. Product A is directly adopted from Madsen et al.(1991), and product B is modified slightly from product A.Functional requirements for the two product can be de-scribed as two graphs with dashed edges in Fig. 19, in thesame way as in example 1.
Production plans for three periods and the length of thesequence cycle are given as follows: q(s1,a1)=q(2,(8,2)),q(s2,a2)=q(3,(5,5)), q(s3,a3)=q(3,(2,8)) and |sj|=10.Figure 20 shows the production plan variations diagram-
matically. The weight for the cycle time wp=20, and theweight for the number of machines wf=55. The materialvolume to be removed for each manufacturing feature inproduct A is presented in Table 4. Table 5 gives theavailable types of machines and their material removalrates (MRR) and matching manufacturing feature types.For turning machines, the time for tool changes is as-sumed to be negligible.
A set of optimized CN for two products is presentedin Fig. 21, and Config for three periods and the ac-companying six process plans obtained after running theroutine described in Eqs. (4), (5), (6) and (7) are pre-sented in Fig. 22. Figures 23 and 24 show the updateddesigns with modified CN of products A and B, re-spectively. More design changes have been made than inexample 1 because increased complexity provides thesystem with a wider range of choices for alternative
Fig. 14. Updated design of product A in example 1
Table 2. Cost comparison be-tween the original and modifieddesigns – example 1
Overall cost for period j Grosscost
j=1 j=2 j=3
Original designs 501.111 526.111 566.111 3777.777Modified designs 493.333 497.778 549.444 3635.000
Table 3. The number of setupsin the process plans from theredesign suggestion
Part Process plans Orientations of machining features in sequence No. ofsetups
A p11, p12, p13 –y –z z y – 3B p21, p22 –z –x –y y z 4
p23 –x –z y –y z 4
Fig. 15a–c. Each pair of constraint networks of products A and B isoptimized for each volume ratio shown in Fig. 11. For each volumeratio, these CN give a lower cost than those in Fig. 12 optimizedthroughout the production periods
B. Lee, K. Saitou: Design of part family robust-to-production plan variations based on quantitative manufacturability evaluation
207

datums. The evaluated costs are given in Table 6 andare compared with the result for the original designswith the same production plan variations. The cost ofthe modified designs shows a 5.9% cost reduction (seegross cost in Table 6).
Figure 22a–c shows process plans and manufacturingsystem configurations for three periods and modified de-signs. As noticed in example 1, example 2 also shows thatthe higher-volume product dominates the configuration ofthe manufacturing system, although the processes are not
well distributed throughout the manufacturing systems asin example 1.
Figure 25 shows three pairs of products A and B opti-mized for the production plan of each period. Because theproblem is more complex than that in example 1, these CNdo not show as much similarity as those in example 1. Thecomplexity comes not only from the number of manu-facturing features (nodes) but also from the number ofconstraints (edges). Moreover, the number of datumsavailable for a geometrical tolerance affects the complexity
Fig. 16. Original design ofproduct A in example 2
Fig. 17. Original design ofproduct B in example 2
Fig. 18. Constraint networks of products A and B in example 2 Fig. 19. Representation of functional requirement for example 2
Res Eng Design 13 (2002)
208

of problem. While only two datums are available for mostof the geometrical tolerances in example 1, four or fivedatums are available in example 2. For example, fourfeatures are available (BO1, BO2, BO3 and ST1) for theconcentricity (denoted as ‘c1’) in product A of example 2.In the examples, allowing a specific manufacturing featureto be a datum of a geometrical tolerance was decided basedon the shape, size and orientation of the feature. However,experienced engineers could decrease the complexity ofthe problem by excluding some of the available datumsbased on their experience. This is very desirable, since GAwould find more practical solutions in a shorter time.
6Conclusion and discussionThis paper provides a simple framework to evaluate themanufacturability of a part family and to generate redesignsuggestions to reduce the cost for production plan varia-tions. For this purpose, a graphical representation of ge-ometry and tolerance information is devised. Methods todefine functional requirements and to generate alternativedesigns are also presented. An optimization methodutilizing GA was developed to find redesign suggestions.Although the results obtained are not guaranteed to beoptimum, it shows a certain advantage over originaldesigns that are already fair enough, considering everymanufacturing feature and its tolerances are assumed to bepart of the functional requirements. However, for moresophisticated products, where more degrees of freedom indefining tolerances and datums exist and the formation ofredundant design elements is more probable, the appli-cation of this method would provide significant improve-ment.
A number of assumptions have been made on theproblem formulation. Relaxing these assumptions is thetopic of future work, including:
While similar datum definitions may share a fixture, ifwe set different datum definitions for the same fea-tures of different products, a new fixture must bedesigned and utilized in the manufacturing system,and its cost should be included.There is also a certain cost for the design changes,although it is not easy to estimate. When a part thathas been under production is changed according to anew production plan, changing existing designs willinvoke additional overhead cost.The reconfiguration cost of manufacturing systemsbetween production plans can be included.For application to more realistic and complex manu-facturing systems, the modeling should allow multiplechoices of machine for a manufacturing feature toachieve shorter cycle time.When modifying constraint networks, the effect ofdatums in terms of tolerance level has been ignored.When a path between a pair of nodes is lengthened,the tolerance level of each edge in the lengthened pathshould be adjusted higher to meet the tolerance levelof the original path because of tolerance accumulation.Then the cost of increasing tolerance level should beestimated and included in overall cost.
Finally, application to assembly design of a productfamily can be considered in future work, since precedence
Fig. 20. Production plan variations for example 2
Table 4. Material volume to beremoved for manufacturingfeatures in example 2
Product AFeature BO1 IF1 BO2 FA1 CH1 TH1 ST1 BO3 IF2Volume 30 5 10 8 15 12 60 10 5
Product BFeature BO1 IF1 BO2 FA1 CH1 TH1 ST1 FA2 –Volume 30 5 10 8 15 12 60 8 –
Table 5. Material removal rateand matching manufacturingfeatures for types of machines inexample 2
Type of machine Turning (TU) Cross-drilling(CD)
Tapered cross-drilling (TD)
MRR 2 4 3.5Manufacturing features Straight turning (ST) Cross-hole (CH) Tapered cross-hole (TH)
Boring (BO)Facing (FA)Internal facing (IF)
Fig. 21. Modified constraint network of products A and B inexample 2
B. Lee, K. Saitou: Design of part family robust-to-production plan variations based on quantitative manufacturability evaluation
209
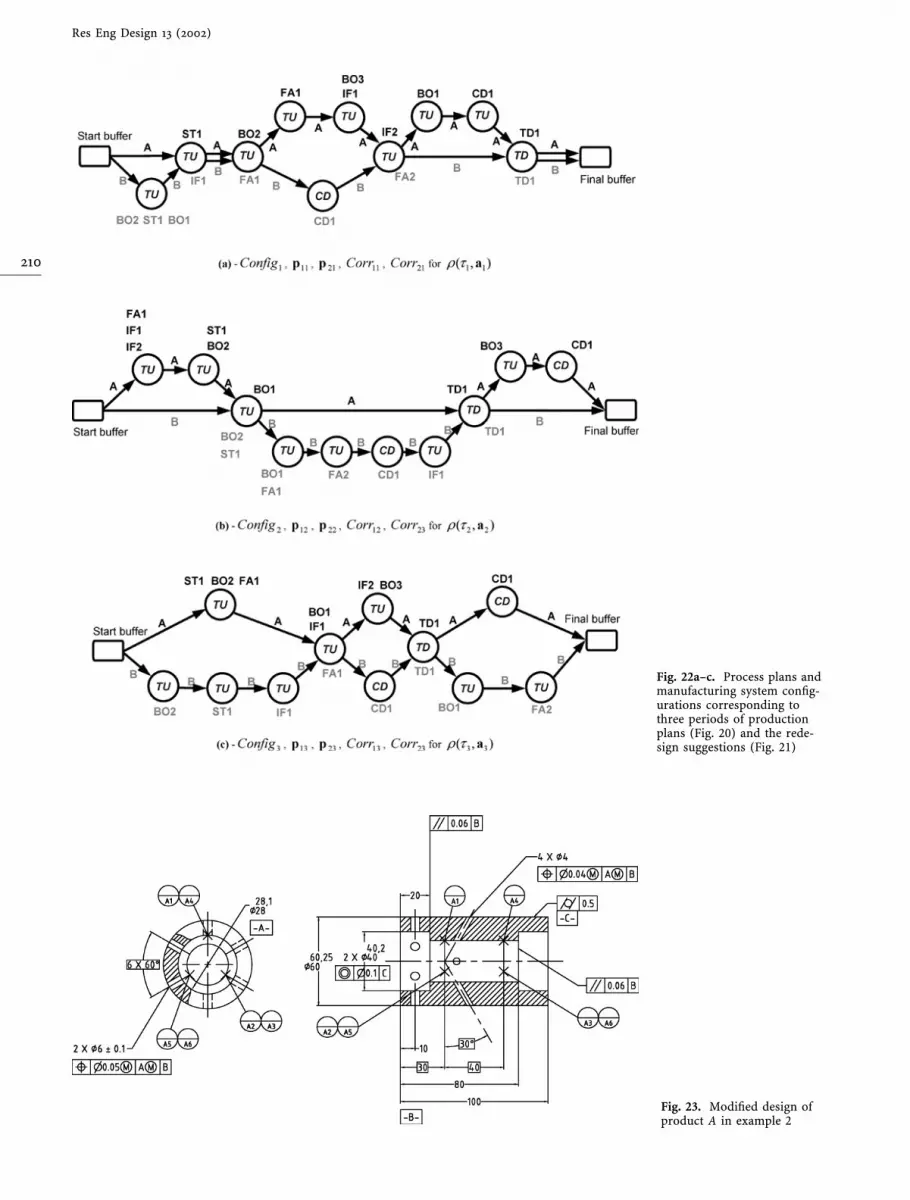
Fig. 22a–c. Process plans andmanufacturing system config-urations corresponding tothree periods of productionplans (Fig. 20) and the rede-sign suggestions (Fig. 21)
Fig. 23. Modified design ofproduct A in example 2
Res Eng Design 13 (2002)
210

conditions in assembly sequences and core functions mustbe kept, which is similar to the approach proposed in thisresearch.
ReferencesAlla H, Ladet P, Martinez J, Silva-Suarez M (1985) Modeling and
validation of complex systems by colored Petri nets: application toflexible manufacturing systems. Lecture Notes Comput Sci188:1–14
Bralla JG (1999) Design for manufacturability handbook. McGraw-Hill, New York
Boothroyd G, Dewhurst P, Knight W (1999) Product design formanufacture and assembly. Dekker, New York
Das D, Gupta SK, Nau DS (1994) Reducing setup cost by automatedgeneration of redesign suggestions. In: Proc 1994 ASME Interna-tional Computers in Engineering Conference and Exhibition,Part 1
Das D, Gupta SK, Nau DS (1996) Generating redesign suggestions toreduce setup cost: a step towards automated redesign. ComputAided Des 28:763–782
Fu Z, dePennington A (1994) Geometric reasoning based on graphgrammar parsing. ASME J Mech Des 116:763–769
Fujita K, Akagi S, Yoneda T, Ishikawa M (1998) Simultaneous opti-mization of product family sharing system structure and config-uration. In: Proc ASME Design Engineering TechnicalConferences, Atlanta, 12–16 September, paper no. DETC98/DFM-5722
Goldberg DE (1989) Genetic algorithms in search, optimization andmachine learning. Addison-Wesley, Reading, Mass
Gonzalez-Zugasti JP, Otto KN, Baker JD (1998) A method for archi-tecting product platforms with an application to interplanetarymission design. In: Proc ASME Design Engineering TechnicalConferences, Atlanta, 12–16 September, paper no. DETC98/DAC-5608
Gupta SK, Regli WC, Das D, Nau DS (1997) Automated manufactu-rability analysis: a survey. Res Eng Des 9:168–190
Hayes CC (1996) Plan-based manufacturability analysis and genera-tion of shape-changing redesign suggestions. J Intell Manuf 7:121–132
Fig. 24. Modified design ofproduct B in example 2
Table 6. Cost comparison be-tween the original and modifieddesigns for example 2
Overall cost for period j Grosscost
j=1 j=2 j=3
Original designs 1122.33 1011.22 1105 8593.32Modified designs 1031.56 970.667 1035.67 8082.13
Fig. 25a–c. Each pair of constraint networks of products A and B isoptimized for each volume ratio shown in Fig. 20. For each volumeratio, these CN give a lower cost than the ones in Fig. 21 optimizedthroughout the production period
B. Lee, K. Saitou: Design of part family robust-to-production plan variations based on quantitative manufacturability evaluation
211

Hayes CC, Sun HC (1995) Using a manufacturing constraint networkto identify cost-critical areas of designs. Art Intell Eng Des AnalManuf 9:73–87
Hernandez G, Simpson TW, Allen JK, Bascaran E, Avila LF, Salinas F(1998) Robust design of product families for make-to-order sys-tems. In: Proc ASME Design Engineering Technical Conferences,Atlanta, 12–16 September, paper no. DETC98/DAC-5595
Herrmann JW, Chincholkar MM (2000) Design for production: a toolfor reducing manufacturing cycle time. In: Proc ASME DesignEngineering Technical Conferences, Las Vegas, 12–15 September,paper no. DETC2000/DFM-14002
Holland JH (1975) Adaptation in natural and artificial systems. Univof Michigan Press, Ann Arbor
Huang SH, Zhang HC, Oldham WJB (1997) Tolerance analysis forsetup planning: a graph theoretical approach. Int J Product Res35:1107–1124
Ishii K, Juengel C, Eubanks CF (1995) Design for product variety: keyto product line structuring. In: Proc ASME Design EngineeringTechnical Conferences, Boston, 17–20 September, 2:499–506
Joshi S, Chang TC (1988) Graph-based heuristics for recognition ofmachined features from a 3-D solid model. Comput Aided Des2:58–66
Kota S, Sethuraman K, Miller R (2000) A metric for evaluating designcommonality in product families. J Mech Des 122:403–410
Kusiak A, He DW (1998) Design for agility: a scheduling perspective.Robotics Comput Integrated Manuf 14:415–427
Mehlhorn K, Naher S (1999) The LEDA platform of combinatorial andgeometric computing. Cambridge University Press, Cambridge
Madsen DA, Shumaker TM, Turpin JL, Stark C (1991) Engineeringdrawing and design. Delmar, Albany, New York
Nelson SA II, Parkinson MB, Papalambros PY (1999) Multicriteriaoptimization in product platform design. In: Proc ASME DesignEngineering Technical Conferences, Las Vegas, Paper No.DETC99/DAC-8676
Saitou K, Malpathak S (1999) Robustness optimization of FMS underproduction plan variations: the case of cyclic production. In: ProcASME Design Engineering Technical Conferences, Las Vegas,12–15 September, paper no. DETC99/CIE-9127
Simpson TW, Maier JRA, Mistree F (1999) A product platform con-cept exploration method for product family design. In: Proc ASMEDesign Engineering Technical Conferences, Las Vegas, 12–15September, paper no. DETC99/DTM-8761
Suresh NC, Kay JM (eds) (1998) Group technology and cellularmanufacturing: a state-of-the-art synthesis of research and prac-tice. Kluwer, Boston
Tsai J, Cutkosky MR (1997) Representation and reasoning of geo-metric tolerances in design. Art Intell Eng Des Anal Manuf11:325–341
Ulrich KT, Eppinger SD (1995) Product design and development.McGraw-Hill, New York
van Vliet JW, van Luttervelt CA, Kals HJJ (1999) State-of-the-art re-port on design for manufacturing. In: Proc ASME Design Engi-neering Technical Conferences, Las Vegas, 12–15 September,paper no. DETC99/DFM-8970
Whitney DE (1993) Nippondenso Co Ltd: a case study of strategicproduct design. Res Eng Des 5:1–20
Res Eng Design 13 (2002)
212