design, modeling and parametric optimization of
TRANSCRIPT
International Journal of Low-Carbon Technologies 2021, 16, 1060–1076© The Author(s) 2021. Published by Oxford University Press.This is an Open Access article distributed under the terms of the Creative Commons Attribution License (http://creativecommons.org/licenses/by/4.0/), whichpermits unrestricted reuse, distribution, and reproduction in any medium, provided the original work is properly cited.https://doi.org/10.1093/ijlct/ctab032 Advance Access publication 27 April 2021 1060
Design, modeling and parametricoptimization of thermoelectric coolingsystems for high power density electronicdevices. . . . . . . . . . . . . . . . . . . . . . . . . . . . . . . . . . . . . . . . . . . . . . . . . . . . . . . . . . . . . . . . . . . . . . . . . . . . . . . . . . . . . . . . . . . . . . . . . . . . . . . . . . . . . . . . . . . . . . . . . . . . . . . . . . . . . . . . . . . . . . . . . . . . . . . . . . . . . .
Mohammed Barrubeeah*, Mohamed Rady, Alaa Attar, Faisal Albatati andAbdullah AbuhabayaMechanical Engineering Department, Faculty of Engineering at Rabigh, King AbdelazizUniversity, KSA. . . . . . . . . . . . . . . . . . . . . . . . . . . . . . . . . . . . . . . . . . . . . . . . . . . . . . . . . . . . . . . . . . . . . . . . . . . . . . . . . . . . . . . . . . . . . . . . . . . . . . . . . . . . . . . . . . . . . . . . . . . . . . . . . . . . . . . . . . . . .
AbstractThe present article reports on the design, modeling and parametric optimization of a thermoelectric coolingsystem for electronics applications. An analytical model based on energy equilibrium is developed forcooling a microprocessor using a thermoelectric module with an air-cooled finned heat sink. The proposedanalytical model is validated by experimental measurements and by comparison with detailed 3D numericalsimulations. Estimation of effective material properties of the thermoelectric module using manufacturer-reported performance characteristics is found to reduce the uncertainty in the calculation of module inputpower as compared to experimental measurements. A parametric optimization of the thermoelectric moduleand heat sink is carried out to maximize the coefficient of performance (COP) and achieve the requiredcooling capacity of the microprocessor. The effectiveness of the proposed methodology is demonstratedfor cooling current high power microprocessors. At a constant input current, the cooling capacity andCOP of the thermoelectric cooling system increase with increasing thermoelectric module geometric ratio.Furthermore, at a constant geometric ratio, the cooling power increases with increasing input current toreach a maximum value and then decreases. The present study highlights the importance of designing andfabricating high-performance thermoelectric cooler modules with optimum parameters for cooling specificelectronic components. The results indicate that the cooling capacity can be increased by ∼70% usingthermoelectric modules with optimized parameters as compared to using non-optimized commerciallyavailable thermoelectric modules.
Keywords: thermoelectric; heat transfer; microprocessor
*Corresponding author:[email protected]
Received 29 January 2021; revised 12 March 2021; editorial decision 23 March 2021; accepted 23 March2021
. . . . . . . . . . . . . . . . . . . . . . . . . . . . . . . . . . . . . . . . . . . . . . . . . . . . . . . . . . . . . . . . . . . . . . . . . . . . . . . . . . . . . . . . . . . . . . . . . . . . . . . . . . . . . . . . . . . . . . . . . . . . . . . . . . . . . . . . . . . . . . . . . . . . . . . . . . . . . . . . . . . . . . . . . . . . . . . . .
1. INTRODUCTIONThe large amount of heat generated during operation from cur-rent electronic devices poses significant challenges for efficientthermal management to ensure safe and reliable operation. Thesechallenges relate to the need to maintain the electronic devicejunction temperature below the maximum allowable temperatureat the processor die, known as the junction temperature. In thearea of microprocessor cooling, thermal design power (TDP)represents the average power the processor dissipates when oper-ating at base frequency with all cores active. The values of TDPcontinue to increase with the development of new generations
of devices. For example, the TDP value for the recent Intel i9 Xseries processors is as high as 165 W, with a maximum allowedjunction temperature of 94◦C [14]. The primary challenge withusing conventional bulk cooling systems is the limited availablespace in electronic packages. The high effective heat dissipationrequirements are difficult to meet using conventional air or waterpassive cooling technologies; therefore, active cooling methodsshould be applied.
Thermoelectric coolers (TECs) associated with hot side airor liquid cooling solutions have shown promise for electronicscooling. The advantages of TECs include their small size, highreliability and low noise. The use of TECs in military, aerospace,
Dow
nloaded from https://academ
ic.oup.com/ijlct/article/16/3/1060/6248809 by guest on 28 June 2022
Design, modeling and parametric optimization
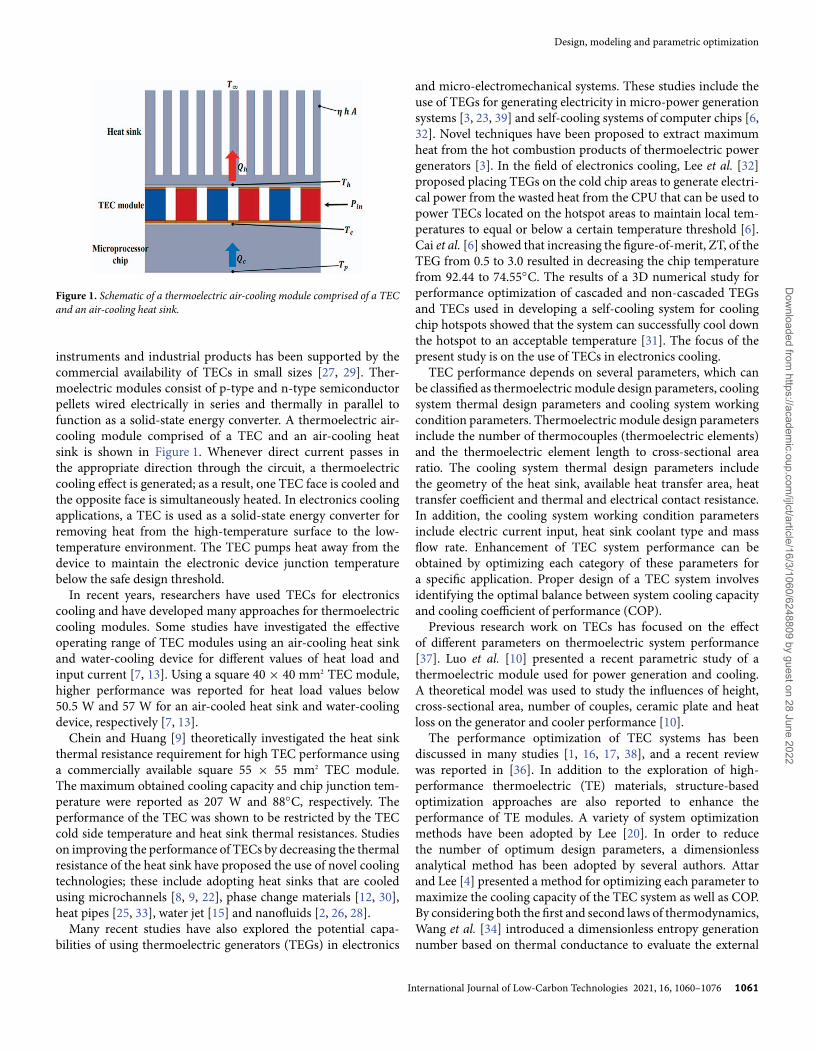
Figure 1. Schematic of a thermoelectric air-cooling module comprised of a TECand an air-cooling heat sink.
instruments and industrial products has been supported by thecommercial availability of TECs in small sizes [27, 29]. Ther-moelectric modules consist of p-type and n-type semiconductorpellets wired electrically in series and thermally in parallel tofunction as a solid-state energy converter. A thermoelectric air-cooling module comprised of a TEC and an air-cooling heatsink is shown in Figure 1. Whenever direct current passes inthe appropriate direction through the circuit, a thermoelectriccooling effect is generated; as a result, one TEC face is cooled andthe opposite face is simultaneously heated. In electronics coolingapplications, a TEC is used as a solid-state energy converter forremoving heat from the high-temperature surface to the low-temperature environment. The TEC pumps heat away from thedevice to maintain the electronic device junction temperaturebelow the safe design threshold.
In recent years, researchers have used TECs for electronicscooling and have developed many approaches for thermoelectriccooling modules. Some studies have investigated the effectiveoperating range of TEC modules using an air-cooling heat sinkand water-cooling device for different values of heat load andinput current [7, 13]. Using a square 40 × 40 mm2 TEC module,higher performance was reported for heat load values below50.5 W and 57 W for an air-cooled heat sink and water-coolingdevice, respectively [7, 13].
Chein and Huang [9] theoretically investigated the heat sinkthermal resistance requirement for high TEC performance usinga commercially available square 55 × 55 mm2 TEC module.The maximum obtained cooling capacity and chip junction tem-perature were reported as 207 W and 88◦C, respectively. Theperformance of the TEC was shown to be restricted by the TECcold side temperature and heat sink thermal resistances. Studieson improving the performance of TECs by decreasing the thermalresistance of the heat sink have proposed the use of novel coolingtechnologies; these include adopting heat sinks that are cooledusing microchannels [8, 9, 22], phase change materials [12, 30],heat pipes [25, 33], water jet [15] and nanofluids [2, 26, 28].
Many recent studies have also explored the potential capa-bilities of using thermoelectric generators (TEGs) in electronics
and micro-electromechanical systems. These studies include theuse of TEGs for generating electricity in micro-power generationsystems [3, 23, 39] and self-cooling systems of computer chips [6,32]. Novel techniques have been proposed to extract maximumheat from the hot combustion products of thermoelectric powergenerators [3]. In the field of electronics cooling, Lee et al. [32]proposed placing TEGs on the cold chip areas to generate electri-cal power from the wasted heat from the CPU that can be used topower TECs located on the hotspot areas to maintain local tem-peratures to equal or below a certain temperature threshold [6].Cai et al. [6] showed that increasing the figure-of-merit, ZT, of theTEG from 0.5 to 3.0 resulted in decreasing the chip temperaturefrom 92.44 to 74.55◦C. The results of a 3D numerical study forperformance optimization of cascaded and non-cascaded TEGsand TECs used in developing a self-cooling system for coolingchip hotspots showed that the system can successfully cool downthe hotspot to an acceptable temperature [31]. The focus of thepresent study is on the use of TECs in electronics cooling.
TEC performance depends on several parameters, which canbe classified as thermoelectric module design parameters, coolingsystem thermal design parameters and cooling system workingcondition parameters. Thermoelectric module design parametersinclude the number of thermocouples (thermoelectric elements)and the thermoelectric element length to cross-sectional arearatio. The cooling system thermal design parameters includethe geometry of the heat sink, available heat transfer area, heattransfer coefficient and thermal and electrical contact resistance.In addition, the cooling system working condition parametersinclude electric current input, heat sink coolant type and massflow rate. Enhancement of TEC system performance can beobtained by optimizing each category of these parameters fora specific application. Proper design of a TEC system involvesidentifying the optimal balance between system cooling capacityand cooling coefficient of performance (COP).
Previous research work on TECs has focused on the effectof different parameters on thermoelectric system performance[37]. Luo et al. [10] presented a recent parametric study of athermoelectric module used for power generation and cooling.A theoretical model was used to study the influences of height,cross-sectional area, number of couples, ceramic plate and heatloss on the generator and cooler performance [10].
The performance optimization of TEC systems has beendiscussed in many studies [1, 16, 17, 38], and a recent reviewwas reported in [36]. In addition to the exploration of high-performance thermoelectric (TE) materials, structure-basedoptimization approaches are also reported to enhance theperformance of TE modules. A variety of system optimizationmethods have been adopted by Lee [20]. In order to reducethe number of optimum design parameters, a dimensionlessanalytical method has been adopted by several authors. Attarand Lee [4] presented a method for optimizing each parameter tomaximize the cooling capacity of the TEC system as well as COP.By considering both the first and second laws of thermodynamics,Wang et al. [34] introduced a dimensionless entropy generationnumber based on thermal conductance to evaluate the external
International Journal of Low-Carbon Technologies 2021, 16, 1060–1076 1061
Dow
nloaded from https://academ
ic.oup.com/ijlct/article/16/3/1060/6248809 by guest on 28 June 2022
M. Barrubeeah et al.
irreversibility in the thermoelectric cooling system. Lee [20]adopted the use of a thermal conduction ratio, convectionconduction ratio and load resistance ratio as new dimensionlessgroups to represent important parameters of the thermoelectricdevices. Zhu et al. [24] conducted a theoretical study focusedon the optimal heat exchanger configuration of a TEC system.The analytical results indicated that the highest COP, highestheat flux pumping capability of the TEC and lowest cold sidetemperature can be achieved by selecting an optimal heat transferarea allocation ratio. Elarusi et al. [11] investigated the optimumdesign of a TEC with heat sinks based on a modification ofthe dimensional technique developed by Lee [20]. The analysisshowed that an optimal design of a TEC can be determined if twofluid temperatures at the heat sinks are known. Optimization ofthe TEC cooling power and COP were achieved by optimizingthe dimensionless current and thermal conductance.
In designing and developing a TEC for electronic cooling appli-cations, its purpose is to maintain the electronic device junctiontemperature below a safe temperature by rejecting the heat fromthe electronic device. Due to the fact that the parameters for com-mercially available TEC modules vary based on the manufacturer,the key design task is to find the optimum thermoelectric ele-ment geometry and structure parameters and the relevant designconstraints. Despite the numerous parametric analyses and opti-mizations of TEC systems discussed above, efficient design toolsare needed that can assist developers to select and design suitableTECs for cooling electronic components, reducing the need forcostly and time-consuming experimental evaluation tests.
The goal of this study is to develop an analytical model for thedesign and optimization of TECs for microprocessor cooling. Thisstudy’s major contribution is a simple and robust design tool thatcan be easily used by electronics developers to design an effectiveTEC system for current high power density microprocessors.
In the present study, optimization techniques are employedfor optimizing the thermoelectric module design parameters andheat sink cooling system. A case study involving the cooling of anIntel i9 microprocessor is utilized to demonstrate the capability ofthe proposed design and analytical approach. Commercial TECmodules are investigated and their performance is predicted byestimating the effective material properties from the performancecurves typically provided by the manufacturers. The performanceof the TEC module depends on a set of parameters such as theelectrical current, the thermal conductivity of the semiconduc-tors, the number thermoelectric elements and its geometric ratio.Likewise, the heat sink performance depends on the number andthickness of the fins as well as the fin spacing, which influencethe heat transfer rate. The thermoelectric parameters are stud-ied simultaneously with the heat sink parameters in which theoptimum cooling power is analyzed along with the heat sinkdimensions, electrical current and leg length of the thermoelec-tric module. The proposed analytical models are validated withdetailed 3D numerical simulations. In addition, the predictionsfrom the theoretical model are compared with the experimen-tal results. The optimal design using the developed analyticalmodel with the effective material properties obtained by Weera
et al. [35] is shown to be simple and robust. The present studyhighlights the importance of the optimal design and fabrica-tion of high-performance TEC modules specifically for coolingelectronic components. The use of commercially available TEmodules may limit the performance of these electronic devices.
2. DESIGN AND MODELINGThe thermoelectric system used to cool the microprocessor inthis study consists of a thermoelectric module placed betweena microprocessor and a heat sink, as shown above in Figure 1.The microprocessor considered in the present study is the Intel®
Core™ i9-9820X X-series Processor with a total power dissipa-tion of 165 W, junction temperature of 94◦C and a surface area50 × 50 mm2 [14]. Intel recommends the use of a liquid coolinghigh-performance thermal solution attached to the entire surfacearea of the microprocessor. In the present design, the surface areaof the TEC is considered equal to the microprocessor area, asshown in Figure 1. This design represents the minimum solutionas constrained by space limitations; increasing the TEC modulearea results in more heat dissipation from the microprocessor.
The microprocessor generates the heat, Qc, at the bottom of themicroprocessor layer, and the heat subsequently transfers to theTEC module by conduction. The TEC module then absorbs theQc at the cold junction and rejects the heat at the hot junction viathermoelectric cooling effects. Finally, the heat rejected from theTEC module, Qh, dissipates into the surroundings by convection.Different modeling approaches for TEC have been reported in theliterature. Three-dimensional modeling involves solving govern-ing nonlinear partial differential equations to capture the tem-perature distribution both along and across the thermoelectricelement; however, this requires significantly more computationaleffort. In contrast, energy equilibrium models (EEMs) are simpleand, when they are validated, can be used as an analytical designtool for thermoelectric cooling applications. In the present study,an analytical model based on energy equilibrium is validated bycomparison with the results obtained from a 3D numerical modeland experimental measurements.
2.1. TEC energy equilibrium modelAn EEM is developed based on governing equations that describethe thermoelectric effects to evaluate the performance of TECmodules. An EEM is a compact model that can be applied tosimplify the design process of the TEC. The calculations of heatflux at the cold and hot sides of the TEC take into accountthe Seebeck effect, Joule heating and heat conduction. They arewritten as follows [21]:
Qc = n[αTcI − 1
2I2R − K (Th − Tc)
](1)
Qh = n[αThI + 1
2I2R − K (Th − Tc)
](2)
1062 International Journal of Low-Carbon Technologies 2021, 16, 1060–1076
Dow
nloaded from https://academ
ic.oup.com/ijlct/article/16/3/1060/6248809 by guest on 28 June 2022
Design, modeling and parametric optimization
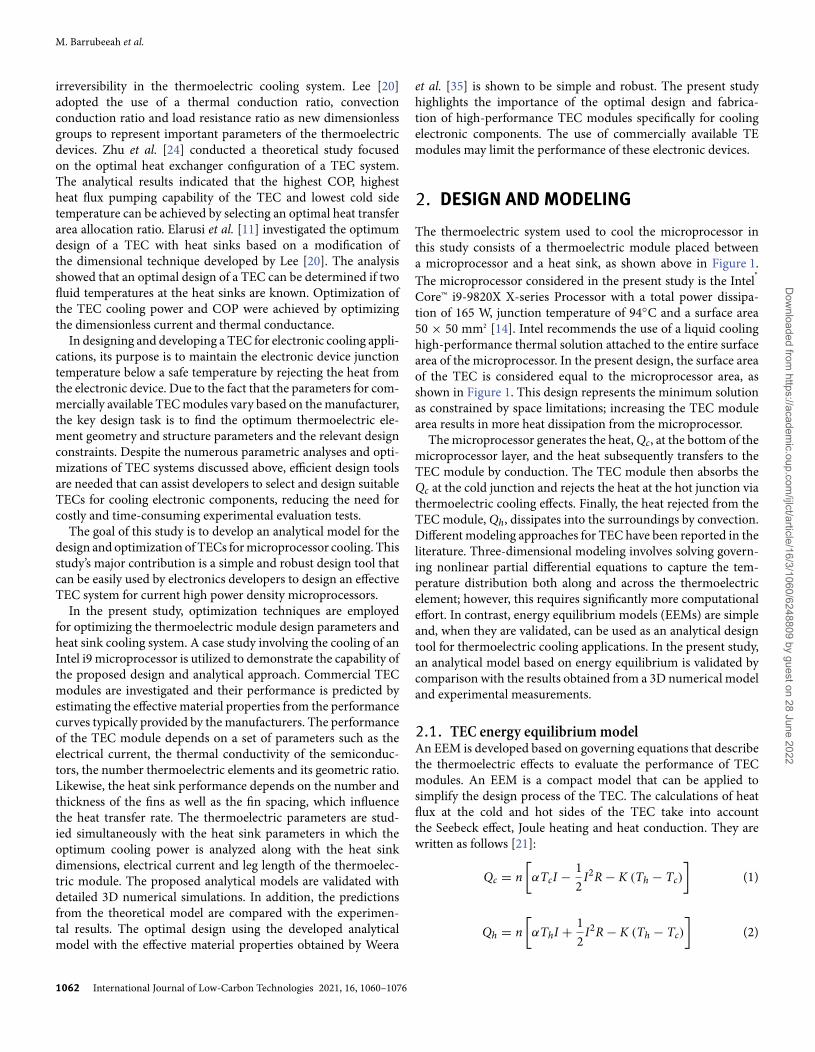
where Qc is the cooling capacity at cold side,Qh is the heat rejec-tion rate, n is the number of thermoelectric elements, α is theSeebeck coefficient,Tc is the cold junction temperature,Th is thehot junction temperature, I is current, R is the electrical resistanceof the thermoelectric element and K is the thermal conductance ofthe thermoelectric element. The values of R and K are calculatedusing the following:
R = ρLe
Ae(3)
K = kAe
Le(4)
where ρ is the electrical resistivity (Ω cm), k is the thermalconductivity,Ae is the cross-sectional area of the thermoelectricelement and Le is the length of thermoelectric element.
The performance of thermoelectric devices is measured by thefigure of merit, Z, with units of 1/K, written as follows:
Z = α2
ρk= α2σ
k(5)
where σ is electrical conductivity(Ωcm
)−1. The dimensionlessfigure of merit is defined by ZT, where T is the absolute tem-perature; it is practically limited to values of ZT ≈ 1. Highervalues of ZT indicate greater energy conversion efficiency ofthe TEC material. The quantity of α2σ is defined as the powerfactor and is a function of the Seebeck coefficient, α, and theelectrical conductivity, σ. Therefore, it is preferable to increase theelectrical conductivity and minimize the thermal conductivity.Improving a material’s ZT is challenging due to the well-knowninterdependence among these physical properties [29].
Assuming that the n- and p-type thermoelectric elements havethe same leg length and cross-sectional area [21], and consideringthe heat transfer rate from the heat sink by convection and con-duction in the processor, the governing equations are written asfollows:
Qh = ηhA (Th − T∞) (6)
Qh = n(
αI Th + 0.5 I2 ρ
Ge− Ge k (Th − Tc)
)(7)
Qc = n(
αI Tc − 0.5 I2 ρ
Ge− Ge k (Th − Tc)
)(8)
Qc = kpAp
tp
(Tp − Tc
)(9)
where T∞ is the average air temperature between the air inlet andoutlet, Ge is the geometric ratio of the thermoelectric element,which is equal to Ae
Le,Ae is the cross-sectional area of the thermo-
electric element, Le is the length of the thermoelectric element,kpis the thermal conductivity of the processor, Ap is the heattransfer area of the processor, tp is the processor thickness andTp is the processor temperature.
The input power to the TEC module is given by the following:
Pin = Qh − QC. (10-a)
Figure 2. Cross-sectional area and length of a thermoelectric element.
Alternatively, from the perspective of the power supply, assum-ing no losses in the circuit, the power consumption of the TECcan be calculated using the voltage, V , and current, I, as follows:
Pin = VI. (10-b)
The COP is given by the following:
COP = Qc
Pin. (11)
2.2. TEC effective material propertiesSolving Equations (7) and (8) requires the determination of prop-erties of the thermoelectric module. The design of a TEC modulefor cooling applications is usually based on commercially availableelements in the market. The manufacturers of thermoelectricmodules typically provide the maximum values for parameterssuch as temperature difference, �Tmax, the electrical current,Imax, the cooling power, Qmax, and the voltage, Vmax. However,the material properties of the module such as the Seebeck coef-ficient, α, the electrical resistivity, ρ, and the thermal conduc-tivity, k, are not given. Material property values can be obtainedusing the effective material equations, where the properties areextracted from the maximum parameters provided by the man-ufacturers [35], as defined in Equations (12) to (15). The effectivefigure of merit, Z∗, is given by the following [21]:
Z∗ = 2�Tmax
(Th − �Tmax)2 . (12)
The effective Seebeck coefficient, α∗, is given by the following:
α∗ = 2Qmax
n Imax (Th + �Tmax). (13)
International Journal of Low-Carbon Technologies 2021, 16, 1060–1076 1063
Dow
nloaded from https://academ
ic.oup.com/ijlct/article/16/3/1060/6248809 by guest on 28 June 2022
M. Barrubeeah et al.
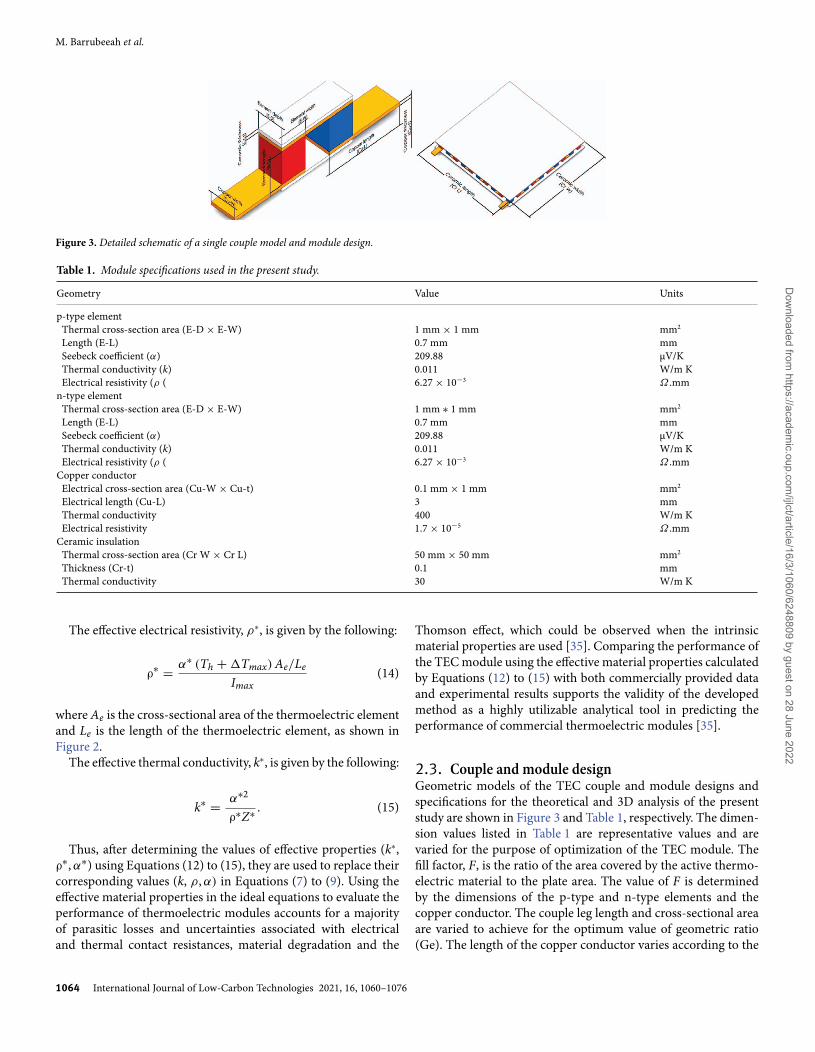
Figure 3. Detailed schematic of a single couple model and module design.
Table 1. Module specifications used in the present study.
Geometry Value Units
p-type elementThermal cross-section area (E-D × E-W) 1 mm × 1 mm mm2
Length (E-L) 0.7 mm mmSeebeck coefficient (α) 209.88 μV/KThermal conductivity (k) 0.011 W/m KElectrical resistivity (ρ ( 6.27 × 10⁻³ Ω .mm
n-type elementThermal cross-section area (E-D × E-W) 1 mm ∗ 1 mm mm2
Length (E-L) 0.7 mm mmSeebeck coefficient (α) 209.88 μV/KThermal conductivity (k) 0.011 W/m KElectrical resistivity (ρ ( 6.27 × 10⁻³ Ω .mm
Copper conductorElectrical cross-section area (Cu-W × Cu-t) 0.1 mm × 1 mm mm2
Electrical length (Cu-L) 3 mmThermal conductivity 400 W/m KElectrical resistivity 1.7 × 10⁻⁵ Ω .mm
Ceramic insulationThermal cross-section area (Cr W × Cr L) 50 mm × 50 mm mm2
Thickness (Cr-t) 0.1 mmThermal conductivity 30 W/m K
The effective electrical resistivity, ρ∗, is given by the following:
ρ∗ = α∗ (Th + �Tmax) Ae/Le
Imax(14)
where Ae is the cross-sectional area of the thermoelectric elementand Le is the length of the thermoelectric element, as shown inFigure 2.
The effective thermal conductivity, k∗, is given by the following:
k∗ = α∗2
ρ∗Z∗ . (15)
Thus, after determining the values of effective properties (k∗,ρ∗, α∗) using Equations (12) to (15), they are used to replace theircorresponding values (k, ρ, α) in Equations (7) to (9). Using theeffective material properties in the ideal equations to evaluate theperformance of thermoelectric modules accounts for a majorityof parasitic losses and uncertainties associated with electricaland thermal contact resistances, material degradation and the
Thomson effect, which could be observed when the intrinsicmaterial properties are used [35]. Comparing the performance ofthe TEC module using the effective material properties calculatedby Equations (12) to (15) with both commercially provided dataand experimental results supports the validity of the developedmethod as a highly utilizable analytical tool in predicting theperformance of commercial thermoelectric modules [35].
2.3. Couple and module designGeometric models of the TEC couple and module designs andspecifications for the theoretical and 3D analysis of the presentstudy are shown in Figure 3 and Table 1, respectively. The dimen-sion values listed in Table 1 are representative values and arevaried for the purpose of optimization of the TEC module. Thefill factor, F, is the ratio of the area covered by the active thermo-electric material to the plate area. The value of F is determinedby the dimensions of the p-type and n-type elements and thecopper conductor. The couple leg length and cross-sectional areaare varied to achieve for the optimum value of geometric ratio(Ge). The length of the copper conductor varies according to the
1064 International Journal of Low-Carbon Technologies 2021, 16, 1060–1076
Dow
nloaded from https://academ
ic.oup.com/ijlct/article/16/3/1060/6248809 by guest on 28 June 2022
Design, modeling and parametric optimization
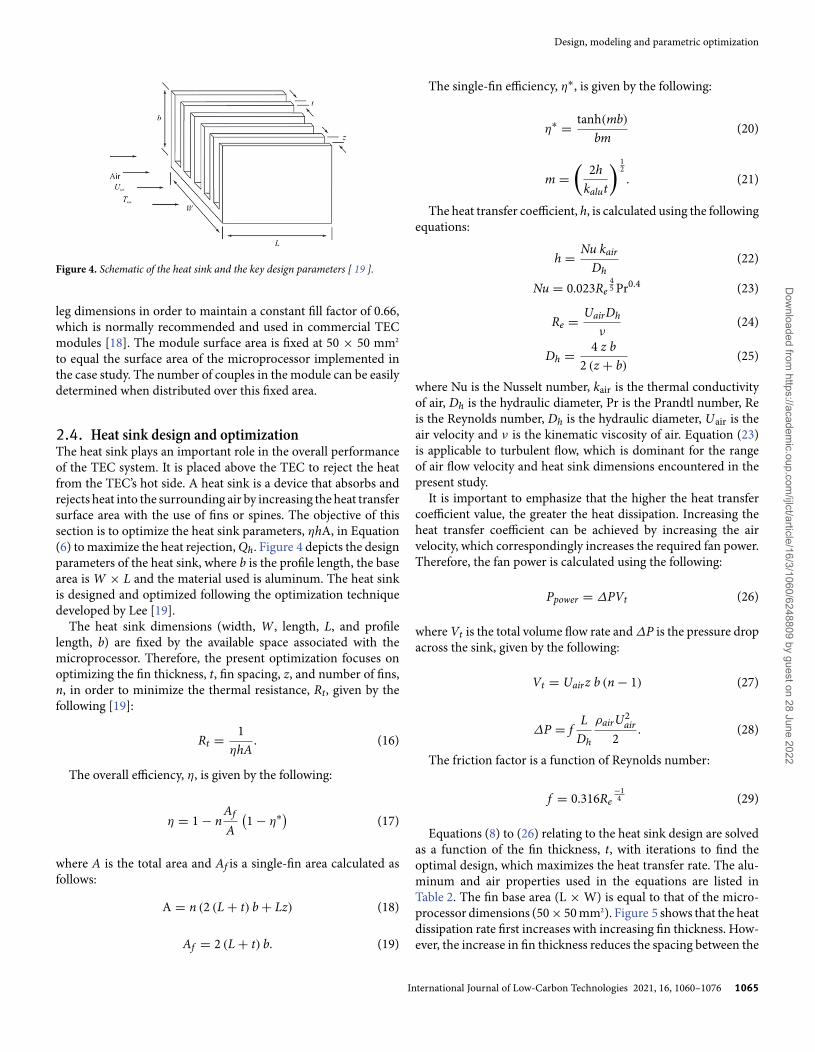
Figure 4. Schematic of the heat sink and the key design parameters [ 19 ].
leg dimensions in order to maintain a constant fill factor of 0.66,which is normally recommended and used in commercial TECmodules [18]. The module surface area is fixed at 50 × 50 mm2
to equal the surface area of the microprocessor implemented inthe case study. The number of couples in the module can be easilydetermined when distributed over this fixed area.
2.4. Heat sink design and optimizationThe heat sink plays an important role in the overall performanceof the TEC system. It is placed above the TEC to reject the heatfrom the TEC’s hot side. A heat sink is a device that absorbs andrejects heat into the surrounding air by increasing the heat transfersurface area with the use of fins or spines. The objective of thissection is to optimize the heat sink parameters, ηhA, in Equation(6) to maximize the heat rejection, Qh. Figure 4 depicts the designparameters of the heat sink, where b is the profile length, the basearea is W × L and the material used is aluminum. The heat sinkis designed and optimized following the optimization techniquedeveloped by Lee [19].
The heat sink dimensions (width, W, length, L, and profilelength, b) are fixed by the available space associated with themicroprocessor. Therefore, the present optimization focuses onoptimizing the fin thickness, t, fin spacing, z, and number of fins,n, in order to minimize the thermal resistance, Rt, given by thefollowing [19]:
Rt = 1ηhA
. (16)
The overall efficiency, η, is given by the following:
η = 1 − nAf
A(1 − η∗) (17)
where A is the total area and Af is a single-fin area calculated asfollows:
A = n (2 (L + t) b + Lz) (18)
Af = 2 (L + t) b. (19)
The single-fin efficiency, η∗, is given by the following:
η∗ = tanh(mb)
bm(20)
m =(
2hkalut
) 12
. (21)
The heat transfer coefficient, h, is calculated using the followingequations:
h = Nu kair
Dh(22)
Nu = 0.023Re45 Pr0.4 (23)
Re = UairDh
ν(24)
Dh = 4 z b2 (z + b)
(25)
where Nu is the Nusselt number, kair is the thermal conductivityof air, Dh is the hydraulic diameter, Pr is the Prandtl number, Reis the Reynolds number, Dh is the hydraulic diameter, Uair is theair velocity and ν is the kinematic viscosity of air. Equation (23)is applicable to turbulent flow, which is dominant for the rangeof air flow velocity and heat sink dimensions encountered in thepresent study.
It is important to emphasize that the higher the heat transfercoefficient value, the greater the heat dissipation. Increasing theheat transfer coefficient can be achieved by increasing the airvelocity, which correspondingly increases the required fan power.Therefore, the fan power is calculated using the following:
Ppower = ΔPVt (26)
where Vt is the total volume flow rate and ΔP is the pressure dropacross the sink, given by the following:
Vt = Uairz b (n − 1) (27)
ΔP = fL
Dh
ρairU2air
2. (28)
The friction factor is a function of Reynolds number:
f = 0.316Re−14 (29)
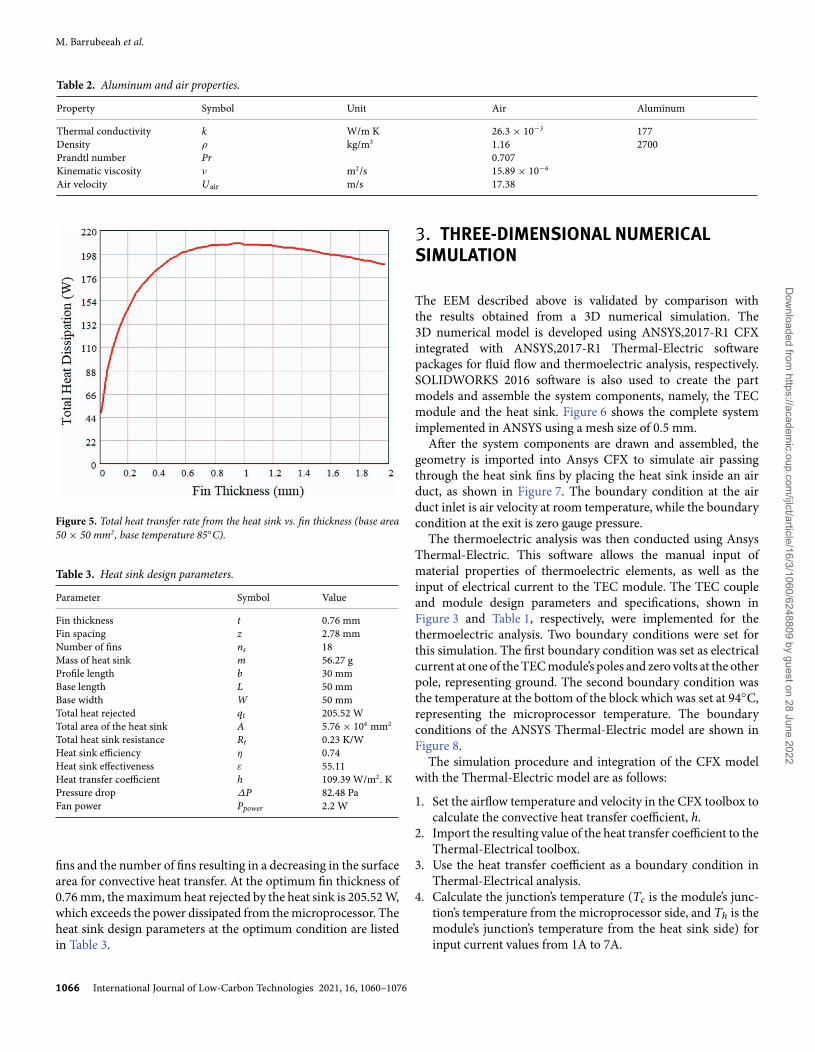
Equations (8) to (26) relating to the heat sink design are solvedas a function of the fin thickness, t, with iterations to find theoptimal design, which maximizes the heat transfer rate. The alu-minum and air properties used in the equations are listed inTable 2. The fin base area (L × W) is equal to that of the micro-processor dimensions (50 × 50 mm2). Figure 5 shows that the heatdissipation rate first increases with increasing fin thickness. How-ever, the increase in fin thickness reduces the spacing between the
International Journal of Low-Carbon Technologies 2021, 16, 1060–1076 1065
Dow
nloaded from https://academ
ic.oup.com/ijlct/article/16/3/1060/6248809 by guest on 28 June 2022
M. Barrubeeah et al.
Table 2. Aluminum and air properties.
Property Symbol Unit Air Aluminum
Thermal conductivity k W/m K 26.3 × 10⁻³ 177Density ρ kg/m3 1.16 2700Prandtl number Pr 0.707Kinematic viscosity ν m2/s 15.89 × 10⁻⁶
Air velocity Uair m/s 17.38
Figure 5. Total heat transfer rate from the heat sink vs. fin thickness (base area50 × 50 mm2, base temperature 85◦C).
Table 3. Heat sink design parameters.
Parameter Symbol Value
Fin thickness t 0.76 mmFin spacing z 2.78 mmNumber of fins ns 18Mass of heat sink m 56.27 gProfile length b 30 mmBase length L 50 mmBase width W 50 mmTotal heat rejected qt 205.52 WTotal area of the heat sink A 5.76 × 104 mm2
Total heat sink resistance Rt 0.23 K/WHeat sink efficiency η 0.74Heat sink effectiveness ε 55.11Heat transfer coefficient h 109.39 W/m2. KPressure drop ΔP 82.48 PaFan power Ppower 2.2 W
fins and the number of fins resulting in a decreasing in the surfacearea for convective heat transfer. At the optimum fin thickness of0.76 mm, the maximum heat rejected by the heat sink is 205.52 W,which exceeds the power dissipated from the microprocessor. Theheat sink design parameters at the optimum condition are listedin Table 3.
3. THREE-DIMENSIONAL NUMERICALSIMULATION
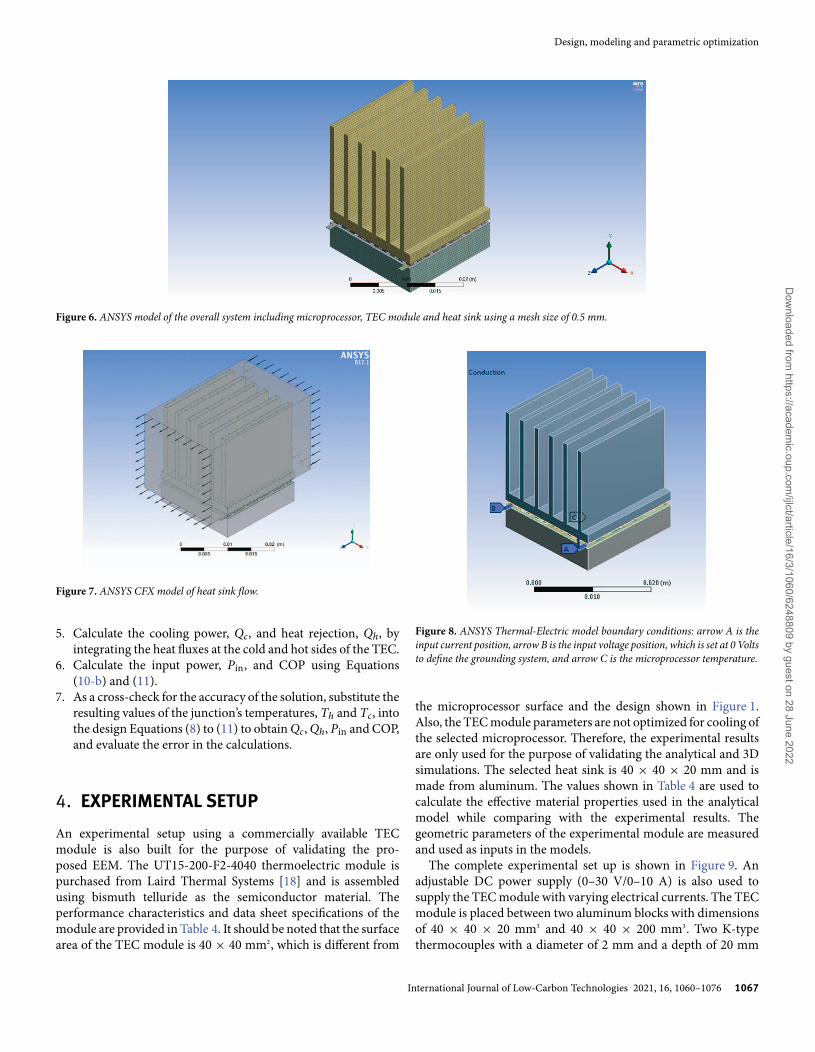
The EEM described above is validated by comparison withthe results obtained from a 3D numerical simulation. The3D numerical model is developed using ANSYS,2017-R1 CFXintegrated with ANSYS,2017-R1 Thermal-Electric softwarepackages for fluid flow and thermoelectric analysis, respectively.SOLIDWORKS 2016 software is also used to create the partmodels and assemble the system components, namely, the TECmodule and the heat sink. Figure 6 shows the complete systemimplemented in ANSYS using a mesh size of 0.5 mm.
After the system components are drawn and assembled, thegeometry is imported into Ansys CFX to simulate air passingthrough the heat sink fins by placing the heat sink inside an airduct, as shown in Figure 7. The boundary condition at the airduct inlet is air velocity at room temperature, while the boundarycondition at the exit is zero gauge pressure.
The thermoelectric analysis was then conducted using AnsysThermal-Electric. This software allows the manual input ofmaterial properties of thermoelectric elements, as well as theinput of electrical current to the TEC module. The TEC coupleand module design parameters and specifications, shown inFigure 3 and Table 1, respectively, were implemented for thethermoelectric analysis. Two boundary conditions were set forthis simulation. The first boundary condition was set as electricalcurrent at one of the TEC module’s poles and zero volts at the otherpole, representing ground. The second boundary condition wasthe temperature at the bottom of the block which was set at 94◦C,representing the microprocessor temperature. The boundaryconditions of the ANSYS Thermal-Electric model are shown inFigure 8.
The simulation procedure and integration of the CFX modelwith the Thermal-Electric model are as follows:
1. Set the airflow temperature and velocity in the CFX toolbox tocalculate the convective heat transfer coefficient, h.
2. Import the resulting value of the heat transfer coefficient to theThermal-Electrical toolbox.
3. Use the heat transfer coefficient as a boundary condition inThermal-Electrical analysis.
4. Calculate the junction’s temperature (Tc is the module’s junc-tion’s temperature from the microprocessor side, and Th is themodule’s junction’s temperature from the heat sink side) forinput current values from 1A to 7A.
1066 International Journal of Low-Carbon Technologies 2021, 16, 1060–1076
Dow
nloaded from https://academ
ic.oup.com/ijlct/article/16/3/1060/6248809 by guest on 28 June 2022
Design, modeling and parametric optimization
Figure 6. ANSYS model of the overall system including microprocessor, TEC module and heat sink using a mesh size of 0.5 mm.
Figure 7. ANSYS CFX model of heat sink flow.
5. Calculate the cooling power, Qc, and heat rejection, Qh, byintegrating the heat fluxes at the cold and hot sides of the TEC.
6. Calculate the input power, Pin, and COP using Equations(10-b) and (11).
7. As a cross-check for the accuracy of the solution, substitute theresulting values of the junction’s temperatures, Th and Tc, intothe design Equations (8) to (11) to obtain Qc, Qh, Pin and COP,and evaluate the error in the calculations.
4. EXPERIMENTAL SETUPAn experimental setup using a commercially available TECmodule is also built for the purpose of validating the pro-posed EEM. The UT15-200-F2-4040 thermoelectric module ispurchased from Laird Thermal Systems [18] and is assembledusing bismuth telluride as the semiconductor material. Theperformance characteristics and data sheet specifications of themodule are provided in Table 4. It should be noted that the surfacearea of the TEC module is 40 × 40 mm2, which is different from
Figure 8. ANSYS Thermal-Electric model boundary conditions: arrow A is theinput current position, arrow B is the input voltage position, which is set at 0 Voltsto define the grounding system, and arrow C is the microprocessor temperature.
the microprocessor surface and the design shown in Figure 1.Also, the TEC module parameters are not optimized for cooling ofthe selected microprocessor. Therefore, the experimental resultsare only used for the purpose of validating the analytical and 3Dsimulations. The selected heat sink is 40 × 40 × 20 mm and ismade from aluminum. The values shown in Table 4 are used tocalculate the effective material properties used in the analyticalmodel while comparing with the experimental results. Thegeometric parameters of the experimental module are measuredand used as inputs in the models.
The complete experimental set up is shown in Figure 9. Anadjustable DC power supply (0–30 V/0–10 A) is also used tosupply the TEC module with varying electrical currents. The TECmodule is placed between two aluminum blocks with dimensionsof 40 × 40 × 20 mm3 and 40 × 40 × 200 mm3. Two K-typethermocouples with a diameter of 2 mm and a depth of 20 mm
International Journal of Low-Carbon Technologies 2021, 16, 1060–1076 1067
Dow
nloaded from https://academ
ic.oup.com/ijlct/article/16/3/1060/6248809 by guest on 28 June 2022
M. Barrubeeah et al.
Table 4. TEC module performance specifications, Laird UT15-200-F2-4040 [ 18 ].
Hot side temperature (◦C) 25 50
Qmax (W) 236.6 254.9�Tmax (◦C) 68 75Imax (A) 15.4 15.4Vmax (V) 25.0 28.6Module resistance (Ohms) 1.37 1.54Thickness 3.3 mmArea 40 × 40 mmNumber of couples 200
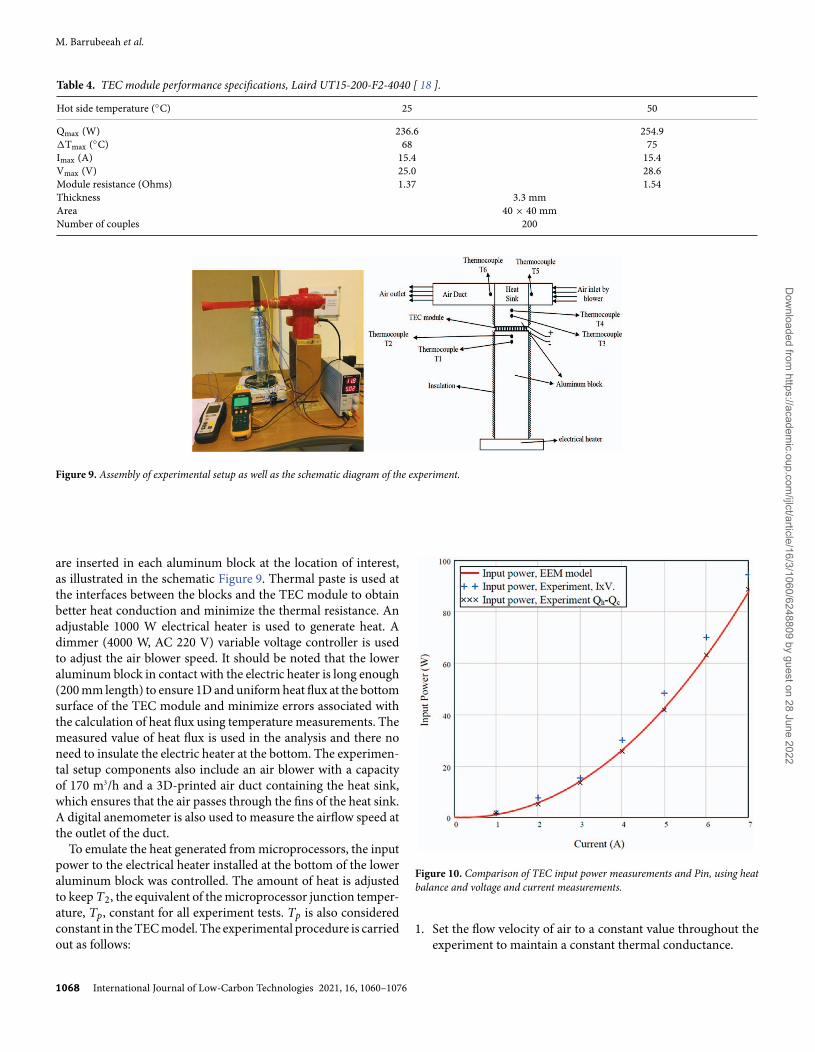
Figure 9. Assembly of experimental setup as well as the schematic diagram of the experiment.
are inserted in each aluminum block at the location of interest,as illustrated in the schematic Figure 9. Thermal paste is used atthe interfaces between the blocks and the TEC module to obtainbetter heat conduction and minimize the thermal resistance. Anadjustable 1000 W electrical heater is used to generate heat. Adimmer (4000 W, AC 220 V) variable voltage controller is usedto adjust the air blower speed. It should be noted that the loweraluminum block in contact with the electric heater is long enough(200 mm length) to ensure 1D and uniform heat flux at the bottomsurface of the TEC module and minimize errors associated withthe calculation of heat flux using temperature measurements. Themeasured value of heat flux is used in the analysis and there noneed to insulate the electric heater at the bottom. The experimen-tal setup components also include an air blower with a capacityof 170 m3/h and a 3D-printed air duct containing the heat sink,which ensures that the air passes through the fins of the heat sink.A digital anemometer is also used to measure the airflow speed atthe outlet of the duct.
To emulate the heat generated from microprocessors, the inputpower to the electrical heater installed at the bottom of the loweraluminum block was controlled. The amount of heat is adjustedto keep T2, the equivalent of the microprocessor junction temper-ature, Tp, constant for all experiment tests. Tp is also consideredconstant in the TEC model. The experimental procedure is carriedout as follows:
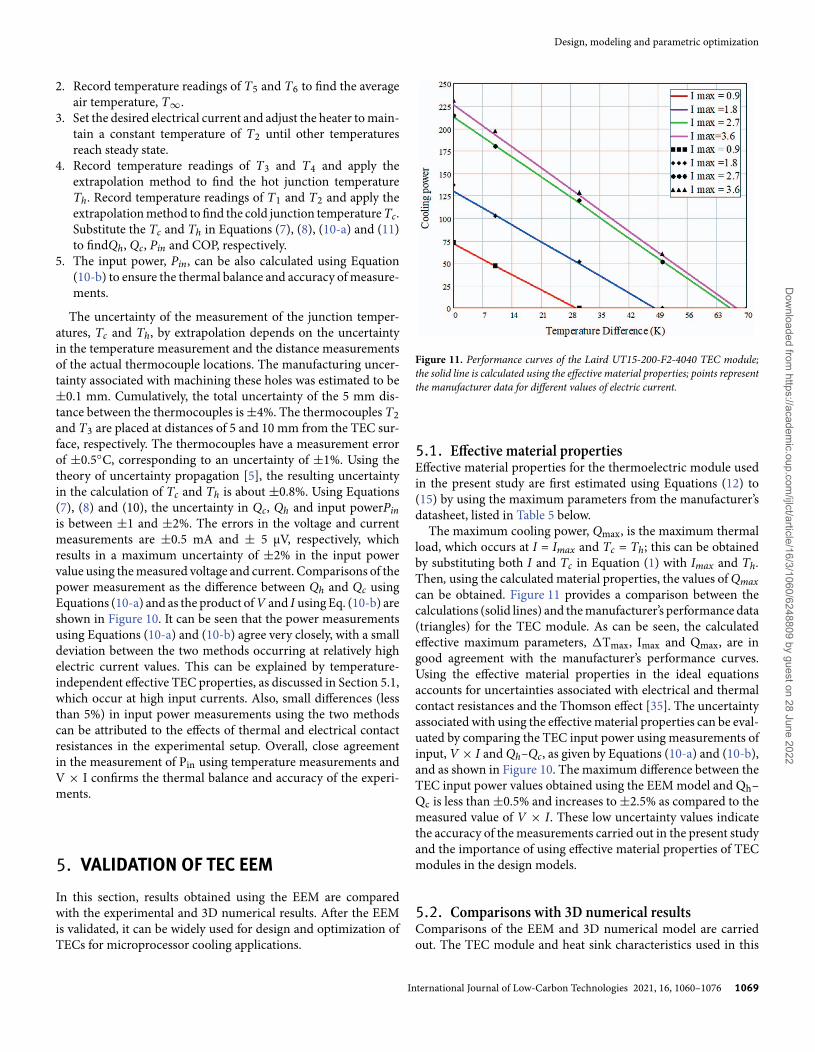
Figure 10. Comparison of TEC input power measurements and Pin, using heatbalance and voltage and current measurements.
1. Set the flow velocity of air to a constant value throughout theexperiment to maintain a constant thermal conductance.
1068 International Journal of Low-Carbon Technologies 2021, 16, 1060–1076
Dow
nloaded from https://academ
ic.oup.com/ijlct/article/16/3/1060/6248809 by guest on 28 June 2022
Design, modeling and parametric optimization
2. Record temperature readings of T5 and T6 to find the averageair temperature, T∞.
3. Set the desired electrical current and adjust the heater to main-tain a constant temperature of T2 until other temperaturesreach steady state.
4. Record temperature readings of T3 and T4 and apply theextrapolation method to find the hot junction temperatureTh. Record temperature readings of T1 and T2 and apply theextrapolation method to find the cold junction temperature Tc.Substitute the Tc and Th in Equations (7), (8), (10-a) and (11)to findQh, Qc, Pin and COP, respectively.
5. The input power, Pin, can be also calculated using Equation(10-b) to ensure the thermal balance and accuracy of measure-ments.
The uncertainty of the measurement of the junction temper-atures, Tc and Th, by extrapolation depends on the uncertaintyin the temperature measurement and the distance measurementsof the actual thermocouple locations. The manufacturing uncer-tainty associated with machining these holes was estimated to be±0.1 mm. Cumulatively, the total uncertainty of the 5 mm dis-tance between the thermocouples is ±4%. The thermocouples T2and T3 are placed at distances of 5 and 10 mm from the TEC sur-face, respectively. The thermocouples have a measurement errorof ±0.5◦C, corresponding to an uncertainty of ±1%. Using thetheory of uncertainty propagation [5], the resulting uncertaintyin the calculation of Tc and Th is about ±0.8%. Using Equations(7), (8) and (10), the uncertainty in Qc, Qh and input powerPinis between ±1 and ±2%. The errors in the voltage and currentmeasurements are ±0.5 mA and ± 5 μV, respectively, whichresults in a maximum uncertainty of ±2% in the input powervalue using the measured voltage and current. Comparisons of thepower measurement as the difference between Qh and Qc usingEquations (10-a) and as the product of V and I using Eq. (10-b) areshown in Figure 10. It can be seen that the power measurementsusing Equations (10-a) and (10-b) agree very closely, with a smalldeviation between the two methods occurring at relatively highelectric current values. This can be explained by temperature-independent effective TEC properties, as discussed in Section 5.1,which occur at high input currents. Also, small differences (lessthan 5%) in input power measurements using the two methodscan be attributed to the effects of thermal and electrical contactresistances in the experimental setup. Overall, close agreementin the measurement of Pin using temperature measurements andV × I confirms the thermal balance and accuracy of the experi-ments.
5. VALIDATION OF TEC EEMIn this section, results obtained using the EEM are comparedwith the experimental and 3D numerical results. After the EEMis validated, it can be widely used for design and optimization ofTECs for microprocessor cooling applications.
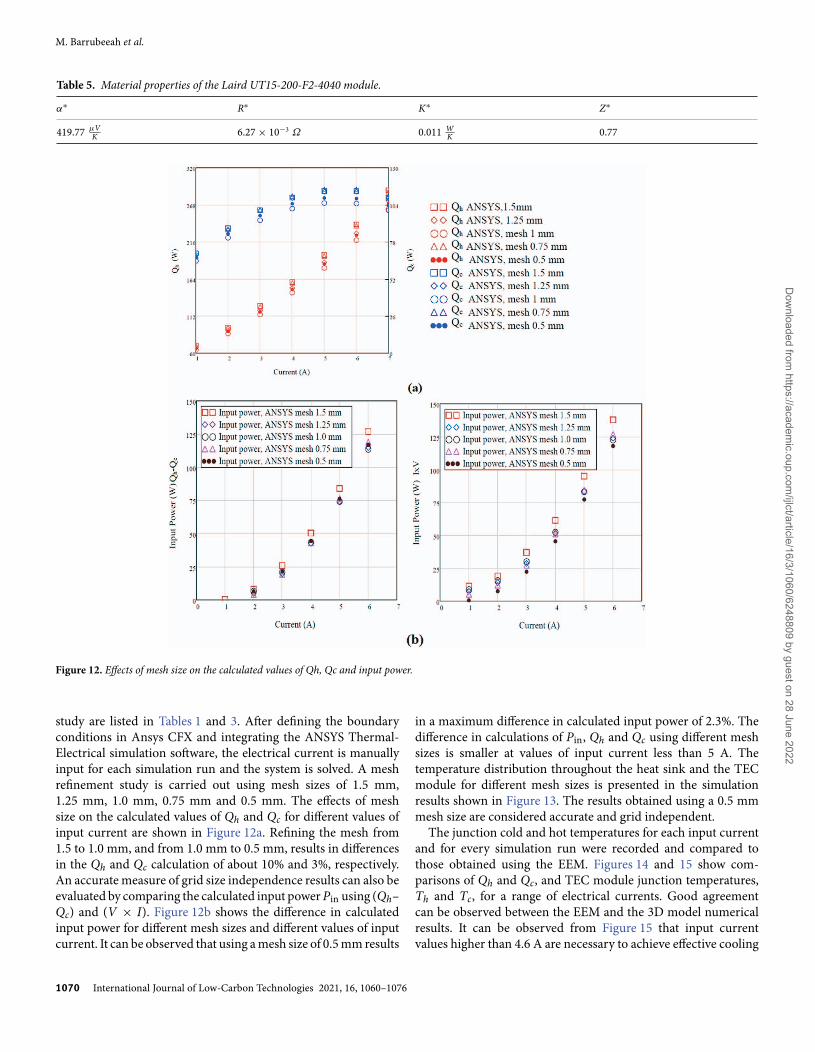
Figure 11. Performance curves of the Laird UT15-200-F2-4040 TEC module;the solid line is calculated using the effective material properties; points representthe manufacturer data for different values of electric current.
5.1. Effective material propertiesEffective material properties for the thermoelectric module usedin the present study are first estimated using Equations (12) to(15) by using the maximum parameters from the manufacturer’sdatasheet, listed in Table 5 below.
The maximum cooling power, Qmax, is the maximum thermalload, which occurs at I = Imax and Tc = Th; this can be obtainedby substituting both I and Tc in Equation (1) with Imax and Th.Then, using the calculated material properties, the values of Qmaxcan be obtained. Figure 11 provides a comparison between thecalculations (solid lines) and the manufacturer’s performance data(triangles) for the TEC module. As can be seen, the calculatedeffective maximum parameters, �Tmax, Imax and Qmax, are ingood agreement with the manufacturer’s performance curves.Using the effective material properties in the ideal equationsaccounts for uncertainties associated with electrical and thermalcontact resistances and the Thomson effect [35]. The uncertaintyassociated with using the effective material properties can be eval-uated by comparing the TEC input power using measurements ofinput, V × I and Qh–Qc, as given by Equations (10-a) and (10-b),and as shown in Figure 10. The maximum difference between theTEC input power values obtained using the EEM model and Qh–Qc is less than ±0.5% and increases to ±2.5% as compared to themeasured value of V × I. These low uncertainty values indicatethe accuracy of the measurements carried out in the present studyand the importance of using effective material properties of TECmodules in the design models.
5.2. Comparisons with 3D numerical resultsComparisons of the EEM and 3D numerical model are carriedout. The TEC module and heat sink characteristics used in this
International Journal of Low-Carbon Technologies 2021, 16, 1060–1076 1069
Dow
nloaded from https://academ
ic.oup.com/ijlct/article/16/3/1060/6248809 by guest on 28 June 2022
M. Barrubeeah et al.
Table 5. Material properties of the Laird UT15-200-F2-4040 module.
α∗ R∗ K∗ Z∗
419.77 μVK 6.27 × 10⁻³ Ω 0.011 W
K 0.77
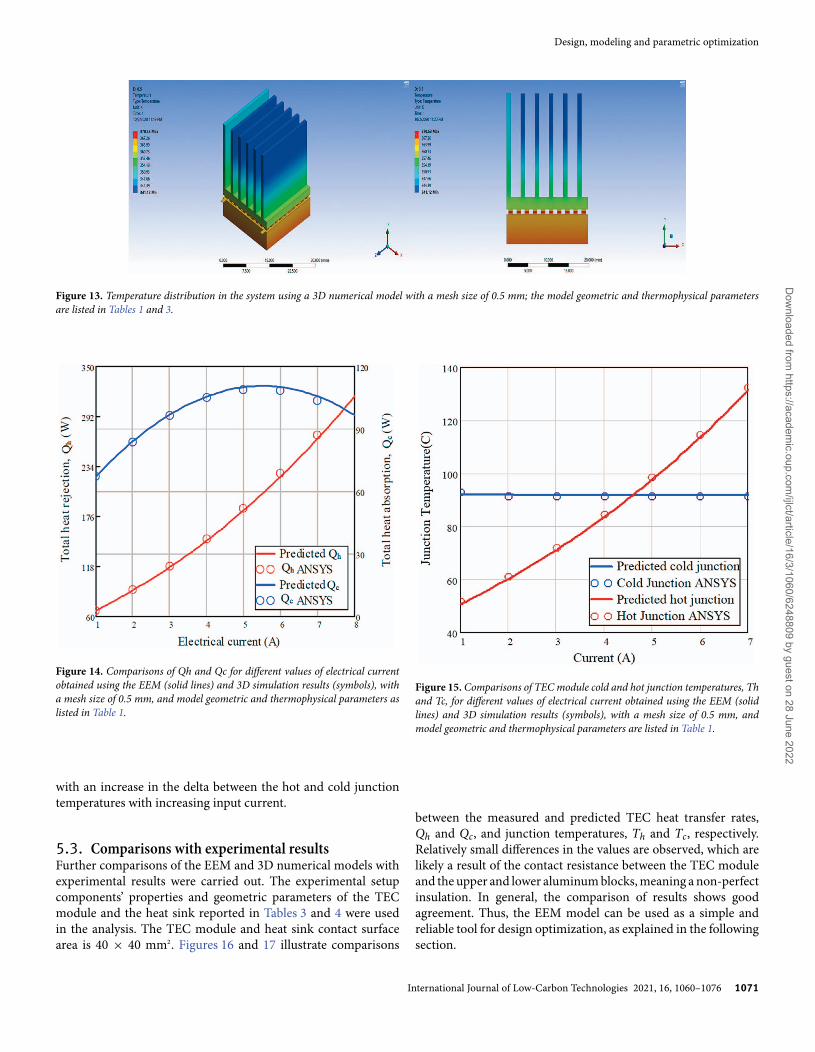
Figure 12. Effects of mesh size on the calculated values of Qh, Qc and input power.
study are listed in Tables 1 and 3. After defining the boundaryconditions in Ansys CFX and integrating the ANSYS Thermal-Electrical simulation software, the electrical current is manuallyinput for each simulation run and the system is solved. A meshrefinement study is carried out using mesh sizes of 1.5 mm,1.25 mm, 1.0 mm, 0.75 mm and 0.5 mm. The effects of meshsize on the calculated values of Qh and Qc for different values ofinput current are shown in Figure 12a. Refining the mesh from1.5 to 1.0 mm, and from 1.0 mm to 0.5 mm, results in differencesin the Qh and Qc calculation of about 10% and 3%, respectively.An accurate measure of grid size independence results can also beevaluated by comparing the calculated input power Pin using (Qh–Qc) and (V × I). Figure 12b shows the difference in calculatedinput power for different mesh sizes and different values of inputcurrent. It can be observed that using a mesh size of 0.5 mm results
in a maximum difference in calculated input power of 2.3%. Thedifference in calculations of Pin, Qh and Qc using different meshsizes is smaller at values of input current less than 5 A. Thetemperature distribution throughout the heat sink and the TECmodule for different mesh sizes is presented in the simulationresults shown in Figure 13. The results obtained using a 0.5 mmmesh size are considered accurate and grid independent.
The junction cold and hot temperatures for each input currentand for every simulation run were recorded and compared tothose obtained using the EEM. Figures 14 and 15 show com-parisons of Qh and Qc, and TEC module junction temperatures,Th and Tc, for a range of electrical currents. Good agreementcan be observed between the EEM and the 3D model numericalresults. It can be observed from Figure 15 that input currentvalues higher than 4.6 A are necessary to achieve effective cooling
1070 International Journal of Low-Carbon Technologies 2021, 16, 1060–1076
Dow
nloaded from https://academ
ic.oup.com/ijlct/article/16/3/1060/6248809 by guest on 28 June 2022
Design, modeling and parametric optimization
Figure 13. Temperature distribution in the system using a 3D numerical model with a mesh size of 0.5 mm; the model geometric and thermophysical parametersare listed in Tables 1 and 3.
Figure 14. Comparisons of Qh and Qc for different values of electrical currentobtained using the EEM (solid lines) and 3D simulation results (symbols), witha mesh size of 0.5 mm, and model geometric and thermophysical parameters aslisted in Table 1.
with an increase in the delta between the hot and cold junctiontemperatures with increasing input current.
5.3. Comparisons with experimental resultsFurther comparisons of the EEM and 3D numerical models withexperimental results were carried out. The experimental setupcomponents’ properties and geometric parameters of the TECmodule and the heat sink reported in Tables 3 and 4 were usedin the analysis. The TEC module and heat sink contact surfacearea is 40 × 40 mm2. Figures 16 and 17 illustrate comparisons
Figure 15. Comparisons of TEC module cold and hot junction temperatures, Thand Tc, for different values of electrical current obtained using the EEM (solidlines) and 3D simulation results (symbols), with a mesh size of 0.5 mm, andmodel geometric and thermophysical parameters are listed in Table 1.
between the measured and predicted TEC heat transfer rates,Qh and Qc, and junction temperatures, Th and Tc, respectively.Relatively small differences in the values are observed, which arelikely a result of the contact resistance between the TEC moduleand the upper and lower aluminum blocks, meaning a non-perfectinsulation. In general, the comparison of results shows goodagreement. Thus, the EEM model can be used as a simple andreliable tool for design optimization, as explained in the followingsection.
International Journal of Low-Carbon Technologies 2021, 16, 1060–1076 1071
Dow
nloaded from https://academ
ic.oup.com/ijlct/article/16/3/1060/6248809 by guest on 28 June 2022
M. Barrubeeah et al.
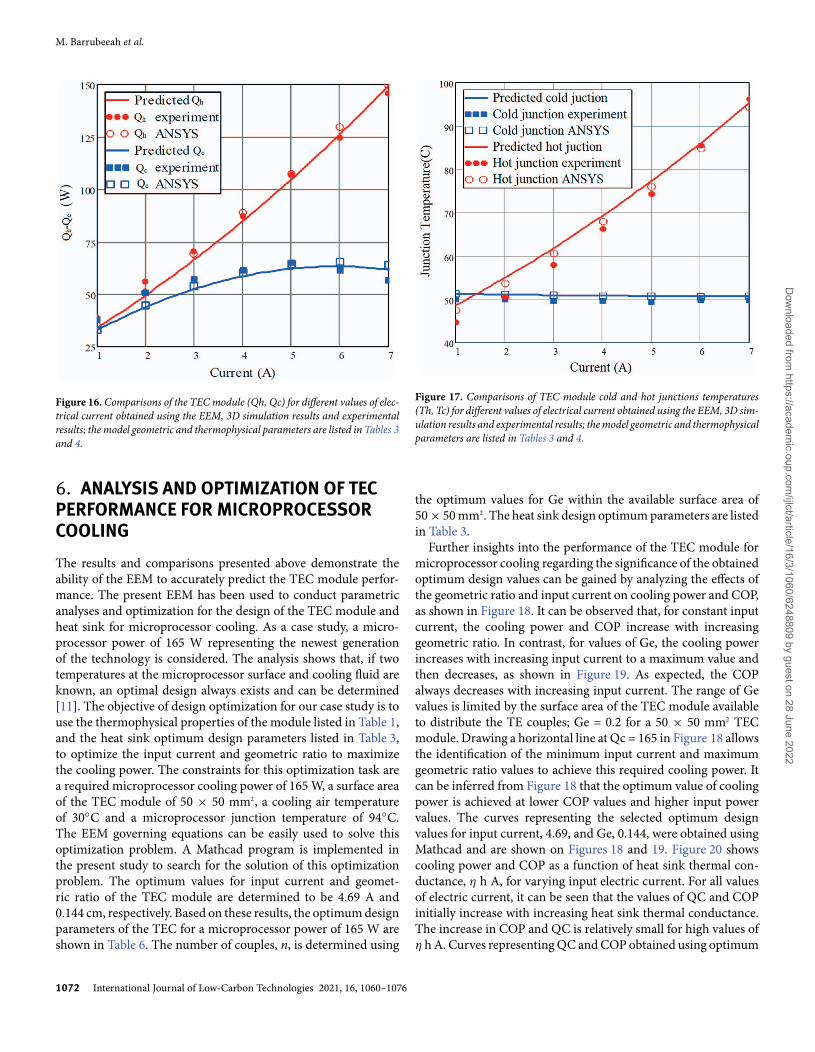
Figure 16. Comparisons of the TEC module (Qh, Qc) for different values of elec-trical current obtained using the EEM, 3D simulation results and experimentalresults; the model geometric and thermophysical parameters are listed in Tables 3and 4.
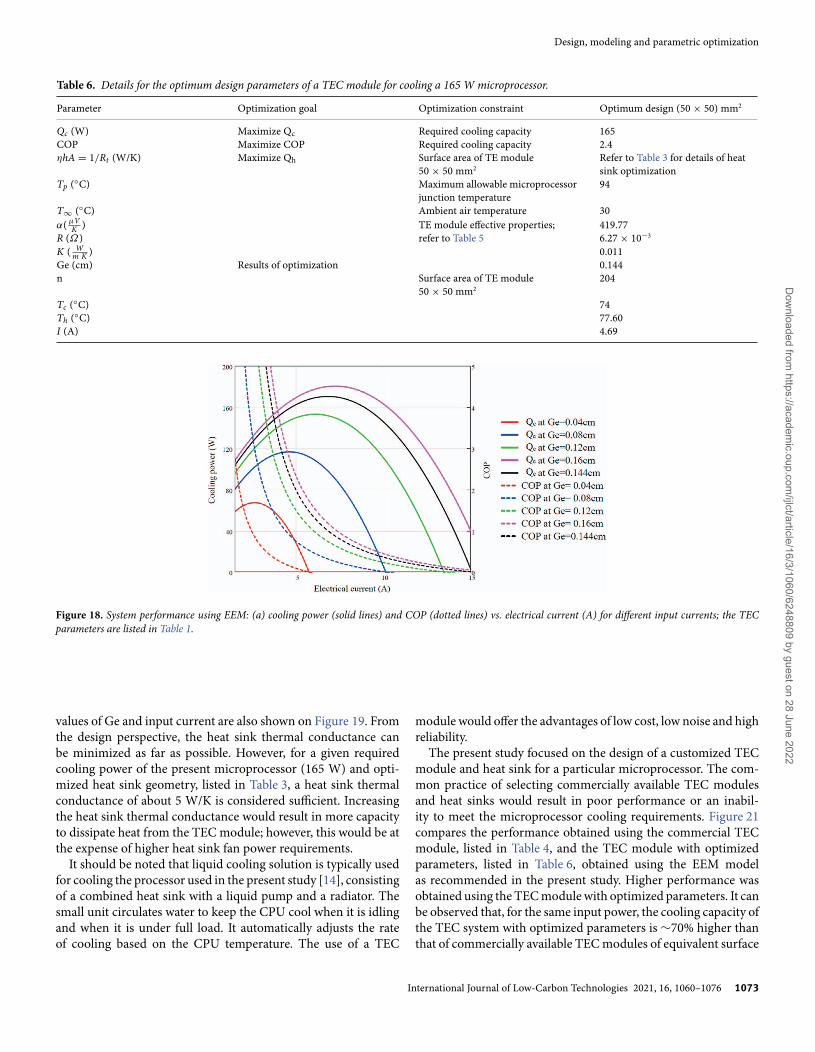
6. ANALYSIS AND OPTIMIZATION OF TECPERFORMANCE FOR MICROPROCESSORCOOLINGThe results and comparisons presented above demonstrate theability of the EEM to accurately predict the TEC module perfor-mance. The present EEM has been used to conduct parametricanalyses and optimization for the design of the TEC module andheat sink for microprocessor cooling. As a case study, a micro-processor power of 165 W representing the newest generationof the technology is considered. The analysis shows that, if twotemperatures at the microprocessor surface and cooling fluid areknown, an optimal design always exists and can be determined[11]. The objective of design optimization for our case study is touse the thermophysical properties of the module listed in Table 1,and the heat sink optimum design parameters listed in Table 3,to optimize the input current and geometric ratio to maximizethe cooling power. The constraints for this optimization task area required microprocessor cooling power of 165 W, a surface areaof the TEC module of 50 × 50 mm2, a cooling air temperatureof 30◦C and a microprocessor junction temperature of 94◦C.The EEM governing equations can be easily used to solve thisoptimization problem. A Mathcad program is implemented inthe present study to search for the solution of this optimizationproblem. The optimum values for input current and geomet-ric ratio of the TEC module are determined to be 4.69 A and0.144 cm, respectively. Based on these results, the optimum designparameters of the TEC for a microprocessor power of 165 W areshown in Table 6. The number of couples, n, is determined using
Figure 17. Comparisons of TEC module cold and hot junctions temperatures(Th, Tc) for different values of electrical current obtained using the EEM, 3D sim-ulation results and experimental results; the model geometric and thermophysicalparameters are listed in Tables 3 and 4.
the optimum values for Ge within the available surface area of50 × 50 mm2. The heat sink design optimum parameters are listedin Table 3.
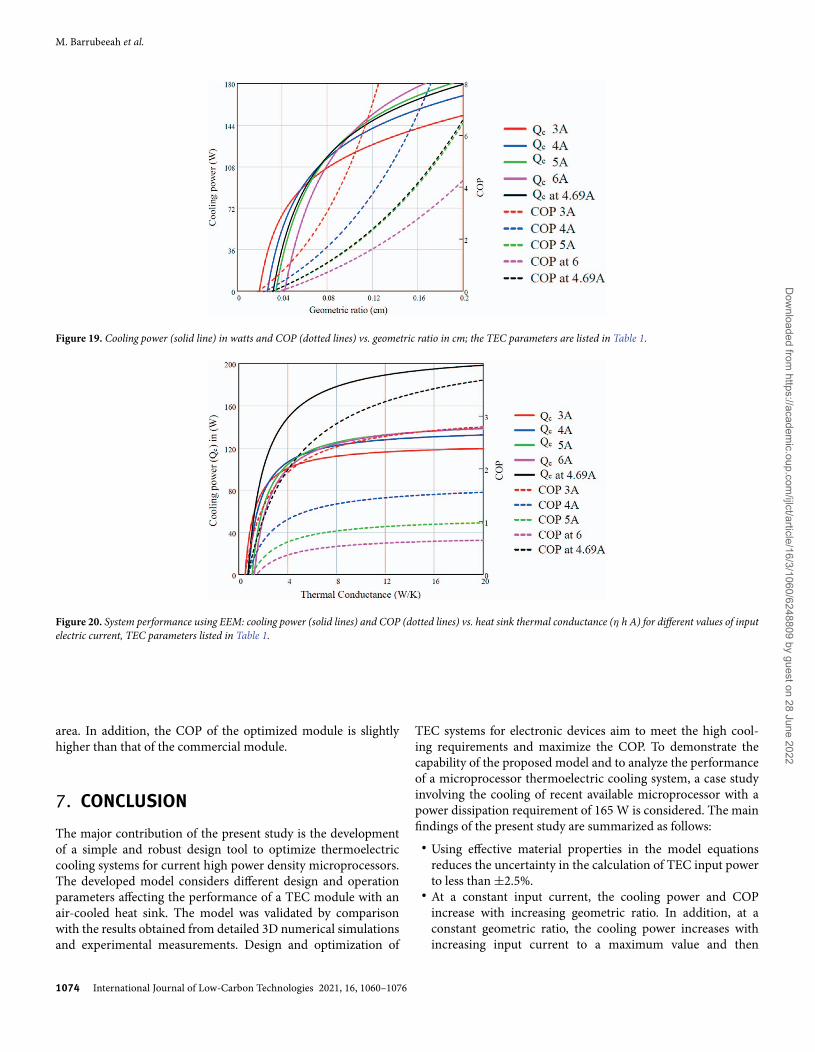
Further insights into the performance of the TEC module formicroprocessor cooling regarding the significance of the obtainedoptimum design values can be gained by analyzing the effects ofthe geometric ratio and input current on cooling power and COP,as shown in Figure 18. It can be observed that, for constant inputcurrent, the cooling power and COP increase with increasinggeometric ratio. In contrast, for values of Ge, the cooling powerincreases with increasing input current to a maximum value andthen decreases, as shown in Figure 19. As expected, the COPalways decreases with increasing input current. The range of Gevalues is limited by the surface area of the TEC module availableto distribute the TE couples; Ge = 0.2 for a 50 × 50 mm2 TECmodule. Drawing a horizontal line at Qc = 165 in Figure 18 allowsthe identification of the minimum input current and maximumgeometric ratio values to achieve this required cooling power. Itcan be inferred from Figure 18 that the optimum value of coolingpower is achieved at lower COP values and higher input powervalues. The curves representing the selected optimum designvalues for input current, 4.69, and Ge, 0.144, were obtained usingMathcad and are shown on Figures 18 and 19. Figure 20 showscooling power and COP as a function of heat sink thermal con-ductance, η h A, for varying input electric current. For all valuesof electric current, it can be seen that the values of QC and COPinitially increase with increasing heat sink thermal conductance.The increase in COP and QC is relatively small for high values ofη h A. Curves representing QC and COP obtained using optimum
1072 International Journal of Low-Carbon Technologies 2021, 16, 1060–1076
Dow
nloaded from https://academ
ic.oup.com/ijlct/article/16/3/1060/6248809 by guest on 28 June 2022
Design, modeling and parametric optimization
Table 6. Details for the optimum design parameters of a TEC module for cooling a 165 W microprocessor.
Parameter Optimization goal Optimization constraint Optimum design (50 × 50) mm2
Qc (W) Maximize Qc Required cooling capacity 165COP Maximize COP Required cooling capacity 2.4ηhA = 1/Rt (W/K) Maximize Qh Surface area of TE module
50 × 50 mm2Refer to Table 3 for details of heatsink optimization
Tp (◦C) Maximum allowable microprocessorjunction temperature
94
T∞ (◦C) Ambient air temperature 30α( μV
K ) TE module effective properties;refer to Table 5
419.77R (Ω) 6.27 × 10⁻³
K ( Wm K ) 0.011
Ge (cm) Results of optimization 0.144n Surface area of TE module
50 × 50 mm2204
Tc (◦C) 74Th (◦C) 77.60I (A) 4.69
Figure 18. System performance using EEM: (a) cooling power (solid lines) and COP (dotted lines) vs. electrical current (A) for different input currents; the TECparameters are listed in Table 1.
values of Ge and input current are also shown on Figure 19. Fromthe design perspective, the heat sink thermal conductance canbe minimized as far as possible. However, for a given requiredcooling power of the present microprocessor (165 W) and opti-mized heat sink geometry, listed in Table 3, a heat sink thermalconductance of about 5 W/K is considered sufficient. Increasingthe heat sink thermal conductance would result in more capacityto dissipate heat from the TEC module; however, this would be atthe expense of higher heat sink fan power requirements.
It should be noted that liquid cooling solution is typically usedfor cooling the processor used in the present study [14], consistingof a combined heat sink with a liquid pump and a radiator. Thesmall unit circulates water to keep the CPU cool when it is idlingand when it is under full load. It automatically adjusts the rateof cooling based on the CPU temperature. The use of a TEC
module would offer the advantages of low cost, low noise and highreliability.
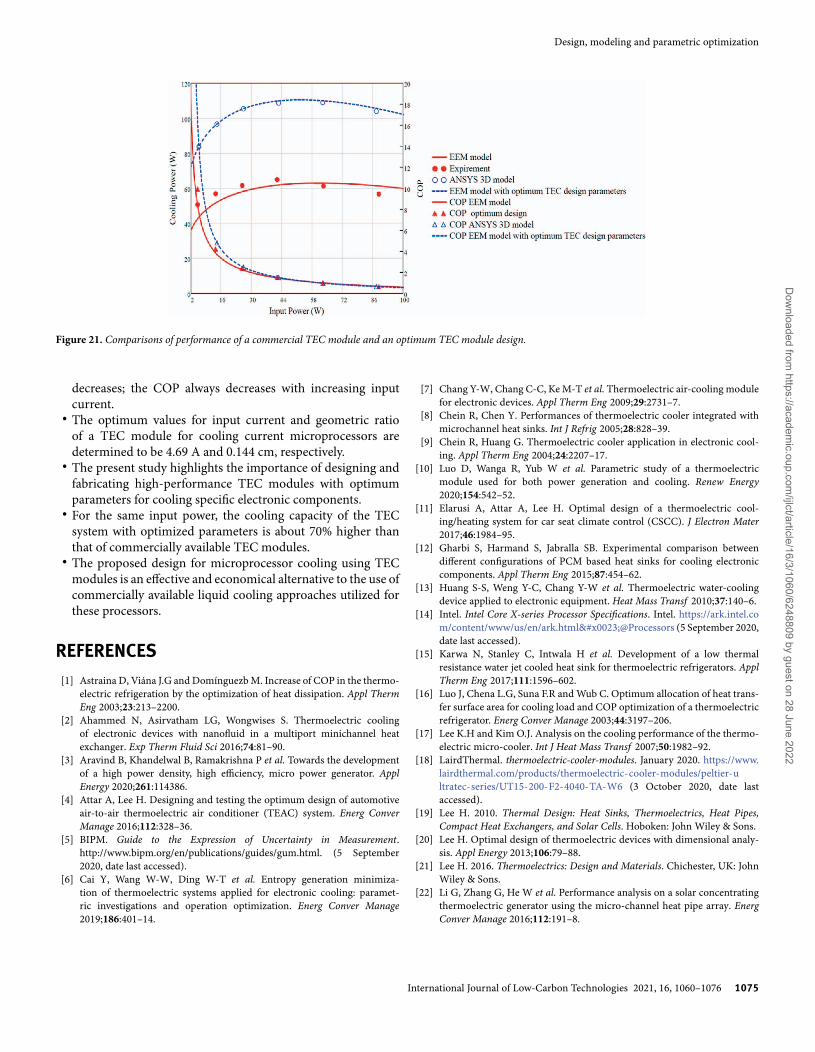
The present study focused on the design of a customized TECmodule and heat sink for a particular microprocessor. The com-mon practice of selecting commercially available TEC modulesand heat sinks would result in poor performance or an inabil-ity to meet the microprocessor cooling requirements. Figure 21compares the performance obtained using the commercial TECmodule, listed in Table 4, and the TEC module with optimizedparameters, listed in Table 6, obtained using the EEM modelas recommended in the present study. Higher performance wasobtained using the TEC module with optimized parameters. It canbe observed that, for the same input power, the cooling capacity ofthe TEC system with optimized parameters is ∼70% higher thanthat of commercially available TEC modules of equivalent surface
International Journal of Low-Carbon Technologies 2021, 16, 1060–1076 1073
Dow
nloaded from https://academ
ic.oup.com/ijlct/article/16/3/1060/6248809 by guest on 28 June 2022
M. Barrubeeah et al.
Figure 19. Cooling power (solid line) in watts and COP (dotted lines) vs. geometric ratio in cm; the TEC parameters are listed in Table 1.
Figure 20. System performance using EEM: cooling power (solid lines) and COP (dotted lines) vs. heat sink thermal conductance (η h A) for different values of inputelectric current, TEC parameters listed in Table 1.
area. In addition, the COP of the optimized module is slightlyhigher than that of the commercial module.
7. CONCLUSIONThe major contribution of the present study is the developmentof a simple and robust design tool to optimize thermoelectriccooling systems for current high power density microprocessors.The developed model considers different design and operationparameters affecting the performance of a TEC module with anair-cooled heat sink. The model was validated by comparisonwith the results obtained from detailed 3D numerical simulationsand experimental measurements. Design and optimization of
TEC systems for electronic devices aim to meet the high cool-ing requirements and maximize the COP. To demonstrate thecapability of the proposed model and to analyze the performanceof a microprocessor thermoelectric cooling system, a case studyinvolving the cooling of recent available microprocessor with apower dissipation requirement of 165 W is considered. The mainfindings of the present study are summarized as follows:
• Using effective material properties in the model equationsreduces the uncertainty in the calculation of TEC input powerto less than ±2.5%.
• At a constant input current, the cooling power and COPincrease with increasing geometric ratio. In addition, at aconstant geometric ratio, the cooling power increases withincreasing input current to a maximum value and then
1074 International Journal of Low-Carbon Technologies 2021, 16, 1060–1076
Dow
nloaded from https://academ
ic.oup.com/ijlct/article/16/3/1060/6248809 by guest on 28 June 2022
Design, modeling and parametric optimization
Figure 21. Comparisons of performance of a commercial TEC module and an optimum TEC module design.
decreases; the COP always decreases with increasing inputcurrent.
• The optimum values for input current and geometric ratioof a TEC module for cooling current microprocessors aredetermined to be 4.69 A and 0.144 cm, respectively.
• The present study highlights the importance of designing andfabricating high-performance TEC modules with optimumparameters for cooling specific electronic components.
• For the same input power, the cooling capacity of the TECsystem with optimized parameters is about 70% higher thanthat of commercially available TEC modules.
• The proposed design for microprocessor cooling using TECmodules is an effective and economical alternative to the use ofcommercially available liquid cooling approaches utilized forthese processors.
REFERENCES[1] Astraina D, Viána J.G and Domínguezb M. Increase of COP in the thermo-
electric refrigeration by the optimization of heat dissipation. Appl ThermEng 2003;23:213–2200.
[2] Ahammed N, Asirvatham LG, Wongwises S. Thermoelectric coolingof electronic devices with nanofluid in a multiport minichannel heatexchanger. Exp Therm Fluid Sci 2016;74:81–90.
[3] Aravind B, Khandelwal B, Ramakrishna P et al. Towards the developmentof a high power density, high efficiency, micro power generator. ApplEnergy 2020;261:114386.
[4] Attar A, Lee H. Designing and testing the optimum design of automotiveair-to-air thermoelectric air conditioner (TEAC) system. Energ ConverManage 2016;112:328–36.
[5] BIPM. Guide to the Expression of Uncertainty in Measurement.http://www.bipm.org/en/publications/guides/gum.html. (5 September2020, date last accessed).
[6] Cai Y, Wang W-W, Ding W-T et al. Entropy generation minimiza-tion of thermoelectric systems applied for electronic cooling: paramet-ric investigations and operation optimization. Energ Conver Manage2019;186:401–14.
[7] Chang Y-W, Chang C-C, Ke M-T et al. Thermoelectric air-cooling modulefor electronic devices. Appl Therm Eng 2009;29:2731–7.
[8] Chein R, Chen Y. Performances of thermoelectric cooler integrated withmicrochannel heat sinks. Int J Refrig 2005;28:828–39.
[9] Chein R, Huang G. Thermoelectric cooler application in electronic cool-ing. Appl Therm Eng 2004;24:2207–17.
[10] Luo D, Wanga R, Yub W et al. Parametric study of a thermoelectricmodule used for both power generation and cooling. Renew Energy2020;154:542–52.
[11] Elarusi A, Attar A, Lee H. Optimal design of a thermoelectric cool-ing/heating system for car seat climate control (CSCC). J Electron Mater2017;46:1984–95.
[12] Gharbi S, Harmand S, Jabralla SB. Experimental comparison betweendifferent configurations of PCM based heat sinks for cooling electroniccomponents. Appl Therm Eng 2015;87:454–62.
[13] Huang S-S, Weng Y-C, Chang Y-W et al. Thermoelectric water-coolingdevice applied to electronic equipment. Heat Mass Transf 2010;37:140–6.
[14] Intel. Intel Core X-series Processor Specifications. Intel. https://ark.intel.com/content/www/us/en/ark.html#@Processors (5 September 2020,date last accessed).
[15] Karwa N, Stanley C, Intwala H et al. Development of a low thermalresistance water jet cooled heat sink for thermoelectric refrigerators. ApplTherm Eng 2017;111:1596–602.
[16] Luo J, Chena L.G, Suna F.R and Wub C. Optimum allocation of heat trans-fer surface area for cooling load and COP optimization of a thermoelectricrefrigerator. Energ Conver Manage 2003;44:3197–206.
[17] Lee K.H and Kim O.J. Analysis on the cooling performance of the thermo-electric micro-cooler. Int J Heat Mass Transf 2007;50:1982–92.
[18] LairdThermal. thermoelectric-cooler-modules. January 2020. https://www.lairdthermal.com/products/thermoelectric-cooler-modules/peltier-ultratec-series/UT15-200-F2-4040-TA-W6 (3 October 2020, date lastaccessed).
[19] Lee H. 2010. Thermal Design: Heat Sinks, Thermoelectrics, Heat Pipes,Compact Heat Exchangers, and Solar Cells. Hoboken: John Wiley & Sons.
[20] Lee H. Optimal design of thermoelectric devices with dimensional analy-sis. Appl Energy 2013;106:79–88.
[21] Lee H. 2016. Thermoelectrics: Design and Materials. Chichester, UK: JohnWiley & Sons.
[22] Li G, Zhang G, He W et al. Performance analysis on a solar concentratingthermoelectric generator using the micro-channel heat pipe array. EnergConver Manage 2016;112:191–8.
International Journal of Low-Carbon Technologies 2021, 16, 1060–1076 1075
Dow
nloaded from https://academ
ic.oup.com/ijlct/article/16/3/1060/6248809 by guest on 28 June 2022
M. Barrubeeah et al.
[23] Li Q, Zuo W, Zhang Y et al. Effects of rectangular rib on exergy effi-ciency of a hydrogen-fueled micro combustor. Int J Hydrogen Energy2020;45:10155–63.
[24] Zhu L, Tan H, Yu J. Analysis on optimal heat exchanger size of thermo-electric cooler for electronic cooling applications. Energ Conver Manage2013;76:685–90.
[25] Liu D, Zhao F-Y, Yang H-X et al. Thermoelectric mini cooler coupled withmicro thermosiphon for CPU cooling system. Energy 2015;83:29–36.
[26] Nnanna AA, Rutherford W, Elomar W et al. Assessment of thermoelec-tric module with nanofluid heat exchanger. Appl Therm Eng 2009;29:491–500.
[27] Phelan PE, Chiriac VA, Lee T-YT. Current and future miniature refrig-eration cooling technologies for high power microelectronics. IEEE TransCompon Packag Technol 2002;25:25.
[28] Putra N, Iskandar FN. Application of nanofluids to a heat pipe liquid-blockand the thermoelectric cooling of electronic equipment. Exp Therm FluidSci 2011;35:1274–81.
[29] Riffat S, Ma X. Thermoelectrics: a review of present and potential applica-tions. Appl Therm Eng 2000;23:913–35.
[30] Roberts NS, Al-Shannaq R, Kurdi J et al. Efficacy of using slurry ofmetal-coated microencapsulated PCM for cooling in a microchannel heatexchanger. Appl Therm Eng 2017;122:11–8.
[31] Saber HH, AlShehri SA, Maref W. Performance optimization of cascadedand non-cascaded thermoelectric devices for cooling computer chips.Energ Conver Manage 2019;191:174–92.
[32] Seo JS, Phelan P, Jean Wu C. Thermoelectric-based sustainable self-coolingfor fine-grained processor hot spots. In: 15th InterSociety Conferenceon Thermal and Thermomechanical Phenomena in Electronic Systems,ITherm, Las Vegas, United States, IEEE, 2016.
[33] Sun X, Zhang L, Liao S. Performance of a thermoelectric cooling systemintegrated with a gravity-assisted heat pipe for cooling electronics. ApplTherm Eng 2017;116:433–44.
[34] Wang X, Yu J, Ma M. Optimization of heat sink configuration for ther-moelectric cooling system based on entropy generation analysis. Int J HeatMass Transf 2013;63:361–5.
[35] Weera S, Attar A, Lee H. Utilizing effective material properties to validatethe performance of thermoelectric cooler and generator modules. EnergyConvers Manag 2020;205:112427:1–11.
[36] Xudong Z, Xiaoli M, Samson S et al. Review of thermoelectric geometryand structure optimization for performance enhancement. Appl Energy2020;268:1–31.
[37] Yang C, Yu W, Di L et al. Thermoelectric cooling technology applied in thefield of electronic devices: updated review on the parametric investigationsand model developments. Appl Therm Eng 2019;148:238–55.
[38] Zhao D.L and Tan G. Experimental evaluation of a prototype thermoelec-tric system integrated with PCM (phase change material) for space cooling.Energy 2014;68:658–66.
[39] Zuo W, Li Q, He Z et al. Numerical investigations on thermal performanceenhancement of hydrogen-fueled micro planar combustors with injectorsfor micro-thermophotovoltaic applications. Energy 2020;116904:194.
1076 International Journal of Low-Carbon Technologies 2021, 16, 1060–1076
Dow
nloaded from https://academ
ic.oup.com/ijlct/article/16/3/1060/6248809 by guest on 28 June 2022