descending control of locomotion in the lamprey - universität
TRANSCRIPT
Descending control of locomotion in the
lamprey
Inaugural-Dissertation
zur
Erlangung des Doktorgrades
der Mathematisch-Naturwissenschaftlichen Fakultät
der Universität zu Köln
vorgelegt von
Swantje Grätsch
aus Schleswig
Köln, Mai 2018
1

Berichterstatter/in:
Prof. Dr. Ansgar Büschges
Prof. Dr. Silvia Daun
Prof. Dr. Réjean Dubuc
Tag der mündlichen Prüfung :
16. Juli 2018
2
Contents
1. Zusammenfassung ........................................................................................................................................5
2. Summary.......................................................................................................................................................7
3. List of Abbreviations ....................................................................................................................................9
4. Introduction ................................................................................................................................................10
4.1. Locomotor control in vertebrates .......................................................................................................11
4.2. The control of locomotion in lampreys ..............................................................................................13
4.3. Aims and objectives ...........................................................................................................................17
5. Published studies ........................................................................................................................................20
5.1. Forebrain dopamine neurons project down to a brainstem region controlling locomotion ................20
5.2. Nigral glutamatergic neurons control the speed of locomotion ..........................................................29
5.3. A specific population of reticulospinal neurons controls the termination of locomotion...................42
6. Study under review .....................................................................................................................................54
6.1. A brainstem neural substrate for stopping locomotion .......................................................................54
7. Discussion...................................................................................................................................................85
7.1. Inputs to the MLR: Modulation of locomotion and control of locomotor speed................................85
7.2. Outputs of the MLR: Termination of locomotion ..............................................................................87
7.3. Significance for clinical research .......................................................................................................90
7.4. Concluding remarks and future perspectives ......................................................................................91
8. Bibliography ...............................................................................................................................................94
Acknowledgements ..........................................................................................................................................106
Teilpublikationen ..............................................................................................................................................108
Lebenslauf ........................................................................................................................................................111
Erklärung ..........................................................................................................................................................113
3

4
1. Zusammenfassung Lokomotion entsteht aus einem dynamischen Zusammenspiel dreierlei Komponenten: Den rhythmischen
Bewegungsmustern, die von neuronalen Netzwerken im Rückenmark generiert werden, den absteigenden
Einflüssen von supraspinalen Hirnstrukturen und den sensorischen Eingängen aus der Peripherie. Durch
dieses Zusammenspiel können periodische Bewegungssequenzen generiert werden, die gestartet,
aufrechterhalten und gestoppt werden müssen. Um die Bewegungskontrolle auf zellulärer Ebene untersuchen
zu können, wurde in den letzten Jahrzehnten das Neunauge als Modellorganismus etabliert. In diesem basalen
Wirbeltier wurden neuronale Netzwerke im Rückenmark identifiziert, zentrale Mustergeneratoren (ZMGs),
die rhythmische Aktivität generieren und Muskelaktivität während der Fortbewegung steuern. Diese ZMGs
werden von retikulospinalen (RS) Neuronen im Hirnstamm kontrolliert, welche wiederum von
lokomotorischen Regionen, wie der mesenzephalen lokomotorischen Region (MLR), aktiviert werden. Die
MLR kontrolliert die Initiierung und Aufrechterhaltung von Bewegung und spielt eine entscheidende Rolle
bei der zielgerichteten Fortbewegung. Die Aktivität der MLR unterliegt dabei der Kontrolle von
Hirnstrukturen im Vorderhirn, wie den Basalganglien. Diese Dissertation beschäftigt sich mit den
absteigenden Eingängen, die die MLR aus dem Vorderhirn erreichen, sowie mit den absteigenden
Projektionen der MLR zu unterschiedlichen RS Zellpopulationen im Hirnstamm. Hierfür wurden
elektrophysiologische, neuroanatomische, bildgebende und Verhaltensversuche im Neunauge durchgeführt.
Klassischerweise werden Projektionen von dopaminergen Neuronen der substantia nigra pars compacta
(SNc) so beschrieben, dass sie aufsteigend zum Striatum, der Eingangsstation der Basalganglien, führen. In
der ersten Studie (Ryczko et al., 2013) konnten dopaminerge Neurone des posterior tumberculum (PT,
homolog zur SNc in Säugetieren) identifiziert werden, die absteigend auf die MLR projizieren. Versuche in
semi-intakten Präparationen ermöglichen eine Korrelation der RS Zellaktivität mit aktiven
Schwimmbewegungen. Hierbei wurde beobachtet, dass eine elektrische Stimulation des PT zu Aktivität in RS
Zellen und zu aktiven Schwimmbewegungen führt. Im selben experimentellen Aufbau wurde außerdem eine
signifikante Erhöhung der Aktivität in RS Zellen und im Schwimmverhalten beobachtet, wenn
Dopaminrezeptoren der MLR lokal aktiviert wurden. Auf der anderen Seite führte ein pharmakologisches
Blockieren von D1 Rezeptoren in der MLR zu einer Reduzierung der RS Zellaktitivät und des
Schwimmverhaltens. Somit konnte in diesem Teil der Arbeit gezeigt werden, dass absteigende dopaminerge
Nervenbahnen des PT die MLR direkt innervieren und die Aktivität der MLR sowie des Schwimmverhaltens
erhöhen.
Aufgrund von Vorstudien wurde bereits angenommen, dass neben den absteigenden dopaminergen
Projektionen auch glutamaterge Neurone des PT die MLR direkt innervieren. Diese glutamatergen
Projektionen wurde in der zweiten Studie untersucht (Ryczko et al., 2017). Eine wichtige Beobachtung dieser
Studie war, dass die Aktivität der MLR und der Bewegungsgeschwindigkeit durch eine elektrische PT
Stimulation graduell kontrolliert werden kann: je höher die Intensität der PT Stimulation, desto schneller
wurden Bewegungsabläufe ausgeführt. Die Blockierung von Glutamatrezeptoren in der MLR hatte eine
5
erhebliche Beeinträchtigung der Initiierung von Bewegungsabläufen zur Folge. Die Blockierung von D1
Dopaminrezeptoren in der MLR setzte die Schwimmgeschwindigkeit zwar signifikant herunter, eine graduelle
Kontrolle der Schwimmgeschwindigkeit durch elektrische PT Stimulation war aber nach wie vor möglich.
Daraus ergibt sich, dass absteigende glutamaterge PT Neurone für die graduelle Kontrolle der
Schwimmgeschwindigkeit verantwortlich sind.
In der dritten Studie (Juvin*, Grätsch* et al., 2016) konnte gezeigt werden, dass RS Zellen nicht uniform auf
eine elektrische MLR Stimulation antworten, sondern drei unterschiedliche Aktivitätsmuster aufweisen. Eine
Population von RS Zellen wird kurz am Beginn einer MLR Stimulation aktiviert, während eine zweite
Zellpopulation Aktionspotentiale während der gesamten MLR Stimulation generiert. Interessanterweise wurde
eine dritte Gruppe von RS Zellen identifiziert, die eine Salve von Aktionspotenzialen am Anfang und eine
weitere Salve nach dem Ende einer MLR Stimulation produziert. In semi-intakten Präparationen wurde
gezeigt, dass diese letzte Salve von Aktionspotentialen stark mit dem Ende der Schwimmepisode korreliert.
Des Weitern wurde nachgewiesen, dass eine pharmakologische Aktivierung dieser RS Zellen
Schwimmbewegungen beendet, während eine Inaktivierung dieser RS Zellen den Beendigungsprozess der
Schwimmepisode stark beeinträchtigt. Da diese RS Zellen funktionell eng mit dem Ende von
Bewegungsabläufen verknüpft ist, wurden sie Stopp Zellen genannt.
Es war bisher unklar, wie Stopp Zellen währen einer Bewegung aktiviert werden und sie wiesen keine
Membraneigenschaften auf, die ihr charakteristisches Aktivitätsmuster erklären. Daher wurden sie in der
vierten Studie (Grätsch et al., in Begutachtung) auf synaptische Eingänge untersucht, die die zweite Salve von
Aktionspotenzialen auslösen könnten. In dieser Studie konnte gezeigt werden, dass durch eine Stimulation der
MLR während einer Bewegungsepisode, Stopp Zellen rekrutiert werden und somit das Ende des
Bewegungsablaufs kontrolliert wird. Elektrophysiologische und anatomische Versuche weisen außerdem
darauf hin, dass eine monosynaptische Verbindung zwischen der MLR und Stopp Zellen besteht.
Teile dieser Arbeit wurden bereits in Fachzeitschriften publiziert (Ryczko et al., 2013; Ryczko et al., 2017;
Juvin*, Grätsch* et al., 2016) oder sind im Begutachtungsverfahren (Grätsch et al.).
1 2
* Ko-Erstautoren
6
2. Summary Locomotion underlies a dynamic interplay of a basic motor pattern that is generated by spinal neural
networks, descending control originating from supraspinal structures, and sensory feedback from the
periphery. Locomotion usually occurs intermittently and thus, it must be initiated, maintained, and eventually
stopped. Over the past decades, the lamprey has been used as an experimental model to define the cellular
mechanisms controlling locomotion in vertebrates. In this model, spinal central pattern generators (CPGs)
have been characterized and shown to generate rhythmic muscle contractions needed for body propulsion. The
spinal CPGs are controlled by brainstem reticulospinal (RS) neurons, which are activated by upstream brain
structures, such as the mesencephalic locomotor region (MLR). The MLR initiates and controls locomotion in
a graded fashion and plays a role in goal-directed locomotion. Its activity is in turn controlled by forebrain
structures, such as the basal ganglia. The focus of my thesis was to examine descending projections from
forebrain structures to the MLR as well as MLR projections to different RS cell populations in the lamprey
lower brainstem. For this, electrophysiological, neuroanatomical, Ca2+ - imaging, and behavioral experiments
were performed.
In vertebrates, forebrain dopaminergic neurons of the substantia nigra pars compacta (SNc) are classically
described to send ascending projections to the striatum, the input structure of the basal ganglia. In a first study
(Ryczko et al., 2013), we identified in the lamprey a previously unknown descending dopaminergic pathway
from the posterior tuberculum (PT; the homologue structure to the mammalian SNc) that directly innervates
the MLR. Experiments were performed in semi-intact preparations, in which cellular activity can be correlated
to active swimming movements of the intact body. It was demonstrated that electrical PT stimulation elicits
RS cell activity as well as motor behavior. Both RS cell activity and locomotor output were significantly
increased when dopamine was injected locally into the MLR. On the other hand, local injections of a D1
receptor antagonist in the MLR dramatically decreased RS cell activity and locomotor activity. It was
concluded that this descending dopaminergic pathway provides extra excitation to the MLR and consequently
increases the locomotor output.
It was thought that this newly identified dopaminergic pathway acts in parallel with a descending
glutamatergic pathway from the PT to the MLR. In a second study (Ryczko et al., 2017), the glutamatergic
projection was examined in detail. One important finding was that the PT controls MLR activity and
consequently the locomotor speed in a graded fashion: increasing stimulation intensity of the PT leads to
increasing MLR cell activity and locomotor speed. Local blockade of glutamate receptors in the MLR
dramatically diminishes locomotor activity elicited by PT stimulation. Local injections of a D1 receptor
antagonist in the MLR also decreases locomotor frequency but surprisingly, the graded control of locomotor
speed was still present. It was concluded that the PT controls the locomotor speed in a graded fashion through
direct descending glutamatergic projections to the MLR.
In a third study (Juvin*, Grätsch* et al., 2016), it was demonstrated that RS cells do not respond to MLR
stimulation uniformly, but with three distinct activity patterns. One RS cell population responds with a
7
transient burst of activity at the beginning of a MLR stimulation, a second group displays a sustained response
throughout the MLR stimulation, and a third group of RS cells was shown to display two transient bursts of
activity: a first burst of activity is generated at the beginning and a second burst occurs at the end of a MLR
stimulation. These RS cells were recorded in semi-intact preparations, and it was demonstrated that the second
burst of activity is strongly correlated to the end of a locomotor bout (‘termination burst’). Local application
of glutamate on these RS cells was shown to stop ongoing swimming movements, whereas inactivation of
glutamate receptors elicits a slower termination. As they contribute to the termination of locomotion, these RS
cells are referred to as stop cells.
It was shown that the ‘termination burst’ does not underlie specific membrane properties of stop cells but
rather synaptic inputs to those cells. The aim of a fourth study (Grätsch et al., under review) was to define the
origin of these synaptic inputs. An important finding was that ongoing locomotion can be stopped by electrical
and pharmacological MLR activation. When the animal is at rest, MLR stimulation elicits locomotion, but it
produces very different effects if stimulated during locomotion. It stops swimming if it is stimulated at low
intensity and prolongs swimming if stimulated at a higher intensity. Furthermore it was shown that MLR
stimulation at low intensity also triggers the ‘termination burst’ in stop cells. Electrophysiological and
anatomical experiments revealed that at least some connections between MLR and stop cells are
monosynaptic.
Parts of this work are published in peer-reviewed journals (Ryczko et al., 2013; Ryczko et al., 2017; Juvin*,
Grätsch* et al., 2016) or are under review (Grätsch et al.).3
* co-first authors
8
3. List of Abbreviations AMPA: α-amino-3-hydroxy-5-methyl-4-isoxazolepropionic acid
AP5: (2R)-amino-5-phosphonovaleric acid; (2R)-amino-5-phosphonopentanoate; NMDA receptor antagonist
ARRN: anterior rhombencephalic reticular nucleus
CNQX: 6-cyano-7-nitroquinoxaline-2,3-dione; AMPA/kianate receptor antagonist
CNS: central nervous system
CPG: central pattern generator
CuN: cuneiform nucleus
DLR: diencephalic locomotor region
EPSP: excitatory postsynaptic potential
GABA: gamma-aminobutyric acid
GPe: globus pallidus externa
GPi: globus pallidus interna
ICAN: Calcium-activated nonselective cation current
LDT: laterodorsal tegmental nucleus
MHR: mid-hindbrain neurons
MLR: mesencephalic locomotor region
MPTP: 1-methyl-4-phenyl-1,2,3,6-tetrahydropyridine
MRN: mesencephalic reticular nucleus
MRRN: middle rhombencephalic reticular nucleus
NMDA: N-methyl-D-aspartate
PD: Parkinson’s disease
PPN: pedunclopontine nucleus
PRRN: posterior rhombencephalic reticular nucleus
PT: posterior tuberculum
RS: reticulospinal
SCH29930: halobenzazepine; D1 receptor antagonist
SNc: substantia nigra pars compacta
SNr: substantia nigra par reticulata
STN: subthalamic nucleus
9
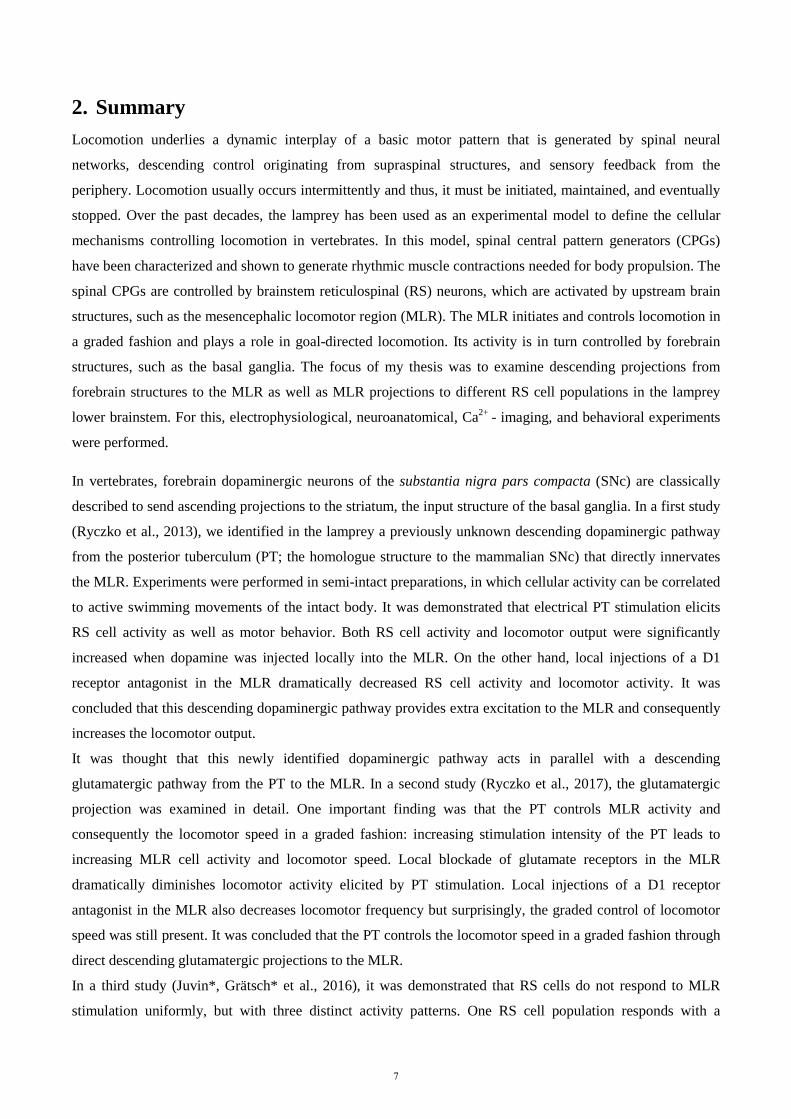
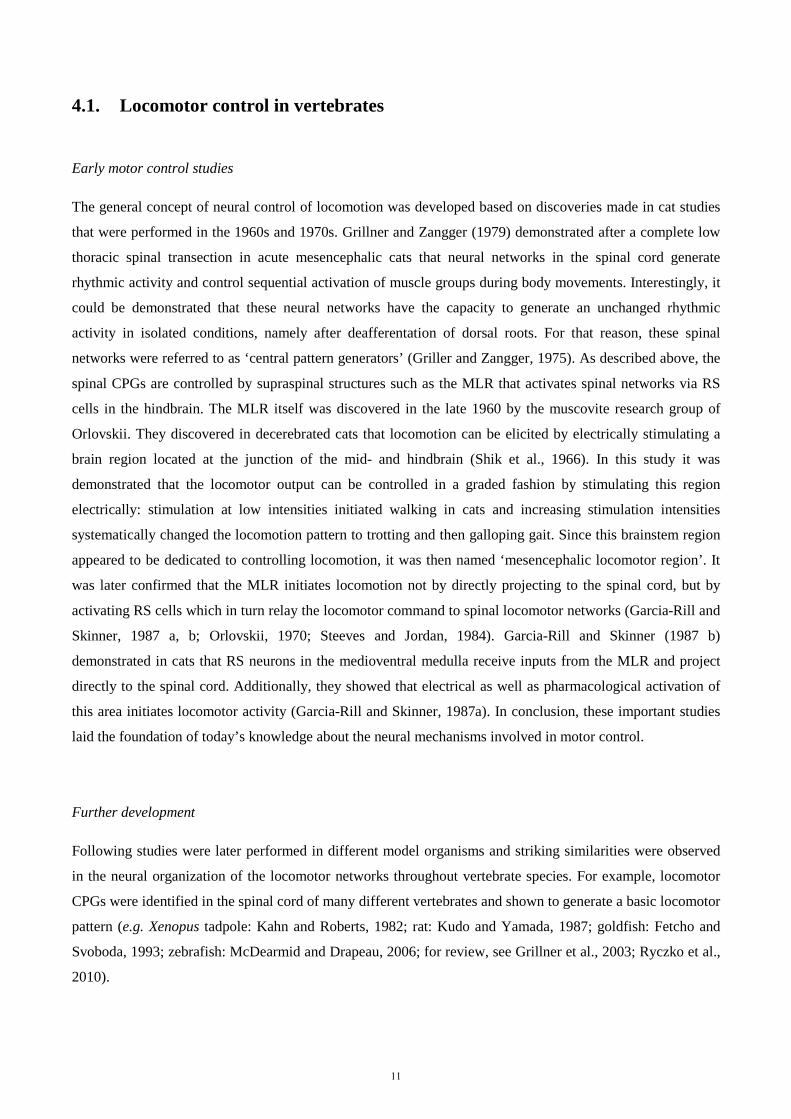
4. Introduction Locomotion is a complex motor behavior that plays a crucial role in our daily life. Animals have developed
different locomotor strategies to survive in their environment and to explore it: a stick insect coordinates six
legs while walking through shrub lands; a hummingbird uses its two wings to perform ultra-fast flight
maneuvers; and a humpback whale can travel long distances by swimming through the ocean water. Even
though the biomechanics of their movement are very different, the general scheme for locomotor control is
very similar in invertebrate and
vertebrate species: Central
pattern generators (CPGs)
produce a basic motor pattern
and control sequential muscle
contractions, needed for body
propulsion. These CPGs are in
turn controlled by descending
inputs from the central nervous
system (CNS) and modulated by
sensory feedback from the
periphery (for review see
Rossignol et al., 2006; Dubuc et
al., 2008; Büschges et al, 2011;
Grillner and Robertson, 2017).
In vertebrates, the locomotor
CPGs are located in the spinal
cord and they receive synaptic
inputs from reticulospinal (RS)
neurons in the hindbrain (see
Figure 1). These RS cells are
command cells for locomotion
and are controlled by upstream
locomotor regions such as the
mesencephalic and the
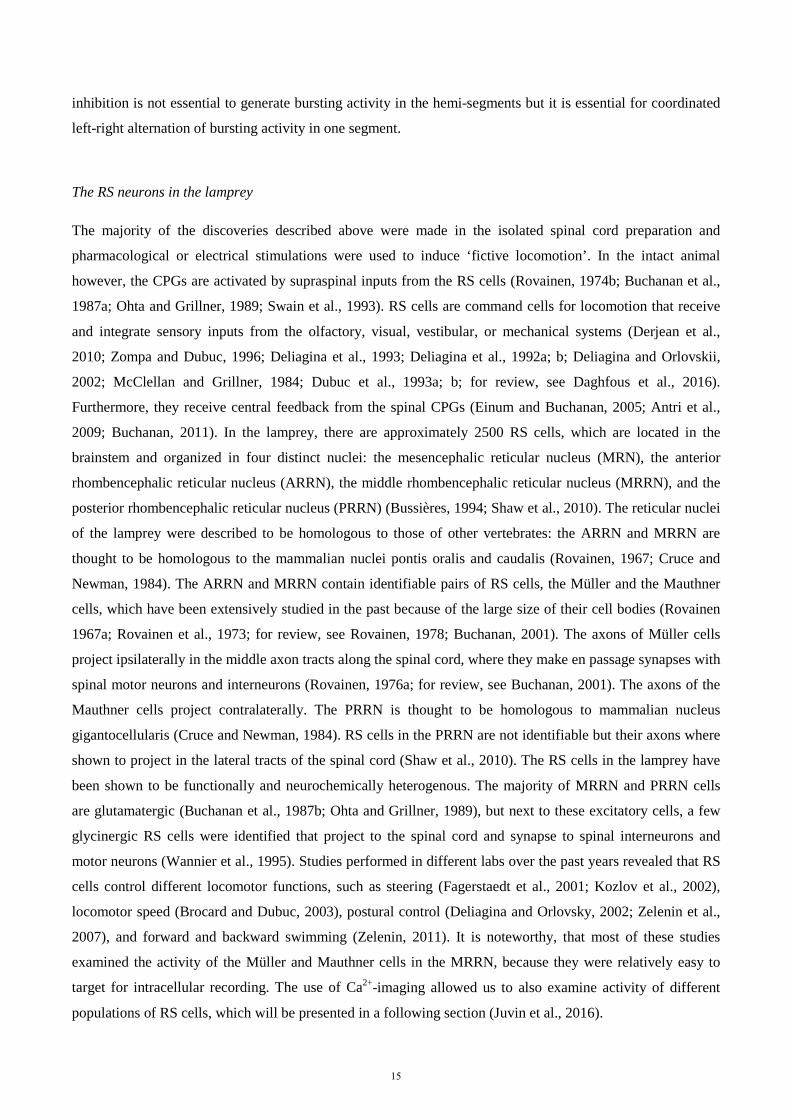
diencephalic locomotor region (MLR and DLR, respectively). The MLR controls the initiation of locomotion
and is controlled by forebrain structures, including the basal ganglia. Additionally, the motor cortex is
involved in fine adjustment of the locomotor output.
Figure 1. Neural control of locomotion in vertebrates.
Schematic representation of a human brain (sagittal view) with the
approximate locations and connections of selected supraspinal brain
structures that are relevant for locomotor control in vertebrates. (CPG,
central pattern generator; DLR, Diencephalic locomotor region, MLR,
Mesencephalic locomotor region; modified from Le Ray et al., 2011).
10
4.1. Locomotor control in vertebrates
Early motor control studies
The general concept of neural control of locomotion was developed based on discoveries made in cat studies
that were performed in the 1960s and 1970s. Grillner and Zangger (1979) demonstrated after a complete low
thoracic spinal transection in acute mesencephalic cats that neural networks in the spinal cord generate
rhythmic activity and control sequential activation of muscle groups during body movements. Interestingly, it
could be demonstrated that these neural networks have the capacity to generate an unchanged rhythmic
activity in isolated conditions, namely after deafferentation of dorsal roots. For that reason, these spinal
networks were referred to as ‘central pattern generators’ (Griller and Zangger, 1975). As described above, the
spinal CPGs are controlled by supraspinal structures such as the MLR that activates spinal networks via RS
cells in the hindbrain. The MLR itself was discovered in the late 1960 by the muscovite research group of
Orlovskii. They discovered in decerebrated cats that locomotion can be elicited by electrically stimulating a
brain region located at the junction of the mid- and hindbrain (Shik et al., 1966). In this study it was
demonstrated that the locomotor output can be controlled in a graded fashion by stimulating this region
electrically: stimulation at low intensities initiated walking in cats and increasing stimulation intensities
systematically changed the locomotion pattern to trotting and then galloping gait. Since this brainstem region
appeared to be dedicated to controlling locomotion, it was then named ‘mesencephalic locomotor region’. It
was later confirmed that the MLR initiates locomotion not by directly projecting to the spinal cord, but by
activating RS cells which in turn relay the locomotor command to spinal locomotor networks (Garcia-Rill and
Skinner, 1987 a, b; Orlovskii, 1970; Steeves and Jordan, 1984). Garcia-Rill and Skinner (1987 b)
demonstrated in cats that RS neurons in the medioventral medulla receive inputs from the MLR and project
directly to the spinal cord. Additionally, they showed that electrical as well as pharmacological activation of
this area initiates locomotor activity (Garcia-Rill and Skinner, 1987a). In conclusion, these important studies
laid the foundation of today’s knowledge about the neural mechanisms involved in motor control.
Further development
Following studies were later performed in different model organisms and striking similarities were observed
in the neural organization of the locomotor networks throughout vertebrate species. For example, locomotor
CPGs were identified in the spinal cord of many different vertebrates and shown to generate a basic locomotor
pattern (e.g. Xenopus tadpole: Kahn and Roberts, 1982; rat: Kudo and Yamada, 1987; goldfish: Fetcho and
Svoboda, 1993; zebrafish: McDearmid and Drapeau, 2006; for review, see Grillner et al., 2003; Ryczko et al.,
2010).
11
RS cells were also shown to constitute the interface between the locomotor centers and spinal networks and
provide mainly excitatory input to spinal interneurons and motor neurons (e.g. Peterson et al., 1979; Perrins et
al., 2002; Bouvier et al., 2015; Capelli et al., 2017). Interestingly, multiple studies in different vertebrate
models revealed that different groups of RS cells control various motor functions, such as locomotor initiation
(Garcia-Rill and Skinner, 1987a; Kimura et al, 2013; Capelli et al., 2017), maintenance (Bretzner and
Brownstone, 2013), termination (Bouvier et al., 2015; Perrins et al., 2002; Capelli et al, 2017), and steering
(Thiele et al., 2014).
Importantly, the MLR has been shown to be highly conserved and has been identified in all vertebrate species
tested (e.g. rats: Skinner and Garcia-Rill, 1984; mice: Lee et al., 2014; salamanders: Cabelguen et al., 2003;
ducks and geese: Sholomenko et al., 1991; lamprey: Sirota et al, 2000, for review, see Jordan, 1998; Dubuc et
al., 2008). It is classically described to be located at the border between the midbrain and hindbrain and
electrical, pharmacological, or optogenetic stimulation initiates stable locomotor bouts (Shik et al., 1966;
Garcia-Rill et al., 1985; Lee et al., 2014; Roseberry et al, 2016; Caggiano et al., 2018; Josset et al, 2018). The
key characteristic of the MLR to control the locomotor speed in a graded fashion was also shown to be present
in other species (Sirota et al., 2000; Cabelguen et al., 2003; Lee et al., 2014; for review, see Le Ray et al,
2011; Ryczko and Dubuc, 2013). The mammalian MLR comprises cholinergic, glutamatergic, and
GABAergic neurons that are localized in different nuclei, the pedunculopontine nucleus (PPN) and the
cuneiform nucleus (CuN) (Skinner and Garcia-Rill, 1984; Martinez-Gonzalez et al., 2011; Roseberry et al.,
2016; for review, see Ryczko and Dubuc, 2013). It has not yet been resolved whether different sub-nuclei of
the MLR control different motor functions, but this matter has been extensively studied. Sinnamon (1993)
proposed that different MLR regions control different motor functions such as appetitive behavior that is used
to approach a consummatory stimulus, escape behavior in response to threat, and exploratory behavior. Recent
optogenetic studies support this hypothesis (Roseberry et al., 2016; Caggiano et al., 2018; Josset et al., 2018).
Examination of the functional role of different cell types in the MLR demonstrated that glutamatergic MLR
cells drive locomotor activity, whereas cholinergic cells contribute to speed control. GABAergic cells inhibit
glutamatergic MLR neurons, which leads to locomotor arrest (Roseberry et al., 2016). Caggiano and
colleagues (2018) revealed that glutamatergic neurons in both PPN and CuN contribute to slow exploratory
movements but only activation of glutamatergic CuN neurons can elicit high-speed escape-like behavior.
Similar observations were made by Josset and colleagues (2018), who demonstrated that optogenetic
stimulations of glutamatergic CuN neurons trigger fast locomotion, as it is seen in escape behavior.
Furthermore, it was shown that both glutamatergic as well as cholinergic neurons in the PPN contribute and
modulate slow walking movements, as observed in exploratory behavior (Josset et al., 2018).
The mammalian MLR in turn is controlled by forebrain structures, such as the basal ganglia, which are
involved in the selection of actions and motor programs (for review, see Kreitzer and Malenka, 2008; Grillner
and Robertson, 2016). At rest, GABAergic neurons from the substantia nigra pars reticulata (SNr) and the
globus pallidus interna (GPi), the output structures of the basal ganglia, keep the MLR under tonic inhibition
12
(Saitoh et al., 2003; Roseberry et al., 2016; for review, see Takakusaki et al., 2008). In order to generate and
suppress goal-directed locomotion, the basal ganglia recruit their direct and indirect pathway respectively
(Kravitz et al., 2010; Roseberry et al., 2016). The direct pathway is composed of GABAergic neurons that
project from the striatum, the input structure of the basal ganglia, directly to the SNr and GPi. Activation of
this direct pathway inhibits the GABAergic neurons of the SNr and GPi and thus disinhibits the MLR, which
then leads to the initiation of locomotion. Striatal neurons of the indirect pathway, on the other hand, project
to the globus pallidus externa (GPe), which in turn projects to the subthalamic nucleus (STN). The STN
activates the GPi and the SNr, which then leads to suppression of motor activity (Kravitz et al., 2010; for
review, see Grillner and Robertson, 2016; Roseberry and Kreitzer, 2017).
In the past decades, motor control studies have given a broad insight into the neural control of locomotor
behavior. Cross-linking concepts that were found in invertebrates, basal vertebrates, and more recently-
evolved vertebrates is one reason for this progress (for review, see Mullins et al., 2011). Furthermore,
technological advances allowed the establishment of new techniques, such as Ca2+ imaging or optogenetic
tools. The latter provide many advantages, since the functional role of neurons with specific genetic markers
can be examined (e.g. Kimura et al., 2013; Lee, 2014; Thiele et al., 2014; Bouvier et al., 2015; Capelli et al.,
2017; Caggiano et al., 2018; Josset et al., 2018). However, the mammalian nervous system is very complex
and single cell recordings remain challenging, notably during ongoing locomotion. Therefore, studies in
organisms with simpler nervous systems, like the lamprey, remain of great importance in order to reveal
details about neural connectivity and properties involved in locomotor control.
4.2. The control of locomotion in lampreys
Studies performed in mammalian models could not yet bring detailed insights into the cellular organization
and connectivity within the locomotor network. In the 1980s, Grillner and colleagues started to investigate the
cellular organization of the spinal locomotor CPG in a basal vertebrate, the lamprey. The lamprey was chosen
as an experimental model for several reasons. It is a basal vertebrate that diverged from the vertebrate phylum
some 560 million years ago (Kumar and Hedges, 1998) and the anatomical organization of the lamprey and
mammalian CNS is strikingly similar (for review, see Nieuwenhuys et al., 1998; Robertson et al., 2014
Grillner and Robertson, 2017). Another advantage was the simplicity of the undulary, limbless movements.
Lampreys swim in the horizontal plane and movements underlie reciprocal muscle contractions of the left and
right side of the body. For the most common forward propulsion, those contractions propagate along the body
axis like a mechanical wave that propagates from the rostral to the caudal body segments, with an
intersegmental phase lag of approximately 1% (Wallén and Williams, 1984). In very rare cases, the lamprey
performs backward swimming, characterized by undulary movements that start in caudal segments and
propagate rostrally with a phase lag of approximately -1% (Matsushima and Grillner, 1992; Islam et al.,
13
2006). Compared to the mammalian CNS, there are considerably fewer neurons present in the lamprey CNS
and many are larger and thus more accessible for intracellular recording. Another advantage is that he lamprey
brain can survive in vitro for a few days, which makes it very valuable for anatomical and physiological
experiments. Moreover, a semi-intact preparation was developed in lampreys to study neural activity during
active behavior (Sirota et al, 2000). Here, the brain is exposed and accessible to recording electrodes while the
intact body is still attached and may perform active swimming movements, cellular activity in the intact brain
can thus be correlated to the behavioral output. Over the past decades, these features allowed the development
and the combination of multiple in vitro and in vivo techniques that are now used to examine neural networks
from the single cell to the behavioral level (e.g. Derjean et al., 2010; Brocard et al., 2010; Ryczko et al., 2013;
Juvin et al., 2016).
The locomotor CPGs in the lamprey spinal cord
As mentioned above, Grillner and his group began to characterize the cellular organization of the locomotor
CPGs in the lamprey spinal cord. Buchanan and Grillner (1987) discovered that excitatory glutamatergic
premotor neurons build networks that intrinsically generate burst activity and excite ipsilateral motor neurons
(Buchanan and Grillner, 1987). Rhythmic bursting activity can be generated by these networks even in
isolated spinal cord preparations in which supraspinal and sensory inputs are removed. Pharmacological
application of glutamate agonists to the spinal cord or electrical stimulation of supraspinal brain areas as well
as RS cell axons induce stable bursting pattern in spinal ventral roots. This motor output is referred to as
‘fictive locomotion’ (Cohen and Wallén, 1980; Wallén and Williams, 1984). The rhythmogenetic networks
were shown to be located in individual spinal cord segments and are interconnected through ipsilateral
(intersegmental) and contralateral (intrasegmental) projections, originating from excitatory and inhibitory
interneurons that allow rostro-caudal and left-right coordination of body segments (for review, see Grillner,
2003). For the propagation of the mechanical wave from rostral to caudal, intersegmental coordination of
ipsilateral rhythmogenetic networks is needed. Excitatory interneurons of each segment project collateral
axons to rostral and caudal segments (Dale, 1986). This interconnection allows the generation of rostro-caudal
body undulations, but can also induce caudo-rostral body movements during backward swimming. Decisive
for the direction of propagation of burst activity is the excitatory gradient of rostral and caudal spinal cord
segments: if rostral segments are more excited than caudal segments, the wave of bursting activity propagates
from rostral to caudal and vice versa (Matsushima and Griller, 1992). Glycinergic commissural interneurons
coordinate alternating activity of rhythmogenetic networks located on the left and right side of one segment.
These neurons are activated by the excitatory interneurons of the rhythmogenetic networks and inhibit
contralateral CPG interneurons as well as contralateral motor neurons (Buchanan, 1982). Application of
strychnine, a glycinergic antagonist, on the isolated spinal cord does not prevent rhythmic bursting activity in
the spinal cord, but it results in a change from alternating bursting activity to simultaneous bilateral activity of
motor neurons within one segment (Cohen and Harris-Warrick, 1984). These results indicate that contralateral
14
inhibition is not essential to generate bursting activity in the hemi-segments but it is essential for coordinated
left-right alternation of bursting activity in one segment.
The RS neurons in the lamprey
The majority of the discoveries described above were made in the isolated spinal cord preparation and
pharmacological or electrical stimulations were used to induce ‘fictive locomotion’. In the intact animal
however, the CPGs are activated by supraspinal inputs from the RS cells (Rovainen, 1974b; Buchanan et al.,
1987a; Ohta and Grillner, 1989; Swain et al., 1993). RS cells are command cells for locomotion that receive
and integrate sensory inputs from the olfactory, visual, vestibular, or mechanical systems (Derjean et al.,
2010; Zompa and Dubuc, 1996; Deliagina et al., 1993; Deliagina et al., 1992a; b; Deliagina and Orlovskii,
2002; McClellan and Grillner, 1984; Dubuc et al., 1993a; b; for review, see Daghfous et al., 2016).
Furthermore, they receive central feedback from the spinal CPGs (Einum and Buchanan, 2005; Antri et al.,
2009; Buchanan, 2011). In the lamprey, there are approximately 2500 RS cells, which are located in the
brainstem and organized in four distinct nuclei: the mesencephalic reticular nucleus (MRN), the anterior
rhombencephalic reticular nucleus (ARRN), the middle rhombencephalic reticular nucleus (MRRN), and the
posterior rhombencephalic reticular nucleus (PRRN) (Bussières, 1994; Shaw et al., 2010). The reticular nuclei
of the lamprey were described to be homologous to those of other vertebrates: the ARRN and MRRN are
thought to be homologous to the mammalian nuclei pontis oralis and caudalis (Rovainen, 1967; Cruce and
Newman, 1984). The ARRN and MRRN contain identifiable pairs of RS cells, the Müller and the Mauthner
cells, which have been extensively studied in the past because of the large size of their cell bodies (Rovainen
1967a; Rovainen et al., 1973; for review, see Rovainen, 1978; Buchanan, 2001). The axons of Müller cells
project ipsilaterally in the middle axon tracts along the spinal cord, where they make en passage synapses with
spinal motor neurons and interneurons (Rovainen, 1976a; for review, see Buchanan, 2001). The axons of the
Mauthner cells project contralaterally. The PRRN is thought to be homologous to mammalian nucleus
gigantocellularis (Cruce and Newman, 1984). RS cells in the PRRN are not identifiable but their axons where
shown to project in the lateral tracts of the spinal cord (Shaw et al., 2010). The RS cells in the lamprey have
been shown to be functionally and neurochemically heterogenous. The majority of MRRN and PRRN cells
are glutamatergic (Buchanan et al., 1987b; Ohta and Grillner, 1989), but next to these excitatory cells, a few
glycinergic RS cells were identified that project to the spinal cord and synapse to spinal interneurons and
motor neurons (Wannier et al., 1995). Studies performed in different labs over the past years revealed that RS
cells control different locomotor functions, such as steering (Fagerstaedt et al., 2001; Kozlov et al., 2002),
locomotor speed (Brocard and Dubuc, 2003), postural control (Deliagina and Orlovsky, 2002; Zelenin et al.,
2007), and forward and backward swimming (Zelenin, 2011). It is noteworthy, that most of these studies
examined the activity of the Müller and Mauthner cells in the MRRN, because they were relatively easy to
target for intracellular recording. The use of Ca2+-imaging allowed us to also examine activity of different
populations of RS cells, which will be presented in a following section (Juvin et al., 2016).
15
The mesencephalic locomotor region of the lamprey
Other than inputs from the sensory system and the spinal cord, RS cells receive descending inputs from
upstream motor centers, such as the mesencephalic locomotor region and the diencephalic locomotor region
(MLR and DLR respectively; El Manira et al., 1997; Sirota et al., 2000; Brocard et al., 2010). The MLR of
lampreys comprises cholinergic and glutamatergic neurons that are localized in the PPN and laterodorsal
tegmental nucleus (LDT). These neurons project bilaterally and symmetrically to RS cells in the brainstem via
monosynaptic connections (Le Ray et al., 2003; Brocard et al., 2010). Whether the two neurotransmitter
systems in the MLR contribute to different locomotor functions, as it has recently been shown in mice
(Roseberry et al., 2016), has not been confirmed in lampreys. Yet, local applications of acetylcholine or
nicotine elicit dose-dependent responses in RS cells and can initiate or accelerate locomotion in semi-intact
preparations (Le Ray et al., 2003). Interestingly, blocking nicotinic receptors in the brainstem increased the
threshold of MLR stimulation but did not prevent the initiation of locomotion as such, which indicates the
cooperative nature of the two neurotransmitter systems that are present in the MLR (Le Ray et al., 2003).
Apart from the initiation of locomotion, the graded control of locomotor intensity is another characteristic of
the MLR (Sirota et al., 2000). This mechanism works similarly to a rheostat: the stronger the MLR is
activated, either electrically or pharmacologically, the higher is the activation of RS cells and consequently,
the locomotor output (Sirota et al., 2000). Direct recruitment of different RS cell populations in the MRRN
and PRRN (for slow and fast locomotor activity, respectively) underlies this fine control of the intensity of the
locomotor output (Brocard and Dubuc, 2003). Additionally, a parallel pathway has been shown to boost
locomotor activity (Smetana et al., 2010). Here, the MLR activates a group of muscarinoceptive hindbrain
neurons, which in turn project to the RS cells in the MRRN (Smetana et al., 2010). These muscarinoceptive
neurons provide extra excitation to RS cells in order to amplify the locomotor output. Interestingly, the MLR
not only controls the locomotor output but also participates in other vital functions, by adjusting the activity in
neural networks responsible for respiration or gating sensory inputs that reach RS cells (Gariépy et al., 2012;
Le Ray et al., 2010; for review, see Le Ray et al., 2011; Missaghi et al., 2016).
The basal ganglia of the lamprey
Like in mammalian species, the lamprey MLR is under the control of forebrain structures, such as the basal
ganglia. In vertebrates, the basal ganglia are responsible for the selection of appropriate motor programs.
Interestingly, it was shown that the main structures that were identified in the mammalian basal ganglia are
also present in the lamprey nervous system (Stephenson- Jones et al., 2011; 2012; for review, see Grillner and
Robertson, 2017). GABAergic projections originating from the basal ganglia innervate the MLR and keep
them under tonic inhibition (Ménard et al., 2007; Stephenson-Jones et al., 2011; 2012; Pombal et al., 1997; for
review, see Robertson et al., 2014). Physiological experiments demonstrated that a blockade of GABAergic
receptors in the MLR induced well-coordinated swimming movements in a semi-intact preparation, whereas
16
activation of GABAergic receptors suppressed ongoing locomotion (Ménard et al., 2007). Meanwhile, the
input structure of the basal ganglia, the striatum, receives input from the thalamus and from the pallium, the
homologue structure of the mammalian cortex (Ericsson et al., 2013; Ocaña et al., 2015). Additionally, the
striatum receives dopaminergic inputs from the posterior tuberculum (PT), the homologue of the mammalian
substantia nigra pars compacta (SNc) and the ventral tegmental area (Pombal et al., 1997; Ryczko et al.,
2013; Peréz-Frenández et al., 2014). As mentioned above for the mammalian basal ganglia, the afferent
projections of the striatum form two distinct pathways: the direct pathway and the indirect pathway
(Stephenson- Jones et al., 2011; 2012). GABAergic striatal neurons that express substance P constitute the
direct pathway and project to the pallidal output structures of the basal ganglia (Stephenson-Jones et al.,
2011). Like in the direct pathway in mammals, activation of this pathway in lampreys should suppress the
GABAergic neurons of the basal ganglia output region and disinhibit the motor control regions which would
in turn lead to locomotor activity. Striatal neurons that form the indirect pathway of the lamprey express
enkephalin and project to the output region of the basal ganglia via the GPe and the STN (Ericsson et al.,
2013; Stephenson- Jones et al., 2012). The circuitry is strikingly similar to the indirect pathway of mammals
so it could be expected that activation of this pathway leads to disinhibition of the basal ganglia output region,
which in turn would set the motor regions under tonic inhibition and suppress locomotor activity. Together
these findings demonstrate that the building blocks and the connectivity within the basal ganglia were present
in the first stages of vertebrate evolution (Stephenson-Jones et al., 2011; 2012; Ryczko et al., 2013) and it is
tempting to suggest that this neural substrate for action selection has been used by all vertebrate species since
then, with gradual modifications and complexification (for review, see Grillner and Robertson, 2017).
4.3. Aims and objectives
The locomotor network of the lamprey has been examined extensively in the past and many details are known
about the descending control of locomotion. However, important details remain elusive such as detailed
information regarding the descending input from the forebrain to the MLR and the output of the MLR to
different RS cell populations. These topics are at the base of the specific aims of my thesis.
Classically, dopaminergic cells in the SNc were described to send ascending projections to the striatum, the
input regions of the basal ganglia (for review, see Ryczko and Dubuc, 2017). But in mammals, some studies
suggested the presence of a descending projection, possibly dopaminergic, from the SNc to the MLR (Rolland
et al., 2009; Beckstedt et al., 1979). Similarly in the lamprey, anatomical studies demonstrated that
dopaminergic neurons of the PT not only send ascending projections to the striatum but also descending
projections (Pombal et al., 1997). In a first study (Ryczko et al., 2013), we examined this dopaminergic
projection of the PT in more detail and identified a previously unknown descending dopaminergic pathway
from the PT to the MLR. Anatomical and physiological experiments were performed and confirmed the
17
functional relevance of this descending dopaminergic pathway in locomotor control. Dopaminergic inputs
from the PT increase MLR activity and consequently the locomotor output via a D1 receptor-dependent
mechanism.
Based on studies that were performed previously in the lamprey, it was thought that the PT not only sends
dopaminergic projections to the MLR, but that an additional descending pathway provides a parallel
excitatory input. For example, it has been shown that electrical stimulation of the PT provides a strong
excitatory input to the MLR and that it can initiate locomotion (Derjean et al., 2010; Gariépy et al., 2012;
Ryczko et al., 2013). Intracellularly recorded MLR neurons respond to PT stimulation with fast excitatory
postsynaptic potentials and a blockade of D1 receptors in the MLR reduces but does not prevent locomotion
(Gariépy et al., 2012; Ryczko et al., 2013). Additionally, anatomical studies identified glutamatergic neurons
in the PT and physiological studies revealed that activation of glutamatergic receptors in the MLR induces
stable locomotor bouts (Sirota et al., 2000; Ménard et al., 2007; Villar-Cervino et al., 2011). Therefore, it
seemed very likely that glutamate is present in this parallel pathway. The goal of a second study (Ryczko et
al., 2017), was to examine this pathway from the PT to the MLR in more detail. Using anatomical, Ca2+
imaging, and electrophysiological techniques, the presence of a descending glutamatergic pathway from the
PT to the MLR was confirmed. Moreover, it was shown to be responsible for the graded control of locomotor
speed.
It had long been demonstrated that electrical stimulation of the MLR directly activates RS cells in the
hindbrain. In the lamprey, RS cells of larger size were preferably examined in the past and the aim of a third
study (Juvin*, Grätsch* et al., 2016) was to investigate RS cell responses to MLR stimulation in different
populations of RS cells. We found that MLR stimulation elicits three distinct patterns of activity in different
RS cell populations. One group of RS cells is transiently active at the beginning of the MLR stimulation and a
second group responds with a sustained activity throughout the whole MLR stimulation. A third group of RS
cells displayed two transient bursts of activity: one at the beginning and one at the end of the MLR
stimulation. Experiments in semi-intact preparations demonstrated that the second burst of activity is
correlated to the end of a swimming bout. We thus hypothesised that this RS cell population plays a role in
ending locomotor activity. These cells became of great interest because little was known at the time about the
neural mechanisms controlling the termination of locomotion (for review, see Klemm, 2001; Mullins et al.,
2011). Only recent studies brought insights into the brain regions and neurotransmitter systems that could be
involved in stopping locomotion (for review, see Roseberry and Kreitzer, 2017). In our study (Juvin*,
Grätsch* et al., 2016), we showed that the pharmacological activation of the RS cells displaying a second
burst of activity at the end of a swimming bout halted ongoing swimming. Their inactivation on the other hand
slowed the termination of locomotion down. We concluded that these cells played a crucial part in the
termination process of locomotion and named them ‘stop cells’.
18
It was not resolved how the stop cells are activated during ongoing locomotor movements, but synaptic inputs
rather than membrane properties were suggested to play a significant role (Juvin*, Grätsch* et al., 2016). As
the MLR provides major input to RS cells (Orlovskii, 1970; Steeves and Jordan, 1984; Le Ray et al., 2003;
Brocard and Dubuc, 2003; Brocard et al., 2010; Ryczko et al, 2016) it was considered to be a promising
candidate for providing such a synaptic input to stop cells. In cats, it has been proposed that projections from
the PPN to neurons in the nucleus reticularis points oralis that in turn activate RS neurons in the medullary
reticular formation are responsible for suppression of muscle tone (for review, see Takakusaki, 2008). But
details about this pathway have not yet been described. The aim of the fourth study was therefore to find the
source that activates stop cells during ongoing locomotion. Using physiological and anatomical techniques,
we could confirm that the MLR is able to activate RS stop cells during ongoing locomotion and can thus stop
ongoing locomotion (Grätsch et al., under review).4
Altogether, my thesis investigated the descending control of locomotion in the lamprey and revealed details
about the direct control of the MLR by forebrain structures as well as descending outputs of the MLR to
different RS cell populations in the hindbrain. Furthermore, a neural substrate underlying the neural control of
termination of locomotion was identified.
* co-first authors
19
5. Published studies
5.1. Forebrain dopamine neurons project down to a brainstem region
controlling locomotion
Ryczko, D., Grätsch, S., Auclair, F., Dubé, C., Bergeron, S., Alpert, M.H., Cone, J.J., Roitman, M.F., Alford,
S., and Dubuc, R.
Published 2013 in Proceedings of the National Academy of Sciences, 110(34):E3235-42.
Author contributions
Designed research:
Dimitri Ryczko, François Auclair, and Réjean Dubuc.
Performed research:
Dimitri Ryczko, Swantje Grätsch, François Auclair, Catherine Dubé, Saskia Bergeron, Michael H. Alpert,
Jackson J. Cone, Mitchell F. Roitman, Simon Alford, and Réjean Dubuc.
Analyzed data:
Dimitri Ryczko, Swantje Grätsch, François Auclair, Catherine Dubé, Saskia Bergeron, Michael H. Alpert,
Jackson J. Cone, Mitchell F. Roitman, Simon Alford, and Réjean Dubuc.
Wrote the paper:
Dimitri Ryczko, François Auclair, and Réjean Dubuc.
This paper was reproduced with the permission from the publisher.
20
Forebrain dopamine neurons project down toa brainstem region controlling locomotionDimitri Ryczkoa, Swantje Grätscha, François Auclaira, Catherine Dubéa, Saskia Bergeronb, Michael H. Alpertc,Jackson J. Conec, Mitchell F. Roitmanc, Simon Alfordc, and Réjean Dubuca,b,1
aGroupe de Recherche sur le Système Nerveux Central, Département de Physiologie, Université de Montréal, Montréal, QC, Canada H3C 3J7; bGroupe deRecherche en Activité Physique Adaptée, Département de Kinanthropologie, Université du Québec à Montréal, Montréal, QC, Canada H3C 3P8; andcLaboratory of Integrative Neuroscience, University of Illinois at Chicago, Chicago, IL 60607
Edited by Sten Grillner, Karolinska Institutet, Stockholm, Sweden, and approved June 28, 2013 (received for review January 18, 2013)
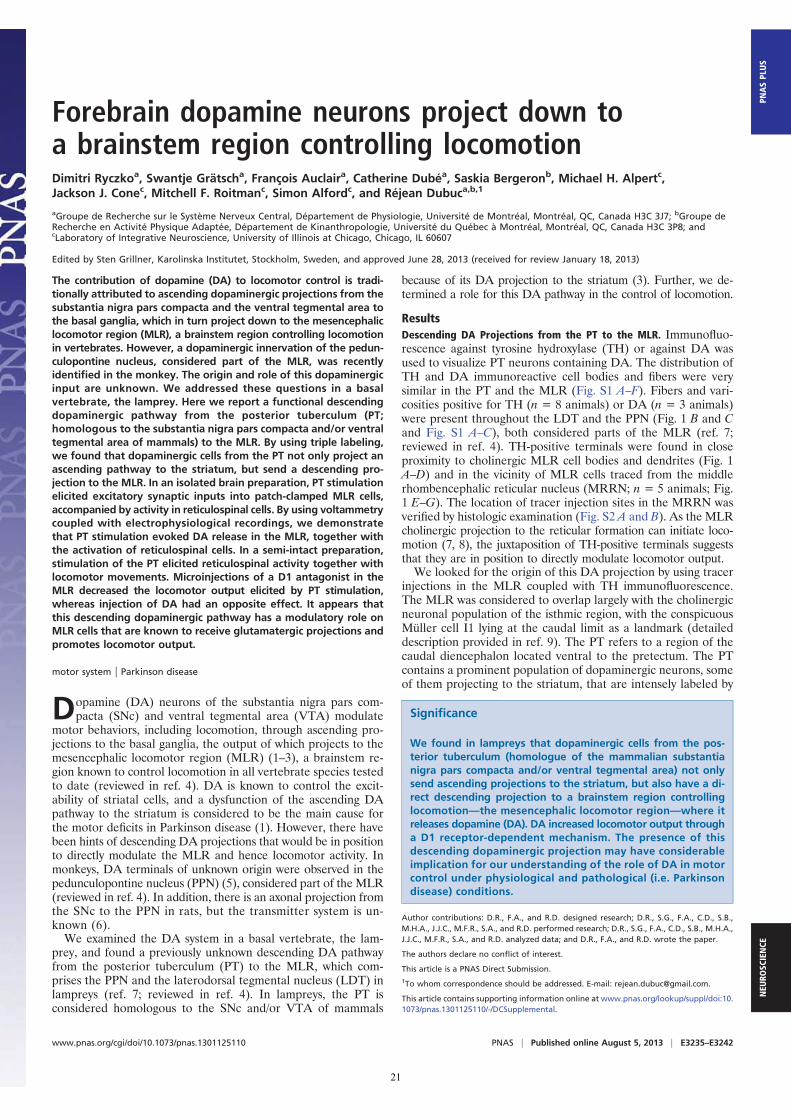
The contribution of dopamine (DA) to locomotor control is tradi-tionally attributed to ascending dopaminergic projections from thesubstantia nigra pars compacta and the ventral tegmental area tothe basal ganglia, which in turn project down to the mesencephaliclocomotor region (MLR), a brainstem region controlling locomotionin vertebrates. However, a dopaminergic innervation of the pedun-culopontine nucleus, considered part of the MLR, was recentlyidentified in the monkey. The origin and role of this dopaminergicinput are unknown. We addressed these questions in a basalvertebrate, the lamprey. Here we report a functional descendingdopaminergic pathway from the posterior tuberculum (PT;homologous to the substantia nigra pars compacta and/or ventraltegmental area of mammals) to the MLR. By using triple labeling,we found that dopaminergic cells from the PT not only project anascending pathway to the striatum, but send a descending pro-jection to the MLR. In an isolated brain preparation, PT stimulationelicited excitatory synaptic inputs into patch-clamped MLR cells,accompanied by activity in reticulospinal cells. By using voltammetrycoupled with electrophysiological recordings, we demonstratethat PT stimulation evoked DA release in the MLR, together withthe activation of reticulospinal cells. In a semi-intact preparation,stimulation of the PT elicited reticulospinal activity together withlocomotor movements. Microinjections of a D1 antagonist in theMLR decreased the locomotor output elicited by PT stimulation,whereas injection of DA had an opposite effect. It appears thatthis descending dopaminergic pathway has a modulatory role onMLR cells that are known to receive glutamatergic projections andpromotes locomotor output.
motor system | Parkinson disease
Dopamine (DA) neurons of the substantia nigra pars com-pacta (SNc) and ventral tegmental area (VTA) modulate
motor behaviors, including locomotion, through ascending pro-jections to the basal ganglia, the output of which projects to themesencephalic locomotor region (MLR) (1–3), a brainstem re-gion known to control locomotion in all vertebrate species testedto date (reviewed in ref. 4). DA is known to control the excit-ability of striatal cells, and a dysfunction of the ascending DApathway to the striatum is considered to be the main cause forthe motor deficits in Parkinson disease (1). However, there havebeen hints of descending DA projections that would be in positionto directly modulate the MLR and hence locomotor activity. Inmonkeys, DA terminals of unknown origin were observed in thepedunculopontine nucleus (PPN) (5), considered part of the MLR(reviewed in ref. 4). In addition, there is an axonal projection fromthe SNc to the PPN in rats, but the transmitter system is un-known (6).We examined the DA system in a basal vertebrate, the lam-
prey, and found a previously unknown descending DA pathwayfrom the posterior tuberculum (PT) to the MLR, which com-prises the PPN and the laterodorsal tegmental nucleus (LDT) inlampreys (ref. 7; reviewed in ref. 4). In lampreys, the PT isconsidered homologous to the SNc and/or VTA of mammals
because of its DA projection to the striatum (3). Further, we de-termined a role for this DA pathway in the control of locomotion.
ResultsDescending DA Projections from the PT to the MLR. Immunofluo-rescence against tyrosine hydroxylase (TH) or against DA wasused to visualize PT neurons containing DA. The distribution ofTH and DA immunoreactive cell bodies and fibers were verysimilar in the PT and the MLR (Fig. S1 A–F). Fibers and vari-cosities positive for TH (n = 8 animals) or DA (n = 3 animals)were present throughout the LDT and the PPN (Fig. 1 B and Cand Fig. S1 A–C), both considered parts of the MLR (ref. 7;reviewed in ref. 4). TH-positive terminals were found in closeproximity to cholinergic MLR cell bodies and dendrites (Fig. 1A–D) and in the vicinity of MLR cells traced from the middlerhombencephalic reticular nucleus (MRRN; n = 5 animals; Fig.1 E–G). The location of tracer injection sites in the MRRN wasverified by histologic examination (Fig. S2 A and B). As the MLRcholinergic projection to the reticular formation can initiate loco-motion (7, 8), the juxtaposition of TH-positive terminals suggeststhat they are in position to directly modulate locomotor output.We looked for the origin of this DA projection by using tracer
injections in the MLR coupled with TH immunofluorescence.The MLR was considered to overlap largely with the cholinergicneuronal population of the isthmic region, with the conspicuousMüller cell I1 lying at the caudal limit as a landmark (detaileddescription provided in ref. 9). The PT refers to a region of thecaudal diencephalon located ventral to the pretectum. The PTcontains a prominent population of dopaminergic neurons, someof them projecting to the striatum, that are intensely labeled by
Significance
We found in lampreys that dopaminergic cells from the pos-terior tuberculum (homologue of the mammalian substantianigra pars compacta and/or ventral tegmental area) not onlysend ascending projections to the striatum, but also have a di-rect descending projection to a brainstem region controllinglocomotion—the mesencephalic locomotor region—where itreleases dopamine (DA). DA increased locomotor output througha D1 receptor-dependent mechanism. The presence of thisdescending dopaminergic projection may have considerableimplication for our understanding of the role of DA in motorcontrol under physiological and pathological (i.e. Parkinsondisease) conditions.
Author contributions: D.R., F.A., and R.D. designed research; D.R., S.G., F.A., C.D., S.B.,M.H.A., J.J.C., M.F.R., S.A., and R.D. performed research; D.R., S.G., F.A., C.D., S.B., M.H.A.,J.J.C., M.F.R., S.A., and R.D. analyzed data; and D.R., F.A., and R.D. wrote the paper.
The authors declare no conflict of interest.
This article is a PNAS Direct Submission.1To whom correspondence should be addressed. E-mail: [email protected].
This article contains supporting information online at www.pnas.org/lookup/suppl/doi:10.1073/pnas.1301125110/-/DCSupplemental.
www.pnas.org/cgi/doi/10.1073/pnas.1301125110 PNAS | Published online August 5, 2013 | E3235–E3242
NEU
ROSC
IENCE
PNASPL
US
21
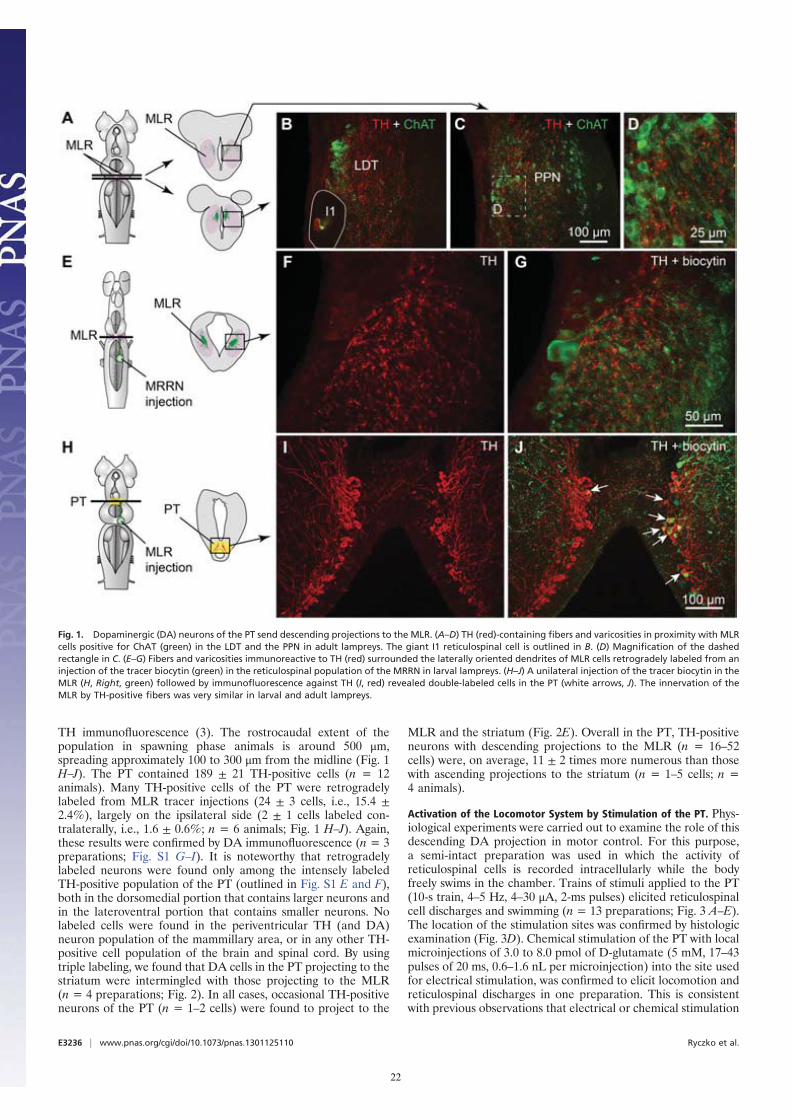
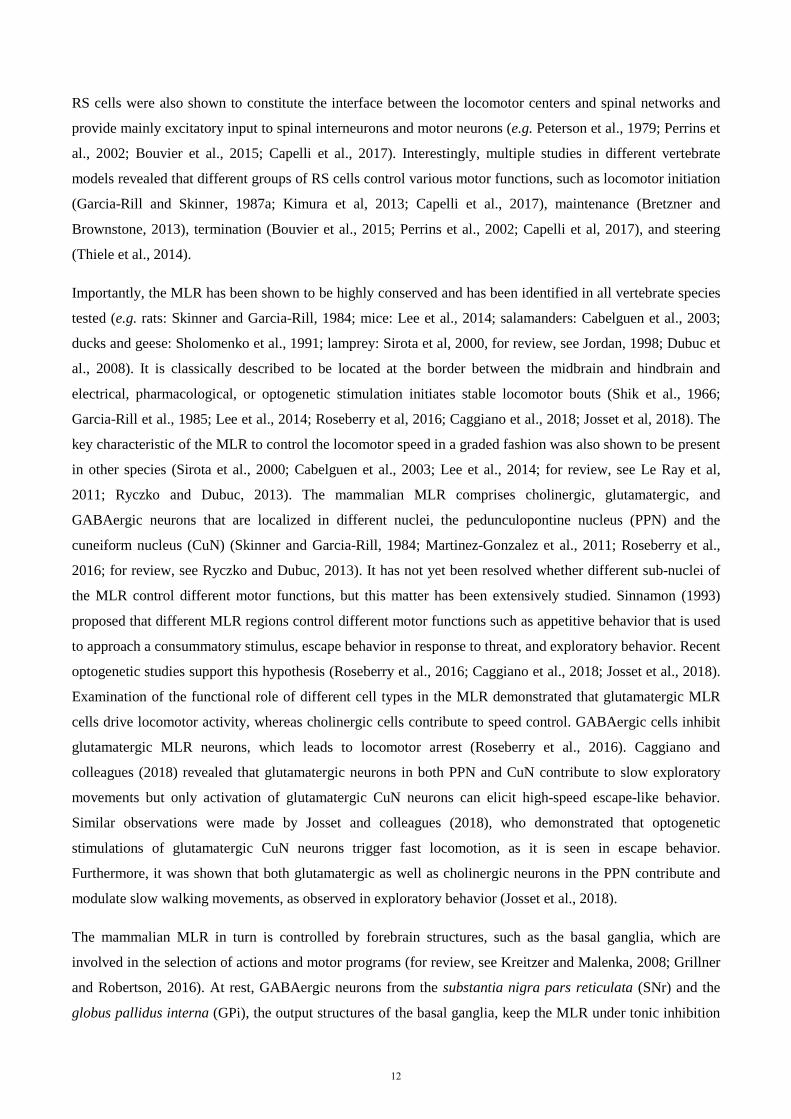
TH immunofluorescence (3). The rostrocaudal extent of thepopulation in spawning phase animals is around 500 μm,spreading approximately 100 to 300 μm from the midline (Fig. 1H–J). The PT contained 189 ± 21 TH-positive cells (n = 12animals). Many TH-positive cells of the PT were retrogradelylabeled from MLR tracer injections (24 ± 3 cells, i.e., 15.4 ±2.4%), largely on the ipsilateral side (2 ± 1 cells labeled con-tralaterally, i.e., 1.6 ± 0.6%; n = 6 animals; Fig. 1 H–J). Again,these results were confirmed by DA immunofluorescence (n = 3preparations; Fig. S1 G–I). It is noteworthy that retrogradelylabeled neurons were found only among the intensely labeledTH-positive population of the PT (outlined in Fig. S1 E and F),both in the dorsomedial portion that contains larger neurons andin the lateroventral portion that contains smaller neurons. Nolabeled cells were found in the periventricular TH (and DA)neuron population of the mammillary area, or in any other TH-positive cell population of the brain and spinal cord. By usingtriple labeling, we found that DA cells in the PT projecting to thestriatum were intermingled with those projecting to the MLR(n = 4 preparations; Fig. 2). In all cases, occasional TH-positiveneurons of the PT (n = 1–2 cells) were found to project to the
MLR and the striatum (Fig. 2E). Overall in the PT, TH-positiveneurons with descending projections to the MLR (n = 16–52cells) were, on average, 11 ± 2 times more numerous than thosewith ascending projections to the striatum (n = 1–5 cells; n =4 animals).
Activation of the Locomotor System by Stimulation of the PT. Phys-iological experiments were carried out to examine the role of thisdescending DA projection in motor control. For this purpose,a semi-intact preparation was used in which the activity ofreticulospinal cells is recorded intracellularly while the bodyfreely swims in the chamber. Trains of stimuli applied to the PT(10-s train, 4–5 Hz, 4–30 μA, 2-ms pulses) elicited reticulospinalcell discharges and swimming (n = 13 preparations; Fig. 3 A–E).The location of the stimulation sites was confirmed by histologicexamination (Fig. 3D). Chemical stimulation of the PT with localmicroinjections of 3.0 to 8.0 pmol of D-glutamate (5 mM, 17–43pulses of 20 ms, 0.6–1.6 nL per microinjection) into the site usedfor electrical stimulation, was confirmed to elicit locomotion andreticulospinal discharges in one preparation. This is consistentwith previous observations that electrical or chemical stimulation
Fig. 1. Dopaminergic (DA) neurons of the PT send descending projections to the MLR. (A–D) TH (red)-containing fibers and varicosities in proximity with MLRcells positive for ChAT (green) in the LDT and the PPN in adult lampreys. The giant I1 reticulospinal cell is outlined in B. (D) Magnification of the dashedrectangle in C. (E–G) Fibers and varicosities immunoreactive to TH (red) surrounded the laterally oriented dendrites of MLR cells retrogradely labeled from aninjection of the tracer biocytin (green) in the reticulospinal population of the MRRN in larval lampreys. (H–J) A unilateral injection of the tracer biocytin in theMLR (H, Right, green) followed by immunofluorescence against TH (I, red) revealed double-labeled cells in the PT (white arrows, J). The innervation of theMLR by TH-positive fibers was very similar in larval and adult lampreys.
E3236 | www.pnas.org/cgi/doi/10.1073/pnas.1301125110 Ryczko et al.
22
with D-glutamate of this region initiates locomotion (10, 11). Byusing targeted whole-cell patch clamp recordings in an isolatedbrain preparation (Materials and Methods), we found that trainsof stimuli (10-s train, 4–5 Hz, 10–35 μA, 2-ms pulses) to the PT(Fig. S2 G and H) directly activate MLR cells projecting toreticulospinal neurons (n = 6 cells from six preparations; Fig. 3F–I). When comparing simultaneous recordings from an MLRcell and reticulospinal cells (extracellular), we found a verysimilar activation following trains of stimuli to the PT (Fig. 3H).Single stimuli to the PT evoked short-latency, large excitatorypostsynaptic currents in whole-cell patch recorded MLR cells(Fig. 3I). Glutamatergic receptors are involved in these responses,as previously demonstrated (10), and the DA input from PT to theMLR could modulate this glutamatergic excitatory connection.The rest of our study was aimed at examining this possibility.
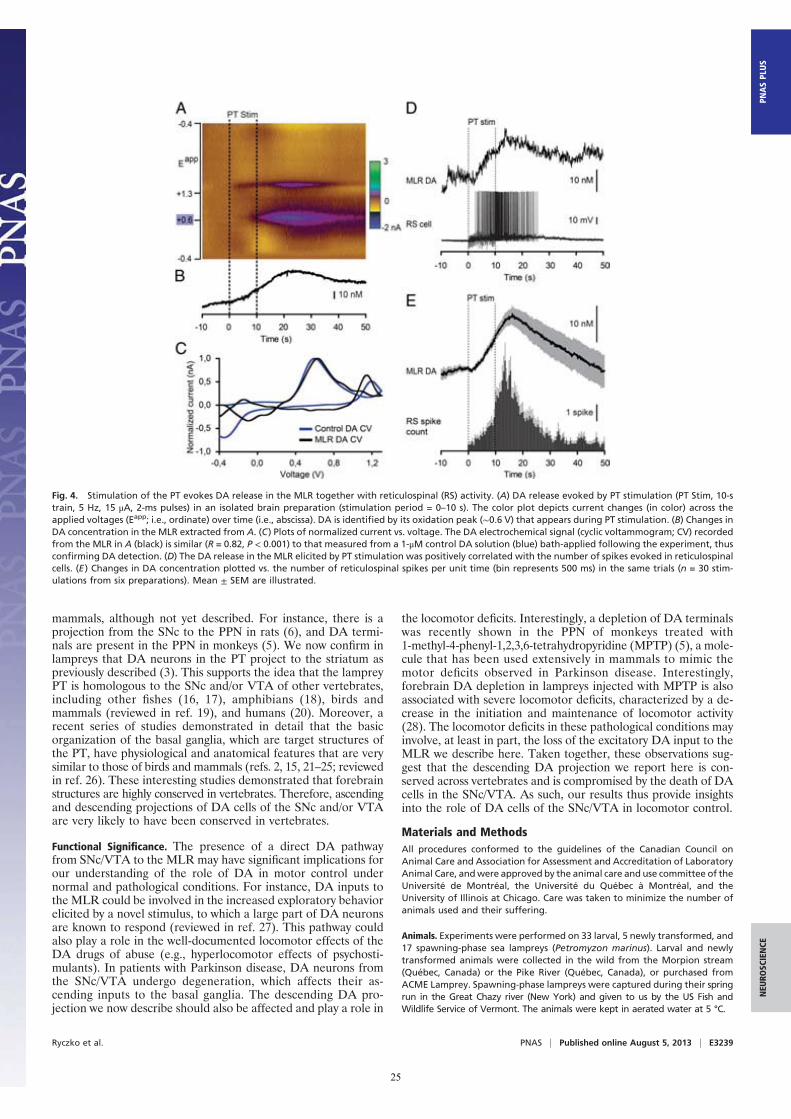
Stimulation of the PT Evokes DA Release in the MLR. Fast-scanningcyclic voltammetry (12) was used to measure changes in DAconcentration in the MLR while stimulating the PT (Fig. 4). Thelocation of the recording site was confirmed to be within theMLR (Fig. S2 J and K). A reticulospinal neuron was recordedintracellularly to monitor locomotor network activation. Trainsof stimuli (10-s train, 5 Hz, 14–25 μA, 2-ms pulses) in the PT(Fig. S2 G and I) elicited a large increase in DA concentration inthe MLR (n = 6 preparations; Fig. 4 A–C). We found a strongpositive correlation between the increase in DA concentration inthe MLR elicited by PT stimulation and the increase in thenumber of spikes per unit time in reticulospinal cells recordedduring the same trials (R = 0.91; P < 0.001; n = 30 stimulationsin six preparations; Fig. 4 D and E). DA release in the MLR wasalso evoked together with reticulospinal spiking activity whenchemically activating the PT with local microinjections of 60.5pmol of D-glutamate (5 mM, 10 pulses of 100 ms, 12.1 nL permicroinjection; n = 20 stimulations in four preparations; Fig.S3). These data demonstrate that PT activation results in DArelease in the MLR and suggest that DA release may contributeto locomotor output.
Blockade of the DA Inputs to the MLR Decreases Locomotor Output.We then tested whether DA had an effect on the locomotoroutput elicited by PT stimulation (10-s train, 5 Hz, 12–30 μA,2-ms pulses). Bath-applying DA (10 μM) onto the brain induceda 25% decrease in the PT stimulation intensity threshold re-quired to elicit locomotion in two of three semi-intact prepara-tions [reduction from 16 to 12 μA in both cases (Fig. S4 A–C); 20μA in the remaining preparation in which no effect was ob-served]. For PT stimulation intensities above locomotor thresh-old (16–30 μA), bath-applied DA increased locomotor boutduration (+86.8 ± 18.4%; P < 0.001 vs. control), the number oflocomotor cycles (+102.6 ± 23.8%; P < 0.001), and locomotorfrequency (+25.8 ± 9.1%; P < 0.01; pooled data from threepreparations, 18 bouts, and six intensities per preparation; Fig.S4 D–F). These effects were reduced after DA washout (P < 0.05or P < 0.001 vs. DA). Bath-applied DA also increased thenumber of reticulospinal spikes (+72.4 ± 17.9%; P < 0.001 vs.control) and the duration of spiking activity (+58.4 ± 14.7%; P <0.001 vs. control). These increases were also reversed after ap-proximately 1 h of DA washout (P < 0.01 vs. DA in both cases).Next, we determined that DA has a direct excitatory effect on
the MLR. Microinjections of 1.0 to 7.0 pmol of DA (5 mM, n =5–38 pulses of 20 ms, 0.2–1.4 nL per microinjection) in the MLR
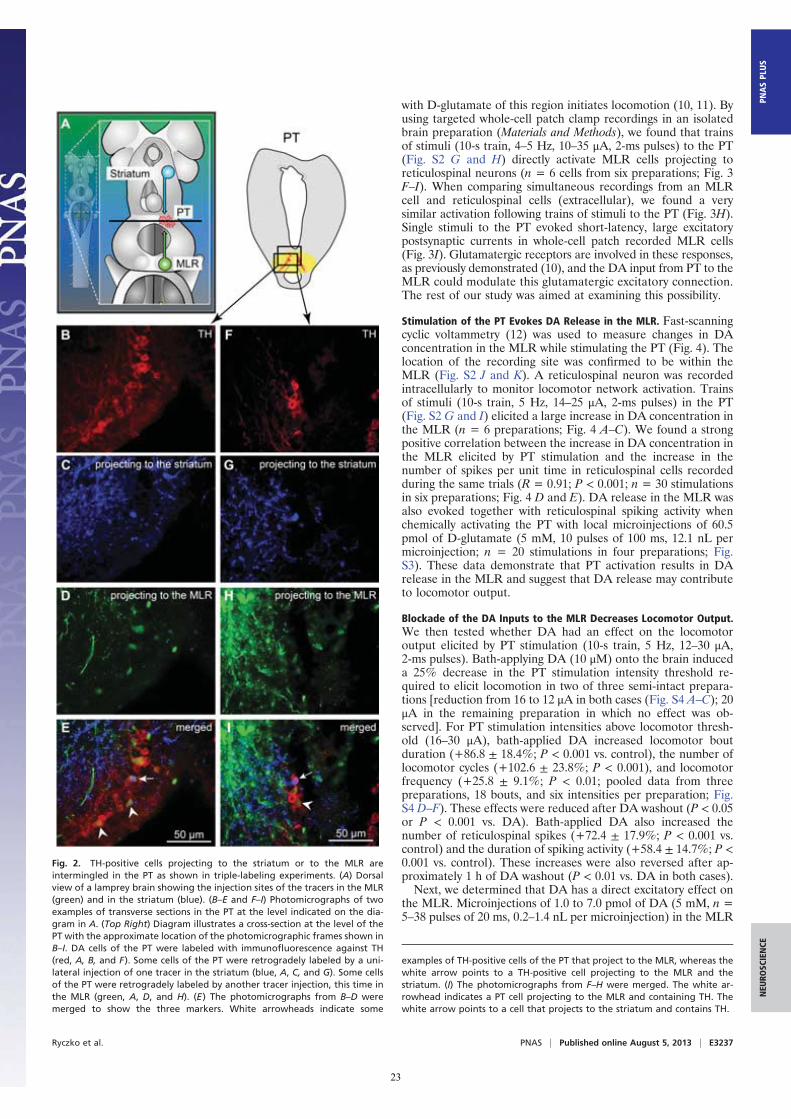
Fig. 2. TH-positive cells projecting to the striatum or to the MLR areintermingled in the PT as shown in triple-labeling experiments. (A) Dorsalview of a lamprey brain showing the injection sites of the tracers in the MLR(green) and in the striatum (blue). (B–E and F–I) Photomicrographs of twoexamples of transverse sections in the PT at the level indicated on the dia-gram in A. (Top Right) Diagram illustrates a cross-section at the level of thePT with the approximate location of the photomicrographic frames shown inB–I. DA cells of the PT were labeled with immunofluorescence against TH(red, A, B, and F). Some cells of the PT were retrogradely labeled by a uni-lateral injection of one tracer in the striatum (blue, A, C, and G). Some cellsof the PT were retrogradely labeled by another tracer injection, this time inthe MLR (green, A, D, and H). (E) The photomicrographs from B–D weremerged to show the three markers. White arrowheads indicate some
examples of TH-positive cells of the PT that project to the MLR, whereas thewhite arrow points to a TH-positive cell projecting to the MLR and thestriatum. (I) The photomicrographs from F–H were merged. The white ar-rowhead indicates a PT cell projecting to the MLR and containing TH. Thewhite arrow points to a cell that projects to the striatum and contains TH.
Ryczko et al. PNAS | Published online August 5, 2013 | E3237
NEU
ROSC
IENCE
PNASPL
US
23
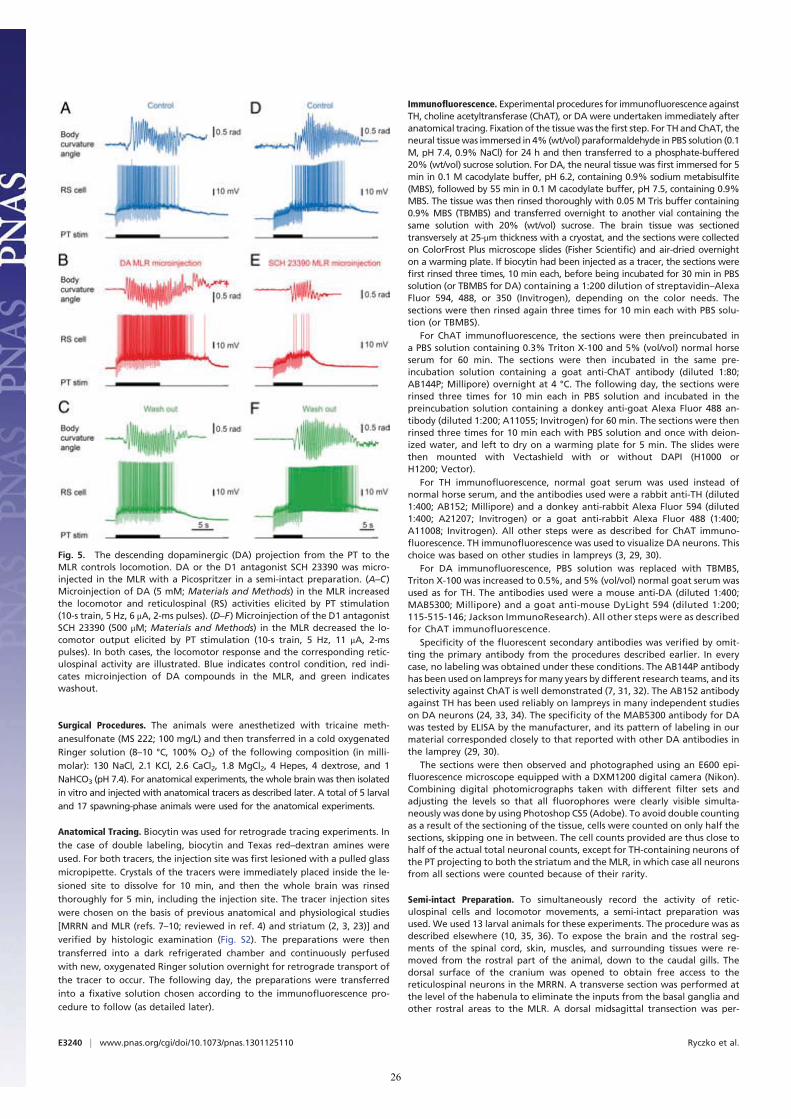
(as confirmed by histologic examination; Fig. S2 J and L) in-creased the locomotor output elicited by trains of electricalstimulation (10-s train, 5 Hz, 4–7 μA, 2-ms pulses) in the PT (Fig.3D) in a semi-intact preparation (n = 25 injections in fivepreparations; Fig. 5 A–C). DA microinjections prolonged thelocomotor bout duration (+56.7 ± 14.3%; P < 0.001) and in-creased the number of locomotor cycles (+50.8 ± 12.3%; P <0.001). These effects were reversed after DA washout (P < 0.05vs. injection in both cases; Fig. 5C). DA injections in the MLRalso increased the duration of reticulospinal cell spiking activity(+33.6 ± 11.8%; P < 0.01). This effect was reversed after ap-proximately 1 h of washout (P < 0.01; Fig. 5C). The effects onlocomotor threshold were not measured in these experiments.The excitatory effect of DA microinjections in the MLR waslower than that of bath-applied DA, probably because of thesingle site of action of DA during local microinjections. For in-stance, local DA microinjections in the MLR did not significantlymodify the locomotor frequency that remained at 95.2 ± 3.0% ofcontrol (P > 0.05), or the number of reticulospinal spikes thatremained at 119.5 ± 11.1% of control (P > 0.05).D1 receptor activation is known to have excitatory effects on
striatal cells in mammals (reviewed in ref. 13). Those receptorsare also present in lampreys (14, 15). Targeted blocking of D1receptors in the MLR (Fig. S2 J and L) dramatically decreasedthe locomotor output elicited by stimulation of the PT (10-s
train, 5 Hz, 7–11 μA, 2-ms pulses; Fig. 3D). Local microinjectionof 0.1 to 0.8 pmol of the D1 antagonist SCH 23390 (500 μM,6–43 pulses of 20 ms, 0.2–1.6 nL per microinjection) in the MLR(n = 25 injections in five preparations; Fig. 5 D–F) decreased theduration of locomotor bouts (−48.4 ± 10.6%; P < 0.001 vs.control), locomotor frequency (−32.2 ± 6.3%; P < 0.001), andthe number of locomotor cycles (−60.0 ± 9.9%; P < 0.001).These decreases in locomotor output were reversed after wash-out (for all parameters, P < 0.001 vs. injection; Fig. 5F). BlockingD1 receptors in the MLR also decreased the duration of spikingactivity in reticulospinal neurons (−43.8 ± 9.4%; P < 0.001 vs.control), their discharge frequency (−30.8 ± 9.9%; P < 0.01), andtheir number of spikes (−41.6 ± 11.9%; P < 0.001). Recovery wasobtained after approximately 1 h of washout (P < 0.05 or P <0.01 vs. injection; Fig. 5F).
DiscussionNewly Identified Descending DA Pathway. In this study, we provideevidence for a descending DA projection from the PT to theMLR that modulates motor output. This descending DA path-way supports DA release, which increases locomotor output, andD1 receptors are involved in this excitatory effect. It appears thatthis descending DA pathway amplifies the previously knownexcitatory glutamatergic inputs to MLR cells (10). Such adescending DA projection is also very likely to be present in
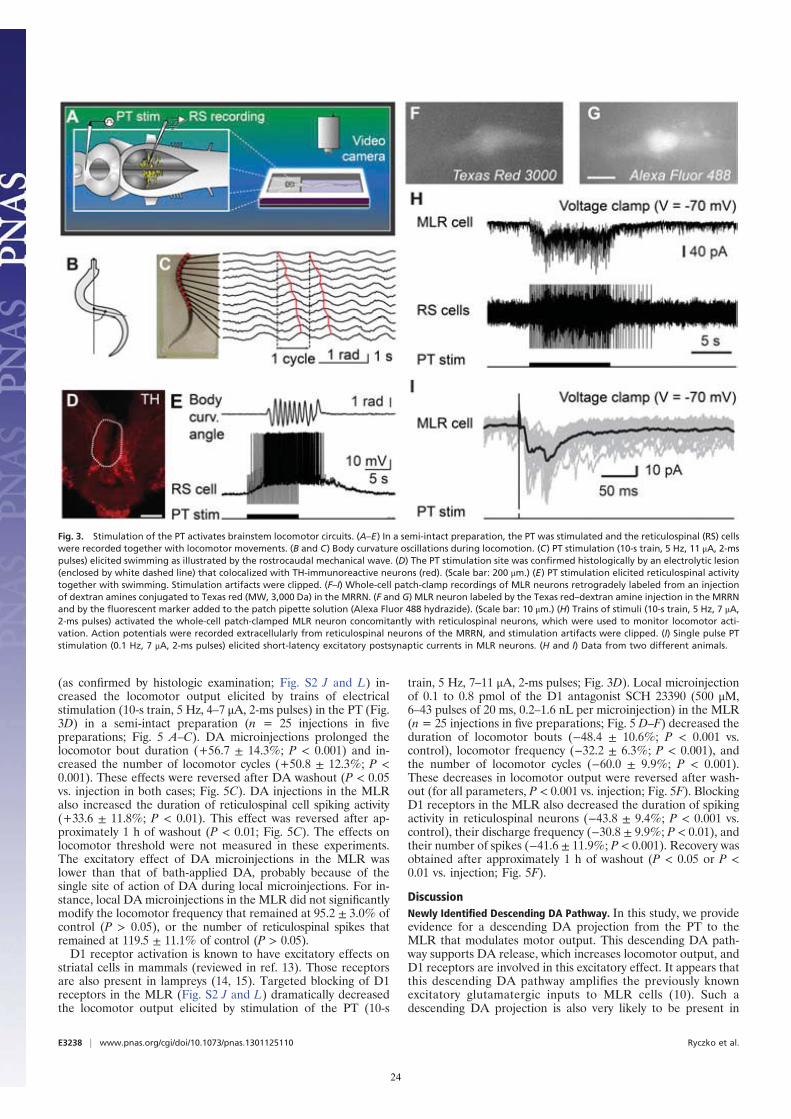
Fig. 3. Stimulation of the PT activates brainstem locomotor circuits. (A–E) In a semi-intact preparation, the PT was stimulated and the reticulospinal (RS) cellswere recorded together with locomotor movements. (B and C) Body curvature oscillations during locomotion. (C) PT stimulation (10-s train, 5 Hz, 11 μA, 2-mspulses) elicited swimming as illustrated by the rostrocaudal mechanical wave. (D) The PT stimulation site was confirmed histologically by an electrolytic lesion(enclosed by white dashed line) that colocalized with TH-immunoreactive neurons (red). (Scale bar: 200 μm.) (E) PT stimulation elicited reticulospinal activitytogether with swimming. Stimulation artifacts were clipped. (F–I) Whole-cell patch-clamp recordings of MLR neurons retrogradely labeled from an injectionof dextran amines conjugated to Texas red (MW, 3,000 Da) in the MRRN. (F and G) MLR neuron labeled by the Texas red–dextran amine injection in the MRRNand by the fluorescent marker added to the patch pipette solution (Alexa Fluor 488 hydrazide). (Scale bar: 10 μm.) (H) Trains of stimuli (10-s train, 5 Hz, 7 μA,2-ms pulses) activated the whole-cell patch-clamped MLR neuron concomitantly with reticulospinal neurons, which were used to monitor locomotor acti-vation. Action potentials were recorded extracellularly from reticulospinal neurons of the MRRN, and stimulation artifacts were clipped. (I) Single pulse PTstimulation (0.1 Hz, 7 μA, 2-ms pulses) elicited short-latency excitatory postsynaptic currents in MLR neurons. (H and I) Data from two different animals.
E3238 | www.pnas.org/cgi/doi/10.1073/pnas.1301125110 Ryczko et al.
24
mammals, although not yet described. For instance, there is aprojection from the SNc to the PPN in rats (6), and DA termi-nals are present in the PPN in monkeys (5). We now confirm inlampreys that DA neurons in the PT project to the striatum aspreviously described (3). This supports the idea that the lampreyPT is homologous to the SNc and/or VTA of other vertebrates,including other fishes (16, 17), amphibians (18), birds andmammals (reviewed in ref. 19), and humans (20). Moreover, arecent series of studies demonstrated in detail that the basicorganization of the basal ganglia, which are target structures ofthe PT, have physiological and anatomical features that are verysimilar to those of birds and mammals (refs. 2, 15, 21–25; reviewedin ref. 26). These interesting studies demonstrated that forebrainstructures are highly conserved in vertebrates. Therefore, ascendingand descending projections of DA cells of the SNc and/or VTAare very likely to have been conserved in vertebrates.
Functional Significance. The presence of a direct DA pathwayfrom SNc/VTA to the MLR may have significant implications forour understanding of the role of DA in motor control undernormal and pathological conditions. For instance, DA inputs tothe MLR could be involved in the increased exploratory behaviorelicited by a novel stimulus, to which a large part of DA neuronsare known to respond (reviewed in ref. 27). This pathway couldalso play a role in the well-documented locomotor effects of theDA drugs of abuse (e.g., hyperlocomotor effects of psychosti-mulants). In patients with Parkinson disease, DA neurons fromthe SNc/VTA undergo degeneration, which affects their as-cending inputs to the basal ganglia. The descending DA pro-jection we now describe should also be affected and play a role in
the locomotor deficits. Interestingly, a depletion of DA terminalswas recently shown in the PPN of monkeys treated with1-methyl-4-phenyl-1,2,3,6-tetrahydropyridine (MPTP) (5), a mole-cule that has been used extensively in mammals to mimic themotor deficits observed in Parkinson disease. Interestingly,forebrain DA depletion in lampreys injected with MPTP is alsoassociated with severe locomotor deficits, characterized by a de-crease in the initiation and maintenance of locomotor activity(28). The locomotor deficits in these pathological conditions mayinvolve, at least in part, the loss of the excitatory DA input to theMLR we describe here. Taken together, these observations sug-gest that the descending DA projection we report here is con-served across vertebrates and is compromised by the death of DAcells in the SNc/VTA. As such, our results thus provide insightsinto the role of DA cells of the SNc/VTA in locomotor control.
Materials and MethodsAll procedures conformed to the guidelines of the Canadian Council onAnimal Care and Association for Assessment and Accreditation of LaboratoryAnimal Care, andwere approved by the animal care and use committee of theUniversité de Montréal, the Université du Québec à Montréal, and theUniversity of Illinois at Chicago. Care was taken to minimize the number ofanimals used and their suffering.
Animals. Experiments were performed on 33 larval, 5 newly transformed, and17 spawning-phase sea lampreys (Petromyzon marinus). Larval and newlytransformed animals were collected in the wild from the Morpion stream(Québec, Canada) or the Pike River (Québec, Canada), or purchased fromACME Lamprey. Spawning-phase lampreys were captured during their springrun in the Great Chazy river (New York) and given to us by the US Fish andWildlife Service of Vermont. The animals were kept in aerated water at 5 °C.
Fig. 4. Stimulation of the PT evokes DA release in the MLR together with reticulospinal (RS) activity. (A) DA release evoked by PT stimulation (PT Stim, 10-strain, 5 Hz, 15 μA, 2-ms pulses) in an isolated brain preparation (stimulation period = 0–10 s). The color plot depicts current changes (in color) across theapplied voltages (Eapp; i.e., ordinate) over time (i.e., abscissa). DA is identified by its oxidation peak (∼0.6 V) that appears during PT stimulation. (B) Changes inDA concentration in the MLR extracted from A. (C) Plots of normalized current vs. voltage. The DA electrochemical signal (cyclic voltammogram; CV) recordedfrom the MLR in A (black) is similar (R = 0.82, P < 0.001) to that measured from a 1-μM control DA solution (blue) bath-applied following the experiment, thusconfirming DA detection. (D) The DA release in the MLR elicited by PT stimulation was positively correlated with the number of spikes evoked in reticulospinalcells. (E) Changes in DA concentration plotted vs. the number of reticulospinal spikes per unit time (bin represents 500 ms) in the same trials (n = 30 stim-ulations from six preparations). Mean ± SEM are illustrated.
Ryczko et al. PNAS | Published online August 5, 2013 | E3239
NEU
ROSC
IENCE
PNASPL
US
25
Surgical Procedures. The animals were anesthetized with tricaine meth-anesulfonate (MS 222; 100 mg/L) and then transferred in a cold oxygenatedRinger solution (8–10 °C, 100% O2) of the following composition (in milli-molar): 130 NaCl, 2.1 KCl, 2.6 CaCl2, 1.8 MgCl2, 4 Hepes, 4 dextrose, and 1NaHCO3 (pH 7.4). For anatomical experiments, the whole brain was then isolatedin vitro and injected with anatomical tracers as described later. A total of 5 larvaland 17 spawning-phase animals were used for the anatomical experiments.
Anatomical Tracing. Biocytin was used for retrograde tracing experiments. Inthe case of double labeling, biocytin and Texas red–dextran amines wereused. For both tracers, the injection site was first lesioned with a pulled glassmicropipette. Crystals of the tracers were immediately placed inside the le-sioned site to dissolve for 10 min, and then the whole brain was rinsedthoroughly for 5 min, including the injection site. The tracer injection siteswere chosen on the basis of previous anatomical and physiological studies[MRRN and MLR (refs. 7–10; reviewed in ref. 4) and striatum (2, 3, 23)] andverified by histologic examination (Fig. S2). The preparations were thentransferred into a dark refrigerated chamber and continuously perfusedwith new, oxygenated Ringer solution overnight for retrograde transport ofthe tracer to occur. The following day, the preparations were transferredinto a fixative solution chosen according to the immunofluorescence pro-cedure to follow (as detailed later).
Immunofluorescence. Experimental procedures for immunofluorescence againstTH, choline acetyltransferase (ChAT), or DA were undertaken immediately afteranatomical tracing. Fixation of the tissuewas thefirst step. For THand ChAT, theneural tissuewas immersed in 4% (wt/vol) paraformaldehyde in PBS solution (0.1M, pH 7.4, 0.9% NaCl) for 24 h and then transferred to a phosphate-buffered20% (wt/vol) sucrose solution. For DA, the neural tissue was first immersed for 5min in 0.1 M cacodylate buffer, pH 6.2, containing 0.9% sodium metabisulfite(MBS), followed by 55 min in 0.1 M cacodylate buffer, pH 7.5, containing 0.9%MBS. The tissue was then rinsed thoroughly with 0.05 M Tris buffer containing0.9% MBS (TBMBS) and transferred overnight to another vial containing thesame solution with 20% (wt/vol) sucrose. The brain tissue was sectionedtransversely at 25-μm thickness with a cryostat, and the sections were collectedon ColorFrost Plus microscope slides (Fisher Scientific) and air-dried overnighton a warming plate. If biocytin had been injected as a tracer, the sections werefirst rinsed three times, 10 min each, before being incubated for 30 min in PBSsolution (or TBMBS for DA) containing a 1:200 dilution of streptavidin–AlexaFluor 594, 488, or 350 (Invitrogen), depending on the color needs. Thesections were then rinsed again three times for 10 min each with PBS solu-tion (or TBMBS).
For ChAT immunofluorescence, the sections were then preincubated ina PBS solution containing 0.3% Triton X-100 and 5% (vol/vol) normal horseserum for 60 min. The sections were then incubated in the same pre-incubation solution containing a goat anti-ChAT antibody (diluted 1:80;AB144P; Millipore) overnight at 4 °C. The following day, the sections wererinsed three times for 10 min each in PBS solution and incubated in thepreincubation solution containing a donkey anti-goat Alexa Fluor 488 an-tibody (diluted 1:200; A11055; Invitrogen) for 60 min. The sections were thenrinsed three times for 10 min each with PBS solution and once with deion-ized water, and left to dry on a warming plate for 5 min. The slides werethen mounted with Vectashield with or without DAPI (H1000 orH1200; Vector).
For TH immunofluorescence, normal goat serum was used instead ofnormal horse serum, and the antibodies used were a rabbit anti-TH (diluted1:400; AB152; Millipore) and a donkey anti-rabbit Alexa Fluor 594 (diluted1:400; A21207; Invitrogen) or a goat anti-rabbit Alexa Fluor 488 (1:400;A11008; Invitrogen). All other steps were as described for ChAT immuno-fluorescence. TH immunofluorescence was used to visualize DA neurons. Thischoice was based on other studies in lampreys (3, 29, 30).
For DA immunofluorescence, PBS solution was replaced with TBMBS,Triton X-100 was increased to 0.5%, and 5% (vol/vol) normal goat serum wasused as for TH. The antibodies used were a mouse anti-DA (diluted 1:400;MAB5300; Millipore) and a goat anti-mouse DyLight 594 (diluted 1:200;115-515-146; Jackson ImmunoResearch). All other steps were as describedfor ChAT immunofluorescence.
Specificity of the fluorescent secondary antibodies was verified by omit-ting the primary antibody from the procedures described earlier. In everycase, no labeling was obtained under these conditions. The AB144P antibodyhas been used on lampreys formany years by different research teams, and itsselectivity against ChAT is well demonstrated (7, 31, 32). The AB152 antibodyagainst TH has been used reliably on lampreys in many independent studieson DA neurons (24, 33, 34). The specificity of the MAB5300 antibody for DAwas tested by ELISA by the manufacturer, and its pattern of labeling in ourmaterial corresponded closely to that reported with other DA antibodies inthe lamprey (29, 30).
The sections were then observed and photographed using an E600 epi-fluorescence microscope equipped with a DXM1200 digital camera (Nikon).Combining digital photomicrographs taken with different filter sets andadjusting the levels so that all fluorophores were clearly visible simulta-neously was done by using Photoshop CS5 (Adobe). To avoid double countingas a result of the sectioning of the tissue, cells were counted on only half thesections, skipping one in between. The cell counts provided are thus close tohalf of the actual total neuronal counts, except for TH-containing neurons ofthe PT projecting to both the striatum and the MLR, in which case all neuronsfrom all sections were counted because of their rarity.
Semi-intact Preparation. To simultaneously record the activity of retic-ulospinal cells and locomotor movements, a semi-intact preparation wasused. We used 13 larval animals for these experiments. The procedure was asdescribed elsewhere (10, 35, 36). To expose the brain and the rostral seg-ments of the spinal cord, skin, muscles, and surrounding tissues were re-moved from the rostral part of the animal, down to the caudal gills. Thedorsal surface of the cranium was opened to obtain free access to thereticulospinal neurons in the MRRN. A transverse section was performed atthe level of the habenula to eliminate the inputs from the basal ganglia andother rostral areas to the MLR. A dorsal midsagittal transection was per-
Fig. 5. The descending dopaminergic (DA) projection from the PT to theMLR controls locomotion. DA or the D1 antagonist SCH 23390 was micro-injected in the MLR with a Picospritzer in a semi-intact preparation. (A–C)Microinjection of DA (5 mM; Materials and Methods) in the MLR increasedthe locomotor and reticulospinal (RS) activities elicited by PT stimulation(10-s train, 5 Hz, 6 μA, 2-ms pulses). (D–F) Microinjection of the D1 antagonistSCH 23390 (500 μM; Materials and Methods) in the MLR decreased the lo-comotor output elicited by PT stimulation (10-s train, 5 Hz, 11 μA, 2-mspulses). In both cases, the locomotor response and the corresponding retic-ulospinal activity are illustrated. Blue indicates control condition, red indi-cates microinjection of DA compounds in the MLR, and green indicateswashout.
E3240 | www.pnas.org/cgi/doi/10.1073/pnas.1301125110 Ryczko et al.
26
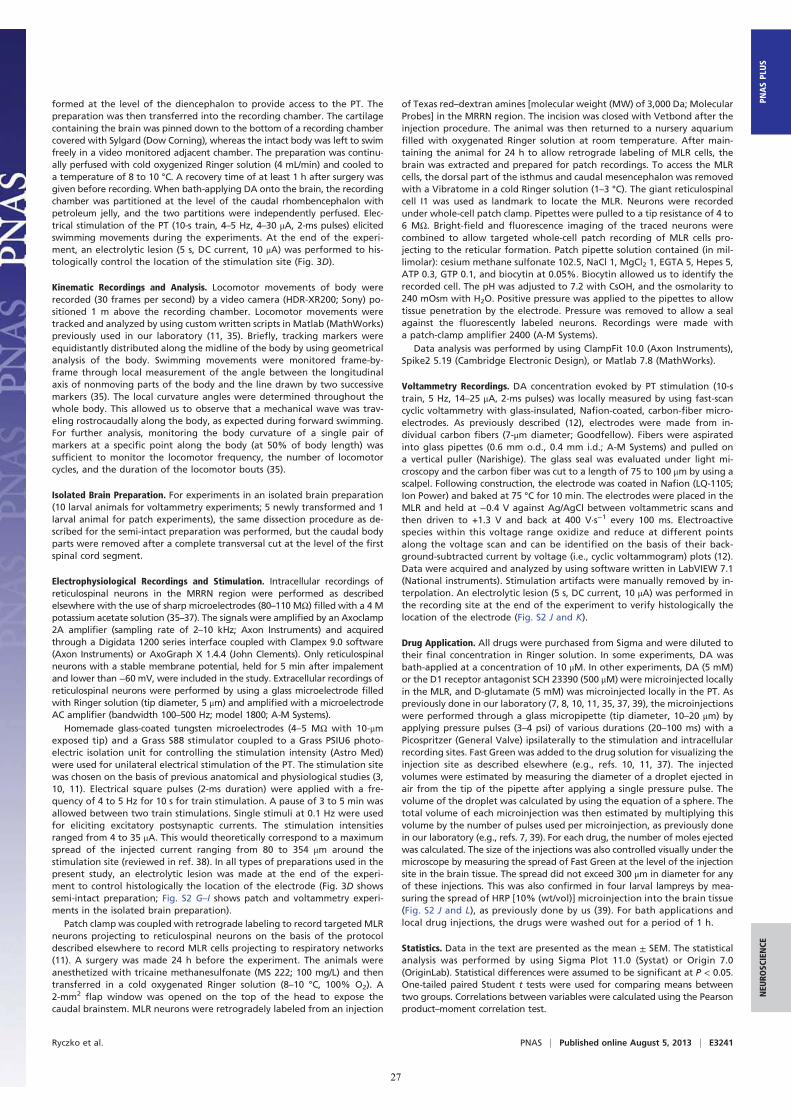
formed at the level of the diencephalon to provide access to the PT. Thepreparation was then transferred into the recording chamber. The cartilagecontaining the brain was pinned down to the bottom of a recording chambercovered with Sylgard (Dow Corning), whereas the intact body was left to swimfreely in a video monitored adjacent chamber. The preparation was continu-ally perfused with cold oxygenized Ringer solution (4 mL/min) and cooled toa temperature of 8 to 10 °C. A recovery time of at least 1 h after surgery wasgiven before recording. When bath-applying DA onto the brain, the recordingchamber was partitioned at the level of the caudal rhombencephalon withpetroleum jelly, and the two partitions were independently perfused. Elec-trical stimulation of the PT (10-s train, 4–5 Hz, 4–30 μA, 2-ms pulses) elicitedswimming movements during the experiments. At the end of the experi-ment, an electrolytic lesion (5 s, DC current, 10 μA) was performed to his-tologically control the location of the stimulation site (Fig. 3D).
Kinematic Recordings and Analysis. Locomotor movements of body wererecorded (30 frames per second) by a video camera (HDR-XR200; Sony) po-sitioned 1 m above the recording chamber. Locomotor movements weretracked and analyzed by using custom written scripts in Matlab (MathWorks)previously used in our laboratory (11, 35). Briefly, tracking markers wereequidistantly distributed along the midline of the body by using geometricalanalysis of the body. Swimming movements were monitored frame-by-frame through local measurement of the angle between the longitudinalaxis of nonmoving parts of the body and the line drawn by two successivemarkers (35). The local curvature angles were determined throughout thewhole body. This allowed us to observe that a mechanical wave was trav-eling rostrocaudally along the body, as expected during forward swimming.For further analysis, monitoring the body curvature of a single pair ofmarkers at a specific point along the body (at 50% of body length) wassufficient to monitor the locomotor frequency, the number of locomotorcycles, and the duration of the locomotor bouts (35).
Isolated Brain Preparation. For experiments in an isolated brain preparation(10 larval animals for voltammetry experiments; 5 newly transformed and 1larval animal for patch experiments), the same dissection procedure as de-scribed for the semi-intact preparation was performed, but the caudal bodyparts were removed after a complete transversal cut at the level of the firstspinal cord segment.
Electrophysiological Recordings and Stimulation. Intracellular recordings ofreticulospinal neurons in the MRRN region were performed as describedelsewhere with the use of sharp microelectrodes (80–110 MΩ) filled with a 4 Mpotassium acetate solution (35–37). The signals were amplified by an Axoclamp2A amplifier (sampling rate of 2–10 kHz; Axon Instruments) and acquiredthrough a Digidata 1200 series interface coupled with Clampex 9.0 software(Axon Instruments) or AxoGraph X 1.4.4 (John Clements). Only reticulospinalneurons with a stable membrane potential, held for 5 min after impalementand lower than −60 mV, were included in the study. Extracellular recordings ofreticulospinal neurons were performed by using a glass microelectrode filledwith Ringer solution (tip diameter, 5 μm) and amplified with a microelectrodeAC amplifier (bandwidth 100–500 Hz; model 1800; A-M Systems).
Homemade glass-coated tungsten microelectrodes (4–5 MΩ with 10-μmexposed tip) and a Grass S88 stimulator coupled to a Grass PSIU6 photo-electric isolation unit for controlling the stimulation intensity (Astro Med)were used for unilateral electrical stimulation of the PT. The stimulation sitewas chosen on the basis of previous anatomical and physiological studies (3,10, 11). Electrical square pulses (2-ms duration) were applied with a fre-quency of 4 to 5 Hz for 10 s for train stimulation. A pause of 3 to 5 min wasallowed between two train stimulations. Single stimuli at 0.1 Hz were usedfor eliciting excitatory postsynaptic currents. The stimulation intensitiesranged from 4 to 35 μA. This would theoretically correspond to a maximumspread of the injected current ranging from 80 to 354 μm around thestimulation site (reviewed in ref. 38). In all types of preparations used in thepresent study, an electrolytic lesion was made at the end of the experi-ment to control histologically the location of the electrode (Fig. 3D showssemi-intact preparation; Fig. S2 G–I shows patch and voltammetry experi-ments in the isolated brain preparation).
Patch clamp was coupled with retrograde labeling to record targeted MLRneurons projecting to reticulospinal neurons on the basis of the protocoldescribed elsewhere to record MLR cells projecting to respiratory networks(11). A surgery was made 24 h before the experiment. The animals wereanesthetized with tricaine methanesulfonate (MS 222; 100 mg/L) and thentransferred in a cold oxygenated Ringer solution (8–10 °C, 100% O2). A2-mm2
flap window was opened on the top of the head to expose thecaudal brainstem. MLR neurons were retrogradely labeled from an injection
of Texas red–dextran amines [molecular weight (MW) of 3,000 Da; MolecularProbes] in the MRRN region. The incision was closed with Vetbond after theinjection procedure. The animal was then returned to a nursery aquariumfilled with oxygenated Ringer solution at room temperature. After main-taining the animal for 24 h to allow retrograde labeling of MLR cells, thebrain was extracted and prepared for patch recordings. To access the MLRcells, the dorsal part of the isthmus and caudal mesencephalon was removedwith a Vibratome in a cold Ringer solution (1–3 °C). The giant reticulospinalcell I1 was used as landmark to locate the MLR. Neurons were recordedunder whole-cell patch clamp. Pipettes were pulled to a tip resistance of 4 to6 MΩ. Bright-field and fluorescence imaging of the traced neurons werecombined to allow targeted whole-cell patch recording of MLR cells pro-jecting to the reticular formation. Patch pipette solution contained (in mil-limolar): cesium methane sulfonate 102.5, NaCl 1, MgCl2 1, EGTA 5, Hepes 5,ATP 0.3, GTP 0.1, and biocytin at 0.05%. Biocytin allowed us to identify therecorded cell. The pH was adjusted to 7.2 with CsOH, and the osmolarity to240 mOsm with H2O. Positive pressure was applied to the pipettes to allowtissue penetration by the electrode. Pressure was removed to allow a sealagainst the fluorescently labeled neurons. Recordings were made witha patch-clamp amplifier 2400 (A-M Systems).
Data analysis was performed by using ClampFit 10.0 (Axon Instruments),Spike2 5.19 (Cambridge Electronic Design), or Matlab 7.8 (MathWorks).
Voltammetry Recordings. DA concentration evoked by PT stimulation (10-strain, 5 Hz, 14–25 μA, 2-ms pulses) was locally measured by using fast-scancyclic voltammetry with glass-insulated, Nafion-coated, carbon-fiber micro-electrodes. As previously described (12), electrodes were made from in-dividual carbon fibers (7-μm diameter; Goodfellow). Fibers were aspiratedinto glass pipettes (0.6 mm o.d., 0.4 mm i.d.; A-M Systems) and pulled ona vertical puller (Narishige). The glass seal was evaluated under light mi-croscopy and the carbon fiber was cut to a length of 75 to 100 μm by using ascalpel. Following construction, the electrode was coated in Nafion (LQ-1105;Ion Power) and baked at 75 °C for 10 min. The electrodes were placed in theMLR and held at −0.4 V against Ag/AgCl between voltammetric scans andthen driven to +1.3 V and back at 400 V·s−1 every 100 ms. Electroactivespecies within this voltage range oxidize and reduce at different pointsalong the voltage scan and can be identified on the basis of their back-ground-subtracted current by voltage (i.e., cyclic voltammogram) plots (12).Data were acquired and analyzed by using software written in LabVIEW 7.1(National instruments). Stimulation artifacts were manually removed by in-terpolation. An electrolytic lesion (5 s, DC current, 10 μA) was performed inthe recording site at the end of the experiment to verify histologically thelocation of the electrode (Fig. S2 J and K).
Drug Application. All drugs were purchased from Sigma and were diluted totheir final concentration in Ringer solution. In some experiments, DA wasbath-applied at a concentration of 10 μM. In other experiments, DA (5 mM)or the D1 receptor antagonist SCH 23390 (500 μM) were microinjected locallyin the MLR, and D-glutamate (5 mM) was microinjected locally in the PT. Aspreviously done in our laboratory (7, 8, 10, 11, 35, 37, 39), the microinjectionswere performed through a glass micropipette (tip diameter, 10–20 μm) byapplying pressure pulses (3–4 psi) of various durations (20–100 ms) with aPicospritzer (General Valve) ipsilaterally to the stimulation and intracellularrecording sites. Fast Green was added to the drug solution for visualizing theinjection site as described elsewhere (e.g., refs. 10, 11, 37). The injectedvolumes were estimated by measuring the diameter of a droplet ejected inair from the tip of the pipette after applying a single pressure pulse. Thevolume of the droplet was calculated by using the equation of a sphere. Thetotal volume of each microinjection was then estimated by multiplying thisvolume by the number of pulses used per microinjection, as previously donein our laboratory (e.g., refs. 7, 39). For each drug, the number of moles ejectedwas calculated. The size of the injections was also controlled visually under themicroscope by measuring the spread of Fast Green at the level of the injectionsite in the brain tissue. The spread did not exceed 300 μm in diameter for anyof these injections. This was also confirmed in four larval lampreys by mea-suring the spread of HRP [10% (wt/vol)] microinjection into the brain tissue(Fig. S2 J and L), as previously done by us (39). For bath applications andlocal drug injections, the drugs were washed out for a period of 1 h.
Statistics. Data in the text are presented as the mean ± SEM. The statisticalanalysis was performed by using Sigma Plot 11.0 (Systat) or Origin 7.0(OriginLab). Statistical differences were assumed to be significant at P < 0.05.One-tailed paired Student t tests were used for comparing means betweentwo groups. Correlations between variables were calculated using the Pearsonproduct–moment correlation test.
Ryczko et al. PNAS | Published online August 5, 2013 | E3241
NEU
ROSC
IENCE
PNASPL
US
27
ACKNOWLEDGMENTS. We thank Danielle Veilleux for technical assistance,Jean-François Gariépy for help with some of the experiments, and FrédéricBernard for help with graphics. This work was supported by Canadian Insti-tutes of Health Research Grants 15129 and 15176 (to R.D.), Parkinson SocietyCanada Grant 2011-11 (to R.D.), Fonds de la Recherche en Santé du Québec
Groupe de Recherche sur le Système Nerveux Central (GRSNC) Grant 5249,Natural Sciences and Engineering Research Council of Canada Grant 217435(to R.D.), National Institutes of Health Grant R01 MH 084874 (to S.A); Fondsde la Recherche en Santé du Québec fellowships (to D.R.); and a GRSNCJasper Fellowship (to D.R.).
1. Kravitz AV, et al. (2010) Regulation of parkinsonian motor behaviours by optogeneticcontrol of basal ganglia circuitry. Nature 466(7306):622–626.
2. Stephenson-Jones M, Samuelsson E, Ericsson J, Robertson B, Grillner S (2011) Evolutionaryconservation of the basal ganglia as a common vertebratemechanism for action selection.Curr Biol 21(13):1081–1091.
3. Pombal MA, El Manira A, Grillner S (1997) Afferents of the lamprey striatum with specialreference to the dopaminergic system: A combined tracing and immunohistochemicalstudy. J Comp Neurol 386(1):71–91.
4. Le Ray D, Juvin L, Ryczko D, Dubuc R (2011) Chapter 4—supraspinal control oflocomotion: The mesencephalic locomotor region. Prog Brain Res 188:51–70.
5. Rolland AS, et al. (2009) Evidence for a dopaminergic innervation of the pedunculopontinenucleus in monkeys, and its drastic reduction after MPTP intoxication. J Neurochem 110(4):1321–1329.
6. Beckstead RM, Domesick VB, Nauta WJ (1979) Efferent connections of the substantianigra and ventral tegmental area in the rat. Brain Res 175(2):191–217.
7. Le Ray D, et al. (2003) Nicotinic activation of reticulospinal cells involved in the controlof swimming in lampreys. Eur J Neurosci 17(1):137–148.
8. Smetana R, Juvin L, Dubuc R, Alford S (2010) A parallel cholinergic brainstem pathwayfor enhancing locomotor drive. Nat Neurosci 13(6):731–738.
9. Ménard A, Auclair F, Bourcier-Lucas C, Grillner S, Dubuc R (2007) Descending GABAergicprojections to the mesencephalic locomotor region in the lamprey Petromyzon marinus.J Comp Neurol 501(2):260–273.
10. Derjean D, et al. (2010) A novel neural substrate for the transformation of olfactoryinputs into motor output. PLoS Biol 8(12):e1000567.
11. Gariépy JF, et al. (2012) Specific neural substrate linking respiration to locomotion.Proc Natl Acad Sci USA 109(2):E84–E92.
12. Roitman MF, Wheeler RA, Wightman RM, Carelli RM (2008) Real-time chemicalresponses in the nucleus accumbens differentiate rewarding and aversive stimuli. NatNeurosci 11(12):1376–1377.
13. Surmeier DJ, Ding J, Day M, Wang Z, Shen W (2007) D1 and D2 dopamine-receptormodulation of striatal glutamatergic signaling in striatal medium spiny neurons.Trends Neurosci 30(5):228–235.
14. Le Crom S, Kapsimali M, Barôme PO, Vernier P (2003) Dopamine receptors for everyspecies: Gene duplications and functional diversification in Craniates. J Struct FunctGenomics 3(1-4):161–176.
15. Ericsson J, et al. (2013) Dopamine differentially modulates the excitability of striatalneurons of the direct and indirect pathways in lamprey. J Neurosci 33(18):8045–8054.
16. Blin M, Norton W, Bally-Cuif L, Vernier P (2008) NR4A2 controls the differentiationof selective dopaminergic nuclei in the zebrafish brain. Mol Cell Neurosci 39(4):592–604.
17. Rink E, Wullimann MF (2001) The teleostean (zebrafish) dopaminergic system ascendingto the subpallium (striatum) is located in the basal diencephalon (posterior tuberculum).Brain Res 889(1-2):316–330.
18. Marín O, Smeets WJ, González A (1997) Basal ganglia organization in amphibians:Catecholaminergic innervation of the striatum and the nucleus accumbens. J CompNeurol 378(1):50–69.
19. Yamamoto K, Vernier P (2011) The evolution of dopamine systems in chordates. FrontNeuroanat 5:21.
20. Puelles L, Verney C (1998) Early neuromeric distribution of tyrosine-hydroxylase-immunoreactive neurons in human embryos. J Comp Neurol 394(3):283–308.
21. Ericsson J, Silberberg G, Robertson B, Wikström MA, Grillner S (2011) Striatal cellularproperties conserved from lampreys to mammals. J Physiol 589(pt 12):2979–2992.
22. Ericsson J, et al. (2013) Evolutionarily conserved differences in pallial and thalamicshort-term synaptic plasticity in striatum. J Physiol 591(pt 4):859–874.
23. Pombal MA, El Manira A, Grillner S (1997) Organization of the lamprey striatum -transmitters and projections. Brain Res 766(1-2):249–254.
24. Robertson B, et al. (2012) The dopamine D2 receptor gene in lamprey, its expressionin the striatum and cellular effects of D2 receptor activation. PLoS ONE 7(4):e35642.
25. Stephenson-Jones M, Ericsson J, Robertson B, Grillner S (2012) Evolution of the basalganglia: Dual-output pathways conserved throughout vertebrate phylogeny. J CompNeurol 520(13):2957–2973.
26. Grillner S, Robertson B, Stephenson-Jones M (2013) The evolutionary origin of thevertebrate basal ganglia and its role in action-selection. J Physiol 2013(Feb):25.
27. Schultz W, Dayan P, Montague PR (1997) A neural substrate of prediction and reward.Science 275(5306):1593–1599.
28. Thompson RH, Ménard A, Pombal M, Grillner S (2008) Forebrain dopamine depletionimpairs motor behavior in lamprey. Eur J Neurosci 27(6):1452–1460.
29. Abalo XM, Villar-Cheda B, Anadón R, Rodicio MC (2005) Development of thedopamine-immunoreactive system in the central nervous system of the sea lamprey.Brain Res Bull 66(4-6):560–564.
30. Pierre J, Mahouche M, Suderevskaya EI, Repérant J, Ward R (1997) Immunocytochemicallocalization of dopamine and its synthetic enzymes in the central nervous system of thelamprey Lampetra fluviatilis. J Comp Neurol 380(1):119–135.
31. Pombal MA, Marín O, González A (2001) Distribution of choline acetyltransferase-immunoreactive structures in the lamprey brain. J Comp Neurol 431(1):105–126.
32. Quinlan KA, Buchanan JT (2008) Cellular and synaptic actions of acetylcholine in thelamprey spinal cord. J Neurophysiol 100(2):1020–1031.
33. Villar-Cerviño V, et al. (2006) Presence of glutamate, glycine, and gamma-aminobutyricacid in the retina of the larval sea lamprey: Comparative immunohistochemical study ofclassical neurotransmitters in larval and postmetamorphic retinas. J Comp Neurol 499(5):810–827.
34. Barreiro-Iglesias A, Villar-Cerviño V, Villar-Cheda B, Anadón R, Rodicio MC (2008)Neurochemical characterization of sea lamprey taste buds and afferent gustatoryfibers: Presence of serotonin, calretinin, and CGRP immunoreactivity in taste bud bi-ciliated cells of the earliest vertebrates. J Comp Neurol 511(4):438–453.
35. Brocard F, et al. (2010) The transformation of a unilateral locomotor command intoa symmetrical bilateral activation in the brainstem. J Neurosci 30(2):523–533.
36. Sirota MG, Di Prisco GV, Dubuc R (2000) Stimulation of the mesencephalic locomotorregion elicits controlled swimming in semi-intact lampreys. Eur J Neurosci 12(11):4081–4092.
37. Brocard F, Dubuc R (2003) Differential contribution of reticulospinal cells to the controlof locomotion induced by the mesencephalic locomotor region. J Neurophysiol 90(3):1714–1727.
38. Ranck JB, Jr. (1975) Which elements are excited in electrical stimulation of mammaliancentral nervous system: a review. Brain Res 98(3):417–440.
39. Brocard F, Bardy C, Dubuc R (2005) Modulatory effect of substance P to the brain stemlocomotor command in lampreys. J Neurophysiol 93(4):2127–2141.
E3242 | www.pnas.org/cgi/doi/10.1073/pnas.1301125110 Ryczko et al.
28
5.2. Nigral glutamatergic neurons control the speed of locomotion
Ryczko, D., Grätsch, S., Schläger, L., Keuyalian, A., Boukhatem, Z., Garcia, C., Auclair, F., Büschges, A.,
and Dubuc, R.
Published 2017 in Journal of Neuroscience, 37(40):9759-9770.
Author contributions
Designed research:
Dimitri Ryczko, Swantje Grätsch, François Auclair, and Réjean Dubuc.
Performed research:
Dimitri Ryczko, Swantje Grätsch, Laura Schläger, Avo Keuyalian, Zakaria Boukhatem, Claudia Garcia, and
François Auclair.
Analyzed data:
Dimitri Ryczko, Swantje Grätsch, Laura Schläger, Avo Keuyalian, Zakaria Boukhatem, Claudia Garcia,
François Auclair, and Réjean Dubuc.
Wrote the paper:
Dimitri Ryczko, Ansgar Büschges, and Réjean Dubuc.
This paper was reproduced with the permission from the publisher.
29
Systems/Circuits
Nigral Glutamatergic Neurons Control the Speed of Locomotion
Dimitri Ryczko,1,2 Swantje Gratsch,1,3 Laura Schlager,1 Avo Keuyalian,1 Zakaria Boukhatem,1 Claudia Garcia,1
Francois Auclair,1 Ansgar Buschges,3 and Rejean Dubuc1,4
1Groupe de Recherche sur le Systeme Nerveux Central, Departement de Neurosciences, Universite de Montreal, Montreal, Quebec H3C 3J7, Canada,2Departement de Pharmacologie-Physiologie, Universite de Sherbrooke, Sherbrooke, Quebec J1H 5N4, Canada,3Department of Animal Physiology,Biocenter Cologne, University of Cologne, 50674 Cologne, Germany, and 4Groupe de Recherche en Activite Physique Adaptee, Departement des Sciences del’Activite Physique, Universite du Quebec a Montreal, Montreal, Quebec, H3C 3P8, Canada
The mesencephalic locomotor region (MLR) plays a crucial role in locomotor control. In vertebrates, stimulation of the MLR at increasingintensities elicits locomotion of growing speed. This effect has been presumed to result from higher brain inputs activating the MLR likea dimmer switch. Here, we show in lampreys (Petromyzon marinus) of either sex that incremental stimulation of a region homologous tothe mammalian substantia nigra pars compacta (SNc) evokes increasing activation of MLR cells with a graded increase in the frequencyof locomotor movements. Neurons co-storing glutamate and dopamine were found to project from the primal SNc to the MLR. Blockadeof glutamatergic transmission largely diminished MLR cell responses and locomotion. Local blockade of D1 receptors in the MLRdecreased locomotor frequency, but did not disrupt the SNc-evoked graded control of locomotion. Our findings revealed the presence ofa glutamatergic input to the MLR originating from the primal SNc that evokes graded locomotor movements.
Key words: dopamine; glutamate; lamprey; locomotion; mesencephalic locomotor region; substantia nigra pars compacta
IntroductionIn the brainstem, the mesencephalic locomotor region (MLR)plays a crucial role in locomotor control. First discovered in catsby a Russian team (Shik et al., 1966), the MLR was found in allvertebrates tested afterward (lamprey: Sirota et al., 2000; sala-
mander: Cabelguen et al., 2003; stingray: Bernau et al., 1991; bird:Sholomenko et al., 1991; rat: Garcia-Rill et al., 1987; mouse: Leeet al., 2014; Roseberry et al., 2016; rabbit: Musienko et al., 2008;guinea-pig: Marlinsky and Voitenko, 1991; monkey: Eidelberg etal., 1981; Karachi et al., 2010; Goetz et al., 2016). The MLR proj-ects downward to reticulospinal neurons, which activate the spi-nal locomotor networks (cat: Orlovskiı, 1970; Steeves and Jordan,1980; Garcia-Rill and Skinner, 1987a,b; Noga et al., 1991; Mus-ienko et al., 2012; rat: Bachmann et al., 2013; bird: Sholomenko etal., 1991; lamprey: Buchanan and Grillner, 1987; Brocard et al.,2010; mouse: Bretzner and Brownstone, 2013; salamander: Ryc-zko et al., 2016a). One salient feature of the MLR lies in its abilityto finely control locomotor output. Increasing MLR stimulationintensity produces a growing activation of reticulospinal cells anda progressive increase in the speed of locomotor movements.
Since the discovery of the MLR (Shik et al., 1966), it waspresumed that the MLR is activated incrementally (i.e., like adimmer switch) by higher brain regions, but the source of therheostat-like inputs remained unknown. The MLR receives pro-jections from the cortex, basal ganglia, periaqueductal gray, lat-
Received June 28, 2017; revised Aug. 8, 2017; accepted Aug. 26, 2017.
Author contributions: D.R., S.G., F.A., and R.D. designed research; D.R., S.G., L.S., A.K., Z.B., C.G., and F.A. per-
formed research; D.R., S.G., L.S., A.K., Z.B., C.G., F.A., A.B., and R.D. analyzed data; D.R., A.B., and R.D. wrote the
paper.
This work was supported by the Canadian Institutes of Health Research (15129); the Fonds de la Recherche en
Sante du Quebec (Groupe de Recherche sur le Systeme Nerveux Central, GRSNC, 5249); the Natural Sciences and
Engineering Research Council of Canada Grant 217435 (R.D.); the Great Lakes Fishery Commission Grants 54011 and
54021 (R.D.); fellowships from the Fonds de la Recherche en Sante du Quebec (D.R.) and the GRSNC Jasper fellowship
(D.R.); and scholarships from the University of Cologne and the German Academic Exchange Service (S.G.). We thank
Arlette Kolta for providing access to her electrophysiology setup for some experiments, Danielle Veilleux for her
technical assistance, and Frederic Bernard for his help with the graphics.
The authors declare no competing financial interests.
Correspondence should be addressed to Dr. Rejean Dubuc, Groupe de Recherche en Activite Physique Adaptee,
Departement des Sciences de l’Activite Physique, Universite du Quebec a Montreal, C.P. 8888, Section Centre-ville,
Montreal, QC H3C 3P8, Canada. E-mail: [email protected].
DOI:10.1523/JNEUROSCI.1810-17.2017
Copyright © 2017 the authors 0270-6474/17/379759-12$15.00/0
Significance Statement
The mesencephalic locomotor region (MLR) plays a crucial role in the control of locomotion. It projects downward to reticulospi-nal neurons that in turn activate the spinal locomotor networks. Increasing the intensity of MLR stimulation produces a growingactivation of reticulospinal cells and a progressive increase in the speed of locomotor movements. Since the discovery of the MLRsome 50 years ago, it has been presumed that higher brain regions activate the MLR in a graded fashion, but this has not beenconfirmed yet. Here, using a combination of techniques from cell to behavior, we provide evidence of a new glutamatergic pathwayactivating the MLR in a graded fashion, and consequently evoking a progressive increase in locomotor output.
The Journal of Neuroscience, October 4, 2017 • 37(40):9759 –9770 • 9759
30
eral hypothalamus (for review, see Ryczko and Dubuc, 2013), andfrom dopamine neurons of the substantia nigra pars compacta(SNc; Ryczko et al., 2013, 2016b). The physiological role of thesedifferent inputs to the MLR is not fully understood. The tonicinhibition sent by the output stations of the basal ganglia (lam-prey: Stephenson-Jones et al., 2011, 2012; Menard et al., 2007; cat:Takakusaki et al., 2003; mouse: Kravitz et al., 2010; Roseberry etal., 2016) is considered to be involved in action selection andtherefore locomotion initiation or suppression, rather than finecontrol of locomotion (Albin et al., 1989; Redgrave et al., 1999;Grillner et al., 2013; Grillner and Robertson, 2016). The lampreyhomolog of the mammalian motor cortex (i.e., pallium) wasshown to elicit reticulospinal responses and locomotion (Ocanaet al., 2015), but its contribution to the graded control of MLRactivity and locomotion is unknown.
So far, only one source of input to the MLR called the poste-rior tuberculum (PT) was characterized physiologically. Thisdiencephalic region, which is considered homologous to themammalian SNc (Pombal et al., 1997; Stephenson-Jones et al.,2011; Ryczko et al., 2013, 2016b), provides a strong excitatoryinput to MLR cells and robustly evokes locomotion (Derjean etal., 2010; Gariepy et al., 2012a; Ryczko et al., 2013). The PT sendsa descending dopaminergic projection to the MLR (Ryczko et al.,2013; Perez-Fernandez et al., 2014) where it releases dopaminethat increases locomotor output through a D1 receptor-depen-dent mechanism (Ryczko et al., 2013). Interestingly, the PT alsocontains glutamatergic neurons (Villar-Cervino et al., 2011,2013), and data suggest that their descending projections couldcontrol MLR activity. The PT sends non-dopaminergic (thus poten-tially glutamatergic) projections to the MLR (Ryczko et al., 2013). PTstimulation elicits fast synaptic responses in MLR cells (Gariepy etal., 2012a; Ryczko et al., 2013). Blockade of MLR glutamatergic re-ceptors disrupts reticulospinal responses elicited by stimulation ofthe olfactory bulbs, which project to the PT (Derjean et al., 2010).Glutamate application in the MLR elicits locomotion (Brocard et al.,2010; Gariepy et al., 2012a). However, there is no direct evidence fordescending glutamatergic inputs from the PT to the MLR, and it isunknown whether such input can progressively increase MLR acti-vation and the speed of the locomotor movements. Here, using neu-ral tracing, immunofluorescence, calcium imaging, patch-clamprecordings, and intracellular recordings during locomotion in lam-preys, we show that a descending glutamatergic pathway originatingfrom the primal SNc controls MLR activity and locomotor move-ments like a dimmer switch.
Materials and MethodsEthics statement. All procedures conformed to the guidelines of theCanadian Council on Animal Care and were approved by the animal careand use committees of the Universite de Montreal (Quebec, Canada) andUniversite du Quebec a Montreal (Quebec, Canada). A total of 47 sealampreys (Petromyzon marinus) were used, with n � 36 larvae for phys-iology experiments and n � 4 transformed and n � 7 adults for anatomyexperiments. Sex of the individuals used was not taken into account inthe present study. Care was taken to minimize the number of animalsused and their suffering.
Semi-intact and isolated brain preparations. Larval sea lampreys wereanesthetized with tricaine methanesulphonate (MS 222, 200 mg/L; Sigma-Aldrich) dissolved in a Ringer’s solution (in mM: 130 NaCl, 2.1 KCl, 2.6CaCl2, 1.8 MgCl2, 4.0 HEPES, 4.0 dextrose, and 1.0 NaHCO3 at pH 7.4).The animals were anesthetized for 8 –10 min and then transferred intooxygenated cold Ringer’s solution. To expose the brain, the skin andmuscles were removed from the rostral part of the animal. The dorsalcranium was opened to obtain ad libitum access to the PT and to reticu-lospinal neurons in the middle rhombencephalic reticular nucleus
(MRRN). Brain tissue rostral to the PT was removed by a transversesection between the diencephalon and the telencephalon. The rostralspinal segments were exposed and the caudal body parts were left intact.The brain was pinned down dorsal side up in the recording chamber, andthe body was free to move in a video monitored chamber. To provideaccess to the PT, a dorsal midsagittal transection was performed at thelevel of the diencephalon. Recovery time lasted 1 h before the recordingexperiments began. For isolated brain preparations, the same dissectionprocedure was used, but the body was removed.
Electrophysiology and stimulation. Intracellular recordings were per-formed with sharp glass microelectrodes (80 –110 M�) filled with potas-sium acetate (4 M). The signals were amplified with an Axoclamp 2A(Molecular Devices). Only cells with a membrane potential ��60 mVand held stable for 15 min after impalement were included in the study.
Extracellular recordings of reticulospinal neurons were performed us-ing glass micropipettes (diameter 5 �m) filled with Ringer’s solution andthe recordings were amplified with a model 1800 amplifier (bandwidth100 –500 Hz; A-M Systems). Signals were acquired (sampling rate of5–10 kHz) through a Digidata 1200 series interface coupled with Clam-pex 9.0 (Brocard et al., 2010; Ryczko et al., 2013).
Targeted patch-clamp recordings of MLR cells were done using theprotocol previously developed in the laboratory (Gariepy et al., 2012a;Ryczko et al., 2013). Briefly, MLR cells were first retrogradely labeledin vivo from an injection of Texas Red dextran amines (MW 3000 Da;Invitrogen) in the MRRN. The following day, the animal was killed andthe brain was isolated and placed in a cold Ringer’s solution (1–3 °C). Toprovide access to MLR cells, the dorsal part of the brain was removedwith a vibratome. The giant reticulospinal cell I1 (Rovainen, 1967) wasused as a landmark to locate the MLR (Brocard et al., 2010; Ryczko et al.,2013). Retrogradely labeled MLR cells were visualized under a micro-scope (Nikon Instruments or Olympus) equipped for fluorescence andtargeted for whole-cell patch-clamp. Patch pipette (4 – 6 M�) were filledwith a solution containing the following (in mM): 102.5 cesium methanesulfonate, 1 NaCl, 1 MgCl2, 5 EGTA, 5 HEPES, 0.3 ATP, and 0.1 GTP.The pH was adjusted to 7.2 with CsOH, and the osmolarity to 240 mOsmwith H2O. The cellular electrophysiological signals were recorded with amodel 2400 amplifier (A-M Systems). To measure the drug effects on theamplitude of synaptic responses, 20 excitatory postsynaptic potentials(EPSPs) were recorded for each cell and for each drug condition.
Glass-coated tungsten microelectrodes (0.7–3.1 M� with 10 – 40 �mexposed tip) and a Grass S88 stimulator (Astro Med) coupled to a GrassPSIU6 photoelectric isolation unit for controlling stimulation intensity(Astro Med) were used for electrical stimulation. The stimulation sitewas chosen on the basis of previous anatomical and physiological studies(Derjean et al., 2010; Gariepy et al., 2012a; Ryczko et al., 2013) andconfirmed by subsequent histology (see Fig. 2 B, C). The electrical stim-ulation consisted of square pulses (2 ms duration) applied with a fre-quency of 4 –5 Hz for 10 s to elicit swimming. A pause of 3–5 min wasmade between two stimulations. Single pulses applied at a frequency of0.1 Hz were used to evoke excitatory postsynaptic currents (EPSCs).High-frequency doublet pulses (20 Hz) were used to test for monosyn-aptic connectivity. The stimulation intensity ranged from 1 to 32 �A.
Ca2� imaging. MLR cells were retrogradely labeled by placing crystalof the Ca 2� indicator Ca 2� green-dextran amines (MW 3000, Invitro-gen) at the level of the MRRN, immediately after a complete transversetransection of the brainstem at the level of the MRRN. The preparationwas then transferred for 18 –24 h in a chamber perfused with cooled(8 –10°C), oxygenated Ringer’s solution to allow the tracer to migrate tofill the MLR cell bodies. The next day, the brain tissue rostral to the PTwas removed following a transverse section. As for the patch-clamp re-cording experiments described above, the dorsal part of the brain was cutaway with a vibratome to provide access to MLR cells. The preparationwas then pinned down to the bottom of a recording chamber perfusedwith cooled (8–10°C), oxygenated Ringer’s solution (4 ml/min). Changes influorescence were recorded as previously (Brocard et al., 2010; Ryczko et al.,2016a,b) with a Nikon epifluorescent microscope coupled with a CCDvideo camera (Photometrics CoolSNAP HQ, Roper Scientific). To mea-sure the changes in fluorescence, regions-of-interest were manually de-lineated around the MLR cell bodies labeled with the Ca 2� dye. Changes
9760 • J. Neurosci., October 4, 2017 • 37(40):9759 –9770 Ryczko et al. • Glutamatergic Control of a Locomotor Center
31
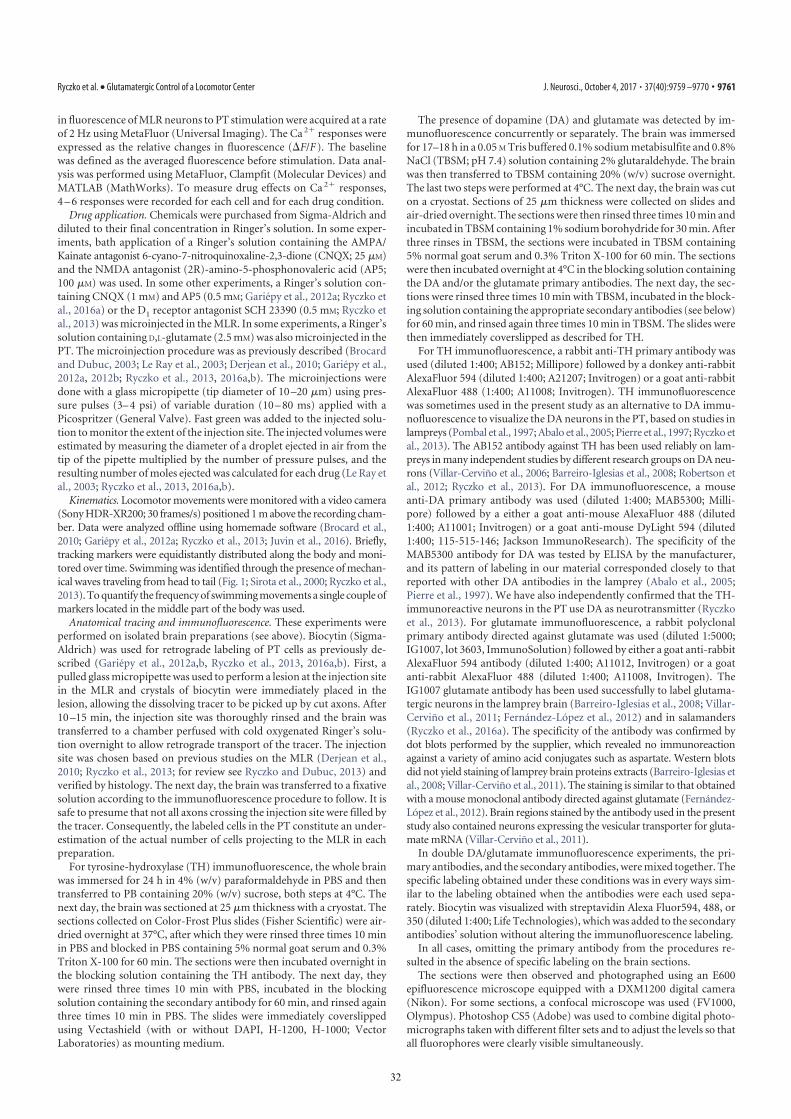
in fluorescence of MLR neurons to PT stimulation were acquired at a rateof 2 Hz using MetaFluor (Universal Imaging). The Ca 2� responses wereexpressed as the relative changes in fluorescence (�F/F ). The baselinewas defined as the averaged fluorescence before stimulation. Data anal-ysis was performed using MetaFluor, Clampfit (Molecular Devices) andMATLAB (MathWorks). To measure drug effects on Ca 2� responses,4 – 6 responses were recorded for each cell and for each drug condition.
Drug application. Chemicals were purchased from Sigma-Aldrich anddiluted to their final concentration in Ringer’s solution. In some exper-iments, bath application of a Ringer’s solution containing the AMPA/Kainate antagonist 6-cyano-7-nitroquinoxaline-2,3-dione (CNQX; 25 �M)and the NMDA antagonist (2R)-amino-5-phosphonovaleric acid (AP5;100 �M) was used. In some other experiments, a Ringer’s solution con-taining CNQX (1 mM) and AP5 (0.5 mM; Gariepy et al., 2012a; Ryczko etal., 2016a) or the D1 receptor antagonist SCH 23390 (0.5 mM; Ryczko etal., 2013) was microinjected in the MLR. In some experiments, a Ringer’ssolution containing D,L-glutamate (2.5 mM) was also microinjected in thePT. The microinjection procedure was as previously described (Brocardand Dubuc, 2003; Le Ray et al., 2003; Derjean et al., 2010; Gariepy et al.,2012a, 2012b; Ryczko et al., 2013, 2016a,b). The microinjections weredone with a glass micropipette (tip diameter of 10 –20 �m) using pres-sure pulses (3– 4 psi) of variable duration (10 – 80 ms) applied with aPicospritzer (General Valve). Fast green was added to the injected solu-tion to monitor the extent of the injection site. The injected volumes wereestimated by measuring the diameter of a droplet ejected in air from thetip of the pipette multiplied by the number of pressure pulses, and theresulting number of moles ejected was calculated for each drug (Le Ray etal., 2003; Ryczko et al., 2013, 2016a,b).
Kinematics. Locomotor movements were monitored with a video camera(Sony HDR-XR200; 30 frames/s) positioned 1 m above the recording cham-ber. Data were analyzed offline using homemade software (Brocard et al.,2010; Gariepy et al., 2012a; Ryczko et al., 2013; Juvin et al., 2016). Briefly,tracking markers were equidistantly distributed along the body and moni-tored over time. Swimming was identified through the presence of mechan-ical waves traveling from head to tail (Fig. 1; Sirota et al., 2000; Ryczko et al.,2013). To quantify the frequency of swimming movements a single couple ofmarkers located in the middle part of the body was used.
Anatomical tracing and immunofluorescence. These experiments wereperformed on isolated brain preparations (see above). Biocytin (Sigma-Aldrich) was used for retrograde labeling of PT cells as previously de-scribed (Gariepy et al., 2012a,b, Ryczko et al., 2013, 2016a,b). First, apulled glass micropipette was used to perform a lesion at the injection sitein the MLR and crystals of biocytin were immediately placed in thelesion, allowing the dissolving tracer to be picked up by cut axons. After10 –15 min, the injection site was thoroughly rinsed and the brain wastransferred to a chamber perfused with cold oxygenated Ringer’s solu-tion overnight to allow retrograde transport of the tracer. The injectionsite was chosen based on previous studies on the MLR (Derjean et al.,2010; Ryczko et al., 2013; for review see Ryczko and Dubuc, 2013) andverified by histology. The next day, the brain was transferred to a fixativesolution according to the immunofluorescence procedure to follow. It issafe to presume that not all axons crossing the injection site were filled bythe tracer. Consequently, the labeled cells in the PT constitute an under-estimation of the actual number of cells projecting to the MLR in eachpreparation.
For tyrosine-hydroxylase (TH) immunofluorescence, the whole brainwas immersed for 24 h in 4% (w/v) paraformaldehyde in PBS and thentransferred to PB containing 20% (w/v) sucrose, both steps at 4°C. Thenext day, the brain was sectioned at 25 �m thickness with a cryostat. Thesections collected on Color-Frost Plus slides (Fisher Scientific) were air-dried overnight at 37°C, after which they were rinsed three times 10 minin PBS and blocked in PBS containing 5% normal goat serum and 0.3%Triton X-100 for 60 min. The sections were then incubated overnight inthe blocking solution containing the TH antibody. The next day, theywere rinsed three times 10 min with PBS, incubated in the blockingsolution containing the secondary antibody for 60 min, and rinsed againthree times 10 min in PBS. The slides were immediately coverslippedusing Vectashield (with or without DAPI, H-1200, H-1000; VectorLaboratories) as mounting medium.
The presence of dopamine (DA) and glutamate was detected by im-munofluorescence concurrently or separately. The brain was immersedfor 17–18 h in a 0.05 M Tris buffered 0.1% sodium metabisulfite and 0.8%NaCl (TBSM; pH 7.4) solution containing 2% glutaraldehyde. The brainwas then transferred to TBSM containing 20% (w/v) sucrose overnight.The last two steps were performed at 4°C. The next day, the brain was cuton a cryostat. Sections of 25 �m thickness were collected on slides andair-dried overnight. The sections were then rinsed three times 10 min andincubated in TBSM containing 1% sodium borohydride for 30 min. Afterthree rinses in TBSM, the sections were incubated in TBSM containing5% normal goat serum and 0.3% Triton X-100 for 60 min. The sectionswere then incubated overnight at 4°C in the blocking solution containingthe DA and/or the glutamate primary antibodies. The next day, the sec-tions were rinsed three times 10 min with TBSM, incubated in the block-ing solution containing the appropriate secondary antibodies (see below)for 60 min, and rinsed again three times 10 min in TBSM. The slides werethen immediately coverslipped as described for TH.
For TH immunofluorescence, a rabbit anti-TH primary antibody wasused (diluted 1:400; AB152; Millipore) followed by a donkey anti-rabbitAlexaFluor 594 (diluted 1:400; A21207; Invitrogen) or a goat anti-rabbitAlexaFluor 488 (1:400; A11008; Invitrogen). TH immunofluorescencewas sometimes used in the present study as an alternative to DA immu-nofluorescence to visualize the DA neurons in the PT, based on studies inlampreys (Pombal et al., 1997; Abalo et al., 2005; Pierre et al., 1997; Ryczko etal., 2013). The AB152 antibody against TH has been used reliably on lam-preys in many independent studies by different research groups on DA neu-rons (Villar-Cervino et al., 2006; Barreiro-Iglesias et al., 2008; Robertson etal., 2012; Ryczko et al., 2013). For DA immunofluorescence, a mouseanti-DA primary antibody was used (diluted 1:400; MAB5300; Milli-pore) followed by a either a goat anti-mouse AlexaFluor 488 (diluted1:400; A11001; Invitrogen) or a goat anti-mouse DyLight 594 (diluted1:400; 115-515-146; Jackson ImmunoResearch). The specificity of theMAB5300 antibody for DA was tested by ELISA by the manufacturer,and its pattern of labeling in our material corresponded closely to thatreported with other DA antibodies in the lamprey (Abalo et al., 2005;Pierre et al., 1997). We have also independently confirmed that the TH-immunoreactive neurons in the PT use DA as neurotransmitter (Ryczkoet al., 2013). For glutamate immunofluorescence, a rabbit polyclonalprimary antibody directed against glutamate was used (diluted 1:5000;IG1007, lot 3603, ImmunoSolution) followed by either a goat anti-rabbitAlexaFluor 594 antibody (diluted 1:400; A11012, Invitrogen) or a goatanti-rabbit AlexaFluor 488 (diluted 1:400; A11008, Invitrogen). TheIG1007 glutamate antibody has been used successfully to label glutama-tergic neurons in the lamprey brain (Barreiro-Iglesias et al., 2008; Villar-Cervino et al., 2011; Fernandez-Lopez et al., 2012) and in salamanders(Ryczko et al., 2016a). The specificity of the antibody was confirmed bydot blots performed by the supplier, which revealed no immunoreactionagainst a variety of amino acid conjugates such as aspartate. Western blotsdid not yield staining of lamprey brain proteins extracts (Barreiro-Iglesias etal., 2008; Villar-Cervino et al., 2011). The staining is similar to that obtainedwith a mouse monoclonal antibody directed against glutamate (Fernandez-Lopez et al., 2012). Brain regions stained by the antibody used in the presentstudy also contained neurons expressing the vesicular transporter for gluta-mate mRNA (Villar-Cervino et al., 2011).
In double DA/glutamate immunofluorescence experiments, the pri-mary antibodies, and the secondary antibodies, were mixed together. Thespecific labeling obtained under these conditions was in every ways sim-ilar to the labeling obtained when the antibodies were each used sepa-rately. Biocytin was visualized with streptavidin Alexa Fluor594, 488, or350 (diluted 1:400; Life Technologies), which was added to the secondaryantibodies’ solution without altering the immunofluorescence labeling.
In all cases, omitting the primary antibody from the procedures re-sulted in the absence of specific labeling on the brain sections.
The sections were then observed and photographed using an E600epifluorescence microscope equipped with a DXM1200 digital camera(Nikon). For some sections, a confocal microscope was used (FV1000,Olympus). Photoshop CS5 (Adobe) was used to combine digital photo-micrographs taken with different filter sets and to adjust the levels so thatall fluorophores were clearly visible simultaneously.
Ryczko et al. • Glutamatergic Control of a Locomotor Center J. Neurosci., October 4, 2017 • 37(40):9759 –9770 • 9761
32
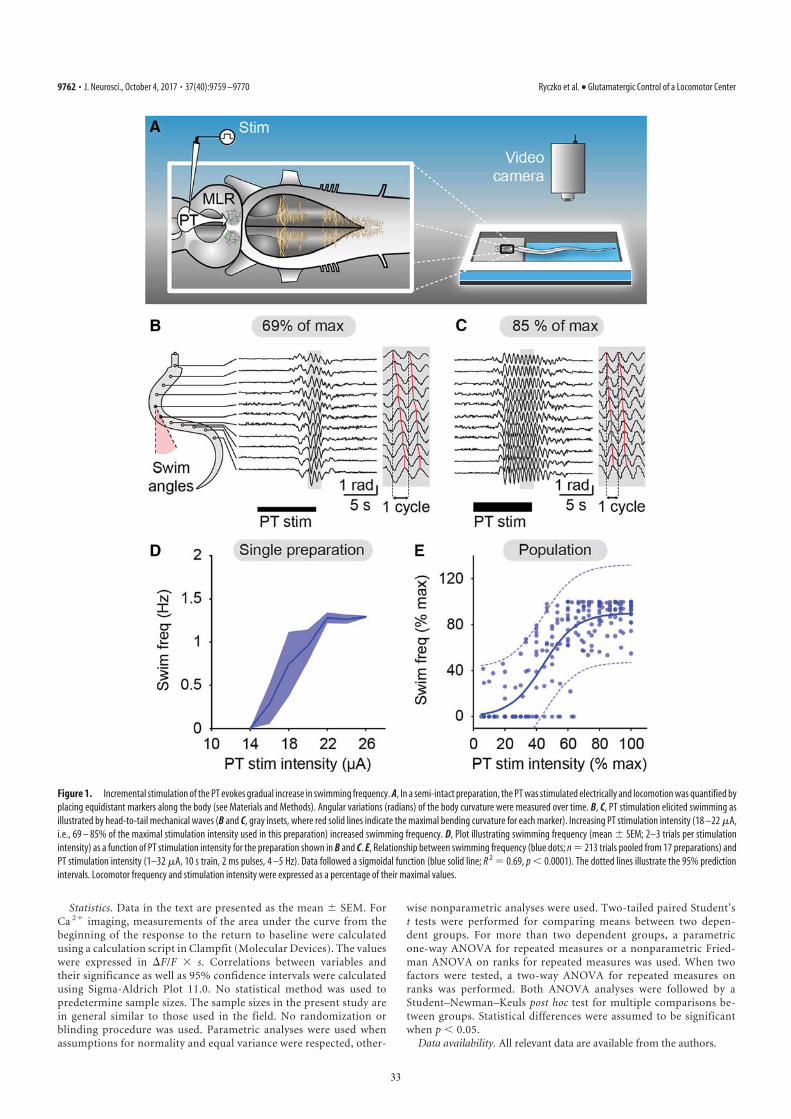
Statistics. Data in the text are presented as the mean � SEM. ForCa 2� imaging, measurements of the area under the curve from thebeginning of the response to the return to baseline were calculatedusing a calculation script in Clampfit (Molecular Devices). The valueswere expressed in �F/F s. Correlations between variables andtheir significance as well as 95% confidence intervals were calculatedusing Sigma-Aldrich Plot 11.0. No statistical method was used topredetermine sample sizes. The sample sizes in the present study arein general similar to those used in the field. No randomization orblinding procedure was used. Parametric analyses were used whenassumptions for normality and equal variance were respected, other-
wise nonparametric analyses were used. Two-tailed paired Student’st tests were performed for comparing means between two depen-dent groups. For more than two dependent groups, a parametricone-way ANOVA for repeated measures or a nonparametric Fried-man ANOVA on ranks for repeated measures was used. When twofactors were tested, a two-way ANOVA for repeated measures onranks was performed. Both ANOVA analyses were followed by aStudent–Newman–Keuls post hoc test for multiple comparisons be-tween groups. Statistical differences were assumed to be significantwhen p � 0.05.
Data availability. All relevant data are available from the authors.
Figure 1. Incremental stimulation of the PT evokes gradual increase in swimming frequency. A, In a semi-intact preparation, the PT was stimulated electrically and locomotion was quantified by
placing equidistant markers along the body (see Materials and Methods). Angular variations (radians) of the body curvature were measured over time. B, C, PT stimulation elicited swimming as
illustrated by head-to-tail mechanical waves (B and C, gray insets, where red solid lines indicate the maximal bending curvature for each marker). Increasing PT stimulation intensity (18 –22 �A,
i.e., 69 – 85% of the maximal stimulation intensity used in this preparation) increased swimming frequency. D, Plot illustrating swimming frequency (mean � SEM; 2–3 trials per stimulation
intensity) as a function of PT stimulation intensity for the preparation shown in B and C. E, Relationship between swimming frequency (blue dots; n � 213 trials pooled from 17 preparations) and
PT stimulation intensity (1–32 �A, 10 s train, 2 ms pulses, 4 –5 Hz). Data followed a sigmoidal function (blue solid line; R 2 � 0.69, p � 0.0001). The dotted lines illustrate the 95% prediction
intervals. Locomotor frequency and stimulation intensity were expressed as a percentage of their maximal values.
9762 • J. Neurosci., October 4, 2017 • 37(40):9759 –9770 Ryczko et al. • Glutamatergic Control of a Locomotor Center
33
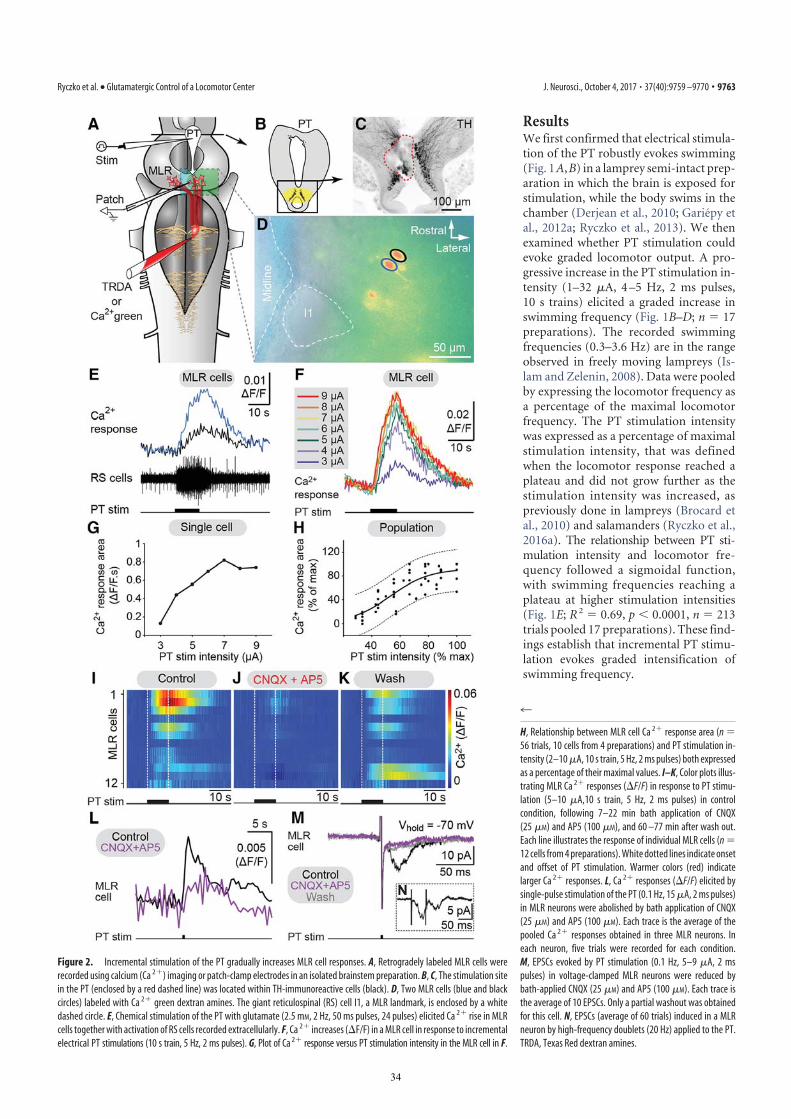
ResultsWe first confirmed that electrical stimula-tion of the PT robustly evokes swimming(Fig. 1A,B) in a lamprey semi-intact prep-aration in which the brain is exposed forstimulation, while the body swims in thechamber (Derjean et al., 2010; Gariepy etal., 2012a; Ryczko et al., 2013). We thenexamined whether PT stimulation couldevoke graded locomotor output. A pro-gressive increase in the PT stimulation in-tensity (1–32 �A, 4 –5 Hz, 2 ms pulses,10 s trains) elicited a graded increase inswimming frequency (Fig. 1B–D; n � 17preparations). The recorded swimmingfrequencies (0.3–3.6 Hz) are in the rangeobserved in freely moving lampreys (Is-lam and Zelenin, 2008). Data were pooledby expressing the locomotor frequency asa percentage of the maximal locomotorfrequency. The PT stimulation intensitywas expressed as a percentage of maximalstimulation intensity, that was definedwhen the locomotor response reached aplateau and did not grow further as thestimulation intensity was increased, aspreviously done in lampreys (Brocard etal., 2010) and salamanders (Ryczko et al.,2016a). The relationship between PT sti-mulation intensity and locomotor fre-quency followed a sigmoidal function,with swimming frequencies reaching aplateau at higher stimulation intensities(Fig. 1E; R 2 � 0.69, p � 0.0001, n � 213trials pooled 17 preparations). These find-ings establish that incremental PT stimu-lation evokes graded intensification ofswimming frequency.
Figure 2. Incremental stimulation of the PT gradually increases MLR cell responses. A, Retrogradely labeled MLR cells were
recorded using calcium (Ca 2�) imaging or patch-clamp electrodes in an isolated brainstem preparation. B, C, The stimulation site
in the PT (enclosed by a red dashed line) was located within TH-immunoreactive cells (black). D, Two MLR cells (blue and black
circles) labeled with Ca 2� green dextran amines. The giant reticulospinal (RS) cell I1, a MLR landmark, is enclosed by a white
dashed circle. E, Chemical stimulation of the PT with glutamate (2.5 mM, 2 Hz, 50 ms pulses, 24 pulses) elicited Ca 2� rise in MLR
cells together with activation of RS cells recorded extracellularly. F, Ca 2� increases (�F/F) in a MLR cell in response to incremental
electrical PT stimulations (10 s train, 5 Hz, 2 ms pulses). G, Plot of Ca 2� response versus PT stimulation intensity in the MLR cell in F.
4
H, Relationship between MLR cell Ca 2� response area (n �56 trials, 10 cells from 4 preparations) and PT stimulation in-
tensity (2–10 �A, 10 s train, 5 Hz, 2 ms pulses) both expressed
as a percentage of their maximal values. I–K, Color plots illus-
trating MLR Ca 2� responses (�F/F) in response to PT stimu-
lation (5–10 �A,10 s train, 5 Hz, 2 ms pulses) in control
condition, following 7–22 min bath application of CNQX
(25 �M) and AP5 (100 �M), and 60 –77 min after wash out.
Each line illustrates the response of individual MLR cells (n �12 cells from 4 preparations). White dotted lines indicate onset
and offset of PT stimulation. Warmer colors (red) indicate
larger Ca 2� responses. L, Ca 2� responses (�F/F) elicited by
single-pulse stimulation of the PT (0.1 Hz, 15 �A, 2 ms pulses)
in MLR neurons were abolished by bath application of CNQX
(25 �M) and AP5 (100 �M). Each trace is the average of the
pooled Ca 2� responses obtained in three MLR neurons. In
each neuron, five trials were recorded for each condition.
M, EPSCs evoked by PT stimulation (0.1 Hz, 5–9 �A, 2 ms
pulses) in voltage-clamped MLR neurons were reduced by
bath-applied CNQX (25 �M) and AP5 (100 �M). Each trace is
the average of 10 EPSCs. Only a partial washout was obtained
for this cell. N, EPSCs (average of 60 trials) induced in a MLR
neuron by high-frequency doublets (20 Hz) applied to the PT.
TRDA, Texas Red dextran amines.
Ryczko et al. • Glutamatergic Control of a Locomotor Center J. Neurosci., October 4, 2017 • 37(40):9759 –9770 • 9763
34
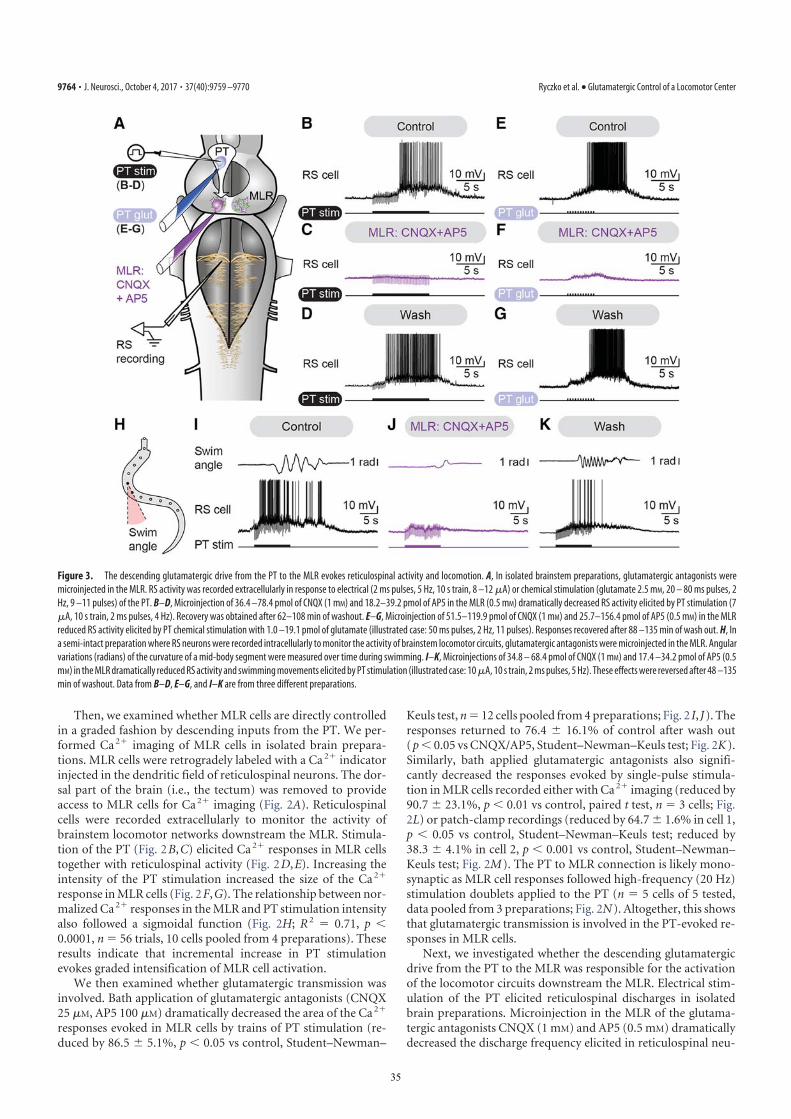
Then, we examined whether MLR cells are directly controlledin a graded fashion by descending inputs from the PT. We per-formed Ca 2� imaging of MLR cells in isolated brain prepara-tions. MLR cells were retrogradely labeled with a Ca 2� indicatorinjected in the dendritic field of reticulospinal neurons. The dor-sal part of the brain (i.e., the tectum) was removed to provideaccess to MLR cells for Ca 2� imaging (Fig. 2A). Reticulospinalcells were recorded extracellularly to monitor the activity ofbrainstem locomotor networks downstream the MLR. Stimula-tion of the PT (Fig. 2B,C) elicited Ca 2� responses in MLR cellstogether with reticulospinal activity (Fig. 2D,E). Increasing theintensity of the PT stimulation increased the size of the Ca 2�
response in MLR cells (Fig. 2F,G). The relationship between nor-malized Ca 2� responses in the MLR and PT stimulation intensityalso followed a sigmoidal function (Fig. 2H; R 2 � 0.71, p �0.0001, n � 56 trials, 10 cells pooled from 4 preparations). Theseresults indicate that incremental increase in PT stimulationevokes graded intensification of MLR cell activation.
We then examined whether glutamatergic transmission wasinvolved. Bath application of glutamatergic antagonists (CNQX25 �M, AP5 100 �M) dramatically decreased the area of the Ca 2�
responses evoked in MLR cells by trains of PT stimulation (re-duced by 86.5 � 5.1%, p � 0.05 vs control, Student–Newman–
Keuls test, n � 12 cells pooled from 4 preparations; Fig. 2 I, J). Theresponses returned to 76.4 � 16.1% of control after wash out(p � 0.05 vs CNQX/AP5, Student–Newman–Keuls test; Fig. 2K).Similarly, bath applied glutamatergic antagonists also signifi-cantly decreased the responses evoked by single-pulse stimula-tion in MLR cells recorded either with Ca 2� imaging (reduced by90.7 � 23.1%, p � 0.01 vs control, paired t test, n � 3 cells; Fig.2L) or patch-clamp recordings (reduced by 64.7 � 1.6% in cell 1,p � 0.05 vs control, Student–Newman–Keuls test; reduced by38.3 � 4.1% in cell 2, p � 0.001 vs control, Student–Newman–Keuls test; Fig. 2M). The PT to MLR connection is likely mono-synaptic as MLR cell responses followed high-frequency (20 Hz)stimulation doublets applied to the PT (n � 5 cells of 5 tested,data pooled from 3 preparations; Fig. 2N). Altogether, this showsthat glutamatergic transmission is involved in the PT-evoked re-sponses in MLR cells.
Next, we investigated whether the descending glutamatergicdrive from the PT to the MLR was responsible for the activationof the locomotor circuits downstream the MLR. Electrical stim-ulation of the PT elicited reticulospinal discharges in isolatedbrain preparations. Microinjection in the MLR of the glutama-tergic antagonists CNQX (1 mM) and AP5 (0.5 mM) dramaticallydecreased the discharge frequency elicited in reticulospinal neu-
Figure 3. The descending glutamatergic drive from the PT to the MLR evokes reticulospinal activity and locomotion. A, In isolated brainstem preparations, glutamatergic antagonists were
microinjected in the MLR. RS activity was recorded extracellularly in response to electrical (2 ms pulses, 5 Hz, 10 s train, 8 –12 �A) or chemical stimulation (glutamate 2.5 mM, 20 – 80 ms pulses, 2
Hz, 9 –11 pulses) of the PT. B–D, Microinjection of 36.4 –78.4 pmol of CNQX (1 mM) and 18.2–39.2 pmol of AP5 in the MLR (0.5 mM) dramatically decreased RS activity elicited by PT stimulation (7
�A, 10 s train, 2 ms pulses, 4 Hz). Recovery was obtained after 62–108 min of washout. E–G, Microinjection of 51.5–119.9 pmol of CNQX (1 mM) and 25.7–156.4 pmol of AP5 (0.5 mM) in the MLR
reduced RS activity elicited by PT chemical stimulation with 1.0 –19.1 pmol of glutamate (illustrated case: 50 ms pulses, 2 Hz, 11 pulses). Responses recovered after 88 –135 min of wash out. H, In
a semi-intact preparation where RS neurons were recorded intracellularly to monitor the activity of brainstem locomotor circuits, glutamatergic antagonists were microinjected in the MLR. Angular
variations (radians) of the curvature of a mid-body segment were measured over time during swimming. I–K, Microinjections of 34.8 – 68.4 pmol of CNQX (1 mM) and 17.4 –34.2 pmol of AP5 (0.5
mM) in the MLR dramatically reduced RS activity and swimming movements elicited by PT stimulation (illustrated case: 10 �A, 10 s train, 2 ms pulses, 5 Hz). These effects were reversed after 48 –135
min of washout. Data from B–D, E–G, and I–K are from three different preparations.
9764 • J. Neurosci., October 4, 2017 • 37(40):9759 –9770 Ryczko et al. • Glutamatergic Control of a Locomotor Center
35
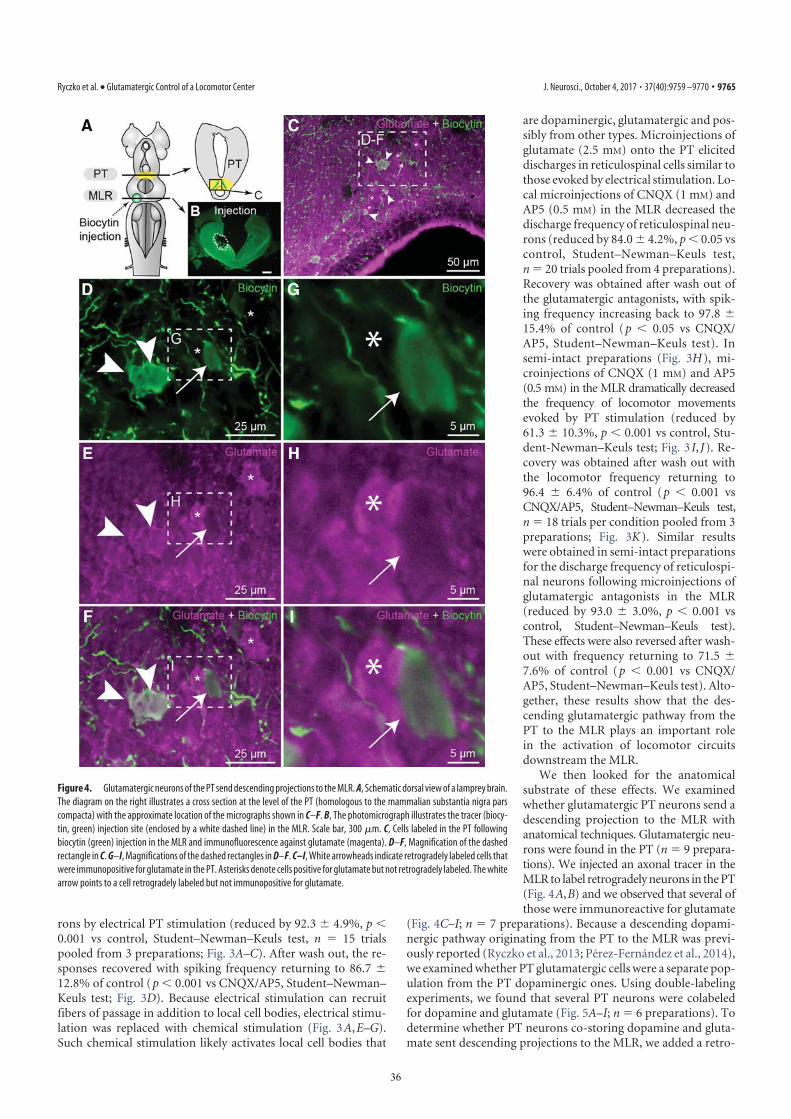
rons by electrical PT stimulation (reduced by 92.3 � 4.9%, p �0.001 vs control, Student–Newman–Keuls test, n � 15 trialspooled from 3 preparations; Fig. 3A–C). After wash out, the re-sponses recovered with spiking frequency returning to 86.7 �12.8% of control (p � 0.001 vs CNQX/AP5, Student–Newman–Keuls test; Fig. 3D). Because electrical stimulation can recruitfibers of passage in addition to local cell bodies, electrical stimu-lation was replaced with chemical stimulation (Fig. 3A,E–G).Such chemical stimulation likely activates local cell bodies that
are dopaminergic, glutamatergic and pos-sibly from other types. Microinjections ofglutamate (2.5 mM) onto the PT eliciteddischarges in reticulospinal cells similar tothose evoked by electrical stimulation. Lo-cal microinjections of CNQX (1 mM) andAP5 (0.5 mM) in the MLR decreased thedischarge frequency of reticulospinal neu-rons (reduced by 84.0 � 4.2%, p � 0.05 vscontrol, Student–Newman–Keuls test,n � 20 trials pooled from 4 preparations).Recovery was obtained after wash out ofthe glutamatergic antagonists, with spik-ing frequency increasing back to 97.8 �15.4% of control (p � 0.05 vs CNQX/AP5, Student–Newman–Keuls test). Insemi-intact preparations (Fig. 3H), mi-croinjections of CNQX (1 mM) and AP5(0.5 mM) in the MLR dramatically decreasedthe frequency of locomotor movementsevoked by PT stimulation (reduced by61.3 � 10.3%, p � 0.001 vs control, Stu-dent-Newman–Keuls test; Fig. 3 I, J). Re-covery was obtained after wash out withthe locomotor frequency returning to96.4 � 6.4% of control (p � 0.001 vsCNQX/AP5, Student–Newman–Keuls test,n � 18 trials per condition pooled from 3preparations; Fig. 3K). Similar resultswere obtained in semi-intact preparationsfor the discharge frequency of reticulospi-nal neurons following microinjections ofglutamatergic antagonists in the MLR(reduced by 93.0 � 3.0%, p � 0.001 vscontrol, Student–Newman–Keuls test).These effects were also reversed after wash-out with frequency returning to 71.5 �7.6% of control (p � 0.001 vs CNQX/AP5, Student–Newman–Keuls test). Alto-gether, these results show that the des-cending glutamatergic pathway from thePT to the MLR plays an important rolein the activation of locomotor circuitsdownstream the MLR.
We then looked for the anatomicalsubstrate of these effects. We examinedwhether glutamatergic PT neurons send adescending projection to the MLR withanatomical techniques. Glutamatergic neu-rons were found in the PT (n � 9 prepara-tions). We injected an axonal tracer in theMLR to label retrogradely neurons in the PT(Fig. 4A,B) and we observed that several ofthose were immunoreactive for glutamate
(Fig. 4C–I; n � 7 preparations). Because a descending dopami-nergic pathway originating from the PT to the MLR was previ-ously reported (Ryczko et al., 2013; Perez-Fernandez et al., 2014),we examined whether PT glutamatergic cells were a separate pop-ulation from the PT dopaminergic ones. Using double-labelingexperiments, we found that several PT neurons were colabeledfor dopamine and glutamate (Fig. 5A–I; n � 6 preparations). Todetermine whether PT neurons co-storing dopamine and gluta-mate sent descending projections to the MLR, we added a retro-
Figure 4. Glutamatergic neurons of the PT send descending projections to the MLR. A, Schematic dorsal view of a lamprey brain.
The diagram on the right illustrates a cross section at the level of the PT (homologous to the mammalian substantia nigra pars
compacta) with the approximate location of the micrographs shown in C–F. B, The photomicrograph illustrates the tracer (biocy-
tin, green) injection site (enclosed by a white dashed line) in the MLR. Scale bar, 300 �m. C, Cells labeled in the PT following
biocytin (green) injection in the MLR and immunofluorescence against glutamate (magenta). D–F, Magnification of the dashed
rectangle in C. G–I, Magnifications of the dashed rectangles in D–F. C–I, White arrowheads indicate retrogradely labeled cells that
were immunopositive for glutamate in the PT. Asterisks denote cells positive for glutamate but not retrogradely labeled. The white
arrow points to a cell retrogradely labeled but not immunopositive for glutamate.
Ryczko et al. • Glutamatergic Control of a Locomotor Center J. Neurosci., October 4, 2017 • 37(40):9759 –9770 • 9765
36
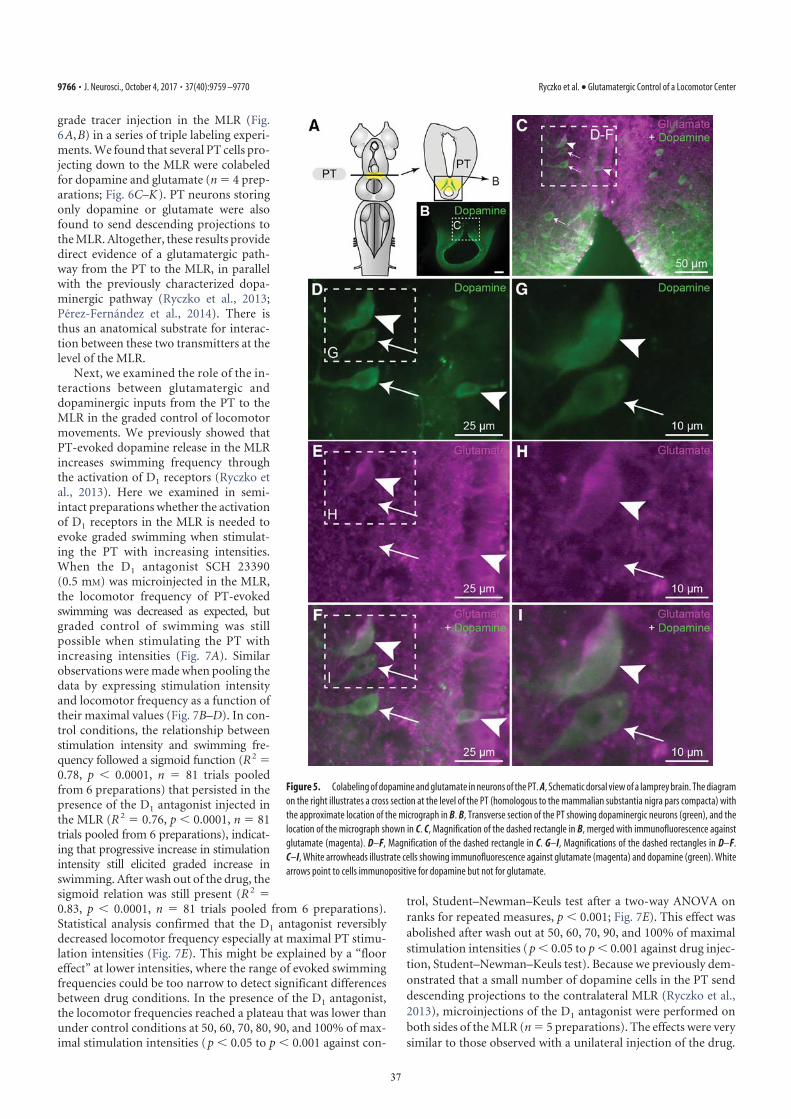
grade tracer injection in the MLR (Fig.6A,B) in a series of triple labeling experi-ments. We found that several PT cells pro-jecting down to the MLR were colabeledfor dopamine and glutamate (n � 4 prep-arations; Fig. 6C–K). PT neurons storingonly dopamine or glutamate were alsofound to send descending projections tothe MLR. Altogether, these results providedirect evidence of a glutamatergic path-way from the PT to the MLR, in parallelwith the previously characterized dopa-minergic pathway (Ryczko et al., 2013;Perez-Fernandez et al., 2014). There isthus an anatomical substrate for interac-tion between these two transmitters at thelevel of the MLR.
Next, we examined the role of the in-teractions between glutamatergic anddopaminergic inputs from the PT to theMLR in the graded control of locomotormovements. We previously showed thatPT-evoked dopamine release in the MLRincreases swimming frequency throughthe activation of D1 receptors (Ryczko etal., 2013). Here we examined in semi-intact preparations whether the activationof D1 receptors in the MLR is needed toevoke graded swimming when stimulat-ing the PT with increasing intensities.When the D1 antagonist SCH 23390(0.5 mM) was microinjected in the MLR,the locomotor frequency of PT-evokedswimming was decreased as expected, butgraded control of swimming was stillpossible when stimulating the PT withincreasing intensities (Fig. 7A). Similarobservations were made when pooling thedata by expressing stimulation intensityand locomotor frequency as a function oftheir maximal values (Fig. 7B–D). In con-trol conditions, the relationship betweenstimulation intensity and swimming fre-quency followed a sigmoid function (R2 �0.78, p � 0.0001, n � 81 trials pooledfrom 6 preparations) that persisted in thepresence of the D1 antagonist injected inthe MLR (R 2 � 0.76, p � 0.0001, n � 81trials pooled from 6 preparations), indicat-ing that progressive increase in stimulationintensity still elicited graded increase inswimming. After wash out of the drug, thesigmoid relation was still present (R 2 �0.83, p � 0.0001, n � 81 trials pooled from 6 preparations).Statistical analysis confirmed that the D1 antagonist reversiblydecreased locomotor frequency especially at maximal PT stimu-lation intensities (Fig. 7E). This might be explained by a “flooreffect” at lower intensities, where the range of evoked swimmingfrequencies could be too narrow to detect significant differencesbetween drug conditions. In the presence of the D1 antagonist,the locomotor frequencies reached a plateau that was lower thanunder control conditions at 50, 60, 70, 80, 90, and 100% of max-imal stimulation intensities (p � 0.05 to p � 0.001 against con-
trol, Student–Newman–Keuls test after a two-way ANOVA onranks for repeated measures, p � 0.001; Fig. 7E). This effect wasabolished after wash out at 50, 60, 70, 90, and 100% of maximalstimulation intensities (p � 0.05 to p � 0.001 against drug injec-tion, Student–Newman–Keuls test). Because we previously dem-onstrated that a small number of dopamine cells in the PT senddescending projections to the contralateral MLR (Ryczko et al.,2013), microinjections of the D1 antagonist were performed onboth sides of the MLR (n � 5 preparations). The effects were verysimilar to those observed with a unilateral injection of the drug.
Figure 5. Colabeling of dopamine and glutamate in neurons of the PT. A, Schematic dorsal view of a lamprey brain. The diagram
on the right illustrates a cross section at the level of the PT (homologous to the mammalian substantia nigra pars compacta) with
the approximate location of the micrograph in B. B, Transverse section of the PT showing dopaminergic neurons (green), and the
location of the micrograph shown in C. C, Magnification of the dashed rectangle in B, merged with immunofluorescence against
glutamate (magenta). D–F, Magnification of the dashed rectangle in C. G–I, Magnifications of the dashed rectangles in D–F.
C–I, White arrowheads illustrate cells showing immunofluorescence against glutamate (magenta) and dopamine (green). White
arrows point to cells immunopositive for dopamine but not for glutamate.
9766 • J. Neurosci., October 4, 2017 • 37(40):9759 –9770 Ryczko et al. • Glutamatergic Control of a Locomotor Center
37
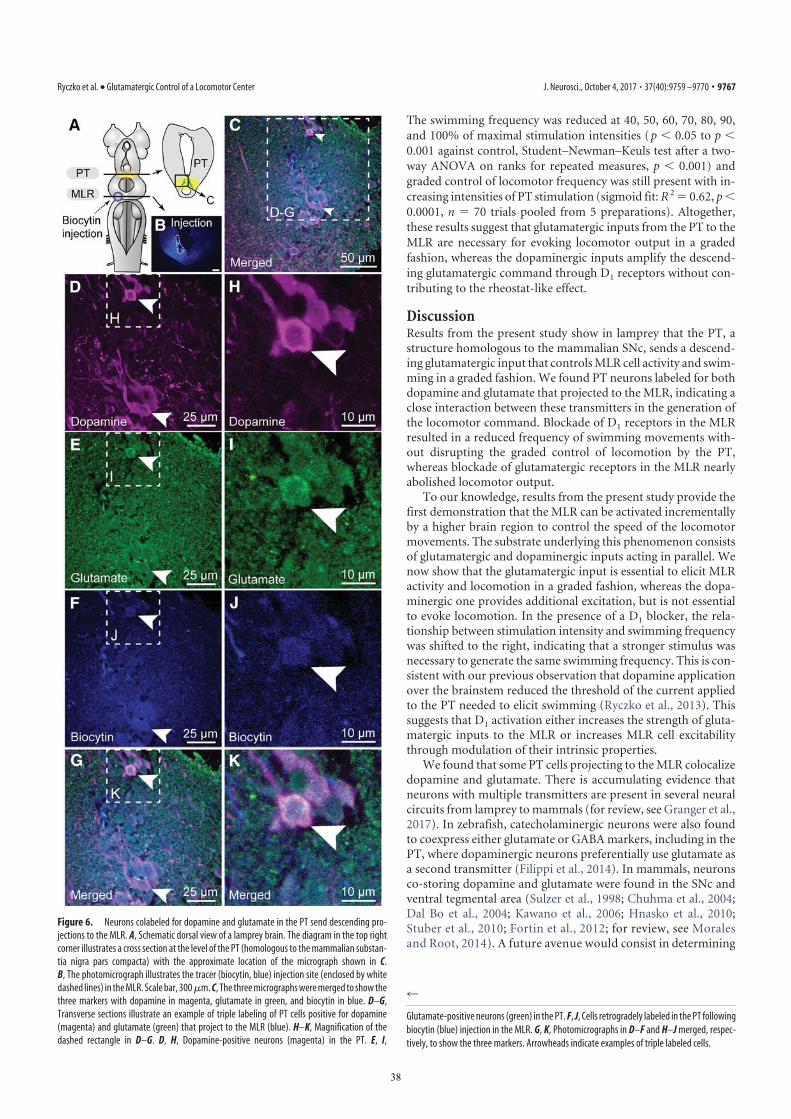
The swimming frequency was reduced at 40, 50, 60, 70, 80, 90,and 100% of maximal stimulation intensities (p � 0.05 to p �0.001 against control, Student–Newman–Keuls test after a two-way ANOVA on ranks for repeated measures, p � 0.001) andgraded control of locomotor frequency was still present with in-creasing intensities of PT stimulation (sigmoid fit: R 2 � 0.62, p �0.0001, n � 70 trials pooled from 5 preparations). Altogether,these results suggest that glutamatergic inputs from the PT to theMLR are necessary for evoking locomotor output in a gradedfashion, whereas the dopaminergic inputs amplify the descend-ing glutamatergic command through D1 receptors without con-tributing to the rheostat-like effect.
DiscussionResults from the present study show in lamprey that the PT, astructure homologous to the mammalian SNc, sends a descend-ing glutamatergic input that controls MLR cell activity and swim-ming in a graded fashion. We found PT neurons labeled for bothdopamine and glutamate that projected to the MLR, indicating aclose interaction between these transmitters in the generation ofthe locomotor command. Blockade of D1 receptors in the MLRresulted in a reduced frequency of swimming movements with-out disrupting the graded control of locomotion by the PT,whereas blockade of glutamatergic receptors in the MLR nearlyabolished locomotor output.
To our knowledge, results from the present study provide thefirst demonstration that the MLR can be activated incrementallyby a higher brain region to control the speed of the locomotormovements. The substrate underlying this phenomenon consistsof glutamatergic and dopaminergic inputs acting in parallel. Wenow show that the glutamatergic input is essential to elicit MLRactivity and locomotion in a graded fashion, whereas the dopa-minergic one provides additional excitation, but is not essentialto evoke locomotion. In the presence of a D1 blocker, the rela-tionship between stimulation intensity and swimming frequencywas shifted to the right, indicating that a stronger stimulus wasnecessary to generate the same swimming frequency. This is con-sistent with our previous observation that dopamine applicationover the brainstem reduced the threshold of the current appliedto the PT needed to elicit swimming (Ryczko et al., 2013). Thissuggests that D1 activation either increases the strength of gluta-matergic inputs to the MLR or increases MLR cell excitabilitythrough modulation of their intrinsic properties.
We found that some PT cells projecting to the MLR colocalizedopamine and glutamate. There is accumulating evidence thatneurons with multiple transmitters are present in several neuralcircuits from lamprey to mammals (for review, see Granger et al.,2017). In zebrafish, catecholaminergic neurons were also foundto coexpress either glutamate or GABA markers, including in thePT, where dopaminergic neurons preferentially use glutamate asa second transmitter (Filippi et al., 2014). In mammals, neuronsco-storing dopamine and glutamate were found in the SNc andventral tegmental area (Sulzer et al., 1998; Chuhma et al., 2004;Dal Bo et al., 2004; Kawano et al., 2006; Hnasko et al., 2010;Stuber et al., 2010; Fortin et al., 2012; for review, see Moralesand Root, 2014). A future avenue would consist in determining
Figure 6. Neurons colabeled for dopamine and glutamate in the PT send descending pro-
jections to the MLR. A, Schematic dorsal view of a lamprey brain. The diagram in the top right
corner illustrates a cross section at the level of the PT (homologous to the mammalian substan-
tia nigra pars compacta) with the approximate location of the micrograph shown in C.
B, The photomicrograph illustrates the tracer (biocytin, blue) injection site (enclosed by white
dashed lines) in the MLR. Scale bar, 300 �m. C, The three micrographs were merged to show the
three markers with dopamine in magenta, glutamate in green, and biocytin in blue. D–G,
Transverse sections illustrate an example of triple labeling of PT cells positive for dopamine
(magenta) and glutamate (green) that project to the MLR (blue). H–K, Magnification of the
dashed rectangle in D–G. D, H, Dopamine-positive neurons (magenta) in the PT. E, I,
4
Glutamate-positive neurons (green) in the PT. F, J, Cells retrogradely labeled in the PT following
biocytin (blue) injection in the MLR. G, K, Photomicrographs in D–F and H–J merged, respec-
tively, to show the three markers. Arrowheads indicate examples of triple labeled cells.
Ryczko et al. • Glutamatergic Control of a Locomotor Center J. Neurosci., October 4, 2017 • 37(40):9759 –9770 • 9767
38
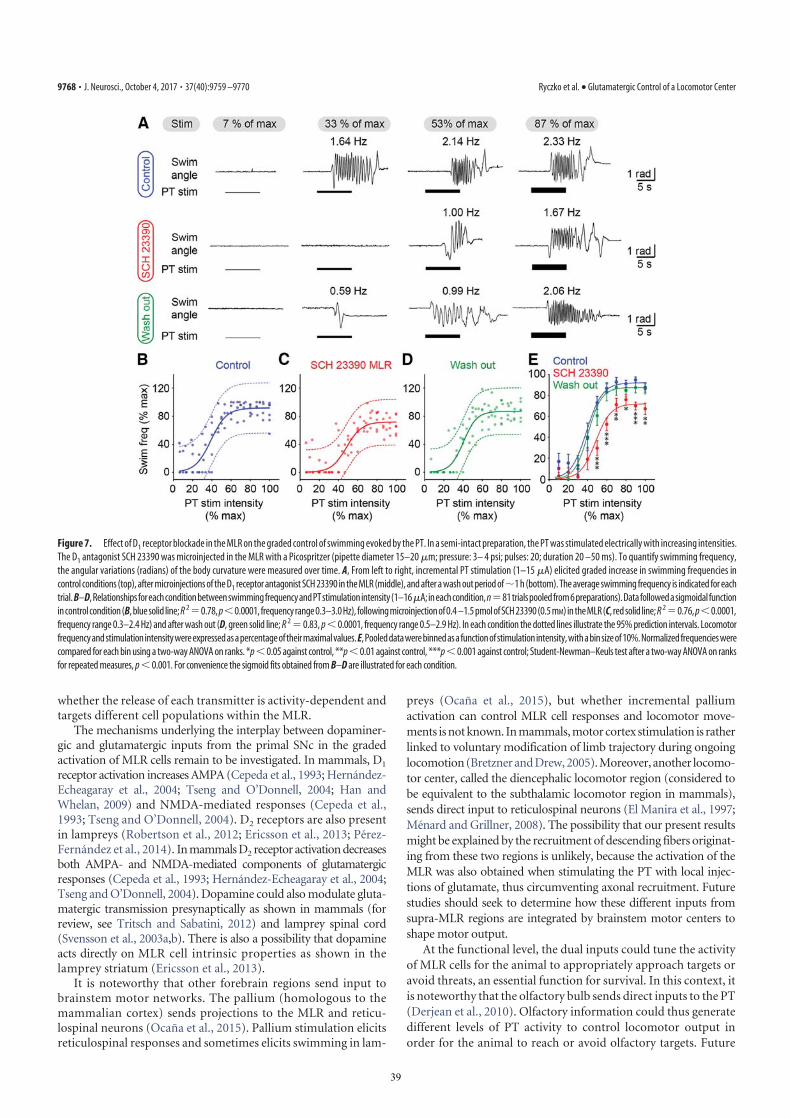
whether the release of each transmitter is activity-dependent andtargets different cell populations within the MLR.
The mechanisms underlying the interplay between dopaminer-gic and glutamatergic inputs from the primal SNc in the gradedactivation of MLR cells remain to be investigated. In mammals, D1
receptor activation increases AMPA (Cepeda et al., 1993; Hernandez-Echeagaray et al., 2004; Tseng and O’Donnell, 2004; Han andWhelan, 2009) and NMDA-mediated responses (Cepeda et al.,1993; Tseng and O’Donnell, 2004). D2 receptors are also presentin lampreys (Robertson et al., 2012; Ericsson et al., 2013; Perez-Fernandez et al., 2014). In mammals D2 receptor activation decreasesboth AMPA- and NMDA-mediated components of glutamatergicresponses (Cepeda et al., 1993; Hernandez-Echeagaray et al., 2004;Tseng and O’Donnell, 2004). Dopamine could also modulate gluta-matergic transmission presynaptically as shown in mammals (forreview, see Tritsch and Sabatini, 2012) and lamprey spinal cord(Svensson et al., 2003a,b). There is also a possibility that dopamineacts directly on MLR cell intrinsic properties as shown in thelamprey striatum (Ericsson et al., 2013).
It is noteworthy that other forebrain regions send input tobrainstem motor networks. The pallium (homologous to themammalian cortex) sends projections to the MLR and reticu-lospinal neurons (Ocana et al., 2015). Pallium stimulation elicitsreticulospinal responses and sometimes elicits swimming in lam-
preys (Ocana et al., 2015), but whether incremental palliumactivation can control MLR cell responses and locomotor move-ments is not known. In mammals, motor cortex stimulation is ratherlinked to voluntary modification of limb trajectory during ongoinglocomotion (Bretzner and Drew, 2005). Moreover, another locomo-tor center, called the diencephalic locomotor region (considered tobe equivalent to the subthalamic locomotor region in mammals),sends direct input to reticulospinal neurons (El Manira et al., 1997;Menard and Grillner, 2008). The possibility that our present resultsmight be explained by the recruitment of descending fibers originat-ing from these two regions is unlikely, because the activation of theMLR was also obtained when stimulating the PT with local injec-tions of glutamate, thus circumventing axonal recruitment. Futurestudies should seek to determine how these different inputs fromsupra-MLR regions are integrated by brainstem motor centers toshape motor output.
At the functional level, the dual inputs could tune the activityof MLR cells for the animal to appropriately approach targets oravoid threats, an essential function for survival. In this context, itis noteworthy that the olfactory bulb sends direct inputs to the PT(Derjean et al., 2010). Olfactory information could thus generatedifferent levels of PT activity to control locomotor output inorder for the animal to reach or avoid olfactory targets. Future
Figure 7. Effect of D1 receptor blockade in the MLR on the graded control of swimming evoked by the PT. In a semi-intact preparation, the PT was stimulated electrically with increasing intensities.
The D1 antagonist SCH 23390 was microinjected in the MLR with a Picospritzer (pipette diameter 15–20 �m; pressure: 3– 4 psi; pulses: 20; duration 20 –50 ms). To quantify swimming frequency,
the angular variations (radians) of the body curvature were measured over time. A, From left to right, incremental PT stimulation (1–15 �A) elicited graded increase in swimming frequencies in
control conditions (top), after microinjections of the D1 receptor antagonist SCH 23390 in the MLR (middle), and after a wash out period of1 h (bottom). The average swimming frequency is indicated for each
trial.B–D,RelationshipsforeachconditionbetweenswimmingfrequencyandPTstimulationintensity(1–16�A;ineachcondition,n�81trialspooledfrom6preparations).Datafollowedasigmoidalfunction
in control condition (B, blue solid line; R 2�0.78, p�0.0001, frequency range 0.3–3.0 Hz), following microinjection of 0.4 –1.5 pmol of SCH 23390 (0.5 mM) in the MLR (C, red solid line; R 2�0.76, p�0.0001,
frequency range 0.3–2.4 Hz) and after wash out (D, green solid line; R 2 � 0.83, p � 0.0001, frequency range 0.5–2.9 Hz). In each condition the dotted lines illustrate the 95% prediction intervals. Locomotor
frequencyandstimulationintensitywereexpressedasapercentageoftheirmaximalvalues.E,Pooleddatawerebinnedasafunctionofstimulationintensity,withabinsizeof10%.Normalizedfrequencieswere
compared for each bin using a two-way ANOVA on ranks. *p �0.05 against control, **p�0.01 against control, ***p �0.001 against control; Student-Newman–Keuls test after a two-way ANOVA on ranks
for repeated measures, p � 0.001. For convenience the sigmoid fits obtained from B–D are illustrated for each condition.
9768 • J. Neurosci., October 4, 2017 • 37(40):9759 –9770 Ryczko et al. • Glutamatergic Control of a Locomotor Center
39
studies should examine whether and how olfactory informationcontrols the activity of cell populations in the PT.
The lamprey is considered as a blueprint of the vertebratebrain (Robertson et al., 2014), suggesting that the descendingglutamatergic pathway from the SNc to brainstem locomotornetworks reported here could be present in all vertebrates. In linewith this possibility, we recently provided evidence that the de-scending dopaminergic pathway from the SNc to the MLR isconserved in amphibians, mammals, and likely humans (Ryczkoet al., 2016b; for review, see Ryczko and Dubuc, 2017). Further-more, the present study suggests that a dysfunction in the regu-lation of the interaction between glutamate and dopamine in theMLR could translate into abnormal activation of the locomotorsystem, and thus result in locomotor deficits such as those re-ported in Parkinson’s disease and other locomotor disorders.
ReferencesAbalo XM, Villar-Cheda B, Anadon R, Rodicio MC (2005) Development of
the dopamine-immunoreactive system in the central nervous system ofthe sea lamprey. Brain Res Bull 66:560 –564. CrossRef Medline
Albin RL, Young AB, Penney JB (1989) The functional anatomy of basalganglia disorders. Trends Neurosci 12:366 –375. CrossRef Medline
Bachmann LC, Matis A, Lindau NT, Felder P, Gullo M, Schwab ME (2013)Deep brain stimulation of the midbrain locomotor region improves pa-retic hindlimb function after spinal cord injury in rats. Sci Transl Med5:208ra146. CrossRef Medline
Barreiro-Iglesias A, Villar-Cervino V, Villar-Cheda B, Anadon R, Rodicio MC(2008) Neurochemical characterization of sea lamprey taste buds andafferent gustatory fibers: presence of serotonin, calretinin, and CGRPimmunoreactivity in taste bud bi-ciliated cells of the earliest vertebrates.J Comp Neurol 511:438 – 453. CrossRef Medline
Bernau NA, Puzdrowski RL, Leonard RB (1991) Identification of the mid-brain locomotor region and its relation to descending locomotor pathways inthe Atlantic stingray, Dasyatis sabina. Brain Res 557:83–94. CrossRef Medline
Bretzner F, Brownstone RM (2013) Lhx3-Chx10 reticulospinal neurons inlocomotor circuits. J Neurosci 33:14681–14692. CrossRef Medline
Bretzner F, Drew T (2005) Contribution of the motor cortex to the structureand the timing of hindlimb locomotion in the cat: a microstimulationstudy. J Neurophysiol 94:657– 672. CrossRef Medline
Brocard F, Dubuc R (2003) Differential contribution of reticulospinal cellsto the control of locomotion induced by the mesencephalic locomotorregion. J Neurophysiol 90:1714 –1727. CrossRef Medline
Brocard F, Ryczko D, Fenelon K, Hatem R, Gonzales D, Auclair F, Dubuc R(2010) The transformation of a unilateral locomotor command into asymmetrical bilateral activation in the brainstem. J Neurosci 30:523–533.CrossRef Medline
Buchanan JT, Grillner S (1987) Newly identified “glutamate interneurons”and their role in locomotion in the lamprey spinal cord. Science 236:312–314. CrossRef Medline
Cabelguen JM, Bourcier-Lucas C, Dubuc R (2003) Bimodal locomotionelicited by electrical stimulation of the midbrain in the salamanderNotophthalmus viridescens. J Neurosci 23:2434 –2439. Medline
Cepeda C, Buchwald NA, Levine MS (1993) Neuromodulatory actions ofdopamine in the neostriatum are dependent upon the excitatory aminoacid receptor subtypes activated. Proc Natl Acad Sci U S A 90:9576 –9580.CrossRef Medline
Chuhma N, Zhang H, Masson J, Zhuang X, Sulzer D, Hen R, Rayport S(2004) Dopamine neurons mediate a fast excitatory signal via their glu-tamatergic synapses. J Neurosci 24:972–981. CrossRef Medline
Dal Bo G, St-Gelais F, Danik M, Williams S, Cotton M, Trudeau LE (2004)Dopamine neurons in culture express VGLUT2 explaining their capacityto release glutamate at synapses in addition to dopamine. J Neurochem88:1398 –1405. CrossRef Medline
Derjean D, Moussaddy A, Atallah E, St-Pierre M, Auclair F, Chang S, Ren X,Zielinski B, Dubuc R (2010) A novel neural substrate for the transfor-mation of olfactory inputs into motor output. PLoS Biol 8:e1000567.CrossRef Medline
Eidelberg E, Walden JG, Nguyen LH (1981) Locomotor control in macaquemonkeys. Brain 104:647– 663. CrossRef Medline
El Manira A, Pombal MA, Grillner S (1997) Diencephalic projection to re-
ticulospinal neurons involved in the initiation of locomotion in adultlampreys Lampetra fluviatilis. J Comp Neurol 389:603– 616. CrossRefMedline
Ericsson J, Stephenson-Jones M, Perez-Fernandez J, Robertson B, SilberbergG, Grillner S (2013) Dopamine differentially modulates the excitabilityof striatal neurons of the direct and indirect pathways in lamprey. J Neu-rosci 33:8045– 8054. CrossRef Medline
Fernandez-Lopez B, Villar-Cervino V, Valle-Maroto SM, Barreiro-Iglesias A,Anadon R, Rodicio MC (2012) The glutamatergic neurons in the spinalcord of the sea lamprey: an in situ hybridization and immunohistochem-ical study. PloS One 7:e47898. CrossRef Medline
Filippi A, Mueller T, Driever W (2014) vglut2 and gad expression revealdistinct patterns of dual GABAergic versus glutamatergic cotransmitterphenotypes of dopaminergic and noradrenergic neurons in the zebrafishbrain. J Comp Neurol 522:2019 –2037. CrossRef Medline
Fortin GM, Bourque MJ, Mendez JA, Leo D, Nordenankar K, Birgner C,Arvidsson E, Rymar VV, Berube-Carriere N, Claveau AM, Descarries L,Sadikot AF, Wallen-Mackenzie Å, Trudeau LE (2012) Glutamate core-lease promotes growth and survival of midbrain dopamine neurons.J Neurosci 32:17477–17491. CrossRef Medline
Garcia-Rill E, Skinner RD (1987a) The mesencephalic locomotor region: I.Activation of a medullary projection site. Brain Res 411:1–12. CrossRefMedline
Garcia-Rill E, Skinner RD (1987b) The mesencephalic locomotor region: II.Projections to reticulospinal neurons. Brain Res 411:13–20. CrossRefMedline
Garcia-Rill E, Houser CR, Skinner RD, Smith W, Woodward DJ (1987)Locomotion-inducing sites in the vicinity of the pedunculopontine nu-cleus. Brain Res Bull 18:731–738. CrossRef Medline
Gariepy JF, Missaghi K, Chevallier S, Chartre S, Robert M, Auclair F, Lund JP,Dubuc R (2012a) Specific neural substrate linking respiration to loco-motion. Proc Natl Acad Sci U S A 109:E84 –E92. CrossRef Medline
Gariepy JF, Missaghi K, Chartre S, Robert M, Auclair F, Dubuc R (2012b)Bilateral connectivity in the brainstem respiratory networks of lampreys.J Comp Neurol 520:1442–1456. CrossRef Medline
Goetz L, Piallat B, Bhattacharjee M, Mathieu H, David O, Chabardes S(2016) On the role of the pedunculopontine nucleus and mesencephalicreticular formation in locomotion in nonhuman primates. J Neurosci36:4917– 4929. CrossRef Medline
Granger AJ, Wallace ML, Sabatini BL (2017) Multi-transmitter neurons inthe mammalian central nervous system. Curr Opin Neurobiol 45:85–91.CrossRef Medline
Grillner S, Robertson B (2016) The basal ganglia over 500 million years.Curr Biol 26:R1088 –R1100. CrossRef Medline
Grillner S, Robertson B, Stephenson-Jones M (2013) The evolutionary ori-gin of the vertebrate basal ganglia and its role in action selection. J Physiol591:5425–5431. CrossRef Medline
Han P, Whelan PJ (2009) Modulation of AMPA currents by D1-like but notD2-like receptors in spinal motoneurons. Neuroscience 158:1699 –1707.CrossRef Medline
Hernandez-Echeagaray E, Starling AJ, Cepeda C, Levine MS (2004) Modu-lation of AMPA currents by D2 dopamine receptors in striatal medium-sizedspiny neurons: are dendrites necessary? Eur J Neurosci 19:2455–2463. CrossRefMedline
Hnasko TS, Chuhma N, Zhang H, Goh GY, Sulzer D, Palmiter RD, Rayport S,Edwards RH (2010) Vesicular glutamate transport promotes dopaminestorage and glutamate corelease in vivo. Neuron 65:643– 656. CrossRefMedline
Islam SS, Zelenin PV (2008) Modifications of locomotor pattern underlyingescape behavior in the lamprey. J Neurophysiol 99:297–307. Medline
Juvin L, Gratsch S, Trillaud-Doppia E, Gariepy JF, Buschges A, Dubuc R(2016) A specific population of reticulospinal neurons controls the ter-mination of locomotion. Cell Rep 15:2377–2386. CrossRef Medline
Karachi C, Grabli D, Bernard FA, Tande D, Wattiez N, Belaid H, Bardinet E,Prigent A, Nothacker HP, Hunot S, Hartmann A, Lehericy S, Hirsch EC,Francois C (2010) Cholinergic mesencephalic neurons are involved ingait and postural disorders in Parkinson disease. J Clin Invest 120:2745–2754. CrossRef Medline
Kawano M, Kawasaki A, Sakata-Haga H, Fukui Y, Kawano H, Nogami H,Hisano S (2006) Particular subpopulations of midbrain and hypotha-lamic dopamine neurons express vesicular glutamate transporter 2 in therat brain. J Comp Neurol 498:581–592. CrossRef Medline
Ryczko et al. • Glutamatergic Control of a Locomotor Center J. Neurosci., October 4, 2017 • 37(40):9759 –9770 • 9769
40
Kravitz AV, Freeze BS, Parker PR, Kay K, Thwin MT, Deisseroth K, KreitzerAC (2010) Regulation of parkinsonian motor behaviours by optogeneticcontrol of basal ganglia circuitry. Nature 466:622–626. CrossRef Medline
Lee AM, Hoy JL, Bonci A, Wilbrecht L, Stryker MP, Niell CM (2014) Iden-tification of a brainstem circuit regulating visual cortical state in parallelwith locomotion. Neuron 83:455– 466. CrossRef Medline
Le Ray D, Brocard F, Bourcier-Lucas C, Auclair F, Lafaille P, Dubuc R (2003)Nicotinic activation of reticulospinal cells involved in the control ofswimming in lampreys. Eur J Neurosci 17:137–148. CrossRef Medline
Marlinsky VV, Voitenko LP (1991) The effect of procaine injection into themedullary reticular formation on forelimb muscle activity evoked by mes-encephalic locomotor region and vestibular stimulation in the decere-brated guinea-pig. Neuroscience 45:753–759. CrossRef Medline
Menard A, Grillner S (2008) Diencephalic locomotor region in the lamprey:afferents and efferent control. J Neurophysiol 100:1343–1353. CrossRefMedline
Menard A, Auclair F, Bourcier-Lucas C, Grillner S, Dubuc R (2007) De-scending GABAergic projections to the mesencephalic locomotor regionin the lamprey Petromyzon marinus. J Comp Neurol 501:260–273. CrossRefMedline
Morales M, Root DH (2014) Glutamate neurons within the midbrain dopa-mine regions. Neuroscience 282:60 – 68. CrossRef Medline
Musienko PE, Zelenin PV, Lyalka VF, Orlovsky GN, Deliagina TG (2008)Postural performance in decerebrated rabbit. Behav Brain Res 190:124 –134. CrossRef Medline
Musienko PE, Zelenin PV, Lyalka VF, Gerasimenko YP, Orlovsky GN, Delia-gina TG (2012) Spinal and supraspinal control of the direction of step-ping during locomotion. J Neurosci 32:17442–17453. CrossRef Medline
Noga BR, Kriellaars DJ, Jordan LM (1991) The effect of selective brainstemor spinal cord lesions on treadmill locomotion evoked by stimulation ofthe mesencephalic or pontomedullary locomotor regions. J Neurosci 11:1691–1700. Medline
Ocana FM, Suryanarayana SM, Saitoh K, Kardamakis AA, Capantini L, Rob-ertson B, Grillner S (2015) The lamprey pallium provides a blueprint ofthe mammalian motor projections from cortex. Curr Biol 25:413– 423.CrossRef Medline
Orlovskiı GN (1970) Work of reticulo-spinal neurons during locomotion(in Russian). Biofizika 15:728 –737. Medline
Perez-Fernandez J, Stephenson-Jones M, Suryanarayana SM, Robertson B,Grillner S (2014) Evolutionarily conserved organization of the dopami-nergic system in lamprey: SNc/VTA afferent and efferent connectivity andD2 receptor expression. J Comp Neurol 522:3775–3794. CrossRef Medline
Pierre J, Mahouche M, Suderevskaya EI, Reperant J, Ward R (1997) Immu-nocytochemical localization of dopamine and its synthetic enzymes in thecentral nervous system of the lamprey Lampetra fluviatilis. J Comp Neurol380:119 –135. CrossRef Medline
Pombal MA, El Manira A, Grillner S (1997) Afferents of the lamprey striatumwith special reference to the dopaminergic system: a combined tracing andimmunohistochemical study. J Comp Neurol 386:71–91. CrossRef Medline
Redgrave P, Prescott TJ, Gurney K (1999) The basal ganglia: a vertebratesolution to the selection problem? Neuroscience 89:1009 –1023. CrossRefMedline
Robertson B, Huerta-Ocampo I, Ericsson J, Stephenson-Jones M, Perez-Fernandez J, Bolam JP, Diaz-Heijtz R, Grillner S (2012) The dopamineD2 receptor gene in lamprey, its expression in the striatum and cellulareffects of D2 receptor activation. PloS One 7:e35642. CrossRef Medline
Robertson B, Kardamakis A, Capantini L, Perez-Fernandez J, SuryanarayanaSM, Wallen P, Stephenson-Jones M, Grillner S (2014) The lampreyblueprint of the mammalian nervous system. Prog Brain Res 212:337–349. CrossRef Medline
Roseberry TK, Lee AM, Lalive AL, Wilbrecht L, Bonci A, Kreitzer AC (2016)Cell-type-specific control of brainstem locomotor circuits by basal gan-glia. Cell 164:526 –537. CrossRef Medline
Rovainen CM (1967) Physiological and anatomical studies on large neuronsof central nervous system of the sea lamprey (Petromyzon marinus): I.Muller and Mauthner cells. J Neurophysiol 30:1000 –1023. Medline
Ryczko D, Dubuc R (2013) The multifunctional mesencephalic locomotorregion. Curr Pharm Des 19:4448 – 4470. CrossRef Medline
Ryczko D, Gratsch S, Auclair F, Dube C, Bergeron S, Alpert MH, Cone JJ,Roitman MF, Alford S, Dubuc R (2013) Forebrain dopamine neurons
project down to a brainstem region controlling locomotion. Proc NatlAcad Sci U S A 110:E3235–3242. CrossRef Medline
Ryczko D, Auclair F, Cabelguen JM, Dubuc R (2016a) The mesencephaliclocomotor region sends a bilateral glutamatergic drive to hindbrain reticu-lospinal neurons in a tetrapod. J Comp Neurol 524:1361–1383. CrossRefMedline
Ryczko D, Cone JJ, Alpert MH, Goetz L, Auclair F, Dube C, Parent M, Roit-man MF, Alford S, Dubuc R (2016b) A descending dopamine pathwayconserved from basal vertebrates to mammals. Proc Natl Acad Sci U S A113:E2440 –2449. CrossRef Medline
Ryczko D, Dubuc R (2017) Dopamine and the brainstem locomotor net-works: from lamprey to human. Front Neurosci 11:295. CrossRefMedline
Shik ML, Severin FV, Orlovskiı GN (1966) Control of walking and runningby means of electric stimulation of the midbrain (in Russian). Biofizika11:659 – 666. Medline
Sholomenko GN, Funk GD, Steeves JD (1991) Avian locomotion activatedby brainstem infusion of neurotransmitter agonists and antagonists: II.�-Aminobutyric acid. Exp Brain Res 85:674 – 681. CrossRef Medline
Sirota MG, Di Prisco GV, Dubuc R (2000) Stimulation of the mesencephaliclocomotor region elicits controlled swimming in semi-intact lampreys.Eur J Neurosci 12:4081– 4092. CrossRef Medline
Steeves JD, Jordan LM (1980) Localization of a descending pathway in thespinal cord which is necessary for controlled treadmill locomotion. Neu-rosci Lett 20:283–288. CrossRef Medline
Stephenson-Jones M, Samuelsson E, Ericsson J, Robertson B, Grillner S(2011) Evolutionary conservation of the basal ganglia as a common verte-brate mechanism for action selection. Curr Biol 21:1081–1091. CrossRefMedline
Stephenson-Jones M, Ericsson J, Robertson B, Grillner S (2012) Evolutionof the basal ganglia: dual-output pathways conserved throughout verte-brate phylogeny. J Comp Neurol 520:2957–2973. CrossRef Medline
Stuber GD, Hnasko TS, Britt JP, Edwards RH, Bonci A (2010) Dopaminer-gic terminals in the nucleus accumbens but not the dorsal striatum core-lease glutamate. J Neurosci 30:8229 – 8233. CrossRef Medline
Sulzer D, Joyce MP, Lin L, Geldwert D, Haber SN, Hattori T, Rayport S(1998) Dopamine neurons make glutamatergic synapses in vitro. J Neu-rosci 18:4588 – 4602. Medline
Svensson E, Wikstrom MA, Hill RH, Grillner S (2003a) Endogenous andexogenous dopamine presynaptically inhibits glutamatergic reticulospi-nal transmission via an action of D2-receptors on N-type Ca2� channels.Eur J Neurosci 17:447– 454. CrossRef Medline
Svensson E, Woolley J, Wikstrom M, Grillner S (2003b) Endogenous dopa-minergic modulation of the lamprey spinal locomotor network. Brain Res970:1– 8. CrossRef Medline
Takakusaki K, Habaguchi T, Ohtinata-Sugimoto J, Saitoh K, Sakamoto T(2003) Basal ganglia efferents to the brainstem centers controlling pos-tural muscle tone and locomotion: a new concept for understanding mo-tor disorders in basal ganglia dysfunction. Neuroscience 119:293–308.CrossRef Medline
Tritsch NX, Sabatini BL (2012) Dopaminergic modulation of synaptictransmission in cortex and striatum. Neuron 76:33–50. CrossRef Medline
Tseng KY, O’Donnell P (2004) Dopamine-glutamate interactions control-ling prefrontal cortical pyramidal cell excitability involve multiple signal-ing mechanisms. J Neurosci 24:5131–5139. CrossRef Medline
Villar-Cervino V, Abalo XM, Villar-Cheda B, Melendez-Ferro M, Perez-Costas E, Holstein GR, Martinelli GP, Rodicio MC, Anadon R (2006)Presence of glutamate, glycine, and gamma-aminobutyric acid in the ret-ina of the larval sea lamprey: comparative immunohistochemical study ofclassical neurotransmitters in larval and postmetamorphic retinas.J Comp Neurol 499:810 – 827. CrossRef Medline
Villar-Cervino V, Barreiro-Iglesias A, Mazan S, Rodicio MC, Anadon R(2011) Glutamatergic neuronal populations in the forebrain of the sealamprey, Petromyzon marinus: an in situ hybridization and immunocyto-chemical study. J Comp Neurol 519:1712–1735. CrossRef Medline
Villar-Cervino V, Barreiro-Iglesias A, Fernandez-Lopez B, Mazan S, RodicioMC, Anadon R (2013) Glutamatergic neuronal populations in thebrainstem of the sea lamprey, Petromyzon marinus: an in situ hybridiza-tion and immunocytochemical study. J Comp Neurol 521:522–557.CrossRef Medline
9770 • J. Neurosci., October 4, 2017 • 37(40):9759 –9770 Ryczko et al. • Glutamatergic Control of a Locomotor Center
41
5.3. A specific population of reticulospinal neurons controls the termination of
locomotion
Juvin. L.,* Grätsch, S.,* Trillaud-Doppia, E., Gariépy, J.F., Büschges, A., and Dubuc, R.
* co-first authors
Published 2016 in Cell Reports, 15(11):2377-86.
Author contributions
Designed research:
Laurent Juvin, Swantje Grätsch, and Réjean Dubuc.
Performed research:
Laurent Juvin, Swantje Grätsch, Emilie Trillaud-Doppia, and Jean-François Gariépy.
Analyzed data:
Laurent Juvin, Swantje Grätsch, Emilie Trillaud-Doppia, and Jean-François Gariépy.
Wrote the paper:
Laurent Juvin, Swantje Grätsch, Ansgar Büschges, and Réjean Dubuc.
This paper was reproduced with the permission from the publisher.
42
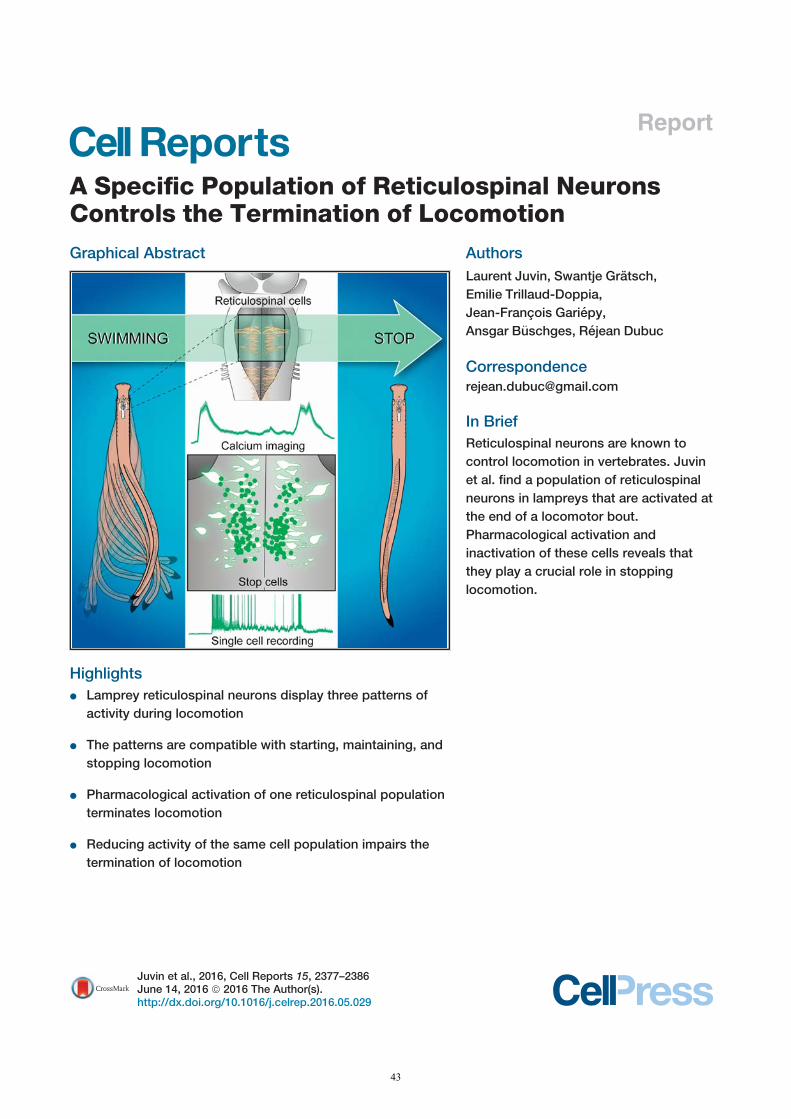
Report
A Specific Population of Reticulospinal NeuronsControls the Termination of Locomotion
Graphical Abstract
Highlights
d Lamprey reticulospinal neurons display three patterns of
activity during locomotion
d The patterns are compatible with starting, maintaining, and
stopping locomotion
d Pharmacological activation of one reticulospinal population
terminates locomotion
d Reducing activity of the same cell population impairs the
termination of locomotion
Authors
Laurent Juvin, Swantje Gratsch,
Emilie Trillaud-Doppia,
Jean-Francois Gariepy,
Ansgar B€uschges, Rejean Dubuc
In Brief
Reticulospinal neurons are known to
control locomotion in vertebrates. Juvin
et al. find a population of reticulospinal
neurons in lampreys that are activated at
the end of a locomotor bout.
Pharmacological activation and
inactivation of these cells reveals that
they play a crucial role in stopping
locomotion.
Juvin et al., 2016, Cell Reports 15, 2377–2386June 14, 2016 ª 2016 The Author(s).http://dx.doi.org/10.1016/j.celrep.2016.05.029
43
Cell Reports
Report
A Specific Population of Reticulospinal NeuronsControls the Termination of LocomotionLaurent Juvin,1,4 Swantje Gratsch,1,2,3,4 Emilie Trillaud-Doppia,1 Jean-Francois Gariepy,1 Ansgar B€uschges,3
and Rejean Dubuc1,2,*1Department of Neuroscience, Universite de Montreal, Montreal, QC H3C 3J7, Canada2Department of Sciences de l’Activite Physique, Universite du Quebec a Montreal, Montreal, QC H3C 3P8, Canada3Department of Animal Physiology, Biocenter Cologne, University of Cologne, 50674 Cologne, Germany4Co-first author*Correspondence: [email protected]
http://dx.doi.org/10.1016/j.celrep.2016.05.029
SUMMARY
Locomotion requires the proper sequencing of neu-ral activity to start, maintain, and stop it. Recently,brainstem neurons were shown to specifically stoplocomotion in mammals. However, the cellular prop-erties of these neurons and their activity during loco-motion are still unknown. Here, we took advantage ofthe lamprey model to characterize the activity of acell population that we now show to be involved instopping locomotion. We find that these neuronsdisplay a burst of spikes that coincides with theend of swimming activity. Their pharmacologicalactivation ends ongoing swimming, whereas theinactivation of these neurons dramatically impairsthe rapid termination of swimming. These neuronsare henceforth referred to as stop cells, becausethey play a crucial role in the termination of locomo-tion. Our findings contribute to the fundamental un-derstanding of motor control and provide importantdetails about the cellular mechanisms involved inlocomotor termination.
INTRODUCTION
Locomotion is a basic motor function vital for survival. In verte-
brates, central pattern generators (CPGs) in the spinal cord are
responsible for generating the rhythmic muscle synergies un-
derlying body propulsion, whereas supraspinal structures play
a crucial role in starting, maintaining, and stopping locomotion
(for review, see Grillner et al., 1998). Brainstem reticulospinal
(RS) cells project directly to spinal CPG neurons. They are in
turn activated by the mesencephalic locomotor region (MLR),
which initiates and maintains locomotion and controls the in-
tensity of the locomotor output like a rheostat (for review, see
Dubuc et al., 2008; Ryczko and Dubuc, 2013). In lampreys, uni-
lateral stimulation of the MLR induces bilaterally symmetrical
swimming with similar activation of RS cells on both sides (Bro-
card et al., 2010). The MLR inputs activate RS cells via both
cholinergic and glutamatergic receptors (Brocard and Dubuc,
2003; Le Ray et al., 2003). The MLR also activates muscarino-
ceptive cells in the lower brainstem that provide additional exci-
tation to RS cells through a parallel connection (Smetana et al.,
2010).
How locomotion is initiated and maintained was examined
intensively in the past, and some of the underlying neural mech-
anisms are well understood (for review, see Dubuc et al., 2008).
The termination of locomotion has remained far more elusive (for
review, seeMullins et al., 2011). Recently, a genetically identified
group of V2a cells in mice was described as halting locomotion
when activated optogenetically (Bouvier et al., 2015). Blocking
the synaptic output of these V2a stop neurons dramatically
impaired the termination of locomotion in free-walking animals.
Because these cells were not yet accessible for intracellular re-
cordings, no details relative to their cellular activity and mem-
brane properties were provided.
Using calcium imaging, electrophysiological, and kinematic
techniques, we identify a specific population of lamprey RS cells
that showed functional features similar to those of mouse V2a
stop neurons. Using strengths of the lamprey model, we were
able to describe the cellular activity and membrane properties
of these cells. We thus demonstrate that these neurons produce
a transient burst of spikes when locomotion terminates. This
termination burst was present when locomotion was elicited by
MLR stimulation, was sensory evoked, or occurred spontane-
ously. Pharmacological activation of these neurons with D-gluta-
mate halted ongoing locomotor activity, whereas inactivation of
these cells dramatically impaired locomotor termination. In line
with these findings, we have named this RS cell population
stop cells.
RESULTS
RS Neurons in the MRRN Show Three Distinct Patternsof ActivityIn lampreys, RS neurons from themiddle rhombencephalic retic-
ular nucleus (MRRN) have been identified as command cells and
were shown to be essential for the initiation and control of loco-
motion (Brocard and Dubuc, 2003). They have been described
as key elements of a neural circuit controlling locomotor speed
and swimming direction (Smetana et al., 2010; Deliagina et al.,
2008). Despite the key role played by these neurons in locomo-
tion, the activity of only a small number of lamprey RS cells,
namely, the large MRRN cells (M€uller and Mauthner cells), was
Cell Reports 15, 2377–2386, June 14, 2016 ª 2016 The Author(s). 2377This is an open access article under the CC BY license (http://creativecommons.org/licenses/by/4.0/).
44
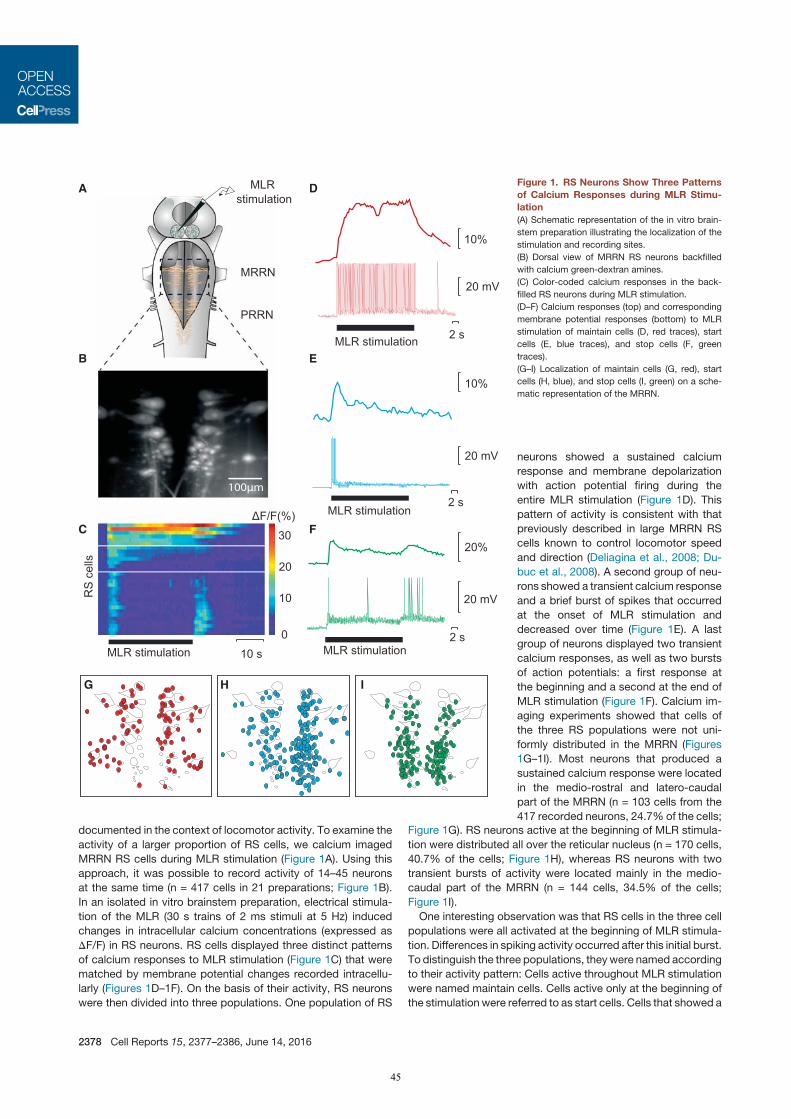
documented in the context of locomotor activity. To examine the
activity of a larger proportion of RS cells, we calcium imaged
MRRN RS cells during MLR stimulation (Figure 1A). Using this
approach, it was possible to record activity of 14–45 neurons
at the same time (n = 417 cells in 21 preparations; Figure 1B).
In an isolated in vitro brainstem preparation, electrical stimula-
tion of the MLR (30 s trains of 2 ms stimuli at 5 Hz) induced
changes in intracellular calcium concentrations (expressed as
DF/F) in RS neurons. RS cells displayed three distinct patterns
of calcium responses to MLR stimulation (Figure 1C) that were
matched by membrane potential changes recorded intracellu-
larly (Figures 1D–1F). On the basis of their activity, RS neurons
were then divided into three populations. One population of RS
stimulationMLR
MLR stimulation 10 s
30
20
10
0
ΔF/F(%)
RS
cel
ls
20 mV
10%
2 sMLR stimulation
10%
20 mV
2 sMLR stimulation
20%
20 mV
2 sMLR stimulation
B
G
C
DA
E
F
H I
100μm
MRRN
PRRN
Figure 1. RS Neurons Show Three Patterns
of Calcium Responses during MLR Stimu-
lation
(A) Schematic representation of the in vitro brain-
stem preparation illustrating the localization of the
stimulation and recording sites.
(B) Dorsal view of MRRN RS neurons backfilled
with calcium green-dextran amines.
(C) Color-coded calcium responses in the back-
filled RS neurons during MLR stimulation.
(D–F) Calcium responses (top) and corresponding
membrane potential responses (bottom) to MLR
stimulation of maintain cells (D, red traces), start
cells (E, blue traces), and stop cells (F, green
traces).
(G–I) Localization of maintain cells (G, red), start
cells (H, blue), and stop cells (I, green) on a sche-
matic representation of the MRRN.
neurons showed a sustained calcium
response and membrane depolarization
with action potential firing during the
entire MLR stimulation (Figure 1D). This
pattern of activity is consistent with that
previously described in large MRRN RS
cells known to control locomotor speed
and direction (Deliagina et al., 2008; Du-
buc et al., 2008). A second group of neu-
rons showed a transient calcium response
and a brief burst of spikes that occurred
at the onset of MLR stimulation and
decreased over time (Figure 1E). A last
group of neurons displayed two transient
calcium responses, as well as two bursts
of action potentials: a first response at
the beginning and a second at the end of
MLR stimulation (Figure 1F). Calcium im-
aging experiments showed that cells of
the three RS populations were not uni-
formly distributed in the MRRN (Figures
1G–1I). Most neurons that produced a
sustained calcium response were located
in the medio-rostral and latero-caudal
part of the MRRN (n = 103 cells from the
417 recorded neurons, 24.7% of the cells;Figure 1G). RS neurons active at the beginning of MLR stimula-
tion were distributed all over the reticular nucleus (n = 170 cells,
40.7% of the cells; Figure 1H), whereas RS neurons with two
transient bursts of activity were located mainly in the medio-
caudal part of the MRRN (n = 144 cells, 34.5% of the cells;
Figure 1I).
One interesting observation was that RS cells in the three cell
populations were all activated at the beginning of MLR stimula-
tion. Differences in spiking activity occurred after this initial burst.
To distinguish the three populations, theywere named according
to their activity pattern: Cells active throughout MLR stimulation
were named maintain cells. Cells active only at the beginning of
the stimulation were referred to as start cells. Cells that showed a
2378 Cell Reports 15, 2377–2386, June 14, 2016
45
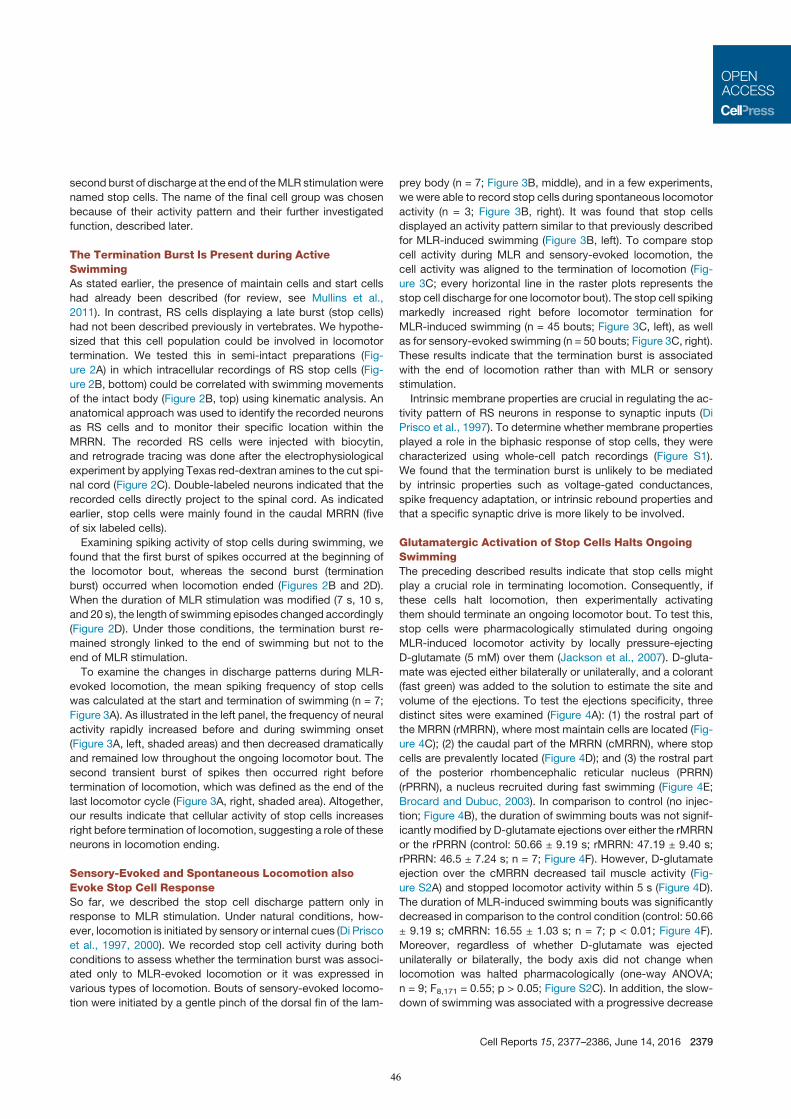
second burst of discharge at the end of theMLR stimulation were
named stop cells. The name of the final cell group was chosen
because of their activity pattern and their further investigated
function, described later.
The Termination Burst Is Present during ActiveSwimmingAs stated earlier, the presence of maintain cells and start cells
had already been described (for review, see Mullins et al.,
2011). In contrast, RS cells displaying a late burst (stop cells)
had not been described previously in vertebrates. We hypothe-
sized that this cell population could be involved in locomotor
termination. We tested this in semi-intact preparations (Fig-
ure 2A) in which intracellular recordings of RS stop cells (Fig-
ure 2B, bottom) could be correlated with swimming movements
of the intact body (Figure 2B, top) using kinematic analysis. An
anatomical approach was used to identify the recorded neurons
as RS cells and to monitor their specific location within the
MRRN. The recorded RS cells were injected with biocytin,
and retrograde tracing was done after the electrophysiological
experiment by applying Texas red-dextran amines to the cut spi-
nal cord (Figure 2C). Double-labeled neurons indicated that the
recorded cells directly project to the spinal cord. As indicated
earlier, stop cells were mainly found in the caudal MRRN (five
of six labeled cells).
Examining spiking activity of stop cells during swimming, we
found that the first burst of spikes occurred at the beginning of
the locomotor bout, whereas the second burst (termination
burst) occurred when locomotion ended (Figures 2B and 2D).
When the duration of MLR stimulation was modified (7 s, 10 s,
and 20 s), the length of swimming episodes changed accordingly
(Figure 2D). Under those conditions, the termination burst re-
mained strongly linked to the end of swimming but not to the
end of MLR stimulation.
To examine the changes in discharge patterns during MLR-
evoked locomotion, the mean spiking frequency of stop cells
was calculated at the start and termination of swimming (n = 7;
Figure 3A). As illustrated in the left panel, the frequency of neural
activity rapidly increased before and during swimming onset
(Figure 3A, left, shaded areas) and then decreased dramatically
and remained low throughout the ongoing locomotor bout. The
second transient burst of spikes then occurred right before
termination of locomotion, which was defined as the end of the
last locomotor cycle (Figure 3A, right, shaded area). Altogether,
our results indicate that cellular activity of stop cells increases
right before termination of locomotion, suggesting a role of these
neurons in locomotion ending.
Sensory-Evoked and Spontaneous Locomotion alsoEvoke Stop Cell ResponseSo far, we described the stop cell discharge pattern only in
response to MLR stimulation. Under natural conditions, how-
ever, locomotion is initiated by sensory or internal cues (Di Prisco
et al., 1997, 2000). We recorded stop cell activity during both
conditions to assess whether the termination burst was associ-
ated only to MLR-evoked locomotion or it was expressed in
various types of locomotion. Bouts of sensory-evoked locomo-
tion were initiated by a gentle pinch of the dorsal fin of the lam-
prey body (n = 7; Figure 3B, middle), and in a few experiments,
we were able to record stop cells during spontaneous locomotor
activity (n = 3; Figure 3B, right). It was found that stop cells
displayed an activity pattern similar to that previously described
for MLR-induced swimming (Figure 3B, left). To compare stop
cell activity during MLR and sensory-evoked locomotion, the
cell activity was aligned to the termination of locomotion (Fig-
ure 3C; every horizontal line in the raster plots represents the
stop cell discharge for one locomotor bout). The stop cell spiking
markedly increased right before locomotor termination for
MLR-induced swimming (n = 45 bouts; Figure 3C, left), as well
as for sensory-evoked swimming (n = 50 bouts; Figure 3C, right).
These results indicate that the termination burst is associated
with the end of locomotion rather than with MLR or sensory
stimulation.
Intrinsic membrane properties are crucial in regulating the ac-
tivity pattern of RS neurons in response to synaptic inputs (Di
Prisco et al., 1997). To determine whether membrane properties
played a role in the biphasic response of stop cells, they were
characterized using whole-cell patch recordings (Figure S1).
We found that the termination burst is unlikely to be mediated
by intrinsic properties such as voltage-gated conductances,
spike frequency adaptation, or intrinsic rebound properties and
that a specific synaptic drive is more likely to be involved.
Glutamatergic Activation of Stop Cells Halts OngoingSwimmingThe preceding described results indicate that stop cells might
play a crucial role in terminating locomotion. Consequently, if
these cells halt locomotion, then experimentally activating
them should terminate an ongoing locomotor bout. To test this,
stop cells were pharmacologically stimulated during ongoing
MLR-induced locomotor activity by locally pressure-ejecting
D-glutamate (5 mM) over them (Jackson et al., 2007). D-gluta-
mate was ejected either bilaterally or unilaterally, and a colorant
(fast green) was added to the solution to estimate the site and
volume of the ejections. To test the ejections specificity, three
distinct sites were examined (Figure 4A): (1) the rostral part of
the MRRN (rMRRN), where most maintain cells are located (Fig-
ure 4C); (2) the caudal part of the MRRN (cMRRN), where stop
cells are prevalently located (Figure 4D); and (3) the rostral part
of the posterior rhombencephalic reticular nucleus (PRRN)
(rPRRN), a nucleus recruited during fast swimming (Figure 4E;
Brocard and Dubuc, 2003). In comparison to control (no injec-
tion; Figure 4B), the duration of swimming bouts was not signif-
icantly modified by D-glutamate ejections over either the rMRRN
or the rPRRN (control: 50.66 ± 9.19 s; rMRRN: 47.19 ± 9.40 s;
rPRRN: 46.5 ± 7.24 s; n = 7; Figure 4F). However, D-glutamate
ejection over the cMRRN decreased tail muscle activity (Fig-
ure S2A) and stopped locomotor activity within 5 s (Figure 4D).
The duration of MLR-induced swimming bouts was significantly
decreased in comparison to the control condition (control: 50.66
± 9.19 s; cMRRN: 16.55 ± 1.03 s; n = 7; p < 0.01; Figure 4F).
Moreover, regardless of whether D-glutamate was ejected
unilaterally or bilaterally, the body axis did not change when
locomotion was halted pharmacologically (one-way ANOVA;
n = 9; F8,171 = 0.55; p > 0.05; Figure S2C). In addition, the slow-
down of swimming was associated with a progressive decrease
Cell Reports 15, 2377–2386, June 14, 2016 2379
46
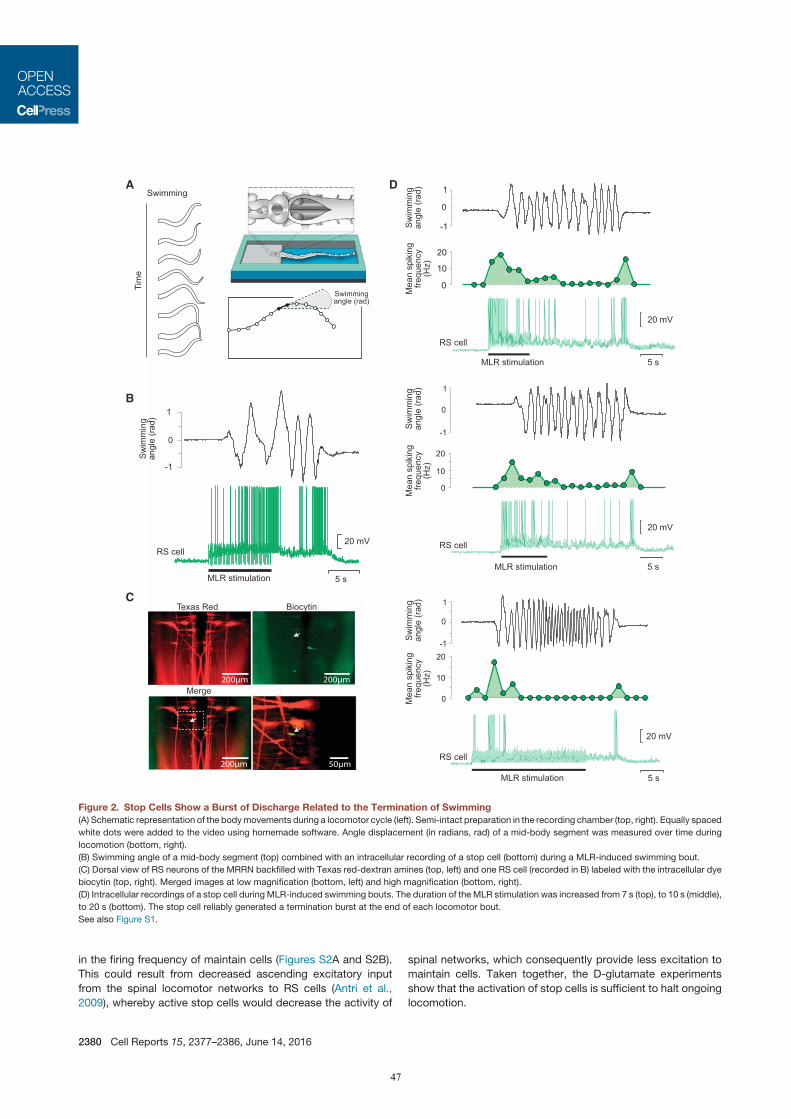
in the firing frequency of maintain cells (Figures S2A and S2B).
This could result from decreased ascending excitatory input
from the spinal locomotor networks to RS cells (Antri et al.,
2009), whereby active stop cells would decrease the activity of
spinal networks, which consequently provide less excitation to
maintain cells. Taken together, the D-glutamate experiments
show that the activation of stop cells is sufficient to halt ongoing
locomotion.
200μm200μm
200μm
Texas Red Biocytin
Merge
50μm
0
10
20
20 mV
1
0
-1
MLR stimulation 5 s
RS cell
0
10
20
-1
0
1
MLR stimulation
20 mV
5 s
RS cell
-1
0
1
0
10
20
5 s
20 mV
RS cell
MLR stimulation
Swimming
Swimming angle (rad)
Tim
e
A
B
D
Sw
imm
ing
angl
e (r
ad)
Sw
imm
ing
angl
e (r
ad)
Sw
imm
ing
angl
e (r
ad)
1
RS cell20 mV
MLR stimulation 5 s
Sw
imm
ing
angl
e (r
ad)
0
-1
C
Mea
n sp
ikin
g fre
quen
cy
(Hz)
Mea
n sp
ikin
g fre
quen
cy
(Hz)
Mea
n sp
ikin
g fre
quen
cy
(Hz)
Figure 2. Stop Cells Show a Burst of Discharge Related to the Termination of Swimming
(A) Schematic representation of the bodymovements during a locomotor cycle (left). Semi-intact preparation in the recording chamber (top, right). Equally spaced
white dots were added to the video using homemade software. Angle displacement (in radians, rad) of a mid-body segment was measured over time during
locomotion (bottom, right).
(B) Swimming angle of a mid-body segment (top) combined with an intracellular recording of a stop cell (bottom) during a MLR-induced swimming bout.
(C) Dorsal view of RS neurons of the MRRN backfilled with Texas red-dextran amines (top, left) and one RS cell (recorded in B) labeled with the intracellular dye
biocytin (top, right). Merged images at low magnification (bottom, left) and high magnification (bottom, right).
(D) Intracellular recordings of a stop cell during MLR-induced swimming bouts. The duration of the MLR stimulation was increased from 7 s (top), to 10 s (middle),
to 20 s (bottom). The stop cell reliably generated a termination burst at the end of each locomotor bout.
See also Figure S1.
2380 Cell Reports 15, 2377–2386, June 14, 2016
47
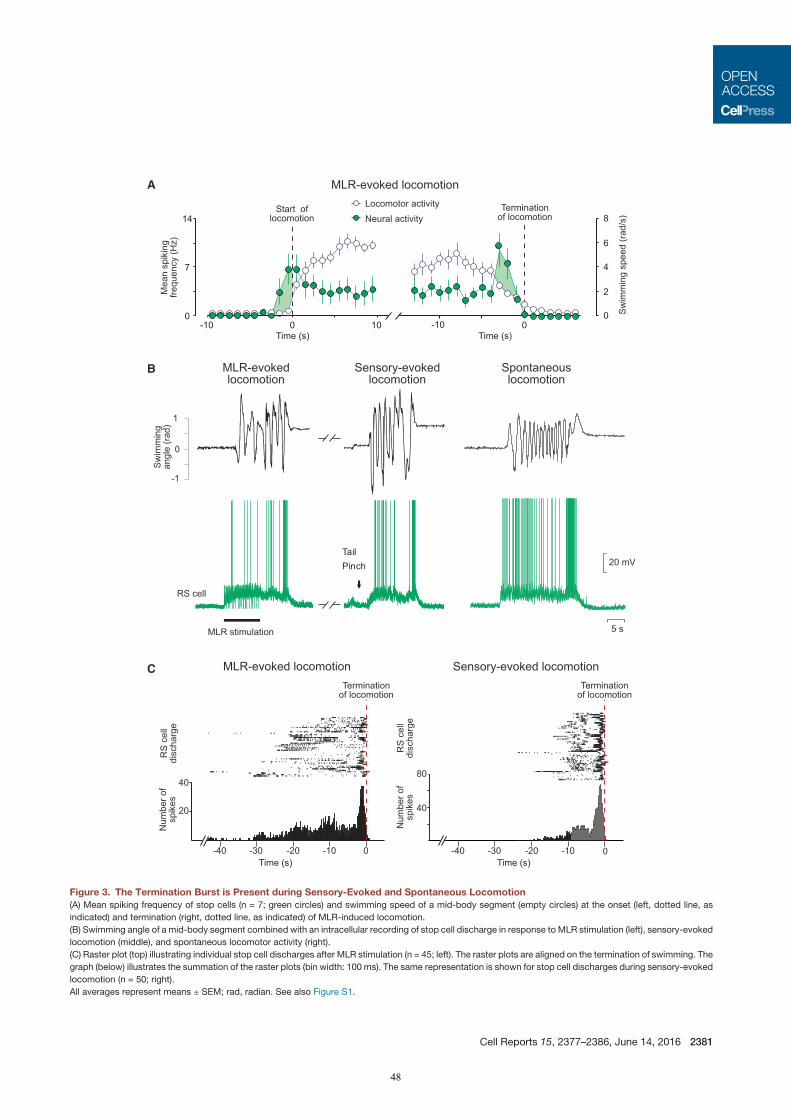
B
0
7
14
-10 0 10Time (s) Time (s)
Locomotor activityNeural activity
0
2
4
6
8
Sw
imm
ing
spee
d (r
ad/s
)
0-10
Termination of locomotion
Start of locomotion
A MLR-evoked locomotion
C
MLR-evokedlocomotion
Sensory-evokedlocomotion
Spontaneouslocomotion
MLR stimulation
RS cell
5 s
20 mVTailPinch
Sw
imm
ing
angl
e (r
ad)
1
0
-1
Termination of locomotion
40
80
RS
cel
l di
scha
rge
Num
ber o
f sp
ikes
0-10-20-30-40
Sensory-evoked locomotionMLR-evoked locomotionTermination
of locomotion
40
20
RS
cel
l di
scha
rge
Num
ber o
f sp
ikes
0-10-20-30-40Time (s)Time (s)
Mea
n sp
ikin
g fre
quen
cy (H
z)
Figure 3. The Termination Burst is Present during Sensory-Evoked and Spontaneous Locomotion
(A) Mean spiking frequency of stop cells (n = 7; green circles) and swimming speed of a mid-body segment (empty circles) at the onset (left, dotted line, as
indicated) and termination (right, dotted line, as indicated) of MLR-induced locomotion.
(B) Swimming angle of a mid-body segment combined with an intracellular recording of stop cell discharge in response to MLR stimulation (left), sensory-evoked
locomotion (middle), and spontaneous locomotor activity (right).
(C) Raster plot (top) illustrating individual stop cell discharges after MLR stimulation (n = 45; left). The raster plots are aligned on the termination of swimming. The
graph (below) illustrates the summation of the raster plots (bin width: 100 ms). The same representation is shown for stop cell discharges during sensory-evoked
locomotion (n = 50; right).
All averages represent means ± SEM; rad, radian. See also Figure S1.
Cell Reports 15, 2377–2386, June 14, 2016 2381
48
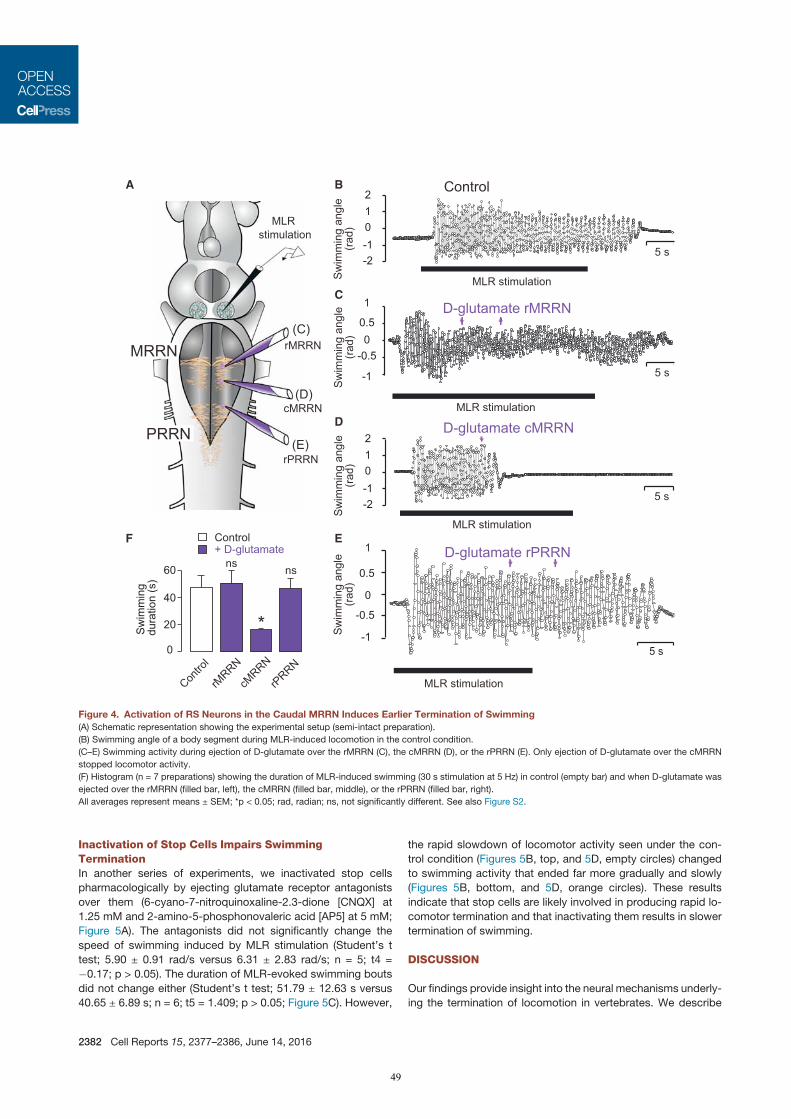
Inactivation of Stop Cells Impairs SwimmingTerminationIn another series of experiments, we inactivated stop cells
pharmacologically by ejecting glutamate receptor antagonists
over them (6-cyano-7-nitroquinoxaline-2.3-dione [CNQX] at
1.25 mM and 2-amino-5-phosphonovaleric acid [AP5] at 5 mM;
Figure 5A). The antagonists did not significantly change the
speed of swimming induced by MLR stimulation (Student’s t
test; 5.90 ± 0.91 rad/s versus 6.31 ± 2.83 rad/s; n = 5; t4 =
�0.17; p > 0.05). The duration of MLR-evoked swimming bouts
did not change either (Student’s t test; 51.79 ± 12.63 s versus
40.65 ± 6.89 s; n = 6; t5 = 1.409; p > 0.05; Figure 5C). However,
the rapid slowdown of locomotor activity seen under the con-
trol condition (Figures 5B, top, and 5D, empty circles) changed
to swimming activity that ended far more gradually and slowly
(Figures 5B, bottom, and 5D, orange circles). These results
indicate that stop cells are likely involved in producing rapid lo-
comotor termination and that inactivating them results in slower
termination of swimming.
DISCUSSION
Our findings provide insight into the neural mechanisms underly-
ing the termination of locomotion in vertebrates. We describe
5 s
5 s
-2-1012
-2-1012
MLR stimulation
MLR stimulation
MLR stimulation
MLR stimulation
5 s
B
5 s
0
1
-1
C
E
D
-0.5
-0.5
00.5
0.5
1
-1
*
F
0
20
40
60
Sw
imm
ing
dur
atio
n (s
)
ns ns
Control
Contro
l
rMRRN
cMRRN
rPRRN
+ D-glutamate
A
(C)
(D)
(E)
rMRRN
cMRRN
rPRRN
stimulationMLR
MRRN
PRRN
Sw
imm
ing
angl
e (r
ad)
Sw
imm
ing
angl
e (r
ad)
Sw
imm
ing
angl
e (r
ad)
Sw
imm
ing
angl
e (r
ad)
Control
D-glutamate cMRRN
D-glutamate rPRRN
D-glutamate rMRRN
Figure 4. Activation of RS Neurons in the Caudal MRRN Induces Earlier Termination of Swimming
(A) Schematic representation showing the experimental setup (semi-intact preparation).
(B) Swimming angle of a body segment during MLR-induced locomotion in the control condition.
(C–E) Swimming activity during ejection of D-glutamate over the rMRRN (C), the cMRRN (D), or the rPRRN (E). Only ejection of D-glutamate over the cMRRN
stopped locomotor activity.
(F) Histogram (n = 7 preparations) showing the duration of MLR-induced swimming (30 s stimulation at 5 Hz) in control (empty bar) and when D-glutamate was
ejected over the rMRRN (filled bar, left), the cMRRN (filled bar, middle), or the rPRRN (filled bar, right).
All averages represent means ± SEM; *p < 0.05; rad, radian; ns, not significantly different. See also Figure S2.
2382 Cell Reports 15, 2377–2386, June 14, 2016
49
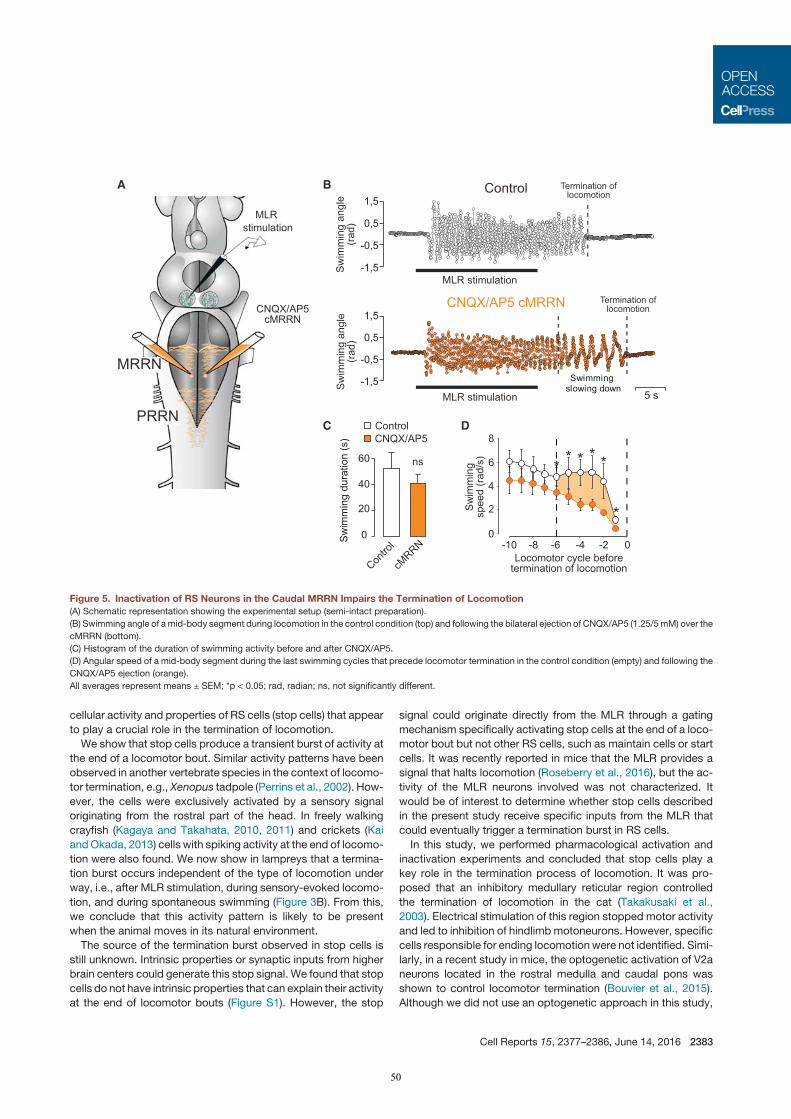
cellular activity and properties of RS cells (stop cells) that appear
to play a crucial role in the termination of locomotion.
We show that stop cells produce a transient burst of activity at
the end of a locomotor bout. Similar activity patterns have been
observed in another vertebrate species in the context of locomo-
tor termination, e.g., Xenopus tadpole (Perrins et al., 2002). How-
ever, the cells were exclusively activated by a sensory signal
originating from the rostral part of the head. In freely walking
crayfish (Kagaya and Takahata, 2010, 2011) and crickets (Kai
andOkada, 2013) cells with spiking activity at the end of locomo-
tion were also found. We now show in lampreys that a termina-
tion burst occurs independent of the type of locomotion under
way, i.e., after MLR stimulation, during sensory-evoked locomo-
tion, and during spontaneous swimming (Figure 3B). From this,
we conclude that this activity pattern is likely to be present
when the animal moves in its natural environment.
The source of the termination burst observed in stop cells is
still unknown. Intrinsic properties or synaptic inputs from higher
brain centers could generate this stop signal. We found that stop
cells do not have intrinsic properties that can explain their activity
at the end of locomotor bouts (Figure S1). However, the stop
signal could originate directly from the MLR through a gating
mechanism specifically activating stop cells at the end of a loco-
motor bout but not other RS cells, such as maintain cells or start
cells. It was recently reported in mice that the MLR provides a
signal that halts locomotion (Roseberry et al., 2016), but the ac-
tivity of the MLR neurons involved was not characterized. It
would be of interest to determine whether stop cells described
in the present study receive specific inputs from the MLR that
could eventually trigger a termination burst in RS cells.
In this study, we performed pharmacological activation and
inactivation experiments and concluded that stop cells play a
key role in the termination process of locomotion. It was pro-
posed that an inhibitory medullary reticular region controlled
the termination of locomotion in the cat (Takakusaki et al.,
2003). Electrical stimulation of this region stopped motor activity
and led to inhibition of hindlimb motoneurons. However, specific
cells responsible for ending locomotion were not identified. Simi-
larly, in a recent study in mice, the optogenetic activation of V2a
neurons located in the rostral medulla and caudal pons was
shown to control locomotor termination (Bouvier et al., 2015).
Although we did not use an optogenetic approach in this study,
Contro
l
cMRRN
D
0
20
40
60
Sw
imm
ing
dura
tion
(s)
ns
ControlCNQX/AP5
C
A
stimulationMLR
MRRN
PRRN
0
2
4
6
8
-2 0-4-6-8-10
*
*****
Locomotor cycle before termination of locomotion
Sw
imm
ing
spee
d (r
ad/s
)
-1,5
-0,5
0,5
1,5
MLR stimulation 5 s
Swimmingslowing down
Termination of locomotion
Sw
imm
ing
angl
e (r
ad)
B
-1,5
-0,5
0,5
1,5
MLR stimulation
Termination of locomotion
Sw
imm
ing
angl
e (r
ad)
Control
CNQX/AP5 cMRRNCNQX/AP5cMRRN
Figure 5. Inactivation of RS Neurons in the Caudal MRRN Impairs the Termination of Locomotion
(A) Schematic representation showing the experimental setup (semi-intact preparation).
(B) Swimming angle of amid-body segment during locomotion in the control condition (top) and following the bilateral ejection of CNQX/AP5 (1.25/5mM) over the
cMRRN (bottom).
(C) Histogram of the duration of swimming activity before and after CNQX/AP5.
(D) Angular speed of a mid-body segment during the last swimming cycles that precede locomotor termination in the control condition (empty) and following the
CNQX/AP5 ejection (orange).
All averages represent means ± SEM; *p < 0.05; rad, radian; ns, not significantly different.
Cell Reports 15, 2377–2386, June 14, 2016 2383
50
pharmacological activation or inactivation still provides an excel-
lent tool to manipulate cell activity. This has been used and con-
tinues to be used extensively in several animal models (Mentis
et al., 2005; Petzold et al., 2009). We do not consider pharmaco-
logical manipulation of the stop cells to be as selective as the op-
togenetic approach. The localization of the three populations of
RS cells described in our study showed some anatomical over-
lap. Ejections of D-glutamate over the cMRRN could then acti-
vate stop cells, aswell as start cells or interneurons in the vicinity.
Nevertheless, our results consistently demonstrated a powerful
impact of the drug ejection on swimming activity associated
with the termination of locomotion. This could result from the
presence of a larger number of stop cells in the vicinity or a gating
mechanism, whereby stop cells could be activated at the end of
the locomotor bout, whereas start cells would be in a state of low
excitability. Briefly, the significant halting effects we obtained by
pharmacologically activating the cMRRN and the absence of ef-
fects in our control experiments indicate that stop cells are suf-
ficient to terminate ongoing locomotion.
When stop cells were inactivated by local CNQX/AP5 ejection,
locomotor duration was not significantly modified. Yet in the
control condition, the deceleration process of swimming preced-
ing locomotor termination lasted only a few seconds and swim-
ming speed decreased abruptly (Figure 5). After CNQX/AP5
ejection, however, the duration of the deceleration process
increased and instead of an abrupt reduction of swimming
speed, a slower and gradual decrease occurred. These results
suggest that stop cells might not provide the sole command
for locomotor termination, but they would be needed to swiftly
halt locomotion. Similarly, blocking the synaptic output of V2a
stop neurons increased mobility in freely behaving mice (Bouvier
et al., 2015). Stopping episodes were still present and could arise
from another pathway.
So far, we have not identified the neuronal targets of lamprey
stop cells in the spinal cord or the neurotransmitter or neuro-
transmitters used by those cells. In some studies, inhibitory de-
scending neurons were described to be involved in stopping
locomotion. The hindbrain RS neurons were shown to inhibit
the spinal locomotor neural network mainly through activation
of g-aminobutyric acid type A (GABAA; Xenopus tadpole; Li
et al., 2003) and glycinergic receptors (lamprey; Wannier et al.,
1995). However, it was recently reported in the mouse that V2a
stop neurons are glutamatergic and directly project to the lumbar
spinal cord, where they contact inhibitory and excitatory neurons
(Bouvier et al., 2015).
We have shown that stop cells discharge both when locomo-
tion is initiated and when it stops. Such an antagonistic activity
pattern was previously reported in the leech, where Tr2 neurons
can either initiate or stop locomotion (O’Gara and Friesen, 1995).
Activation of these neurons initiates an episode of fictive loco-
motion. However, similar to stop cells, Tr2 neurons cease to
fire action potentials once locomotion is started, and their activa-
tion terminates ongoing fictive swimming. These results indicate
that antagonistic signals could be coded sequentially by one
neuron, depending on the state of the network. Onset and offset
signals with similar effects have been recorded in dorsal striatum
and substantia nigra of monkeys in relation to the control of
movement (Jin and Costa, 2010). The dual neural activity was
proposed to signal both the initiation and the termination of ac-
tion sequences. This suggest that neural activity involved in pro-
gramming movement sequences shares similar mechanisms
with that involved in initiation, maintenance, and termination of
locomotion.
In the present study, we show that the termination of locomo-
tion in lampreys is encoded by a specific population of RS neu-
rons, the stop cells. Pharmacological activation and inactivation
of these cells revealed that they play a crucial role in rapid loco-
motor termination. So far, we have not identified the origin of
the termination burst produced by stop cells, but this will be
the subject of upcoming studies. The present results should
have importance in the field of motor control, because they
reveal the cellular activity of specific brainstem cells involved in
halting locomotion.
EXPERIMENTAL PROCEDURES
In Vitro Isolated Brainstem Preparation
Experiments were performed on the isolated brainstem of larval lampreys (Pet-
romyzon marinus). Under tricaine methanesulphonate anesthesia (MS 222,
100 mg/L; Sigma Chemical), the animals were decapitated, incised along
the ventral midline, and eviscerated in a cold saline solution (Ringer’s solution)
with the following composition: 130.0 mM NaCl, 2.1 mM KCl, 2.6 mM CaCl2,
1.8 mM MgCl2, 4.0 mM HEPES, 4.0 mM dextrose, and 1.0 mM NaHCO3,
adjusted to a pH of 7.4. The dorsal surface of the brain and spinal cord was
exposed. Animals were decerebrated and spinalized between the first and
the second segments of the spinal cord. The cartilage containing the isolated
brainstem was pinned down to the Sylgard bottom of a cooled, 5 ml chamber.
The recording chamber was continually superfused with cold oxygenated
Ringer’s solution (8�C–10�C). All procedures conformed to the guidelines of
the Canadian Council on Animal Care andwere approved by the University An-
imal Care and Use Committees. Special care was taken to limit any possible
suffering and to limit the number of animals used in the experiments.
Imaging
Calcium imaging experiments were performed in larval lampreys (n = 21) in
which the brainstem had been isolated in vitro as described earlier. Crystals
of calcium green-dextran amines (3,000 molecular weight [MW]; Invitrogen)
were applied over the cut spinal cord (between the first and the second spinal
segments) to label RS cells retrogradely. The preparations were perfused with
cold Ringer’s solution overnight in the dark to allow dye transport (10–24 hr).
Calcium responses were measured in labeled RS neurons during electrical
stimulation of the MLR using a Nikon epifluorescent microscope equipped
with a 203 (0.75 numerical aperture) objective and captured using an intensi-
fied charge-coupled device video camera (Photometrics CoolSNAP HQ;
Roper Scientific) at a rate of two images per second. The MLR was stimulated
using a glass-coated tungsten microelectrode (0.8–2 MU). Metafluor imaging
software (Molecular Devices) was used to acquire and analyze the data. Cal-
cium responseswere expressed as relative changes in fluorescenceDF/F after
subtraction of background fluorescence immediately adjacent to the recorded
neurons. All arithmetic manipulations performed on the image data were linear
(background subtraction and alterations in gain) and were applied uniformly
across the image under analysis.
Electrophysiology
RS neurons were impaled with glass microelectrodes (80–120 MU) filled with
potassium acetate (4 M). The signals were amplified (Axoclamp 2A; Axon In-
struments) and sampled at a rate of 10 kHz. Only RS neurons with a stable
membrane potential (below �70 mV for more than 15 min) were included in
the study. In some experiments, patch recordings of RS neurons were made
in either whole-cell current clamp mode or voltage clamp mode (�60 to
�70 mV) with a model 2400 amplifier (A-M Systems). The cells were targeted
under an Eclipse FN-1 microscope (Nikon Instruments) equipped for
2384 Cell Reports 15, 2377–2386, June 14, 2016
51
fluorescence. The patch pipette solution contained: 102.5 mM cesium
methane sulfonate, 1.0 mM NaCl, 1.0 mM MgCl2, 5.0 mM EGTA, 5.0 mM
HEPES, and 0.1% biocytin. The pH was adjusted to 7.2 with CsOH, and pi-
pettes were pulled to a tip resistance of 5 MU.
Labeling of RS Neurons
Microelectrodes were filled with 4 M potassium acetate and 0.5% biocytin
(Sigma), and depolarizing pulses (0.5–1.0 nA) were delivered for 10 min to fill
individual neurons iontophoretically. RS cells were retrogradely labeled after
the experiment by applying Texas red-dextran amines (Molecular Probes) on
the rostral stump of a transversely cut spinal cord, and the preparation was
perfused with cold oxygenated Ringer’s solution overnight to allow dye trans-
port. The tissue was fixed in 4% paraformaldehyde (Fisher Scientific) for 24 hr
at 4�C and was then transferred into a solution of Alexa Fluor 488 conjugated
streptavidin (Invitrogen) diluted in Triton X-1000 and PBS (1:200) to reveal the
biocytin for 24 hr. The tissue was dehydrated in an ascending series of ethanol
solutions (50%, 70%, 85%, 95%, and 100%) and cleared in methyl salicylate
(Fisher Scientific). The cleared whole mount was then observed and photo-
graphed with an E600 epifluorescence microscope equipped with a DXM
1200 digital camera (Nikon); insets were made with an Olympus FV1000
confocal microscope.
Semi-intact Preparation
For semi-intact preparations (n = 56), the brain and the ten most rostral spinal
cord segments were exposed to the Ringer’s solution while the remaining
bodywas kept intact. The craniumand themost rostral notochordwere pinned
down on Sylgard while the body was free to move. At least 2 hr were allowed
between the end of the dissection and the beginning of recording session. Lo-
comotor bouts were induced by electrical stimulation of the MLR (10–30 s
trains of 2 ms stimuli at 5 Hz) using a glass-coated tungsten microelectrode.
In some experiments, locomotion was induced by tactile stimulation of the
body or occurred spontaneously. Electromyographic (EMG) recordings were
carried out using Teflon-coated stainless steel wires (diameter: 50 mm; Califor-
nia Fine Wire) inserted into the body musculature between segments 20 and
25. The quality of the swimming was assessed visually. The EMG signals
were amplified (1,000 times), filtered (bandwidth: 30 Hz to 1 kHz), and acquired
with a sampling rate of 5 kHz. Kinematic recordings of body movements were
performed using a high-definition video camera (GZ-HD3U; JVC) at a sampling
rate of 30 Hz. Body movements were analyzed using a homemade MATLAB
R2009A script (MathWorks). Markers were placed offline at equal distances
on the body (Figure 2A) and tracked over time to monitor swimming behavior.
Drugs
All drugs were dissolved at their final concentration in the Ringer’s solution and
injectedasdescribedpreviously (e.g., Smetanaet al., 2010;Ryczkoet al., 2013).
D-glutamate (5 mM; Sigma-Aldrich), and a CNQX/AP5 mixture (CNQX at
1.25 mM and AP5 at 5 mM) was pressure ejected through a glass micropipette
with a Picospritzer (General ValveCorporation). The inactive dye fast greenwas
added to the drug solution to monitor the extent of the injection. The injection
micropipette was positioned on the surface of the tissue, and injection param-
eterswere set so that a fast greenstainof�100mmdiameterwouldbe visible on
the surface of the tissue right after injection. Control injections of fast green dis-
solved in Ringer’s solution did not induce responses in RS neurons.
Data Acquisition and Analysis
Electrophysiological datawere acquired through aDigidata 1322A interfacewith
Clampex 8.0 software (Axon Instruments,Molecular Devices) and analyzed with
Clampfit 10.2 software.Datawereexpressedasmeans±SEM.UsingSigmaPlot
11.0, statistical significance was determined using Student’s t tests or one-way
ANOVA, followed by Tukey’s post hoc test. Correlations were obtained using a
Spearman correlation test. p < 0.05 was considered statistically significant.
SUPPLEMENTAL INFORMATION
Supplemental Information includes two figures can be found with this article
online at http://dx.doi.org/10.1016/j.celrep.2016.05.029.
AUTHOR CONTRIBUTIONS
L.J. and S.G. performed both the experiments and the analyses, wrote sec-
tions, and edited the paper. E.T.-D. performed experiments and analyses
and edited sections of the paper. J.-F.G. performed experiments. A.B. super-
vised the project and edited sections of the paper. R.D. supervised the project
and wrote and edited sections of the paper.
ACKNOWLEDGMENTS
We thank D. Veilleux for her assistance with experiments, C. Valiquette for his
expertise in computer programming, F. Bernard for his help with the figures,
and F. Auclair for his help with anatomical work. This work was funded by
the Canadian Institutes of Health Research (15129 and 15176), the Natural Sci-
ences and Engineering Research Council of Canada (217435-01), the Great
Lakes Fishery Commission (54011, 54021, and 54035). L.J. received a Jasper
fellowship from the Groupe de Recherche sur le Systeme Nerveux Central.
S.G. received scholarships from the University of Cologne and the German Ac-
ademic Exchange Service.
Received: May 22, 2015
Revised: March 23, 2016
Accepted: May 5, 2016
Published: June 2, 2016
REFERENCES
Antri, M., Fenelon, K., and Dubuc, R. (2009). The contribution of synaptic
inputs to sustained depolarizations in reticulospinal neurons. J. Neurosci.
29, 1140–1151.
Bouvier, J., Caggiano, V., Leiras, R., Caldeira, V., Bellardita, C., Balueva, K.,
Fuchs, A., and Kiehn, O. (2015). Descending command neurons in the brain-
stem that halt locomotion. Cell 163, 1191–1203.
Brocard, F., and Dubuc, R. (2003). Differential contribution of reticulospinal
cells to the control of locomotion induced by the mesencephalic locomotor re-
gion. J. Neurophysiol. 90, 1714–1727.
Brocard, F., Ryczko, D., Fenelon, K., Hatem, R., Gonzales, D., Auclair, F., and
Dubuc, R. (2010). The transformation of a unilateral locomotor command into a
symmetrical bilateral activation in the brainstem. J. Neurosci. 30, 523–533.
Deliagina, T.G., Beloozerova, I.N., Zelenin, P.V., and Orlovsky, G.N. (2008).
Spinal and supraspinal postural networks. Brain Res. Brain Res. Rev. 57,
212–221.
Di Prisco, G.V., Pearlstein, E., Robitaille, R., and Dubuc, R. (1997). Role of sen-
sory-evoked NMDA plateau potentials in the initiation of locomotion. Science
278, 1122–1125.
Di Prisco, G.V., Pearlstein, E., Le Ray, D., Robitaille, R., andDubuc, R. (2000). A
cellular mechanism for the transformation of a sensory input into a motor com-
mand. J. Neurosci. 20, 8169–8176.
Dubuc, R., Brocard, F., Antri, M., Fenelon, K., Gariepy, J.F., Smetana, R., Me-
nard, A., Le Ray, D., Viana Di Prisco, G., Pearlstein, E., et al. (2008). Initiation of
locomotion in lampreys. Brain Res. Brain Res. Rev. 57, 172–182.
Grillner, S., Ekeberg, O., El Manira, A., Lansner, A., Parker, D., Tegner, J., and
Wallen, P. (1998). Intrinsic function of a neuronal network—a vertebrate central
pattern generator. Brain Res. Brain Res. Rev. 26, 184–197.
Jackson, A.W., Pino, F.A., Wiebe, E.D., and McClellan, A.D. (2007). Move-
ments and muscle activity initiated by brain locomotor areas in semi-intact
preparations from larval lamprey. J. Neurophysiol. 97, 3229–3241.
Jin, X., and Costa, R.M. (2010). Start/stop signals emerge in nigrostriatal cir-
cuits during sequence learning. Nature 466, 457–462.
Kagaya, K., and Takahata, M. (2010). Readiness discharge for spontaneous
initiation of walking in crayfish. J. Neurosci. 30, 1348–1362.
Kagaya, K., and Takahata, M. (2011). Sequential synaptic excitation and
inhibition shape readiness discharge for voluntary behavior. Science 332,
365–368.
Cell Reports 15, 2377–2386, June 14, 2016 2385
52
Kai, K., and Okada, J. (2013). Characterization of locomotor-related spike ac-
tivity in protocerebrum of freely walking cricket. Zoolog. Sci. 30, 591–601.
Le Ray, D., Brocard, F., Bourcier-Lucas, C., Auclair, F., Lafaille, P., and Dubuc,
R. (2003). Nicotinic activation of reticulospinal cells involved in the control of
swimming in lampreys. Eur. J. Neurosci. 17, 137–148.
Li, W.C., Perrins, R., Walford, A., and Roberts, A. (2003). The neuronal targets
for GABAergic reticulospinal inhibition that stops swimming in hatchling frog
tadpoles. J. Comp. Physiol. A Neuroethol. Sens. Neural Behav. Physiol. 189,
29–37.
Mentis, G.Z., Alvarez, F.J., Bonnot, A., Richards, D.S., Gonzalez-Forero, D.,
Zerda, R., and O’Donovan, M.J. (2005). Noncholinergic excitatory actions of
motoneurons in the neonatal mammalian spinal cord. Proc. Natl. Acad. Sci.
USA 102, 7344–7349.
Mullins, O.J., Hackett, J.T., Buchanan, J.T., and Friesen, W.O. (2011).
Neuronal control of swimming behavior: comparison of vertebrate and inverte-
brate model systems. Prog. Neurobiol. 93, 244–269.
O’Gara, B.A., and Friesen, W.O. (1995). Termination of leech swimming activity
by a previously identified swim trigger neuron. J. Comp. Physiol. A Neuroethol.
Sens. Neural Behav. Physiol. 177, 627–636.
Perrins, R., Walford, A., and Roberts, A. (2002). Sensory activation and role of
inhibitory reticulospinal neurons that stop swimming in hatchling frog tadpoles.
J. Neurosci. 22, 4229–4240.
Petzold, G.C., Hagiwara, A., andMurthy, V.N. (2009). Serotonergic modulation
of odor input to the mammalian olfactory bulb. Nat. Neurosci. 12, 784–791.
Roseberry, T.K., Lee, A.M., Lalive, A.L., Wilbrecht, L., Bonci, A., and Kreitzer,
A.C. (2016). Cell-type-specific control of brainstem locomotor circuits by basal
ganglia. Cell 164, 526–537.
Ryczko, D., and Dubuc, R. (2013). Themultifunctional mesencephalic locomo-
tor region. Curr. Pharm. Des. 19, 4448–4470.
Ryczko, D., Gratsch, S., Auclair, F., Dube, C., Bergeron, S., Alpert, M.H., Cone,
J.J., Roitman, M.F., Alford, S., and Dubuc, R. (2013). Forebrain dopamine neu-
rons project down to a brainstem region controlling locomotion. Proc. Natl.
Acad. Sci. USA 110, E3235–E3242.
Smetana, R., Juvin, L., Dubuc, R., and Alford, S. (2010). A parallel cholinergic
brainstem pathway for enhancing locomotor drive. Nat. Neurosci. 13,
731–738.
Takakusaki, K., Kohyama, J., and Matsuyama, K. (2003). Medullary reticulo-
spinal tract mediating a generalized motor inhibition in cats: III. Functional or-
ganization of spinal interneurons in the lower lumbar segments. Neuroscience
121, 731–746.
Wannier, T., Orlovsky, G., and Grillner, S. (1995). Reticulospinal neurones pro-
vide monosynaptic glycinergic inhibition of spinal neurones in lamprey. Neuro-
report 6, 1597–1600.
2386 Cell Reports 15, 2377–2386, June 14, 2016
53
6. Study under review
6.1. A brainstem neural substrate for stopping locomotion
Grätsch, S., Auclair, F., Demers, O., Auguste, E., Hanna, A., Büschges, A., and Dubuc, R.
Submitted to and reviewed by Current Biology.
Author contributions
Designed research:
Swantje Grätsch, François Auclair, Ansgar Büschges, and Réjean Dubuc.
Performed research:
Swantje Grätsch, François Auclair, Olivier Demers, Emmanuella Auguste, and Amer Hanna.
Analyzed data:
Swantje Grätsch, François Auclair, Olivier Demers, Emmanuella Auguste, Amer Hanna, Ansgar Büschges,
and Réjean Dubuc.
Wrote the paper:
Swantje Grätsch, Ansgar Büschges, and Réjean Dubuc.
54
A Brainstem Neural Substrate for Stopping Locomotion
Swantje Grätsch1, 2, 3, François Auclair1, Olivier Demers2, Emmanuella Auguste2, Amer
Hanna1, Ansgar Büschges3, and Réjean Dubuc1, 2, 4*
1 Dept. Neuroscience; Université de Montréal; Montréal, Québec, H3C 3J7; Canada
2 Dept. Sciences de l’Activité Physique; Université du Québec à Montréal; Montréal, Québec, H3C 3P8;
Canada
3 Biocenter Cologne; Dept. Animal Physiology; University of Cologne; Cologne, D-50674; Germany
4 Lead contact
*Correspondence to: [email protected]
55
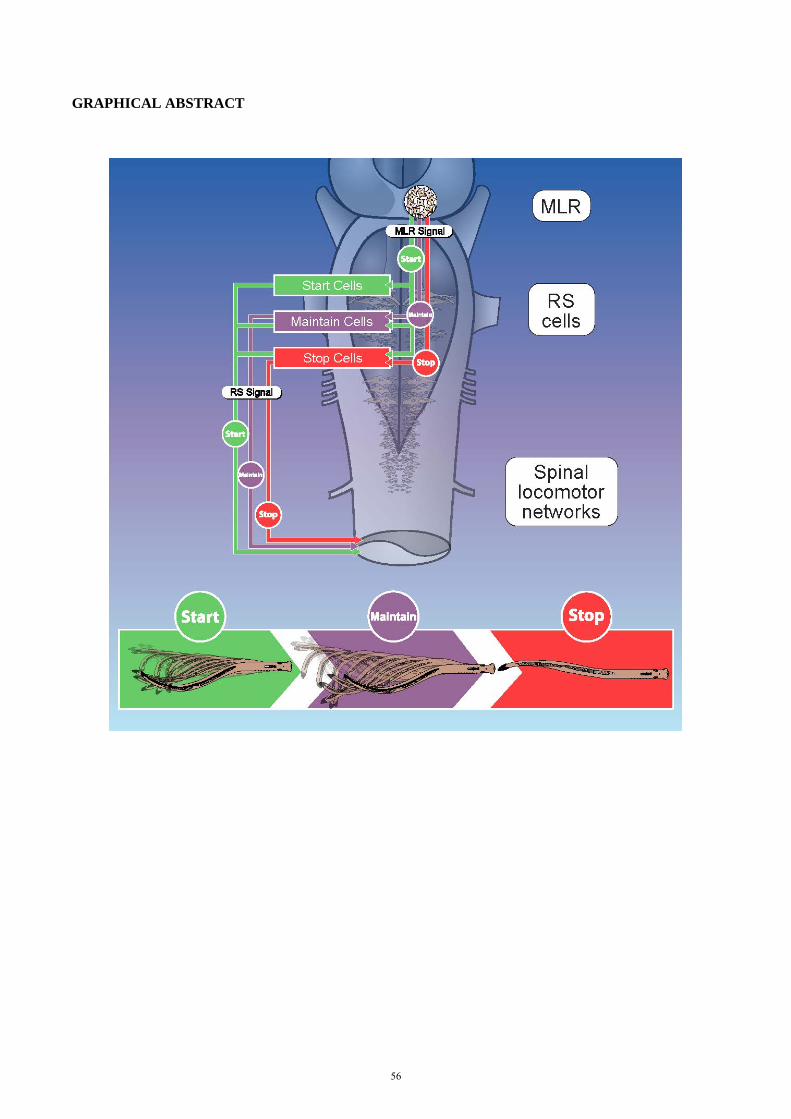
GRAPHICAL ABSTRACT
56
SUMMARY
Locomotion is a basic motor function crucial for survival. Daily activities consist of locomotor bouts that need
to be started, maintained, and stopped. The neural substrate underlying starting and maintaining locomotion is
partly known, but there is little knowledge concerning stopping. Recently, reticulospinal (RS) neurons (stop
cells) that control locomotor termination were identified. The inputs that activate the stop cells are unknown.
The mesencephalic locomotor region (MLR) is classically described as a major input to RS cells as it is
involved in starting and maintaining locomotion. We now show in the lamprey, that the MLR also produces
locomotor termination that is accompanied by a burst of discharge in stop cells. Our results suggest the
presence of a monosynaptic pathway from MLR to stop cells. These results fill an important gap in knowledge
relative to the neural mechanisms controlling the termination of locomotion.
KEYWORDS
locomotion; locomotor termination; brainstem; mesencephalic locomotor region; reticulospinal neurons; stop
cells; lamprey.
eTOC BLURB
Grätsch et al. describe a neural substrate involved in terminating locomotion. The mesencephalic locomotor
region is well known for initiating and controlling locomotion. The authors demonstrate that it also controls
the termination of locomotion through inputs to reticulospinal cells (stop cells) that play a crucial role in
stopping of locomotion.
HIGHLIGHTS
MLR stimulation not only initiates and maintains locomotion, it also stops it
Both electrical and chemical stimulation of the MLR can stop locomotion
RS stop cells display a termination burst in response to MLR stimulation
MLR stimulation also stops sensory-evoked and spontaneous locomotion
57
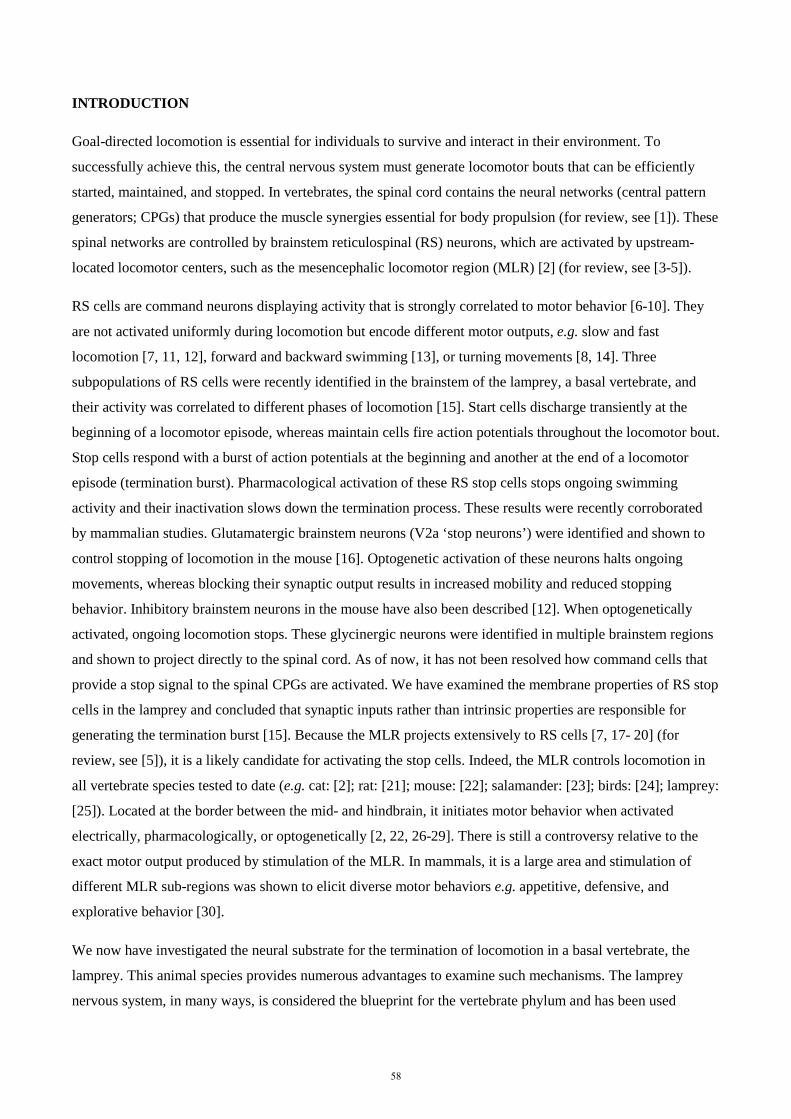
INTRODUCTION
Goal-directed locomotion is essential for individuals to survive and interact in their environment. To
successfully achieve this, the central nervous system must generate locomotor bouts that can be efficiently
started, maintained, and stopped. In vertebrates, the spinal cord contains the neural networks (central pattern
generators; CPGs) that produce the muscle synergies essential for body propulsion (for review, see [1]). These
spinal networks are controlled by brainstem reticulospinal (RS) neurons, which are activated by upstream-
located locomotor centers, such as the mesencephalic locomotor region (MLR) [2] (for review, see [3-5]).
RS cells are command neurons displaying activity that is strongly correlated to motor behavior [6-10]. They
are not activated uniformly during locomotion but encode different motor outputs, e.g. slow and fast
locomotion [7, 11, 12], forward and backward swimming [13], or turning movements [8, 14]. Three
subpopulations of RS cells were recently identified in the brainstem of the lamprey, a basal vertebrate, and
their activity was correlated to different phases of locomotion [15]. Start cells discharge transiently at the
beginning of a locomotor episode, whereas maintain cells fire action potentials throughout the locomotor bout.
Stop cells respond with a burst of action potentials at the beginning and another at the end of a locomotor
episode (termination burst). Pharmacological activation of these RS stop cells stops ongoing swimming
activity and their inactivation slows down the termination process. These results were recently corroborated
by mammalian studies. Glutamatergic brainstem neurons (V2a ‘stop neurons’) were identified and shown to
control stopping of locomotion in the mouse [16]. Optogenetic activation of these neurons halts ongoing
movements, whereas blocking their synaptic output results in increased mobility and reduced stopping
behavior. Inhibitory brainstem neurons in the mouse have also been described [12]. When optogenetically
activated, ongoing locomotion stops. These glycinergic neurons were identified in multiple brainstem regions
and shown to project directly to the spinal cord. As of now, it has not been resolved how command cells that
provide a stop signal to the spinal CPGs are activated. We have examined the membrane properties of RS stop
cells in the lamprey and concluded that synaptic inputs rather than intrinsic properties are responsible for
generating the termination burst [15]. Because the MLR projects extensively to RS cells [7, 17- 20] (for
review, see [5]), it is a likely candidate for activating the stop cells. Indeed, the MLR controls locomotion in
all vertebrate species tested to date (e.g. cat: [2]; rat: [21]; mouse: [22]; salamander: [23]; birds: [24]; lamprey:
[25]). Located at the border between the mid- and hindbrain, it initiates motor behavior when activated
electrically, pharmacologically, or optogenetically [2, 22, 26-29]. There is still a controversy relative to the
exact motor output produced by stimulation of the MLR. In mammals, it is a large area and stimulation of
different MLR sub-regions was shown to elicit diverse motor behaviors e.g. appetitive, defensive, and
explorative behavior [30].
We now have investigated the neural substrate for the termination of locomotion in a basal vertebrate, the
lamprey. This animal species provides numerous advantages to examine such mechanisms. The lamprey
nervous system, in many ways, is considered the blueprint for the vertebrate phylum and has been used
58
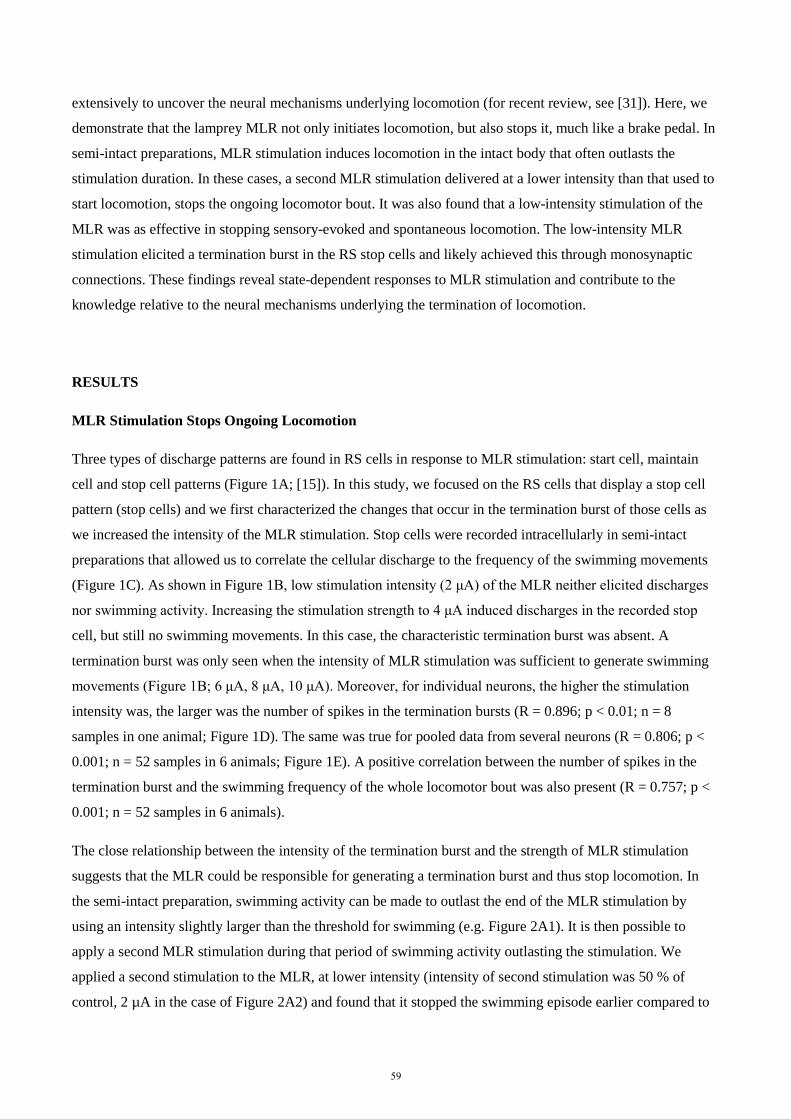
extensively to uncover the neural mechanisms underlying locomotion (for recent review, see [31]). Here, we
demonstrate that the lamprey MLR not only initiates locomotion, but also stops it, much like a brake pedal. In
semi-intact preparations, MLR stimulation induces locomotion in the intact body that often outlasts the
stimulation duration. In these cases, a second MLR stimulation delivered at a lower intensity than that used to
start locomotion, stops the ongoing locomotor bout. It was also found that a low-intensity stimulation of the
MLR was as effective in stopping sensory-evoked and spontaneous locomotion. The low-intensity MLR
stimulation elicited a termination burst in the RS stop cells and likely achieved this through monosynaptic
connections. These findings reveal state-dependent responses to MLR stimulation and contribute to the
knowledge relative to the neural mechanisms underlying the termination of locomotion.
RESULTS
MLR Stimulation Stops Ongoing Locomotion
Three types of discharge patterns are found in RS cells in response to MLR stimulation: start cell, maintain
cell and stop cell patterns (Figure 1A; [15]). In this study, we focused on the RS cells that display a stop cell
pattern (stop cells) and we first characterized the changes that occur in the termination burst of those cells as
we increased the intensity of the MLR stimulation. Stop cells were recorded intracellularly in semi-intact
preparations that allowed us to correlate the cellular discharge to the frequency of the swimming movements
(Figure 1C). As shown in Figure 1B, low stimulation intensity (2 μA) of the MLR neither elicited discharges
nor swimming activity. Increasing the stimulation strength to 4 μA induced discharges in the recorded stop
cell, but still no swimming movements. In this case, the characteristic termination burst was absent. A
termination burst was only seen when the intensity of MLR stimulation was sufficient to generate swimming
movements (Figure 1B; 6 μA, 8 μA, 10 μA). Moreover, for individual neurons, the higher the stimulation
intensity was, the larger was the number of spikes in the termination bursts (R = 0.896; p < 0.01; n = 8
samples in one animal; Figure 1D). The same was true for pooled data from several neurons (R = 0.806; p <
0.001; n = 52 samples in 6 animals; Figure 1E). A positive correlation between the number of spikes in the
termination burst and the swimming frequency of the whole locomotor bout was also present (R = 0.757; p <
0.001; n = 52 samples in 6 animals).
The close relationship between the intensity of the termination burst and the strength of MLR stimulation
suggests that the MLR could be responsible for generating a termination burst and thus stop locomotion. In
the semi-intact preparation, swimming activity can be made to outlast the end of the MLR stimulation by
using an intensity slightly larger than the threshold for swimming (e.g. Figure 2A1). It is then possible to
apply a second MLR stimulation during that period of swimming activity outlasting the stimulation. We
applied a second stimulation to the MLR, at lower intensity (intensity of second stimulation was 50 % of
control, 2 µA in the case of Figure 2A2) and found that it stopped the swimming episode earlier compared to
59
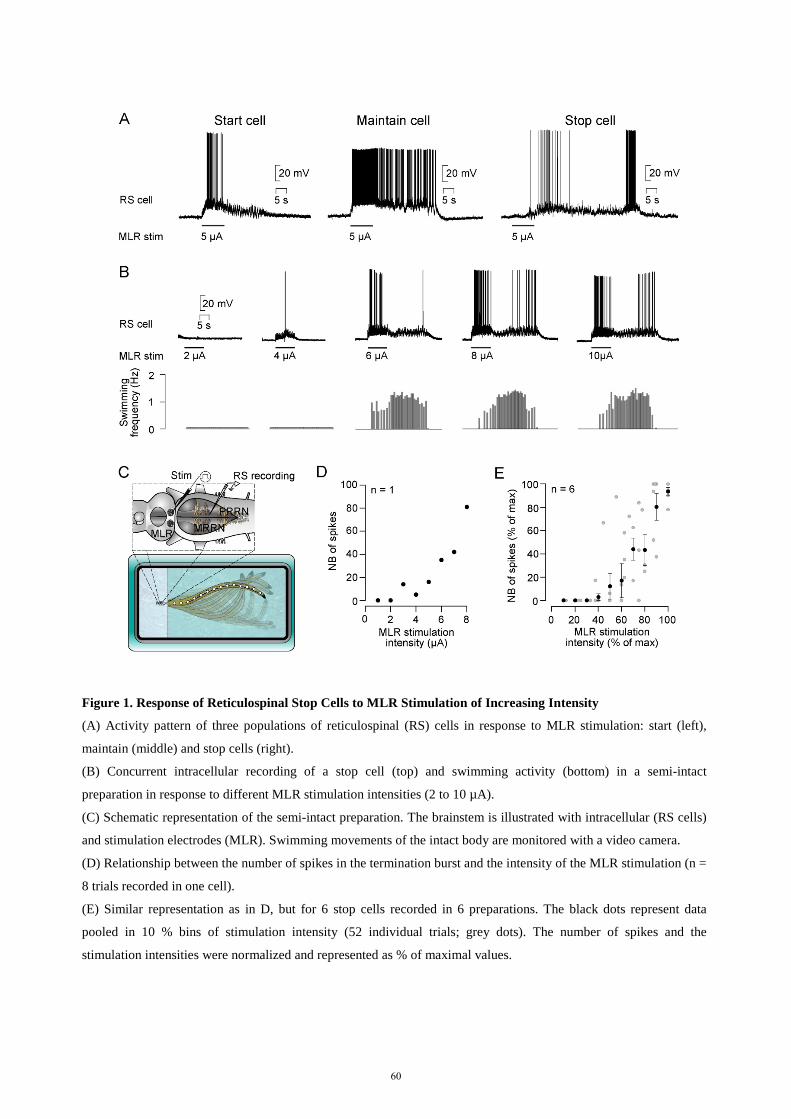
Figure 1. Response of Reticulospinal Stop Cells to MLR Stimulation of Increasing Intensity
(A) Activity pattern of three populations of reticulospinal (RS) cells in response to MLR stimulation: start (left),
maintain (middle) and stop cells (right).
(B) Concurrent intracellular recording of a stop cell (top) and swimming activity (bottom) in a semi-intact
preparation in response to different MLR stimulation intensities (2 to 10 µA).
(C) Schematic representation of the semi-intact preparation. The brainstem is illustrated with intracellular (RS cells)
and stimulation electrodes (MLR). Swimming movements of the intact body are monitored with a video camera.
(D) Relationship between the number of spikes in the termination burst and the intensity of the MLR stimulation (n =
8 trials recorded in one cell).
(E) Similar representation as in D, but for 6 stop cells recorded in 6 preparations. The black dots represent data
pooled in 10 % bins of stimulation intensity (52 individual trials; grey dots). The number of spikes and the
stimulation intensities were normalized and represented as % of maximal values.
60
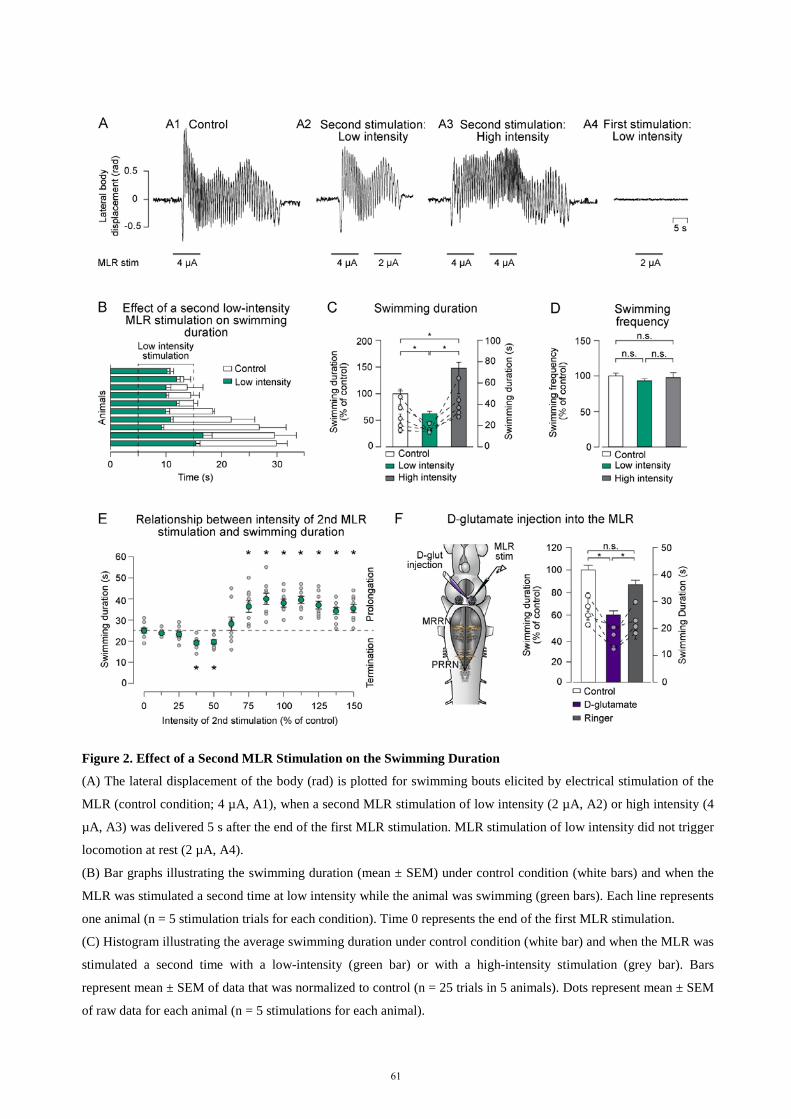
Figure 2. Effect of a Second MLR Stimulation on the Swimming Duration (A) The lateral displacement of the body (rad) is plotted for swimming bouts elicited by electrical stimulation of the
MLR (control condition; 4 µA, A1), when a second MLR stimulation of low intensity (2 µA, A2) or high intensity (4
µA, A3) was delivered 5 s after the end of the first MLR stimulation. MLR stimulation of low intensity did not trigger
locomotion at rest (2 µA, A4).
(B) Bar graphs illustrating the swimming duration (mean ± SEM) under control condition (white bars) and when the
MLR was stimulated a second time at low intensity while the animal was swimming (green bars). Each line represents
one animal (n = 5 stimulation trials for each condition). Time 0 represents the end of the first MLR stimulation.
(C) Histogram illustrating the average swimming duration under control condition (white bar) and when the MLR was
stimulated a second time with a low-intensity (green bar) or with a high-intensity stimulation (grey bar). Bars
represent mean ± SEM of data that was normalized to control (n = 25 trials in 5 animals). Dots represent mean ± SEM
of raw data for each animal (n = 5 stimulations for each animal).
61
control. It is noteworthy that such a low-intensity stimulation (2 μA) did not elicit locomotion at rest (Figure
2A4). Interestingly, the locomotor bout was prolonged when the second MLR stimulation was of the same
intensity as the first one, i.e. sufficient to trigger locomotion at rest (4 μA; Figure 2A3).
The duration of the locomotor activity outlasting the end of a MLR stimulation, without a second stimulation
(control condition), was on average 19.37 ± 1.24 s (n = 10 animals; Figure 2B, white boxes) before it stopped
spontaneously. From one preparation to another, it ranged from 8.9 to 43.3 s. However, when there was a
second low-intensity stimulation, the duration of the locomotor activity after the second stimulation was
decreased to 6.7 ± 0.37 s (Figure 2B, green boxes). In five of these animals, we compared the effects of a
second MLR stimulation of low intensity vs. high intensity (Figure 2C, n = 25 trials). Here, the average
swimming duration was significantly reduced to 62.63 ± 4.37 % of control when the MLR was stimulated at a
low intensity (p < 0.05; Figure 2C, green bar). When the second MLR stimulation was delivered at a high
intensity, the average duration significantly increased to 148.0 ± 11.04 % of control (p < 0.05; Figure 2C, grey
bar). Interestingly, the swimming frequency of the entire locomotor bout was not significantly altered by the
second stimulation (Figure 2D).
In another set of experiments, we aimed at defining more precisely the intensity of the second stimulation that
was needed to terminate or prolong the swimming bouts (Figure 2E). Therefore, the intensity of the second
stimulation was varied from 0 % to 150 % of control (with 12.5 % steps). First, we established the stimulation
intensity that was needed to elicit locomotion (1T) and then we set the control intensity to 2T (100 %).
Overall, the average duration of the locomotor bouts was 25 ± 1.18 s when the MLR was stimulated only once
at 100 % intensity. The intensity of the second stimulation needed to significantly shorten swimming activity
was 37.5 % (19.22 ± 0.92 s) and 50 % (19.66 ± 0.96 s) of control (p < 0.05; n = 9 trials in 3 animals for each
(Continuation of Figure 2)
(D) Comparison of the average swimming frequency in three conditions: control (white bar); when a second MLR
stimulation of low intensity is delivered (green bar); when a second MLR stimulation of high intensity is delivered
(grey bar). Same animals as illustrated in C.
(E) Swimming duration as a function of the intensity of the second MLR stimulation. For each trial, swimming was
elicited by electrical MLR stimulation (100 %). Intensities of the second MLR stimulation were altered from 0 to
150 % in 12.5 % steps. Grey dots represent swimming duration for each individual trial, green dots represent
average duration (mean ± SEM) of all animals (n = 3 animals). The doted horizontal line indicates the average
swimming duration under control condition, when no second stimulation was delivered to the MLR.
(F) Left: Schematic representation of the experimental setup when the second MLR stimulation was delivered by
injection of small D-glutamate quantities or Ringer’s solution into the MLR. Right: Bar graph illustrating the
average swimming duration in control condition (white bar) when D-glutamate (violet bar) or Ringer’s solution
(grey bar) was applied into the MLR during ongoing swimming. Data were normalized to the mean of control. Bars
represent the mean ± SEM of pooled data (n = 20 trials in 4 animals for each condition). Dots illustrate mean ±
SEM for each animal. (* indicates p < 0.05; n.s. indicates not statistically significant). See also Figure S1.
62
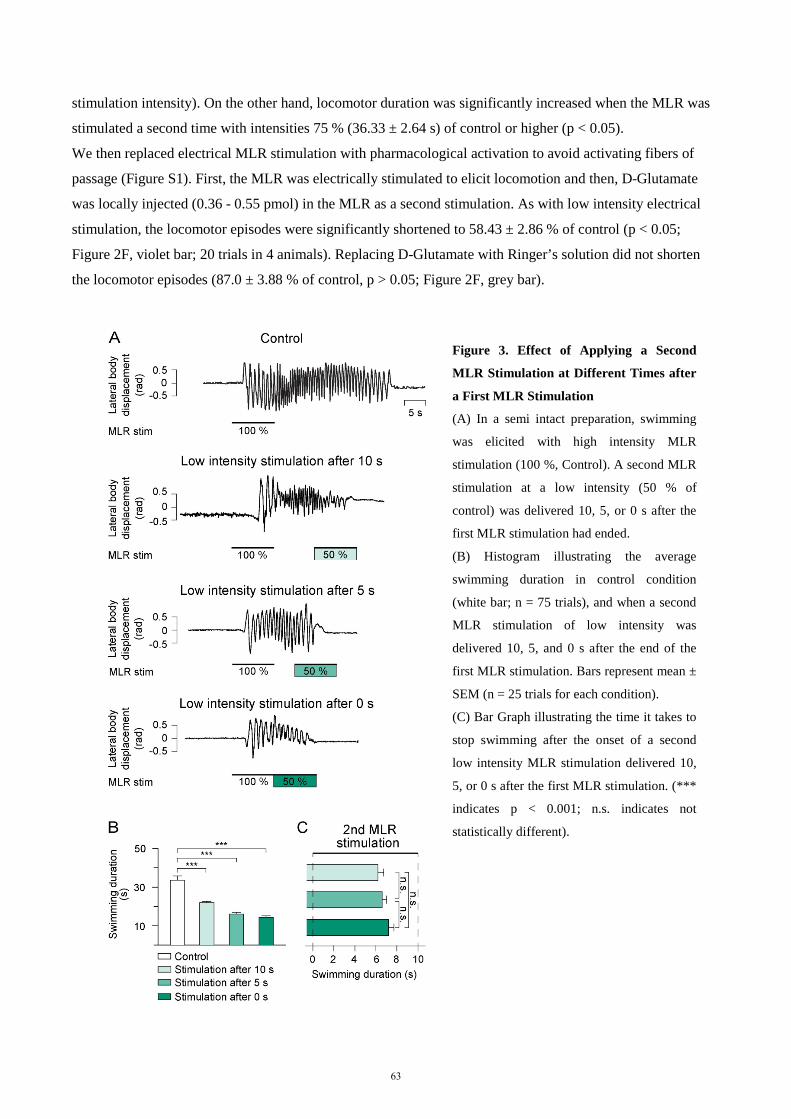
stimulation intensity). On the other hand, locomotor duration was significantly increased when the MLR was
stimulated a second time with intensities 75 % (36.33 ± 2.64 s) of control or higher (p < 0.05).
We then replaced electrical MLR stimulation with pharmacological activation to avoid activating fibers of
passage (Figure S1). First, the MLR was electrically stimulated to elicit locomotion and then, D-Glutamate
was locally injected (0.36 - 0.55 pmol) in the MLR as a second stimulation. As with low intensity electrical
stimulation, the locomotor episodes were significantly shortened to 58.43 ± 2.86 % of control (p < 0.05;
Figure 2F, violet bar; 20 trials in 4 animals). Replacing D-Glutamate with Ringer’s solution did not shorten
the locomotor episodes (87.0 ± 3.88 % of control, p > 0.05; Figure 2F, grey bar).
Figure 3. Effect of Applying a Second
MLR Stimulation at Different Times after
a First MLR Stimulation
(A) In a semi intact preparation, swimming
was elicited with high intensity MLR
stimulation (100 %, Control). A second MLR
stimulation at a low intensity (50 % of
control) was delivered 10, 5, or 0 s after the
first MLR stimulation had ended.
(B) Histogram illustrating the average
swimming duration in control condition
(white bar; n = 75 trials), and when a second
MLR stimulation of low intensity was
delivered 10, 5, and 0 s after the end of the
first MLR stimulation. Bars represent mean ±
SEM (n = 25 trials for each condition).
(C) Bar Graph illustrating the time it takes to
stop swimming after the onset of a second
low intensity MLR stimulation delivered 10,
5, or 0 s after the first MLR stimulation. (***
indicates p < 0.001; n.s. indicates not
statistically different).
63
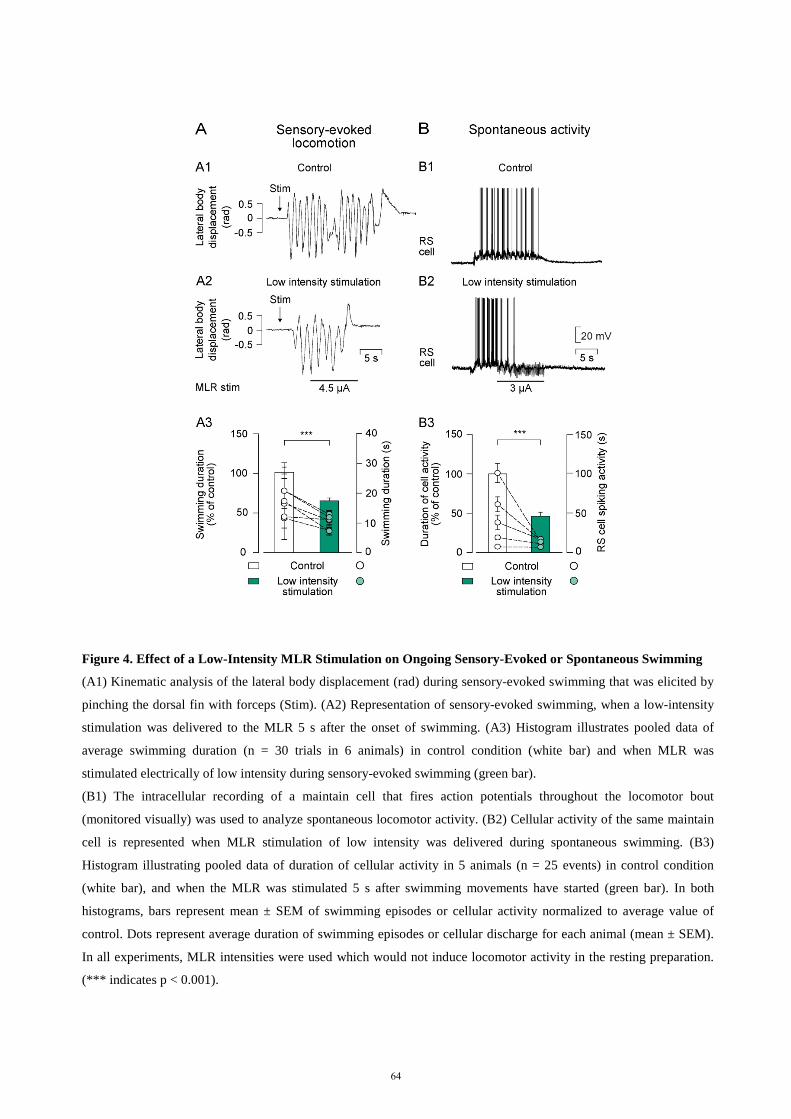
Figure 4. Effect of a Low-Intensity MLR Stimulation on Ongoing Sensory-Evoked or Spontaneous Swimming
(A1) Kinematic analysis of the lateral body displacement (rad) during sensory-evoked swimming that was elicited by
pinching the dorsal fin with forceps (Stim). (A2) Representation of sensory-evoked swimming, when a low-intensity
stimulation was delivered to the MLR 5 s after the onset of swimming. (A3) Histogram illustrates pooled data of
average swimming duration (n = 30 trials in 6 animals) in control condition (white bar) and when MLR was
stimulated electrically of low intensity during sensory-evoked swimming (green bar).
(B1) The intracellular recording of a maintain cell that fires action potentials throughout the locomotor bout
(monitored visually) was used to analyze spontaneous locomotor activity. (B2) Cellular activity of the same maintain
cell is represented when MLR stimulation of low intensity was delivered during spontaneous swimming. (B3)
Histogram illustrating pooled data of duration of cellular activity in 5 animals (n = 25 events) in control condition
(white bar), and when the MLR was stimulated 5 s after swimming movements have started (green bar). In both
histograms, bars represent mean ± SEM of swimming episodes or cellular activity normalized to average value of
control. Dots represent average duration of swimming episodes or cellular discharge for each animal (mean ± SEM).
In all experiments, MLR intensities were used which would not induce locomotor activity in the resting preparation.
(*** indicates p < 0.001).
64
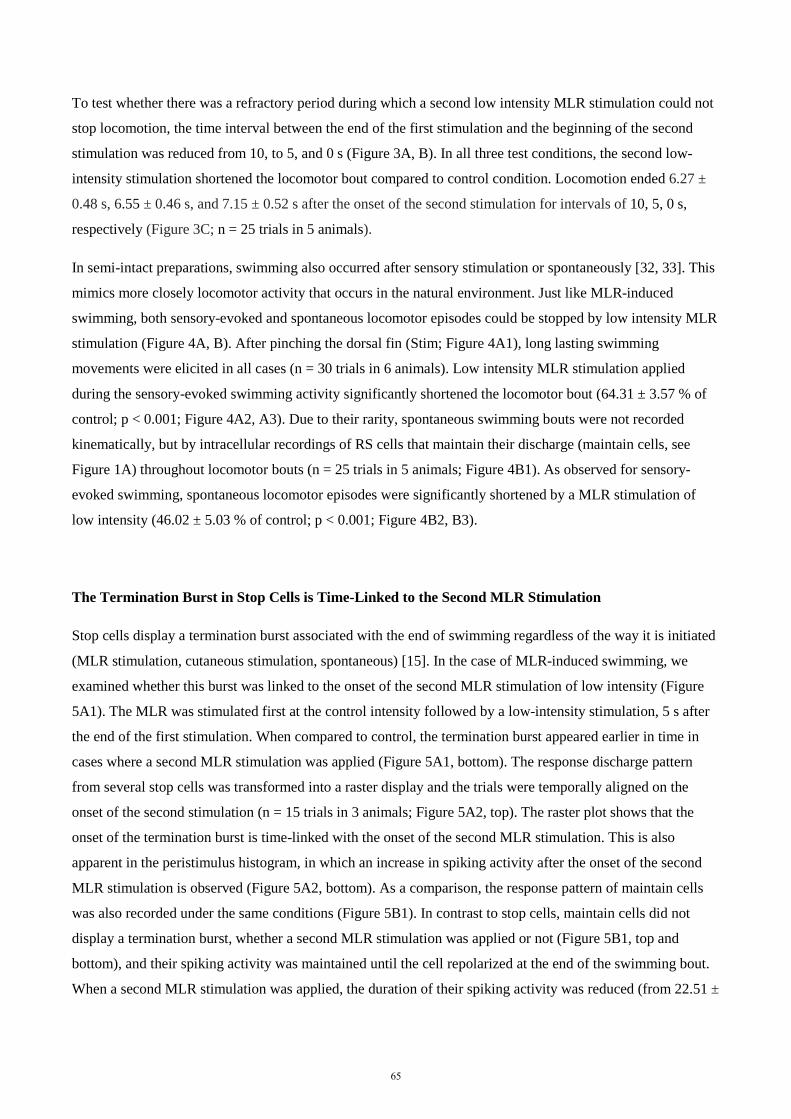
To test whether there was a refractory period during which a second low intensity MLR stimulation could not
stop locomotion, the time interval between the end of the first stimulation and the beginning of the second
stimulation was reduced from 10, to 5, and 0 s (Figure 3A, B). In all three test conditions, the second low-
intensity stimulation shortened the locomotor bout compared to control condition. Locomotion ended 6.27 ±
0.48 s, 6.55 ± 0.46 s, and 7.15 ± 0.52 s after the onset of the second stimulation for intervals of 10, 5, 0 s,
respectively (Figure 3C; n = 25 trials in 5 animals).
In semi-intact preparations, swimming also occurred after sensory stimulation or spontaneously [32, 33]. This
mimics more closely locomotor activity that occurs in the natural environment. Just like MLR-induced
swimming, both sensory-evoked and spontaneous locomotor episodes could be stopped by low intensity MLR
stimulation (Figure 4A, B). After pinching the dorsal fin (Stim; Figure 4A1), long lasting swimming
movements were elicited in all cases (n = 30 trials in 6 animals). Low intensity MLR stimulation applied
during the sensory-evoked swimming activity significantly shortened the locomotor bout (64.31 ± 3.57 % of
control; p < 0.001; Figure 4A2, A3). Due to their rarity, spontaneous swimming bouts were not recorded
kinematically, but by intracellular recordings of RS cells that maintain their discharge (maintain cells, see
Figure 1A) throughout locomotor bouts (n = 25 trials in 5 animals; Figure 4B1). As observed for sensory-
evoked swimming, spontaneous locomotor episodes were significantly shortened by a MLR stimulation of
low intensity (46.02 ± 5.03 % of control; p < 0.001; Figure 4B2, B3).
The Termination Burst in Stop Cells is Time-Linked to the Second MLR Stimulation
Stop cells display a termination burst associated with the end of swimming regardless of the way it is initiated
(MLR stimulation, cutaneous stimulation, spontaneous) [15]. In the case of MLR-induced swimming, we
examined whether this burst was linked to the onset of the second MLR stimulation of low intensity (Figure
5A1). The MLR was stimulated first at the control intensity followed by a low-intensity stimulation, 5 s after
the end of the first stimulation. When compared to control, the termination burst appeared earlier in time in
cases where a second MLR stimulation was applied (Figure 5A1, bottom). The response discharge pattern
from several stop cells was transformed into a raster display and the trials were temporally aligned on the
onset of the second stimulation (n = 15 trials in 3 animals; Figure 5A2, top). The raster plot shows that the
onset of the termination burst is time-linked with the onset of the second MLR stimulation. This is also
apparent in the peristimulus histogram, in which an increase in spiking activity after the onset of the second
MLR stimulation is observed (Figure 5A2, bottom). As a comparison, the response pattern of maintain cells
was also recorded under the same conditions (Figure 5B1). In contrast to stop cells, maintain cells did not
display a termination burst, whether a second MLR stimulation was applied or not (Figure 5B1, top and
bottom), and their spiking activity was maintained until the cell repolarized at the end of the swimming bout.
When a second MLR stimulation was applied, the duration of their spiking activity was reduced (from 22.51 ±
65
Figure 5. Relationship between Termination Burst and Low-Intensity MLR Stimulation
(A1) In a semi-intact preparation, stop cells were recorded in control condition (top) and when a second MLR
stimulation of low intensity (50 % of control) was delivered 5 s after the first MLR stimulation had ended (bottom).
(A2) The raster plot (top) and the peristimulus histogram (bottom; bin size = 1 s) illustrate the cellular activity of
stop cells (n = 15 trials in 3 animals) that is aligned to the onset of the second MLR stimulation (dashed red line).
66
2.53 s to 16.29 ± 0.85 s) as would be expected for shorter locomotor bouts (see Figure 2), but the raster
display and the peristimulus histogram did not reveal a change in the activity pattern (n = 16 trials in 4
animals; Figure 5B2).
Connectivity between the MLR and Stop Cells
We then examined the projections between the MLR and stop cells. Stop cells were intracellularly recorded
and we examined their response to electric shocks applied to the MLR (Figure 6). The intensity was
determined at 50 % of the intensity used to trigger a locomotor bout. Under these conditions, double shocks
delivered with a time interval of 50, 25, 16.7, 12.5 ms (20, 40, 60, 80 Hz respectively) elicited short latency
EPSPs (2.8 up to 3.2 s; n = 4; Figure 6A). As the time interval between shocks was shortened, the EPSPs
remained unchanged. Next, double shocks with a time interval of 40 ms (25 Hz) were delivered to the MLR in
normal Ringer’s and in Ringer’s with high concentration of divalent cations (Figure 6B). This did not change
the synaptic responses of recorded stop cells (n = 2), suggesting that at least part of the connection between
the MLR and stop cells is monosynaptic.
Anatomical experiments (n = 8) were performed to determine if particular populations of MLR cells projected
to stop cell-rich, or to maintain cell-rich areas (see [15]). In these experiments, two fluorescent retrograde
tracers were injected on the same side, a few hours apart, the first injection being more extensive and more
caudal than the second. The rationale behind this was that MLR neurons that do not reach the caudal injection
level will only be labelled by the rostral injection, while the MLR neurons that terminate more caudally will
be labeled by the two injections (double-labeled) or only by the more extensive, more caudal one. The caudal
injection was made larger to make sure that all the axons that travelled through the rostral injection site and
continued down to the caudal injection were labelled. Using this technique, we first wanted to know if a
population of MLR neurons projected selectively to an area of the reticular formation rich in stop cells, the
caudal MRRN. To label these MLR cells specifically, the first caudal injection was made in the reticular
formation (rostral portion of the posterior rhombencephalic reticular nucleus or rPRRN) and the second
injection slightly more rostral (in the caudal portion of the medial rhombencephalic reticular nucleus or
cMRRN; an area rich in stop cells; Figure 7A). After such injections, cell bodies were retrogradely labeled in
(Continuation of Figure 5)
(B1) Same representation for the cellular activity of maintain cells that display activity throughout the swimming
episode. Maintain cells were recorded during MLR-induced swimming (control condition, top) and when the
MLR was stimulated a second time with low intensity (33 % of control; bottom). (B2) Raster plot and
peristimulus histogram represent spiking activity of maintain cells (n = 16 trials in 4 animals) aligned to the
onset of MLR stimulation of low intensity (dashed line).
67
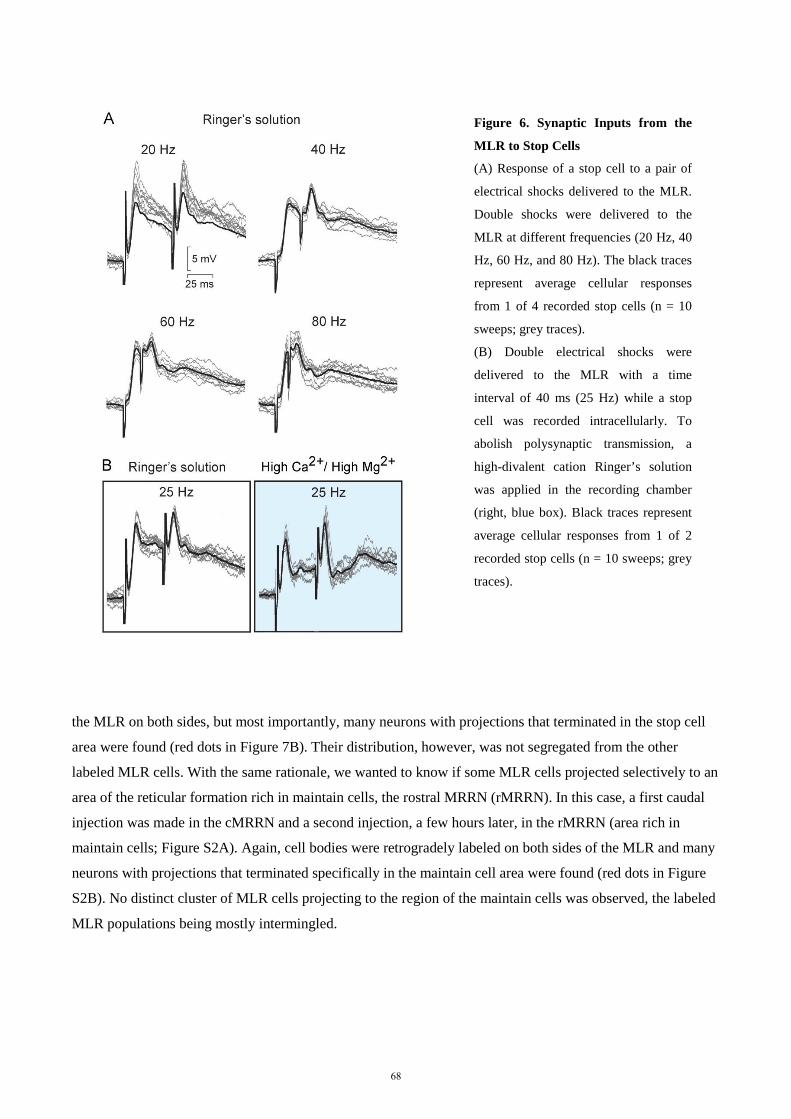
the MLR on both sides, but most importantly, many neurons with projections that terminated in the stop cell
area were found (red dots in Figure 7B). Their distribution, however, was not segregated from the other
labeled MLR cells. With the same rationale, we wanted to know if some MLR cells projected selectively to an
area of the reticular formation rich in maintain cells, the rostral MRRN (rMRRN). In this case, a first caudal
injection was made in the cMRRN and a second injection, a few hours later, in the rMRRN (area rich in
maintain cells; Figure S2A). Again, cell bodies were retrogradely labeled on both sides of the MLR and many
neurons with projections that terminated specifically in the maintain cell area were found (red dots in Figure
S2B). No distinct cluster of MLR cells projecting to the region of the maintain cells was observed, the labeled
MLR populations being mostly intermingled.
Figure 6. Synaptic Inputs from the
MLR to Stop Cells
(A) Response of a stop cell to a pair of
electrical shocks delivered to the MLR.
Double shocks were delivered to the
MLR at different frequencies (20 Hz, 40
Hz, 60 Hz, and 80 Hz). The black traces
represent average cellular responses
from 1 of 4 recorded stop cells (n = 10
sweeps; grey traces).
(B) Double electrical shocks were
delivered to the MLR with a time
interval of 40 ms (25 Hz) while a stop
cell was recorded intracellularly. To
abolish polysynaptic transmission, a
high-divalent cation Ringer’s solution
was applied in the recording chamber
(right, blue box). Black traces represent
average cellular responses from 1 of 2
recorded stop cells (n = 10 sweeps; grey
traces).
68
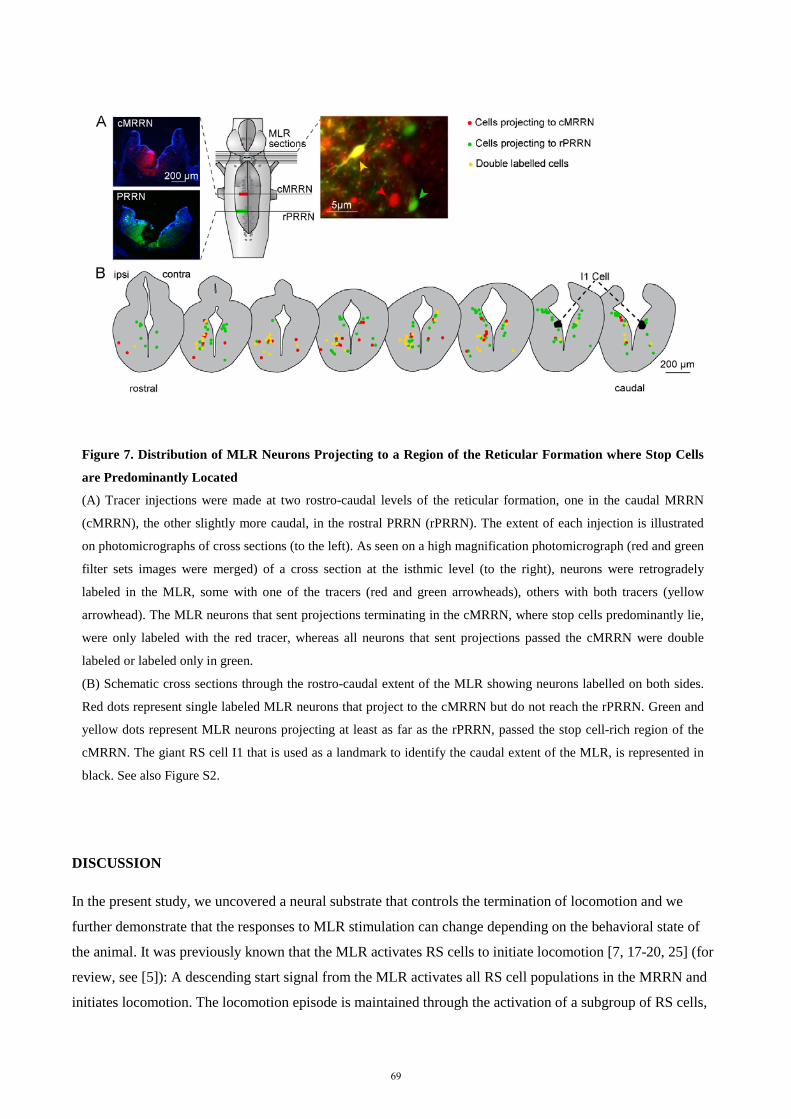
DISCUSSION
In the present study, we uncovered a neural substrate that controls the termination of locomotion and we
further demonstrate that the responses to MLR stimulation can change depending on the behavioral state of
the animal. It was previously known that the MLR activates RS cells to initiate locomotion [7, 17-20, 25] (for
review, see [5]): A descending start signal from the MLR activates all RS cell populations in the MRRN and
initiates locomotion. The locomotion episode is maintained through the activation of a subgroup of RS cells,
Figure 7. Distribution of MLR Neurons Projecting to a Region of the Reticular Formation where Stop Cells
are Predominantly Located
(A) Tracer injections were made at two rostro-caudal levels of the reticular formation, one in the caudal MRRN
(cMRRN), the other slightly more caudal, in the rostral PRRN (rPRRN). The extent of each injection is illustrated
on photomicrographs of cross sections (to the left). As seen on a high magnification photomicrograph (red and green
filter sets images were merged) of a cross section at the isthmic level (to the right), neurons were retrogradely
labeled in the MLR, some with one of the tracers (red and green arrowheads), others with both tracers (yellow
arrowhead). The MLR neurons that sent projections terminating in the cMRRN, where stop cells predominantly lie,
were only labeled with the red tracer, whereas all neurons that sent projections passed the cMRRN were double
labeled or labeled only in green.
(B) Schematic cross sections through the rostro-caudal extent of the MLR showing neurons labelled on both sides.
Red dots represent single labeled MLR neurons that project to the cMRRN but do not reach the rPRRN. Green and
yellow dots represent MLR neurons projecting at least as far as the rPRRN, passed the stop cell-rich region of the
cMRRN. The giant RS cell I1 that is used as a landmark to identify the caudal extent of the MLR, is represented in
black. See also Figure S2.
69
the maintain cells. We now report that MLR stimulation can also produce an opposite behavioral effect
consisting in the termination of locomotion, much like a brake pedal. This effect is mediated by the activation
of another subgroup of RS cells, the stop cells, which display a typical termination burst that coincides with
the end of the locomotion episodes. Our experiments also suggest the presence of a monosynaptic connection
between the MLR and stop cells. These results fill an important gap in knowledge relative to the neural
mechanisms underlying the termination of locomotion.
Synaptic Inputs to Stop Cells
The concept of brainstem cells involved in the termination of locomotion has been proposed for different
vertebrate species [12, 15, 16, 34, 35]. However, little is known about the mechanisms activating these stop
cells. In all of the above studies, stimulation of these RS cells (electric, pharmacologic, or optogenetic) led to
termination of ongoing locomotion. In the Xenopus tadpole, it was shown that the lower brainstem cells are
linked to sensorimotor network and are activated by stimulation of the head region [34]. The brainstem cells
described in mammals are thought to be controlled by central neural mechanisms, but details of the
connections are still unknown [16]. In cats it is considered that a disynaptic pathway from the
pedunculopontine nucleus (PPN) (considered part of the MLR in mammals) to medullary RS neurons elicits
motor inhibition, but details about this pathway are missing (for review, see [36]). It is well known that
projections from the MLR provide a major input to RS cells [7, 9, 17-20, 37, 38] (for review, [5]). In the
lamprey, these projections have been characterized extensively. Inputs from the MLR to RS cells were shown
to differ in strength of connectivity depending on the localization of the RS cells in the brainstem [7]. Rostral
RS cells located in the MRRN receive stronger MLR inputs than caudal RS cells located in the PRRN. The
connections were shown to be both mono- and disynaptic [11, 38] and glutamatergic as well as cholinergic
projection neurons were identified to be involved in locomotor initiation and speed control [7, 19]. The
present results demonstrate that at least a part of the projections from the MLR to stop cells are monosynaptic.
Moreover, our anatomical data indicate that numerous cells in the MLR seem to project specifically to an area
of the reticular formation rich in stop cells. We have not yet identified neurotransmitters involved in this
pathway, but in a previous study, we have shown that stimulating or blocking glutamatergic receptors in the
area rich in stop cells, triggered or delayed the termination of locomotion, respectively [15]. These results
strongly suggest that glutamatergic transmission is involved, while cholinergic neurotransmission has yet to
be tested.
70
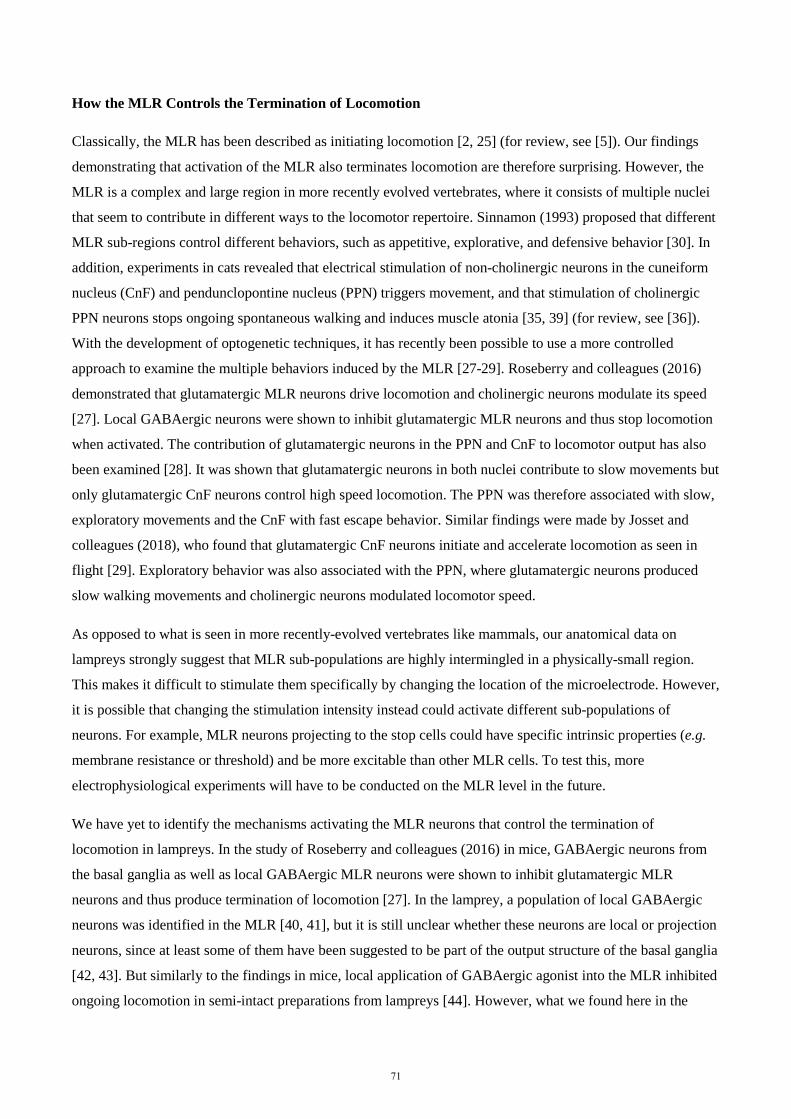
How the MLR Controls the Termination of Locomotion
Classically, the MLR has been described as initiating locomotion [2, 25] (for review, see [5]). Our findings
demonstrating that activation of the MLR also terminates locomotion are therefore surprising. However, the
MLR is a complex and large region in more recently evolved vertebrates, where it consists of multiple nuclei
that seem to contribute in different ways to the locomotor repertoire. Sinnamon (1993) proposed that different
MLR sub-regions control different behaviors, such as appetitive, explorative, and defensive behavior [30]. In
addition, experiments in cats revealed that electrical stimulation of non-cholinergic neurons in the cuneiform
nucleus (CnF) and pendunclopontine nucleus (PPN) triggers movement, and that stimulation of cholinergic
PPN neurons stops ongoing spontaneous walking and induces muscle atonia [35, 39] (for review, see [36]).
With the development of optogenetic techniques, it has recently been possible to use a more controlled
approach to examine the multiple behaviors induced by the MLR [27-29]. Roseberry and colleagues (2016)
demonstrated that glutamatergic MLR neurons drive locomotion and cholinergic neurons modulate its speed
[27]. Local GABAergic neurons were shown to inhibit glutamatergic MLR neurons and thus stop locomotion
when activated. The contribution of glutamatergic neurons in the PPN and CnF to locomotor output has also
been examined [28]. It was shown that glutamatergic neurons in both nuclei contribute to slow movements but
only glutamatergic CnF neurons control high speed locomotion. The PPN was therefore associated with slow,
exploratory movements and the CnF with fast escape behavior. Similar findings were made by Josset and
colleagues (2018), who found that glutamatergic CnF neurons initiate and accelerate locomotion as seen in
flight [29]. Exploratory behavior was also associated with the PPN, where glutamatergic neurons produced
slow walking movements and cholinergic neurons modulated locomotor speed.
As opposed to what is seen in more recently-evolved vertebrates like mammals, our anatomical data on
lampreys strongly suggest that MLR sub-populations are highly intermingled in a physically-small region.
This makes it difficult to stimulate them specifically by changing the location of the microelectrode. However,
it is possible that changing the stimulation intensity instead could activate different sub-populations of
neurons. For example, MLR neurons projecting to the stop cells could have specific intrinsic properties (e.g.
membrane resistance or threshold) and be more excitable than other MLR cells. To test this, more
electrophysiological experiments will have to be conducted on the MLR level in the future.
We have yet to identify the mechanisms activating the MLR neurons that control the termination of
locomotion in lampreys. In the study of Roseberry and colleagues (2016) in mice, GABAergic neurons from
the basal ganglia as well as local GABAergic MLR neurons were shown to inhibit glutamatergic MLR
neurons and thus produce termination of locomotion [27]. In the lamprey, a population of local GABAergic
neurons was identified in the MLR [40, 41], but it is still unclear whether these neurons are local or projection
neurons, since at least some of them have been suggested to be part of the output structure of the basal ganglia
[42, 43]. But similarly to the findings in mice, local application of GABAergic agonist into the MLR inhibited
ongoing locomotion in semi-intact preparations from lampreys [44]. However, what we found here in the
71
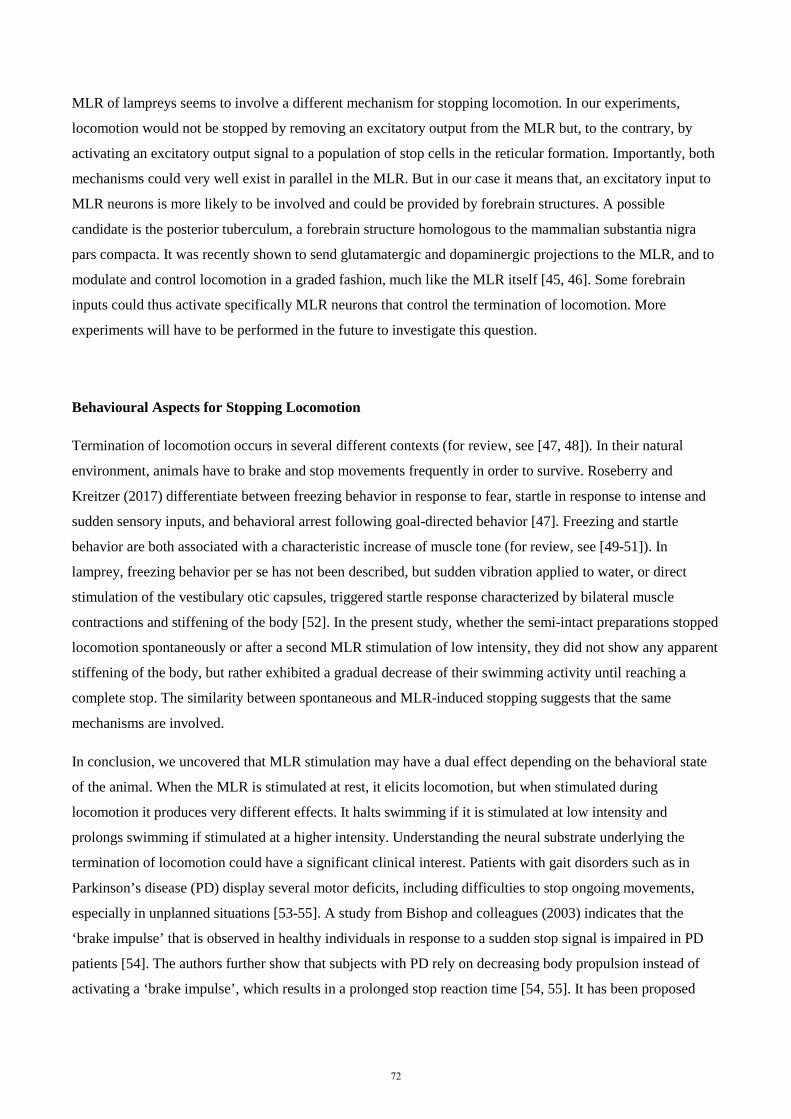
MLR of lampreys seems to involve a different mechanism for stopping locomotion. In our experiments,
locomotion would not be stopped by removing an excitatory output from the MLR but, to the contrary, by
activating an excitatory output signal to a population of stop cells in the reticular formation. Importantly, both
mechanisms could very well exist in parallel in the MLR. But in our case it means that, an excitatory input to
MLR neurons is more likely to be involved and could be provided by forebrain structures. A possible
candidate is the posterior tuberculum, a forebrain structure homologous to the mammalian substantia nigra
pars compacta. It was recently shown to send glutamatergic and dopaminergic projections to the MLR, and to
modulate and control locomotion in a graded fashion, much like the MLR itself [45, 46]. Some forebrain
inputs could thus activate specifically MLR neurons that control the termination of locomotion. More
experiments will have to be performed in the future to investigate this question.
Behavioural Aspects for Stopping Locomotion
Termination of locomotion occurs in several different contexts (for review, see [47, 48]). In their natural
environment, animals have to brake and stop movements frequently in order to survive. Roseberry and
Kreitzer (2017) differentiate between freezing behavior in response to fear, startle in response to intense and
sudden sensory inputs, and behavioral arrest following goal-directed behavior [47]. Freezing and startle
behavior are both associated with a characteristic increase of muscle tone (for review, see [49-51]). In
lamprey, freezing behavior per se has not been described, but sudden vibration applied to water, or direct
stimulation of the vestibulary otic capsules, triggered startle response characterized by bilateral muscle
contractions and stiffening of the body [52]. In the present study, whether the semi-intact preparations stopped
locomotion spontaneously or after a second MLR stimulation of low intensity, they did not show any apparent
stiffening of the body, but rather exhibited a gradual decrease of their swimming activity until reaching a
complete stop. The similarity between spontaneous and MLR-induced stopping suggests that the same
mechanisms are involved.
In conclusion, we uncovered that MLR stimulation may have a dual effect depending on the behavioral state
of the animal. When the MLR is stimulated at rest, it elicits locomotion, but when stimulated during
locomotion it produces very different effects. It halts swimming if it is stimulated at low intensity and
prolongs swimming if stimulated at a higher intensity. Understanding the neural substrate underlying the
termination of locomotion could have a significant clinical interest. Patients with gait disorders such as in
Parkinson’s disease (PD) display several motor deficits, including difficulties to stop ongoing movements,
especially in unplanned situations [53-55]. A study from Bishop and colleagues (2003) indicates that the
‘brake impulse’ that is observed in healthy individuals in response to a sudden stop signal is impaired in PD
patients [54]. The authors further show that subjects with PD rely on decreasing body propulsion instead of
activating a ‘brake impulse’, which results in a prolonged stop reaction time [54, 55]. It has been proposed
72
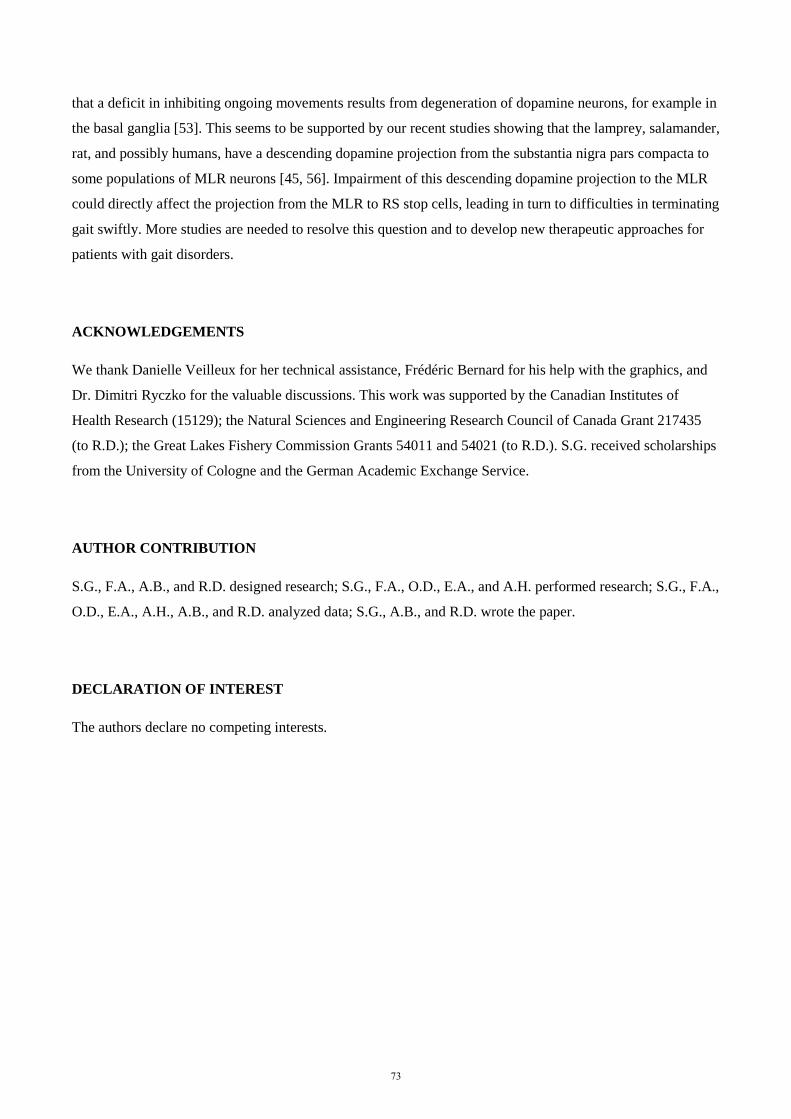
that a deficit in inhibiting ongoing movements results from degeneration of dopamine neurons, for example in
the basal ganglia [53]. This seems to be supported by our recent studies showing that the lamprey, salamander,
rat, and possibly humans, have a descending dopamine projection from the substantia nigra pars compacta to
some populations of MLR neurons [45, 56]. Impairment of this descending dopamine projection to the MLR
could directly affect the projection from the MLR to RS stop cells, leading in turn to difficulties in terminating
gait swiftly. More studies are needed to resolve this question and to develop new therapeutic approaches for
patients with gait disorders.
ACKNOWLEDGEMENTS
We thank Danielle Veilleux for her technical assistance, Frédéric Bernard for his help with the graphics, and
Dr. Dimitri Ryczko for the valuable discussions. This work was supported by the Canadian Institutes of
Health Research (15129); the Natural Sciences and Engineering Research Council of Canada Grant 217435
(to R.D.); the Great Lakes Fishery Commission Grants 54011 and 54021 (to R.D.). S.G. received scholarships
from the University of Cologne and the German Academic Exchange Service.
AUTHOR CONTRIBUTION
S.G., F.A., A.B., and R.D. designed research; S.G., F.A., O.D., E.A., and A.H. performed research; S.G., F.A.,
O.D., E.A., A.H., A.B., and R.D. analyzed data; S.G., A.B., and R.D. wrote the paper.
DECLARATION OF INTEREST
The authors declare no competing interests.
73
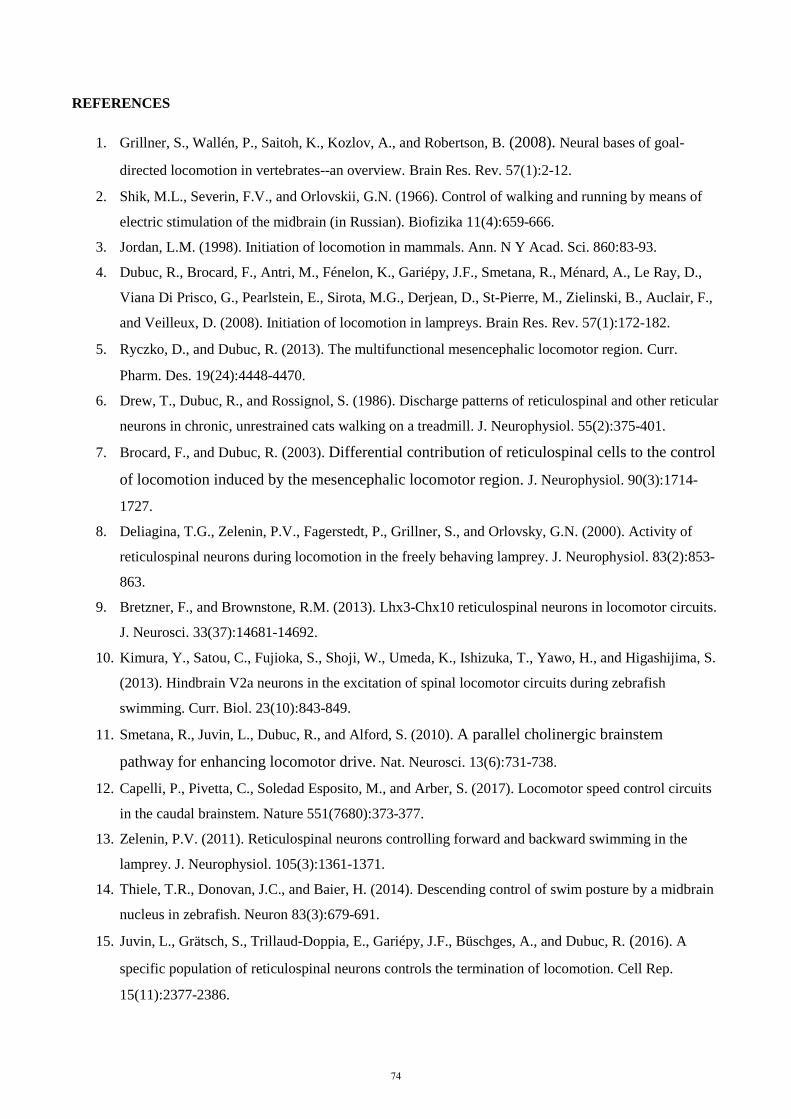
REFERENCES
1. Grillner, S., Wallén, P., Saitoh, K., Kozlov, A., and Robertson, B. (2008). Neural bases of goal-
directed locomotion in vertebrates--an overview. Brain Res. Rev. 57(1):2-12.
2. Shik, M.L., Severin, F.V., and Orlovskii, G.N. (1966). Control of walking and running by means of
electric stimulation of the midbrain (in Russian). Biofizika 11(4):659-666.
3. Jordan, L.M. (1998). Initiation of locomotion in mammals. Ann. N Y Acad. Sci. 860:83-93.
4. Dubuc, R., Brocard, F., Antri, M., Fénelon, K., Gariépy, J.F., Smetana, R., Ménard, A., Le Ray, D.,
Viana Di Prisco, G., Pearlstein, E., Sirota, M.G., Derjean, D., St-Pierre, M., Zielinski, B., Auclair, F.,
and Veilleux, D. (2008). Initiation of locomotion in lampreys. Brain Res. Rev. 57(1):172-182.
5. Ryczko, D., and Dubuc, R. (2013). The multifunctional mesencephalic locomotor region. Curr.
Pharm. Des. 19(24):4448-4470.
6. Drew, T., Dubuc, R., and Rossignol, S. (1986). Discharge patterns of reticulospinal and other reticular
neurons in chronic, unrestrained cats walking on a treadmill. J. Neurophysiol. 55(2):375-401.
7. Brocard, F., and Dubuc, R. (2003). Differential contribution of reticulospinal cells to the control
of locomotion induced by the mesencephalic locomotor region. J. Neurophysiol. 90(3):1714-
1727.
8. Deliagina, T.G., Zelenin, P.V., Fagerstedt, P., Grillner, S., and Orlovsky, G.N. (2000). Activity of
reticulospinal neurons during locomotion in the freely behaving lamprey. J. Neurophysiol. 83(2):853-
863.
9. Bretzner, F., and Brownstone, R.M. (2013). Lhx3-Chx10 reticulospinal neurons in locomotor circuits.
J. Neurosci. 33(37):14681-14692.
10. Kimura, Y., Satou, C., Fujioka, S., Shoji, W., Umeda, K., Ishizuka, T., Yawo, H., and Higashijima, S.
(2013). Hindbrain V2a neurons in the excitation of spinal locomotor circuits during zebrafish
swimming. Curr. Biol. 23(10):843-849.
11. Smetana, R., Juvin, L., Dubuc, R., and Alford, S. (2010). A parallel cholinergic brainstem
pathway for enhancing locomotor drive. Nat. Neurosci. 13(6):731-738.
12. Capelli, P., Pivetta, C., Soledad Esposito, M., and Arber, S. (2017). Locomotor speed control circuits
in the caudal brainstem. Nature 551(7680):373-377.
13. Zelenin, P.V. (2011). Reticulospinal neurons controlling forward and backward swimming in the
lamprey. J. Neurophysiol. 105(3):1361-1371.
14. Thiele, T.R., Donovan, J.C., and Baier, H. (2014). Descending control of swim posture by a midbrain
nucleus in zebrafish. Neuron 83(3):679-691.
15. Juvin, L., Grätsch, S., Trillaud-Doppia, E., Gariépy, J.F., Büschges, A., and Dubuc, R. (2016). A
specific population of reticulospinal neurons controls the termination of locomotion. Cell Rep.
15(11):2377-2386.
74
16. Bouvier, J., Caggiano, V., Leiras, R., Caldeira, V., Bellardita, C., Balueva, K., Fuchs, A., and Kiehn,
O. (2015). Descending command neurons in the brainstem that halt locomotion. Cell
163(5):1191-1203.
17. Orlovskii, G.N. (1970). Relations between reticulo-spinal neurons and locomotor regions of the brain
stem (in Russian). Biofizika 15(1):171-178.
18. Steeves, J.D., and Jordan, L.M. (1984). Autoradiographic demonstration of the projections from the
mesencephalic locomotor region. Brain Res. 307(1-2):263-276.
19. Le Ray, D., Brocard, F., Bourcier-Lucas, C., Auclair, F., Lafaille, P., and Dubuc, R. (2003).
Nicotinic activation of reticulospinal cells involved in the control of swimming in
lampreys. Eur. J. Neurosci. 17(1):137-148.
20. Ryczko, D., Auclair, F., Cabelguen, J.M., and Dubuc, R. (2016). The mesencephalic locomotor region
sends a bilateral glutamatergic drive to hindbrain reticulospinal neurons in a tetrapod. J. Comp.
Neurol. 524(7):1361-1383.
21. Skinner, R.D., and Garcia-Rill, E. (1984). The mesencephalic locomotor region (MLR) in the rat.
Brain Res. 323(2):385-389.
22. Lee, A.M., Hoy, J.L., Bonci, A., Wilbrecht, L., Stryker, M.P., and Niell, C.M. (2014). Identification
of a brainstem circuit regulating visual cortical state in parallel with locomotion. Neuron 83:455-466.
23. Cabelguen, J.M., Bourcier-Lucas, C., and Dubuc, R. (2003). Bimodal locomotion elicited by electrical
stimulation of the midbrain in the salamander Notophthalmus viridescens. J. Neurosci. 23(6):2434-
2439.
24. Sholomenko, G.N., Funk, G.D., and Steeves, J.D. (1991). Avian locomotion activated by
brainstem infusion of neurotransmitter agonists and antagonists. I. Acetylcholine excitatory amino
acids and substance P. Exp. Brain Res. 85(3):659-673.
25. Sirota, M.G., Di Prisco, G.V., and Dubuc, R. (2000). Stimulation of the mesencephalic locomotor
region elicits controlled swimming in semi-intact lampreys. Eur. J. Neurosci. 12(11):4081-4092.
26. Garcia-Rill, E., Skinner, R.D., and Fitzgerald, J.A. (1985). Chemical activation of the mesencephalic
locomotor region. Brain Res. 330(1):43-54.
27. Roseberry, T.K., Lee, A.M., Lalive, A.L., Wilbrecht, L., Bonci, A., Kreitzer, A.C. (2016). Cell-type-
specific control of brainstem locomotor circuits by basal ganglia. Cell 164(3):526-537.
28. Caggiano, V., Leiras, R., Goñi-Erro, H., Masini, D., Bellardita, C., Bouvier, J., Caldeira, V., Fisone,
G., and Kiehn, O. (2018). Midbrain circuits that set locomotor speed and gait selection. Nature
553(7689):455-460.
29. Josset, N., Roussel, M., Lemieux, M., Lafrance-Zoubga, D., Rastqar, A., and Bretzner, F. (2018).
Distinct contributions of mesencephalic locomotor region nuclei to locomotor control in the freely
behaving mouse. Curr. Biol. 28(6):884-901.
75
30. Sinnamon, H.M. (1993). Preoptic and hypothalamic neurons and the initiation of locomotion in the
anesthetized rat. Prog. Neurobiol. 41(3):323-344.
31. Grillner, S., and Robertson, B. (2017). Selection of action - A vertebrate perspective. In Neurobiology
of Motor Control - Fundamental Concepts and New Directions, S.L. Hooper and A. Büschges, eds.
(New Jersey, United States of America: Wiley-Blackwell), pp. 181-191.
32. Di Prisco, G.V., Pearlstein, E., Robitaille, R., and Dubuc, R. (1997). Role of sensory-evoked
NMDA plateau potentials in the initiation of locomotion. Science 278(5340):1122-1125.
33. Di Prisco, G.V., Pearlstein, E., Le Ray, D., Robitaille, R., and Dubuc, R. (2000). A cellular
mechanism for the transformation of a sensory input into a motor command. J. Neurosci.
20(21):8169-8176.
34. Perrins, R., Walford, A., and Roberts, A. (2002). Sensory activation and role of inhibitory
reticulospinal neurons that stop swimming in hatchling frog tadpoles. J. Neurosci. 22(10):4229-4240.
35. Takakusaki, K., Kohyama, J., and Matsuyama, K. (2003). Medullary reticulospinal tract mediating a
generalized motor inhibition in cats: III. Functional organization of spinal interneurons in the lower
lumbar segments. Neurosci. 121(3):731-746.
36. Takakusaki, K. (2008). Forebrain control of locomotor behaviors. Brain Res. Rev. 57(1):192-198.
37. Garcia-Rill, E., and Skinner, R.D. (1987). The mesencephalic locomotor region. II. Projections to
reticulospinal neurons. Brain Res. 411(1):13-20.
38. Brocard, F., Ryczko, D., Fénelon, K., Hatem, R., Gonzales, D., Auclair, F., and Dubuc, R. (2010).
The transformation of a unilateral locomotor command into a symmetrical bilateral activation in the
brainstem. J. Neurosci. 30(2):523-533.
39. Takakusaki, K., Habaguchi, T., Saitoh, K., and Kohyama, J. (2004). Changes in the excitability of
hindlimb motoneurons during muscular atonia induced by stimulating the pedunculopontine
tegmental nucleus in cats. Neurosci. 124(2):467-480.
40. Meléndez-Ferro, M., Pérez-Costas, E., Villar-Cheda, B., Rodríguez-Muñoz, R., Anadón, R., and
Rodicio, M.C. (2003). Ontogeny of gamma-aminobutyric acid-immunoreactive neurons in the
rhombencephalon and spinal cord of the sea lamprey. J. Comp. Neurol. 464(1):17-35.
41. Robertson, B., Auclair, F., Ménard, A., Grillner, S., and Dubuc, R. (2007). GABA distribution in
lamprey is phylogenetically conserved. J. Comp. Neurol. 503(1):47-63.
42. Stephenson-Jones, M., Samuelsson, E., Ericsson, J., Robertson, B., and Grillner, S. (2011).
Evolutionary conservation of the basal ganglia as a common vertebrate mechanism for action
selection. Curr. Biol. 21(13):1081-1091.
43. Stephenson-Jones, M., Ericsson, J., Robertson, B., and Grillner, S. (2012). Evolution of the basal
ganglia: dual-output pathways conserved throughout vertebrate phylogeny. J. Comp. Neurol.
520(13):2957-2973.
76
44. Ménard, A., Auclair, F., Bourcier-Lucas, C., Grillner, S., and Dubuc, R. (2007). Descending
GABAergic projections to the mesencephalic locomotor region in the lamprey Petromyzon
marinus. J. Comp. Neurol. 501(2):260-273.
45. Ryczko, D., Grätsch, S., Auclair, F., Dubé, C., Bergeron, S., Alpert, M.H., Cone, J.J., Roitman, M.F.,
Alford, S., and Dubuc, R. (2013). Forebrain dopamine neurons project down to a brainstem
region controlling locomotion. Proc. Natl. Acad. Sci. USA. 110(34):E3235-42.
46. Ryczko, D., Grätsch, S., Schläger, L., Keuyalian, A., Boukhatem, Z., Garcia, C., Auclair, F.,
Büschges, A., and Dubuc, R. (2017). Nigral glutamatergic neurons control the speed of locomotion. J.
Neurosci. 37(40):9759-9770.
47. Roseberry, T., and Kreitzer, A. (2017). Neural circuitry for behavioural arrest. Philos. Trans. R.
Soc. Lond. B. Biol. Sci. 372(1718).
48. Kim, L.H., Sharma, S., Sharples, S.A., Mayr, K.A., Kwok, C.H.T., and Whelan, P.J. (2017).
Integration of descending command systems for the generation of context-specific locomotor
behaviors. Front. Neurosci. 11:581.
49. Roelofs, K. (2017). Freeze for action: neurobiological mechanisms in animal and human freezing.
Phil. Trans. R. Soc. Lond. B. Biol. Sci. 372(1718).
50. Koch, M. (1999). The neurobiology of startle. Prog. Neurobiol. 59(2):107-128.
51. Yeomans, J.S., Li, L., Scott, B.W., and Frankland, P.W. (2002). Tactile, acoustic and vestibular
systems sum to elicit the startle reflex. Neurosci. Biobehav. Rev. 26(1):1-11.
52. Currie, S., and Carlsen, R.C. (1985). A rapid startle response in larval lampreys. Brain Res. 358(1-
2):367-371.
53. Gauggel, S., Rieger, M., and Feghoff, T.A. (2004). Inhibition of ongoing responses in patients with
Parkinson's disease. J. Neurol. Neurosurg. Psychiatry 75(4):539-544.
54. Bishop, M.D., Brunt, D., Kukulka, C., Tillman, M.D., and Pathare, N. (2003). Braking impulse and
muscle activation during unplanned gait termination in human subjects with parkinsonism. Neurosci.
Lett. 348(2):89-92.
55. Bishop, M., Brunt, D., and Marjama-Lyons, J. (2006). Do people with Parkinson's disease change
strategy during unplanned gait termination? Neurosci. Lett. 397(3):240-244.
56. Ryczko, D., Cone, J.J., Alpert, M.H., Goetz, L., Auclair, F., Dubé, C., Parent, M., Roitman, M.F.,
Alford, S., Dubuc, R. (2016). A descending dopamine pathway conserved from basal vertebrates to
mammals. Proc Natl Acad Sci U S A. 113(17):E2440-9.
57. Ranck, J.B. Jr. (1975). Which elements are excited in electrical stimulation of mammalian
central nervous system: a review. Brain Res. 98(3):417-440.
58. Rovainen, C.M. (1967). Physiological and anatomical studies on large neurons of central nervous
system of the sea lamprey (Petromyzon marinus). I. Müller and Mauthner cells. J. Neurophysiol.
30(5):1000-1023.
77

59. Paggett, K.C., Jackson, A.W., and McClellan, A.D. (2004). Organization of higher-order brain areas
that initiate locomotor activity in larval lamprey. Neurosci. 125(1):25-33.
60. Jackson, A.W., Pino, F.A., Wiebe, E.D., and McClellan, A.D. (2007). Movements and muscle activity
initiated by brain locomotor areas in semi-intact preparations from larval lamprey. J. Neurophysiol.
97(5):3229-3241.
78
STAR METHODS
Contact for Agent and Resource Sharing
Further information and requests for resources and reagents should be directed to and will be fulfilled by the
Lead Contact, Réjean Dubuc ([email protected]).
Experimental Model and Subject Details
All procedures conformed to the guidelines of the Canadian Council on Animal Care and were approved by
the animal care and use committees of the Université de Montréal (QC, Canada) and Université du Québec à
Montréal (QC, Canada). Care was taken to minimize the number of animals used and their suffering. All
experiments were performed in larval sea lampreys, Petromyzon marinus that were collected in a river near
Notre-Dame-de-Stanbridge (Rivière aux Brochets, QC, Canada). The animals were kept in aerated water at 5°
C and received every other week approximately 2 mg of yeast per animal. In the present study, the sex of the
individual larval animals was not taken into account.
Method Details
Semi-Intact and Isolated Brain Preparations
Semi-intact preparations (n = 44) were used to simultaneously record RS cell activity and locomotor
movements. For this purpose, the brain and rostral spinal cord segments were dissected free and the caudal
part of the body was kept intact. Animals were deeply anaesthetized with tricaine methanesulphonate
(MS 222, 100 mg / L; Sigma Chemical) and transferred into a cold and oxygenated Ringer’s solution of the
following composition (in mM): NaCl 130.0, KCl 2.1, CaCl2 2.6, MgCl2 1.8, HEPES 4.0, dextrose 4.0 and
NaHCO3 1.0, adjusted to a pH of 7.4. A transverse incision was made on the ventral side at the level of the last
pair of gills. Skin and muscle tissue was then removed from the rostral part of the body and around the head.
The brain and the rostral spinal cord segments were then exposed dorsally by removing the surrounding tissue,
skin, muscles and cranial cartilage. The choroid plexus over the mesencephalic and fourth ventricles was
removed to gain access to RS neurons and the MLR. Decerebration was achieved by a complete transverse
section of the neuraxis just rostral to the mesencephalon. A dorsal midsagittal transection was performed at
the isthmus to provide an easier access to the MLR. The animals were transferred into a recording chamber
continuously perfused with cold, oxygenized Ringer’s solution. One part of the chamber was shallow and
designed to pin down the rostral part of the preparation onto the Sylgard (Dow Corning) lining at the bottom,
in order to record the activity of the brainstem neurons. The other part of the chamber was deeper and allowed
the intact body (caudal part of the animal) to swim freely (Figure 1B). Animals were allowed to recover for at
least 1 hour before recording.
79
For anatomical experiments, isolated brain preparations of larval lampreys were used (n = 8). The dissection
procedure was the same as described above but a complete transverse cut was made at the level of the last
gills to remove the body.
Electrophysiological Recordings and Stimulation
Intracellular recordings of RS cells were made using sharp microelectrodes (80 - 120 MΩ), filled with 4M
potassium acetate. The signals were amplified and sampled at a rate of 10 kHz (Axoclamp 2A; Axon
Instruments) and acquired through a Digidata 1200 series interface coupled to Clampex 8.1 software (Axon
Instruments). Intracellular signals were analyzed using Clampfit 10.4 (Axon Instruments) or Spike2 5.19
software (Camebridge Electronic Design Limited). The MLR was electrically stimulated on one side to elicit
swimming movements of the intact body. Trains of 2 ms pulses (frequency of 5 Hz for 10 s) were delivered
through custom made glass-coated tungsten microelectrodes (4 - 5 MΩ with 10 µm tip exposure) using a
Grass S88 stimulator (Astro Med). Stimulation intensities ranged from 0.5 - 15 µA, theoretically
corresponding to a maximum current spread of 130 - 281 µm around the stimulation electrode [57].
Stimulation trains were delivered to the MLR with at least a 3 min waiting period in between. The location of
the stimulation site was based on previous anatomical and physiological studies in the lamprey MLR, whereby
the giant RS cell I1 [58] serves as a MLR landmark [7, 19, 25, 45].
In a series of experiments, the synaptic connectivity was tested using a high-divalent cation Ringer’s solution
(10.8 mM Ca2+/ 7.2 mM Mg2+; [7, 19]). In these experiments, the recording chamber was split between the
head and body using petroleum jelly (Vaseline) and the Ringer’s solution in the head chamber was replaced
by a high-divalent cation solution. After 30 min of exposure to the high-divalent cation solution, the MLR was
stimulated with two electrical shocks (2 ms) applied at a high frequency (20, 40, 60, 80, and 25 Hz).
Drugs
In a series of experiments, the MLR was pharmacologically stimulated with microinjections of D-glutamate (5
mM in Ringer’s solution, Sigma-Aldrich). Microinjections were performed as described in previous studies
(e.g. [15, 45, 59, 60]): a glass micropipette (diameter of opening 10 - 20 µm) was inserted in the MLR and the
D-glutamate solution was pressure-ejected (3 - 4 psi, 20 ms pulses, 2 - 3 pulses) using a Picospritzer (General
Valve Corporation). The solution was colored with the inactive dye Fast Green for visual guidance of the
ejected droplets. Control injections consisted of Ringer’s solution alone.
80
Kinematic Analysis
A video camera (HDR-XR200; Sony) was placed 1 m above the recording chamber to record swimming
movements of the intact body (sampling rate: 30 frame / s). Video recordings were analyzed using a custom
made script in MatlabR2009A (Math Works, Inc.; [38, 45]). Swimming movements were analyzed by adding
equally spaced markers offline along the midline of the body. The lateral displacement of the body curvature
was then monitored for each frame. For this, the angle between the longitudinal axis of the non-moving body
parts (line along the body midline) and a straight line drawn between two successive markers located in the
middle of the body was measured for the entire locomotor bout. The values were expressed in radian (rad).
Anatomical Tracing
Anatomical experiments were performed to investigate the distribution of MLR neurons projecting to the
caudal MRRN and the rostral MRRN. Double injections, delayed in time and at different rostro-caudal levels,
were carried out in the reticular formation to determine the termination region of specific populations of MLR
neurons. In these experiments, two injections were made with a 4 h interval, one more caudal than the other,
in isolated brainstem preparations. The first injection, the caudal one, consisted of a unilateral transverse
section of the medial tegmentum using a microsurgical knife (Sharpoint). The lesion was quickly filled with
crystals of Fluorescein dextran amines (3000 MW; Molecular Probes) left there to dissolve for 10 min. This
allowed the tracer uptake by the cut axons. After thorough rinsing of the injected area, the preparation was
placed in cold oxygenated Ringer’s solution to guarantee tracer transport past the location of the more rostral,
future second injection. After 4 h, a second ipsilateral transverse section of the medial tegmentum was made
and quickly filled with crystals of Texas Red dextran amines (3000; Molecular Probes) left there to dissolve
for 10 min. The second, more rostral injection, was always more restricted medio-laterally than the first, more
caudal one. Care was taken so that tracer from the second injection did not spread to the first injection area.
After thoroughly rinsing the second injection site, the preparation was again transferred to cold oxygenated
Ringer’s solution overnight. The next morning, it was transferred into a fixative solution (4 %
paraformaldehyde in 0.1 M phosphate buffer with 0.9 % NaCl, pH 7.4 (PBS)) for 24 h, followed by an
immersion in a sucrose solution (20 % in phosphate buffer) for at least 24 h. The brain was frozen and cross
sectioned (25 µm) on a cryostat. The sections were placed on ColorFrost Plus microscope slides (Fisher
Scientific) and rinsed with PBS and coverslipped using Vectashield mounting medium (with DAPI; Vector
Laboratories). Labeled cell bodies in the MLR were observed under an E600 epifluorescent microscope
equipped with a digital camera (DXM 1200; Nikon). The sections were photographed and levels were
adjusted in Photoshop CS5 (Adobe) so that all fluorophores were clearly visible.
81
Quantification and Statistical Analysis
Data in the text are represented as the mean ± SEM. Statistical analysis was performed with Sigma Plot 11.0
(Systat). Comparisons between two groups were made in which normality and equal variance assumptions
were not met. In these two cases, a Man Whitney rank-sum test was applied to compare the two groups. For
more than two groups, One-way ANOVA for repeated measures was used as parametric and Friedman
repeated measures analysis of variance on ranks as non-parametric analyses. These analyses were followed by
a Student-Newman-Keuls post-hoc test as a pairwise multiple comparison procedure.
To calculate correlations between variables, the Pearson product-moment correlation test was used. For all
statistical analyses carried out in this study, differences were considered statistically significant when p <
0.05. Illustrations were made using Illustrator CS5 (Adobe).
82
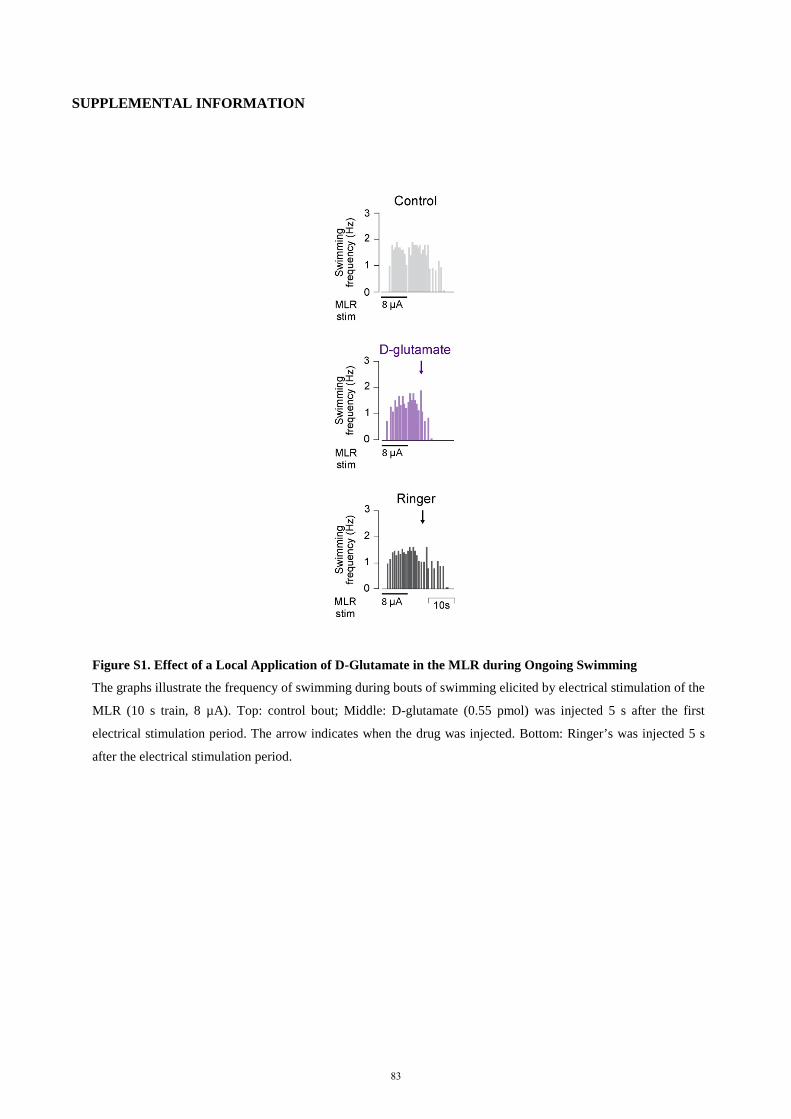
SUPPLEMENTAL INFORMATION
Figure S1. Effect of a Local Application of D-Glutamate in the MLR during Ongoing Swimming
The graphs illustrate the frequency of swimming during bouts of swimming elicited by electrical stimulation of the
MLR (10 s train, 8 µA). Top: control bout; Middle: D-glutamate (0.55 pmol) was injected 5 s after the first
electrical stimulation period. The arrow indicates when the drug was injected. Bottom: Ringer’s was injected 5 s
after the electrical stimulation period.
83
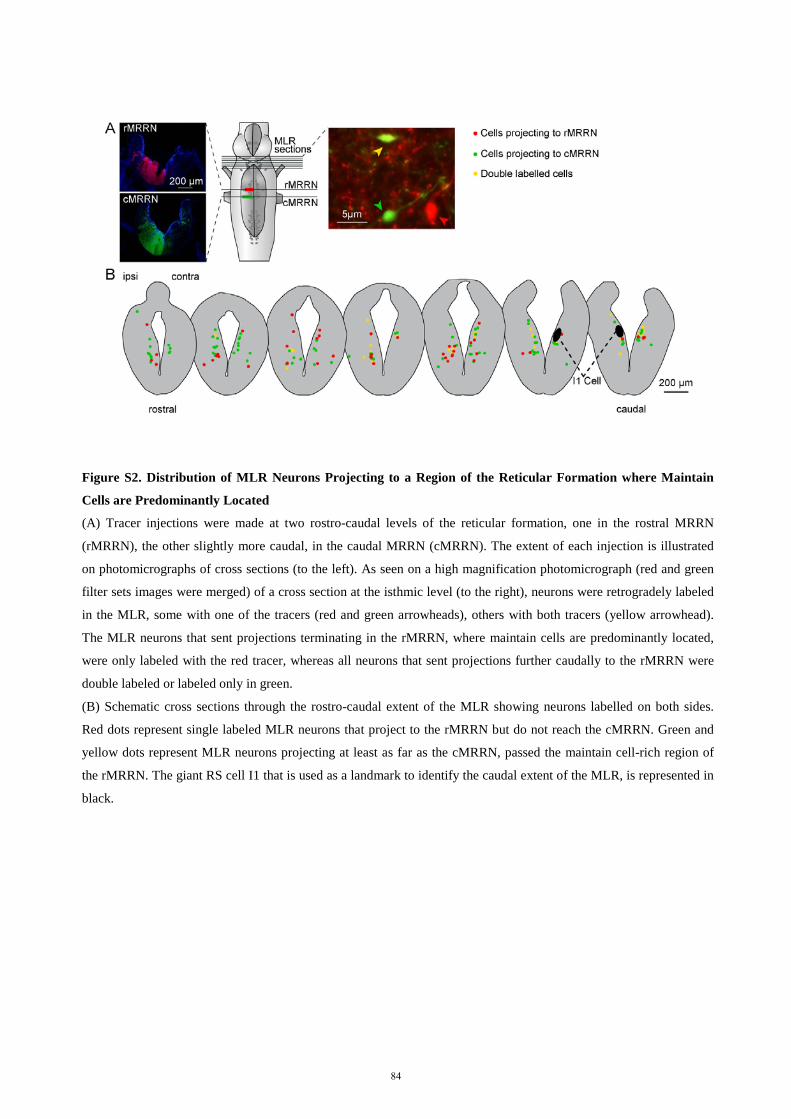
Figure S2. Distribution of MLR Neurons Projecting to a Region of the Reticular Formation where Maintain
Cells are Predominantly Located
(A) Tracer injections were made at two rostro-caudal levels of the reticular formation, one in the rostral MRRN
(rMRRN), the other slightly more caudal, in the caudal MRRN (cMRRN). The extent of each injection is illustrated
on photomicrographs of cross sections (to the left). As seen on a high magnification photomicrograph (red and green
filter sets images were merged) of a cross section at the isthmic level (to the right), neurons were retrogradely labeled
in the MLR, some with one of the tracers (red and green arrowheads), others with both tracers (yellow arrowhead).
The MLR neurons that sent projections terminating in the rMRRN, where maintain cells are predominantly located,
were only labeled with the red tracer, whereas all neurons that sent projections further caudally to the rMRRN were
double labeled or labeled only in green.
(B) Schematic cross sections through the rostro-caudal extent of the MLR showing neurons labelled on both sides.
Red dots represent single labeled MLR neurons that project to the rMRRN but do not reach the cMRRN. Green and
yellow dots represent MLR neurons projecting at least as far as the cMRRN, passed the maintain cell-rich region of
the rMRRN. The giant RS cell I1 that is used as a landmark to identify the caudal extent of the MLR, is represented in
black.
84
7. Discussion
7.1. Inputs to the MLR: Modulation of locomotion and control of locomotor
speed
Dopaminergic modulation of locomotion
Classically, dopaminergic neurons of the mammalian SNc are described to send ascending projections to the
striatum, the input region of the basal ganglia (for review, see Ryczko et al., 2017). A similar ascending
dopaminergic pathway to the striatum was anatomically identified in the lamprey (Pombal et al., 1997;
Ryczko et al., 2013; Peréz-Frenández et al., 2014). Here, dopaminergic neurons of the PT were shown to
directly innervate the striatum, suggesting that the PT is homologous to the mammalian SNc. In addition to
this ascending projection, we discovered a descending dopaminergic projection originating from the PT
(Ryczko et al., 2013). We found that dopaminergic neurons directly innervate the MLR to amplify descending
excitatory inputs via a D1 receptor-dependent mechanism. Since many lamprey forebrain structures have been
found to be anatomically and neurochemically similar to those of mammals (Stephenson-Jones et al., 2011;
2012; for review, see Grillner and Robertson, 2016), the question emerged whether this descending
dopaminergic pathway from the PT to the MLR is also present in higher vertebrates, including mammals.
Indications for this were found in anatomical experiments performed in monkeys, in which dopaminergic
terminals had been identified in the PPN (Rolland et al., 2009). To examine this in greater detail, Ryczko and
colleagues (2016) performed a comparative study in salamanders and rats, and additionally performed
experiments in human brain tissue. In salamanders and rats, they provided anatomical and physiological
evidence that the dopaminergic cells project from the PT/ SNc to the MLR. Dopaminergic fibers were also
anatomically identified in the human PPN. An interesting aspect of the two studies of Ryczko and colleagues
(2013; 2016) was that some dopaminergic neurons in the PT/ SNc were found to project to both the MLR and
the striatum, but their number differed from one species to another. Only few of these neurons were found in
lampreys, and none in salamander. In rats on the other hand, several of these neurons were identified in the
SNc and it was speculated that an increase in ascending dopaminergic fibers is based on the increase of basal
ganglia size during evolution (for review, see Ryczko and Dubuc, 2017; Grillner and Robertson, 2016).
It has not yet been resolved if the ascending and descending dopaminergic pathways have different functional
roles. Considering their targets, it is possible that the descending dopaminergic pathway to the MLR controls
the excitability of brainstem motor circuits and directly amplifies the locomotor command that originates from
forebrain structures. The ascending pathway could be involved in the selection of motor programs since it is
innervating the input region of the basal ganglia, a brain structure known to be involved in action selection
85
(for review, see Grillner and Robertson, 2016). More experiments will have to be performed in the future in
order to answer this question.
Glutamatergic control of locomotor speed
In addition to the descending dopaminergic pathway, a glutamatergic projection from the PT to the MLR has
been identified in the lamprey (Ryczko et al., 2017). In Anatomical and physiological experiments it was
found that dopaminergic and glutamatergic projections to the MLR have different functions (Ryczko et al.,
2017). As previously described, dopaminergic MLR inputs modulate and amplify activity in the MLR. This
input, however, is not necessary to initiate locomotion since swimming can still be elicited by electrical PT
stimulation after a local blockage of D1 receptors in the MLR. Glutamatergic inputs to the MLR, on the other
hand, are necessary to initiate locomotion and they control MLR activity in a graded fashion (Ryczko et al.,
2017). The neural mechanisms underlying this function of the MLR are not yet elucidated. In a recent study,
Roseberry and colleagues (2016) demonstrated that MLR sub-populations have different functional roles in
mice. Glutamatergic MLR neurons are necessary and sufficient to initiate locomotion and their optogenetic
activation drives locomotion. Optogenetic activation of cholinergic MLR neurons on the other hand does not
trigger locomotion at rest but modulates the speed of the ongoing locomotor bout. In the lamprey,
glutamatergic and cholinergic neurons have been identified in the MLR (Le Ray et al., 2003; Brocard et al.,
2010), but so far it is unknown if they control the locomotor output differently. It has been reported that local
ejections of acetylcholine over the RS cells in the MRRN accelerates the fictive locomotor rhythm induced by
NMDA, (Le Ray et al., 2003), similar to what has been observed in mice (Roseberry et al., 2016). Taking
these findings into account, it is possible that glutamatergic neurons from the PT project to cholinergic
neurons in the MLR to control the locomotor output in a graded fashion (Ryczko et al., 2017). However, since
it has not been examined whether PT neurons project to specific cell populations in the MLR, this hypothesis
remains speculative. In order to test it, anatomical as well as physiological experiments should be performed
in the future.
It also has not been resolved in which context the glutamatergic pathway from the PT to the MLR is recruited.
It could be part of the olfactory-locomotor circuit, since fibers from the medial olfactory bulb project directly
to the PT and electrical stimulation of this region elicits responses in the MLR that evoke locomotion (Derjean
et al., 2010; Ryczko et al., 2017). In this case, olfactory inputs could generate different activity levels in the
PT, which in turn could finely tune the locomotor command from the MLR. Such mechanism could play a
crucial role for animals to move towards an attractive olfactory stimulus or avoid dangerous ones.
86
7.2. Outputs of the MLR: Termination of locomotion
Command cells for stopping locomotion and their targets
We demonstrated the presence of RS stop cells that control the end of a locomotor bout in lampreys (Juvin et
al., 2016). Anatomical experiments revealed that their axons project to the spinal cord, but neither their spinal
targets have been identified nor the neurotransmitter they use. Command cells for stopping locomotor
movements have been identified in both invertebrates (crayfish: Kagaya and Takahata, 2010; 2011;
cockroach: Kai and Okada, 2013; leech: O’Gara and Friesen, 1995; Taylor et al., 2003) and vertebrates
(Xenopus tadpole: Perrins et al., 2002; mouse: Bouvier et al., 2015; Capelli et al., 2017; cat: Takakusaki et al.,
2001). In vertebrates, different neural mechanisms have been described to be involved in the termination of
locomotion. In the Xenopus tadpole, ongoing swimming bouts stop if the animal swims into an object
(Boothby and Roberts, 1992). Mechanical stimulation of the head’s cement gland activates the trigeminal
afferents that in turn excite GABAergic neurons in the hindbrain (Perrins et al., 2002). These GABAergic
cells send mostly contralateral projections to the spinal cord to inhibit spinal locomotor CPGs (Perrins et al.,
2002). More recently, glutamatergic V2a ‘stop neurons’ were identified in the brainstem of mice (Bouvier et
al., 2015). Optogenetic activation of these V2a ‘stop neurons’ halts ongoing locomotor movements, and a
blockade of the synaptic output increases ambulating phases dramatically. These neurons project to inhibitory
and excitatory neurons in the lamina VII and X of the lumbar spinal cord, and it was proposed that they make
direct and indirect synaptic contacts to inhibitory spinal circuits (Bouvier et al., 2015). Capelli and colleagues
(2017) also identified RS neurons in the mouse brainstem that stop locomotion when activated
optogenetically. These neurons are glycinergic and send direct descending projections to the spinal cord,
where they mostly target motor neurons residing in the ventral laminae (Capelli et al., 2017). Taken together,
excitatory (glutamatergic) as well as inhibitory (glycinergic, GABAergic) command neurons have been
reported to control the termination of locomotion. In the lamprey, glutamatergic as well as glycinergic RS
cells have been identified (Buchanan et al., 1987a; Ohta and Grillner, 1989; Wannier et al, 1995). Both RS
groups were shown to project directly to the spinal cord and target spinal interneurons and motor neurons.
However, the identified glutamatergic RS cells were either Müller or Mauthner cells located in the rostral
MRRN (Buchanan et al., 1987a) or in the PRRN (Ohta and Grillner, 1989), and do not coincide with the
location of the stop cells in the caudal MRRN. As Wannier and colleagues performed the experiments only on
the axons of RS cells, the localization of the cell bodies of glycinergic RS cells is unknown and cannot be
correlated to our findings (Juvin et al., 2016).
Another interesting aspect is that stop cells exhibit two bursts of activity: one burst at the beginning of the
locomotor bout and one at the end (‘termination burst’). It seems puzzling that stop cells encode two
antagonistic signals and so far, the underlying neural mechanism is not yet understood. Interestingly, in motor
pathways of vertebrates (e.g. cat: Rossignol et al., 1981; Pearson and Collins, 1993) and invertebrates (e.g.
87
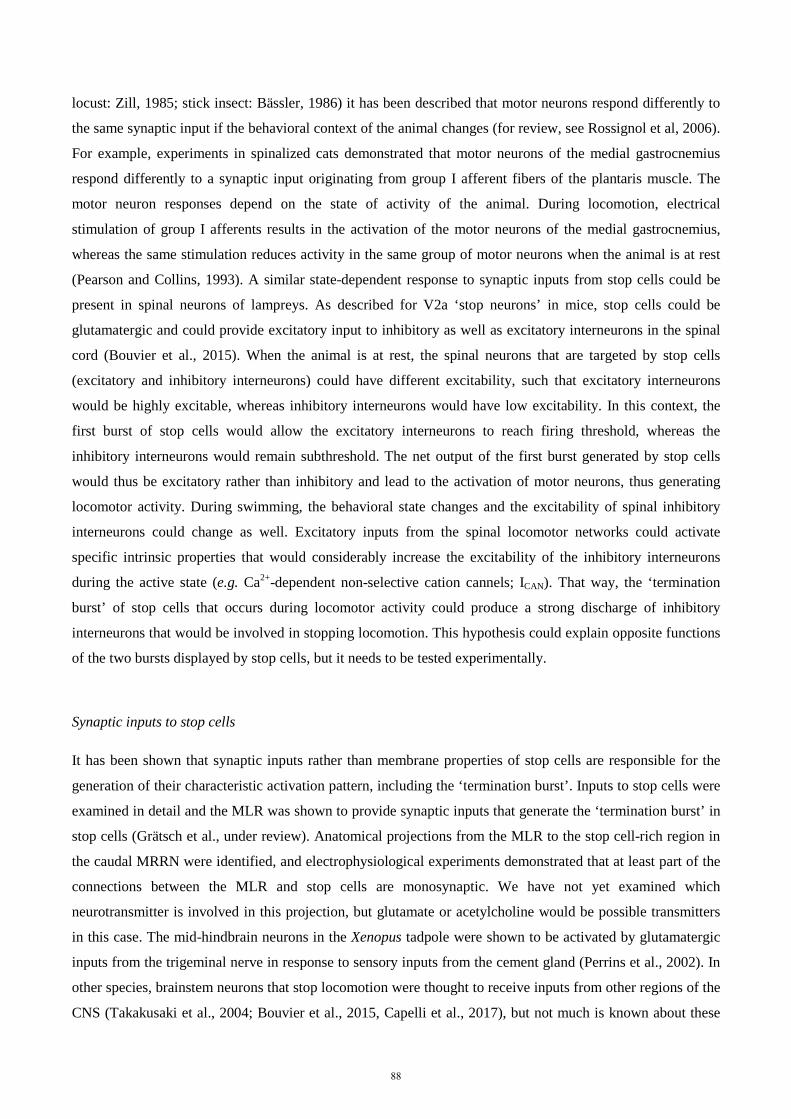
locust: Zill, 1985; stick insect: Bässler, 1986) it has been described that motor neurons respond differently to
the same synaptic input if the behavioral context of the animal changes (for review, see Rossignol et al, 2006).
For example, experiments in spinalized cats demonstrated that motor neurons of the medial gastrocnemius
respond differently to a synaptic input originating from group I afferent fibers of the plantaris muscle. The
motor neuron responses depend on the state of activity of the animal. During locomotion, electrical
stimulation of group I afferents results in the activation of the motor neurons of the medial gastrocnemius,
whereas the same stimulation reduces activity in the same group of motor neurons when the animal is at rest
(Pearson and Collins, 1993). A similar state-dependent response to synaptic inputs from stop cells could be
present in spinal neurons of lampreys. As described for V2a ‘stop neurons’ in mice, stop cells could be
glutamatergic and could provide excitatory input to inhibitory as well as excitatory interneurons in the spinal
cord (Bouvier et al., 2015). When the animal is at rest, the spinal neurons that are targeted by stop cells
(excitatory and inhibitory interneurons) could have different excitability, such that excitatory interneurons
would be highly excitable, whereas inhibitory interneurons would have low excitability. In this context, the
first burst of stop cells would allow the excitatory interneurons to reach firing threshold, whereas the
inhibitory interneurons would remain subthreshold. The net output of the first burst generated by stop cells
would thus be excitatory rather than inhibitory and lead to the activation of motor neurons, thus generating
locomotor activity. During swimming, the behavioral state changes and the excitability of spinal inhibitory
interneurons could change as well. Excitatory inputs from the spinal locomotor networks could activate
specific intrinsic properties that would considerably increase the excitability of the inhibitory interneurons
during the active state (e.g. Ca2+-dependent non-selective cation cannels; ICAN). That way, the ‘termination
burst’ of stop cells that occurs during locomotor activity could produce a strong discharge of inhibitory
interneurons that would be involved in stopping locomotion. This hypothesis could explain opposite functions
of the two bursts displayed by stop cells, but it needs to be tested experimentally.
Synaptic inputs to stop cells
It has been shown that synaptic inputs rather than membrane properties of stop cells are responsible for the
generation of their characteristic activation pattern, including the ‘termination burst’. Inputs to stop cells were
examined in detail and the MLR was shown to provide synaptic inputs that generate the ‘termination burst’ in
stop cells (Grätsch et al., under review). Anatomical projections from the MLR to the stop cell-rich region in
the caudal MRRN were identified, and electrophysiological experiments demonstrated that at least part of the
connections between the MLR and stop cells are monosynaptic. We have not yet examined which
neurotransmitter is involved in this projection, but glutamate or acetylcholine would be possible transmitters
in this case. The mid-hindbrain neurons in the Xenopus tadpole were shown to be activated by glutamatergic
inputs from the trigeminal nerve in response to sensory inputs from the cement gland (Perrins et al., 2002). In
other species, brainstem neurons that stop locomotion were thought to receive inputs from other regions of the
CNS (Takakusaki et al., 2004; Bouvier et al., 2015, Capelli et al., 2017), but not much is known about these
88
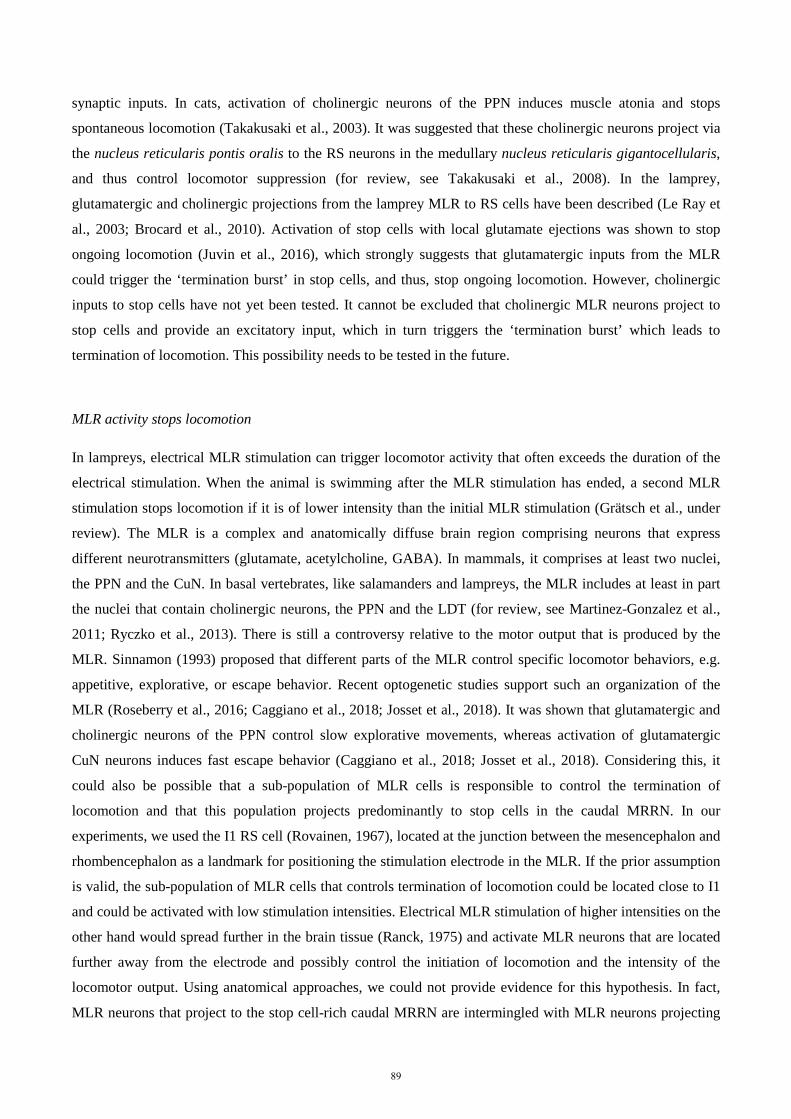
synaptic inputs. In cats, activation of cholinergic neurons of the PPN induces muscle atonia and stops
spontaneous locomotion (Takakusaki et al., 2003). It was suggested that these cholinergic neurons project via
the nucleus reticularis pontis oralis to the RS neurons in the medullary nucleus reticularis gigantocellularis,
and thus control locomotor suppression (for review, see Takakusaki et al., 2008). In the lamprey,
glutamatergic and cholinergic projections from the lamprey MLR to RS cells have been described (Le Ray et
al., 2003; Brocard et al., 2010). Activation of stop cells with local glutamate ejections was shown to stop
ongoing locomotion (Juvin et al., 2016), which strongly suggests that glutamatergic inputs from the MLR
could trigger the ‘termination burst’ in stop cells, and thus, stop ongoing locomotion. However, cholinergic
inputs to stop cells have not yet been tested. It cannot be excluded that cholinergic MLR neurons project to
stop cells and provide an excitatory input, which in turn triggers the ‘termination burst’ which leads to
termination of locomotion. This possibility needs to be tested in the future.
MLR activity stops locomotion
In lampreys, electrical MLR stimulation can trigger locomotor activity that often exceeds the duration of the
electrical stimulation. When the animal is swimming after the MLR stimulation has ended, a second MLR
stimulation stops locomotion if it is of lower intensity than the initial MLR stimulation (Grätsch et al., under
review). The MLR is a complex and anatomically diffuse brain region comprising neurons that express
different neurotransmitters (glutamate, acetylcholine, GABA). In mammals, it comprises at least two nuclei,
the PPN and the CuN. In basal vertebrates, like salamanders and lampreys, the MLR includes at least in part
the nuclei that contain cholinergic neurons, the PPN and the LDT (for review, see Martinez-Gonzalez et al.,
2011; Ryczko et al., 2013). There is still a controversy relative to the motor output that is produced by the
MLR. Sinnamon (1993) proposed that different parts of the MLR control specific locomotor behaviors, e.g.
appetitive, explorative, or escape behavior. Recent optogenetic studies support such an organization of the
MLR (Roseberry et al., 2016; Caggiano et al., 2018; Josset et al., 2018). It was shown that glutamatergic and
cholinergic neurons of the PPN control slow explorative movements, whereas activation of glutamatergic
CuN neurons induces fast escape behavior (Caggiano et al., 2018; Josset et al., 2018). Considering this, it
could also be possible that a sub-population of MLR cells is responsible to control the termination of
locomotion and that this population projects predominantly to stop cells in the caudal MRRN. In our
experiments, we used the I1 RS cell (Rovainen, 1967), located at the junction between the mesencephalon and
rhombencephalon as a landmark for positioning the stimulation electrode in the MLR. If the prior assumption
is valid, the sub-population of MLR cells that controls termination of locomotion could be located close to I1
and could be activated with low stimulation intensities. Electrical MLR stimulation of higher intensities on the
other hand would spread further in the brain tissue (Ranck, 1975) and activate MLR neurons that are located
further away from the electrode and possibly control the initiation of locomotion and the intensity of the
locomotor output. Using anatomical approaches, we could not provide evidence for this hypothesis. In fact,
MLR neurons that project to the stop cell-rich caudal MRRN are intermingled with MLR neurons projecting
89
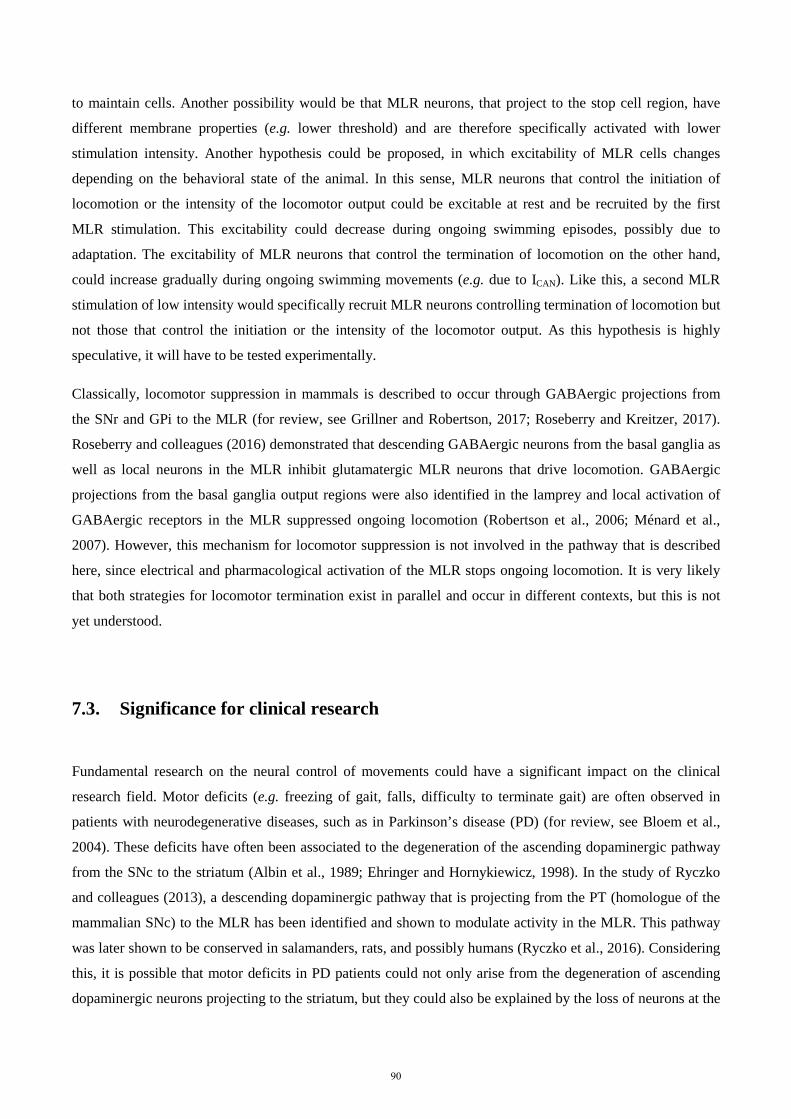
to maintain cells. Another possibility would be that MLR neurons, that project to the stop cell region, have
different membrane properties (e.g. lower threshold) and are therefore specifically activated with lower
stimulation intensity. Another hypothesis could be proposed, in which excitability of MLR cells changes
depending on the behavioral state of the animal. In this sense, MLR neurons that control the initiation of
locomotion or the intensity of the locomotor output could be excitable at rest and be recruited by the first
MLR stimulation. This excitability could decrease during ongoing swimming episodes, possibly due to
adaptation. The excitability of MLR neurons that control the termination of locomotion on the other hand,
could increase gradually during ongoing swimming movements (e.g. due to ICAN). Like this, a second MLR
stimulation of low intensity would specifically recruit MLR neurons controlling termination of locomotion but
not those that control the initiation or the intensity of the locomotor output. As this hypothesis is highly
speculative, it will have to be tested experimentally.
Classically, locomotor suppression in mammals is described to occur through GABAergic projections from
the SNr and GPi to the MLR (for review, see Grillner and Robertson, 2017; Roseberry and Kreitzer, 2017).
Roseberry and colleagues (2016) demonstrated that descending GABAergic neurons from the basal ganglia as
well as local neurons in the MLR inhibit glutamatergic MLR neurons that drive locomotion. GABAergic
projections from the basal ganglia output regions were also identified in the lamprey and local activation of
GABAergic receptors in the MLR suppressed ongoing locomotion (Robertson et al., 2006; Ménard et al.,
2007). However, this mechanism for locomotor suppression is not involved in the pathway that is described
here, since electrical and pharmacological activation of the MLR stops ongoing locomotion. It is very likely
that both strategies for locomotor termination exist in parallel and occur in different contexts, but this is not
yet understood.
7.3. Significance for clinical research
Fundamental research on the neural control of movements could have a significant impact on the clinical
research field. Motor deficits (e.g. freezing of gait, falls, difficulty to terminate gait) are often observed in
patients with neurodegenerative diseases, such as in Parkinson’s disease (PD) (for review, see Bloem et al.,
2004). These deficits have often been associated to the degeneration of the ascending dopaminergic pathway
from the SNc to the striatum (Albin et al., 1989; Ehringer and Hornykiewicz, 1998). In the study of Ryczko
and colleagues (2013), a descending dopaminergic pathway that is projecting from the PT (homologue of the
mammalian SNc) to the MLR has been identified and shown to modulate activity in the MLR. This pathway
was later shown to be conserved in salamanders, rats, and possibly humans (Ryczko et al., 2016). Considering
this, it is possible that motor deficits in PD patients could not only arise from the degeneration of ascending
dopaminergic neurons projecting to the striatum, but they could also be explained by the loss of neurons at the
90
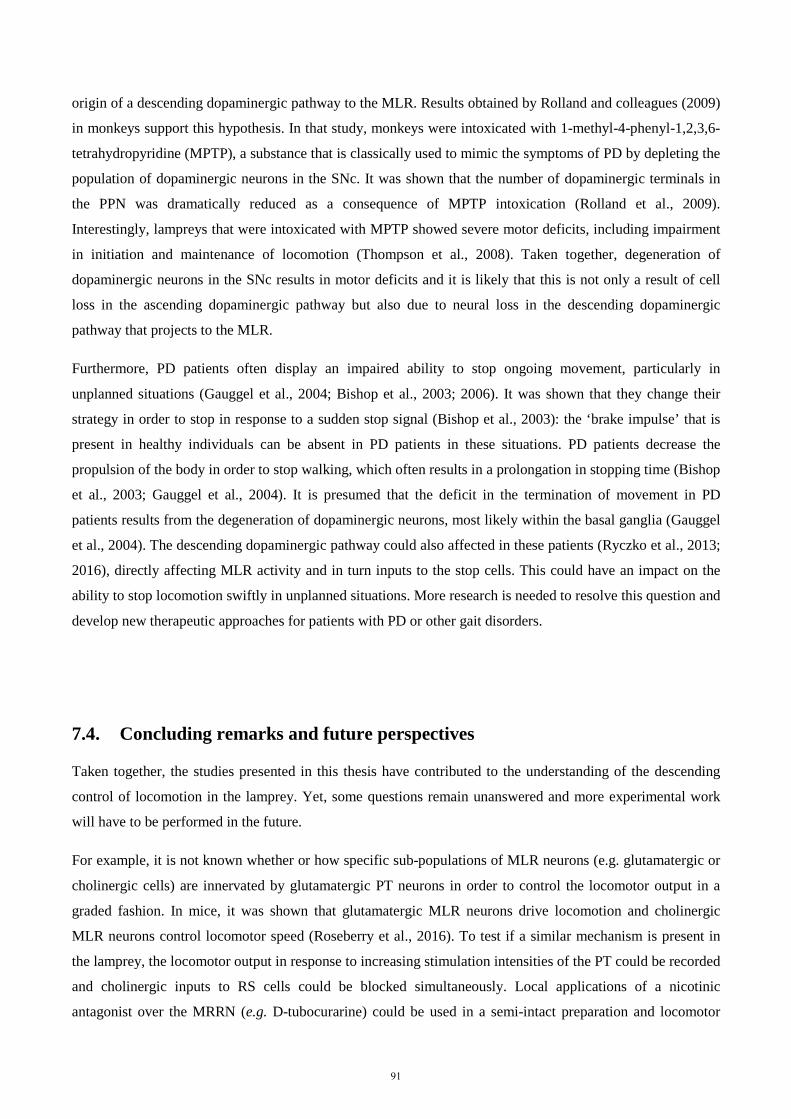
origin of a descending dopaminergic pathway to the MLR. Results obtained by Rolland and colleagues (2009)
in monkeys support this hypothesis. In that study, monkeys were intoxicated with 1-methyl-4-phenyl-1,2,3,6-
tetrahydropyridine (MPTP), a substance that is classically used to mimic the symptoms of PD by depleting the
population of dopaminergic neurons in the SNc. It was shown that the number of dopaminergic terminals in
the PPN was dramatically reduced as a consequence of MPTP intoxication (Rolland et al., 2009).
Interestingly, lampreys that were intoxicated with MPTP showed severe motor deficits, including impairment
in initiation and maintenance of locomotion (Thompson et al., 2008). Taken together, degeneration of
dopaminergic neurons in the SNc results in motor deficits and it is likely that this is not only a result of cell
loss in the ascending dopaminergic pathway but also due to neural loss in the descending dopaminergic
pathway that projects to the MLR.
Furthermore, PD patients often display an impaired ability to stop ongoing movement, particularly in
unplanned situations (Gauggel et al., 2004; Bishop et al., 2003; 2006). It was shown that they change their
strategy in order to stop in response to a sudden stop signal (Bishop et al., 2003): the ‘brake impulse’ that is
present in healthy individuals can be absent in PD patients in these situations. PD patients decrease the
propulsion of the body in order to stop walking, which often results in a prolongation in stopping time (Bishop
et al., 2003; Gauggel et al., 2004). It is presumed that the deficit in the termination of movement in PD
patients results from the degeneration of dopaminergic neurons, most likely within the basal ganglia (Gauggel
et al., 2004). The descending dopaminergic pathway could also affected in these patients (Ryczko et al., 2013;
2016), directly affecting MLR activity and in turn inputs to the stop cells. This could have an impact on the
ability to stop locomotion swiftly in unplanned situations. More research is needed to resolve this question and
develop new therapeutic approaches for patients with PD or other gait disorders.
7.4. Concluding remarks and future perspectives
Taken together, the studies presented in this thesis have contributed to the understanding of the descending
control of locomotion in the lamprey. Yet, some questions remain unanswered and more experimental work
will have to be performed in the future.
For example, it is not known whether or how specific sub-populations of MLR neurons (e.g. glutamatergic or
cholinergic cells) are innervated by glutamatergic PT neurons in order to control the locomotor output in a
graded fashion. In mice, it was shown that glutamatergic MLR neurons drive locomotion and cholinergic
MLR neurons control locomotor speed (Roseberry et al., 2016). To test if a similar mechanism is present in
the lamprey, the locomotor output in response to increasing stimulation intensities of the PT could be recorded
and cholinergic inputs to RS cells could be blocked simultaneously. Local applications of a nicotinic
antagonist over the MRRN (e.g. D-tubocurarine) could be used in a semi-intact preparation and locomotor
91
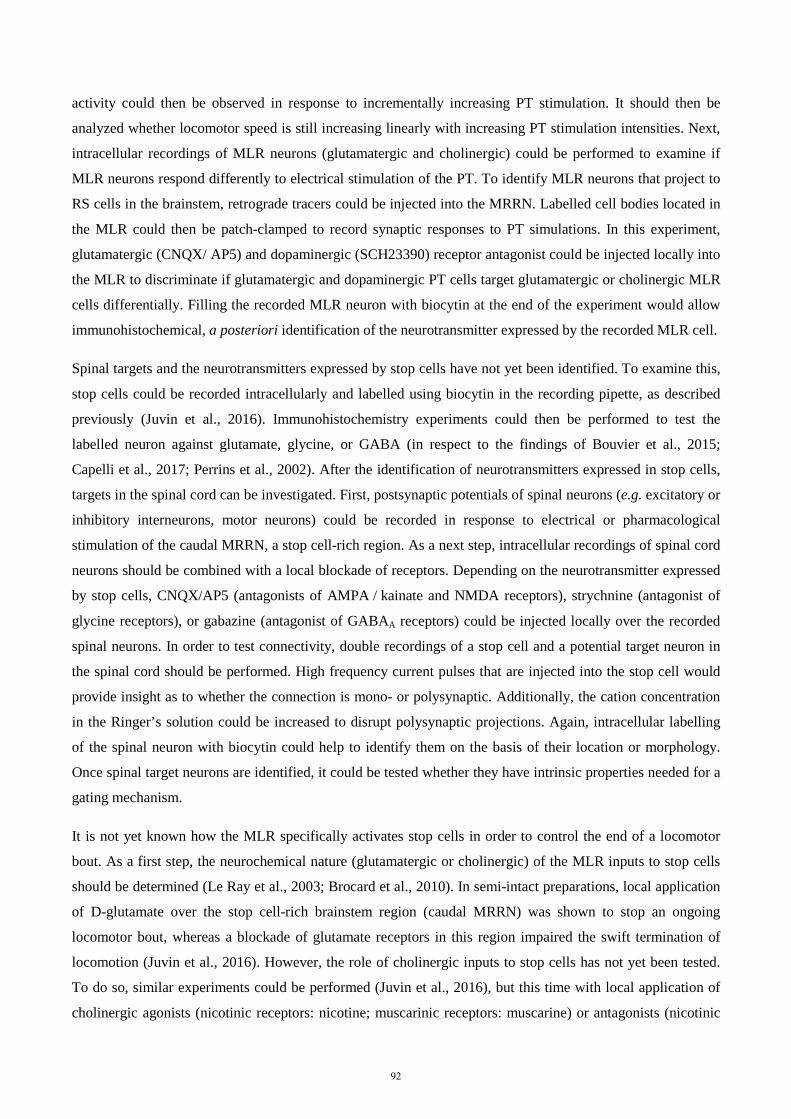
activity could then be observed in response to incrementally increasing PT stimulation. It should then be
analyzed whether locomotor speed is still increasing linearly with increasing PT stimulation intensities. Next,
intracellular recordings of MLR neurons (glutamatergic and cholinergic) could be performed to examine if
MLR neurons respond differently to electrical stimulation of the PT. To identify MLR neurons that project to
RS cells in the brainstem, retrograde tracers could be injected into the MRRN. Labelled cell bodies located in
the MLR could then be patch-clamped to record synaptic responses to PT simulations. In this experiment,
glutamatergic (CNQX/ AP5) and dopaminergic (SCH23390) receptor antagonist could be injected locally into
the MLR to discriminate if glutamatergic and dopaminergic PT cells target glutamatergic or cholinergic MLR
cells differentially. Filling the recorded MLR neuron with biocytin at the end of the experiment would allow
immunohistochemical, a posteriori identification of the neurotransmitter expressed by the recorded MLR cell.
Spinal targets and the neurotransmitters expressed by stop cells have not yet been identified. To examine this,
stop cells could be recorded intracellularly and labelled using biocytin in the recording pipette, as described
previously (Juvin et al., 2016). Immunohistochemistry experiments could then be performed to test the
labelled neuron against glutamate, glycine, or GABA (in respect to the findings of Bouvier et al., 2015;
Capelli et al., 2017; Perrins et al., 2002). After the identification of neurotransmitters expressed in stop cells,
targets in the spinal cord can be investigated. First, postsynaptic potentials of spinal neurons (e.g. excitatory or
inhibitory interneurons, motor neurons) could be recorded in response to electrical or pharmacological
stimulation of the caudal MRRN, a stop cell-rich region. As a next step, intracellular recordings of spinal cord
neurons should be combined with a local blockade of receptors. Depending on the neurotransmitter expressed
by stop cells, CNQX/AP5 (antagonists of AMPA / kainate and NMDA receptors), strychnine (antagonist of
glycine receptors), or gabazine (antagonist of GABAA receptors) could be injected locally over the recorded
spinal neurons. In order to test connectivity, double recordings of a stop cell and a potential target neuron in
the spinal cord should be performed. High frequency current pulses that are injected into the stop cell would
provide insight as to whether the connection is mono- or polysynaptic. Additionally, the cation concentration
in the Ringer’s solution could be increased to disrupt polysynaptic projections. Again, intracellular labelling
of the spinal neuron with biocytin could help to identify them on the basis of their location or morphology.
Once spinal target neurons are identified, it could be tested whether they have intrinsic properties needed for a
gating mechanism.
It is not yet known how the MLR specifically activates stop cells in order to control the end of a locomotor
bout. As a first step, the neurochemical nature (glutamatergic or cholinergic) of the MLR inputs to stop cells
should be determined (Le Ray et al., 2003; Brocard et al., 2010). In semi-intact preparations, local application
of D-glutamate over the stop cell-rich brainstem region (caudal MRRN) was shown to stop an ongoing
locomotor bout, whereas a blockade of glutamate receptors in this region impaired the swift termination of
locomotion (Juvin et al., 2016). However, the role of cholinergic inputs to stop cells has not yet been tested.
To do so, similar experiments could be performed (Juvin et al., 2016), but this time with local application of
cholinergic agonists (nicotinic receptors: nicotine; muscarinic receptors: muscarine) or antagonists (nicotinic
92
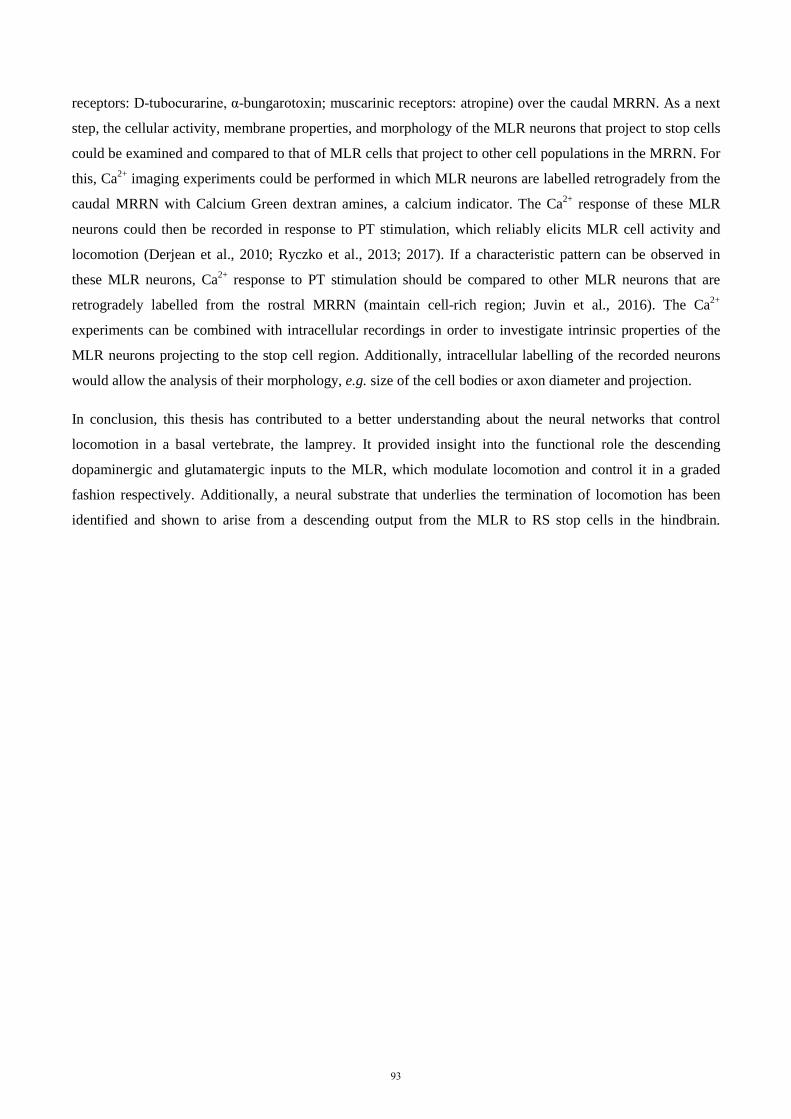
receptors: D-tubocurarine, α-bungarotoxin; muscarinic receptors: atropine) over the caudal MRRN. As a next
step, the cellular activity, membrane properties, and morphology of the MLR neurons that project to stop cells
could be examined and compared to that of MLR cells that project to other cell populations in the MRRN. For
this, Ca2+ imaging experiments could be performed in which MLR neurons are labelled retrogradely from the
caudal MRRN with Calcium Green dextran amines, a calcium indicator. The Ca2+ response of these MLR
neurons could then be recorded in response to PT stimulation, which reliably elicits MLR cell activity and
locomotion (Derjean et al., 2010; Ryczko et al., 2013; 2017). If a characteristic pattern can be observed in
these MLR neurons, Ca2+ response to PT stimulation should be compared to other MLR neurons that are
retrogradely labelled from the rostral MRRN (maintain cell-rich region; Juvin et al., 2016). The Ca2+
experiments can be combined with intracellular recordings in order to investigate intrinsic properties of the
MLR neurons projecting to the stop cell region. Additionally, intracellular labelling of the recorded neurons
would allow the analysis of their morphology, e.g. size of the cell bodies or axon diameter and projection.
In conclusion, this thesis has contributed to a better understanding about the neural networks that control
locomotion in a basal vertebrate, the lamprey. It provided insight into the functional role the descending
dopaminergic and glutamatergic inputs to the MLR, which modulate locomotion and control it in a graded
fashion respectively. Additionally, a neural substrate that underlies the termination of locomotion has been
identified and shown to arise from a descending output from the MLR to RS stop cells in the hindbrain.
93
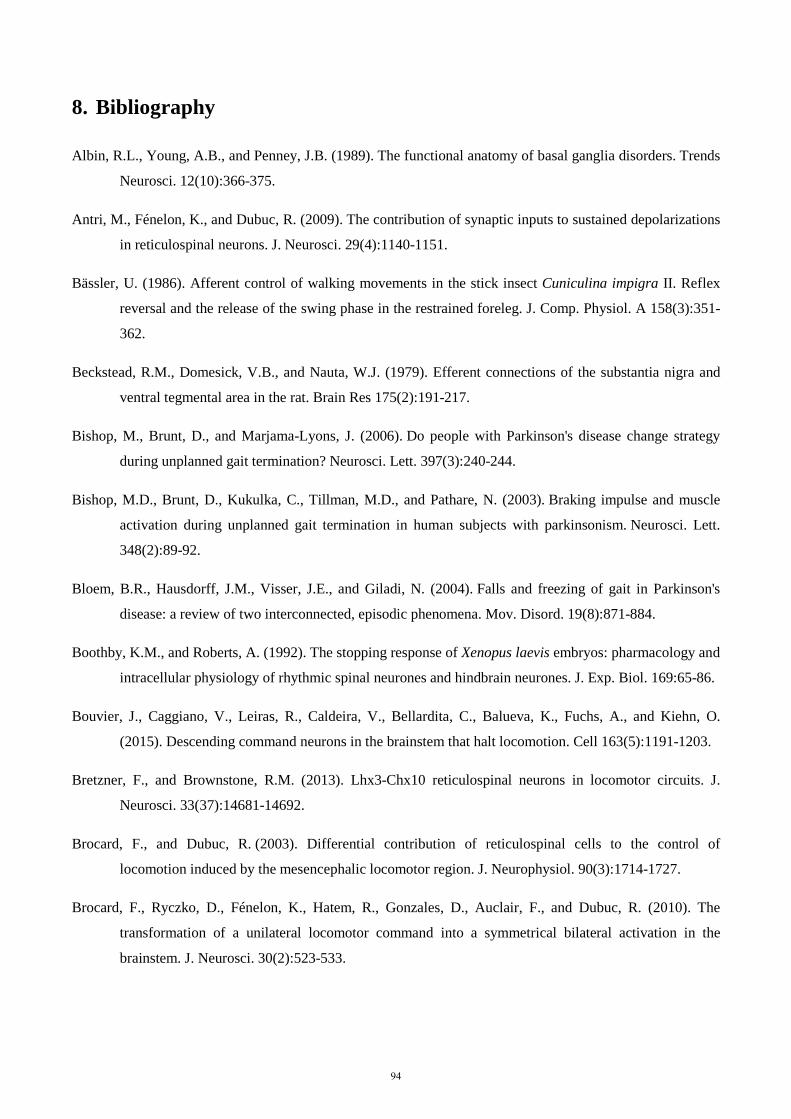
8. Bibliography
Albin, R.L., Young, A.B., and Penney, J.B. (1989). The functional anatomy of basal ganglia disorders. Trends
Neurosci. 12(10):366-375.
Antri, M., Fénelon, K., and Dubuc, R. (2009). The contribution of synaptic inputs to sustained depolarizations
in reticulospinal neurons. J. Neurosci. 29(4):1140-1151.
Bässler, U. (1986). Afferent control of walking movements in the stick insect Cuniculina impigra II. Reflex
reversal and the release of the swing phase in the restrained foreleg. J. Comp. Physiol. A 158(3):351-
362.
Beckstead, R.M., Domesick, V.B., and Nauta, W.J. (1979). Efferent connections of the substantia nigra and
ventral tegmental area in the rat. Brain Res 175(2):191-217.
Bishop, M., Brunt, D., and Marjama-Lyons, J. (2006). Do people with Parkinson's disease change strategy
during unplanned gait termination? Neurosci. Lett. 397(3):240-244.
Bishop, M.D., Brunt, D., Kukulka, C., Tillman, M.D., and Pathare, N. (2003). Braking impulse and muscle
activation during unplanned gait termination in human subjects with parkinsonism. Neurosci. Lett.
348(2):89-92.
Bloem, B.R., Hausdorff, J.M., Visser, J.E., and Giladi, N. (2004). Falls and freezing of gait in Parkinson's
disease: a review of two interconnected, episodic phenomena. Mov. Disord. 19(8):871-884.
Boothby, K.M., and Roberts, A. (1992). The stopping response of Xenopus laevis embryos: pharmacology and
intracellular physiology of rhythmic spinal neurones and hindbrain neurones. J. Exp. Biol. 169:65-86.
Bouvier, J., Caggiano, V., Leiras, R., Caldeira, V., Bellardita, C., Balueva, K., Fuchs, A., and Kiehn, O.
(2015). Descending command neurons in the brainstem that halt locomotion. Cell 163(5):1191-1203.
Bretzner, F., and Brownstone, R.M. (2013). Lhx3-Chx10 reticulospinal neurons in locomotor circuits. J.
Neurosci. 33(37):14681-14692.
Brocard, F., and Dubuc, R. (2003). Differential contribution of reticulospinal cells to the control of
locomotion induced by the mesencephalic locomotor region. J. Neurophysiol. 90(3):1714-1727.
Brocard, F., Ryczko, D., Fénelon, K., Hatem, R., Gonzales, D., Auclair, F., and Dubuc, R. (2010). The
transformation of a unilateral locomotor command into a symmetrical bilateral activation in the
brainstem. J. Neurosci. 30(2):523-533.
94
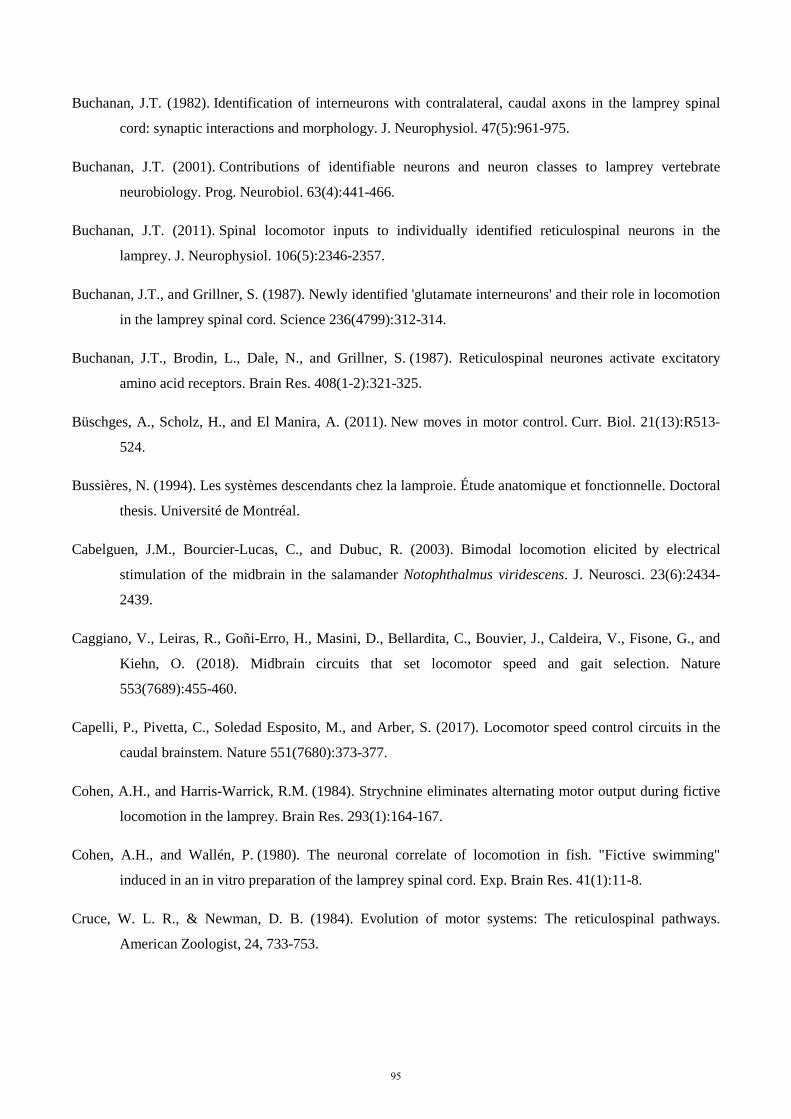
Buchanan, J.T. (1982). Identification of interneurons with contralateral, caudal axons in the lamprey spinal
cord: synaptic interactions and morphology. J. Neurophysiol. 47(5):961-975.
Buchanan, J.T. (2001). Contributions of identifiable neurons and neuron classes to lamprey vertebrate
neurobiology. Prog. Neurobiol. 63(4):441-466.
Buchanan, J.T. (2011). Spinal locomotor inputs to individually identified reticulospinal neurons in the
lamprey. J. Neurophysiol. 106(5):2346-2357.
Buchanan, J.T., and Grillner, S. (1987). Newly identified 'glutamate interneurons' and their role in locomotion
in the lamprey spinal cord. Science 236(4799):312-314.
Buchanan, J.T., Brodin, L., Dale, N., and Grillner, S. (1987). Reticulospinal neurones activate excitatory
amino acid receptors. Brain Res. 408(1-2):321-325.
Büschges, A., Scholz, H., and El Manira, A. (2011). New moves in motor control. Curr. Biol. 21(13):R513-
524.
Bussières, N. (1994). Les systèmes descendants chez la lamproie. Étude anatomique et fonctionnelle. Doctoral
thesis. Université de Montréal.
Cabelguen, J.M., Bourcier-Lucas, C., and Dubuc, R. (2003). Bimodal locomotion elicited by electrical
stimulation of the midbrain in the salamander Notophthalmus viridescens. J. Neurosci. 23(6):2434-
2439.
Caggiano, V., Leiras, R., Goñi-Erro, H., Masini, D., Bellardita, C., Bouvier, J., Caldeira, V., Fisone, G., and
Kiehn, O. (2018). Midbrain circuits that set locomotor speed and gait selection. Nature
553(7689):455-460.
Capelli, P., Pivetta, C., Soledad Esposito, M., and Arber, S. (2017). Locomotor speed control circuits in the
caudal brainstem. Nature 551(7680):373-377.
Cohen, A.H., and Harris-Warrick, R.M. (1984). Strychnine eliminates alternating motor output during fictive
locomotion in the lamprey. Brain Res. 293(1):164-167.
Cohen, A.H., and Wallén, P. (1980). The neuronal correlate of locomotion in fish. "Fictive swimming"
induced in an in vitro preparation of the lamprey spinal cord. Exp. Brain Res. 41(1):11-8.
Cruce, W. L. R., & Newman, D. B. (1984). Evolution of motor systems: The reticulospinal pathways.
American Zoologist, 24, 733-753.
95
Daghfous, G., Green, W.W., Alford, S.T., Zielinski, B.S., and Dubuc, R. (2016). Sensory activation of
command cells for locomotion and modulatory mechanisms: lessons from lampreys. Front. Neural.
Circuits. 10:18 doi: 10.3389/fncir.2016.00018.
Dale, N. (1986). Excitatory synaptic drive for swimming mediated by amino acid receptors in the lamprey. J.
Neurosci. 6(9):2662-2675.
Deliagina, T.G., and Orlovsky, G.N. (2002). Comparative neurobiology of postural control. Curr. Opin.
Neurobiol. 12(6):652-657.
Deliagina, T.G., Orlovsky, G.N., Grillner, S., and Wallén, P. (1992). Vestibular control of swimming in
lamprey. III. Activity of vestibular afferents: convergence of vestibular inputs on reticulospinal
neurons. Exp Brain Res. 90(3):499-507.
Deliagina, T.G., Orlovsky, G.N., Grillner, S., and Wallén, P. (1992). Vestibular control of swimming in
lamprey. III. Activity of vestibular afferents: convergence of vestibular inputs on reticulospinal
neurons. Exp. Brain Res. 90(3):499-507.
Deliagina, T.G., Orlovsky, G.N., Grillner, S., and Wallén, P. (1992). Vestibular control of swimming in
lamprey. II. Characteristics of spatial sensitivity of reticulospinal neurons. Exp. Brain Res. 90(3):489-
498.
Derjean, D., Moussaddy, A., Atallah, E., St-Pierre, M., Auclair, F., Chang, S., Ren, X., Zielinski, B., and
Dubuc, R. (2010). A novel neural substrate for the transformation of olfactory inputs into motor
output. PLoS Biol. 8(12):e1000567.
Dubuc, R., Bongianni, F., Ohta, Y., and Grillner, S. (1993). Anatomical and physiological study of brainstem
nuclei relaying dorsal column inputs in lampreys. J. Comp. Neurol. 327(2):260-270.
Dubuc, R., Bongianni, F., Ohta, Y., and Grillner, S. (1993). Dorsal root and dorsal column mediated synaptic
inputs to reticulospinal neurons in lampreys: involvement of glutamatergic, glycinergic, and
GABAergic transmission. J. Comp. Neurol. 327(2):251-259.
Dubuc, R., Brocard, F., Antri, M., Fénelon, K., Gariépy, J.F., Smetana, R., Ménard, A., Le Ray, D., Viana Di
Prisco, G., Pearlstein, E., Sirota, M.G., Derjean, D., St-Pierre, M., Zielinski, B., Auclair, F., and
Veilleux, D. (2008). Initiation of locomotion in lampreys. Brain Res. Rev. 57(1):172-182.
Ehringer, H., and Hornykiewicz, O. (1998). Distribution of noradrenaline and dopamine (3-hydroxytyramine)
in the human brain and their behavior in diseases of the extrapyramidal system. Parkinsonism Relat.
Disord. 4(2):53-57.
96
Einum, J.F., and Buchanan, J.T. (2005). Membrane potential oscillations in reticulospinal and spinobulbar
neurons during locomotor activity. J. Neurophysiol. 94(1):273-281.
El Manira, A., Pombal, M.A., and Grillner, S. (1997). Diencephalic projection to reticulospinal neurons
involved in the initiation of locomotion in adult lampreys Lampetra fluviatilis. J. Comp. Neurol.
389(4):603-616.
Ericsson, J., Stephenson-Jones, M., Kardamakis, A., Robertson, B., Silberberg, G., and Grillner, S.
(2013). Evolutionarily conserved differences in pallial and thalamic short-term synaptic plasticity in
striatum. J. Physiol. 591(4):859-874.
Fagerstedt, P., Orlovsky, G.N., Deliagina, T.G., Grillner, S., and Ullén, F. (2001). Lateral turns in the
Lamprey. II. Activity of reticulospinal neurons during the generation of fictive turns. J. Neurophysiol.
86(5):2257-2265.
Fetcho, J.R., and Svoboda, K.R. (1993). Fictive swimming elicited by electrical stimulation of the midbrain in
goldfish. J. Neurophysiol. 70(2):765-80.
Garcia-Rill, E., and Skinner, R.D. (1987). The mesencephalic locomotor region. II. Projections to
reticulospinal neurons. Brain Res. 411(1):13-20.
Garcia-Rill, E., and Skinner, R.D. (1987). The mesencephalic locomotor region. I. Activation of a medullary
projection site. Brain Res. 411(1):1-12.
Garcia-Rill, E., Skinner, R.D., and Fitzgerald, J.A. (1985). Chemical activation of the mesencephalic
locomotor region. Brain Res. 330(1):43-54.
Gariépy, J.F., Missaghi, K., Chevallier, S., Chartré, S., Robert, M., Auclair, F., Lund, J.P., and Dubuc,
R. (2012). Specific neural substrate linking respiration to locomotion. Proc. Natl. Acad. Sci. U. S. A.
109(2):E84-92.
Gauggel, S., Rieger, M., and Feghoff, T.A. (2004). Inhibition of ongoing responses in patients with
Parkinson's disease. J. Neurol. Neurosurg. Psychiatry 75(4):539-544.
Grillner, S. (2003). The motor infrastructure: from ion channels to neuronal networks. Nat. Rev. Neurosci.
4(7):573-586.
Grillner, S., and Robertson, B. (2017). Selection of action - A vertebrate perspective. In Neurobiology of
Motor Control - Fundamental Concepts and New Directions, S.L. Hooper and A. Büschges, eds.
(New Jersey, United States of America: Wiley-Blackwell), pp. 181-191.
97
Grillner, S., and Robertson, B. (2016). The basal ganglia over 500 million years. Curr. Biol. 26(20):R1088-
R1100.
Grillner, S., and Zangger, P. (1975). How detailed is the central pattern generation for locomotion? Brain
Res. 88(2):367-371.
Grillner, S., and Zangger, P. (1979). On the central generation of locomotion in the low spinal cat. Exp. Brain
Res. 34(2):241-261
Islam, S.S., Zelenin, P.V., Orlovsky, G.N., Grillner, S., and Deliagina, T.G. (2006). Pattern of motor
coordination underlying backward swimming in the lamprey. J. Neurophysiol. 96(1):451-460.
Jordan, L.M. (1998). Initiation of locomotion in mammals. Ann. N Y Acad. Sci. 860:83-93.
Josset, N., Roussel, M., Lemieux, M., Lafrance-Zoubga, D., Rastqar, A., and Bretzner, F. (2018). Distinct
contributions of mesencephalic locomotor region nuclei to locomotor control in the freely behaving
mouse. Curr. Biol. 28(6):884-901.
Juvin, L., Grätsch, S., Trillaud-Doppia, E., Gariépy, J.F., Büschges, A., and Dubuc, R. 2016. A specific
population of reticulospinal neurons controls the termination of locomotion. Cell Rep. 15(11):2377-
2386.
Kagaya, K., and Takahata, M. (2011). Sequential synaptic excitation and inhibition shape readiness discharge
for voluntary behavior. Science 332(6027):365-368.
Kagaya, K., and Takahata, M. (2010). Readiness discharge for spontaneous initiation of walking in crayfish. J.
Neurosci. 30(4):1348-1362.
Kahn, J.A., and Roberts, A. (1982). Experiments on the central pattern generator for swimming in amphibian
embryos. Philos. Trans. R. Soc. Lond. B Biol. Sci. 296(1081):229-243.
Kai, K., and Okada, J. (2013). Characterization of locomotor-related spike activity in protocerebrum of freely
walking cricket. Zoolog. Sci. 30(7):591-601.
Kimura, Y., Satou, C., Fujioka, S., Shoji, W., Umeda, K., Ishizuka, T., Yawo, H., and Higashijima, S. (2013).
Hindbrain V2a neurons in the excitation of spinal locomotor circuits during zebrafish swimming.
Curr. Biol. 23(10):843-849.
Klemm, W.R. (2001). Behavioral arrest: in search of the neural control system. Prog. Neurobiol. 65(5):453-
471.
98
Kozlov, A.K., Ullén, F., Fagerstedt, P., Aurell, E., Lansner, A., and Grillner, S. (2002). Mechanisms for lateral
turns in lamprey in response to descending unilateral commands: a modeling study. Biol. Cybern.
86(1):1-14.
Kravitz, A.V., Freeze, B.S., Parker, P.R., Kay, K., Thwin, M.T., Deisseroth, K., and Kreitzer, A.C. (2010).
Regulation of parkinsonian motor behaviours by optogenetic control of basal ganglia circuitry. Nature
466(7306):622-626.
Kreitzer, A.C., and Malenka, R.C. (2008). Striatal plasticity and basal ganglia circuit function. Neuron
60(4):543-554.
Kudo, N., and Yamada, T. (1987). N-methyl-D,L-aspartate-induced locomotor activity in a spinal cord-
hindlimb muscles preparation of the newborn rat studied in vitro. Neurosci. Lett. 75(1):43-48.
Kumar, S., and Hedges, S.B. (1998). A molecular timescale for vertebrate evolution. Nature 392(6679):917-
920.
Le Ray, D., Brocard, F., Bourcier-Lucas, C., Auclair, F., Lafaille, P., and Dubuc, R. (2003). Nicotinic
activation of reticulospinal cells involved in the control of swimming in lampreys. Eur. J. Neurosci.
17(1):137-148.
Le Ray, D., Juvin, L., Boutin, T., Auclair, F., and Dubuc, R. (2010). A neuronal substrate for a state-
dependent modulation of sensory inputs in the brainstem. Eur. J. Neurosci. 32(1):53-59.
Le Ray, D., Juvin, L., Ryczko, D., and Dubuc, R. (2011). Chapter 4--supraspinal control of locomotion: the
mesencephalic locomotor region. Prog. Brain. Res. 188:51-70.
Lee, A.M., Hoy, J.L., Bonci, A., Wilbrecht, L., Stryker, M.P., and Niell, C.M. (2014). Identification of a
brainstem circuit regulating visual cortical state in parallel with locomotion. Neuron 83:455-466.
Martinez-Gonzalez, C., Bolam, J.P., and Mena-Segovia, J. (2011). Topographical organization of the
pedunculopontine nucleus. Front. Neuroanat. 5:22.
Matsushima, T., and Grillner, S. (1992). Neural mechanisms of intersegmental coordination in lamprey: local
excitability changes modify the phase coupling along the spinal cord. J. Neurophysiol. 67(2):373-
388.
McClellan, A.D., and Grillner, S. (1984). Activation of 'fictive swimming' by electrical microstimulation of
brainstem locomotor regions in an in vitro preparation of the lamprey central nervous system. Brain
Res. 300(2):357-361.
99
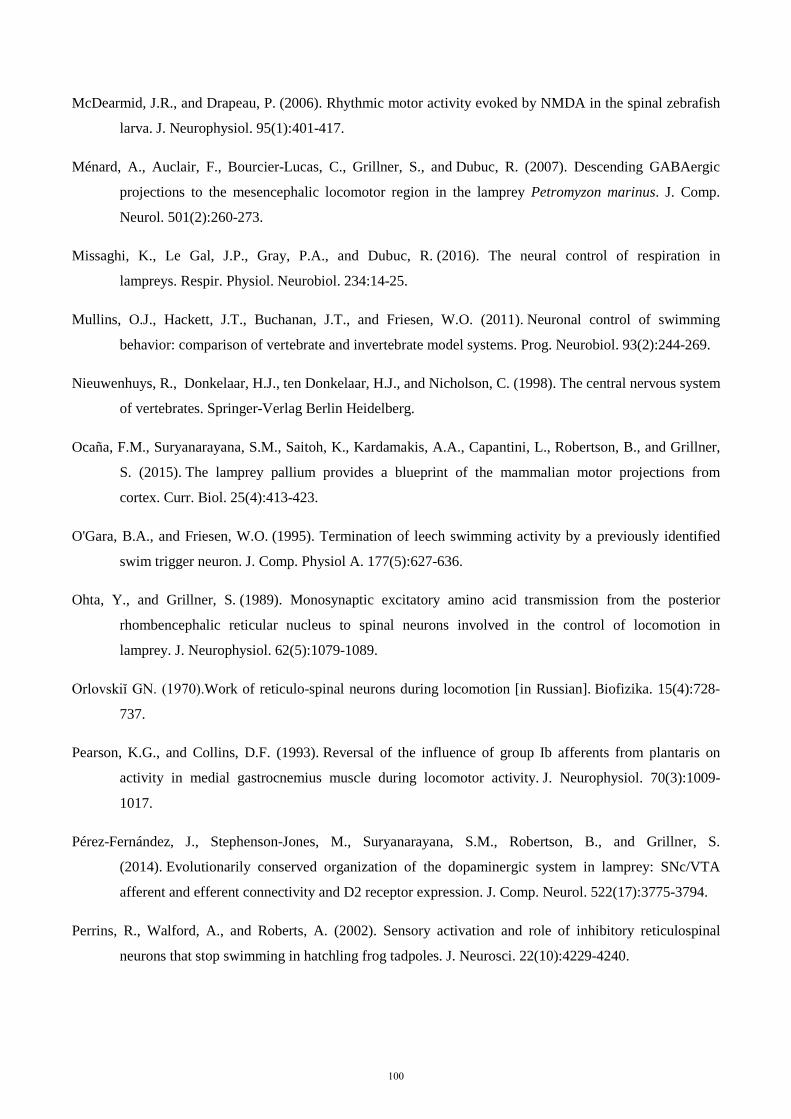
McDearmid, J.R., and Drapeau, P. (2006). Rhythmic motor activity evoked by NMDA in the spinal zebrafish
larva. J. Neurophysiol. 95(1):401-417.
Ménard, A., Auclair, F., Bourcier-Lucas, C., Grillner, S., and Dubuc, R. (2007). Descending GABAergic
projections to the mesencephalic locomotor region in the lamprey Petromyzon marinus. J. Comp.
Neurol. 501(2):260-273.
Missaghi, K., Le Gal, J.P., Gray, P.A., and Dubuc, R. (2016). The neural control of respiration in
lampreys. Respir. Physiol. Neurobiol. 234:14-25.
Mullins, O.J., Hackett, J.T., Buchanan, J.T., and Friesen, W.O. (2011). Neuronal control of swimming
behavior: comparison of vertebrate and invertebrate model systems. Prog. Neurobiol. 93(2):244-269.
Nieuwenhuys, R., Donkelaar, H.J., ten Donkelaar, H.J., and Nicholson, C. (1998). The central nervous system
of vertebrates. Springer-Verlag Berlin Heidelberg.
Ocaña, F.M., Suryanarayana, S.M., Saitoh, K., Kardamakis, A.A., Capantini, L., Robertson, B., and Grillner,
S. (2015). The lamprey pallium provides a blueprint of the mammalian motor projections from
cortex. Curr. Biol. 25(4):413-423.
O'Gara, B.A., and Friesen, W.O. (1995). Termination of leech swimming activity by a previously identified
swim trigger neuron. J. Comp. Physiol A. 177(5):627-636.
Ohta, Y., and Grillner, S. (1989). Monosynaptic excitatory amino acid transmission from the posterior
rhombencephalic reticular nucleus to spinal neurons involved in the control of locomotion in
lamprey. J. Neurophysiol. 62(5):1079-1089.
Orlovskiĭ GN. (1970).Work of reticulo-spinal neurons during locomotion [in Russian]. Biofizika. 15(4):728-
737.
Pearson, K.G., and Collins, D.F. (1993). Reversal of the influence of group Ib afferents from plantaris on
activity in medial gastrocnemius muscle during locomotor activity. J. Neurophysiol. 70(3):1009-
1017.
Pérez-Fernández, J., Stephenson-Jones, M., Suryanarayana, S.M., Robertson, B., and Grillner, S.
(2014). Evolutionarily conserved organization of the dopaminergic system in lamprey: SNc/VTA
afferent and efferent connectivity and D2 receptor expression. J. Comp. Neurol. 522(17):3775-3794.
Perrins, R., Walford, A., and Roberts, A. (2002). Sensory activation and role of inhibitory reticulospinal
neurons that stop swimming in hatchling frog tadpoles. J. Neurosci. 22(10):4229-4240.
100
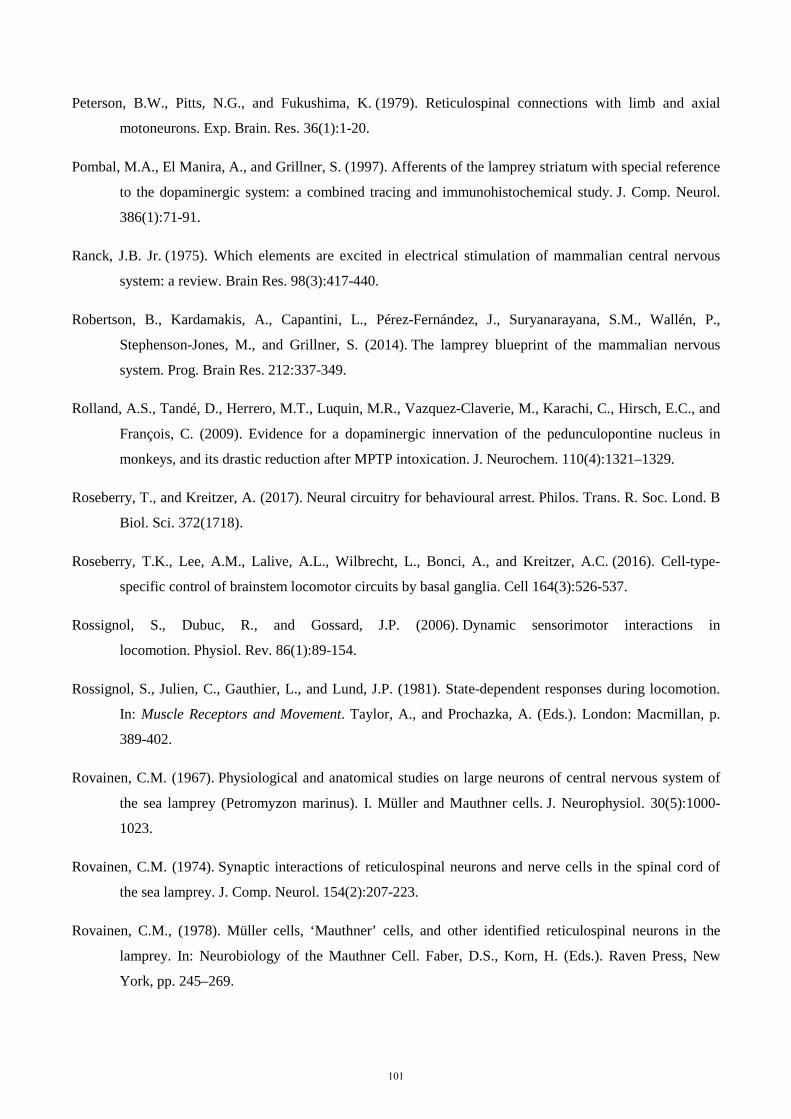
Peterson, B.W., Pitts, N.G., and Fukushima, K. (1979). Reticulospinal connections with limb and axial
motoneurons. Exp. Brain. Res. 36(1):1-20.
Pombal, M.A., El Manira, A., and Grillner, S. (1997). Afferents of the lamprey striatum with special reference
to the dopaminergic system: a combined tracing and immunohistochemical study. J. Comp. Neurol.
386(1):71-91.
Ranck, J.B. Jr. (1975). Which elements are excited in electrical stimulation of mammalian central nervous
system: a review. Brain Res. 98(3):417-440.
Robertson, B., Kardamakis, A., Capantini, L., Pérez-Fernández, J., Suryanarayana, S.M., Wallén, P.,
Stephenson-Jones, M., and Grillner, S. (2014). The lamprey blueprint of the mammalian nervous
system. Prog. Brain Res. 212:337-349.
Rolland, A.S., Tandé, D., Herrero, M.T., Luquin, M.R., Vazquez-Claverie, M., Karachi, C., Hirsch, E.C., and
François, C. (2009). Evidence for a dopaminergic innervation of the pedunculopontine nucleus in
monkeys, and its drastic reduction after MPTP intoxication. J. Neurochem. 110(4):1321–1329.
Roseberry, T., and Kreitzer, A. (2017). Neural circuitry for behavioural arrest. Philos. Trans. R. Soc. Lond. B
Biol. Sci. 372(1718).
Roseberry, T.K., Lee, A.M., Lalive, A.L., Wilbrecht, L., Bonci, A., and Kreitzer, A.C. (2016). Cell-type-
specific control of brainstem locomotor circuits by basal ganglia. Cell 164(3):526-537.
Rossignol, S., Dubuc, R., and Gossard, J.P. (2006). Dynamic sensorimotor interactions in
locomotion. Physiol. Rev. 86(1):89-154.
Rossignol, S., Julien, C., Gauthier, L., and Lund, J.P. (1981). State-dependent responses during locomotion.
In: Muscle Receptors and Movement. Taylor, A., and Prochazka, A. (Eds.). London: Macmillan, p.
389-402.
Rovainen, C.M. (1967). Physiological and anatomical studies on large neurons of central nervous system of
the sea lamprey (Petromyzon marinus). I. Müller and Mauthner cells. J. Neurophysiol. 30(5):1000-
1023.
Rovainen, C.M. (1974). Synaptic interactions of reticulospinal neurons and nerve cells in the spinal cord of
the sea lamprey. J. Comp. Neurol. 154(2):207-223.
Rovainen, C.M., (1978). Müller cells, ‘Mauthner’ cells, and other identified reticulospinal neurons in the
lamprey. In: Neurobiology of the Mauthner Cell. Faber, D.S., Korn, H. (Eds.). Raven Press, New
York, pp. 245–269.
101
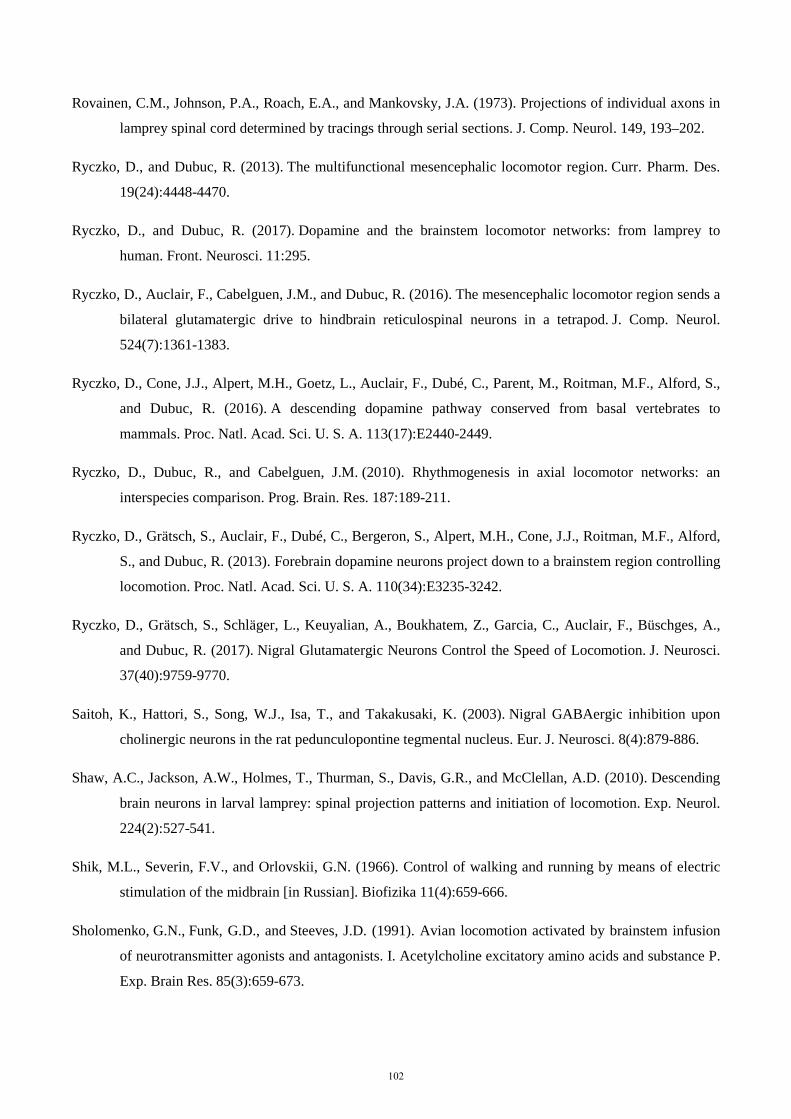
Rovainen, C.M., Johnson, P.A., Roach, E.A., and Mankovsky, J.A. (1973). Projections of individual axons in
lamprey spinal cord determined by tracings through serial sections. J. Comp. Neurol. 149, 193–202.
Ryczko, D., and Dubuc, R. (2013). The multifunctional mesencephalic locomotor region. Curr. Pharm. Des.
19(24):4448-4470.
Ryczko, D., and Dubuc, R. (2017). Dopamine and the brainstem locomotor networks: from lamprey to
human. Front. Neurosci. 11:295.
Ryczko, D., Auclair, F., Cabelguen, J.M., and Dubuc, R. (2016). The mesencephalic locomotor region sends a
bilateral glutamatergic drive to hindbrain reticulospinal neurons in a tetrapod. J. Comp. Neurol.
524(7):1361-1383.
Ryczko, D., Cone, J.J., Alpert, M.H., Goetz, L., Auclair, F., Dubé, C., Parent, M., Roitman, M.F., Alford, S.,
and Dubuc, R. (2016). A descending dopamine pathway conserved from basal vertebrates to
mammals. Proc. Natl. Acad. Sci. U. S. A. 113(17):E2440-2449.
Ryczko, D., Dubuc, R., and Cabelguen, J.M. (2010). Rhythmogenesis in axial locomotor networks: an
interspecies comparison. Prog. Brain. Res. 187:189-211.
Ryczko, D., Grätsch, S., Auclair, F., Dubé, C., Bergeron, S., Alpert, M.H., Cone, J.J., Roitman, M.F., Alford,
S., and Dubuc, R. (2013). Forebrain dopamine neurons project down to a brainstem region controlling
locomotion. Proc. Natl. Acad. Sci. U. S. A. 110(34):E3235-3242.
Ryczko, D., Grätsch, S., Schläger, L., Keuyalian, A., Boukhatem, Z., Garcia, C., Auclair, F., Büschges, A.,
and Dubuc, R. (2017). Nigral Glutamatergic Neurons Control the Speed of Locomotion. J. Neurosci.
37(40):9759-9770.
Saitoh, K., Hattori, S., Song, W.J., Isa, T., and Takakusaki, K. (2003). Nigral GABAergic inhibition upon
cholinergic neurons in the rat pedunculopontine tegmental nucleus. Eur. J. Neurosci. 8(4):879-886.
Shaw, A.C., Jackson, A.W., Holmes, T., Thurman, S., Davis, G.R., and McClellan, A.D. (2010). Descending
brain neurons in larval lamprey: spinal projection patterns and initiation of locomotion. Exp. Neurol.
224(2):527-541.
Shik, M.L., Severin, F.V., and Orlovskii, G.N. (1966). Control of walking and running by means of electric
stimulation of the midbrain [in Russian]. Biofizika 11(4):659-666.
Sholomenko, G.N., Funk, G.D., and Steeves, J.D. (1991). Avian locomotion activated by brainstem infusion
of neurotransmitter agonists and antagonists. I. Acetylcholine excitatory amino acids and substance P.
Exp. Brain Res. 85(3):659-673.
102
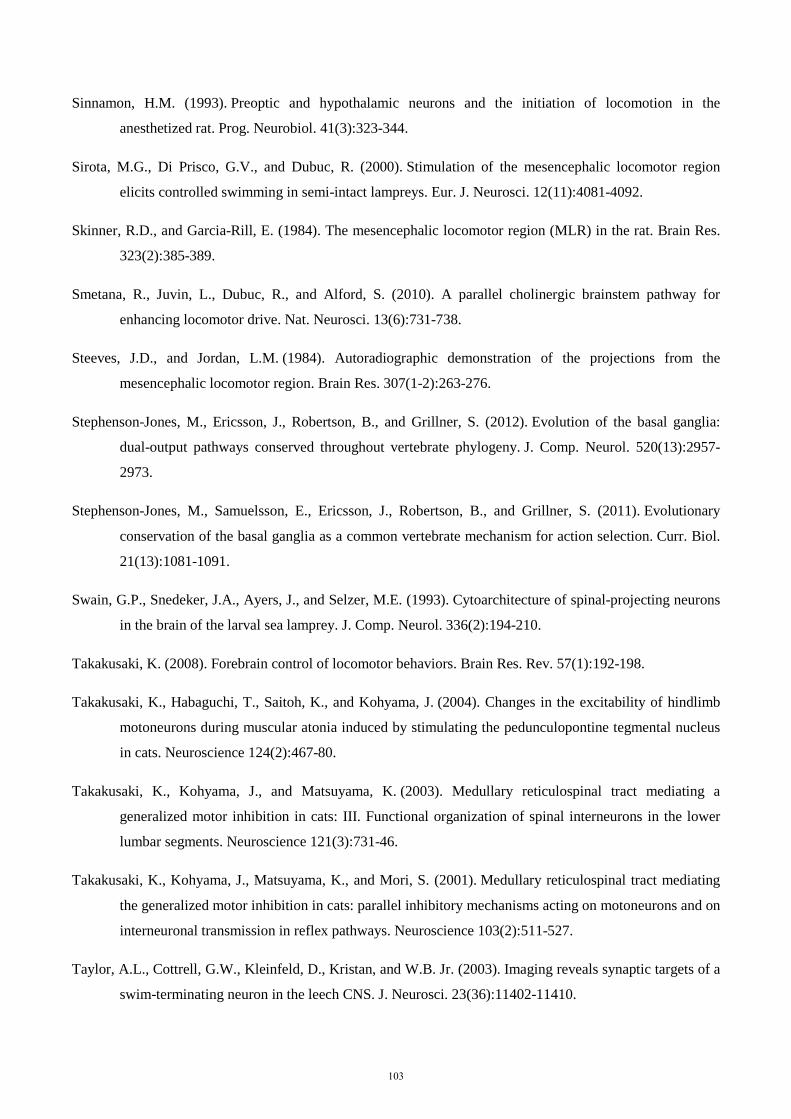
Sinnamon, H.M. (1993). Preoptic and hypothalamic neurons and the initiation of locomotion in the
anesthetized rat. Prog. Neurobiol. 41(3):323-344.
Sirota, M.G., Di Prisco, G.V., and Dubuc, R. (2000). Stimulation of the mesencephalic locomotor region
elicits controlled swimming in semi-intact lampreys. Eur. J. Neurosci. 12(11):4081-4092.
Skinner, R.D., and Garcia-Rill, E. (1984). The mesencephalic locomotor region (MLR) in the rat. Brain Res.
323(2):385-389.
Smetana, R., Juvin, L., Dubuc, R., and Alford, S. (2010). A parallel cholinergic brainstem pathway for
enhancing locomotor drive. Nat. Neurosci. 13(6):731-738.
Steeves, J.D., and Jordan, L.M. (1984). Autoradiographic demonstration of the projections from the
mesencephalic locomotor region. Brain Res. 307(1-2):263-276.
Stephenson-Jones, M., Ericsson, J., Robertson, B., and Grillner, S. (2012). Evolution of the basal ganglia:
dual-output pathways conserved throughout vertebrate phylogeny. J. Comp. Neurol. 520(13):2957-
2973.
Stephenson-Jones, M., Samuelsson, E., Ericsson, J., Robertson, B., and Grillner, S. (2011). Evolutionary
conservation of the basal ganglia as a common vertebrate mechanism for action selection. Curr. Biol.
21(13):1081-1091.
Swain, G.P., Snedeker, J.A., Ayers, J., and Selzer, M.E. (1993). Cytoarchitecture of spinal-projecting neurons
in the brain of the larval sea lamprey. J. Comp. Neurol. 336(2):194-210.
Takakusaki, K. (2008). Forebrain control of locomotor behaviors. Brain Res. Rev. 57(1):192-198.
Takakusaki, K., Habaguchi, T., Saitoh, K., and Kohyama, J. (2004). Changes in the excitability of hindlimb
motoneurons during muscular atonia induced by stimulating the pedunculopontine tegmental nucleus
in cats. Neuroscience 124(2):467-80.
Takakusaki, K., Kohyama, J., and Matsuyama, K. (2003). Medullary reticulospinal tract mediating a
generalized motor inhibition in cats: III. Functional organization of spinal interneurons in the lower
lumbar segments. Neuroscience 121(3):731-46.
Takakusaki, K., Kohyama, J., Matsuyama, K., and Mori, S. (2001). Medullary reticulospinal tract mediating
the generalized motor inhibition in cats: parallel inhibitory mechanisms acting on motoneurons and on
interneuronal transmission in reflex pathways. Neuroscience 103(2):511-527.
Taylor, A.L., Cottrell, G.W., Kleinfeld, D., Kristan, and W.B. Jr. (2003). Imaging reveals synaptic targets of a
swim-terminating neuron in the leech CNS. J. Neurosci. 23(36):11402-11410.
103
Thiele, T.R., Donovan, J.C., and Baier, H. (2014). Descending control of swim posture by a midbrain nucleus
in zebrafish. Neuron 83(3):679-691.
Thompson, R.H., Ménard, A., Pombal, M., and Grillner, S. (2008). Forebrain dopamine depletion impairs
motor behavior in lamprey. Eur. J. Neurosci. 27(6):1452-1460.
Villar-Cerviño, V., Barreiro-Iglesias, A., Mazan, S., Rodicio, M.C., and Anadón, R. (2011). Glutamatergic
neuronal populations in the forebrain of the sea lamprey, Petromyzon marinus: an in situ hybridization
and immunocytochemical study. J. Comp. Neurol. 519(9):1712-1735.
Wallén, P., and Williams, T.L. (1984). Fictive locomotion in the lamprey spinal cord in vitro compared with
swimming in the intact and spinal animal. J. Physiol. 347:225-239.
Wannier, T., Orlovsky, G., and Grillner, S. (1995). Reticulospinal neurones provide monosynaptic glycinergic
inhibition of spinal neurones in lamprey. Neuroreport. 6(12):1597-1600.
Zelenin, P.V. (2011). Reticulospinal neurons controlling forward and backward swimming in the lamprey. J.
Neurophysiol. 105(3):1361-1371.
Zelenin, P.V., Orlovsky, G.N., and Deliagina, T.G. (2007). Sensory-motor transformation by individual
command neurons. J. Neurosci. 27(5):1024-1032
Zill, S.N. (1985). Plasticity and proprioception in insects. II. Modes of reflex action of the locust metathoracic
femoral chordotonal organ. J. Exp. Biol. 116:463-480.
Zompa, I.C., and Dubuc, R. (1996). A mesencephalic relay for visual inputs to reticulospinal neurones in
lampreys. Brain Res. 718(1-2):221-227.
104

105

Acknowledgements
During my Ph.D. time, I met many inspiring and supporting people that made this time an exciting and
unforgettable experience, full with new discoveries and joy. Here, I would like to take the opportunity to
thank a couple of these very important people.
Special thanks go to my fantastic supervisors, Prof. Dr. Ansgar Büschges and Prof. Dr. Réjean Dubuc.
Ansgar, thank you so much for your support, for sharing your ambition and scientific curiosity, and of course
your endless optimism. You are right, in the end everything works out.
Réjean, thank you very much for everything you did for me, for your endless support, the opportunity to work
on exciting projects, and for sharing your scientific passion. This has been an amazing experience!
Furthermore, I would like to thank my jury and thesis committee members, Prof. Dr. Silvia Daun and Prof.
Dr. Matthias Hammerschmidt. Thank you for the lively discussions and advices that helped to plan and
improve my experiments.
Scientific and emotional support was always provided by my marvellous colleagues in Montréal and Cologne.
François, Danielle, Dimitri, Laurent, Gheylen, Jean-Patrick, Kianoush, Philipp-Antoine, Emilie, Catherine,
Fréderic, and Christian: Merci beaucoup pour tout! Vous êtes les meilleurs collègues au monde.
Big thanks also go to the members of the laboratories Kolta, Robitaille, Lacaille, Rossignol, Arya and the
ADÉNUM. Merci pour les évènements plaisants et les bons moments.
Tommi, Carmen, Eli, Anna, Joscha, Till, Chalalompos, Felix I, Felix II, Laura, Alex, Gesa, Sander, Micha,
Jochen, Volker, Matthias, Jan, Philipp, Eva, Jens, Anne und Tino: Tausend Dank für die unvergesslichen
Konferenzaufenthalte, stimulierenden Diskussionen, Verrücktheiten und Freundschaften. Ihr ward in meinem
Herzen immer bei mir!
Many thanks go to my dear friends who were always cheering from near and far. Jules, Lara, Kerstin, Isidora,
Sarah, Barbro, Camille and Lucie, Violeta and Benjamin, Andréanne and Laurent, Nadine and Vincent, Eliane
and Guillaume, Julie and Fred, Maxi and Lena, Alexandra, Anni, Mo, Oke, Eliza, Alexandra, Lisa. Danke
schön! Merci beaucoup! Tack så mycket!
106
Family support is so very important especially if you are far away from home. Therefore I am thanking my
whole family who I deeply missed but who made me feel close by writing, calling, and sending tons of Yogi
Tea and Haribo to Montréal.
A special shout-out goes to my small family Günter, Irmela, Annika, Jasper, Philipp, and of course Kalle.
Danke für eure Unterstützung und eure Liebe. Ihr seid meine Liebsten, ihr seid die Besten!
Also, I would like to thank my québécois family Shahram, Carmelle, Shaida, and Jules. Thanks for being
awesome, kind, and jovial. I love you guys!
And of course I would like to thank Kianoush, who is always there for me. Thanks for your motivation, for
taking care of my worries, and believing in me. Thank you for all this joy and laughter!
Finally, I would like to thank Sanft & Sorgfältig/ Fest & Flauschig, the only real podcast in Germany for
making the weekend experiments and long hours of kinematic analysis more than enjoyable. Tausend Dank
für die Unterhaltung. Wegen euch war ich die, die alleine in der Ecke sitzt und laut lacht.
Financial support for this work came from my two supervisors but also from the University of Cologne and
the Deutscher Akademischer Austauschdienst (DAAD), who I would like to thank as well for making this
project and collaboration possible.
107
Teilpublikationen
Artikel
(mit peer-review
Verfahren)
Ryczko D, Grätsch S, Schläger L, Keuyalian A, Boukhatem Z, Garcia C, Auclair F, Büschges
A, Dubuc R. „Nigral glutamatergic neurons control the speed of locomotion.“ J. Neuroscience
37(40):9759-9770.
Juvin L *, Grätsch S *, Trillaud- Doppia E, Gariépy JF, Büschges A, Dubuc R. 2016.
„A Specific Population of Reticulospinal Neurons Controls the Termination of Locomotion.“
Cell Rep. 15(11):2377-86.
* Ko-Erstautoren
Ryczko D, Grätsch S, Auclair F, Dubé C, Bergeron S, Alpert M, Cone J, Roitman M, Alford S,
Dubuc R. 2013. „Forebrain dopamine neurons project down to a brainstem region controlling
locomotion“. Proc. Natl. Acad. Sci. USA 110(4):E3235-42.
Artikel
(im Begutachtungs-
verfahren)
Grätsch S, Auclair F, Demers O, Auguste E, Hanna A, Büschges A, Dubuc R. „A brainstem
neural substrate for stopping locomotion.“ Im Begutachtungsverfahren bei Current Biology
(CURRENT-BIOLOGY-D-18-00650)
Posterbeiträge
2017
Grätsch S, Demers O, Auguste E, Auclair F, Veilleux D, Büschges A, Dubuc R. 2017. „A
neural substrate involved in stopping locomotion.“ 47. Jahrestagung der Society for
Neuroscience, Washington, USA
Grätsch S, Demers O, Auguste E, Auclair F, Veilleux D, Büschges A, Dubuc R. 2017. „A
neural substrate involved in stopping locomotion.“ 10. SfN Satellitensymposium über
Motorische Systeme, Bethesda, USA
Grätsch S, Auclair F, Veilleux D, Büschges A, Dubuc R. 2017. „On mechanisms for stopping
locomotion.“ 2. Jahrestagung „NeuroSymposium“, Montréal, Canada
Grätsch S, Auclair F, Veilleux D, Büschges A, Dubuc R. 2017. „A neural mechanism
underlying swimming termination in lamprey.“ 12. Jahrestagung der Neurowissenschaftlichen
Gesellschaft, Göttingen, Deutschland
2016 Grätsch S, Auclair F, Veilleux D, Büschges A, Dubuc R. 2016. „A stop signal for swimming
originates from the mesencephalic locomotor region. “ 46. Jahrestagung der Society for
Neuroscience, San Diego, USA
Grätsch S, Auclair F, Veilleux D, Büschges A, Dubuc R. 2016. „A stop signal for swimming
originates from the mesencephalic locomotor region. “ 9. SfN Satellitensymposium über
Motorische Systeme, La Jolla, USA
108
Grätsch S, Auclair F, Veilleux D, Büschges A, Dubuc R. 2016. „The mesencephalic locomotor
region controls stopping of locomotion in the lamprey.“ 6. Jahrestagung der Groupe de
Recherche en Activité Physique Adaptée (GRAPA), Montréal, Kanada
Grätsch S, Auclair F, Veilleux D, Büschges A, Dubuc R. 2016. „Termination of locomotion in
the lamprey is controlled by a descending neural mechanism.“ 2. Jahrestagung der
Neurowissenschaftsstudenten der Université de Montréal (ADÉNUM), Montréal, Kanada
2015 Grätsch S, Juvin L, Auclair F, Veilleux D, Büschges A, Dubuc R. 2015. „Identification of a
descending neural mechanism that controls termination of locomotion in the lamprey.“ 45.
Jahrestagung der Society for Neuroscience, Chicago, USA
Grätsch S, Juvin L, Auclair F, Veilleux D, Büschges A, Dubuc R. 2015. „Identification of a
descending neural mechanism that controls termination of locomotion in the lamprey. “ 9. SfN
Satellitensymposium über Motorische Systeme, Chicago, USA
Grätsch S, Juvin L, Auclair F, Veilleux D, Büschges A, Dubuc R. 2015. „A descending
pathway that controls termination of locomotion in the lamprey.“ 5. Jahrestagung der Groupe
de Recherche en Activité Physique Adaptée (GRAPA), Montréal, Kanada
2014 Grätsch S, Auclair F, Büschges A, Dubuc R. 2014. „Differential contribution of reticulospinal
neurons to locomotor control in the lamprey.“ 4. Jahrestagung der Groupe de Recherche en
Activité Physique Adaptée (GRAPA), Montréal, Kanada
Ryczko D, Grätsch S, Auclair F, Dubé C, Bergeron S, Alpert M, Cone J, Roitman M, Alford S,
Dubuc R. 2013. „Forebrain dopamine neurons send descending projections to a brainstem
region controlling locomotion. Possible implication for Parkinson’s disease.“ 3. Jahrestagung
der Groupe de Recherche en Activité Physique Adaptée (GRAPA), Montréal, Kanada
2012 Ryczko D, Grätsch S, Dubé C, Auclair F, Dubuc R. 2012. „Evidence that lamprey
dopaminergic neurons from the posterior tuberculum are homologous to those in the substantia
nigra and/or ventral tegmental area, and control locomotion.“ 42. Jahrestagung der Society for
Neuroscience, New Orleans, USA
Ryczko D, Grätsch S, Lamontagne V, Dubuc R. 2012. „Innervation dopaminergique de la
region locomotrice mesencephalique: 2. Role dans le maintien de l’activite locomotrice.“ 2.
Jahrestagung der Groupe de Recherche en Activité Physique Adaptée (GRAPA), Montréal,
Kanada
109
Mündliche Vorträge
2018
„Brainstem command cells controlling the locomotor output“. 2018. 4. Jahrestagung der
Neurowissenschaftsstudenten der Université de Montréal (ADÉNUM), Montréal, Kanada
2017 „A stop signal for swimming originates from the Mesencephalic Locomotor Region“. 2017.
Studentenseminar der Groupe de recherche sur le système nerveux central (GRSNC) der
Université de Montréal, Montréal, Canada
„On the mechanisms for stopping locomotion.“ 2017. Pitch talk bei der 2. Jahrestagung
„NeuroSymposium“, BaNQ Grande Bibliothèque, Montréal, Canada
„Stopping locomotion: Identification of a neural mechanism that controls termination of
swimming in the lamprey“. 2017. Max Planck Institute of Neurobiology, Martinsried, Germany
110
Erklärung
Ich versichere, dass ich die von mir vorgelegte Dissertation selbständig angefertigt, die benutzten
Quellen und Hilfsmittel vollständig angegeben und die Stellen der Arbeit – einschließlich Tabellen,
Karten und
Abbildungen –, die anderen Werken im Wortlaut oder dem Sinn nach entnommen sind, in jedem
Einzelfall als Entlehnung kenntlich gemacht habe; dass diese Dissertation noch keiner anderen
Fakultät oder Universität zur Prüfung vorgelegen hat; dass sie – abgesehen von unten angegebenen
Teilpublikationen – noch nicht veröffentlicht worden ist sowie, dass ich eine solche Veröffentlichung
vor Abschluss des Promotionsverfahrens nicht vornehmen werde.
Die Bestimmungen der Promotionsordnung sind mir bekannt. Die von mir vorgelegte Dissertation ist
von Prof. Dr. Ansgar Büschges betreut worden.
Swantje Grätsch