deregulating school aid in california: how 10 districts responded to fiscal flexibility, 2009-2010
TRANSCRIPT
ReprintsThis product is part of the RAND Corporation reprint series. RAND reprints present previously pub-lished journal articles, book chapters, and reports with the permission of the publisher. RAND reprints have been formally reviewed in accordance with the publisher’s editorial policy, and are compliant with RAND’s rigorous quality assurance standards for quality and objectivity.
For More InformationVisit RAND at www.rand.org
Explore RAND Education
View document details
Support RANDPurchase this document
Browse Reports & Bookstore
Make a charitable contribution
Skip all front matter: Jump to Page 16
The RAND Corporation is a nonprofit institution that helps improve policy and decisionmaking through research and analysis.
This electronic document was made available from www.rand.org as a public service of the RAND Corporation.
CHILDREN AND FAMILIES
EDUCATION AND THE ARTS
ENERGY AND ENVIRONMENT
HEALTH AND HEALTH CARE
INFRASTRUCTURE AND TRANSPORTATION
INTERNATIONAL AFFAIRS
LAW AND BUSINESS
NATIONAL SECURITY
POPULATION AND AGING
PUBLIC SAFETY
SCIENCE AND TECHNOLOGY
TERRORISM AND HOMELAND SECURITY
The research described in this report was sponsored by the William and Flora Hewlett Foundation, the Dirk and Charlene Kabcenell Foundation, and the Stuart Foundation and was conducted by PACE research network and RAND Education, a division of the RAND Corporation.
The RAND Corporation is a nonprofit institution that helps improve policy and decisionmaking through research and analysis. RAND’s publications do not necessarily reflect the opinions of its research clients and sponsors.
R® is a registered trademark.
© Copyright 2011 RAND Corporation
Permission is given to duplicate this document for personal use only, as long as it is unaltered and complete. Copies may not be duplicated for commercial purposes. Unauthorized posting of RAND documents to a non-RAND website is prohibited. RAND documents are protected under copyright law. For information on reprint and linking permissions, please visit the RAND permissions page (http://www.rand.org/publications/ permissions.html).
Published 2011 by the RAND Corporation1776 Main Street, P.O. Box 2138, Santa Monica, CA 90407-2138
1200 South Hayes Street, Arlington, VA 22202-50504570 Fifth Avenue, Suite 600, Pittsburgh, PA 15213-2665
RAND URL: http://www.rand.orgTo order RAND documents or to obtain additional information, contact
Distribution Services: Telephone: (310) 451-7002; Fax: (310) 451-6915; Email: [email protected]
1DEREGULATING SCHOOL AID IN CALIFORNIA
Deregulating SchoolAid in California:
How 10 Districts Responded to Fiscal Flexibility,
2009-2010
RAND and the
PACE Research Network
Bruce Fuller, Julie Marsh,
Brian Stecher, Tom Timar
Co-Principal Investigators
With
Mary Briggs
Scott Epstein
Nina Lorenzi
Reino Makkonen
Angeline Spain
Anisah Waite
May, 2011
2 DEREGULATING SCHOOL AID IN CALIFORNIA
Acknowledgments
Special thanks to the many school board members, district superintendents and staff , principals, and com-munity members who took time to speak candidly and at length with us. We are grateful to the three Califor-nia foundations, who sponsored the overall study, and for their steady desire to fi nance our schools in ways that citizens, and policymakers can understand and improve. Th is includes Th e William and Flora Hewlett Foundation, the Dirk and Charlene Kabcenell Founda-tion, and the Stuart Foundation. Special thanks to Der-ry Kabcenell, Matt Keleman, Kristi Kimball, Susan Lit-tle, and Christy Pichel for making this eff ort possible. Our advisory committee continues to provide careful guidance. Th e project would not have been completed without aid from Laurie Kimbler at the University of California, Berkeley, and Donna White at the RAND Corporation. David Plank at Policy Analysis for Cali-fornia Education graciously supported dissemination of this report. Th ree anonymous reviewers off ered thoughtful comments.
3DEREGULATING SCHOOL AID IN CALIFORNIA
Table of Contents
Executive Summary – Major Findingsand Policy Implications ............................................ i
Section 1. Deregulating School Aid in California –A Persisting Policy Discussion ............................... 1
Section 2. Situating Fiscal Deregulationand Tier 3 Flexibility – Multiple Policy Aimsin Tough Economic Times ...................................... 4
Section 3. Methodology and Descriptionof Case Districts ..................................................... 15
Section 4. District Responses toTier 3 Flexibility and Stimulus Funds ................. 26
Section 5. Decision-Making Processesthat Guide District Allocations ............................ 44
Section 6. Consequences of Tier 3 Flexibility ........... 50
Section 7. Factors that Shape DistrictResponses to Fiscal Deregulation ........................ 56
Section 8. Conclusions and Policy Implications ...... 67
References ...................................................................... 70
Appendices
A. Tier 3 Categorical Programs Combinedinto New “Flex Item” (2009-2010) ................ 72
B. Advisory Committee ......................................... 73
iDEREGULATING SCHOOL AID IN CALIFORNIA
Executive Summary –Major Findings and Policy Implications
This report details how leaders in 10 Califor-nia school districts are responding to the de-regulation of $4.5 billion in education funding.
Sacramento policymakers have freed local educators from the specifi c guidelines that previously regulated spending on 40 categorical-aid programs. Th ese pro-gram funds became entirely fl exible in 2009, and lo-cal school boards could decide how to allocate these resources.
Th is decentralization of fi scal authority is the latest episode in a four-decade-old debate in Sacramento over who is best qualifi ed to allocate public dollars to improve student achievement. Th is study illuminates what happened to these 40 programs (referred to as Tier 3 resources subject to categorical fl exibility) in 10 diverse districts, how budget decisions were made by district leaders, and what local factors explain the various ways in which districts responded to this fl ex-ibility. Th e study was conducted by researchers from the RAND Corporation; the University of California, Berkeley; the University of California, Davis; and San Diego State University.
Decentralizing school fi nance in tough economic times
Th e Tier 3 fl exibility reform is one element in a much larger policy debate about fi nancing California schools. Th e present approach is built on complex formulae that blend historical funding levels, court-mandated adjustments, and revenue-generation constraints set by Proposition 13, which was approved by voters 32 years ago. Few understand these complexities, yet they have major implications for the operation of districts and schools. In particular, when the state undergoes
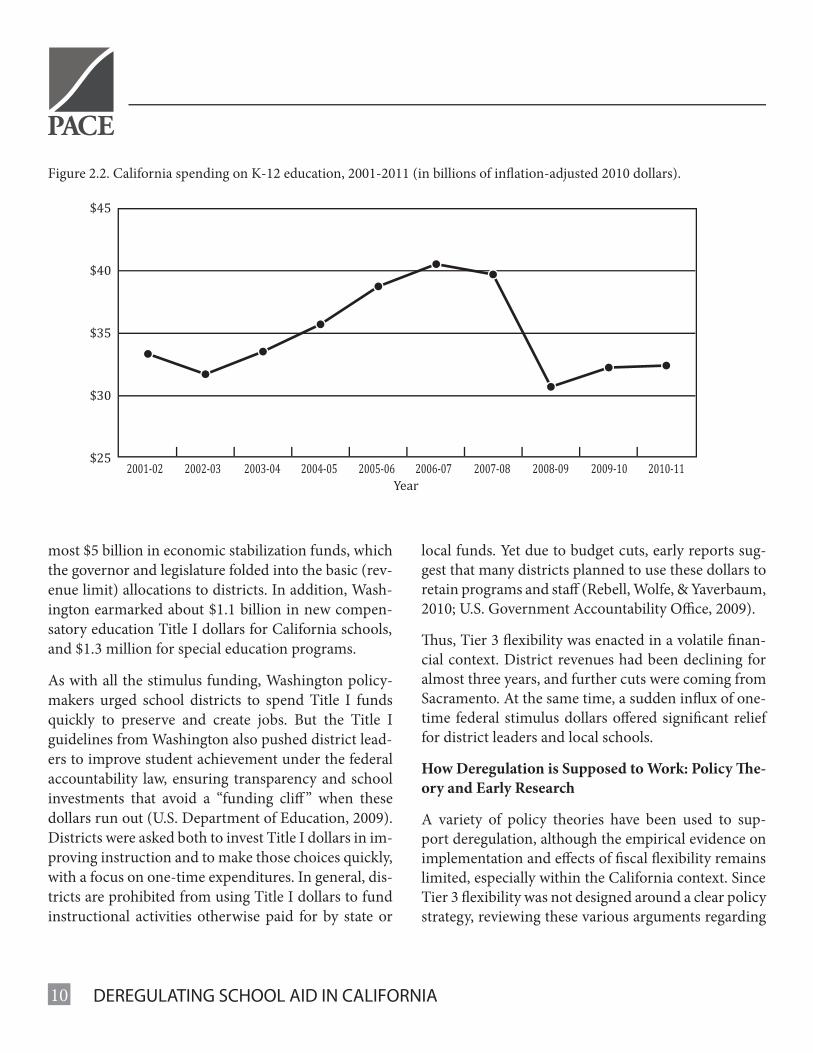
an economic downturn, school funding suff ers. Th is occurred in 2007 and 2008 when spending on K-12 education fell from $39.7 billion to $30.7 billion (in infl ation-adjusted 2010 dollars). Faced with a painful and persisting economic recession, California’s gover-nor and legislature were forced to cut education spend-ing again in February 2009. Th is reduction included an unexpected 20 percent cut for many categorical-aid programs, including dollars for new textbooks, student transportation, school security, eff orts for gift ed and talented children, and adult education.
To soft en the cuts, the governor urged legislators to combine $4.5 billion allocated for 40 separate pro-grams, previously regulated by the legislature and the California Department of Education (CDE), into a single, general purpose funding stream. Th e larg-est of these programs were the Targeted Instructional Improvement Block Grant, Adult Education, Regional Occupational Centers and Programs, and School and Library Improvement Block Grant (see Appendix A for a full list). Local school boards and district lead-ers could then decide to continue these programs or “sweep” the revenues into their general funds to help them cover other costs, or they could reorder spend-ing priorities. Th e legislature did not eliminate the programs from statute, but they granted districts the fl exibility to use the funds in any manner approved by their local school board.
A Persisting Policy Debate
Few Sacramento observers would argue that the de-centralization of fi scal authority for Tier 3 programs was a carefully designed policy experiment, as we will describe. However, equaling about 6 percent of the to-tal education budget, this is the largest eff ort to date to reduce state government’s regulatory role and enlarge the authority of local boards and superintendents to make their own allocation decisions.
ii DEREGULATING SCHOOL AID IN CALIFORNIA
Tier 3 fl exibility is the latest skirmish in a long-standing battle over centralized versus localized control of edu-cational expenditures. Historically, Sacramento policy-makers have earmarked funds for particular categories of students (from disabled to gift ed students) or school improvement strategies (smaller classes, teacher train-ing, school-level decision-making), rather than letting local school boards make these decisions. Some legis-lators prefer that new education funding not be sub-ject to collective bargaining, allocating money instead to specifi c programs rather than salary increases. Even aft er the Tier 3 deregulation reform, almost one-fourth of all school spending in California remains highly regulated by specifi c program guidelines.
To further complicate the picture, just as districts were beginning to understand and respond to the Tier 3 fl exibility in the spring and summer of 2009, the fed-eral government directed an additional $1.1 billion in Title I compensatory education dollars to Califor-nia districts under the federal government’s economic stimulus package. Suddenly, districts enjoyed both greater fl exibility and a fresh infusion of federal cat-egorical aid, albeit within the context of sharp and re-peated cuts in overall state spending. Th is study was designed to learn how district leaders responded to this series of policy changes: new fl exibility for Tier 3 state categorical aid, signifi cant cuts in education rev-enues overall, and a temporary boost in federal cat-egorical aid.
Research Methods
To explore how local districts and school-level leaders perceived and implemented Tier 3 fl exibility, we con-ducted more than 90 in-depth interviews with leaders and other stakeholders in 10 diverse unifi ed school districts in California, along with a dozen interviews with policy leaders in Sacramento. Th e districts were split evenly between north and south, and they varied
with respect to enrollment, fi scal health, and the share of their budgets used for administrative personnel. Our initial report on statewide revenue and expen-diture patterns, distributed in January 2011, detailed which districts and students benefi ted most from Tier 3 spending, how these dollars have been spent, and how district leaders allocated Tier 3 funds in conjunc-tion with new federal stimulus dollars.
To frame the local interviews, we considered the ratio-nales of policymakers when they enacted this policy shift . Th ere were several competing hypotheses. Some policymakers speculated that deregulation would further widen disparities in school fi nance at the lo-cal level as vocal constituencies pushed for a greater share of resources. Others argued that deregulation of previously earmarked funds would place these dollars on the bargaining table, protecting or boosting teacher benefi ts with little attention to improving teaching and learning. Proponents of decentralizing school fi nance claimed that increased fl exibility would allow districts to better align resources to local priorities, direct more dollars toward instructional gains, and expand prin-cipals’ authority to build a stronger teaching staff . Yet, little evidence was available to back these competing claims, even though Sacramento leaders had consoli-dated and deregulated categorical aid in the past.
In early 2010, we set out to examine these competing hypotheses and gather evidence about how local edu-cators respond to fi scal fl exibility and the forces that shape resource allocation decisions within district of-fi ces and schools. With funding from three founda-tions, the research initiative, Deregulating School Aid in California, sought to answer a set of core questions re-lated to implementation. Th e study’s specifi c research questions are:
1. What did district leaders do with the newly fl exible Tier 3 funds?
iiiDEREGULATING SCHOOL AID IN CALIFORNIA
2. How did district leaders make these allocation deci-sions, and who was involved?
3. What were the reported local consequences of these allocation decisions?
4. What prior conditions and concurrent factors shaped budget decisions of district leaders?
5. How did federal Title I stimulus funds interact with decisions about Tier 3 fl exibility?
6. What are statewide revenue and spending patterns for Tier 3 and stimulus funds?
a. Which kinds of districts, schools, and students benefi t most from the fl ow of deregulated Tier 3 categorical aid and federal stimulus dollars?
b. Do districts (and schools) with larger shares of Tier 3 aid and federal stimulus funding (as frac-tions of their overall budgets) spend relatively more on instruction and teaching staff , compared with districts that benefi t less from these sources?
Th is report addresses the initial fi ve research questions. Th e companion report distributed in January 2011 fo-cused on question six. An upcoming statewide survey of district leaders will further examine key issues iden-tifi ed in the present report and develop statewide evi-dence of the implementation of Tier 3 fl exibility.
Findings
Tier 3 funding went into eff ect in early 2009 at the same time that local districts were coping with other policy shocks: sharp cutbacks in overall funding, lead-ing to teacher layoff s and rising class sizes, along with fresh stimulus dollars from Washington.
Our in-depth work inside districts focused on Tier 3 funding, tracking spending patterns of specifi c pro-grams. We asked district leaders how they made budget
decisions, who was involved in the decisions, and what consequences were observed in local communities. At the same time, we learned much about local contexts, diff ering leadership approaches inside districts, and the interplay between state and federal categorical aid.
We sorted our fi ndings into three major areas, corre-sponding to the research questions.
How did districts respond to Tier 3 fl exibility? What happened to spending levels for core Tier 3 programs?
District leaders’ perceptions of Tier 3 fl exibility varied signifi cantly. Almost all district leaders welcomed the fl exible dollars now contained in the Tier 3 funding stream, praising the governor and legislator for enact-ing this change. However, most superintendents and senior district staff viewed the change as an expedient trade-off between sharp overall budget cuts (includ-ing a 20 percent cut to Tier 3 categorical aid) and a modicum of increased fl exibility for a relatively small portion (about 7 percent) of their total district bud-get.1 Few superintendents or budget deputies said they believed the Tier 3 policy was a carefully thought-out attempt in Sacramento to decentralize spending au-thority. In fact, a signifi cant share of district leaders remained worried that lawmakers would take back this fl exibility when the state budget picture improves. Furthermore, most respondents would prefer greater fl exibility over the major categorical aid programs that were left out of Tier 3. Th ese programs include class-size reduction and Economic Impact Aid. Others wor-ried that deregulation would put certain types of stu-dents and programs at risk.
Overall, the 10 district responses to Tier 3 fl exibility followed at least one of four patterns as they reacted to these interwoven policy shift s:
Retrenchment and backfi lling against cuts. Leaders in all 10 districts “swept-up” at least of portion of their
iv DEREGULATING SCHOOL AID IN CALIFORNIA
Tier 3 dollars and used these revenues to help balance the general fund. Th is resulted in small to severe re-ductions in Tier 3 program services.
Effi ciency seeking and reassessing of spending pri-orities. In keeping with local priorities, some district leaders selectively cut back Tier 3 programs. We rarely saw district leaders use hard evidence to weigh the rel-ative eff ectiveness of programs. Th ese decisions had to be made quickly and leaders who understood the local context oft en made choices that were consistent with policies that would be politically feasible.
Reallocating dollars to advance new initiatives. A mi-nority of the 10 district superintendents reported le-veraging Tier 3 dollars with other resources to create or sustain instructional improvement eff orts or other new programs.
Sharing fl exibility with school principals and site councils. Most district leaders did not share Tier 3 fl exibility with school principals, except in districts with strong traditions of site-based budgeting. District leaders had to weigh the desirability of shared author-ity against the pressing need to balance the district budget and minimize teacher layoff s.
Under Tier 3 fl exibility, eight of the 10 case study dis-tricts reduced adult education programs, oft en sharply. Spending on core instructional materials, including textbooks, was also reduced in the majority of districts. Special instructional activities for gift ed and talented students (GATE) were pared-back or eliminated in six of 10 case study districts.
Cuts were made in smaller yet consequential Tier 3 programs as well. Th is includes programs where the legislature or the courts mandated district engagement, such as support for adolescents at risk of not passing the high school exit exam. We observed that districts were either eliminating or reducing expenditures on
a number of small categorical programs. While some districts have attempted to maintain various programs in the fi rst year of budget reductions, they foresee fur-ther cuts in coming years.
Th e infusion of federal stimulus dollars played a role in district decision-making. Some districts, channel-ing fresh stimulus dollars to schools, chose to sweep existing Tier 3 aid from these same schools, in an ef-fort to balance the district general fund. Tier 3 dollars remained a small portion of overall district budgets, but they did spur refl ection upon local priorities and creative reallocations by some district leaders and local stakeholders.
District budget cuts and Tier 3 reallocations led to predictable consequences, including job losses within aff ected programs and strained relations with teacher unions, parent groups, and other stakeholders. Th ere were also reports of bargaining with principals over cuts and how the shift ing mix of categorical aid was to be managed at district and school levels. We heard of deepening concerns over how district resources could be sustained, and whether short-term solvency was coming at the cost of eliminating politically weak Tier 3 programs previously protected by state regulation. In some cases, fees for adult education courses were raised to off set cuts in Tier 3 support, and funding for GATE and supplemental instructional programs was provided by parents and school foundations.
How did district decision-making unfold? Which stakeholders were involved in assessing budget priori-ties, especially with regard to Tier 3 programs?
Although many districts solicited input from various stakeholders to determine overall budget priorities, most superintendents and senior staff controlled bud-get decisions around Tier 3 funds. Local board mem-bers and superintendents were forced to react quickly to Tier 3 fl exibility in the mid-2009 school-year. Budget
vDEREGULATING SCHOOL AID IN CALIFORNIA
adjustments and possible layoff notifi cations had to be approved by local school boards by mid-March, given statutory requirements.2 So, bringing many stakehold-ers into the decision-making process was viewed as risky. Budget processes became somewhat more pub-lic during the 2009-10 school-year, as district leaders gained some breathing room.
Yet key stakeholders, especially board members, teach-er unions, and parent groups, remained focused on minimizing layoff s and keeping class sizes from rising dramatically. In a few cases we heard of parents orga-nizing around select Tier 3 programs, including the shrinking of GATE activities and cuts in counseling staff . Some adult-education directors organized eff orts to resist severe cuts. Yet adult education was cut in eight of the 10 districts, where it was typically viewed as peripheral to core district priorities or as a service that could be picked-up by local community colleges.
Another common feature of decision-making regard-ing Tier 3 funding was that principals and school-level leaders were not involved in seven of the 10 case study districts. Exceptions did arise, especially in districts with established histories of site-based budgeting, but they were rare.
District leaders commonly relied on two sources of information about the state revenue picture and the Tier 3 implementation, in particular. School Services of California (SSCA), a private fi rm that contracts with districts, was the most frequently mentioned source of information regarding the meaning and implementa-tion of Tier 3 fl exibility. District leaders also relied on information from their respective county offi ce of edu-cation, given this agency’s fi scal oversight responsibil-ity.
Most case study districts had entered Program Im-provement status, meaning that students were not meeting federal growth targets under No Child Left
Behind. Consequently, county education offi ces were helping several districts to improve test scores, while monitoring budget decisions, as well. Finally, guidance regarding Tier 3 was provided by the state Department of Education, but districts reported that CDE was less informative or proactive than SSCA.
What prior conditions and local factors help to ex-plain budget decisions and varying responses to Tier 3 fl exibility among districts?
Given the demographic and organizational diversity among the 10 case-study districts, it is not surprising that we observed considerable variability in district leader responses to Tier 3 fl exibility. Yet, we also iden-tifi ed some prior conditions and concurrent factors that were related to district decisions regarding fl ex-ibility. Our upcoming statewide survey aims to estab-lish whether these factors generalize to other districts beyond the 10 in this case-study.
Infl uential conditions that existed prior to the February 2009 enactment of Tier 3 fl exibility included student achievement levels; commitments to instructional im-provement eff orts; budget reserves and relative fi scal health; district size (enrollments and organizational complexity); and the stability of district leadership.
Leaders in all 10 districts faced pressure to avoid lay-ing-off teachers. Th is led to the sweeping-up of Tier 3 revenues to relieve concern over balancing the general fund. In this sense, declining fi scal health and shrink-ing cash reserves (to below statutory minimums) made a huge diff erence in district responses. However, we could not discern any consistent pattern in budget de-cision-making when we compared fi scally healthy with relatively unhealthy districts.
On the other hand, concurrent factors did infl uence district decisions patterns. For example, instability in leadership and the innovative presence of a new super-
vi DEREGULATING SCHOOL AID IN CALIFORNIA
intendent played an infl uential role in budget decision-making in three of our districts. In addition, four sets of circumstances seemed to infl uence district actions in specifi c cases. Th ese conditions included: the fact that Tier 3 came with mid-year budget cuts, ongoing fi scal uncertainty, and a sense of urgency to implement fi scal changes; the perception that legal mandates or persist-ing student needs required that some Tier 3 programs be continued; the ways in which Tier 3 programs were intertwined with labor contracts; and the infl uence of local interest groups and community organizing.
Conclusions and Policy Implications
Overall, what we heard and learned from district leaders and local stakeholders provides some helpful insights for Sacramento policymakers and districts throughout the state. While still preliminary, our inter-views revealed a few themes that should be of immedi-ate interest to policymakers. Th ese themes include the following:
Tier 3 fl exibility was not a well-articulated policy. Th e administrators in the 10 districts we studied had dif-ferent interpretations of the regulations that applied to the use and reporting of Tier 3 funds. Th ese diff erences in perception occurred, in part, because the communi-cation from CDE was viewed by some as inadequate. Another factor that may have contributed to confusion was the variety of reasons policymakers themselves ex-pressed for granting this fl exibility.
Uncertainty around Tier 3 fl exibility led districts to be cautious. Districts felt some uncertainty about their options because the legislation granting fl exibility is only temporary; unless additional action is taken by the legislature, the fl exibility expires in 2013. Addition-al uncertainty came from the fact that the legislature reduced the total amount of funds available for the 40 Tier 3 programs by 15 percent in 2008-09 and 20 per-
cent in subsequent years. Many administrators could not discern the aims of the Tier 3 reform, nor see any rationale for which programs were included in Tier 3 as opposed to those retained as categorical. Th is con-fusion stemmed from a lack of clarity in communica-tion from the legislature and CDE and the fact that the bundle of 40 Tier 3 programs was assembled quickly with little public or private discussion. Th is unclear guidance may have made some administrators cau-tious about using the new fl exibility to make dramatic changes in programs. Th e general atmosphere was one of crisis and retrenchment, and administrators were focused on trying to preserve programs more than on developing new ones.
Th e timing and technical complexity of the Tier 3 fl ex-ibility gave superintendents and chief fi nancial offi -cers a privileged position in decision-making. In nine of the 10 districts we visited, the central offi ce “swept” the Tier 3 funds into the general fund, and the deci-sions about their use were made centrally. Because of the need to act quickly, superintendents played a cen-tral role in decision-making. Similarly, complying with the guidelines required understanding of the budget-ing and reporting system, so the chief fi nancial admin-istrator was a key player in decisions.
District leaders oft en remain committed to the goals of Tier 3 programs. One fear with fl exibility is that some of the program goals will be abandoned when funding is no longer attached to them. While we did not ask about the goals associated with all 40 categori-cal programs that were part of Tier 3, the administra-tors did speak of their continued commitment to the four major programs we inquired about—Gift ed and Talented Education, professional development, Target-ed Instructional Improvement Block Grant, and Adult Education.
1DEREGULATING SCHOOL AID IN CALIFORNIA
Section 1Deregulating School Aid in California: A Persisting Policy Discussion
Faced with a third year of pallid state revenues, California’s governor and legislature were forced in early 2009 to make additional cuts to the edu-
cation budget. To ease the fi scal pain felt by local dis-tricts and schools, Sacramento policymakers agreed to consolidate and largely deregulate 40 discrete educa-tional programs, a signifi cant portion of what is called categorical aid. Th ese programs, totaling more than $4.5 billion in outlays to local school districts, were now designated as Tier 3 programs, subject to fl exibil-ity, with most regulatory strings removed. Total spend-ing directed through these now-unrestricted program funds were reduced during the 2008-09 fi scal year by about 15 percent, and by 20 percent in subsequent school-years. Sacramento policymakers appeared to be trading less state funding for greater local control over budget decisions by school boards and district leaders.
When this policy shift toward local fl exibility was en-acted, little was known about how district and school leaders would respond. Some speculated that deregula-tion would further widen disparities in school fi nance at the local level as more vocal constituencies pushed for a greater share of resources. Others argued that deregulation of previously earmarked funds would place these dollars on the bargaining table, protect-ing or boosting teacher benefi ts with little attention to reform. Proponents of decentralizing school fi nance claimed that increased fl exibility would allow districts to better align resources to local priorities, direct more dollars toward instructional gains, and expand prin-cipals’ authority to build stronger teaching staff s. Yet little evidence was available to back these competing claims, despite the fact that Sacramento has consoli-dated and deregulated categorical aid in the past, as
reviewed below. At the same moment, in the spring of 2009, signifi cant federal stimulus dollars arrived to California schools.
Purpose of the DSAC Study
In early 2010, researchers at the RAND Corporation, the University of California at Berkeley and Davis, and San Diego State University set out to examine these competing hypotheses, build evidence on how local educators respond to fi scal fl exibility, and better un-derstand the forces that shape resource allocation de-cisions within district offi ces and schools. With fund-ing from the three foundations, the research initiative, Deregulating School Aid in California (DSAC), sought to answer a set of core questions related to the imple-mentation of the Tier 3 reform. Our research team also asked questions that could improve the implementa-tion of the Tier 3 initiative and the persisting discus-sion, both in California and nationwide, over how to balance state-level spending priorities with greater lo-cal control over school dollars. Th e study’s specifi c re-search questions include:
1. What did district leaders do with the newly fl exible Tier 3 funds?
2. How did district leaders make these allocation deci-sions and who was involved in decision-making?
3. What were the reported local consequences of these allocation decisions?
4. What prior conditions and concurrent factors shaped budget decisions of district leaders?
5. How did federal Title I stimulus funds under the American Recovery and Reinvestment Act (ARRA) interact with decisions about Tier 3 fl exibility?
6. What are the statewide revenue and expenditure patterns for Tier 3 and stimulus funds?
2 DEREGULATING SCHOOL AID IN CALIFORNIA
a. Which kinds of districts, schools, and students benefi t most from the fl ow of deregulated Tier 3 categorical aid and federal stimulus dollars?
b. Do districts (and schools) with larger shares of Tier 3 aid and federal stimulus funding (as frac-tions of their overall budgets) spend relatively more on instruction and teaching staff , compared with those that benefi t less from these sources?
Th is report addresses the fi rst fi ve research questions. Th e sixth question is informed by our initial report re-leased in December 2010, detailing statewide revenue and spending patterns related to Tier 3 and stimulus dollars (Imazeki, 2011). Th e present report describes what we discovered on the basis of interviews conduct-ed in 10 districts over the fi rst half of 2010. Building on the fi ndings from these reports, a third report will describe fi ndings from a statewide survey of district leaders.
In addition, this report details how district leaders, principals, and local stakeholders across the 10 diverse districts interpreted and responded to the Tier 3 re-form. Th e story that we heard speaks to how district leaders aimed to cover cuts in their overall budget, bal-ance the general fund, and pursue aff ordable priorities that could be sustained with remaining state categori-cal aid and federal Title I dollars.
Th e study will not address one bottom-line question: to what extent are Tier 3 categorical-aid dollars spent eff ectively? Ideally, policymakers would learn whether local decision-making leads to more cost-eff ective al-locations of state education funds. Aft er all, this is the policy theory advanced by advocates of fi scal deregu-lation. Sacramento policymakers do occasionally sup-port research about the impact of major programs on schools and students, including class-size reduction and targeted funding for low-achieving students or
schools (Harr, Parrish, Socias, & Gubbins, 2007; O’Day & Bitter, 2003; Stecher & Bohrnstedt, 2000). But little evidence exists to clarify whether budget allocations made by district leaders result in stronger outcomes for pupils, compared with the allocation decisions made by Sacramento policymakers. Th is question is beyond the scope of the present study.
Methods
As detailed in Section 3, we employed qualitative methods to understand how district and school lead-ers were interpreting and responding to fi scal deregu-lation. First, in the spring of the 2009-10 school-year, we conducted more than ninety in-depth interviews with district, school, and community leaders in 10 case study districts. Th ese districts were selected to pro-vide variation across four key variables: relative fi scal health, district size, concentration of administrative staff in the central offi ce, and geographic location. Th e interviews, together with the tracking of categorical-aid budgets and other documents, yield a deep look into allocation decisions, the players and dynamics of the decision-making process, the reported eff ects and factors aff ecting decisions around newly fl exible Tier 3 funds.
Second, from mid-September to early October of 2010, we conducted twelve interviews with legislative staff members and leaders of state education associa-tions who were either involved in the design of the Tier 3 reform, or have been historically infl uential in school fi nance policy. Th ese interviews helped to illu-minate the elements of the Tier 3 reform, the multiple rationales advanced, and the prevailing views of early implementation.
Note that the sample of 10 districts was not randomly selected nor selected to be representative of all Cali-fornia districts. Th e fi ndings detailed in this report cannot be generalized to the state. Th ey do however
3DEREGULATING SCHOOL AID IN CALIFORNIA
highlight variability in district responses to fi scal fl exi-bility, identifying shared patterns, and pointing to local conditions that drive decision-making. Th e statewide survey of district leaders planned for 2011 will yield generalizable evidence.
Organization of the Report
In Section 2, we provide some historical context for Tier 3 reform by describing previous eff orts by the legislature to balance state-level priorities with local fl exibility. We then describe our research methods in Section 3, including how we sampled diverse districts, conducted in-depth interviews with district leaders and other local actors, and tracked spending trends in these districts. Section 4 reports how districts in-terpreted Tier 3 fl exibility and allocated these newly fl exible funds. We then provide information about dis-tricts’ decision-making processes in Section 5, along with the reported consequences of the actions taken by district leaders in Section 6. Next we analyze in depth the factors and conditions explaining overall patterns observed in district responses to the confl uence of eco-nomic and fi scal events in Section 7. We conclude in Section 8 with a summary of fi ndings, implications for refi ning policy around deregulation, and the next steps in our overall study.

4 DEREGULATING SCHOOL AID IN CALIFORNIA
Section 2Situating Fiscal Deregulation andTier 3 Flexibility: Multiple Policy Aims in Tough Economic Times
This section includes a brief history of prior ef-forts to deregulate or simplify school fi nance in California, the rationale for this most recent
episode, how the Tier 3 reform fi ts into the wider poli-cy conversation around fi scal decentralization, and the strained economic context into which Tier 3 fl exibility was enacted.
A Persisting Debate: State Interests and Local Flexibility
Consolidating two-thirds of all categorical-aid pro-grams (representing 6 percent of all state education funding) into Tier 3 funds stemmed, in part, from the four-decade-old debate over the extent to which Sacra-mento should tie dollars and rules to certain categories of students or reforms.3 On the one hand, state-level policymakers, eager to raise student achievement, ar-gue that shared statewide interests are expressed when they earmark dollars to serve particular students or reform models. Policymakers create programs to lift students with disabilities, gift ed students, or those fall-ing behind in reading profi ciency. Over the years, Sac-ramento policymakers have regulated program eff orts to provide adequate numbers of textbooks that are aligned with standards, reduce class sizes, and expand preschool and aft er-school eff orts. Each well-meaning program is founded on the assumption that targeting dollars from the state level will yield stronger, more eq-uitable results for California’s students than allowing local school boards to make these allocation decisions.
Th e competing argument is that district or school-level educators are better positioned to understand the bar-riers that constrain student performance and can thus
target dollars to address these local problems. Th ese advocates of deregulation emphasize that administra-tive staff could be reduced in Sacramento, and state education authorities could move away from their fo-cus on compliance to helping districts improve their instructional programs. Defenders of state-craft ed cat-egorical aid push back arguing that without protected dollars for low-achieving students or specifi c reform models, local teacher unions will lobby for more cash on the bargaining table and ignore reform eff orts.
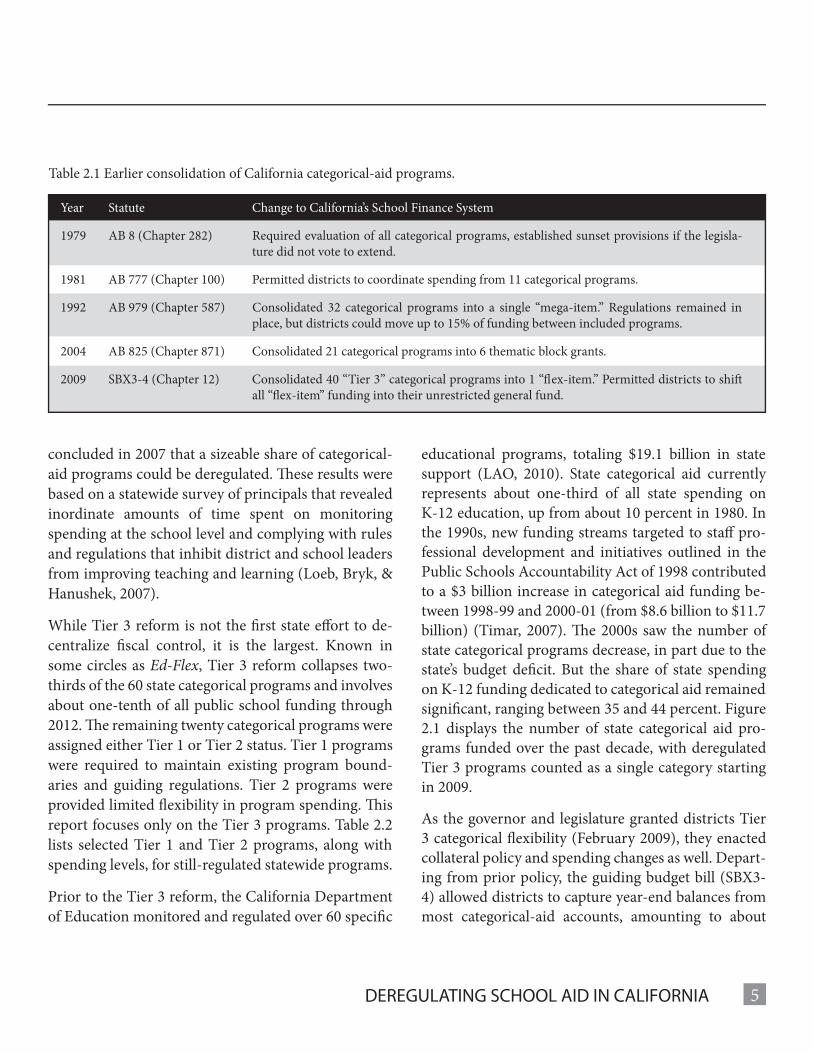
Th e Tier 3 reform (SBX3-4; Chapter 12, Statutes of 2009) enacted in 2009 was not the fi rst time that Sac-ramento deregulated certain categorical-aid programs, granting districts greater fi scal control. Table 2.1 de-tails earlier instances, fi rst enacted by the legislature a decade aft er state and federal policymakers began to target dollars and rules on specifi c categories of stu-dents or reform strategies in the 1960s. Between 1980 and 2000, state categorical aid per pupil increased by 165 percent, while discretionary dollars per pupil shrank by almost eight percent (Timar, 2007). Assem-bly Bill 825 in 2004 consolidated thematically related programs, those relating to teacher preparation and in-service development, into unifi ed, less-regulated block grants. Th is slightly decreased the categorical share of state spending on K-12 education.
A variety of analysts and groups have urged moving the pendulum back toward local fi scal control. Over the past two decades the legislature’s budget analyst has recommended greater fl exibility for local school boards and asserted that such eff orts would not weak-en state-level budget priorities (Legislative Analyst’s Offi ce, 1993; 2004). Rhetoric in Sacramento has grown louder over moving the state Department of Educa-tion away from a “compliance mentality” toward an approach that encourages districts to focus on improv-ing instruction and lift ing test scores. Th e Stanford University-led Getting Down to Facts investigation
5DEREGULATING SCHOOL AID IN CALIFORNIA
concluded in 2007 that a sizeable share of categorical-aid programs could be deregulated. Th ese results were based on a statewide survey of principals that revealed inordinate amounts of time spent on monitoring spending at the school level and complying with rules and regulations that inhibit district and school leaders from improving teaching and learning (Loeb, Bryk, & Hanushek, 2007).
While Tier 3 reform is not the fi rst state eff ort to de-centralize fi scal control, it is the largest. Known in some circles as Ed-Flex, Tier 3 reform collapses two-thirds of the 60 state categorical programs and involves about one-tenth of all public school funding through 2012. Th e remaining twenty categorical programs were assigned either Tier 1 or Tier 2 status. Tier 1 programs were required to maintain existing program bound-aries and guiding regulations. Tier 2 programs were provided limited fl exibility in program spending. Th is report focuses only on the Tier 3 programs. Table 2.2 lists selected Tier 1 and Tier 2 programs, along with spending levels, for still-regulated statewide programs.
Prior to the Tier 3 reform, the California Department of Education monitored and regulated over 60 specifi c
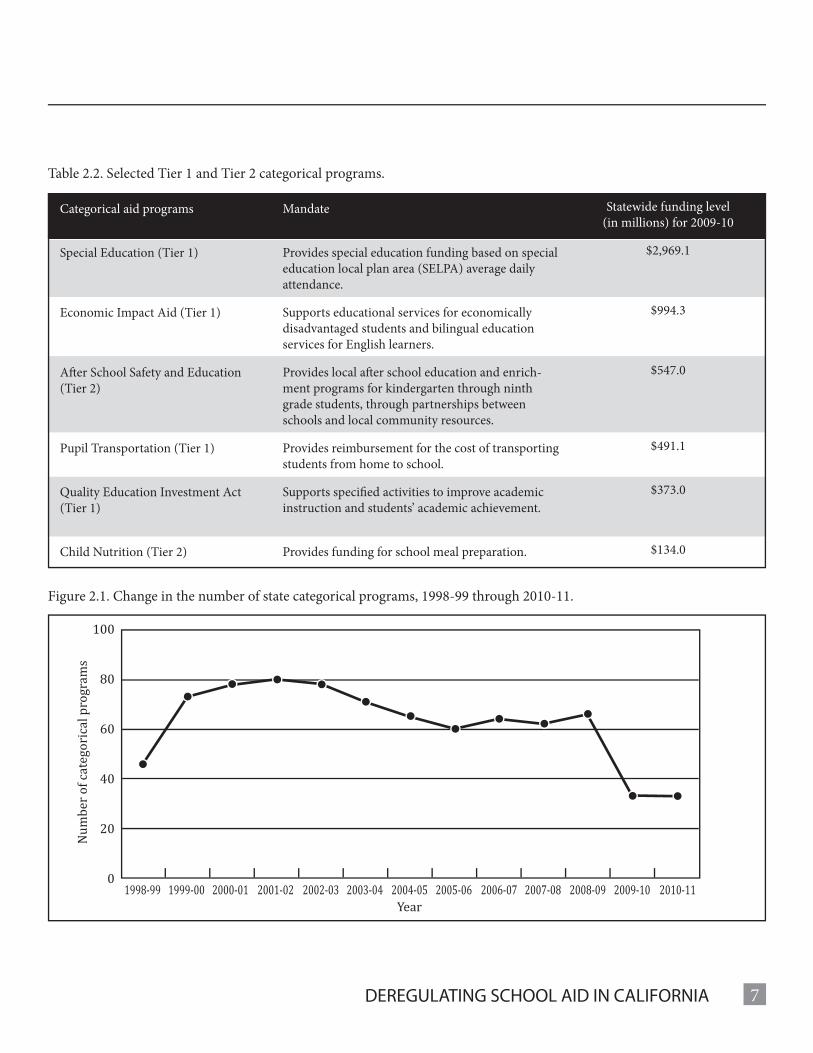
educational programs, totaling $19.1 billion in state support (LAO, 2010). State categorical aid currently represents about one-third of all state spending on K-12 education, up from about 10 percent in 1980. In the 1990s, new funding streams targeted to staff pro-fessional development and initiatives outlined in the Public Schools Accountability Act of 1998 contributed to a $3 billion increase in categorical aid funding be-tween 1998-99 and 2000-01 (from $8.6 billion to $11.7 billion) (Timar, 2007). Th e 2000s saw the number of state categorical programs decrease, in part due to the state’s budget defi cit. But the share of state spending on K-12 funding dedicated to categorical aid remained signifi cant, ranging between 35 and 44 percent. Figure 2.1 displays the number of state categorical aid pro-grams funded over the past decade, with deregulated Tier 3 programs counted as a single category starting in 2009.
As the governor and legislature granted districts Tier 3 categorical fl exibility (February 2009), they enacted collateral policy and spending changes as well. Depart-ing from prior policy, the guiding budget bill (SBX3-4) allowed districts to capture year-end balances from most categorical-aid accounts, amounting to about
Table 2.1 Earlier consolidation of California categorical-aid programs.
Year Statute Change to California’s School Finance System
1979 AB 8 (Chapter 282) Required evaluation of all categorical programs, established sunset provisions if the legisla-ture did not vote to extend.
1981 AB 777 (Chapter 100) Permitted districts to coordinate spending from 11 categorical programs.
1992 AB 979 (Chapter 587) Consolidated 32 categorical programs into a single “mega-item.” Regulations remained in place, but districts could move up to 15% of funding between included programs.
2004 AB 825 (Chapter 871) Consolidated 21 categorical programs into 6 thematic block grants.
2009 SBX3-4 (Chapter 12) Consolidated 40 “Tier 3” categorical programs into 1 “fl ex-item.” Permitted districts to shift all “fl ex-item” funding into their unrestricted general fund.
6 DEREGULATING SCHOOL AID IN CALIFORNIA
$2.2 billion, and to use these dollars in any way they saw fi t. In addition, when Sacramento pared back spending on Tier 3 programs by 20 percent, policymakers lift ed accompanying mandates, such as the earlier schedule for buying new textbooks. Th e elimination of up to fi ve days of the school-year and the reduction in cash reserves were also permitted under the 2008-09 fi scal deregulation policies.
Th e Tier 3 Reform and Multiple Policy Aims
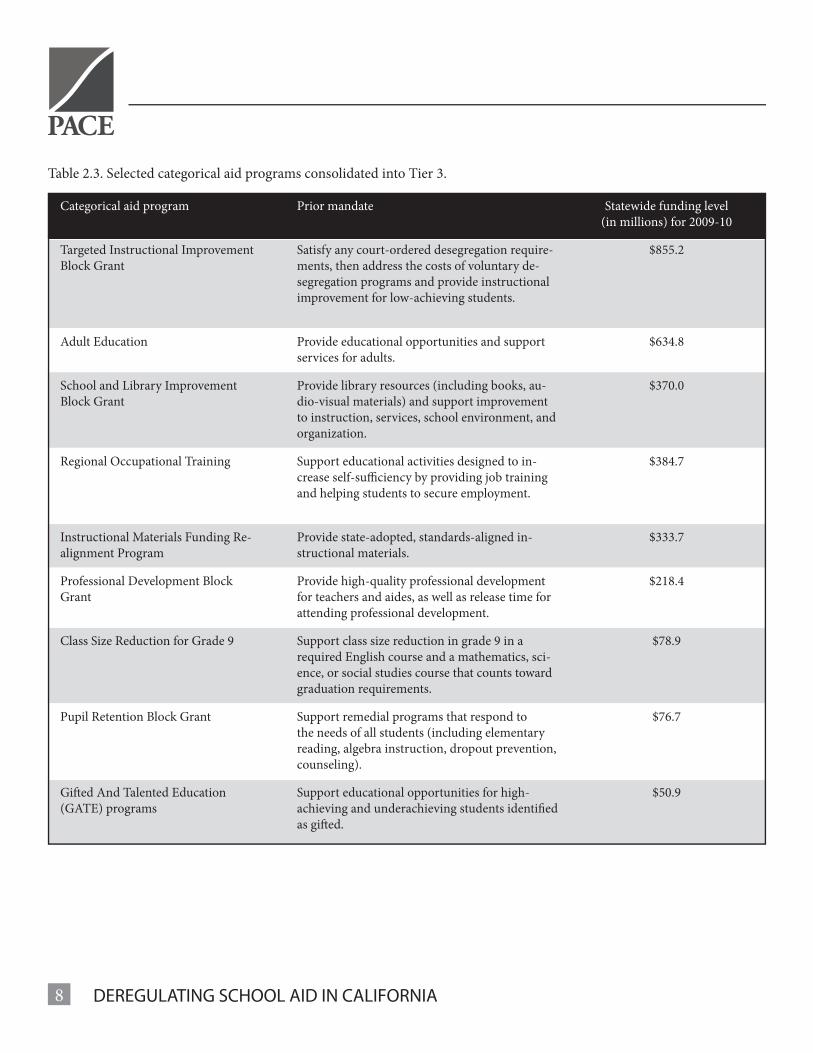
Before the Tier 3 programs were granted fl exibility they were quite variable in purpose, scope, and spend-ing level. A sampling of the earlier programs appears in Table 2.3. Th ey ranged from sizeable initiatives, such as the $1.1 billion Targeted Instructional Materials Block Grant and $800 million for adult education courses, to smaller yet signifi cant eff orts, including dollars ear-marked for Gift ed and Talented Education (GATE) programs. Overall, the policy leaders we interviewed could identify no common underlying purpose or cri-teria for consolidating the 40 programs included in Tier 3. Some of these programs were also smaller block grants, consolidated under earlier legislation. (See Ap-pendix A for a full list of the Tier 3 programs and fund-ing levels.)
As we interviewed legislative staff and education as-sociation leaders in Sacramento, we heard of several policy aims tied to the Tier 3 reform (see box 2.1 for summary). Political expediency was certainly at play as the governor and legislative leaders scrambled to craft a mid-year budget fi x in early 2009. According to some, the governor and Republican leaders aimed to advance local fl exibility in exchange for supporting a new budget plan. Other respondents suggested that policymakers expressed additional motivations via the Tier 3 reform. Many reported that the fl exibility result-ing from the Tier 3 reform was not a direct attempt by policymakers to extend districts’ autonomy over bud-
gets. Instead, fl exibility helped districts survive fi nan-cially in the face of ongoing budget cuts and reduce staff more quickly mid-year, for example, by cutting adult education programs.
Other Sacramento policy leaders argued that Tier 3 cuts and fl exibility facilitated administrative savings by allowing districts to eliminate compliance functions and staff . Collateral elimination of textbook adoption requirements gave districts one place to save money, and move these dollars into the general fund. We also heard that the sharp cuts in Tier 3 programs served to protect basic revenue limits (foundation funding for all districts) from taking an even bigger budgetary reduction. Recognizing these competing policy aims may help to explain the ways in which district leaders have come to understand and utilize their newly found fl exibility under the Tier 3 reform.
No policy leader that we interviewed in Sacramento viewed the Tier 3 reform as a carefully craft ed experi-ment in fi scal decentralization. Instead, our interviews suggest that this policy was put together quickly, large-ly within the governor’s offi ce, with little input via nor-mal legislative hearings or public vetting. Perhaps as a result, the programs placed into the Tier 3 bundle are not conceptually related. Regardless of the motivation and the process, with the passage of SBX3-4 the gov-ernor and legislature set in motion the deregulation of $4.5 billion in previously regulated categorical aid.
Th e DSAC study aims to outline which local districts benefi t from this funding, how district leaders and lo-cal stakeholders responded to new-found fl exibility under stringent fi scal conditions, and what were the reported eff ects on programs and schools.
Economic and Policy Context
Th e debate over how to allocate education dollars more eff ectively—and which level of government is best po-
7DEREGULATING SCHOOL AID IN CALIFORNIA
Table 2.2. Selected Tier 1 and Tier 2 categorical programs.
Figure 2.1. Change in the number of state categorical programs, 1998-99 through 2010-11.
Categorical aid programs
Special Education (Tier 1)
Economic Impact Aid (Tier 1)
Aft er School Safety and Education (Tier 2)
Pupil Transportation (Tier 1)
Quality Education Investment Act (Tier 1)
Child Nutrition (Tier 2)
Mandate
Provides special education funding based on special education local plan area (SELPA) average daily attendance.
Supports educational services for economically disadvantaged students and bilingual education services for English learners.
Provides local aft er school education and enrich-ment programs for kindergarten through ninth grade students, through partnerships between schools and local community resources.
Provides reimbursement for the cost of transporting students from home to school.
Supports specifi ed activities to improve academic instruction and students’ academic achievement.
Provides funding for school meal preparation.
Statewide funding level(in millions) for 2009-10
$2,969.1
$994.3
$547.0
$491.1
$373.0
$134.0
100
80
60
40
20
01998-99 1999-00 2000-01 2001-02 2002-03 2003-04 2004-05
Year
Nu
mb
er
of
cate
go
rica
l p
rog
ram
s
2005-06 2006-07 2007-08 2008-09 2009-10 2010-11
8 DEREGULATING SCHOOL AID IN CALIFORNIA
Table 2.3. Selected categorical aid programs consolidated into Tier 3.
Categorical aid program
Targeted Instructional Improvement Block Grant
Adult Education
School and Library Improvement Block Grant
Regional Occupational Training
Instructional Materials Funding Re-alignment Program
Professional Development Block Grant
Class Size Reduction for Grade 9
Pupil Retention Block Grant
Gift ed And Talented Education (GATE) programs
Prior mandate
Satisfy any court-ordered desegregation require-ments, then address the costs of voluntary de-segregation programs and provide instructional improvement for low-achieving students.
Provide educational opportunities and support services for adults.
Provide library resources (including books, au-dio-visual materials) and support improvement to instruction, services, school environment, and organization.
Support educational activities designed to in-crease self-suffi ciency by providing job training and helping students to secure employment.
Provide state-adopted, standards-aligned in-structional materials.
Provide high-quality professional development for teachers and aides, as well as release time for attending professional development.
Support class size reduction in grade 9 in a required English course and a mathematics, sci-ence, or social studies course that counts toward graduation requirements.
Support remedial programs that respond to the needs of all students (including elementary reading, algebra instruction, dropout prevention, counseling).
Support educational opportunities for high- achieving and underachieving students identifi ed as gift ed.
Statewide funding level(in millions) for 2009-10
$855.2
$634.8
$370.0
$384.7
$333.7
$218.4
$78.9
$76.7
$50.9
9DEREGULATING SCHOOL AID IN CALIFORNIA
sitioned to make these decisions—has grown more heated as larger shares of fi nancing have come from the federal and state governments rather than from lo-cal property tax revenue. Just one-fourth of total school funding in California now comes from local property taxes. Another seven to eight percent comes from a va-riety of parcel taxes and local fees (EdSource, 2009). Furthermore, only the legislature and governor can raise or lower the “revenue limit” of any local school district under the constraints set by the state Supreme Court’s Serrano decision in 1972. Contemporary con-textual forces further contribute to the fi scal decentral-ization debate, starting with the declining capacity of state government to fund and to regulate the panoply of existing education programs. Th e fact that Califor-nia’s school fi nance system is “impossible to compre-hend,” even among policy analysts and scholars (Rose, Sonstelie, & Weston, 2010), further complicates eff orts to change the allocation of resources.
Economic recession, declining state revenues. Th e Tier 3 reform was approved in February 2009 aft er Califor-nia’s economy had been in recession for two full years. Th e state’s jobless rate, which stood at a seasonally ad-justed fi ve percent in March of 2007, rose to 12 percent by November of 2009. As economic activity fl agged statewide, tax revenues coming to Sacramento also fell precipitously. In 2007, Sacramento’s general fund spending level reached a high mark of $103 billion in yearly outlays. Th is fell to $86 billion in the 2009-10 fi scal year. Th e home mortgage crisis further depressed the assessed value of residential property, limiting the portion of resources generated for schools via local property taxes.
Deregulating as budget cuts mount. Th e Tier 3 reform came midway through a second year of sharp cut-backs in state support of public schools. State and lo-cal spending on local schools during the 2010-11 fi scal year will be 12 to 18 percent below appropriation levels in 2007-08 (depending on assumptions about infl ation adjustments and how federal stimulus dollars are fac-tored in). Figure 2.2 shows historical state spending on schools. Signifi cant increases were made between 2001-02 and 2006-07. But as the recession hit Califor-nia, spending dropped by almost one-quarter in one year. During the same period displayed in Figure 2.2, enrollments in elementary and secondary schools grew to a mid-decade high of 6.3 million, falling toward 6.2 million in 2009-10.
Such was the dismal fi scal climate facing the state in 2009. In the middle of the fi scal year, school district leaders were again struggling to balance their budgets and minimize teacher layoff s.
Infl ux of federal stimulus dollars. Th e Tier 3 reform occurred at the very moment that new federal stimulus dollars arrived to backfi ll the deteriorating fi scal condi-tion of California’s schools. New resources included al-
Box 2.1 – Sacramento policy leaders advance multiple aims for fi scal deregulation
Political expediency. Fiscal decentralization has been a longstanding Republican goal, so reducing Sacramento’s centralized control over local education helped deliver the votes needed to pass the budget. To reduce pushback from some constituencies, categorical programs perceived to be politically strong were excluded from Tier 3.
District fi scal survival. Fiscal decentralization provided new options to local districts facing further budget cuts. Freeing up categorical aid was intended to help districts remain solvent, and facilitate mid-year staffi ng cuts.
Administrative savings. Fiscal decentralization meant that compliance and oversight functions could be eliminated at the district and state level. Cuts to categorical aid, described as anticipated administrative savings, helped close the gap in the state budget.
10 DEREGULATING SCHOOL AID IN CALIFORNIA
most $5 billion in economic stabilization funds, which the governor and legislature folded into the basic (rev-enue limit) allocations to districts. In addition, Wash-ington earmarked about $1.1 billion in new compen-satory education Title I dollars for California schools, and $1.3 million for special education programs.
As with all the stimulus funding, Washington policy-makers urged school districts to spend Title I funds quickly to preserve and create jobs. But the Title I guidelines from Washington also pushed district lead-ers to improve student achievement under the federal accountability law, ensuring transparency and school investments that avoid a “funding cliff ” when these dollars run out (U.S. Department of Education, 2009). Districts were asked both to invest Title I dollars in im-proving instruction and to make those choices quickly, with a focus on one-time expenditures. In general, dis-tricts are prohibited from using Title I dollars to fund instructional activities otherwise paid for by state or
Figure 2.2. California spending on K-12 education, 2001-2011 (in billions of infl ation-adjusted 2010 dollars).
$45
$40
$35
$30
$252001-02 2002-03 2003-04 2004-05 2005-06 2006-07 2007-08 2008-09 2009-10 2010-11
Year
local funds. Yet due to budget cuts, early reports sug-gest that many districts planned to use these dollars to retain programs and staff (Rebell, Wolfe, & Yaverbaum, 2010; U.S. Government Accountability Offi ce, 2009).
Th us, Tier 3 fl exibility was enacted in a volatile fi nan-cial context. District revenues had been declining for almost three years, and further cuts were coming from Sacramento. At the same time, a sudden infl ux of one-time federal stimulus dollars off ered signifi cant relief for district leaders and local schools.
How Deregulation is Supposed to Work: Policy Th e-ory and Early Research
A variety of policy theories have been used to sup-port deregulation, although the empirical evidence on implementation and eff ects of fi scal fl exibility remains limited, especially within the California context. Since Tier 3 fl exibility was not designed around a clear policy strategy, reviewing these various arguments regarding
11DEREGULATING SCHOOL AID IN CALIFORNIA
fi scal fl exibility helps us understand how the leaders in 10 districts adapted to this sudden fl exibility and how the Tier 3 approach might be improved over time.
Early architects of standards-based accountability argued that central governments (state capitals and Washington, D.C.) should focus on setting common learning aims and demanding academic standards, and then let local educators allocate resources in ways that advance teacher quality and student performance (Smith & O’Day, 1991). Many advocates argue that greater local fl exibility within a strong accountabil-ity framework will allow district and school leaders to move resources toward innovative eff orts aimed at enriching teaching and student engagement (Goertz & Stiefel, 1998; Ladd, 1996; Loeb & Strunk, 2007). For example, several scholars and urban school leaders argue that educators inside schools will be unable to allocate resources effi ciently (including hiring and fi r-ing teachers) without such decentralizing of authority (e.g., Ouchi, 2009).
From a related angle, proponents of charter schools and vouchers argue that allowing public dollars to sim-ply follow the school selections made by parents will set market dynamics in motion that raise the quality of schools in order to attract additional students and families (Chubb & Moe, 1990). For advocates of both perspectives, categorical aid and commensurate regu-lations constrain resource allocation inside districts and schools.
Some decentralization advocates argue that school principals are the best decision-makers when it comes to allocating resources. Ouchi (2009), for instance, ar-gues that granting principals discretion over budgets and teaching posts leads to larger shares of dollars go-ing to instruction and incentivizes more professional roles for teachers. When district managers allocate teaching posts and dollars and states closely regulate
how categorical dollars can be spent, the principal has little fl exibility in lift ing instructional quality, ac-cording to Ouchi and allied advocates. Ouchi’s study of districts that move resources through weighted-stu-dent formulae suggests that when granted budgetary control, principals work to reduce the count of stu-dents teachers face each day. Th is helps to personalize the school environment and opens time for planning among teachers.
But decentralization of authority alone may not neces-sarily lift teaching practices and student learning. Th e accumulating evidence on schools operating within partially deregulated markets, especially evidence of achievement eff ects, remains mixed (Fuller, 2009). De-centralization, and more specifi cally deregulation of categorical aid, may also bring associated equity risks. For example, the fl ow of $4.7 billion in categorical aid (in the newly fl exible Tier 3 funding) may increase disparities between schools in per pupil funding, hav-ing the opposite eff ect of the Serrano v. Priest decision, which dramatically equalized non-categorical spend-ing. By opening up local political dynamics, where deregulated education dollars are now up for grabs within districts, more advantaged parents or stronger interests may wrestle resources from weaker groups.
Still, fi nancing schools through centrally regulated cat-egorical aid does not ensure eff ective resource alloca-tion, directing dollars to school-level eff orts that best elevate student achievement. Overall, the document-ed eff ects of earmarking dollars for smaller classes in grades K-3 in California have been disappointing. Th e jury is still out on whether smaller classes benefi t stu-dents in low-performing schools (currently being tried under another categorical-aid program, the Quality Education Investment Act). Long-term success has yet to result from additional resources targeted to low-performing schools, such as through the state’s Imme-diate Intervention Underperforming Schools Program
12 DEREGULATING SCHOOL AID IN CALIFORNIA
and the High Priority Schools Grant Program, imple-mented over the past decade (Harr, Parrish, Socias, & Gubbins, 2007; O’Day & Bitter, 2003). Proponents of decentralization argue that long-standing categorical programs, regulated from Sacramento, are not neces-sarily more eff ective than activities craft ed by district leaders. Decentralizing fi scal controls may create the conditions under which instructional improvements are more likely to occur, according to this position.
Categorical-aid programs at least manifest expressed goals and oft en means for raising student achieve-ment—and at times have been carefully evaluated. But these oft en narrowly targeted funding streams build upon arcane funding formula that very few individuals understand in the state capital. Centralizing how Sac-ramento funds schools has failed to simplify funding or to benefi t lower achieving students. So, the policy discussion over how to balance statewide priorities with local discretion intersects the question of how school fi nance can become transparent and easy to un-derstand.
Empirical Evidence on Fiscal Decentralization
What is known about the implementation and benefi ts of decentralizing control over education budgets? And how might prior California eff orts inform our under-standing of how district leaders and local stakeholders respond to deregulation? We turn next to these ques-tions.
Federal eff orts at categorical fl exibility. Responding to criticism over its compliance focus, the federal gov-ernment revised its Title I program in 1988, aiming to encourage states and districts to devise more inno-vative and school-wide Title I programs, rather than simply pulling low-achieving students out of regular classroom instruction for special tutoring (Cross & Roza, 2010). Th is revision to Title I gave schools serv-ing largely low-income students greater latitude in
how Title I compensatory education dollars could be spent, no longer requiring that resources be restricted to eligible children only. Evaluation studies reported that resource allocation patterns did change in sites that were among the fi rst to adopt the school-wide ap-proach (Schenk & Beckstrom, 1993; Wong & Meyer, 1998). Concerns were raised that the resulting consoli-dation eased administrative complexity but were rare-ly founded upon a clear, sustainable eff ort to improve instruction. Greater numbers of schools adopted the school-wide program aft er requirements were further revised in the mid-1990s (U.S. Department of Educa-tion, 2001).
Th e federal Department of Education enacted its own eff ort to deregulate categorical aid in 1998—also dubbed, Ed-Flex. It allowed states even greater dis-cretion over how they utilized Title I compensatory education dollars. Th e U.S. Department of Education would waive regulations on federal funding streams if participating states agreed to weave together similarly regulated state categorical aid. But few states took up this off er of fl exibility, and some analysts argued that it never became clear how added state-level discretion would lead to more eff ective school-level allocations (Cross & Rosa, 2010). Still, one national evaluation found that school principals and site councils reported that the fl exibility allowed them to align Title I dollars with their school’s own strategy for improving student achievement (Raphael & McKay, 2001).
Student-weighted fi nancing of schools. A number of states and districts have initiated an alternative model of fi scal fl exibility in which funding is allocated to dis-tricts or schools based on student enrollment weighted by the specifi c attributes of individual pupils. Th is pol-icy greatly simplifi es funding and, in theory, it encour-ages districts to serve more needy, and hence more costly, students. Oklahoma, for instance, allocates state dollars to districts based on enrollment levels,
13DEREGULATING SCHOOL AID IN CALIFORNIA
but individual pupils are weighted in the enrollment count based on an estimate of the additional costs re-quired to serve them, including heavier weights for preschool-age children and special education pupils. Ouchi (2009) details how weighted-student formulae, advanced by states or districts, yields greater discretion to principals over cash aid and, occasionally, teaching positions.
Two California districts, Oakland and San Francisco Unifi ed, implemented versions of weighted-student funding and site-based decision-making in the mid-2000s. A mixed-methods study found that district and school leaders in the two districts had a relatively high level of satisfaction with their student-weighted fund-ing policies (Chambers, Shambaugh, Levin, Muraki, & Poland, 2008). School leaders reported using their ex-panded discretion to hire additional teachers to reduce class size or support English-learner students, add aca-demic support positions, increase certain useful part-time staff to full-time status, and in some cases, reduce or eliminate non-teaching positions. Some site leaders reported being able to better support their academic planning as a result of the increased transparency in how schools receive funding. Analyses of district-wide expenditures suggest the student-weighted funding policies (along with additional district resource allo-cation practices) helped strengthen the link between per-pupil spending and student poverty. Th is work continues in three districts—Los Angeles, Pasadena, and Twin Rivers —where the weighted-student formu-la approach to school-level budget decision-making is being advanced and studied carefully.4
Principals and school-site councils. An older model of fi scal decentralization involves the creation of school site councils to advise principals on how to allocate diff ering sources of categorical aid. Th is organiza-tional innovation appeared fi rst in the 1960s when the U.S. Department of Education began allocating Title
I dollars to schools via district offi ces. Th is approach sought to ensure that principals shared decision-mak-ing about federal categorical resources with teachers, parents, and community members. Granting school site councils authority over categorical aid budgeting was intended to help schools customize how they used categorical resources, while creating accountability for spending choices. But in spite of the widespread pres-ence of site councils, along with state and federal fund-ing for them, evidence of more eff ective resource allo-cation remains scarce (Malen & Ogawa, 1988).
California created site councils and school-level bud-geting with the School Improvement Program (SIP) in the 1970s. SIP awarded state discretionary dollars to schools, which, as with Title I, were required to form a site council in order to receive and allocate funds. Early evaluation evidence suggested that the issues taken up by site councils, the relevance to instructional improvement, and the extent to which data were uti-lized to make allocation decisions varied greatly across schools and districts (Berman Weiler Associates, 1984; Fuller & Izu, 1982).5
Th ese diff erent models of fi scal decentralization diff er along key dimensions, including the extent to which:
• State policymakers set clear priorities, such as main-taining a focus on certain types of students or pro-gram models, but then let district leaders or site councils set priorities among constrained options;
• School-level leaders enjoy fi scal fl exibility, or wheth-er discretion is vested in the district offi ce but not in principals or site councils; and
• State-level actors deregulate the fl ow of revenues alone, or attempt to build the capacity and data that allows district or school-level leaders to eff ectively allocate dollars in a more informed manner.
14 DEREGULATING SCHOOL AID IN CALIFORNIA
Competing Hypotheses: How will districts or schools respond to fi scal decentralization?
Taking context into account—Sacramento’s multiple policy aims, earlier attempts to decentralize fi scal au-thority, and prior research—several competing hy-potheses emerge as to how district leaders and local stakeholders might respond to the Tier 3 reform. Th ese predictions help to frame the DSAC study and our em-pirical research questions.
• Local school boards and district leaders would sweep deregulated Tier 3 dollars into the general fund to remain fi nancially solvent;
• District leaders would retain some Tier 3 programs, while reassessing budget priorities under variably intense fi scal pressure;
• More focused investments on instruction would emerge, as district leaders respond more fl exibly to local needs and accountability demands;
• School-level capacity to build strong teams of teach-ers and advance reform would be expanded;
• Disparities among districts, schools, or student groups would widen because more vocal, organized constituencies gain a greater share of resources.
With these hypotheses in mind, our study team set out to examine the ways in which 10 districts interpreted and implemented the Tier 3 reform. Next, we describe our research methods in greater detail.
15DEREGULATING SCHOOL AID IN CALIFORNIA
Section 3Methodology and Description of Case Districts
This section details the methodology used for conducting interviews and tracking basic spending trends in the 10 case-study districts.
Th e purpose of the case studies was to help us develop an understanding of the district and school perspec-tive toward Tier 3 fl exibility as the basis for developing a statewide survey. We felt that a sample of 10 districts and twenty schools would be adequate for that pur-pose. In the following sections, we review the research questions, describe the selection and recruitment of the 10 districts, and describe data collection procedures. We also explain the methods we used for analyzing the resulting case data and generating cross-case fi ndings, and present a framework for thinking about the key domains of study. We conclude with an overview of the 10 case districts and their local contexts.
Research Questions
As introduced above, this report details fi ndings that inform the following research questions:
1. What did district leaders do with the newly fl exible Tier 3 funds?
2. How did district leaders make these allocation deci-sions and who was involved?
3. What were the reported consequences of these al-location decisions?
4. What prior conditions and concurrent factors shaped budget decisions of district leaders?
5. How did federal Title I stimulus funds interact with decisions around Tier 3 fl exibility?
District Sample Selection and Recruitment
To inform these questions, we conducted case stud-ies of 10 diverse California school districts. A number of factors guided our selection of these districts. First, practical considerations arose as we considered how to collect in-depth data effi ciently from 10 sites located across California. We limited ourselves to districts in twenty-one counties situated within a two-hour drive from the nearest research center in which our team is based, including Santa Monica, Berkeley, or Davis. Th is decision allowed us to minimize travel expenses and return to sites, as necessary. We excluded districts with fewer than seven schools to ensure we would be able to interview one elementary school principal and one high school principal in each case study district (the potential for principal refusals required multiple schools at each level).
Second, given our study’s focus on Tier 3 programs and federal stimulus funds, we wanted to select districts where interviewees would best be able to speak to these shift s in policy. Consequently we set thresholds for the proportion of revenues that districts obtained from federal funds and Tier 3 aid, and excluded districts below these thresholds from our sampling frame. On average, districts in California received 28 percent of their 2007-08 budgets from all restricted sources, and seven percent from Tier 3 categorical funds. To make sure that selected districts could provide useful infor-mation about using their new fl exibility, when drawing our sample we removed districts in the bottom quartile of percent of budgets coming from Tier 3 categorical funds and the bottom quartile of percent of budgets coming from Title I and IDEA federal funds. Despite this limitation, the districts we selected resembled dis-tricts statewide in terms of restricted funds. On aver-age our sampled districts received 31 percent of their 2007-08 budgets from all restricted sources, ranging from 26 to 43 percent, and 7 percent from Tier 3 cat-
16 DEREGULATING SCHOOL AID IN CALIFORNIA
egorical funds, ranging from 5 to 8 percent. We also excluded basic aid districts (based on 2007-08 status) because their funding situation was diff erent in ways that might aff ect their responses to fl exibility. We only included unifi ed districts, excluding elementary and secondary districts, as a majority of students in Cali-fornia attend school in unifi ed districts.
Aft er these exclusions, we sampled districts that exhib-ited variation across four key variables: fi scal health, centralization (the degree to which decision-making and control over key policy domains such as curricu-lum, instructional time, and budget is centralized in the district offi ce), size, and location. We chose fi scal health, centralization, and size because we hypothe-sized that these variables would likely mediate how dis-tricts responded to changes in fi scal policy. We selected on location (Northern and Southern California) both for practical reasons (our team spanned both regions), and we felt that our fi ndings would be more relevant if our sample accounted for geographical variation. We followed the following operational procedures:
• Fiscal health. Our fi scal health variable was based on three measures: AB 1200 certifi cation (a fi scal accountability law) in 2006-07 and 2007-08, an in-dex of defi cit spending in 2007-08 constructed from Standardized Account Code Structure (SACS) data, and an index of actual reserves relative to required reserves in 2007-08, also using SACS data. If a dis-trict received positive certifi cations in 2006-07 and 2007-08, and was in the top 70 percent of districts for both indices, we labeled it “fi scally healthy.” If a district received a negative certifi cation in either year, or was in the bottom 30 percent of districts for either index, we labeled it “fi scally unhealthy.” All other districts were labeled as “marginal.” In or-der to ensure variation in fi scal health, we excluded marginal districts from the sample and only selected fi scally healthy and fi scally unhealthy districts.
• District centralization. We wanted to select both “centralized” and “decentralized” districts, because we felt that this variable could play an important role in the decisions districts made around Tier 3 and Title I stimulus funding. For example, decen-tralized districts that allow for more site-based de-cision-making might be more apt to pass down Tier 3 fl exibility to schools. A good measure of central-ization, however, was diffi cult to fi nd. We attempted to construct a qualitative measure through discus-sions and informal interviews with state leaders and county offi ces of education, but this approach was time-consuming and the data we received were in-complete and sometimes contradictory. We there-fore decided to use a percentage of a school district’s staff who work in the central offi ce. We called this variable the “central administration ratio.” We as-sumed that districts that are more centralized would have a higher proportion of their employees work-ing as central administrators.
• Size. We aimed to sample large and small districts, so we ranked districts that met the other screening criteria in terms of enrollments and selected incre-mentally from the top and bottom of the list.
• Location. To obtain greater geographic balance, we sought to recruit half of the districts from counties in the north and half in the south.
Recruiting districts proved to be somewhat challeng-ing, given the pressures under which districts were op-erating during the 2009-10 fi scal year, as we entered the fi eld. We contacted approximately 40 districts in order to successfully recruit 10, meaning that about three-fourths of the districts we contacted declined to participate in the study. Th e research team initially sent email invitations to superintendents to participate in the study and followed up both by telephone and email. We did not off er a fi nancial incentive to districts to participate in the study.
17DEREGULATING SCHOOL AID IN CALIFORNIA
We began recruitment in early February 2010 and were able to fi nalize our sample of 10 districts by the end of March. Ultimately we recruited a sample of districts that varied across our primary sampling variables. Of the fi nal 10 districts, fi ve are situated in Northern Cali-fornia and fi ve in Southern California; fi ve are charac-terized as fi scally healthy and fi ve as fi scally unhealthy. Th e central administration ratio ranged from under 5 percent to about 30 percent. Enrollment ranged from under 2,000 pupils to districts with tens of thousands of students. We describe the fi nal sample in greater de-tail at the end of this section.
To ensure anonymity, each of our 10 case study dis-tricts was assigned a pseudonym based on the name of a former Supreme Court justice (see Table 3.1). We have used these pseudonyms in all notes and write-ups and throughout this report. To further protect the identity of the districts we report approximate statis-tics for each district.
Interview Protocols and Data Instruments
To gather a wide range of perspectives on the Tier 3 and collateral fi scal reforms, we attempted to interview fi ve groups of respondents in each district: central of-fi ce staff , school board members, union and associa-tion leaders, community leaders, and site leaders. Th e research team developed a semi-structured interview protocol for each of nine potential roles:
• Superintendent
• Assistant superintendents of business and curricu-lum
• Assistant superintendent of human resources
• Categorical aid director
• School board member
• Union leader
• Parent or community leader
• Adult education administrator
• School principal
Each interview protocol contained a common set of questions as well as some questions tailored to the par-ticular role of the respondent. Questions were designed to capture information on the following domains: dis-trict and community context; interpretation of Tier 3 fl exibility; decision-making related to Tier 3 funds, Title I stimulus funds, and budgeting more broadly; implementation and feedback; and anticipation about fi scal fl exibility in the future. Th e protocol also asked specifi cally about four Tier 3 programs in each district, TIIBG, Professional Development Block Grant, Adult Education, and GATE, in order to compare decision-making about those programs across all districts.
To track Tier 3 spending patterns over a two-year pe-riod we created a budget questionnaire distributed to each of the 10 case-study districts. In the wake of Tier 3 deregulation, the state no longer collects dis-trict spending data for Tier 3 programs through its Standardized Accounting Code System (SACS) so we requested program-specifi c spending numbers from each case district. Th is budget form asked districts to report for 2008-09 and 2009-10 the amount they spent across selected function codes (e.g., instruction, pupil services, administration) and expenditure categories (e.g., teacher and pupil support salaries, books and supplies, professional development) and the number of staff they supported using revenues from the follow-ing categorical programs: Title I overall, Title I Stimu-lus, GATE, Targeted Instructional Improvement Block Grant, the Professional Development Block Grant, and Adult Education.
To understand more deeply how districts responded to particular Tier 3 programs and the factors shaping
18 DEREGULATING SCHOOL AID IN CALIFORNIA
these decisions, we pursued our data collection in two distinct paths. First, to ensure collection of comparable data across all 10 districts, we chose a subset of four Tier 3 programs to investigate. In all districts, we asked in-depth questions about these programs which allowed for detailed comparative analysis. We purposefully se-lected adult education because it generates signifi cant revenues to districts (funded at $635 million statewide in 2009-2010) and historically had considerable politi-cal support. Although not a large source of revenue for districts, GATE was included in this group because it too, historically had considerable political support. We also focused on TIIBG and the Professional Develop-ment Block Grant because, relative to other Tier 3 pro-grams, they are the most relevant to instruction and in theory could be important sources of revenue support-ing district instructional reform eff orts.
Th e second approach used in data collection was to ask open-ended questions to respondents about any Tier 3 programs for which 1) their district made allocation changes, 2) decisions around allocation changes were contested, and 3) fi scal fl exibility was passed down to principals. As expected, answers to these questions generated information about a wide range of Tier 3 programs and not all districts commented on the same set of Tier 3 programs. As a result, our information about these Tier 3 programs does not have comparable information from all 10 districts.
To better understand a broader set of perspectives on the origins, design, and implementation of Tier 3 fl ex-ibility and stimulus funds, we also identifi ed a group of state-level leaders for interviews. We developed a semi-structured protocol with questions regarding: opinions about categorical aid programs in general; opinions about the Tier 3 reform specifi cally; interpretation of Tier 3 policy aims; implementation of Tier 3 regula-tions and Title I stimulus dollars, and consequences of Tier 3 for the organization’s work.
Data Collection
District and school level. All district-level interviews were conducted between April and July, 2010. Nine re-searchers worked in teams of two to three per district. Most interviews were conducted in person during site visits to the central offi ce, whereas most principal in-terviews were conducted over the telephone. Th e ma-jority of respondents were interviewed individually, but in a few cases we interviewed central offi ce staff in groups of three to six at the superintendent’s request. Each respondent was promised confi dentiality, and the interviews were audio-recorded for note-taking pur-poses with the interviewee’s permission.
Table 3.1 indicates the number of interviews we con-ducted by respondent type and district. In total, we interviewed 93 individuals; between six and nine re-spondents were interviewed in each district. We were more successful in recruiting for interviews central offi ce staff , school board members, and school lead-ers than we were in recruiting union, association, and community leaders (as shown in Table 3.1).
Community leaders, who typically served in part-time and voluntary positions, were oft en unresponsive. Union leaders may have been reluctant to participate in the study given strained relationships with district administration. Leaders of statewide teacher associa-tions, however, were readily available and informative.
To understand school-level perspectives, we attempt-ed to interview one elementary and one high school principal, and the chief of adult education in each dis-trict. We interviewed principals independently of the district, contacting them directly by email and phone. We promised principals anonymity, and their schools received a $50 honorarium for participation in the in-terview. We successfully recruited elementary school principals in all 10 districts, and high school principals in nine of the 10 districts.
19DEREGULATING SCHOOL AID IN CALIFORNIA
In selecting principals we only chose those leading “regular” schools, excluding principals of charter and alternative schools, and avoiding magnet school prin-cipals where possible. Given our interest in the aware-ness of principals with regard to Tier 3 fl exibility and the infusion of Title I stimulus dollars, and their pos-sible discretion over evolving categorical aid, we pre-ferred to recruit those who headed school-wide Title I programs. If we were unable to recruit a principal from a school-wide Title I school, we contacted a prin-cipal in a targeted assistance school, and then, if all else failed, a non-Title I school principal. We also took variability in student achievement into account in se-lecting schools within districts. Th is involved recruit-ing principals from schools with relatively high or low API scores. Th us in some districts, we selected a high-performing high school and a low-performing ele-mentary school, whereas in other districts, we selected a low-performing high school and a high-performing elementary school.
Finally, we interviewed adult education directors in only four districts. In most cases we did not contact the director directly, but instead relied on district contacts to schedule these interviews. In some cases the district did not have a full-time director, and in other cases our contacts were unable to coordinate an interview with the administrator.
Moving beyond interview data, we also collected back-ground information from district websites, conduct-ed online searches of news articles, and downloaded quantitative descriptors of each district from the state Department of Education’s website. During our site visits, we collected documents from district offi ces and interviewees regarding demographics and politi-cal developments, budget debates, and media articles regarding teacher layoff s and participation of com-munity leaders or parents. When possible we obtained raw budget data from districts. We also gave our bud-
get questionnaire to a fi scal staff member in each dis-trict who completed it and emailed it back to us at a later date. We asked participating principals for a copy of their 2009-10 Single Plan for Student Achievement.
State level. We conducted 12 interviews with legislative staff ers or education association leaders in September and October 2010. Each Sacramento respondent was either involved in discussing the Tier 3 reform in early 2009 or was involved in the implementation of fi scal fl exibility. Most interviews were conducted in person, individually, or when requested, with two or more rep-resentatives of the legislative offi ce or education orga-nization. Individuals were promised confi dentiality and fi eld notes were taken during the interviews. Th e organizations whose perspectives we investigated in-cluded:
• Association of California School Administrators• California Association of School Business Offi cials• California Council for Adult Education• California Department of Education• California County Superintendents Educational
Services Association• California Teachers Association• Assembly and Senate of the California Legislature• Legislative Analyst’s Offi ce• School Services of California
We used snowball sampling to identify policy leaders and organizations involved in the design or imple-mentation of categorical-aid reform, starting with or-ganizations suggested by our Advisory Committee or by district superintendents. Some organizations with which we pursued formal interviews were represented on our Advisory Committee.
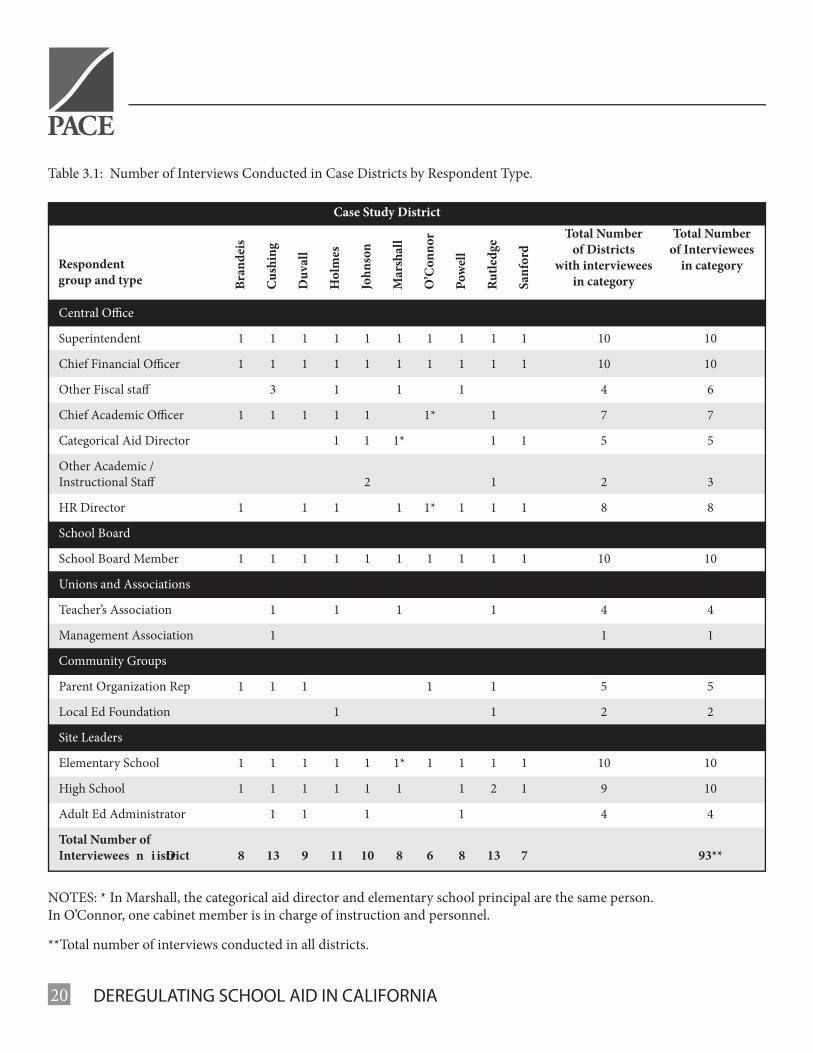
20 DEREGULATING SCHOOL AID IN CALIFORNIA
Table 3.1: Number of Interviews Conducted in Case Districts by Respondent Type.
Central Offi ce
Superintendent 1 1 1 1 1 1 1 1 1 1 10 10
Chief Financial Offi cer 1 1 1 1 1 1 1 1 1 1 10 10
Other Fiscal staff 3 1 1 1 4 6
Chief Academic Offi cer 1 1 1 1 1 1* 1 7 7
Categorical Aid Director 1 1 1* 1 1 5 5
Other Academic /Instructional Staff 2 1 2 3
HR Director 1 1 1 1 1* 1 1 1 8 8
School Board
School Board Member 1 1 1 1 1 1 1 1 1 1 10 10
Unions and Associations
Teacher’s Association 1 1 1 1 4 4
Management Association 1 1 1
Community Groups
Parent Organization Rep 1 1 1 1 1 5 5
Local Ed Foundation 1 1 2 2
Site Leaders
Elementary School 1 1 1 1 1 1* 1 1 1 1 10 10
High School 1 1 1 1 1 1 1 2 1 9 10
Adult Ed Administrator 1 1 1 1 4 4
Total Number ofInterviewees in District 8 13 9 11 10 8 6 8 13 7 93**
NOTES: * In Marshall, the categorical aid director and elementary school principal are the same person.In O’Connor, one cabinet member is in charge of instruction and personnel.
**Total number of interviews conducted in all districts.
Bran
deis
Cush
ing
Duv
all
Hol
mes
John
son
Mar
shal
l
O’C
onno
r
Powe
ll
Rutle
dge
Sanf
ord
Respondentgroup and type
Total Numberof Districts
with intervieweesin category
Total Numberof Interviewees
in category
Case Study District
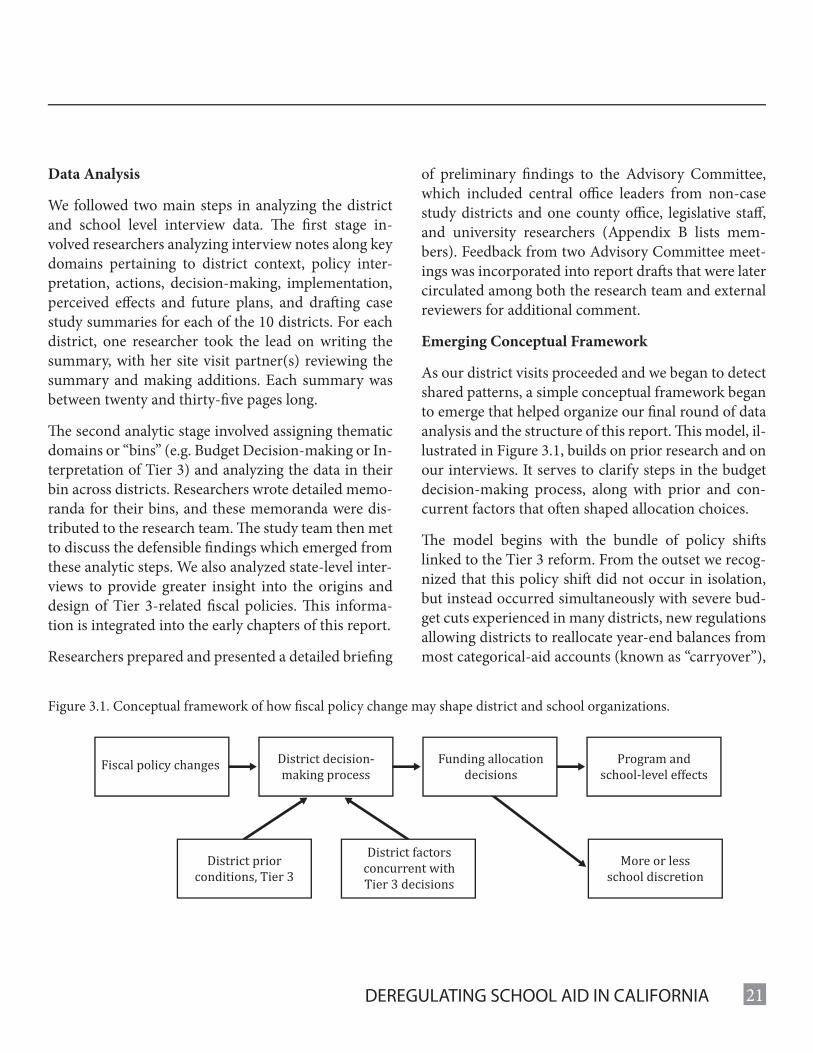
21DEREGULATING SCHOOL AID IN CALIFORNIA
Data Analysis
We followed two main steps in analyzing the district and school level interview data. Th e fi rst stage in-volved researchers analyzing interview notes along key domains pertaining to district context, policy inter-pretation, actions, decision-making, implementation, perceived eff ects and future plans, and draft ing case study summaries for each of the 10 districts. For each district, one researcher took the lead on writing the summary, with her site visit partner(s) reviewing the summary and making additions. Each summary was between twenty and thirty-fi ve pages long.
Th e second analytic stage involved assigning thematic domains or “bins” (e.g. Budget Decision-making or In-terpretation of Tier 3) and analyzing the data in their bin across districts. Researchers wrote detailed memo-randa for their bins, and these memoranda were dis-tributed to the research team. Th e study team then met to discuss the defensible fi ndings which emerged from these analytic steps. We also analyzed state-level inter-views to provide greater insight into the origins and design of Tier 3-related fi scal policies. Th is informa-tion is integrated into the early chapters of this report.
Researchers prepared and presented a detailed briefi ng
of preliminary fi ndings to the Advisory Committee, which included central offi ce leaders from non-case study districts and one county offi ce, legislative staff , and university researchers (Appendix B lists mem-bers). Feedback from two Advisory Committee meet-ings was incorporated into report draft s that were later circulated among both the research team and external reviewers for additional comment.
Emerging Conceptual Framework
As our district visits proceeded and we began to detect shared patterns, a simple conceptual framework began to emerge that helped organize our fi nal round of data analysis and the structure of this report. Th is model, il-lustrated in Figure 3.1, builds on prior research and on our interviews. It serves to clarify steps in the budget decision-making process, along with prior and con-current factors that oft en shaped allocation choices.
Th e model begins with the bundle of policy shift s linked to the Tier 3 reform. From the outset we recog-nized that this policy shift did not occur in isolation, but instead occurred simultaneously with severe bud-get cuts experienced in many districts, new regulations allowing districts to reallocate year-end balances from most categorical-aid accounts (known as “carryover”),
Figure 3.1. Conceptual framework of how fi scal policy change may shape district and school organizations.
Fiscal policy changes District decision-making process
Program andschool-level effects
District priorconditions, Tier 3
District factorsconcurrent withTier 3 decisions
More or lessschool discretion
Funding allocationdecisions
22 DEREGULATING SCHOOL AID IN CALIFORNIA
and the infl ux of new stimulus dollars. Districts were expected to interpret this series of policy changes, then engage in a decision-making process that ensured bal-ancing their general fund and making allocations in up to 40 previously earmarked categorical-aid funds (along with other restricted dollars). Th is process would lead to a set of allocation decisions and actions, for example, eliminating or scaling back certain pro-grams and investing in other areas. Ultimately, these actions would translate into eff ects at the district and school level; for example, optimistically, leading to ad-ministrative cost savings, greater effi ciencies and more coherent or coordinated reform eff orts, or pessimisti-cally, leading to greater inequity in services to disad-vantaged students.
Th e model also recognizes that there are many con-ditions and factors likely to shape district budget decision-making (including student demographics, community wealth, prior focus on accountability and instruction), conditions which operated prior to Tier 3 reform. Local school boards and superintendents also had to consider fungible Tier 3 resources in the context of paring back spending and oft en laying off staff . Our starting point here was the set of variables used to sample our 10 districts, including fi scal health, size, and level of centralization, which we viewed at the outset as possible mediators of district decisions and actions. Our intent is not to prove causation—the fac-tor X always causes decision Y—but instead to explore the range of possible factors aff ecting the decisions districts made with respect to allocating newly fl exible Tier 3 funds.
Th e remainder of this report details our fi ndings, out-lining what we learned about these key domains: the allocation decisions districts made; how they made these decisions; with what reported consequences and concerns; and why. We return to this model in Section 7, where we elaborate on the key explanatory factors.
Study Limitations
Several caveats must be kept in mind when reading and interpreting our fi ndings. First, our sample of districts was not randomly selected nor selected to be representative of all districts in the state. Instead, we purposely chose these 10 districts to provide a range of contexts in which to explore responses to fi scal fl ex-ibility and variation in key conditions such as fi scal health, size, and geographic location. Further, within districts we also purposefully selected a sample of in-dividuals to interview and in some cases were unable to capture perspectives of certain groups, notably labor unions and community leaders. As such, the views of individuals interviewed in our 10 districts cannot be generalized to all individuals within districts or to the overall population within the state.
Despite the two limitations noted above, the results of this research make important contributions to under-standing how individuals think about fi scal fl exibility and make decisions around allocating newly fungible dollars. Th ey provide a preliminary picture of possible responses and actions, as well as explanations that we plan to examine more broadly in a survey adminis-tered to a representative sample of districts in the sec-ond year of the study. We believe these survey data will produce fi ndings that can be generalized to districts statewide.
Description of District Cases
Table 3.2 and Figure 3.2 display summary data for our 10 districts. Table 3.2 contains our four primary sam-pling variables (region, size, fi scal health, and central-ization), as well as an additional geographic variable (Urban-Centric Locale) and two performance indica-tors (Program Improvement Status and Academic Per-formance Index). Figure 3.2 displays two demograph-ic variables, percent poor and percent non-white. In order to protect the identity of districts, we report all
23DEREGULATING SCHOOL AID IN CALIFORNIA
the variables in Table 3.2 in ranges or categories and round the demographic variables in Figure 3.2 to the nearest multiple of 10. Th e 10 districts exhibit varia-tion in our four primary sampling variables, as well as in performance and demographics. Note that the fi s-cal health variable we report in Table 2.2 is based on our qualitative data collection rather than the Healthy/Unhealthy variable we used for sampling purposes and will be described in further detail below where we also describe the 10 districts in terms of community profi le and fi scal health.
Community profi les, student demographics, and per-formance. Sampled districts vary in terms of size, ge-ography, location, and demographics. Enrollment size ranged from four districts with less than 5,000 students to three districts with greater than 15,000 students. Five of the districts are located in Northern California and fi ve are in Southern California, with the 10 districts spread across eight counties. Latinos make up at least a third of each district (not displayed), and (non-Latino) White populations range from very small proportions of total enrollment in Duvall, Johnson, and Sanford to about half in a number of districts. Cushing and John-son have substantial African-American populations, while Cushing, Johnson, and Duvall have substantial Asian populations (not displayed).
Districts also vary in terms of student performance. Seven of the districts are in some stage of Program Im-provement, while three districts are in good standing in terms of federal accountability measures. Two dis-tricts had API scores of less than 700 in 2008; one dis-trict had an API of greater than 800; and the remaining districts had APIs between 700 and 800.
Fiscal health. Aft er visiting the 10 districts, we con-cluded that our fi scal-health sampling variable did a good job identifying healthy and unhealthy districts. Th e interview data we collected substantiated that
Duvall, Brandeis, Marshall, Powell, and O’Connor are relatively healthy (showing a reasonable level of reserves and low defi cit spending), whereas Cushing, Holmes, Rutledge, and Sanford are fi scally unhealthy (facing signifi cant defi cits and shrinking reserves). Th e one exception is Johnson, which our sampling variable identifi ed as healthy but according to our interviews is quite unhealthy. Classifying Johnson as unhealthy gives us fi ve healthy and fi ve unhealthy districts in the sample, which was our original sampling goal.
Based on our data collection, we created a more fi ne-grained measure of fi scal health with four rather than two categories to explore how much variation we captured in our sample. Th is measure incorporates a number of factors including the current fi scal status of the district at the time we sampled, the change in fi s-cal status from previous years, the degree to which the district has had to dip into its reserves, and the sever-ity of budget cuts in the district. From low to high, we labeled the four categories as Poor Fiscal Health, Un-healthy but Surviving, Healthy but Declining, and Very Healthy. We found that our sample was diverse with respect to these more refi ned categories of fi scal health, as well as the binary distinction reported previously. We describe each category and the districts that fall into it below:
• Two districts, Johnson and Sanford were classifi ed as having poor fi scal health. Th ese districts were already in fi scal trouble prior to the economic cri-sis, and as a result are particularly struggling in the wake of state cuts.
• We categorize three districts—Cushing, Rutledge, and Holmes—as unhealthy but surviving. Th ese districts are experiencing substantial budget defi -cits, and as a result have had to make painful de-cisions, including cutting programs and personnel, instituting furlough days, and increasing class size.
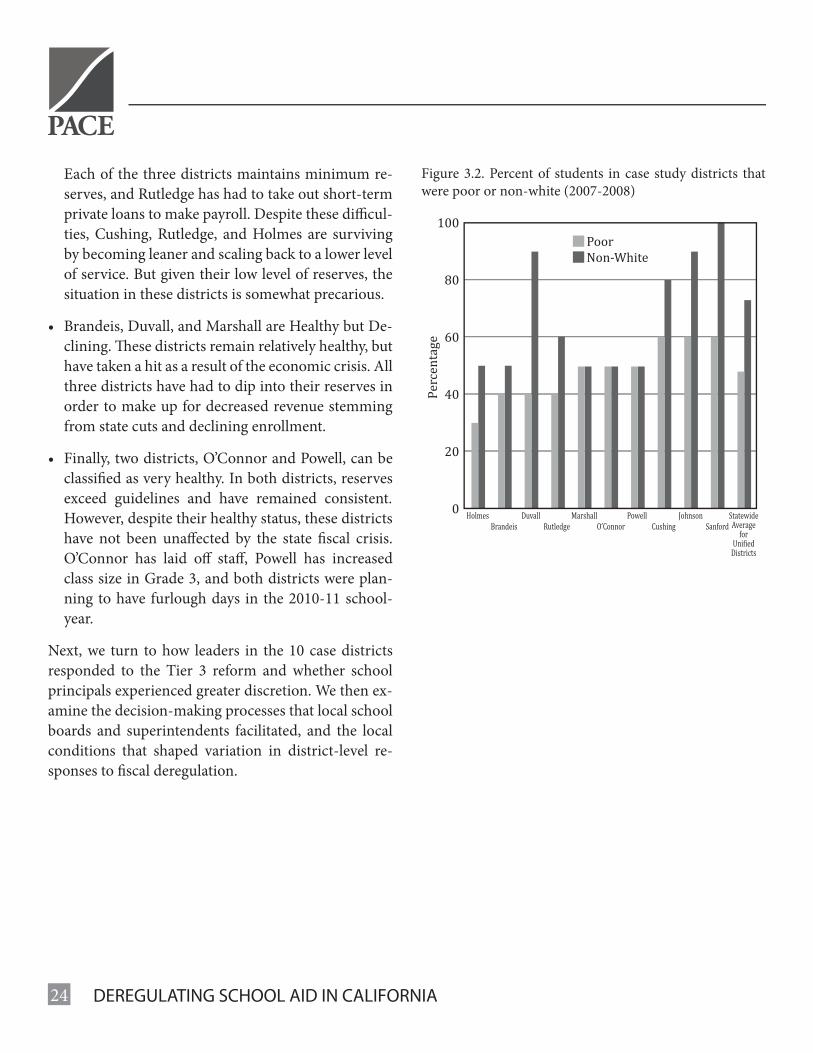
24 DEREGULATING SCHOOL AID IN CALIFORNIA
Each of the three districts maintains minimum re-serves, and Rutledge has had to take out short-term private loans to make payroll. Despite these diffi cul-ties, Cushing, Rutledge, and Holmes are surviving by becoming leaner and scaling back to a lower level of service. But given their low level of reserves, the situation in these districts is somewhat precarious.
• Brandeis, Duvall, and Marshall are Healthy but De-clining. Th ese districts remain relatively healthy, but have taken a hit as a result of the economic crisis. All three districts have had to dip into their reserves in order to make up for decreased revenue stemming from state cuts and declining enrollment.
• Finally, two districts, O’Connor and Powell, can be classifi ed as very healthy. In both districts, reserves exceed guidelines and have remained consistent. However, despite their healthy status, these districts have not been unaff ected by the state fi scal crisis. O’Connor has laid off staff , Powell has increased class size in Grade 3, and both districts were plan-ning to have furlough days in the 2010-11 school-year.
Next, we turn to how leaders in the 10 case districts responded to the Tier 3 reform and whether school principals experienced greater discretion. We then ex-amine the decision-making processes that local school boards and superintendents facilitated, and the local conditions that shaped variation in district-level re-sponses to fi scal deregulation.
Figure 3.2. Percent of students in case study districts that were poor or non-white (2007-2008)
100
80
60
40
20
0
PoorNon-White
Pe
rce
nta
ge
HolmesBrandeis
DuvallRutledge
MarshallO’Connor
PowellCushing
Johnson StatewideAverage
forUni�ied
Districts
Sanford
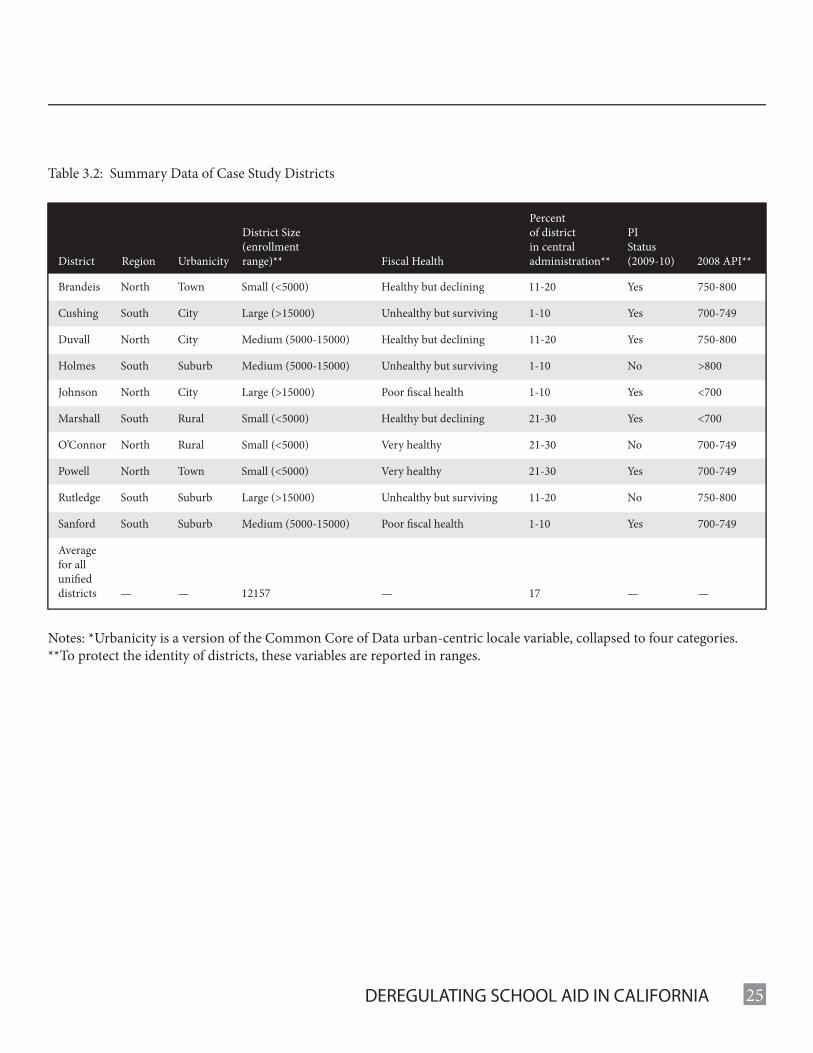
25DEREGULATING SCHOOL AID IN CALIFORNIA
Table 3.2: Summary Data of Case Study Districts
Notes: *Urbanicity is a version of the Common Core of Data urban-centric locale variable, collapsed to four categories.**To protect the identity of districts, these variables are reported in ranges.
Brandeis North Town Small (<5000) Healthy but declining 11-20 Yes 750-800
Cushing South City Large (>15000) Unhealthy but surviving 1-10 Yes 700-749
Duvall North City Medium (5000-15000) Healthy but declining 11-20 Yes 750-800
Holmes South Suburb Medium (5000-15000) Unhealthy but surviving 1-10 No >800
Johnson North City Large (>15000) Poor fi scal health 1-10 Yes <700
Marshall South Rural Small (<5000) Healthy but declining 21-30 Yes <700
O’Connor North Rural Small (<5000) Very healthy 21-30 No 700-749
Powell North Town Small (<5000) Very healthy 21-30 Yes 700-749
Rutledge South Suburb Large (>15000) Unhealthy but surviving 11-20 No 750-800
Sanford South Suburb Medium (5000-15000) Poor fi scal health 1-10 Yes 700-749
Averagefor allunifi eddistricts — — 12157 — 17 — —
District Region Urbanicity
District Size(enrollmentrange)** Fiscal Health
Percentof districtin centraladministration**
PIStatus(2009-10) 2008 API**
26 DEREGULATING SCHOOL AID IN CALIFORNIA
Section 4District Responses to Tier 3 Flexibility and Stimulus Funds
CDE guidance specifi es that for Tier 3 pro-grams, “program or funding requirements, as otherwise provided in statute, regulation, and
budget act provisional language associated with the funding, are not in eff ect” (California Department of Education, 2009). Furthermore, in an April 17, 2009 letter to districts, CDE clarifi ed the fl exibility provi-sions and emphasized districts’ freedom to allocate those funds as they wished, “For 2008-09 through 2012-13, LEAs may use funding formerly restricted for 39 specifi ed categorical programs for any educational purpose.” Yet, district leaders did not always share this understanding, nor did they utilize the full fl exibility that was allowed.
In this section we report on how district leaders and local stakeholders interpreted and responded to Tier 3 fl exibility. We detail how superintendents and district staff understood the rationale and rules of the Tier 3 reform. Th ese fi ndings speak to our fi rst research ques-tion: What did district leaders do with the newly fl ex-ible Tier 3 funds? We describe how leaders in the 10 districts and about twenty school principals under-stood the purposes and potential uses of these funds, and the allocation decisions that they made during the fi rst full year of implementation. We also report on how these local actors allocated Title I federal stimulus funds, at times in conjunction with Tier 3 fl exibility.
District Interpretations of Tier 3 Flexibility
How Tier 3 fl exibility was interpreted and then imple-mented varied greatly across the 10 districts. Six of 10 districts believed that fl exibility was truly uncon-strained and allowed for real choices. One CFO in Cushing explained: “Th ere’s a lot of diff erence between
buying a textbook and paying for a literacy coach. It was illegal [to use funds for one to do the other] before and it’s legal now.” According to these leaders, their districts were free to use funds, both ending balances and current year funding, as they chose.
Yet the other four districts regarded spending fl exibility as limited by educational mandates or legal (e.g. con-tractual) requirements. Leaders in these districts felt obligated to meet the intended needs represented by some of the categorical funding streams. For example, one respondent described the perception that school administrators needed to follow the rules and regula-tions to meet the needs of GATE students even though GATE funds now go into their general expenditure.
Despite the variation among districts in the perceived degree of fl exibility aff orded by deregulation, the per-ceived rationale for the policy was more uniform across districts. Many attributed Tier 3 fl exibility to the exist-ing economic and budget crisis rather than to a pur-poseful policy shift . For example, one superintendent commented that fl exibility was a “misnomer” and that the state “loosened regulations for survival.” He also believed that it was ironic to be given fl exibility but no funding. In two districts, administrators viewed Tier 3 fl exibility as a way of preserving teaching positions. For example, one respondent in Holmes explained, “[F]lexibility really doesn’t mean anything to us except that we are able to hold on to more positions and sur-vive slightly better, not a lot better. But slightly.”
Respondents diff ered widely in their perceptions of how long Tier 3 fl exibility would last. In some dis-tricts, administrators admitted to not thinking too
“It’s the state saying, ‘Oh, we’re not going to give you money here, so now you can take it from here.’ It’s six of one, half-dozen of another.” – Powell super-intendent
27DEREGULATING SCHOOL AID IN CALIFORNIA
far into the future about the lifetime of the program. One Holmes school board member stated “We’ll adjust when they tell us we no longer are going to have the ability to sweep into one big pile that we can use in the general fund… As a board, we haven’t looked at the long term… right now we’re looking at survival. We’re looking at our toes. We’re trying to survive on a day to day basis.” In yet other districts, administrators specu-lated that fl exibility would cease when economic times improve. On the other hand, respondents in three districts thought that fl exibility was permanent. One chief administrative offi cer characterized the changes as “like toothpaste out of the tube,” saying that “When you combine the fl exibility with budget cuts, it’s almost impossible to put these back in place. Th e resistance will be so massive, the state won’t be able to do it.” Our interviews with Sacramento policy leaders tended to concur.
Overall District Responses to Tier 3 Flexibility
Just as district leaders varied in their interpretation of the Tier 3 reform, we also observed diverse responses in terms of how Tier 3 dollars were allocated. Districts did not uniformly or predictably eliminate some pro-grams while maintaining others. A few districts did “sweep” all of their categorical funds into the district’s general fund. Other districts chose to sweep some of the Tier 3 dollars and eliminate the programs that those funds supported. Yet others swept the Tier 3 dol-lars, but continued to fund some of the programs or activities out of the district’s general fund.
Th is subsection details the variety of district responses to Tier 3 fl exibility. We will weave into the story how federal stimulus dollars (Title I) were at times part of the allocation mix, as reported by district leaders. But fi rst we clarify four distinct patterns observed across districts. Th ese are not mutually exclusive budget re-sponses or strategies; some districts engaged in more
than one simultaneously.
• Retrenchment and backfi lling: when district lead-ers largely reallocated Tier 3 dollars into the general fund to balance the overall budget. Oft en Tier 3 pro-grams were severely cut back or eliminated.
• Effi ciency seeking and reassessing spending priori-ties: oft en involving selectively reducing Tier 3 pro-grams, while maintaining others. Priority setting occurred within the array of previously operating Tier 3 programs.
• Reallocating dollars to advance new initiatives: at times reallocating Tier 3 and other categorical aid to create or sustain instructional improvement eff orts, or other new programs.
• Sharing fl exibility with school principals and site councils: Operating across these budget responses, district leaders varied in their commitment to shar-ing newly fl exible dollars with their principals, given fi scal exigencies.
Retrenchment and backfi lling. Th is strategy is charac-terized by the decision to sweep Tier 3 funds into the general fund and reallocate them as needed in order to maintain the perceived core education programs in spite of severe fi scal constraints. Tier 3 dollars were used to backfi ll reductions in funding in general rev-enues. To some extent, all districts adopted this strat-egy and took advantage of the authority to shift fl exible dollars into the general fund and to reconfi gure, con-solidate, or eliminate some Tier 3 programs. In some instances, programs previously supported with Tier 3 funds were entirely eliminated. In other instances, pro-grams were scaled down (in response to overall fi scal reductions) and funds for the programs were shift ed to the district’s general fund. Offi cials in Brandeis stated that they swept Tier 3 dollars into the general fund in order to address structural defi cits and to retain staff .
28 DEREGULATING SCHOOL AID IN CALIFORNIA
In O’Connor, Tier 3 funds were shift ed to the general fund, at the recommendation of California School Ser-vices, in order to make payroll.
Th e Sanford district was experiencing declining en-rollment and had recently recovered from a signifi cant
Retrenchment to Balance the Budget
Sanford had been contending with budget cuts since 2003, when an audit revealed over a $10 million budget shortfall. Th e small district was stabilizing its fi nances just as the state fi scal crisis began in 2008. Aft er years of budget reductions and declining enrollment, the district entered 2009-2010 with few services left to cut. Sanford’s central offi ce administra-tion had already been pared down to a bare-bones structure, and several of the elementary schools had been closed. Tier 3 fl exibility was seen as an opportunity to backfi ll the general fund and preserve jobs.
In order to reduce the number of layoff s, the majority of the Tier 3 funds were swept into the general fund. Of the re-maining Tier 3 dollars, the district cut the allocation down to the minimum contribution needed to remain functional, and swept the remainder. Th e superintendent said, “It’s just that we need to sweep all that we can in order to survive. Th at’s the tragedy of what’s happening in education, is that we’re eating our own in order to survive.”
Under the leadership of the superintendent and the assistant superintendent of business (ASB), the cabinet identifi ed the Tier 3 programs that could be reduced or eliminated in order to support the general fund. Th e ASB said, “We wiped out everything else that we could.” Administrators acknowledged these cuts impact the core instructional program, but they felt it was necessary to maintain solvency. Aft er years of budget reductions, they believed their options were limited. Th e ASB felt that additional staff reductions would also negatively impact the educational program, explaining, “Our goal still was to save programs, but it also was to keep people, too. Without people, you can’t run the programs. We’re really at this point where we’re trying to do so much more with so much less, that every body that’s eliminated creates that much more hardship on the people that are left .” Th e categorical aid director referred to this concept as “preserving services to students through positions.”
Sanford outright abolished some programs. GATE, a program that was not well-entrenched, was eliminated in 2009-2010. Supplemental Counseling was eliminated for the 2010-2011 academic year. Other programs were swept but main-tained through alternative funding streams. Although the district moved all of the Professional Development (PD) Block Grant funds into the general fund, it used Title II and EIA monies to continue to off er site-based PD.
Most Tier 3 programs faced severe cuts, though the district maintained the minimum amount necessary to continue of-fering services. Aft er extensive internal lobbying by curriculum administrators, the district preserved one teacher’s salary to continue the California High School Exit Examination support and swept the remaining dollars. Administrators kept the Beginning Teacher Support and Assessment program intact, despite sweeping some of the money into the general fund.
Sanford belongs to a Regional Occupation Program consortium, and they continued their contribution to the group in order to maintain services. Th e remaining dollars were used to backfi ll the general fund. Th e district eliminated half of
defi cit. As a result, the district entered the 2009-2010 school-year with few services or programs that could easily be cut. Consequently, the district’s response was to sweep all categorical funds in order to protect teach-ing positions.
29DEREGULATING SCHOOL AID IN CALIFORNIA
the school safety offi cers, who were traditionally funded through Tier 3 dollars.
In consultation with the director, the adult education program was redefi ned to become more academically oriented. Sanford adult education continued to off er ESL and citizenship classes, along with credit recovery for high school stu-dents and GED classes. For 2010-2011, the district cut the program by well over half a million dollars—about a third of the prior year’s budget—and shift ed those monies into the general fund. Any recreational programs are now required to charge fees in order to be self-sustaining.
Th e ASB met with the maintenance and operations director to identify priorities, creating a list of necessary and optional projects. Based on that list, the district sought an estimate from a contractor and had the necessary repairs made. Th e remainder of the deferred maintenance funds was swept. According to the superintendent, the union was pressuring the district to eliminate all adult education and deferred maintenance funding in order to preserve regular teaching jobs.
Sanford’s School and Library Improvement Block Grant dollars have been entirely swept, along with funds from Art and Music, PE Block Grant, Educational Technology, and the Targeted Instructional Improvement Block Grant. Many of these categorical programs were previously controlled in site-level budgets and spent with the approval of the principal and school site councils as part of the site’s Single Plan for Student Achievement. As of 2009-2010, the site-level budgets contained only restricted categorical dollars, primarily Title I and EIA. Th is has greatly reduced the school-level fl exibil-ity, as well as the overall site budgets.
Effi ciency seeking and reassessing spending priori-ties. Th e effi ciency strategy is typifi ed by the decision to use Tier 3 fl exibility as an opportunity to allocate funds more effi ciently and to align program funding with local needs and priorities. Some districts pur-sued effi ciency by targeting money more strategically to existing Tier 3 programs. In others, effi ciency was achieved by reallocating Tier 3 categorical dollars to new instructional initiatives. Infrequently, districts tried to be more effi cient by devolving some funding decisions to the school level.
According to the superintendent of Marshall, Tier 3 fl exibility allowed them to be more “economical,” to “make better use of the money,” and “to coalesce that money and spend more on areas of need.” As an ex-ample, he explained,
“When I fi rst got here, we were under an Offi ce of Civil Rights investigation because we weren’t doing a very good job dealing with our ESL students. So now we’ve kind of fi rmed that up and done some other things to make sure
that those students’ needs are being better met. Having fl exibility allows us to do that more effi ciently.”
Th e superintendent noted that some of the categorical funding streams were simply too small to have much programmatic impact and that consolidation allowed them to pool funds for higher priority programs. Con-versely, some funding streams exceed district capacity to use them, such as Proposition 49 funds for aft er-school programs. “It’s a matter of shift ing some pro-grams that used to be during the day to aft er school and shift ing transportation to maybe come to the school a little later,” the superintendent explained. “Next year, we’re going to move a lot of sports and arts to aft er school and then run one bus aft er the aft er-school programs.”
Th e assistant superintendent for fi nance in another district pointed to the ineffi ciencies of carrying over millions of dollars of unspent funds from categorical programs prior to deregulation. So too, the superin-tendent of Marshall noted the greater effi ciencies real-
30 DEREGULATING SCHOOL AID IN CALIFORNIA
ized from fl exibility.
“(Flexibility) allows us to streamline what we’re doing. We were spending [more than a million dollars] in gen-eral supplies—way too much for a district this size. It’s made us think about what we’re doing and how much we’re spending. It used to be you had this much in this category, so you felt like you had to spend that much in a certain category. Now we think more about what we need…Good consequence is that it’s allowed us to put money where our kids need it to be, not where someone tells us it should be.”
Like the superintendent in Marshall, others noted that fl exibility allows districts to match funding with local priorities. In districts that received extensive in-put from a variety of local stakeholders, administra-tors attributed a lack of opposition (to the sweeping of categorical funding) to appreciation of district ef-forts to honor local concerns. As the board president of O’Connor noted, “I think that the community was satisfi ed with our district priorities because we got a lot of input from them. Since that was driving the budget, then they felt that sweeping those (Tier 3) funds was more in line with our priorities.”
One administrator in Johnson emphasized that the dis-trict has generally moved toward ignoring Tier 3 pro-gram labels. With categorical fl exibility, programs and departments in the district receive allocations “negoti-ated by [what] the (state budget) cut was and the re-stricted or unrestricted targets.” It was left to program managers to decide how to spend those funds. In the 2010-11 academic year, the superintendent felt he had to make diffi cult choices between adult education and early-childhood education. In the end, the district made additional cuts (beyond those made in the previous year) to adult education in order to minimize cuts to ear-ly-childhood programs. As the superintendent noted:
I don’t want to trade adult ed for early childhood, and yet…if I don’t, we will never be funded at a high enough rate to make up for not doing early-childhood interven-tion. If you don’t do early-childhood education program-ming for a couple of years and then those kids come into the system, you can’t…we’ll never see that level of funding back again to make up for that. Whereas if for a couple of years, we have to fi gure out other ways to serve and meet the needs of the adult community, we might fi nd some “work-arounds” for doing that.
When Duvall and Powell merged adult education and continuation school administrator positions, they real-ized substantial reductions in overhead costs. Duvall estimated savings of about $150,000 by restructuring administrative overhead. Powell’s administrators also stated that they had used similar strategies for cutting overhead costs and for using those savings to preserve the adult education services and, just as importantly, to “keep cuts away from the classroom.” Th is was a fa-miliar refrain across other districts, as well as the goal of minimizing teacher layoff s and limiting the growth of class sizes.
Th is second pattern, focusing on reassessing program priorities and reallocation, rarely involved the use of performance data across programs. Some expenditure effi ciencies were obvious and easily implemented, as illustrated above. Reallocations oft en were guided by basic principles, like keeping cuts from the classroom or focusing on activities defi ned as core tasks, then trimming more peripheral activities, such as adult education. But in no instance did district staff refer to formal evaluation evidence or performance data to weigh the relative eff ects of diff erent Tier 3 or collateral programs. Th is holds implications for how we consider the effi ciency of local decision-making regarding allo-cations, an issue to which we will return.
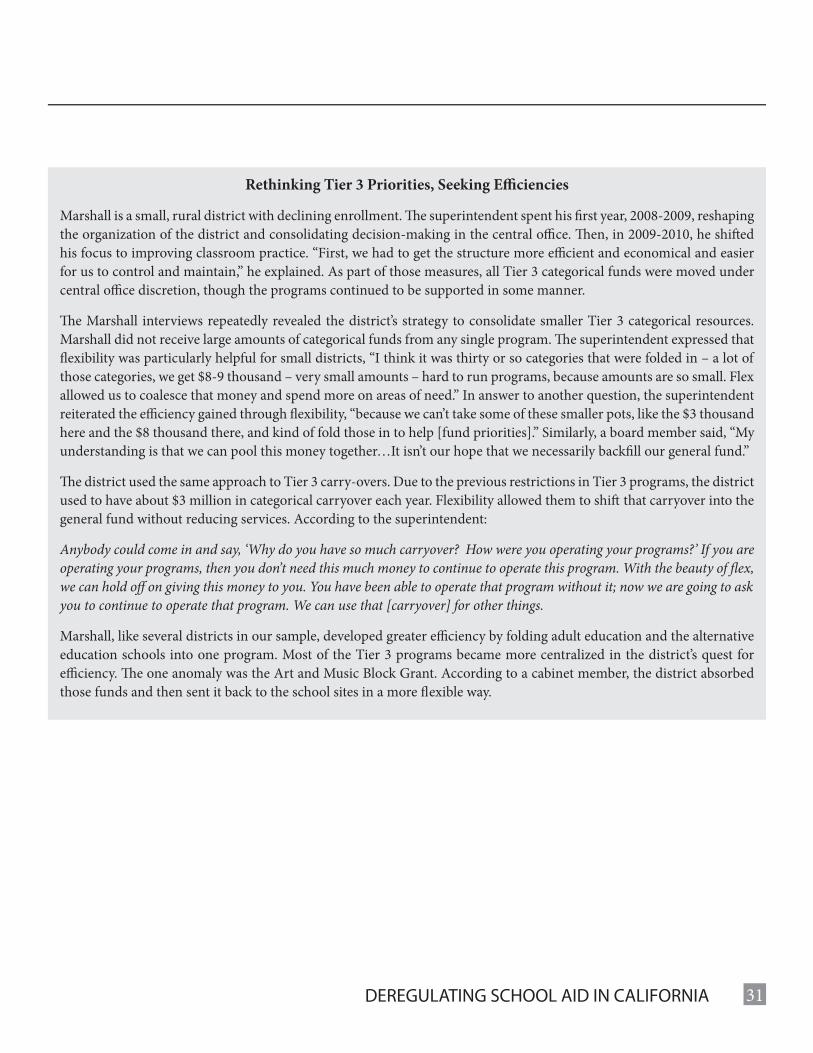
31DEREGULATING SCHOOL AID IN CALIFORNIA
Rethinking Tier 3 Priorities, Seeking Effi ciencies
Marshall is a small, rural district with declining enrollment. Th e superintendent spent his fi rst year, 2008-2009, reshaping the organization of the district and consolidating decision-making in the central offi ce. Th en, in 2009-2010, he shift ed his focus to improving classroom practice. “First, we had to get the structure more effi cient and economical and easier for us to control and maintain,” he explained. As part of those measures, all Tier 3 categorical funds were moved under central offi ce discretion, though the programs continued to be supported in some manner.
Th e Marshall interviews repeatedly revealed the district’s strategy to consolidate smaller Tier 3 categorical resources. Marshall did not receive large amounts of categorical funds from any single program. Th e superintendent expressed that fl exibility was particularly helpful for small districts, “I think it was thirty or so categories that were folded in – a lot of those categories, we get $8-9 thousand – very small amounts – hard to run programs, because amounts are so small. Flex allowed us to coalesce that money and spend more on areas of need.” In answer to another question, the superintendent reiterated the effi ciency gained through fl exibility, “because we can’t take some of these smaller pots, like the $3 thousand here and the $8 thousand there, and kind of fold those in to help [fund priorities].” Similarly, a board member said, “My understanding is that we can pool this money together…It isn’t our hope that we necessarily backfi ll our general fund.”
Th e district used the same approach to Tier 3 carry-overs. Due to the previous restrictions in Tier 3 programs, the district used to have about $3 million in categorical carryover each year. Flexibility allowed them to shift that carryover into the general fund without reducing services. According to the superintendent:
Anybody could come in and say, ‘Why do you have so much carryover? How were you operating your programs?’ If you are operating your programs, then you don’t need this much money to continue to operate this program. With the beauty of fl ex, we can hold off on giving this money to you. You have been able to operate that program without it; now we are going to ask you to continue to operate that program. We can use that [carryover] for other things.
Marshall, like several districts in our sample, developed greater effi ciency by folding adult education and the alternative education schools into one program. Most of the Tier 3 programs became more centralized in the district’s quest for effi ciency. Th e one anomaly was the Art and Music Block Grant. According to a cabinet member, the district absorbed those funds and then sent it back to the school sites in a more fl exible way.
32 DEREGULATING SCHOOL AID IN CALIFORNIA
Reallocating dollars to advance new initiatives or to sustain instructional improvement eff orts. Two districts leveraged Tier 3 fl exibility to mount eff orts aimed at lift ing the quality of teaching and student achievement. Th e recently hired superintendent in Duvall, for example, used a portion of Tier 3 dollars to help balance the general fund and minimize teach-er layoff s. But he also creatively combined Tier 3 and Economic Impact Aid (EIA) dollars into a new fund that supported a cadre of instructional coaches. Th e superintendent also replaced a number of school prin-cipals, and built a common mission among his new set of school leaders, fueled by these interwoven sources of categorical aid.
Th is instructional improvement strategy was not sparked by the Tier 3 fl exibility. Th e superintendent re-lied mainly on EIA dollars, essentially swept-up from within his schools, where allocation decisions were previously made. But the superintendent linked Sac-ramento’s push for fi scal fl exibility to his own discre-tion by more inventively allocating categorical aid for his new initiative. “Since I strongly believe in develop-ing teaching and learning communities to strengthen schools’ work, any time there can be funding to sup-port it, all the better... I use whatever [monies] I can get my hands on,” the superintendent explained. “We’re not paying attention to dollar amounts. Instead, we’re trying to develop a more systematic approach and us-ing money to support it, so there aren’t little silos and so people understand the focus of the work.”
Cushing redirected various funding streams in order to maintain high-priority programs and to continue to consolidate ongoing school improvement initiatives. According to the district’s budget director, they swept more than a third of the district’s TIIBG funds. More than two thirds of the remaining funds were used for transportation (according to this administrator, a sig-nifi cant portion of TIIBG money was used for trans-
portation because they didn’t get enough transpor-tation money from the state). Th e remaining money funded a number of programs, including, at one of the district’s high schools, a special program supporting an additional teacher to expand A-G off erings to improve the image of the school in the community.. A number of other programs and positions that used to be funded by TIIBG were cut in 2009-10. Th ey included two es-tablished, small learning communities, contracts with external providers to support the district’s core aca-demic initiative, and music teachers. According to a 2010 Board action, the district planned to sweep an-other several million dollars in 2010-2011. Th is would include cuts to transportation.
In several districts, administrators welcomed the free-dom to consolidate categorical funding streams so they could be used to greater eff ect. In one district, offi cials noted that their categorical programs were isolated and fragmented. Individually, categorical funding streams were insuffi cient to be used eff ectively. In the aggre-gate, on the other hand, they could be targeted to areas of need. A board member in Johnson commented that “more of the Tier 3 money is fl exed, more of the pro-grams are being fl exed…A lot of these programs are pretty modest.”
School offi cials in O’Connor expressed similar views. In that district, the adult education program was very small, and teaching adults was not the district’s per-ceived core mission. Consequently, the district elimi-nated all adult education programs and shift ed the sav-ings into the general fund. District offi cials reasoned that the local community college would pick up any slack in adult education off erings. As noted above, ad-ministrators in Cushing also redirected funding to try to maintain high-priority programs.
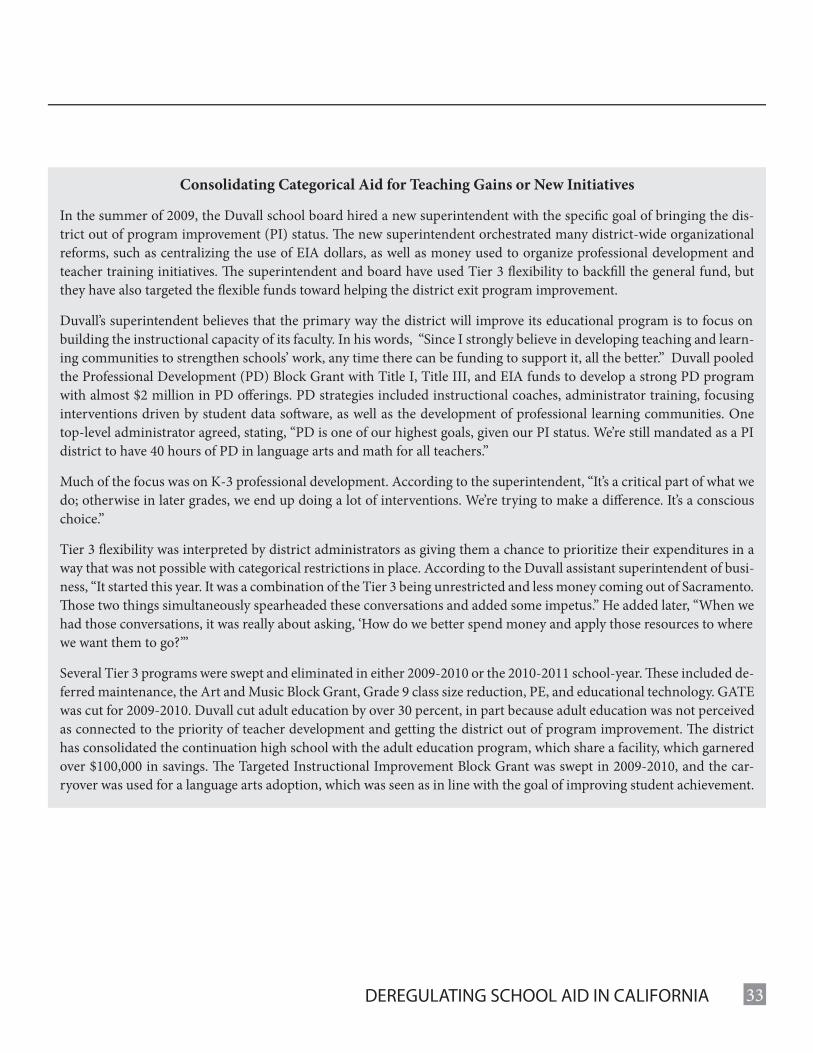
33DEREGULATING SCHOOL AID IN CALIFORNIA
Consolidating Categorical Aid for Teaching Gains or New Initiatives
In the summer of 2009, the Duvall school board hired a new superintendent with the specifi c goal of bringing the dis-trict out of program improvement (PI) status. Th e new superintendent orchestrated many district-wide organizational reforms, such as centralizing the use of EIA dollars, as well as money used to organize professional development and teacher training initiatives. Th e superintendent and board have used Tier 3 fl exibility to backfi ll the general fund, but they have also targeted the fl exible funds toward helping the district exit program improvement.
Duvall’s superintendent believes that the primary way the district will improve its educational program is to focus on building the instructional capacity of its faculty. In his words, “Since I strongly believe in developing teaching and learn-ing communities to strengthen schools’ work, any time there can be funding to support it, all the better.” Duvall pooled the Professional Development (PD) Block Grant with Title I, Title III, and EIA funds to develop a strong PD program with almost $2 million in PD off erings. PD strategies included instructional coaches, administrator training, focusing interventions driven by student data soft ware, as well as the development of professional learning communities. One top-level administrator agreed, stating, “PD is one of our highest goals, given our PI status. We’re still mandated as a PI district to have 40 hours of PD in language arts and math for all teachers.”
Much of the focus was on K-3 professional development. According to the superintendent, “It’s a critical part of what we do; otherwise in later grades, we end up doing a lot of interventions. We’re trying to make a diff erence. It’s a conscious choice.”
Tier 3 fl exibility was interpreted by district administrators as giving them a chance to prioritize their expenditures in a way that was not possible with categorical restrictions in place. According to the Duvall assistant superintendent of busi-ness, “It started this year. It was a combination of the Tier 3 being unrestricted and less money coming out of Sacramento. Th ose two things simultaneously spearheaded these conversations and added some impetus.” He added later, “When we had those conversations, it was really about asking, ‘How do we better spend money and apply those resources to where we want them to go?’”
Several Tier 3 programs were swept and eliminated in either 2009-2010 or the 2010-2011 school-year. Th ese included de-ferred maintenance, the Art and Music Block Grant, Grade 9 class size reduction, PE, and educational technology. GATE was cut for 2009-2010. Duvall cut adult education by over 30 percent, in part because adult education was not perceived as connected to the priority of teacher development and getting the district out of program improvement. Th e district has consolidated the continuation high school with the adult education program, which share a facility, which garnered over $100,000 in savings. Th e Targeted Instructional Improvement Block Grant was swept in 2009-2010, and the car-ryover was used for a language arts adoption, which was seen as in line with the goal of improving student achievement.
34 DEREGULATING SCHOOL AID IN CALIFORNIA
Sharing fl exibility with school principals and school-site councils. In general, we did not see much fl exibility shared with school principals. In a shift toward decen-tralization, Brandeis swept all of its Tier 3 dollars into the general fund. Some of the programs that had been funded by categorical funds continue to operate in schools. However, the district gave greater discretion to schools over the combination of instructional pro-grams it chooses to provide. Schools may decide how to allocate general funds among various programs. Some schools have decided to continue GATE, physi-cal education, music and art, funding them out of their own budgets or through private fund-raising.
Johnson is unique among the sampled districts in that the district operates under a budgeting system, which existed prior to Tier 3 fl exibility, where a majority of the district’s general-purpose funds fl ow directly to school sites. Th e system was implemented as part of a set of district-wide redesign initiatives intended to empower site leaders to make choices about how best to serve students. Although schools must abide by con-
tractual requirements and state class size mandates, school leaders generally have more fl exibility to confi g-ure staffi ng arrangements and instructional programs under this system. Each school’s budget is determined by the number and type of students enrolled and the attendance rates of the school; once teachers’ salaries and benefi ts are covered, principals and school-site councils are able to spend the rest of their funding on the specifi c needs of each school, be they books, sup-plies, or teacher professional development.
But beyond freeing up restrictions around the use of School and Library Improvement Block Grant (SLIBG) funds, it did not appear that Tier 3 fl exibility off ered any major new fi scal freedom for principals in Johnson. Th at was largely due to the fact that the dis-trict swept up monies for its own use in 2009-10, so certain monies no longer went to schools. In addition, several Tier 3 funding streams had previously come to schools, so principals already used these dollars for discretionary spending.
Sharing Fiscal Flexibility with School Principals
Rutledge was one district that shared fl exibility with school principals, in addition to backfi lling and developing ef-fi ciency. Aft er sweeping the School and Library Improvement Block Grant (SLIBG) dollars, the district returned ap-proximately 50 percent of the original allocation to principals as unrestricted dollars. GATE funds were also returned to the sites, without restrictions, at about 50 percent of the previous allotment. Th is decision allowed principals to bypass the approval of the school site council, which was previously required to have oversight over the SLIBG funds. Not all principals opted to use this new discretion. Some continued to follow the old procedure as a way to ensure the staff and parents were included in the decision-making process.
One school is using the new fl exibility to create what appeared to be a “reserve” fund to use at the principal’s discretion for timely responses to requests, something that was not possible prior to the fl exibility. Another cabinet member noted that using unrestricted funds allowed principals to allocate money without adhering to some of the previous regulations. According to the director of curriculum and instruction:
Th e principal has the fl exibility to say, ‘I’m going to buy 3 computers for a new program I have for kids that I believe will benefi t my kids during reading time for those GATE kids.’ Where before we would have been really limited to who was on
35DEREGULATING SCHOOL AID IN CALIFORNIA
that computer…In the past, only GATE kids could have been on that computer, because it was categorically funded by GATE. Well, now, if we have a kid who’s a high achiever who’s not necessarily GATE, but he’s smart, doing well, works hard – we can still use that computer.
Rutledge administrators gave Title I Stimulus, Part A funds to Title I elementary and middle schools to use at their dis-cretion, partly as a means to counteract all the other reductions. High schools in Rutledge do not receive Title I funds, however, so they were not given stimulus dollars. Th e administration attempted to discourage leaders from spending one-time money on personnel. Many principals opted to use the funds for computers, programs like Read 180, and supplemental materials. Most elementary principals augmented existing programs so they could extend services to more students.
Th e assistant superintendent of business explained that the stimulus was a way to backfi ll the cuts made to site-level budgets from sweeping half of the SLIBG funds. According to the assistant superintendent, this aligned with the district philosophy of providing fl exibility to the schools:
It’s really about the students. It’s not about having the control at the district level, but we’re going to set the parameters and policies as to what you need to do to continue moving forward with test scores and closing the achievement gap. And so here, we’re going to give you the resources, so you never have to worry about… saying, ‘I can’t go here or do that or whatever.’ You get the total fl exibility. You need to make this happen within what we’ve established.
Th is level of trust in principals’ fi scal discretion was refl ected in the statements of the director of elementary curriculum:
Our district has always had the opinion that each school is unique and has diff erent needs based on the population. What might be successful at one school may not be successful at another. We wanted to keep that impetus of what was happening that was so good that got us out of Program Improvement, because we’ve been making such great gains that we wanted to ensure that that kept going. We felt that our principals had those visions and could make that happen. So we entrusted that money to them.
Our interviews with both the elementary and high school principals acknowledged this shift in their level of discretion. One elementary principal described the former Tier 3 funds as “more like your general fund now: they are very fl exible.”
District Actions Regarding Tier 3 Programs
Next we examine how districts responded to categori-cal deregulation for four specifi c categorical programs. While 40 categorical programs are included in the Tier 3 fl exibility legislation, there are signifi cant diff erences among districts in the amount of fl exible dollars that they received. For instance, in 2009-2010, large ele-
mentary districts received, on average, about $400 per student while large unifi ed districts received just un-der $800 dollars per student. As we show in Appendix A there is also great variation in state funding levels for the Tier 3 programs: Bilingual Teacher Training is funded statewide at $1.7 million while the Targeted Instructional Improvement Block Grant (TIIBG) is funded at about $855 million.
We fi rst examine general spending trends for selected Tier 3 programs between the baseline year of 2008-09 and the fi rst full year of implementation, 2009-10. Th en, we return to our interview data to illuminate key
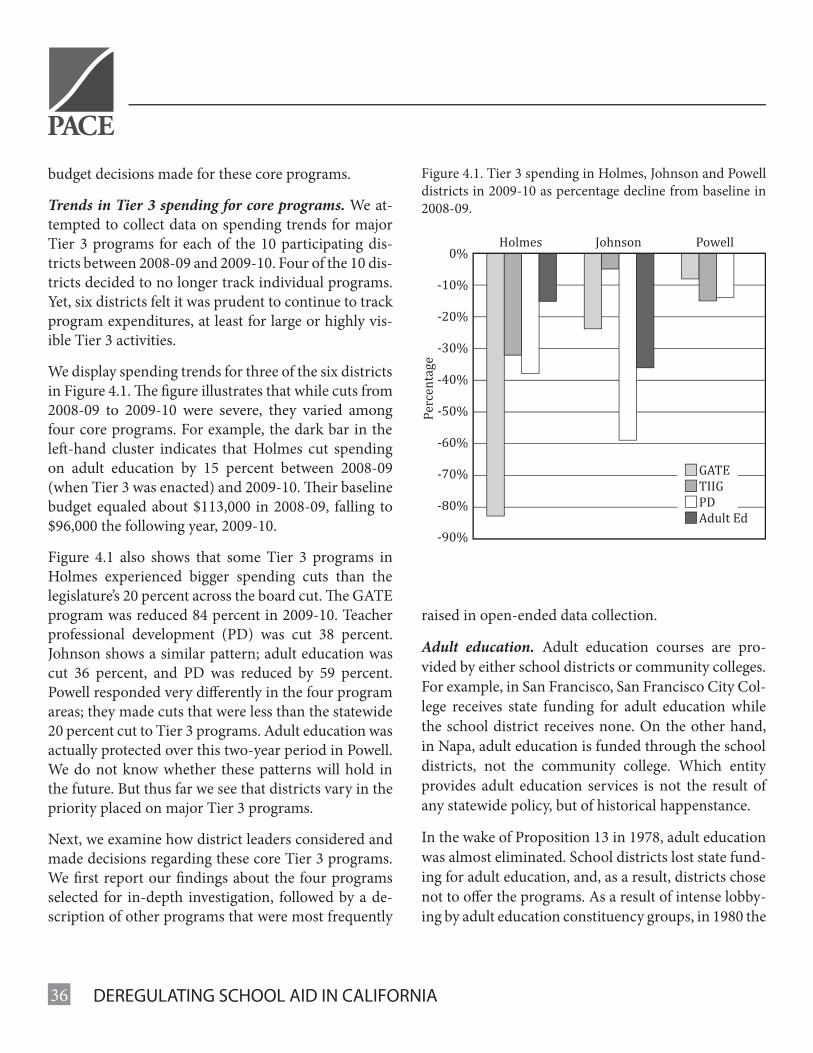
36 DEREGULATING SCHOOL AID IN CALIFORNIA
budget decisions made for these core programs.
Trends in Tier 3 spending for core programs. We at-tempted to collect data on spending trends for major Tier 3 programs for each of the 10 participating dis-tricts between 2008-09 and 2009-10. Four of the 10 dis-tricts decided to no longer track individual programs. Yet, six districts felt it was prudent to continue to track program expenditures, at least for large or highly vis-ible Tier 3 activities.
We display spending trends for three of the six districts in Figure 4.1. Th e fi gure illustrates that while cuts from 2008-09 to 2009-10 were severe, they varied among four core programs. For example, the dark bar in the left -hand cluster indicates that Holmes cut spending on adult education by 15 percent between 2008-09 (when Tier 3 was enacted) and 2009-10. Th eir baseline budget equaled about $113,000 in 2008-09, falling to $96,000 the following year, 2009-10.
Figure 4.1 also shows that some Tier 3 programs in Holmes experienced bigger spending cuts than the legislature’s 20 percent across the board cut. Th e GATE program was reduced 84 percent in 2009-10. Teacher professional development (PD) was cut 38 percent. Johnson shows a similar pattern; adult education was cut 36 percent, and PD was reduced by 59 percent. Powell responded very diff erently in the four program areas; they made cuts that were less than the statewide 20 percent cut to Tier 3 programs. Adult education was actually protected over this two-year period in Powell. We do not know whether these patterns will hold in the future. But thus far we see that districts vary in the priority placed on major Tier 3 programs.
Next, we examine how district leaders considered and made decisions regarding these core Tier 3 programs. We fi rst report our fi ndings about the four programs selected for in-depth investigation, followed by a de-scription of other programs that were most frequently
raised in open-ended data collection.
Adult education. Adult education courses are pro-vided by either school districts or community colleges. For example, in San Francisco, San Francisco City Col-lege receives state funding for adult education while the school district receives none. On the other hand, in Napa, adult education is funded through the school districts, not the community college. Which entity provides adult education services is not the result of any statewide policy, but of historical happenstance.
In the wake of Proposition 13 in 1978, adult education was almost eliminated. School districts lost state fund-ing for adult education, and, as a result, districts chose not to off er the programs. As a result of intense lobby-ing by adult education constituency groups, in 1980 the
Figure 4.1. Tier 3 spending in Holmes, Johnson and Powell districts in 2009-10 as percentage decline from baseline in 2008-09.
0%
-10%
-20%
-30%
-40%
-50%
-60%
-70%
-80%
-90%
GATETIIGPDAdult Ed
Pe
rce
nta
ge
PowellJohnsonHolmes
37DEREGULATING SCHOOL AID IN CALIFORNIA
legislature reinstated funding, initially for seven and eventually for nine program areas. Subsequent legisla-tion reduced the nine programs to six. Th ey are: Adult Literacy/High School Diploma; English as a Second Language/Citizenship; Adults with Disabilities; Ca-reer Technical Education/Apprenticeships; Parenting, Family, and Consumer Awareness; and Older Adults.
Within these six, broad areas, districts were allowed to defi ne specifi c program off erings. Among the 10 districts, adult education generated the most discus-sion and controversy. Eight of our districts reduced or eliminated adult education services. However, in all but one district, a portion of the academic program-ming was protected while enrichment programs were cut or required to be self-suffi cient. Offi cials in the district that cut academic programs explained that the instructional services provided by the adult education program were very limited and that the local commu-nity college could fi ll the need.
Two districts eliminated adult education as a program entity while keeping a couple of the program compo-nents: credit recovery for high school students and al-ternative education. Another shift ed adult education funds into the general fund and used Regional Occu-pation Program (ROP) funds to support an agricul-tural education program, given that the district had recently passed a bond to construct a new agricultural education building and to purchase farmland. In sev-eral districts, the deregulation of adult education funds prompted discussion about the role of adult education programs and how those relate to the K-12 mission. Th e response in Cushing and Johnson was to funda-mentally redesign adult education. Leisure and recre-ational programs were eliminated, while GED, credit recovery, and career and technical education were re-tained. In those districts that retained adult education programs, these were slimmed-down versions of prior year off erings. Again, some districts chose to eliminate
some of the six categories of program off erings that had been required by the California Education Code, while one district chose to maintain all six. However, in most districts, courses that were deemed recreation-al were shift ed to community service and off ered on a fee basis.
Th e director of adult education in Johnson regarded fl exibility over adult education funds as “an opportu-nity to create a state-of-the-art adult ed [sic] program.” However, Johnson’s fl exibility to reallocate adult edu-cation funds was signifi cantly curtailed by its union contract. In its teacher contract, Johnson guarantees a particular number of full-time adult education jobs to its local teachers’ union. Because these full-time lo-cal teachers (and union members) working in adult education had guaranteed positions, the district could eliminate adult education programs but had to fi nd positions for these teachers elsewhere in the district. District leaders could, however, lay off the part-time workers, who oft en taught the more specialized voca-tional courses. One administrator explained,
If we shrink [adult education] as opposed to wiping it out, like we did now, the only ones we can aff ord to em-ploy are full-time, local union members. And the man-agement is saying, ‘Of course,’ but they [the full-time teachers] can’t teach those things. Th ey can’t do ESL and shop and vocational education. And so the [labor orga-nization representing part-time workers] is the group who is hurt the most. Th e administration wants to lower that guaranteed job number [for full-time workers]. In fact, we proposed a contract that eliminated any guar-antee of local union members to give us maximum fl ex-ibility on program design.
Th e CAO of Johnson noted: “adult education got a big hit, but we also saw that as an opportunity to reorganize adult education. Focus on helping students graduate, on ESL, and some parent education and small amount
38 DEREGULATING SCHOOL AID IN CALIFORNIA
of citizenship education.” Adult education programs in the district were prioritized into three tiers and the “nice to have stuff ” (like ballroom dancing) was jet-tisoned, explained the CAO. Other districts also elimi-nated adult education services that were deemed to be extraneous to the district’s K-12 core mission. Several districts questioned any continuing support for adult education as it was considered to lie outside the K-12 mission.
Gift ed and Talented Education (GATE). Six of the 10 districts kept GATE alive in some form. In some cases the program was reduced, but not eliminated. In Cush-ing, Tier 3 fl exibility allowed the leaders to expand GATE by allowing students who previously would not have qualifi ed for the program to participate. In some instances, the district swept the funds and then real-located some portion of those funds to schools. In two of these districts, the funds were not designated for the gift ed program, but were allocated to schools as unre-stricted funds, which allowed schools to use the money for various programs and activities.
Th e GATE program in Johnson was reduced by about 25 percent, but could not be eliminated because it was specifi ed in the collective bargaining agreement. Any signifi cant changes would have required re-ne-gotiating the contract. A cabinet member in Johnson explained the contract included language that guaran-teed the district will identify all GATE-eligible third graders, and most of the GATE money pays the salary of a psychiatrist who runs the identifi cation process. Acknowledging the district’s diffi cult fi scal situation, Johnson’s superintendent put it simply: “Some [Tier 3 program activities] will be on hold, and some of the funding for GATE will go down as we try to fund other things.”
According to a district administrator in Cushing, GATE is a valued and successful program in the dis-
trict. It has the highest certifi cation that the state off ers. In addition, GATE provides access to AP programs, which is also an element of the district’s core instruc-tional initiative. As a result, the program is integral to district priorities. For those reasons, GATE was pre-served, however it was scaled back to a “bare bones” program. (According to budget documents, about half of the 2009-10 appropriation was swept). Th e program has been narrowed to focus on training teachers to diff erentiate for advanced learning, which the district leadership describes as a critical piece of GATE. Th e district also uses some Title II funds for some of the professional development associated with the GATE program.
While parents and teachers in some districts pushed to maintain GATE, there was no evidence of overt oppo-sition to district decisions to “sweep” funding. In one instance, parents in Brandeis advocated successfully to keep using GATE funding to support the Ballet Folk-lorico. However, this description from a school site council member in Rutledge was more typical.
Th ey told us to hold off on spending that money and then at the end of the year they swept it. I felt like I got scammed. I think the district got scammed too. I felt that that one group wasn’t getting anything. You’ve got ELAP and school and library, but pretty much all money seems to be going to those at the bottom, not at top. Very little to help those at the top. Th ere still isn’t any emphasis to make good better and better best. We’re (parents) trying to supplement that and do it on our own through career days or other things.
Targeted Instructional Improvement Block Grant (TIIBG). Responses to districts’ allocation of TI-IBG funds is complicated by the fact that TIIBG is an ambiguous funding source with no clear state policy goals. Th e TIIBG program prior to Tier 3 fl exibility was a combination of two previous funding streams:
39DEREGULATING SCHOOL AID IN CALIFORNIA
Court-ordered and Voluntary Desegregation and the Supplemental Grant Program. Th e former reimbursed district costs for desegregation eff orts while the latter provided supplemental funds to districts that did not qualify for other, state categorical programs.
Th e legislature created the TIIBG program to allow dis-tricts receiving desegregation money to keep it even if they were no longer under a desegregation order, with the provision that districts target those funds to their lowest-achieving students. Th e Supplemental Grants Program, on the other hand, provided additional funds to districts (mostly suburban) to be allocated among approximately fi ft een existing categorical programs (e.g., transportation, instructional materials). Subse-quently, it was folded into the new Targeted Instruc-tional Improvement Block Grant. Prior to SBx3-4, the amount of funding for each district was based on prior year allocation.
Th e lack of a clear policy purpose for the funding is underscored by the fact that districts do not have any specifi c priorities associated with the funding. In Powell, offi cials knew little about the funding stream. Moreover, the amount of allocation varies tremen-dously across districts. Some districts may receive as much as $1,000 per pupil (one sample district received over $2,000 per pupil), while other districts with simi-lar characteristics might receive only $40 per pupil.
Allocation of Tier 3 TIIBG funds varied with district need. Administrators in Powell shift ed TIIBG monies to transportation, while Duvall combined funds with stimulus dollars to pay for a language arts textbook adoption. Holmes swept half of its TIIBG funds and allocated that to various programs while it used the other half to continue operating two magnet schools designed to maintain racial balance among its schools. Cushing swept more than a third of its TIIBG funds and allocated the remainder among various programs
including a special high school career program. How-ever, interviewees believed that more pressing needs would probably lead to a loss of funding for this pro-gram in the coming years.
Teacher Credentialing Block Grant (TCBG).6 Th is block grant, a product of earlier categorical-aid con-solidation, was generally swept into district general funds. Yet districts retained some professional devel-opment activities that they supported from general-purpose funds. In about half of the districts, decisions about professional development activities shift ed from schools to the district offi ce. In Holmes, leaders swept professional development funds and cut activities. In other districts, federal Title II dollars replaced state dollars for professional development or were com-bined with district general funds. In two districts, professional development monies were swept into the general fund, but some professional development components, buy-back days for instance, were retained because they were in the union contract and thus could not be changed without re-negotiating the contract.
In Duvall and Johnson, it is unclear how profession-al development funds were used other than that they were designated as general funds. As with other cat-egorical program reductions, there was no reported community feedback about choices related to profes-sional development.
Action on other Tier 3 programs. Beyond the core pro-grams that we identifi ed a priori, we also heard much about additional Tier 3 programs.
School and Library Improvement Block Grant (SLIBG). Th e SLIBG included funds previously al-located to districts for school library materials and for school improvement programs. In most districts, school improvement and library funds were swept into the general fund. As with other Tier 3 categori-cal funds, some schools received a reduced amount of
40 DEREGULATING SCHOOL AID IN CALIFORNIA
SLIBG funds as an unrestricted allocation. Duvall was an exception to this, in that they kept the funds intact and spent them on textbooks. District responses to fl exibility in this area varied. Some districts allocated some portion of the funds to schools so they could stay current with instructional materials. In most instanc-es, schools lost control over those funds.
Instructional Materials (IM). Only four of the 10 dis-tricts provided information about instructional mate-rials. One district reported having a carryover of sev-eral million dollars, which they shift ed into the general fund with the exception of a small portion set aside for replacement books. Interviewees at Cushing noted that the IM fund had been “problematic” because the district received so much money for textbooks that they were unable to spend it (which was the reason for the substantial carryover). About half of Rutledge’s IM allocation went to the general fund. O’Connor set the funds aside for payroll. Duvall swept all IM funds into the general fund, took the carryover, and used money from SLIBG for instructional materials and new adop-tions. Of the four districts that provided information about IM, three postponed full textbook adoptions for one or more years.
Deferred maintenance. All four districts that com-mented on deferred maintenance swept these dollars into the general fund. Cushing noted that it had bond monies that could be used for deferred maintenance. Th e other three districts recognized that it was not a good long-term policy to neglect deferred mainte-nance, but believed that they had no choice. Th e as-sistant superintendent of fi scal services in Rutledge acknowledged it would take several years for the dis-trict to “get back on track” with deferred maintenance if, and when, the funding is restored, but that the cuts, “seemed easier because they were perceived to be away from the classroom.” Th e Rutledge board member we interviewed said, “It is one place you’ll pay for down
the road, but you can get along without it for now.”
Student Services. District response to various student service Tier 3 programs was mixed. Cushing swept funds and eliminated Supplemental Counseling and the Pupil Retention Block Grant (PRBG) (presumably the activities supported by the block grant). Sanford also eliminated Supplemental Counseling, swept funds previously allocated for students at-risk of failing the California High School Exit Exam (CAHSEE), and eliminated half of its school safety offi cers. Rutledge also eliminated the PRBG, Safety and Violence Preven-tion Program, and Supplemental Counseling—all by the 2010-11 budget. Duvall shift ed its PRBG funds to a summer school program to help students who have been retained at grade level. O’Connor kept the Sup-plemental Counseling program, while Marshall main-tained aft er-school programs with the use of Prop. 49 funds.
Arts and Music. Four of the 10 districts reported that they had swept Arts and Music Block Grant funds and eliminated the positions that those funds supported, though more may have done so. In contrast, Rutledge held back some funds for a roving art and music teach-er. In Powell, some schools raised funds privately in order to maintain music and art programs.
Other Tier 3 programs. Th ree districts reported sweep-ing the Physical Education Teacher Incentive Funds and eliminating the programs. Two districts reported that the Community-Based English Tutoring (CBET) program was eliminated. In Marshall, the funds were shift ed to aft er-school programs to support English language instruction. In Cushing, CBET was eliminat-ed, but partly reinstated through adult education. In Johnson, the Teacher Credentialing Block Grant was cut by several hundred thousand dollars in 2009-10 with additional reductions of up to 50 percent in 2010-11 for the later program.
41DEREGULATING SCHOOL AID IN CALIFORNIA
Next we explore district responses to Title I Part A stimulus dollars—another potentially fl exible source of funding, arriving at the very moment that Tier 3 fl ex-ibility took eff ect. We asked district leaders and school principals how they interpreted the utility of new Title I dollars and whether they were part of the budget de-cision-making that occurred over the same two-year period. First we describe district leaders’ level of un-derstanding about the purposes and potential uses of these stimulus funds, followed by a description of how districts allocated the funds.
Interpreting the Purposes of Title I Stimulus Funds
As we noted above, school districts were encouraged to spend Title I funds quickly to preserve and create jobs. Th e guidelines also directed districts to improve student achievement, ensure transparency and make investments that avoided a “funding cliff ” when these dollars ran out. We heard widespread confusion about the aims of and constraints around Title I stimulus dollars, both across the 10 districts and among lead-ing staff within individual districts. Many individu-als either did not know how these funds were spent or interchangeably spoke about the larger stabilization funds more generally, without a clear understanding about this specifi c category of Title I stimulus funds. In some cases, even top-level district administrators were unclear about the details of these stimulus funds. For example, one superintendent could not answer our questions and referred us to their CFO for more information. Another superintendent confl ated Title I stimulus and stabilization funds throughout the inter-view. In another district, individuals responded to our questions by describing how regular Title I funds were
used along with how they chose to allocate the IDEA stimulus and stabilization dollars.
In particular, there was disagreement across districts about the perceived purpose and allowable use of these stimulus funds. In half of the 10 districts, some respondents stated that the federal government did not intend these funds to be used for personnel and other expenditures with recurring expenses; and a few interpreted such use as violating federal guidelines. In Brandeis, respondents believed that the only way to use the funds for teaching positions was if those posi-tions had been cut and the replacement positions were given a diff erent title. “It can’t look the same,” said one central offi ce administrator. “It has to look diff erent.” In this same district, however, other respondents noted that they were unclear how the funds could be used.
In Rutledge, central offi ce administrators heeded ad-vice from the California Association for Federal Pro-grams to discourage schools from using these stimulus funds for personnel, citing a rule of thumb that one does not use one-time money for people. Th e two prin-cipals interviewed in this district clearly understood this message and knew only to allocate these funds to personnel if they could prove that other funds were available to cover the ongoing costs in future years. In contrast, respondents in Cushing reported that the in-tent of these stimulus funds was to save jobs and there-fore should be used for these purposes.
“Some districts…took the stimulus money and rescinded hun-dreds of layoff s. Well, I read the criteria of the stimulus money and that was not the criteria.” – Marshall board member
“If we are going to start something that is going to go away in a couple of years, if we can provide something useful in those two years, great. But if we’re starting slow and gaining momentum and by the third year we can’t continue the program because there’s no more money, in my opinion that’s a waste. And it’s a disservice to the students.” – Marshall administrator
42 DEREGULATING SCHOOL AID IN CALIFORNIA
Allocation of Title I Stimulus Funds
Overall, we saw little eff ort to coordinate use of Title I stimulus funds and Tier 3 funds. Th e majority of districts treated these as a separate funding streams and made decisions about the use of stimulus funds independent of decisions about Tier 3 categorical pro-grams. In two districts, however, decisions concerning the use of Title I stimulus funds were closely linked to decisions made regarding Tier 3 funds. In both cases, leaders believed the allocation of stimulus funds helped to minimize the negative consequences of decisions to “sweep” Tier 3 categorical program funds into the general fund. Cushing leaders used part of the stimu-lus funds to hire middle and high school counselors who would have been cut as a result of their decision to sweep the Tier 3 counseling program. In Rutledge, one rationale for allowing schools discretion over stimulus funds was to off set the loss of resources resulting from extensive “sweeps” made to Tier 3 programs.
Even though many respondents across the 10 districts acknowledged that it was not sensible to use one-time stimulus funds for personnel and other expenditures with recurring expenses, fi ve districts still made this decision. At least two districts, including Sanford and Cushing, used the funds to hire teachers and lower class sizes in the lower elementary grades. In Holmes, some of the Title I stimulus funds were used to hire a district-wide Response to Intervention (RTI) special-ist. Powell used some of this money to save two full-time equivalent positions, and Duvall used much of the funding for a counselor, instructional assistants, and a principal.
In some cases, respondents cited the economic crisis as one rationale for their decisions to allocate Title I stimulus funds to personnel and felt they had no other choice to prevent further layoff s. Further, most dis-tricts appeared to make these decisions reluctantly
and, in some cases, with internal opposition. As one central offi ce administrator explained: “Th e state did a very good job of telling us over and over that this money will go away [and to] not get used to it, but I think when people are hemorrhaging so much they just want to stop the bleeding.” Th is same administra-tor indicated that the use of Title I, Part A for positions was not her preference:
Stimulus money is like other grants that we have had that have a life. And you don’t spend those kinds of money on things. You spend that money on things that will keep on giving aft er the money has run out. You develop and implement a curriculum. You do those one-time things that will continue to yield something. You build a bridge. You don’t buy a car that will continue to have expenses. Th at is the mindset that I came into it with. You know curriculum reform, instruction reform, let’s buy some materials that we can use long aft er the money is gone. A position is a hungry thing; you will have to keep feeding it. I saw this as a one-time thing, I didn’t have a say on that, but that would seem to be the best way to spend it.
Overall, the majority of the 10 districts took a cen-tralized approach to allocating Title I Part A stimulus funds. In fi ve districts, central offi ce leaders decided how to spend the funds, providing school leaders with little to no say over these decisions. In fact, Duvall nor-mally passes regular Title I funds down to schools to use at their discretion, but felt that the stimulus Title I funds came with more fl exibility than the regular Title I funds and thus could be channeled more productively at the central offi ce level. One administrator explained,
[Title I Part A stimulus funds] lent itself more to a cen-tralized management style, versus the normal Title I allocations which we do push down to sites. Given this extra money, we could choose centrally which programs to supplement and how to leverage those dollars, instead of spreading it out too thin across all seven Title I schools
43DEREGULATING SCHOOL AID IN CALIFORNIA
so they could sit on it again. Let’s spend the stuff !
Th ree districts provided schools with some discre-tion over stimulus funds within certain centrally de-termined parameters guiding use. In Johnson, schools received the funds but were asked by district leaders to set aside a portion of the funds for summer inter-ventions and a portion for professional development to support a district-wide math initiative. Schools had complete discretion over use of a third portion of funds. In Holmes, district leaders decided to use stim-ulus funds to advance the district-wide reorganization of Response to Intervention, but allowed schools some discretion over which training and materials to pur-chase. In Cushing, low-performing Title I schools were required to use these stimulus funds to hire teachers and lower class sizes in grades K-3, while other schools had more discretion.
Only two districts—Brandeis and Rutledge—passed the majority of stimulus funds through to Title I schools, allowing them to make allocation decisions with very little guidance from district leaders. Brandeis leaders, for example, felt strongly that these funds were a “lifeline for principals.” According to the superinten-dent, “We have continued to step aside and let the Title I money and augmentations go to school site coun-cils. And actually, a principal would tell you they have absolute decision-making over that. Th at may be the greatest source of discretionary dollars that we have.”
Finally, it is worth noting that there was some variation in the extent to which districts spread out the use of Title I stimulus funds over time. Sanford, Powell, and O’Connor chose to use all of their funds in one year. A respondent in one of these districts said that because of the many reporting requirements it was easier to use the funds at one time. Other districts spread out the use over time. For example, Cushing spread out the funds evenly over two years. Duvall used some in 2008-2009, the majority in 2009-2010, and then had a small carry
over for 2010-2011. Another district fi gured out a way to spread out use over fi ve years, indicating that funds were “spent on the books” in one year but actually used over a longer period of time.
44 DEREGULATING SCHOOL AID IN CALIFORNIA
Section 5Decision-Making Processes that Guide District Allocations
Backing up from the budget decisions made by districts, we also examined the deliberative pro-cesses that led to these decisions around Tier 3
dollars.7 Th ese processes, which largely though not ex-clusively unfolded in district offi ces and with school board members, varied across the 10 districts. Our interviews and document reviews focused on which stakeholders were involved and what sources of infor-mation may have shaped these decisions. Th e follow-ing sections examine each of these areas.
District Decision-Making
Although in many districts a broad group of stakehold-ers participated in setting goals for the district or de-bating budget cuts and priorities, the superintendent and senior staff largely controlled budget decisions, which then went to the local school board for approval. Th is proved particularly true for decisions regarding the use of Tier 3 funds.
Stakeholder engagement. Some districts engaged in formal, structured processes to solicit stakeholder in-put on budget cuts, most notably O’Connor, Powell, Cushing, and Rutledge. For example, in 2009-10, Pow-ell leaders visited schools to identify site leaders’ pri-ority programs and expenditures, noting which were most related to the “core” set of activities aff ecting their main mission of educating students. Leaders then so-licited similar input from staff and parents at a series of meetings. All of this input informed the ultimate prioritization of three “tiers” of cuts. A district admin-istrator explained,
What we tried to do is put as many budget reduction ideas as we could on the dart-board and then take those
ideas out into the community to get input from the com-munity on how we should prioritize those things. It was really a community-intense process. We had a dozen meetings at all of the school sites. Community members attended. Th ey were very well attended by staff , particu-larly by teachers. Th rough that process, we prioritized the reductions.
A principal in Powell confi rmed the inclusive nature of this process:
We were involved. Th e whole district was involved. Teachers. Th e CFO gave a list of proposed reductions last year, passed out sheets, and had people indicate what they would get rid of from that list. Th ese were the next areas that we would cut if we needed to reduce our funding. Th is was presented to the board in January of this year. Th ese were Administrative Council meetings, and at every school site for the staff . All staff – classifi ed, certifi cated. It was pretty transparent. Th en, the fi nal de-cision was made by [sic] Cabinet.
Similarly, O’Connor held parent workshops in which district leaders shared a list of potential cuts developed by the school board and asked parents to rank them. Cushing leaders administered surveys to teachers, ad-ministrators, classifi ed staff , and parents to identify their priorities. Th is district also organized a budget advisory committee with a wide variety of stakehold-ers, including community and parent groups, manage-ment, and unions, which came up with their own list of budget priorities. Rutledge also sponsored a budget advisory committee in 2008-09, which came up with a list of budget priorities and suggested cuts. Due to the dire economic situation, however, offi cials did not re-convene the group in 2009-10, citing the need for ma-jor decisions around layoff s and school closures to rest in the hands of district leaders. Many of these eff orts to solicit stakeholder input were instigated when either a new superintendent or new board members took of-
45DEREGULATING SCHOOL AID IN CALIFORNIA
fi ce. Also, most did not directly address stimulus or Tier 3 funding decisions but instead, cuts that could be made in general.
Among our 10 districts, there was wide variation in the nature of specifi c stakeholder involvement in dis-trict-level budget decisions and the extent to which they participated substantively in decisions. In many districts, the involvement of stakeholders appeared to represent one-way communication eff orts to ensure transparency about the budget (e.g., sharing decisions at board meetings or community forums). In a few districts, stakeholders appeared to provide substantive input into the decision-making process and there was evidence of direct infl uence on district decisions. In Powell, for example, administrators attribute the deci-sion to preserve class-size reduction in lower grades to community and teacher input and also noted that community feedback prevented further cuts to adult education.
Board members. In some cases, board members ap-peared to easily approve administrators’ recommen-dations and were not substantively involved in setting those priorities (e.g., Marshall). In contrast, board members in other districts were more involved in set-ting the priorities and making the decisions. For exam-ple, in O’Connor, the election of new board members led to what many described as a shift from district-driven to board-driven decision-making and control. One central offi ce administrator explained this shift and the increasing demands for information among the new board members during meetings:
If it had been the old board, we would have come and said, ‘Here’s our recommendation. Here’s [sic] the priori-ties. Here’s what we want.’ Th en they would have given the blessing and moved on. But when you have a new board, and a new confi guration of a board, you have to learn how they want the information presented, and
they have to learn how they want the information pre-sented. Th ey weren’t sure. So as they were trying to talk out loud about how they want to get this information, months are slipping away.
Labor unions. In three districts, the unions partici-pated on formal budget advisory committees. In San-ford, administrators asked all three unions (teach-ers, administrators, classifi ed) to contribute a certain percentage cut of their previous year’s compensation package to help balance the 2010-2011 budget and al-lowed them to decide how to achieve this. As a result, the teachers’ union was poised to play a major role in deciding whether to eliminate class-size reduction, re-quire furlough days, or change the level of benefi ts. In Rutledge and Cushing, which engaged the union in a budget advisory committee, the union leaders inter-viewed did not feel that eff orts to solicit input were genuine. One union leader suggested that the commit-tee (and survey of stakeholders) were merely for show to justify district actions. In contrast, in Holmes, the teachers’ union met regularly with central offi ce lead-ers and participated in making decisions around Tier 3 fl exibility. Th ere was little indication of substantive union involvement in our other sites. In fact, union members in Marshall were upset that they and site-level staff were not involved in the decisions concern-ing the use of stimulus funds.
School staff . Involvement of site leaders varied widely across the sites. In a few districts, principals appeared to be substantively involved in informing district-level budget decisions. For example, a new principal advi-sory group in Johnson was active at the time of our visit and interviews indicate that central offi ce leaders responded to this input. As noted above, principals in Powell also believed they contributed to decisions about budget cuts during meetings and through sur-veys. However, in many other districts, we heard from principals that they were not consulted and in some
46 DEREGULATING SCHOOL AID IN CALIFORNIA
cases simply informed about budget decisions. For ex-ample, one high school principal in Cushing reported,
Right now, the fi scal constraints for this district and ev-ery other district in the state of California are deeming it that they [district leaders] are taking a very heavy-hand-ed approach to expenditures of income and sometimes our input is not taken into account.
Regardless of the nature of stakeholder involvement, in many cases these eff orts refl ected a deliberate dis-trict-level strategy to garner support for budget deci-sions. In the majority of the 10 districts, respondents conveyed a strong commitment to ensuring transpar-ency regarding the budget and decisions made about cuts. For example, the new superintendent in Duvall was working hard to communicate with the union and sites about budget decisions and to provide them with information that may not have been shared publicly in the past. Th ese eff orts were believed to facilitate buy-in for new reforms.
Similarly, leaders in Powell believed their eff orts to share information about the budget with the commu-nity on their website and in meetings built widespread trust in the district and support for their budget deci-sions. A board member in this district reported:
[I]t was a positive process…Even though some people aren’t necessarily happy, they understand it. Th ey feel like we’re all in this boat together, and we’re doing the best we can. Because of the process and because of how much communication and transparency we’ve had, that has helped.
Several respondents in this district attributed their suc-cess at building support to leaders’ ability to translate complicated budget information into digestible forms and to explain ways in which cuts aff ected services to students. In Cushing, leaders also believed that the lack of opposition to their ultimate budget decisions
resulted from their concerted eff orts to solicit input and communicate clearly with all stakeholders.
“If you have a sweetheart program that nobody wants to give up, then how fl exible can you be?” – Powell admin-istrator
“When you’re a small district like this, it’s hard enough to fund a lot of diff erent programs…we don’t want to lose the ones we have.” – O’Connor administrator
In contrast, there were several districts that did not utilize a public process for decision-making or invest in eff orts to promote transparency. For example, lead-ers in Marshall said that they took into consideration community values but did not formally involve com-munity members in the decision-making process. Others may have sponsored outreach eff orts to share fi nal decisions, but did not engage in formal solicita-tion of input.
Decisions about Tier 3 Flexible Funding
As noted, superintendents and other top administra-tors were the primary decision-makers about the bud-get and particularly about the use of Tier 3 and stimu-lus funds. In Marshall, the superintendent appeared to operate behind the scenes and reported moving quick-ly to make decisions before advocacy groups could form and derail his eff orts. In Johnson, the superinten-dent and chief fi nancial offi cer were said to dominate the decision-making process. According to a board member, “Th e specifi c actions about moving some of the Tier 3 funds were done by the [superintendent]. In my opinion it came down to, ‘We need money and we need it now.’ It was more unilateral.” Several central offi ce administrators in this district even commented on feeling excluded from the process and caught off guard by decisions made. In this district and in San-ford, there appeared to be some divisions within the central offi ce, with instructional leaders feeling that
47DEREGULATING SCHOOL AID IN CALIFORNIA
fi scal leaders were making decisions without enough attention to instructional priorities.
In Powell, the cabinet was said to make most of the decisions and with regard to stimulus, and many other respondents did not even know how the funds were spent. Th e superintendent in Rutledge acknowledged making all decisions regarding Tier 3 funds with cab-inet members, noting that, “I don’t want to push the hard decisions to the line managers. I believe it is a cabinet and board decision, of course with commu-nication to principals.” Similarly, regarding stimulus funds, another superintendent explained, “It was a col-laborative process, this was something to be shared, but I was clear that I was making the fi nal decision.”
School Decision-Making
In several districts, we were told that the new state guidelines concerning Tier 3 funds allowed princi-pals to bypass prior requirements to include all Tier 3 resource decisions in the Single Plan for Student Achievement (SPSA) and gain approval from School Site Councils (SSCs). As a result, in theory, principals had greater discretion to use the Tier 3 funds without involving other stakeholders in the decision-making process.
In practice, some principals seized the opportunity and relished the new freedom to make these decisions on their own. Th ese principals generally appreciated this fl exibility, not because they disliked obtaining in-put from others or feared that SSCs would interfere with their plans (because in most cases, SSCs gener-ally approved principal recommendations). Instead, the fl exibility aff orded them the ability to more quickly respond to school needs and avoid the bureaucratic paperwork and planning tied to the old system. One elementary school principal in Johnson greatly appre-ciated this new fl exibility, noting: “You don’t have to wait for a monthly meeting and you can just make the
decisions about the money immediately.” She added,
For the most part the SSC listens to and takes my profes-sional judgment on how to spend money. I present how the funds should be used and nine out of 10 times it will be allocated [in that way]. However to get [the funding] processed it’s not just that. You have to type up all the minutes. Th en you have to type up an amendment to the school plan... then have to get the SSC chair back in to sign that… so it’s not only the delay of getting the idea approved. Th en you have to spend a lot of time doing the paperwork.
Similarly, an elementary school principal in Rutledge reported that the ability to bypass the SSC provided her with the ability to create a reserve fund for quick-response:
We try to not spend our fl exible money—the slugbug [School Library Improvement Block Grant] and the GATE—for two reasons. One, being that if we need something for the school; the other part of fl exibility with those funds [is that] we don’t have to go through the pro-cess of putting it in a SPSA plan and going to the school site council. We do share what we want to do with that with our school site council, but there is not all the pro-tocol you have to do with the other categories, it’s almost treated like general fund. So we try not to touch that un-less … If we can fund it other ways we don’t want to touch it so that if we need that fl exibility we have it…[In the past] we always had to put [plans for spending Tier 3 funds] in the plan and it had to be approved ahead of time before you could even spend it, and you really had to think ahead and if things come up then you get your-self in trouble.
Other principals in all three districts, however, adhered to the old protocol of involving SSCs in their Tier 3 al-location decisions in the spirit of collaboration. For ex-ample, unlike his elementary school colleague quoted above, a high school principal in Rutledge recognized
48 DEREGULATING SCHOOL AID IN CALIFORNIA
that he could make Tier 3-related decisions on his own, but decided to bring these decisions to the SSC for approval because it “seemed to be the fair thing to do” and he was “trying to be collaborative with teach-ers.” Similarly, an elementary school principal in Pow-ell said “I still run everything by them [SSC] out of re-spect for this little operation we have going on here.” Similarly, a Duvall central offi ce administrator report-ed that principals continued to involve their SSCs to ensure support for these decisions:
I think the principals are still trying to get buy-in from their site councils…Th ey are still responding to older regulations. Just trying to involve parents and have the conversation about spending, even though they don’t re-ally have to, really. Th ey do know that, but still value the method of involving parents in resource allocation.
In contrast, in four districts, signifi cant “sweeping” by the district left little Tier 3 funding available at the site level and no real perceived opportunity for principals to take advantage of this new fl exibility regarding deci-sion-making. “When you can’t buy anything, it actual-ly makes decision-making easier,” said one elementary school principal in Duvall, “Th ere are no decisions to be made.” Respondents in several other districts simi-larly noted that principals were receiving fewer discre-tionary dollars and opportunities to exercise greater control over decision-making. Not surprisingly, all but one of these four districts was categorized as fi scally unhealthy.
Information Sources and Networks
When asked where they received information and guidance about Tier 3 fl exibility, central offi ce leaders widely cited a few key organizations. First, the super-intendent and/or chief fi nancial offi cer in all ten dis-tricts cited School Services of California (SSCA)8 as a key source of information about Tier 3 reforms. Th is was, in fact, the only entity cited by all ten districts.
For example, the Brandeis, Rutledge, and O’Connor superintendents all reported getting key information by attending SSCA conferences in 2009. Th e O’Connor superintendent noted that SSCA warned the district that it might not be able to make payroll in May 2010 if it did not sweep Tier 3 program dollars to supple-ment the general fund. Others reported gaining valu-able explanations of the budget and new regulations from SSCA. For example, the chief fi nancial offi cer in Sanford explained, “I always start off listening to the governor’s address. But when he says, ‘I’m cutting $6 billion dollars from education,’ how does that aff ect us? What does it mean? School Services will take that $6 billion and break it down for us.”
Several public organizations were also cited as impor-tant informational resources, although less frequently than SSCA, including: the County Offi ces of Educa-tion (cited in seven cases), the Association of Califor-nia School Administrators (six cases), the California School Boards Association (fi ve cases), and the Cali-fornia Department of Education (four cases). Offi cials in fi ve districts cited their peers in other districts as information sources. Interestingly, in four of these fi ve cases, the district enrolled fewer than 10,000 students, suggesting that peer networks were particularly im-portant sources of information and advice in smaller districts. For example, district staff in Brandeis men-tioned feeling isolated from other districts, and the su-perintendent, chief fi nancial offi cer, and chief academ-ic offi cer each meet monthly with their counterparts from other districts in the county.
Within the 10 districts, information about Tier 3 re-forms appeared to diff use primarily through district meetings or directly from top central offi ce leaders. For
“We needed to learn about this quickly. I was going on the web and googling everything.” – Cushing administrator
49DEREGULATING SCHOOL AID IN CALIFORNIA
example, the district meetings or trainings at which Tier 3 information was shared with school and dis-trict leaders were delivered in several formats, includ-ing otherwise-scheduled meetings among principals (Holmes, Cushing, Rutledge) or budget or community forums at individual school sites (Powell, O’Connor, Duvall). In O’Connor, in addition to holding com-munity forums, the district hosted an event where the chief fi nancial offi cer and superintendent trained prin-cipals and school secretaries on the various revenue streams and their diff ering levels of restrictions. Th e elementary principal we spoke with believed the train-ing session was useful. Similarly, the high school prin-cipal in Powell reported receiving clear information from the central offi ce: “We were involved. Th e whole district was involved... [Th e Tier 3 process] was pretty transparent.”
Th e other main within-district sources of Tier 3 infor-mation were central offi ce staff members, including the chief academic offi cer (cited in fi ve cases), the chief fi nancial offi cer (four cases), and the district categori-cal director (three cases). Staff in four cases, including both larger and smaller districts, reported relying on their colleagues within the district; for example, inter-viewees in Cushing reported regularly relying on their peers’ knowledge, while the Sanford elementary school principal we spoke with referred to fellow principals as being “like family” who lunch together and make deci-sions aft er meetings at the central offi ce.
50 DEREGULATING SCHOOL AID IN CALIFORNIA
Section 6Consequences of Tier 3 Flexibility
As described, fi scal deregulation in the wake of sharp budget reductions allowed districts to balance their budgets, protect shrinking
reserves, and pursue greater effi ciencies. By allowing districts to backfi ll cuts to their general funds, districts could focus on local priorities. Th e general consensus among interviewees was that fl exibility helped to mini-mize layoff s and sparked discussion of how spending priorities might be adjusted. In this section we de-scribe how district leaders and other local stakeholders reported the consequences of these budget decisions during the fi rst full year of implementation. We also report on how district-level debates over the shift in Tier 3 and collateral spending occasionally sparked political push-back and strained relations with key stakeholders. Th ese early results suggest what conse-quences may emerge if deregulatory policies persist or widen in coming years.
Consistent with fi ndings described earlier, the down-stream consequences of budget decisions vary among our 10 districts, in part fl owing from the four distinct patterns of response detailed in Section 3. We did observe that relatively unhealthy districts were more likely to sweep Tier 3 categorical funds to backfi ll gen-eral-fund shortfalls. Th is helped to minimize teacher layoff s, yet left Tier 3 programs more vulnerable, com-pared with districts that retained support for a greater share of Tier 3 activities.
Reductions in Services, Programs, and Staffi ng
Other than maintaining fi scal solvency and pushing effi ciencies, another consequence of Tier 3 fl exibility was the reduction of specifi c programs, services, and associated staff . Th e cuts were situated in a period of signifi cant cutbacks, and this served to moderate con-
troversy and push-back from local stakeholders. Tak-ing advantage of fl exibility to sweep funds from Tier 3 categorical programs, districts oft en reduced these services for students. Of course, reductions cannot be attributed to fi scal deregulation alone, but instead, are best understood as resulting from the confl uence of policy changes in conjunction with the current eco-nomic climate.
Adult education experienced signifi cant cuts in eight of 10 districts, reported above, including cuts to or elimi-nation of adult English-as-a-second-language (ESL) courses and other adult education services. Powell’s adult education administrator refl ected that declin-ing services are particularly challenging in light of the state’s economic situation, in which many unemployed adults are looking for ways to boost their skill levels. She emphasized that the impact will become more ap-parent in the next few years:
I think we haven’t even seen all of the consequences yet. I think the state is going to see it in the next few years. Right now, one out of four adults can’t read a newspa-per. More with unemployment, we have people knocking
“If we didn’t have this fl exibility, we would have laid off hundreds of people last year, to be very honest with you. Our programs would have taken a huge hit on the quality of the programs. We would not have the range of sup-ports that we have for our kids today.” – Cushing super-intendent
“We just focused on saving as much as we could so we could keep our teachers and staff employed.” – O’Connor administrator
“Some of the cuts just came as effi ciency measures. ‘Let’s look at how we can run the program more effi ciently so that we’re still providing almost as many services, but we’re just doing it more effi ciently.’ Allocating our time better, for instance.” – Powell superintendent
51DEREGULATING SCHOOL AID IN CALIFORNIA
down our doors, trying to get more education, and we give them less...So we see it, but what I think is going to happen is that society will see it a lot worse. You’re going to see a lot more ‘have-nots’ out there.
As noted in the section on the implementation of fl ex-ibility, many districts reported a reduction in other services such as supplemental counseling and GATE instruction. At least three districts, perhaps more, have postponed textbook adoptions. Nine of 10 districts swept most or all of their deferred maintenance match-ing funds, prompting several administrators across our sample districts to predict long term consequences if fl exibility and revenue reductions continue.
As for staffi ng reductions, it is not surprising then that the greatest eff ects were reported to occur in adult edu-cation hours and positions. In Duvall, over 15 perma-nent adult education instructors were given reduction in force notices for 2010-11. Most of those teachers were eventually retained by the time of our inter-views, but their positions were reduced to fewer than 18 hours per week, the minimum threshold for “per-manent” status. Johnson adult education instructors were also hit hard by the sweeping of funds, and our interviews in the late spring indicated there would be about 30 fewer teaching positions in 2010-11. As noted earlier, the part-time teachers, who are represented by a diff erent union than the full-time adult education in-structors, were the most aff ected. In Holmes, English-language development instruction time was cut from twelve to six hours per week, also impacting the hours off ered to employees.
In other areas, at least three districts cut art, music, and physical education teachers, and counselors faced reductions in at least three districts. Many districts, however, had eliminated librarian positions and arts and music teachers in cuts prior to fl exibility. Sanford planned to cut over 10 librarians [though it is unclear
if this was eventually approved by the board]. In Pow-ell, the district was uncertain if the librarian positions would be preserved. Although stimulus dollars and a community non-profi t had managed to save positions and Powell library services through 2009-10, several respondents indicated that funding for 2010-11 would become unsustainable.
“We still have so many conversations, so to say it has saved ad-ministrative time—it really isn’t true. Conversations with more constituencies than usual.” – Cushing administrator
Reductions in Administrative Costs
One argument for fi scal deregulation is the potential savings that result from no longer having to moni-tor programs and closely account for how dollars are spent. In nine of the 10 districts, however, most lead-ers stated that Tier 3 fl exibility has not reduced ad-ministrative costs. Interviewees in the 10 districts had varying perspectives about the savings of deregulation. Most fi scal administrators attributed the lack of ad-ministrative savings to the local decision to continue tracking Tier 3 categorical spending, oft en at the ad-vice of their county offi ce of education. Th e chief fi -nancial offi cer in Cushing, for example, believed that if there were certainty that Tier 3 fl exibility would not sunset, there would have been less administrative work required and some potential savings. Knowing that the district may have to revert back to the individual re-stricted funding streams, however, prevented this from occurring.
Th at said, four of the 10 districts no longer tracked spending on previously distinct Tier 3 programs. Th e two years of spending data that we collected detail sig-nifi cant declines in support for full-time equivalent (FTE) positions linked to core Tier 3 programs. Th ese staff cuts, in part, pertain to teaching posts, especially in adult education or transport posts earlier supported with TIIG funds. Still, the magnitude of FTE cuts sug-
52 DEREGULATING SCHOOL AID IN CALIFORNIA
gests that some administrative posts were eliminated in the wake of Tier 3 cutbacks.
Some respondents commented on the increased ad-ministrative time and focus required by the shift to a more fl exible system. For example, two administrators in Holmes believed that clarifying priorities and deter-mining the best use of fl exibility to maintain solvency meant a tremendous investment of time and energy, which they felt detracted from time spent advancing the district’s instructional mission. Th e superinten-dent in Holmes described the second half of the year as almost entirely focused on the budget. “From my perspective…fi rst semester we can do instructional work related to the strategic plan. And we get a little bit of time second semester with our principals meet-ings, but other than that, [the] second semester we’re focused on nothing but budget-cutting.”
Many administrators explained, however, that this ini-tial investment of time and energy could potentially lessen in future years should the fl exibility continue, because local priorities and community input have now been established. District administrators have spent a considerable amount of time in the past two years working to develop priorities and create a public understanding of the budget crisis and strategies re-quired to maintain solvency.
and community activists. Once again, the reported consequences are linked not only to Tier 3 reforms but also to broader fi scal exigencies and a climate of bud-get cuts.
District-community relations. Although Senate Bill SBX3-4 required that districts hold a public hearing to discuss fl exibility with Tier 3 categorical funds, all 10 school boards moved quickly to approve the ability to exercise fl exibility with no reported public opposition. In subsequent years, every school board readily reau-thorized fl exibility with Tier 3 funds without protest from stakeholders. Th e general sense was that districts and parents perceived fl exibility as a means of remain-ing solvent in a time of signifi cant cuts.
As noted earlier, although many districts received community and employee feedback during the deci-sion-making process, once fi nal decisions were made, most districts reported minimal outcry. Th e Sanford superintendent characterized parent response as dem-onstrating a degree of “resignation.” According to the superintendent of Powell, relations with the commu-nity were not strained because they seemed to attri-bute the reduction in services to the state budget crisis, rather than fi scal mismanagement.
In districts that received extensive input from a vari-ety of stakeholders, administrators ascribed the lack of outcry to appreciation for their attempts to honor local concerns. Th e board president of O’Connor noted, “I think that the community was satisfi ed with our dis-trict priorities because we got a lot of input from them. Since that was driving the budget, then they felt that sweeping those [Tier 3 funds] was more in line with our priorities.” Th e superintendent in Powell echoed the sentiment that Tier 3 choices did not create signifi -cant negative consequences for their relationship with their community:
Everyone was feeling pretty well involved. I think the
“We were able to negotiate fi ve days from our teachers for this year and for next year, which is huge for us, but it is only for two years. So that third year, I have to add fi ve more days back to the calendar.” – O’Connor administrator
District Relationships with Labor and Community Groups
When discussing the consequences of Tier 3 fl exibility, many respondents commented on the eff ects of these decisions on relationships with key stakeholders, espe-cially trustful interactions between district leaders and labor unions, school principals, site councils, parents,
53DEREGULATING SCHOOL AID IN CALIFORNIA
greatest frustration was certainly around the state. It was not around what we had to do in this district. It was around government budget cuts. We were just trying to fi gure out how to patch things up as best we could, and I think that people were thankful for that.
In fact, the most notable areas of parent and commu-nity feedback in our sample were over issues unrelated to Tier 3 categorical funding. For example, many dis-trict interviews highlighted vocal outcry surrounding the preservation of class-size reduction, layoff s, trans-portation, or furlough days.
District-union relations. In seven districts we visited, the relationship between district leaders and union leaders was strained by the depth of required budget cuts. Only one district reported that these relations were discernibly intensifi ed by debates over Tier 3 programs, including cuts made to adult education in Duvall. “You know, we have a pretty good and healthy relationship,” explained one Duvall administrator, “but when you get your jobs cut or hours reduced, it causes a lot of tension, and some of that frustration is direct-ed at administration.” In the other districts that noted deterioration in union relations, the issues centered primarily on furlough days, class-size reduction, and/or layoff s. Another district experienced tension with their bargaining unit as a result of the administration’s interpretation of how Title I stimulus dollars could be spent.
In Powell, O’Connor, and Holmes, district adminis-trators commented that their relationships with the unions were positive, even improved. From their per-spective, the budget crisis provided a common obstacle that could be overcome through a collaborative eff ort, a mission facilitated by categorical fl exibility. Th ese three districts were among the fi ve smallest in our sample. An administrator in Holmes stated, “I think if anything, it’s strengthened our relationship with the as-
sociation. When we have money…it’s always the game of who’s going to get the money. And now we’ve come together around a problem that we’ve all agreed upon.”
Th e HR director in O’Connor also boasted about the collaborative relationship between the district and the teacher’s bargaining unit, saying,
Th e teacher’s union in this district is phenomenal in terms of what they do in working with us, so there’s [sic] never any games. Th ey’re just realistic. We say, ‘Here’s the pot of money we have; here’s how we have to get through the year; here’s what it looks like two years out and three years out. Here’s [sic] all the things we want to do to save your teachers; here’s [sic] the other cuts we’re making in other areas, but we need fi ve days off the school-year. We just do.’ Th en, there’s still a little bargaining that goes on, but it’s really so genuinely trying to save people’s jobs on both ends, that it’s a good relationship.
“If you totally dismantle [a program], how diffi cult will it be to rebuild? Or do you scale back to mini-mum level, with infrastructure in place?” – Cushing administrator
“I wouldn’t make a decision today or not run a pro-gram because it might be gone in three years. All of programs may be gone in three years. Half of our budget is grants that are year-to-year. We’re in the business of working in the now and hoping for the future.” – Powell administrator
Th e school board president in Holmes echoed the sense of shared purpose, “Th ey [the union] under-stand the problems, and we work together -- shoulder to shoulder -- to try and work things out.”
Looking to the Future – Worries over Long-term Consequences
When asked to describe consequences they attribute
54 DEREGULATING SCHOOL AID IN CALIFORNIA
to Tier 3 categorical fl exibility, several administrators acknowledged that many of the eff ects might not be visible yet. Some felt that it may be simply too early in the implementation to fully understand and see the impact on districts and schools. Th is is especially true for decisions made for the 2010-11 budgets, given that our interviews were conducted in the late spring/early summer of 2010. For example, administrators from two districts that eliminated Grade 7-12 counseling for the following year, foresaw greater feedback from the community once the impact of those cuts was felt by the students.
In several interviews, district leaders and local stake-holders expressed concern about the confl uence of in-creasingly scarce revenues and greater district authori-ty to set priorities, occasionally with little time to make mindful decisions or encourage healthy civic debate. Two specifi c concerns appeared to reoccur across sev-eral districts.
Increased dependence on parents and community groups for revenue. In four districts, parents and foun-dations were reported to be fi lling in the gaps made by budget cuts due to the sweeping of Tier 3 programs. We heard several reports of volunteers who essential-ly staff ed art, music, library, and GATE activities, or worked alongside credentialed staff . Parents and com-munity organizations were commonly called upon to purchase basic school supplies. In O’Connor, parents and teachers are fund-raising at the site level for essen-tial classroom supplies, like paper. As a result of sweep-ing the School and Library Improvement Block Grant from discretionary budgets into the general fund, sev-eral districts reported diffi culty in providing classroom supplies for teachers.
Two Sanford principals spoke about the rising pressure to raise private dollars to provide traditional programs and services that are not permissible with the restric-
tions of Economic Impact Aid (EIA) or Title I dollars. Rather than relying on parent fund-raisers at the site level, an elementary principal in Powell is becoming more aggressive about pursuing grants. Th e district has also actively sought community partners to pay for arts and music programs aft er the block grants were swept in Powell. Actions like these prompted a founda-tion leader in Holmes to express concern that districts are becoming increasingly dependent on foundations and parent-teacher organizations to pay for basic sup-plies and services, even though these groups were orig-inally developed to provide enrichment opportunities:
It concerns me a little bit [that] PTAs are becoming funding sources. In one school, they are funding the art department, including the cost of the teacher. Th e whole thing. Th at’s admirable. My concern is that districts will become dependent on those dollars. Whether it is the PTA or education foundation, the intent of those funds is to supplement rather than become a line item.
Th e dynamics surrounding private fund-raising stem from the overall deterioration of education budgets statewide. Our fi ndings also suggest that programs not protected by categorical earmarking and rules may come to depend more on fees – as with adult education -- or private revenues.
Equity concerns. Multiple administrators across dis-tricts expressed concern that long-term fl exibility may lead to equity issues, both in regards to district fund-ing from the state, as well as support of disadvantaged students. Th ese comments generally came from dis-tricts with a large proportion of students who qualify for Title I funding, and oft en centered on discussions of the impact of “fl exing” TIIBG dollars. In Johnson, a cabinet member noted that some districts have greater expenses for police and security, which eat up the gen-eral fund budget disproportionately, when compared to suburban districts.
55DEREGULATING SCHOOL AID IN CALIFORNIA
Equity issues for traditionally disadvantaged students were another concern. Th e CFO in Johnson was par-ticularly worried about the potential for districts to shift TIIBG money away from the children the block grant was initially intended to support:
[TIIBG] used to be voluntary desegregation dollars. Folks that were really impacted, you took those dollars to take care of that. With the [Tier 3 fl exibility], you don’t really have to [direct it to those kids]. Th e question is: Should you use other dollars to target those kids? Are you fl ex-ing those and then not doing those kinds of things?... We’ve got a diverse population and we have to service all of these kids. We’re going to focus on the neediest kids. And the ones who have not done so well [in our district] are black males. [We may be] the most improved district in the last fi ve years, [but] the disparity between white kids and black kids hasn’t shrunk.
In Sanford, the superintendent was afraid that sweep-ing funds like TIIBG would have long-term impact on economically disadvantaged children and expressed hope that EIA and Title I would remain restricted funds used to target those students:
I have diffi culty believing that monies that are targeted towards disadvantaged youngsters, socially or economi-cally, will go totally to them if left to the devices of school districts. I think a portion will go, but not what’s ear-marked for them, especially in these days…I just don’t have that confi dence in the current governance structure that we have, that their rights would be protected if we were to put those dollars in, or Title I dollars, into a block grant. For some reason or another, it always happens that those who have the least clout get hurt the most. I think it’s our responsibility to protect that, so long as we can.
Several district leaders and local stakeholders also worried that non-English speaking families would be hit hard by Tier 3 cutbacks, especially regarding adult
education. In many cases, teacher layoff s hit young teachers, who were concentrated in predominately La-tino schools. While district leaders were attempting to lift the achievement of these students or advance the English literacy of their parents, the necessary sweep-ing of Tier 3 dollars into the general fund resulted in shrinking targeted programs.

56 DEREGULATING SCHOOL AID IN CALIFORNIA
Section 7Factors that Shape District Responses to Fiscal Deregulation
This section examines the conditions and factors shaping how districts responded to Tier 3 fl ex-ibility, including district contexts prior to the
enactment of Tier 3 deregulation and factors operat-ing concurrently on district decision-making. Across the 10 districts, we have already detailed the four dis-cernible responses to greater fl exibility: retrenchment and backfi lling cuts; rethinking priorities among Tier 3 program activities; gathering Tier 3 and other cat-egorical aid to sustain new initiatives; and the variable sharing of fi scal fl exibility with school-level leaders. What prior conditions within districts, along with fac-tors unfolding concurrent with Tier 3 implementation, help to explain the paths that were taken by individual districts? Th is is the question we examine next.
Capturing consistent patterns in the behavior of district leaders, each working under diff ering local conditions, proved challenging as we analyzed our interviews and fi eld notes. Expanding on the conceptual framework introduced above, Figure 7.1 enumerates the explana-tory forces that proved most salient across the 10 case districts. We specify prior district conditions and fac-tors concurrent with the budget decision-making pro-cess in 2008-09 and 2009-10, as reported by district leaders and other stakeholders. Infl uential prior con-ditions, well in place prior to February 2009 enactment of Tier 3 fl exibility, include family demographics and student achievement levels; earlier commitment to in-structional improvement eff orts; prior budget reserves and fi scal health; district size (enrollments and organi-zational complexity); and the stability or recent arrival of fresh leadership.
Factors operating concurrently with the implementing of Tier 3 did overlap with prior conditions in some cas-
es. Instability in leadership and the presence of a new superintendent, for example, played an infl uential role in budget decision-making in three of our districts. Still, four factors reportedly arose as Tier 3 implemen-tation was getting underway. Th ese dynamics include the fact that Tier 3 came with mid-year budget cuts, ongoing fi scal uncertainty, and urgency to implement; the perception that legal mandates or persisting stu-dent needs required that some Tier 3 programs be con-tinued; the ways in which Tier 3 programs were inter-twined with labor contracts; and the infl uence of local interest groups and community organizing.
Ultimately, we cannot make strong causal claims that each factor directly led to one of the four district re-sponses. Nor did each factor operate in similar fashion or with comparable magnitude in each district. Aft er all, we only examined decision-making inside 10 of the state’s 900-plus school districts. We did fi nd, however, that a portion of these prior conditions and concur-rent factors commonly operated within the 10 study districts. Th ey may operate in other districts as well. Our Year 2 survey of district leaders statewide will ex-amine this question of generalizability.
Tracking the logic of the conceptual model, we begin with the local conditions that reportedly were in place before enactment of Tier 3 fl exibility.
Prior District ConditionsLocal conditions mattered a lot as district leaders struggled with budget cuts and variably utilized Tier 3 fl exibility. Th is is not surprising, given the diversity of California’s communities and school districts.
Community demographics and student achievement. Pupil demographics varied widely among the 10 study districts. Some districts serve many children from low-income families, including Cushing, Holmes, and Johnson, where more than two-thirds of their schools receive Title I funding. Two districts showed robust
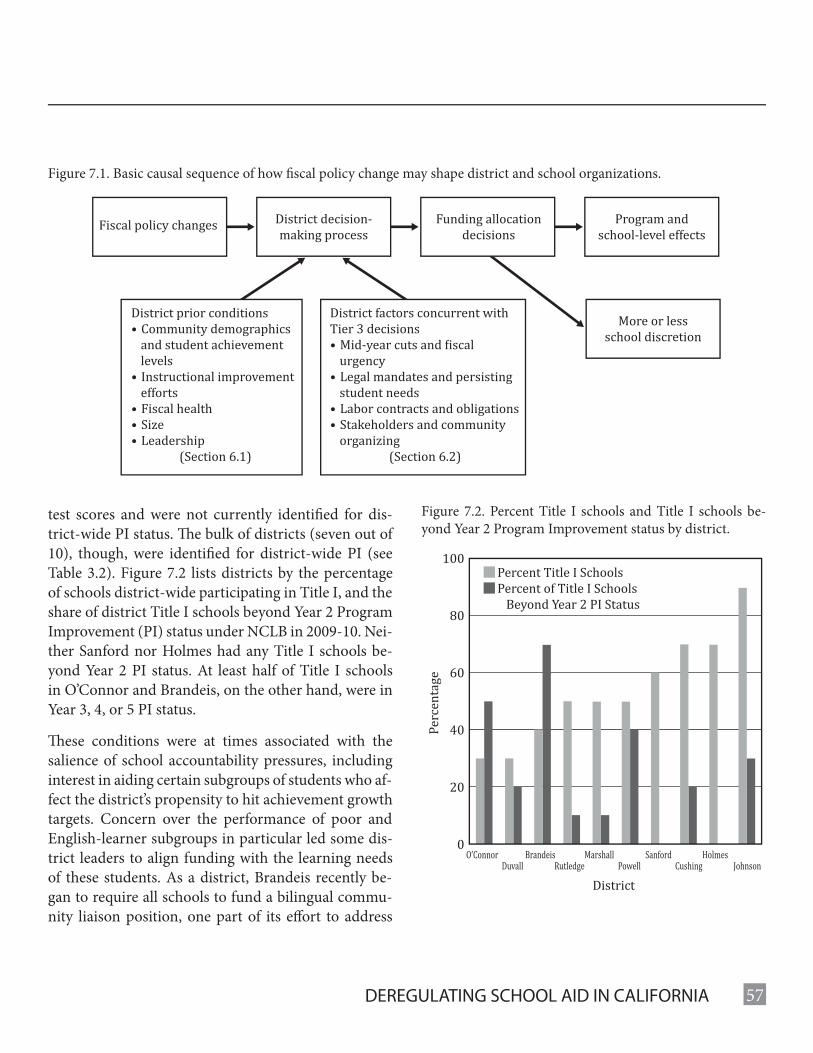
57DEREGULATING SCHOOL AID IN CALIFORNIA
test scores and were not currently identifi ed for dis-trict-wide PI status. Th e bulk of districts (seven out of 10), though, were identifi ed for district-wide PI (see Table 3.2). Figure 7.2 lists districts by the percentage of schools district-wide participating in Title I, and the share of district Title I schools beyond Year 2 Program Improvement (PI) status under NCLB in 2009-10. Nei-ther Sanford nor Holmes had any Title I schools be-yond Year 2 PI status. At least half of Title I schools in O’Connor and Brandeis, on the other hand, were in Year 3, 4, or 5 PI status.
Th ese conditions were at times associated with the salience of school accountability pressures, including interest in aiding certain subgroups of students who af-fect the district’s propensity to hit achievement growth targets. Concern over the performance of poor and English-learner subgroups in particular led some dis-trict leaders to align funding with the learning needs of these students. As a district, Brandeis recently be-gan to require all schools to fund a bilingual commu-nity liaison position, one part of its eff ort to address
Figure 7.1. Basic causal sequence of how fi scal policy change may shape district and school organizations.
Fiscal policy changes District decision-making process
Program andschool-level effects
More or lessschool discretion
Funding allocationdecisions
District prior conditions• Community demographics
and student achievement levels
• Instructional improvement efforts
• Fiscal health• Size• Leadership
(Section 6.1)
District factors concurrent with Tier 3 decisions• Mid-year cuts and �iscal
urgency• Legal mandates and persisting
student needs• Labor contracts and obligations• Stakeholders and community
organizing(Section 6.2)
Figure 7.2. Percent Title I schools and Title I schools be-yond Year 2 Program Improvement status by district.
100
80
60
40
20
0
Percent Title I SchoolsPercent of Title I Schools Beyond Year 2 PI Status
District
Pe
rce
nta
ge
HolmesBrandeisDuvall Rutledge
MarshallO’ConnorPowell Cushing Johnson
Sanford
58 DEREGULATING SCHOOL AID IN CALIFORNIA
the achievement gap between English learners and its more affl uent, white student population.
Th e recently hired superintendent of Duvall empha-sized how he was brought in two years ago to “get the district out of PI status.” Th is leader described his ap-proach as implementing a district-wide approach that uses academic conferencing and walkthroughs, pacing guides, and benchmark testing to help teachers under-stand the need for reform and how best to teach stu-dents. He centralized several funds that had previously been under site control in order to fund district-wide strategies aimed at improving the academic perfor-mance of the district’s English students. Th is included creating a central offi ce position focused on academic support for English learners specifi cally. He used the fl exibility of Tier 3 along with other categorical aid to create a teacher-coaching eff ort aimed at lift ing stu-dents’ basic reading and literacy skills. Some Tier 3 dollars were swept and then blended with Economic Impact Aid to support this new instructional initia-tive. Th e board member we spoke with enthusiastically described the superintendent as a “leader who under-stands accountability,” and credited the superintendent for creating change even within his short tenure.
Th e comparatively low performance of student sub-groups (in some cases mirroring the social-class strati-fi cation of families within the district) at times aff ected budget decisions. In Brandeis, for example, achieve-ment remained low for Latino children, who generally resided in poorer areas of the district. As a result, the superintendent protected categorical aid that had long benefi ted these students, and reached agreement with
the union to not lay off teachers with bilingual skills. Tier 3 dollars were not directly used for this popula-tion, but newfound fl exibility was reportedly a part of the budget discussion around how to best serve low-performing students.
Prior concern with and focus on improving teaching and learning. Despite the stiff fi scal challenges facing all 10 districts, a few detailed specifi c eff orts to lift in-structional quality and attend to low-performing stu-dents. Th e third pattern emphasized by Duvall and Cushing focused on the improvement of teaching, utilizing student data more rigorously, or attending to specifi c subgroups of pupils, as detailed in Section 4. Yet the likelihood of this response appeared to be con-ditioned in Cushing by the district’s strategic plan and core academic initiatives, along with a long history of focusing on classroom improvements, mobilizing stu-dent data, and engaging in steady teacher-development activities. In Duvall, the prior condition was a newly elected school board that was very concerned about the district’s recent move into Program Improvement (PI) status under federal rules. Both districts were inventive in gathering Tier 3 or other categorical aid to sustain instructional reforms, but Tier 3 fl exibility alone did not cause this focus on teaching and learn-ing. We also heard consistent reports from diff erent groups of stakeholders in the two districts about core local priorities and needs.
In Duvall, responses to Tier 3 fl exibility were explic-itly tied to reform eff orts led by a new leader charged by the board with accomplishing objectives like get-ting the district out of PI status. A board member told us, “We have a new leader who understands account-ability. He’s done more in 10 months than the old ad-ministration did in three years.” Th e superintendent and senior cabinet members were already engaged in shift ing discretionary funds toward specifi c instruc-tional strategies at the time of our visits. Th is included
“Th ere are certain benchmarks…If a school is in serious trou-ble, they could have a math coach, extra support for interven-tions, etc. All cuts or redirections have been in total alignment of what [the district’s academic] initiative stands for.” – Cush-ing superintendent
59DEREGULATING SCHOOL AID IN CALIFORNIA
district-wide staff professional development aimed at improving instruction for English learner students, hiring site coaches, and implementing benchmark testing and interventions aimed at supporting lower achieving students. In this context of strong guiding principles governing decision-making, the Tier 3 fl ex-ibility helped facilitate further investment in priority activities, even in the context of overall budget cuts.
In Cushing, budget decisions were explicitly guided by the board-approved strategic plan, which in part em-phasized lift ing student performance. Th eir district of-fi cials hammered on the district’s “academic success” initiative as driving decision-making, and for some time the district had funneled extra resources to schools that were struggling to achieve the objectives outlined in the initiative. We heard that budget decisions over-all were informed by the strategic plan and academic initiative documents, with Tier 3 decisions made by considering each program against the academic initia-tive’s guidelines. District leaders would then go back to Tier 3 program managers and ask them to adjust their off erings to align more tightly with the initiative. As one respondent explained, Tier 3 sweeps were used to “shift what we don’t need.” One stakeholder in Cush-ing even commented that decisions were made easier by the fact that the superintendent’s own performance would be judged by the school board by the degree of progress made in lift ing student test scores. In this way, the Tier 3 fl exibility helped leaders focus more clearly on priorities even as the district wrestled with budget reductions.
Th e superintendent in Johnson complained that prog-
ress in lift ing test scores had stalled in recent years. Th e district’s school-based budgeting had proven quite popular among principals and site councils, but this meant it was unclear from the district’s perspective which school-level initiatives were paying off . In this case, the superintendent was struggling simply to bal-ance the general fund and meet the district’s payroll. Once fi scal conditions stabilized, one next step was to identify what teaching improvement eff orts were yield-ing results and then to spread these strategies. Th is dis-trict’s capacity to move in this direction was reportedly fueled in part by more fl exible categorical aid dollars, including Tier 3 monies.
Accountability pressures remained in place, as dis-trict leaders struggled to balance their general fund and perhaps reallocate Tier 3 and collateral categori-cal aid. In the remaining seven districts, however, our interviews rarely turned to eff orts aimed at lift ing the instructional program. In the face of sharp cuts and teacher layoff s, the majority of districts were simply trying to constrain the rise in class size and conserve their instructional staff . We did hear concern within districts that had been in PI status for multiple years. Th is oft en triggered support from the county educa-tion offi ce or work with a school reform organization. But in the wake of ongoing budget cuts, attention to accountability requirements appeared to wane at least in the medium-term.
We consistently heard from district leaders about their struggle to juggle several priorities (e.g., keeping cuts away from the classroom, minimizing layoff s, and keeping the district fi scally solvent) across the case districts. Yet the diff erent stakeholders with whom we spoke did not consistently describe a focus on particu-lar instructional reform eff orts. When district leaders talked about keeping cuts away from the classroom, this appeared to mean keeping class size low in some settings, and retaining suffi cient materials in others. In
“Local parents and teachers had always thought reforms were burden, saw things as [the superintendent’s] mandates when they’re actually regulations in law. Th e superintendent wasn’t making things up. He was preparing district for year 3 of PI.” – Duvall board member
60 DEREGULATING SCHOOL AID IN CALIFORNIA
these districts, Tier 3 discretion, Title I stimulus dol-lars and other categorical aid were rarely harnessed to lift the instructional program in a determined way.
Comparative fi scal health of districts. As noted, we stratifi ed on the relative fi scal health of districts in se-lecting our sample of ten local settings. All 10 districts, however, were aff ected by cuts in state allocations; the majority were reducing cash reserves to help balance their budgets and minimize teacher layoff s. Th is set the tenor of budget discussions in all 10 districts. Strains on fi scal health constrained how each district could utilize Tier 3 fl exibility. Many district leaders and other stakeholders described fi scal fl exibility as one device used to simply help survive the fi scal crisis.
One administrator in Brandeis compared Tier 3 fl ex-ibility to being “on the Titanic, unbolting the deck chairs, and saying, ‘Good, you can move the chairs around now.’” Others characterized the fl exibility as a shell game, in which districts benefi ted from new-found fl exibility over categorical aid, but this refl ected mere accounting changes, not a long-term shift in state regulatory policy. A Rutledge administrator remarked, “Somehow you have to backfi ll decreases in revenue.”
In this light—implementing Tier 3 fl exibility in the context of a deteriorating budget—fi scal conditions and fi scal health made a sizeable diff erence. All dis-tricts were forced by revenue constraints to sweep a signifi cant portion of Tier 3 dollars to help balance the general fund and to minimize teacher layoff s. A few districts also swapped-out categorical aid previously allocated by school principals and site councils with temporary Title I stimulus dollars. Th ese decisions were driven by fi scal expediency: discretionary dollars were needed to balance the budget and protect teach-ing jobs.
Yet the relative fi scal health of a given district—even though we hypothesized it would matter—proved not
to be associated with the response exhibited, among the four discernible patterns related to the treatment of Tier 3 programs. When we mapped which districts emphasized one of the four types of response to Tier 3 fl exibility, we found no association with a district’s fi scal health within our two strata used to sample dis-tricts, nor with the comparative fi scal health of the 10 districts.
Beyond the material reality of cuts and the need to sweep Tier 3 revenues into the general fund, institu-tional perceptions and rules constrained decision-making at times. For instance, some county education offi ces urged districts to keep track of Tier 3 funds, even if the districts “swept” them. Th is recommenda-tion discouraged some districts from actively pursu-ing new spending choices. Th e view of the fl exibility as a short-term fi x meant that some leaders believed it was wiser to continue operating the Tier 3 programs they could still aff ord within state rules and regula-tions. Tier 3 fl exibility not withstanding, respondents in many of the study districts believed that the pro-gram regulations would return as fi scal circumstances improved or if SBX3-4 sunsets (as planned) in 2013. Th us, actively reconfi guring spending was not to their advantage over the long-term. As one chief business offi cer in Brandeis told us, “Th ey’re going to go back to the old method anyway.”
Administrative size of the district. Th e study districts diff ered greatly in size, both in terms of enrollment and the count of administrative staff , as detailed in Section 3. Th e size of a district’s bureaucratic organization – es-pecially the range of fi scal and program staff involved in decision-making—falso appeared to shape which of the four responses to Tier 3 fl exibility districts adopted. Districts with a larger administrative apparatus were more likely to shift Tier 3 programs into their general fund and align funding with local priorities in ways that moved away from Tier 3 rules and program struc-
61DEREGULATING SCHOOL AID IN CALIFORNIA
tures. Larger districts, such as Duvall and Johnson, for example, reported that their numerous schools histori-cally had signifi cant unexpended balances in categori-cal aid. Th is invited swift district-level action to sweep up these balances to backfi ll general-fund shortfalls or district-level program priorities.
We also observed that Marshall, the smallest study dis-trict in terms of enrollment and administrative staff , looked across Tier 3 programs and adjusted funding based on local priorities, rather than simply having to spend dollars on categories set in Sacramento. Th is district folded about 30 categorical programs into their general fund, and then used those fl exible dollars to spend on areas of need. Th e superintendent explained that the Tier 3 fl exibility allowed them to make key changes to their educational program, such as focus-ing on the needs of their English-learner students. Th e board member we spoke with characterized this as an opportunity to “better meet the needs of students” by tailoring services to the diverse needs of its schools. Th e district simultaneously made changes in the use of other funding streams, moving some sports and arts programs that were previously during the day to aft er school, in order to save on transportation costs. Consolidating Tier 3 funds was one of several ways the district attempted to continue to off er services while cutting spending.
Some districts were able to maintain a focus on the in-structional core, rather than being pulled by organized stakeholders, including larger counts of principals, which characterized districts with greater enrollment. O’Connor’s superintendent, for example, characterized the fl exibility as off ering a trade-off , allowing them to sweep “many programs so that we could keep others alive.” Teachers in that district argued to the board that they wanted to see a full, standards-based language adoption, but a district administrator characterized the tenor of the teachers’ feedback as, “We’d like to
move on, but we also understand that if you’re going to save a teacher, do that fi rst.”
Not surprisingly, Johnson, the district most invested in school-based budgeting, encountered greater resis-tance when trying to move principals and site coun-cils toward adjusted district priorities. Title I stimulus dollars were passed down to school-level leaders under the decentralization scheme. Yet the superintendent worried out loud about how to defi ne stronger district leadership on instructional eff orts that displayed real eff ectiveness, and then harness Tier 3 or other discre-tionary dollars to district-inspired eff orts.
Leadership stability and retaining fl exibility within the district offi ce. When superintendents articulated clear priorities, it made a signifi cant diff erence in the extent to which Tier 3 or allied categorical aid was targeted in specifi c ways. On balance, the majority of superintendents and top district staff were focused on closing budget gaps, minimizing teacher layoff s, and responding to the most salient constituency groups. Th is worked against setting clear priorities among Tier 3 programs or focusing on instructional improvement.
At times, a long-standing superintendent expressed consistent priorities, and this helped to focus budget decisions. In Duvall, a new superintendent had been hired by a largely new school board, which was deter-mined to lift fl agging test scores. So, whether leader-ship had been stable or changing was not a key factor. It was the character and focus of district leadership that led to priority setting among Tier 3 programs and the more careful targeting of categorical aid in general to explicit district priorities.
District leaders who were stable or deliberative—oft en intertwined attributes—contributed to a clearer artic-ulation of spending priorities across the 10 districts. Five districts with recently hired superintendents, de-scribed at times as “outside reformers,” reported clear
62 DEREGULATING SCHOOL AID IN CALIFORNIA
agendas relating to governance or budget priorities. Th is included an emphasis on adjusting how site-based management was operating in Brandeis and Johnson, district-wide professional development for teachers in Duvall, centralizing decision-making around curricu-lar standards and teaching practices in Marshall, and recruiting a new leadership team charged with clarify-ing district priorities in Rutledge. On the other hand, the superintendent of one of the two districts where budget decisions were guided by instructional im-provement priorities was a long-standing veteran. So, again, the newness of district leadership may be less important than a superintendent who pushes senior staff to help clarify and pare-down aff ordable budget priorities.
Th e leadership factor also arose with regard to the ca-pacity of principals and site councils to set clear pri-orities or even spend annual allocations of categorical aid. Th is held implications both for whether funds pre-viously managed by principals were swept by district leaders, whether discretion over Tier 3 programs was passed down to principals, and how Title I stimulus dollars were allocated. Some offi cials felt that the prin-cipals were not yet equipped to make optimal spending choices, at least not when set against district priorities.
In turn, we observed that district leaders retained ex-clusive control over Tier 3 funds in at least seven of the 10 districts, rather than sharing this authority with principals. Given the fi scal stringency that the ma-jority of districts had to pursue, their tendency was to reduce school-level discretion and even to sweep-up unexpended balances of categorical aid (whether from Tier 3 or other accounts). Th is was purposeful with regard to lift ing the instructional program. It also expressed part of a larger change strategy, such as ad-justing school-based budgeting or retaining teachers of English-learners in order to lift the performance of those students.
District control of Tier 3 allocations at times was mo-tivated by skepticism over whether school leaders could agree on clear priorities or program strategies. One Sanford administrator explained that the district chose to absorb Tier 3 because otherwise, “it would be all over the map.” School-level leaders (principals and a site council member) in that district reported fi nd-ing out about cuts in their categorical aid budgets in a routine meeting with district administrators. One principal described learning about the Tier 3 fl exibility in this way: “Th ey met with us and let us know, ‘Th ese are the budgets you have. Th ese are the budgets that are now being swept.’” Th is contrasts with what we heard in Marshall, where district leaders were actively training principals about preferred or “wise” spending options, guided by new district-level approval proce-dures.
Th e reduction of school-level control over spending (and staffi ng decisions) at times was seen as a rational option for advancing the effi cient allocation of shrink-ing resources. In Duvall and Marshall, the superinten-dents and cabinet members talked about using Tier 3 as a way to centralize spending choices at the district level. Th is was motivated by the perception that site leaders required additional training to make spend-ing decisions that were aligned with district priorities. For example, one district administrator in Marshall explained that many of the principals were not happy with it because they were used to having access to sig-nifi cant discretionary funds: “Now it’s being consoli-dated with the idea that they can tap into more money if they demonstrate they have a correct way of going about it.” Th e superintendent of Johnson suggested that the link between site spending and the pursuit of district priorities represented a major aim of his re-structuring agenda over the next few years.
Leadership in just two districts, Cushing and Brandeis, explicitly advocated using the Tier 3 fl exibility to en-
63DEREGULATING SCHOOL AID IN CALIFORNIA
hance site leaders’ control over spending. Even so, in Cushing, site discretion was tied to school per-formance. Underperforming schools were required to invest in K-3 class-size reduction, and in practice, administrators reported that few principals chose to invest in other kinds of instructional resources even when given the fl exibility. In Brandeis, in spite of the superintendent’s philosophy and work to decentralize decisions over resources in the prior school-year, site leaders’ control was curtailed because of the budget defi cit facing the district. Th e cabinet discovered they
these pared-back programs.
District leaders had to move fast to ensure that their spending plans were in line with shrinking resources from Sacramento and to announce any necessary lay-off s in the spring, as required by law. We heard from district staff that time pressure and the mix of pro-grams thrown into the Tier 3 designation meant that systematic planning and use of data to assess the com-parative eff ectiveness of programs would be unlikely.
As reported in Section 4, district leaders and local stakeholders also reported diff ering interpretations of how Tier 3 dollars could be used and the extent to which certain programs should be preserved or recast. District staff also talked much about having little time to weigh budget priorities, consult with board mem-bers, and make decisions without opening up too much civic debate – given the shortness of time and the signifi cance of the cuts overall.
Even when district staff aimed to engage various stake-holders – local union leaders, parent groups, and com-munity leaders – they told us that Tier 3 deliberations were largely formulated by the superintendent, chief budget offi cer, and senior staff ers, as described in Sec-tion 5. Th e timing of the Tier 3 fl exibility, coming down four weeks before districts had to submit their March budget reports to county education offi ces, meant that choices had to be made quickly.
Marshall’s superintendent talked about moving quick-ly with Tier 3 sweeps in order to minimize advocacy and pushback to protect “pet programs.” Th e time crunch also allowed district leaders to constrain wider civic discussion, at times deeming the cuts or reallo-cations as painful but necessary. In Brandeis, the su-perintendent explained that this was because the kinds of decisions Tier 3 involved were “intuitive” and “me-chanical.” In Johnson, this top-down approach to Tier 3 implementation was characterized as an eff ort to
were unable to continue passing through discretionary funding that they had just begun to give site leaders control over. Following Tier 3 sweeps, the high school’s only discretionary money came through the district’s Economic Impact Aid grant.
Concurrent Factors – Post-Tier 3 – Shaping District Budget Decisions
In addition to prior conditions, district leaders and other stakeholders reported several factors that arose aft er the February 2009 enactment of the Tier 3 re-form—motivating or constraining budget decisions. As noted, these factors overlap with some of the prior conditions we just described. Certainly, prior condi-tions persisted through the period of study covered in the present report, but it remains useful to distinguish between the two sets of factors. Th e following sets of concurrent factors were frequently observed in the majority of the 10 study districts:
Mid-year cuts and urgency. As described in Section 1, our interviews with Sacramento policymakers and as-sociation leaders revealed that multiple aims were be-ing pursued when the Tier 3 reform took shape in early 2009. Th is new fl exibility came about mid-year as the state struggled to balance its own budget, intensifying cuts in most categorical aid of about 20 percent and giving districts fl exibility to lay off staff ers attached to
64 DEREGULATING SCHOOL AID IN CALIFORNIA
make the hard decisions in cabinet, rather than push-ing them down to managers.
Legal mandates and persisting student needs. Many district leaders felt that Tier 3 programs were oft en tied to policy mandates or pressing student needs that did not go away with fi scal fl exibility. Th ese mandates rep-resent prior institutional conditions, yet their relevance became more salient as cuts to some Tier 3 programs were being considered. As one administrator in John-son explained, “If [there are] certain things we have to do, we still have to do them. It can be with any of these dollars, as long as we continue to do it. It’s not specifi c to a particular resource.” Brandeis administrators esti-mated that about 50 percent of their programs could not be swept because they remained responsible for achieving program objectives. For instance, the county education offi ce still pressed the district to serve stu-dents at risk of not passing the high school exit exam, strictly enforced under the Valenzuela court order. So, while money earmarked for such students and test-preparation services could now disappear under Tier 3 fl exibility, cutting the program could create legal prob-lems for the district and students would be ill served.
We heard similar concerns over how districts could sustain eff orts to induct and mentor new teachers. Th ese funds also became deregulated under Tier 3, but state licensing requires that some form of men-toring be in place. Some district administrators, ea-ger to lift the quality of teaching and test scores, re-ported a strong belief that mentoring was an eff ective strategy. Sanford’s superintendent explained that they took minimal funding from this source, commenting, “We’re heavily into the BSTA program.” Brandeis chose
to maintain its program so it could meet state require-ments, but eliminated the coordinator position and planned to have other district administrators pick up these responsibilities.
Th e Rutledge district eliminated its GATE program, al-lowable under the Tier 3 fl exibility. But this proved to be somewhat controversial within the district. One ad-ministrator said, “I don’t think it’s what’s best for kids. GATE kids don’t go away because there’s fl exibility. Th ey’re still here and they still need to be challenged.” Similarly, a Marshall district administrator stated, “In my eyes the fl ex[ibility] is you can move the money wherever you like, but you’re still accountable for those programs in some way or another. For example, with GATE, we still want to provide for those students, but there might not be a set dollar amount for that area.” Another administrator in that district emphasized that the programs will stay the same, but just funded us-ing general, unrestricted dollars following their Tier 3 sweeps.
Others perceived a host of mandates as well as report-ing requirements attached to these funds. As one ad-ministrator in Holmes explained, “With each of those dollars in the past come certain mandates from the state that we needed to fulfi ll. So the question comes up in our minds, ‘okay we’ve [been] given this fl exibil-ity to sweep this money, but do we still have to con-form to the requirements of that funding?’” In this district, administrators perceived a need to perform mandated counseling for high school students (related to the Supplemental Counseling program), complete comprehensive school library reports, and record at-tendance for adult education summer school.
In this way, even where programs were not offi cially maintained in terms of accounts, many districts in our sample continued to off er activities and services that addressed what they perceived as governing educa-
“I think what limits a district’s fl exibility in terms of that money is what they’ve tied to that money in the past. It’s only going to be as fl exible as the personnel you have tied to it.” – O’Connor administrator
65DEREGULATING SCHOOL AID IN CALIFORNIA
tional mandates.
Labor contracts and obligations. Given that Tier 3 dollars oft en are tied to provisions of district labor contracts, some programs reportedly continued, not because of their documented eff ectiveness, but simply because of the diffi culty of re-negotiating such provi-sions. In Brandeis, the Teacher Professional Develop-ment Block Grant was part of the existing teachers’ contract. Th e School and Library Improvement grant also had long been used to support the district’s K-3 class-size reduction program. As a result, sweeping these funds would have little impact on the amount of funding with which districts had to work because administrators had to fi nd funding from some other source to continue these eff orts. Th e superintendent commented, “Th ere was no dialogue, because it’s in the contract. It’s a shell game. And whether you want to keep paying for it out of the grant fund, or out of the general fund, it doesn’t really matter.” In Johnson, the GATE program was identifi ed as a “pass-through” in contract language, so according to district administra-tors they “had to maintain that particular stream or the equivalent amount of money.”
Respondents in districts with smaller enrollments of-ten perceived that fi scal fl exibility was constrained by dollars being tied to staff positions. Th is oft en linked back to labor contracts. We heard that discontinuing Tier 3 programs would cause layoff s. For example, some districts used the School and Library Improve-ment Block Grant mostly to pay for teacher aides in elementary classrooms. Sweeping this program meant cutting those positions. Particularly in our smaller, rural districts, decision makers talked about the hu-man costs to their budget-balancing strategies, wor-rying about how layoff s would aff ect the community at large—especially in settings where the district was a signifi cant employer. In O’Connor, one district ad-ministrator explained, “A lot of the elementary schools
depend on those aides, so we didn’t look at, at least not yet…laying off the aides. We’ve maintained.”
Still, districts large and small tended to focus on keeping classroom teachers, laying off other kinds of staff (such as counselors) instead. In Holmes, the school board president explained, “We know that having adults be in touch with kids in the school setting, teacher, prin-cipal, assistant principal, aid, librarian, or counselor is critical to their development…We are hurt by [the need to cut some of these positions]. But they are not in the classroom. Th at is where the instruction takes place. Curriculum and instruction is our call; that is our duty.”
Stakeholders and community organizing. We heard surprisingly little about controversy and stakeholder debate over district budget decisions. Th is appeared to stem from two dynamics. First, districts had to make decisions quickly in the winter and spring of 2009, and downstream decisions in the 2009-10 school-year were less dramatic. Second, teacher union leaders focused little on Tier 3 decisions; instead, they directed more attention to minimizing teacher layoff s, maintaining smaller class sizes, and protecting benefi ts for mem-bers.
Th e degree of local opposition did not appear to dif-fer signifi cantly for districts that used structured – yet more open – processes for arriving at budget decisions, compared to a centralized process driven by the su-perintendent and cabinet. District respondents gener-ally attributed the minimal feedback they received to having shared priorities with the community. Others said they were successful at clearly communicating the district’s budget situation and options. A Rutledge ad-ministrator, for example, only recalled hearing some parents’ concerns about cuts to the district’s music pro-gram, a program that had not even been on the agenda for reductions. District leaders’ eff orts to gather staff
66 DEREGULATING SCHOOL AID IN CALIFORNIA
and community input helped them decide class-size reduction was a high priority in Powell. Th e super-intendent commented: “Th at seemed like it came up over and over and over again for us…As I talked to people in the district, what I kept hearing was that we would rather have furlough days than give up what in-struction we have in the classroom: class size, materi-als, programs.”
Districts that responded by reassessing spending pri-orities or advancing new initiatives identifi ed pro-grams that spoke to district or community priorities. In Marshall, which swept most of its Tier 3 programs, the fi scal manager noted that there had not been any public comment at the board meeting where the Tier 3 sweeps were approved. He said, “Th ere was none, because we weren’t cutting programs. We were say-ing we’re going to move this money, but we’re going to continue these programs. Why would anyone object to that?”
Some districts made cuts to programs that served specifi c populations, but for unknown reasons these constituents did not complain. Brandeis, for example, serves a fairly substantial number of English-learner students, and the community itself is bifurcated along ethnic and class lines. While the district negotiated with its union to avoid layoff s of bilingual-credentialed teachers, the cabinet also chose to cut the adult educa-tion program entirely. Staff worried that the elimina-tion of English-as-a-second language in the adult edu-cation program would undercut the district’s eff orts to increase parent involvement. One district administra-tor commented about that cut, “It’s a real crime, in my opinion, because we keep asking our parents to partner in their children’s education. And if they’re monolin-gual Spanish speaking, they’re not able to do that.” But neither the cabinet nor board member remembered hearing feedback about this particular sweep.
Some actors inside the district (such as adult educa-tion or GATE teachers, and program administrators) did contest decisions. Marshall’s superintendent com-mented that Tier 3 decisions had been made behind the scenes and centralized in cabinet in order to minimize potential contestation. Most of the discussion and dia-logue, however, came from program leaders, respon-dents said, rather than from interest groups outside the district or community members. No respondent reported hearing from an organized parent or advoca-cy group in Johnson, one of the largest study districts. Most pushback came from within, as cabinet members responsible for academic services tried to protect some programs that fi scal offi cers wanted to sweep into gen-eral funds to help reduce the defi cit.
Similarly, in Sanford, the chief academic offi cer and her staff pressured the cabinet to maintain interven-tion programs and adult education, even aft er the district swept these programs into the general fund. While the specifi c examples of internal complaints we heard from respondents were few in number (possibly in part due to the centralized, cabinet-driven nature of decision-making in some districts), these incidents ap-pear to have been somewhat successful at protecting some services related to program objectives. Th is may be because stakeholders had not yet realized the mag-nitude of cuts planned for the upcoming school-year.
67DEREGULATING SCHOOL AID IN CALIFORNIA
Section 8Conclusions and Policy Implications
State policymakers have long debated whether to target educational funding to specifi c groups of students and specifi c program reforms (categori-
cal funding) or to allow local educators to decide how to allocate educational resources (unrestricted fund-ing). In California, a substantial amount of state fund-ing is awarded to local school districts in the form of categorical aid. In 2009, there were more than 60 dis-tinct categorical programs.
In response to steep declines in state revenue, the leg-islature shift ed ground in 2009 and delegated the au-thority to school districts to use funding from 40 of the categorical programs as unrestricted resources. Stakeholders we interviewed off ered several expla-nations for this policy, which is referred to as Tier 3 fl exibility. Th eir comments suggest that it refl ected a political compromise in the face of budget shortfalls rather than a carefully considered decision to decen-tralize program control. Still, the implementation of Tier 3 fl exibility provides an opportunity to track how districts respond when granted discretion over previ-ously restricted funds. At the same time, the federal economic stimulus package brought new Title I dol-lars to California school districts—a second revenue source that could be allocated with some discretion by local school boards.
Th is study was designed to explore district responses to this new fl exibility. Specifi cally, what districts did with the funds, how did they arrive at their decisions, and what the perceived consequences might have been. We also wanted to fi nd out whether districts delegated fl exibility to schools. Additionally, we tried to learn whether districts behaved in a similar manner with federal stimulus dollars. In all cases, we examined the consequences of fl exibility on equity, such as whether
local offi cials continued to allocate funds to support disadvantaged students, which is oft en one of the mo-tivations for categorical programs.
While we cannot draw valid statewide inferences from our sample of 10 districts, we think similar responses are likely to be heard in many districts in the state. As a result, we think this report contains important in-formation the governor and legislature can use as they consider and perhaps refi ne their approach to fi scal decentralization. A statewide survey of districts to be conducted in 2011 will produce more representa-tive fi ndings. Th e reader should also be cautious about drawing general conclusion regarding the deregulation of educational program funding beyond the specifi c el-ements of Tier 3 fl exibility and the particular context of budget reductions we studied. Th e fi ndings do not speak to how deregulation might play out under other circumstances.
District Responses to Fiscal Decentralization
Tier 3 fl exibility was not a well-articulated policy. Ad-ministrators in the 10 districts had diff erent interpreta-tions of regulations governing the use and reporting of Tier 3 funds as well as the legislature’s intent with respect to Tier 3 fl exibility. Some superintendents and fi scal offi cers thought that districts had complete fl ex-ibility to use the funds for any purpose; others thought the goals of each categorical program still had to be supported and the students still had to be served, al-though the money could be used fl exibly. Similarly, some administrators believed they only needed to keep records on expenditures in the aggregate, while others believed they still had to report at the program level. Th ese diff erences in opinion occurred, in part, because the communication from CDE was perceived to be inadequate. In fact, most administrators said they ob-tained their information about Tier 3 fl exibility from other sources, most notably School Services of Califor-
68 DEREGULATING SCHOOL AID IN CALIFORNIA
nia, county offi ces of education, and the Association of California School Administrators.
Top district offi cials also expressed confusion over the state’s policy objectives. Few believed that the gover-nor and legislature had thought carefully about which programs to include in the Tier 3 category. Nor did policymakers clearly articulate the goals of Tier 3 de-regulation, in part due to the rushed timeline for this mid-year policy shift . In interviews with us, legisla-tive staff , heads of education organizations, and other stakeholders in Sacramento off ered three or four dif-ferent rationales for the action.
Conditions surrounding Tier 3 fl exibility led districts to be cautious about use of the funds. Districts felt some uncertainty about their options because the leg-islation granting fl exibility expires in 2013, unless the legislature takes action to extend it. Th is sunset provi-sion means that changes districts made in 2009 may have to be reversed in the future, and some of our re-spondents indicated that this uncertainty made them cautious about making major changes. Additional uncertainty came from the fact that the legislature cut the Tier 3 allocation by 20 percent at the same time they granted districts fl exibility. Some administrators perceived a mixed message in these actions: they were granted increased discretion over a reduced amount of funding. Th e lack of clarity on all these issues may have made some administrators too cautious about using the new fl exibility to make dramatic changes in programs.
Caution may also refl ect the larger fi nancial context in which districts found themselves. Th e general atmo-sphere was one of crisis and retrenchment, and admin-istrators were focused on trying to preserve programs, rather than having time to carefully reconsider existing programs. Th ese conditions may also explain decision-making that appeared to refl ect short-term, “ad hoc”
choices more than long-term, strategic planning. In a few cases, district actions seemed to be guided by well-established local priorities, but in most cases there did not seem to be an established plan for dealing with fi s-cal constraints that are becoming the norm for Califor-nia school districts.
Th e relatively short period for action and the techni-cal nature of Tier 3 fl exibility enhanced the role of su-perintendents and their top staff in decision-making. Advocates of fi scal decentralization oft en argue that it will spur greater deliberation by local stakeholders. However, Tier 3 fl exibility was announced in February 2009 when planning for 2009-10 budgets was already underway. Th us, districts had limited time to decide how to utilize their new freedom. In most of the 10 districts we visited, the central offi ce swept the Tier 3 funds into a pool, and the decisions about their use were made centrally. Because of the need to act quick-ly, superintendents played the central role in decision-making. Similarly, complying with the guidelines re-quired understanding of the budgeting and reporting system, so the chief fi nancial administrator was a also key player.
Administrators remain committed to the policy goals that motivated many of the categorical programs in Tier 3. Policymakers expressed a concern that state-wide priorities would be abandoned if funding was no longer attached to them. For example, programs designed to foster equity could be curtailed. While we did not ask about the goals associated with all 40 programs folded into Tier 3, district leaders did speak of their continued commitment to the four major pro-grams we inquired about: Gift ed and Talented Educa-tion, class-size reduction, the Targeted Instructional Improvement Grant, and adult education. Th eir sup-port may continue for a variety of reasons, including the fact that some policy goals are enforced through court rulings, the superintendents hold these priorities
69DEREGULATING SCHOOL AID IN CALIFORNIA
as their own, and their local constituencies support these goals.
Policy Implications: Improving Tier 3 Flexibility
Despite our cautions about over-interpreting the fi nd-ings of this study, we think the information gathered from these 10 districts and dozen policymakers sug-gest some preliminary lessons for the next governor and legislature to consider with respect to Tier 3 fl ex-ibility.
Be clearer about the rules governing fl exibility. If 10 superintendents and chief fi nancial offi cers did not fully understand the rules governing this program, it is fair to assume the policy was not clearly communi-cated. Th is lack of clarity should be addressed as soon as possible.
Take greater advantage of the intermediary organi-zations that can help disseminate information. Re-spondents reported relying on various intermediary organizations for information, including county of-fi ces of education, the Association of California School Administrators, and School Services of California. Th e state department of education could take advantage of these existing communication channels to disseminate policies in the future. Th is might include focused dis-semination to these organizations as well as resources to enable them to serve school districts better.
Make legislative purposes clearer. It would be helpful if policymakers were more explicit about the reasons undergirding their actions and their expectations for implementation. We recognize that enacted policies oft en refl ect compromises and thus do not embody a unifi ed approach or philosophy. Nevertheless, express-ing the spirit of the decision can only help in its imple-mentation.
Recognize the limits (and problems) of temporary policy changes. Th e sunset provisions associated with
Tier 3 fl exibility infl uenced how some districts re-sponded to the policy. In particular, some hesitated to consider larger changes because the policy was tempo-rary. Th is uncertainty represented an additional bur-den to districts and a hindrance to thoughtful imple-mentation.
70 DEREGULATING SCHOOL AID IN CALIFORNIA
Endnotes1 Tier 3 funds received a 15.4% mid-year reduction during 2008-09, and a 20.1% reduction (an additional 4.7% reduction) for the following four years (CCSESA, 2009).
2 March 15th is the statutory deadline for districts to issue poten-tial layoff notices to teachers, as well as submit their second in-terim fi nancial reports. Districts’ second interim fi nancial reports include current year budget and multi-year fi nancial projections, and incorporate any proposed mid-year budget cuts (as in 2009).
3 Th ere seems to be no general agreement about the exact number of state categorical education programs. Th e number has ranged from 60 to 124, depending on who is counting and what is count-ed as a categorical program. It also depends on the particular year in which the programs are counted, as new categorical programs have been added and occasionally consolidated over time. Th e Legislative Analyst’s Offi ce and the California Department of Education use diff erent numbers, and even within CDE there is a diff erence between the number of categorical programs identifi ed in the SACS and in the state education budget. For the purpose of this paper we identify 40 Tier 3 categorical programs, which are listed in Appendix A.
4 Th is experimental work is being conducted by the American In-stitute for Research and Pivot Learning Partners.
5 Th e School Improvement Program (SIP) was folded into the School Library Improvement Block Grant in 2005-06.
6 Assembly Bill (AB) 825, Chapter 871, Statutes of 2004 estab-lished the TCBG. Th e TCBG includes funding for the BTSA pro-gram. Contrary to most of the other programs included in block grants established by AB 825, the Education Code sections guid-ing the BTSA program were not repealed. Th e BTSA program is co-administered by the CDE and the CTC. BTSA programs vary in organizational design and include individual districts; districts in collaboration with one another and with colleges and universi-ties; and large consortia in which districts, colleges, universities, and county offi ces of education work together.
7 ABX4-2 (Chapter 2 of the 2009–10 Fourth Extraordinary Ses-sion) directed districts to consult with the public regarding the use of the funds, “Th e governing board of the school district or board of the county offi ce of education, as appropriate, at a regu-larly scheduled open public hearing shall take testimony from the public, discuss, approve or disapprove the proposed use of fund-ing, and make explicit for each of the budget items…the purposes
for which the funds will be used.”
8 Initially founded in 1975 by an offi cial in the California Depart-ment of Finance, School Services of California (SSCA) is a for-profi t fi scal-policy consulting fi rm that today works directly or indirectly with districts across the state. Most of SSCA’s over 30 staff members have worked as school fi nance offi cials in Califor-nia or in state government.
References
Berman, Weiler Associates. (1984). Improving school improve-ment. A policy evaluation of the California School Improvement Program. Berkeley, CA: Author.
California Department of Education. (2009). Fiscal issues relat-ing to budget reductions and fl exibility provisions. Sacramento, CA: Author. Retrieved from http://www.cde.ca.gov/fg/fr/eb/yr09budgetacts.asp.
Chambers, J., Shambaugh, L., Levin, J., Muraki, M., & Poland, L. (2008). A comparative study of student-based funding and school-based decision making in San Francisco and Oakland Unifi ed School Districts. Palo Alto, CA: American Institutes for Research.
Cross, C.T., & Roza, M. (2010). How federal categorical funding prevents the eff ective use of resources. In J. Adams, Jr (Ed). Smart money: Using educational resources to accomplish am-bitious learning goals, (pp.57-70). Cambridge, MA: Harvard Education Press.
CCSESA. (2009). CCSESA BASC district fi scal oversight common message talking points 2009/10 budget and related MYPs. Sac-ramento, CA: Author.
EdSource. (2009). Local revenues for schools: Limits and options in California. Menlo Park, CA: Author. Retrieved from http://www.edsource.org/pub_local-revenues.html.
Fuller, B. (2009). Policy and place: Learning from decentralizing reforms. In Sykes, G., B. Schneider, & D. Plank (Eds). Hand-book of education policy research, (pp. 855-875). New York: Routledge.
Fuller, B., Loeb, S., Arshan, N., Chen, A. & Yi, S. (2007). Califor-nia principals’ resources: Acquisition, deployment, and barriers. Stanford, CA: Institute for Research on Educational Policy and
71DEREGULATING SCHOOL AID IN CALIFORNIA
Practice at Stanford University. Retrieved from http://www.stanford.edu/group/irepp/cgi-bin/joomla/getting-down-to-facts.html.
Goertz, M.E. & Stiefel, L. (1998). School-level resource allocation in urban public schools. Journal of Education Finance 23(4), 435-582.
Harr, J.J., Parrish, T., Socias, M., & Gubbins, P. (2007). Evaluation study of California’s High Priority Schools Grant Program: Fi-nal report. Palo Alto, CA: American Institutes for Research.
Imazeki, J. (2011). Deregulating school aid in California: How local educators allocate fl exible dollars and stimulus funds. Berkeley: Policy Analysis for California Education.
Ladd, H. F. (Ed.). (1996). Holding schools accountable. Washing-ton, DC: Brookings Institution Press.
Loeb, S., Bryk, A., & Hanushek, E. (2007). School fi nance and gov-ernance in California. Stanford, CA: Institute for Research on Educational Policy and Practice at Stanford University. Re-trieved from http://www.stanford.edu/group/irepp/cgi-bin/joomla/getting-down-to-facts.html.
Loeb, S. & Strunk, K.A. (2007). Accountability and local con-trol: Response to incentives with and without authority over resource generation and allocation. Education Finance and Policy, 2(1), 10-39.
Malen, B., & Ogawa, R. T. (1988). Professional-patron infl uence on site-based governance councils: A confounding case study. Educational Evaluation and Policy Analysis, 10(4), 251 -270.
O’Day, J.A. & Bitter, C. (2003). Evaluation study of the Immediate Intervention/Underperforming Schools Program and the High Achieving/Improving Schools Program of the Public Schools Ac-countability Act of 1999. Palo Alto, CA: American Institutes for Research.
Ouchi, W. (2009). Th e secret of TSL: Th e revolutionary discovery that raises school performance. New York: Simon & Schuster.
Raphael, J. & McKay, S. (2001). Analysis of the Educational Flex-ibility Partnership Demonstration Program state reports. Wash-ington, DC: Th e Urban Institute.
Rebell, M.A., Wolfe, J.R. & Yaverbaum, D.A. (2010). Stimulating equity? A preliminary analysis of the impact of the Federal Stim-ulus Act on educational opportunity. New York: Campaign for
Educational Equity at Teachers College, Columbia University. Retrieved from http://www.tc.columbia.edu/equitycampaign/article.asp?t=d&id=7439.
Rose, H., Sonstelie, J., & Weston, M. (2010) Pathways for school fi nance in California. San Francisco: Public Policy Institute of California.
Schenck, E. A., & Beckstrom, S. (1993). Chapter 1 Schoolwide Project study fi nal report. Portsmouth, NH: RMC Research Corporation.
Smith, M.S. & O’Day, J.A. (1991). Systemic school reform. In S. H. Fuhrman & B. Malen (Eds.). Th e politics of curriculum and testing (pp.233-267). New York: Th e Falmer Press.
Stecher, B.M. & Bohrnstedt, G. W. (Eds.). (2000). Class size reduc-tion in California: Th e 1998-99 evaluation fi ndings. Sacramen-to, CA: California Department of Education. Retrieved from http://www.rand.org/pubs/reprints/RP903/.
Timar, T. B. (2007). How California funds K-12 education. Stan-ford, CA: Institute for Research on Education Policy and Prac-tice at Stanford University.
U.S. Department of Education. (2009). Guidance: Funds under Title I, Part A of the Elementary and Secondary Education Act of 1965 made available under the American Recovery and Rein-vestment Act of 2009. Washington, DC: Author.
U.S. Department of Education (2001). High standards for all stu-dents: A report from the National Assessment of Title I on prog-ress and challenges since the 1994 reauthorization. Washington, DC: Author.
U.S. Government Accountability Offi ce. (2009). Recovery Act: Sta-tus of states’ and localities’ use of funds and eff orts to ensure accountability. Washington, DC: Author.
Wong, K. K., & Meyer, S. J. (1998). Title I schoolwide programs: A synthesis of fi ndings from recent evaluation. Educational Evaluation and Policy Analysis, 20(2), 115-136.
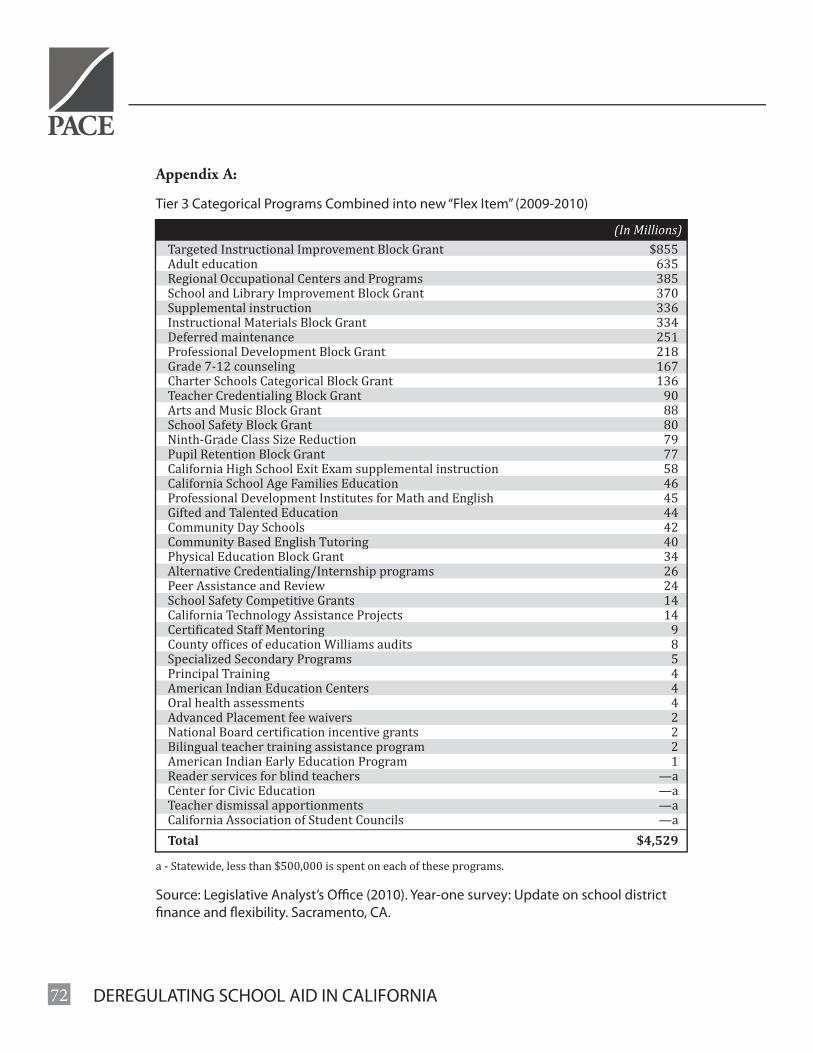
72 DEREGULATING SCHOOL AID IN CALIFORNIA
Appendix A:
Tier 3 Categorical Programs Combined into new “Flex Item” (2009-2010)
Targeted Instructional Improvement Block Grant $855Adult education 635Regional Occupational Centers and Programs 385School and Library Improvement Block Grant 370Supplemental instruction 336Instructional Materials Block Grant 334Deferred maintenance 251Professional Development Block Grant 218Grade 7-12 counseling 167Charter Schools Categorical Block Grant 136Teacher Credentialing Block Grant 90Arts and Music Block Grant 88School Safety Block Grant 80Ninth-Grade Class Size Reduction 79Pupil Retention Block Grant 77California High School Exit Exam supplemental instruction 58California School Age Families Education 46Professional Development Institutes for Math and English 45Gifted and Talented Education 44Community Day Schools 42Community Based English Tutoring 40Physical Education Block Grant 34Alternative Credentialing/Internship programs 26Peer Assistance and Review 24School Safety Competitive Grants 14California Technology Assistance Projects 14Certificated Staff Mentoring 9County offices of education Williams audits 8Specialized Secondary Programs 5Principal Training 4American Indian Education Centers 4Oral health assessments 4Advanced Placement fee waivers 2National Board certification incentive grants 2Bilingual teacher training assistance program 2American Indian Early Education Program 1Reader services for blind teachers —aCenter for Civic Education —aTeacher dismissal apportionments —aCalifornia Association of Student Councils —aTotal $4,529
a - Statewide, less than $500,000 is spent on each of these programs.
Source: Legislative Analyst’s Offi ce (2010). Year-one survey: Update on school district fi nance and fl exibility. Sacramento, CA.
(In Millions)
73DEREGULATING SCHOOL AID IN CALIFORNIA
Appendix B:List of Advisory Group Members
Jorge AyalaCounty Superintendent, Yolo County Offi ce of Education
Sue BurrExecutive Director, California County Superintendents Educational Services Association
Cynthia CoburnAssociate Professor, UC Berkeley, School of Education
Susanna CooperPrincipal Consultant, California Senate Pro Tempore Darrell Steinberg
Rachel EhlersPrincipal Fiscal & Policy Analyst, California Legislative Analyst’s Offi ce
Leonor EhlingPrincipal Consultant, Senate Offi ce of Research
Dave GordonSuperintendent, Sacramento County Offi ce of Education
Derry KabcenellDirk and Charlene Kabcenell Foundation
Matt KelemenConsultant to the William and Flora Hewlett Foundation
Kristi KimballProgram Offi cer, Education, The William and Flora Hewlett Foundation
Teri KookDirector of Child Welfare, Stuart Foundation
Jennifer KuhnDirector, K12 Education, California Legislative Analyst’s Offi ce
Steven LaddSuperintendent, Elk Grove Unifi ed School District
Susan LittleInterim Senior Program Offi cer, Stuart Foundation
Cathy Torres MercadoEducation Program Associate, Stuart Foundation
Joel MonteroChief Executive Offi cer, Fiscal Crisis & Management Assistance Team
Joe NunezAssociate Executive Director, California Teacher’s Association
Tom ParrishAmerican Institutes for Research
David PlankExecutive Director, PACE
Mike RickettsDeputy Executive Director, California County Superintendents Educational Services Association
Rick SimpsonDeputy Chief of Staff , Assembly Speaker’s Offi ce
Bob WellsExecutive Director, Association of California School Administrators
Jason WillisChief Financial Offi cer, Stockton Unifi ed School District
74 DEREGULATING SCHOOL AID IN CALIFORNIA
http://www.rand.orghttp://www.edpolicyinca.org