density-dependent growth in juvenile sockeye salmon (oncorhynchusnerka)
TRANSCRIPT
The Open Fish Science Journal, 2011, 4, 49-61 49
1874-401X/11 2011 Bentham Open
Open Access
Density-Dependent Growth in Juvenile Sockeye Salmon (Oncorhynchus Nerka)
Kim D. Hyatt1, Donald J. McQueen
2,*, D. Paul Rankin
1 and Eric Demers
3
1Fisheries and Oceans Canada, Pacific Biological Station, 3190 Hammond Bay Road, Nanaimo, B.C. V9R 6N7
2125 Pirates Lane, Nanaimo, B.C. V9R 6R1.
3Biology Department, Vancouver Island University, 900 Fifth Street, Nanaimo, B.C. V9R 5S5
Abstract: Data gathered over 77 lake-years from 4 coastal British Columbia sockeye salmon nursery lakes suggest that
density-dependent growth reductions are only possible at exceptionally high fry densities. In Great Central Lake
(n=33 years) and Sproat Lakes (n=30 years) there was no relationship between smolt weight and mean summer fry
densities ranging from 760-3800 fry ha-1
. However, in two years when Sproat Lake fry densities were unusually high
(1983=5183 ha-1
, 1996=4801 ha-1
) smolt weights were among the lowest recorded. In Woss and Vernon lakes (n=14
lake-years), there were significant bottom-up relationships between fall-fry weights and zooplankton biomass, but no
relationships between December-fry weights and average fry densities (range 331-1361 ha-1
), nor were there significant
top-down relationships between fry densities and average zooplankton biomass. Comparisons of zooplankton production
with bioenergetic-based fry consumption, suggested that the carrying capacity for Vernon Lake which had the highest rate
of zooplankton production, was 12,700 fry ha-1
, and for Sproat Lake which had the lowest zooplankton production, was
5200 fry ha-1
. We conclude that fry densities in the range commonly observed for British Columbia coastal lakes (i.e.
500-4000 ha-1
) cannot cause density-dependent reductions in prey biomass or fry growth rates. Further research is
necessary.
Keywords: juvenile sockeye salmon, density dependence, aquatic food web, bioenergetics, zooplankton production, consump-tion by sockeye fry.
INTRODUCTION
It is generally assumed that growth-rates of juvenile sockeye salmon (Oncorhynchus nerka) are positively correlated with nursery lake productivity and negatively correlated with in-lake juvenile sockeye density. The paradigm has two parts and one corollary. (1) Increased lake productivity results in larger late-fall fry and/or smolts and (2) higher densities of juvenile sockeye are associated with smaller late-fall fry and/or smolts. Zooplankton abundance is the common factor linking the two parts of this density-dependent relationship. Higher lake “productivity” is assumed to be associated with higher abundances of zooplankton, more food and therefore faster sockeye growth-rates. Consumption of zooplankton by higher densities of sockeye is assumed to result in decreased availability of zooplankton and therefore decreased growth-rates of juvenile sockeye salmon.
Studies supporting the first proposition linking “lake produc-
tivity” and fry growth include both empirical between-lake
comparisons and whole-lake fertilization manipulations.
Empirical relationships based on positive correlations be-
tween lake productivity and juvenile sockeye growth have
been found for nursery lakes in Alaska [1, 2] and British
*Address correspondence to this author at the 125 Pirates Lane, Nanaimo,
BC, V9R 6R1, Canada; Tel: 250 754 0639; Fax: 250 754 0679;
E-mail: [email protected]
Columbia [3] and have been successfully applied to the management of in-lake sockeye populations [4-6]. Compre-hensive reviews of sockeye nursery-lake fertilization ma-nipulations [7, 8] found that almost without exception, fer-tilization was associated with increased concentrations of chlorophyll a, increased zooplankton biomasses and in-creased late-fall-fry or smolt weights.
Studies supporting the second proposition linking in-creased juvenile sockeye density to reduced juvenile growth rates are all based on lake-specific observational data. Early examples come from Cultus Lake, British Columbia [9, 10], Lake Dalnee, Kamchatka [11, 12], and Babine-Nilkitkwa lakes, British Columbia [13-17]. Later examples from Alaska Department of Fish and Game (FRED) program [2] include Fraser Lake [7, 18, 19] and Coghill Lake [20]. More recent examples include the Egegik River system, Alaska [21], Quesnel, Shuswap and Chilko lakes, British Columbia [3], Wood River system, Alaska [22], Iliamna Lake, Alaska [23]. One of these studies directly links reductions in zooplankton abundance to very high densities of stocked sockeye [7], while many of the others rely on indirect meas-ures of juvenile density and/or zooplankton biomass [2, 3, 22, 23].
On the other hand, long-term (1969-76) and detailed measures of both fish abundance and zooplankton biomass in Great Central Lake (5100 ha) [24-27] showed no relationship between juvenile sockeye density and zooplankton biomass. This is also the result from bioenergetics-based juvenile

50 The Open Fish Science Journal, 2011, Volume 4 Hyatt et al.
sockeye and kokanee studies designed to compare consump-tion by fish with biomass and production of their prey. In most cases, these studies have shown that age 0 sockeye or kokanee have minimal effects on prey standing stocks. In Lake Ozette, State of Washington, juvenile sockeye and ju-venile kokanee consumed < 1% of the instantaneous produc-tion of their preferred prey Daphnia pulicaria (Forbes) [28]. In Lake Washington during March-April, age 0 sockeye con-sumed 5% of prey biomass per month and had no effect on standing stocks of the preferred prey Diacyclops thomasi (Forbes) [29]. Also in Lake Washington during April-November, juvenile sockeye plus Neomysis mercedis (Holmes) consumed only 10% per month of Daphnia bio-mass [29, 30]. In British Columbia’s Woss and Vernon lakes on Vancouver Island, during 2000-02, juvenile sockeye salmon consumed an average of < 0.5% d
-1 of the zooplank-
ton standing stock [31].
Given these very low rates of bioenergetic-based con-sumption by juvenile sockeye and kokanee, it is difficult to understand how density-dependent growth can be explained by top-down impacts of juvenile nerkids on their zooplank-ton food base.
We have addressed this general problem using three data sets. (1) We used long-term data sets from Great Central Lake (33 years) and Sproat Lake (30 years) to test the hy-pothesis that there was a significant negative relationship between fry density and smolt weight. We also investigated the relationship between adult escapement and resulting fry density. (2) We used detailed food web data sets from Great Central and Sproat lakes to quantify the proportion of zooplankton biomass consumed by sockeye fry during the 1999 spring-fall growth period. (3) We used moderately long-term (2000-06) and detailed data sets from Woss and Vernon lakes to quantify the bottom-up relationships be-tween lake productivity, zooplankton abundance and juve-nile sockeye fall-fry lengths and weights, and also the top-down relationships between average fry density, zooplankton abundance and fall fry lengths and weights.
METHODS
Preface to Methods
Given the complexity of the three data sets noted above, we have divided the methods into four sections. The first deals with the site description and long-term data for Great Central and Sproat sockeye salmon escapement, fry and smolt weights. The second deals with the site description and experimental design used for the seven year Woss and Vernon lake experiment. The third section provides detailed descriptions of the methods used to collect and analyze the food web data collected at Woss and Vernon lakes during 2000-06 and also at Great Central and Sproat lakes during 1999. These methods are summarized in Table 1 while sur-vey frequency and sample sizes are provided in Table 2. The fourth section deals with within and between-sample vari-ability.
Great Central and Sproat lakes (1977-2008)
Great Central Lake (lat. 49O22’ long.
125O15’lat.)(surface area 5100 ha, mean depth 212 m, aver-
age total phosphorus TP = 2.6 g L-1
) and Sproat Lake (lat.
49O14’ long. 125
O06’ lat.)(surface area 4100 ha, mean depth
59 m, average TP = 2.7 g L-1
) both drain into Barkley Sound at Port Alberni, central-Vancouver Island. Over the last 35 years Great Central Lake was fertilized in all years, and Sproat was fertilized only in 1985. Sockeye escapements have averaged 190,000 y-1 (Great Central) and 150,000 y
-1 (Sproat), and lake-wide juvenile densities have averaged
8,770,000 (Great Central) and 7,770,000 (Sproat).
Over 33 years in Great Central Lake and 30 years in Sproat Lake, juvenile sockeye densities, fry sizes and associ-ated smolt weights were systematically measured using in-lake echosounding, mid-water trawling (fry) and trap-netting at the lake outlets (smolts). Pelagic fish (principally juvenile sockeye) densities were estimated at night using one of four echosounders. Between 1977 and 1982 we used a Furuno FM-22, 200kHz, single beam echo sounder with 100 W of power output, a pulse width of 1.0 ms and a custom designed Time Varied Gain (TVG) to control for attenuation losses due to increasing target depth. Between 1982 and 2001, we used a Simrad EY-M, 70 kHz, single beam echo-sounder with 75 W of power output, pulse width 0.6 ms and a TVG circuit. From 2002 to 2005 we used a Simrad EY-500, single beam, 70 KHz sounder with 50 W power output with pulse width at 0.2 ms and a TVG circuit. After 2006 we used a split-beam Biosonics DT-X, 200kHz sounder with 300 W power, pulse width at 4 ms and a 6.6
0 transducer.
Cross calibration of the Furuno and Simrad EY-M echo-sounders is documented by Gjernes et al. [32]. Cross-calibration of the two Simrad machines showed that they produce similar results when configured appropriately (P. Rankin, unpublished data). Cross-calibrations of the Simrad and Biosonics echosounders were based on survey data col-lected on 13 sampling dates spread among four B.C. sockeye nursery lakes. During each sampling date, complete lake surveys were conducted simultaneously by two survey crews following identical survey transects. Total density estimates ranged from 300-4000 fish ha
-1. The relationship between
total densities derived from Simrad vs. Biosonics was Sim-rad = 111+0.9*Biosonics (n = 13, R
2 = 0.94). From this we
concluded that density estimates from the two machines were similar. Details regarding survey design and counting methods (for the single beam echosounders) follow Hyatt and colleagues [32-34] and methods (Sonar 5 Pro) for the split-beam (Biosonics) echosounder are described by Balk and Lindem [35].
Smolt samples were collected from outlet streams using a 2x2m trawl net suspended in the main channel. Sampling generally started during the last week of April and was com-pleted by the end of May. The peak migration period usually occurred between the last week of April and first week of May. After each trawl set, fish were immediately removed from the net, and preserved in 10% buffered formalin or 70% ethanol. Weights were corrected for preservative effects and expressed as fresh standardized weight (g). Detailed smolt sampling procedures are described by Hyatt et al. [33].
Woss and Vernon Lakes (2000-06)
Woss Lake (50O7’long. 126
O36’ lat.) (surface area 1366
ha, mean depth 65 m, average TP = 3.5 g L-1
) drains into the Nimpkish River and then into Broughton Strait, north-Vancouver Island. Vernon Lake (50
O2’ long. 126
O 25’ lat.)

Density-Dependent Growth in Juvenile Sockeye Salmon (Oncorhynchus Nerka) The Open Fish Science Journal, 2011, Volume 4 51
Table 1. Summary Linking Results to Methods. Column 1- Lake. Lake Abbreviations are W = Woss, V = Vernon, G = Great Central
and S = Sproat. Where Years are not Shown the Summaries Apply to Woss and Vernon 2000-06, Great Central and Sproat
1999. Smolt and in-Lake Acoustic Estimates are for Great Central and Sproat 1977-2008. Column 2 - The “Result” Used to
Draw Subsequent Conclusions, Column 3- Method Used to Collect Field Data, Column 4 – Method Used to Derive Result.
Refer to Table 2 for Numbers of Samples Per Season. Detailed Methods are Provided in the Methods Section
ß Parameter or Result Method Used in the Field Method Used to Estimate Parameter
W,V Phytoplankton species biomass integrated samples, 1,3,5 m Utermöhl (1958) counts
W,V,G,S Zooplankton species biomass 30 m vertical hauls, metered volume-weighted combined samples;
species, length-weight, egg counts
W,V,G,S Zooplankton productivity as above egg-ratio production models
W,V,G,S Fish density acoustic echo-integration
W,V,G,S Fish vertical migration acoustic as above
W,V,G,S Fish, length, weight, stomachs 2x2 m trawl net length-weights; stomach contents
W,V,G,S Rates consumption by fish density, growth, stomachs, migration, water temperature fish bioenergetics model
G,S Fish density (1977-2008) acoustic echo-integration analysis
G,S Smolt weight (1977-2008) 2x2 m fyke net length-weights, age
G,S Adult escapement (1977-2008) electronic fish-way counts resistivity counter
Table 2. Woss and Vernon Lakes 2000-2006; and Great Central (GCL) and Sproat Lakes 1999. Fertilizer Treatment and Sample Size
Fertilizer kg P
ha-1
Fertilizer kg N
ha-1
No. Algal
Samples
No. Zooplankton
Samples
No. Fish
Biosamples
Total No.
Fish Sampled
Total No. Fish
Stomachs
No. Fish
Acoustic
Samples
Woss
2000 0.4 5.9 7 8 5 376 120 4
2001 0.5 7.2 8 9 5 357 101 5
2002 0.7 9.7 8 9 7 808 109 7
2003 0.5 9.9 5 8 4 462 0 4
2004 0.0 0.0 7 7 3 284 108 5
2005 1.1 10.0 7 8 4 629 57 3
2006 1.0 8.8 6 7 3 313 97 4
Vernon
2000 0.0 0.0 7 8 4 277 120 3
2001 0.0 0.0 7 8 4 175 97 4
2002 0.0 0.0 8 9 7 423 114 7
2003 0.0 0.0 4 4 3 209 0 3
2004 1.1 10.0 7 6 3 278 86 5
2005 1.1 10.0 7 8 4 364 55 3
2006 1.2 8.1 6 7 3 265 87 3
GCL 1999 0.6 8.5 0 9 5 871 159 3
Sproat 1999
0.0 0.0 0 7 4 303 116 3
(surface area of 837 ha, mean depth 62 m, average TP = 2.9
g L-1
) drains into the Sebalhal River which also flows into the Nimpkish River [31]. The Woss River system produces approximately 25% of total Nimpkish system sockeye salmon. Vernon Lake and the Sebalhal River produce ap-proximately 20% of total Nimpkish sockeye salmon [36].
During 2000-06, the “productivity” of both Woss and Vernon lakes was altered through the addition of various concentrations of fertilizer (Table 2) and during the same period, fish density was altered through natural year-to-year variation in recruitment. For Woss and Vernon lakes, our research plan was to use the power of fertilization to increase

52 The Open Fish Science Journal, 2011, Volume 4 Hyatt et al.
lake productivity and zooplankton biomass while still hold-ing all other parameters (i.e. morphometry, species composi-tion) steady. This gave us the opportunity to isolate top-down effects of sockeye on a wider range of treatment-induced zooplankton densities.
Food web analysis Woss and Vernon 2000-06; Great
Central and Sproat 1999
The goal of the intensive 2000-06 analysis in Woss and Vernon lakes and the 1999 analysis in Great Central and Sproat lakes, was to calculate zooplankton consumption by the fish as a percentage of production by each prey species-type. When consumption exceeded production we expected to see the zooplankton population decline and at that point we could assume that the "sockeye salmon production capac-ity" of the lake had been reached or exceeded. During each lake-year, we measured species-specific zooplankton densi-ties, lengths, weights, biomasses and estimated their produc-tion. We also measured O. nerka densities, lengths, weights, biomasses, stomach contents and estimated their prey-specific rates of consumption. We then calculated prey con-sumption by nerkids as percent daily species-specific zooplankton production to draw inferences about whether consumption exceeded production [31]. This allowed us to simulate the effects of changing planktivorous fish numbers and to calculate the density threshold at which consumption by fish > production of their zooplankton prey.
At Woss and Vernon Lakes, during 2000-06, phytoplank-ton was collected approximately every 3 weeks from each of two stations in each lake (Table 1, 2). At the laboratory, each lake-date pair was combined and processed using the Uter-möhl technique [37]. Cells were identified (genus level) measured and biomasses were recorded as mm
3 m
-3 (ap-
proximates 1 μg wet weight L-1
). The objective of the phyto-plankton procedure was to assess biomasses of edible and non-edible algae. We quantified "edibility" based on size, toxicity and digestibility. Single cells or colonies < 30 m width or length were considered edible [38, 39] unless they were classified as being either "toxic" or "digestion-resistant" (defined below). Microcystis was always classified as being "toxic". Other genera were assumed to be non-toxic. Algae with gelatinous sheaths [40] were classified as diges-tion-resistant (not edible).
Zooplankton samples (Rigosha™ metered, 30 x 30 cm
square net, 100 μm mesh, 0-25 m vertical haul) were col-
lected approximately every 3 weeks at each of 4 stations in
Woss, Great Central and Sproat lakes and 3 stations in
Vernon Lake. Samples were washed out of the plankton net
with carbon-dioxide saturated water and were then preserved
in 4% buffered and sugared formalin. Sample frequency,
number of sampling sites and net metering followed proto-
cols suggested by Yan et al. [41-43]. At the laboratory, com-
bined volume-weighted samples were created and used to
estimate species-specific densities, lengths and weights. For
each combined count, 300-500 individual zooplankton [44]
were identified, measured and their eggs counted. Length-
weight regressions were used to calculate dry-weight bio-
mass for each individual [45, 46]. Our goal was to estimate
species-specific prey biomasses available to pelagic fish and
to estimate daily rates of prey replacement resulting from
species-specific production. Zooplankton production was estimated using the egg ratio method [47, 48].
During June-December, pelagic fish densities were sur-veyed 3-7 times (Table 2) using 11 transects in Woss, 7 tran-sects in Vernon, 6 transects in Great Central and 11 transects in Sproat lakes. The acoustic methods used to estimate fish density are summarized above for Great Central and Sproat lakes. Limnetic fish samples were collected 3-7 times (Table 2) using a mid-water trawl net (2 m x 2 m mouth opening x 7.5 m long). Trawl depths were based on echo-sounding re-sults. Fish were processed for lengths, weights and stomach contents. Survey protocols including stomach content analy-sis are described in McQueen et al. [31]. Our goal was to calculate June-October rates of consumption by the fish as a percentage of biomass and production by each species of zooplankton prey. For Woss and Vernon lakes (2000-06) and Great Central and Sproat lakes (1999), Wisconsin Model 3 parameters CA and CB [49] were adjusted so that simulated fry growth rates matched rates observed in the field (Appen-dix A). Model fry densities were based on curves of best fit from field samples (Table 2, Appendix A). The model was used to estimate daily consumption from mid-June to end- November for Great Central and Sproat lakes and from mid-June to end October for Woss and Vernon lakes (Tables 1,
2). In all four lakes, diel migration studies [31, 50] showed that fry fed in both the epilimnion and hypolimnion and therefore model temperatures were based on 0-40 m average water temperatures. Energy densities (J·g
-1 wet weight) were
set at 5233 J·g-1
for sockeye and kokanee, at 3000 J·g-1
for copepods and 2500 J·g
-1 for cladocerans.
For all four lakes, the calculation of “carrying capacity” was based on field estimates of average daily species-specific zooplankton production and daily species-specific consumption by limnetic fish. Simulated fish densities were then increased. When consumption by fry > production of their prey, we assumed that carrying capacity had been reached. In the Great Central and Sproat lake cases, prey production and simulated consumption by fry were based on field estimates from 1999. In the Woss and Vernon lake cases, production and simulated consumption were based on data averaged over several survey years (2000-06) except 2003 when fish stomachs were not sampled.
Within-year variability
Throughout we used seasonal averages to facilitate be-tween-year comparisons for Woss and Vernon phytoplank-ton, zooplankton, fish density and fish weight-at-age data. Because the averages were all derived from samples col-lected through the growing season, there was no meaningful way to summarize within-year variability. We have therefore provided original seasonal data for zooplankton and fish (Appendices A and B).
RESULTS
Great Central and Sproat Lakes: Long-Term Results
Smolt weights and fry densities in Great Central Lake were recorded over 33 years (1976-2008). During 31 lake years, sockeye fry densities varied from 735-3503 ha
-1 (mean
1718 ha-1
) and average smolt weights ranged between 2.0-5.0 g (mean 3.1 g). Over this density range there was no rela-

Density-Dependent Growth in Juvenile Sockeye Salmon (Oncorhynchus Nerka) The Open Fish Science Journal, 2011, Volume 4 53
tionship between average in-lake fry density and average smolt weight (Pearson R
2 = 0.013, n = 31, p = 0.548) (Fig.
1). During two years (1986, 1990) fry densities averaged <1000 ha
-1and smolt weights were exceptionally high (6.6,
6.4 g respectively), but during eight other years when fry densities <1000 ha
-1, smolt weights ranged between 2-4 g
ha-1
.). Including the two outliers failed to yield a significant relationship between fry density and smolt weight (Pearson R
2 = 0.088, n = 31, p = 0.093). At Sproat Lake during 28 of
30 lake years (1978-2007), sockeye fry densities ranged from 934-2962 ha
-1 (mean 1845 ha
-1) and annual-average
smolt weights ranged between 2.4-5.4 g (mean 3.8 g). Over this density range there was no relationship between average in-lake fry density and average smolt weight (Pearson R
2 =
0.107, n = 28, p = 0.089) (Fig. 1). During two of the 30 lake-years (1983, 1996), fry densities were exceptionally high (5183 and 4801 ha
-1) and smolt weights were among the
lowest recorded (2.2 and 2.9 g respectively). Including the two outliers, produced a significant relationship (Pearson R
2
= 0.310, n = 30, p = 0.001) between fry density and smolt weight.
Spawner numbers and associated average fry densities were recorded over 32 years in Great Central Lake and 31 years in Sproat Lake (Fig. 1). In Great Central Lake at high adult densities, there may have been density-dependent mor-tality, perhaps due to events on the spawning beds. In Sproat Lake, there was no evidence of density-dependent mortality.
Great Central and Sproat Lakes: 1999
In Great Central Lake during June-November 1999, fry densities declined as the fry grew and gained weight (22 June density = 3239, mean weight = 0.21 g; 25 November density = 1457, mean weight = 1.88 g). Total 1999 zooplankton biomass gradually increased through the season averaging 13.95 g L
-1 dry weight and >95% of that biomass
comprised only three species (Holopedium gibberum, Diacy-
clops bicuspidatus, Bosmina longispina) (Fig. 2a). The other 5% included 2 copepods (Epischura nevadensis, Skistodiap-tomus oregonensis) and 5 cladocerans (Daphnia longiremis, Daphnia pulex, Bosmina longispina, Bosmina longirostris, and Polyphemus pediculus). Throughout the summer-fall, daily prey consumption by juvenile sockeye averaged 0.05
g L-1
d-1
dw (Fig. 2c) which translates to 0.4% d-1
of total zooplankton standing stock biomass. Percent zooplankton standing stock and production consumed by juvenile sockeye varied through the summer-fall, but never exceeded 100% of daily species-specific production.
In Sproat Lake during June-November 1999, fry densities apparently increased (27 June density = 1426, mean weight = 0.73 g; 18 November density = 2240, mean weight = 2.67 g). In contrast to Great Central Lake, total 1999 Sproat Lake zooplankton biomass decreased through the season averaging 18 g L
-1 dry weight. More than 95% of
total zooplankton biomass comprised 5 species (Epischura nevadensis, Holopedium gibberum, Diacyclops bicuspidatus, Bosmina longispina and Daphnia longiremis) (Fig. 2b). The other 5% included Daphnia pulex, Bosmina longirostris, and Polyphemus pediculus. Throughout the summer-fall, daily consumption by juvenile sockeye averaged 1.2 g L
-1 d
-1 dw
(Fig. 2d), which translates to 0.7% d-1
of total standing stock biomass. Percent zooplankton standing stock and production consumed by juvenile sockeye varied through the summer-fall, but never exceeded 100% of daily species-specific pro-duction of zooplankton
Woss and Vernon Lakes 2000-06 Standing Stocks
In Woss Lake during all years except 2005, more than half of the phytoplankton biomass comprised large, inedible diatoms Rhizosolenia eriensis and R. longiseta. During 2005, more than half of the phytoplankton biomass comprised Lep tocylindrus sp., a small, highly edible, coiled and flattened
Fig. (1). Great Central Lake and Sproat Lake smolt weights (left
side panels) with respect to average (June-November) fry densities.
Mean summer (June-November) fry densities (right panels) with
respect to the number of spawning adults.
Fig. (2). Great Central and Sproat lake (panels a, b) zooplankton
biomass and (panels c, d) daily rates of consumption by juvenile
sockeye.
54 The Open Fish Science Journal, 2011, Volume 4 Hyatt et al.
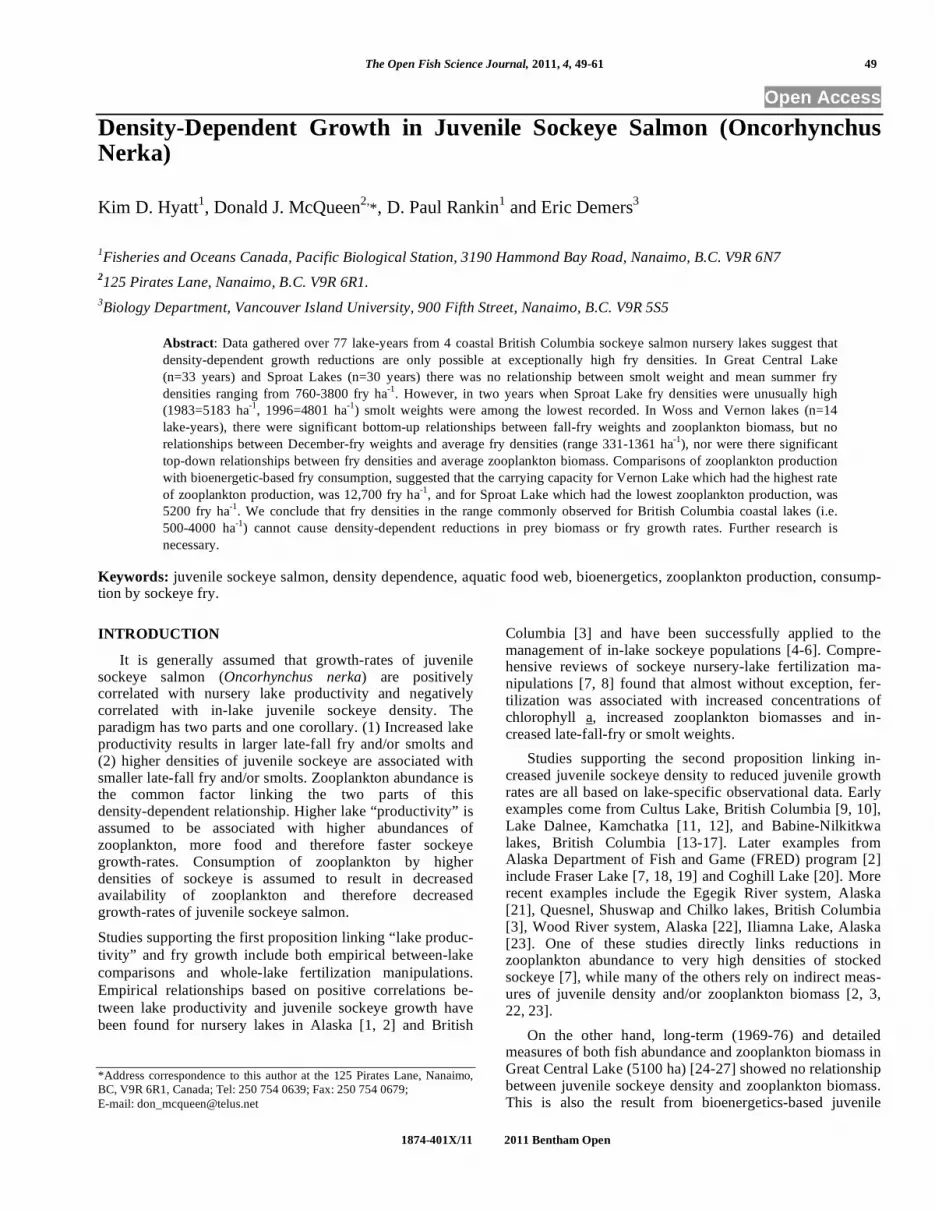
cylinder, measuring approximately 20 x 8 x 3 m (Fig. 3a). The Woss Lake zooplankton community included Daphnia ambigua, Bosmina longirostris, Holopedium gibberum, Polyphemus pediculus, Diacyclops thomasi, Epischura ne-vadensis and Skistodiaptomus oregonensis (Appendix B, Fig. 3b). Population biomasses increased with warming spring-summer water temperatures and declined with cooling fall temperatures. Electivity-based prey preference by juvenile sockeye salmon was Epischura>Daphnia>Bosmina>Dia-cyclops. During 2000-06, a total of 3358 O. nerka were sam-pled with the 3x2m trawl net (Table 2) and 28 (0.8%) were age-1 hold-over sockeye. Mean seasonal densities of juvenile sockeye in Woss Lake (Appendix A, Fig. 3c) varied with escapement and average fall weights (Appendix A, Fig. 3d) varied with zooplankton biomass (Fig. 5e, f).
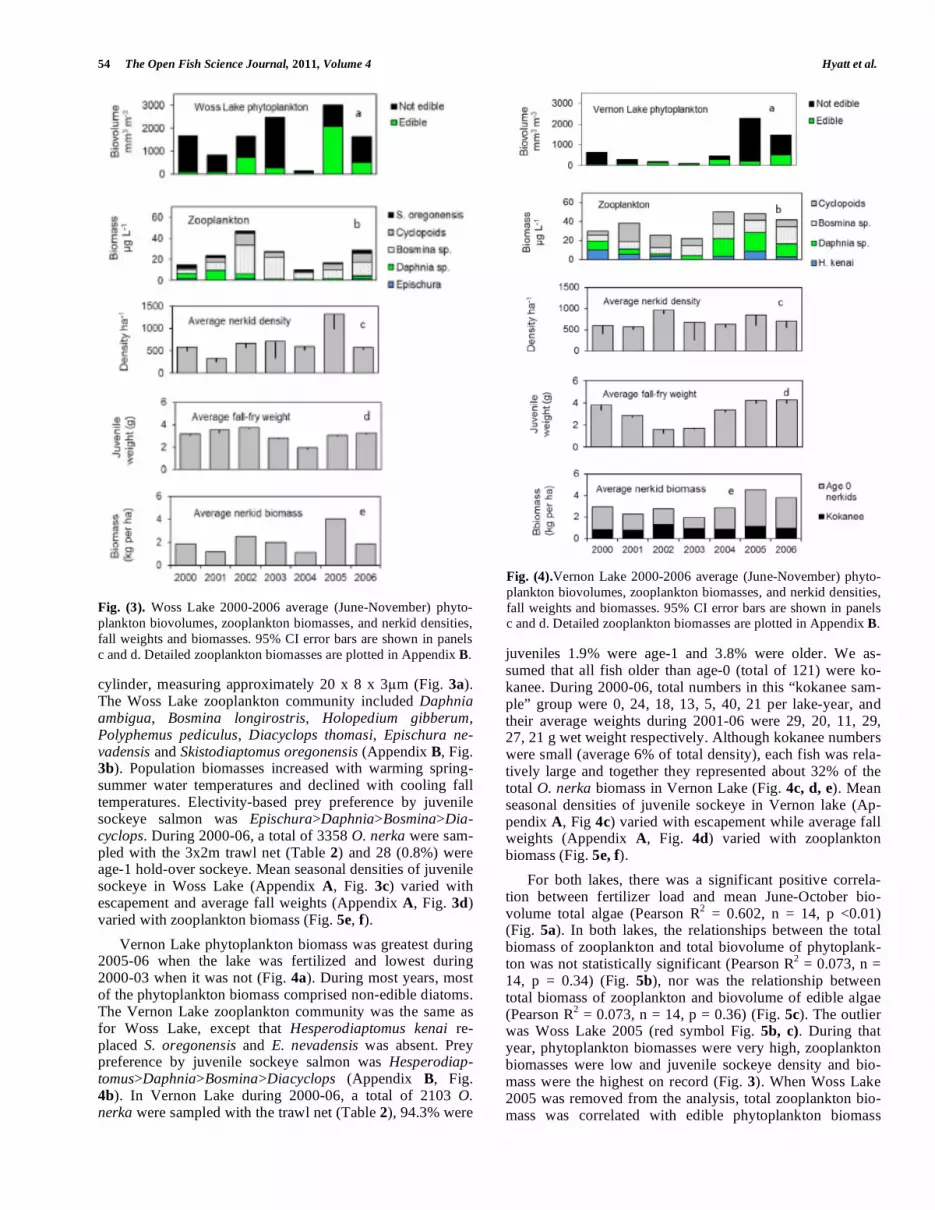
Vernon Lake phytoplankton biomass was greatest during 2005-06 when the lake was fertilized and lowest during 2000-03 when it was not (Fig. 4a). During most years, most of the phytoplankton biomass comprised non-edible diatoms. The Vernon Lake zooplankton community was the same as for Woss Lake, except that Hesperodiaptomus kenai re-placed S. oregonensis and E. nevadensis was absent. Prey preference by juvenile sockeye salmon was Hesperodiap-tomus>Daphnia>Bosmina>Diacyclops (Appendix B, Fig. 4b). In Vernon Lake during 2000-06, a total of 2103 O. nerka were sampled with the trawl net (Table 2), 94.3% were
juveniles 1.9% were age-1 and 3.8% were older. We as-sumed that all fish older than age-0 (total of 121) were ko-kanee. During 2000-06, total numbers in this “kokanee sam-ple” group were 0, 24, 18, 13, 5, 40, 21 per lake-year, and their average weights during 2001-06 were 29, 20, 11, 29, 27, 21 g wet weight respectively. Although kokanee numbers were small (average 6% of total density), each fish was rela-tively large and together they represented about 32% of the total O. nerka biomass in Vernon Lake (Fig. 4c, d, e). Mean seasonal densities of juvenile sockeye in Vernon lake (Ap-pendix A, Fig 4c) varied with escapement while average fall weights (Appendix A, Fig. 4d) varied with zooplankton biomass (Fig. 5e, f).
For both lakes, there was a significant positive correla-tion between fertilizer load and mean June-October bio-volume total algae (Pearson R
2 = 0.602, n = 14, p <0.01)
(Fig. 5a). In both lakes, the relationships between the total biomass of zooplankton and total biovolume of phytoplank-ton was not statistically significant (Pearson R
2 = 0.073, n =
14, p = 0.34) (Fig. 5b), nor was the relationship between total biomass of zooplankton and biovolume of edible algae (Pearson R
2 = 0.073, n = 14, p = 0.36) (Fig. 5c). The outlier
was Woss Lake 2005 (red symbol Fig. 5b, c). During that year, phytoplankton biomasses were very high, zooplankton biomasses were low and juvenile sockeye density and bio-mass were the highest on record (Fig. 3). When Woss Lake 2005 was removed from the analysis, total zooplankton bio-mass was correlated with edible phytoplankton biomass
Fig. (3). Woss Lake 2000-2006 average (June-November) phyto-
plankton biovolumes, zooplankton biomasses, and nerkid densities,
fall weights and biomasses. 95% CI error bars are shown in panels
c and d. Detailed zooplankton biomasses are plotted in Appendix B.
Fig. (4).Vernon Lake 2000-2006 average (June-November) phyto-
plankton biovolumes, zooplankton biomasses, and nerkid densities,
fall weights and biomasses. 95% CI error bars are shown in panels c and d. Detailed zooplankton biomasses are plotted in Appendix B.

Density-Dependent Growth in Juvenile Sockeye Salmon (Oncorhynchus Nerka) The Open Fish Science Journal, 2011, Volume 4 55
(Pearson R2= 0.422, n = 13, p = 0.01) (Fig. 5c). In both lakes
there was a positive and significant correlation between rates of zooplankton production and edible phytoplankton biomass (Pearson R
2 = 0.372, n = 14, p < 0.02) (Fig. 5d), and a
stronger correlation (Pearson R2 = 0.689, n = 14, p < 0.01)
between Woss Lake zooplankton production and the biomass of edible Leptocylindrus sp. (data not shown). For both lakes, there was a significant positive relationship between mean weights of fall-fry and zooplankton biomass (Pearson R
2 = 0.372, n = 14, p = 0.01) (Fig.5e) and a significant posi-
tive relationship between mean weights of fall-fry and one of their most preferred prey, Daphnia (Pearson R
2 = 0.462, n =
14, p < 0.01) (Fig. 5f). In Vernon Lake, the relationship be-tween mean weights of fall-fry and the two most preferred prey, Daphnia + Hesperodiaptomus, was even stronger (Pearson R
2 = 0.757, n = 7, p = <0.01, two tail, data not
shown).
There was no evidence of a density-dependent relation-ship between average June-October fish density and fall-fry weight (Pearson R
2 = -0.019, n = 14, p = 0.64, two tail)(Fig.
6a). There was also no top-down relationship between fish density and zooplankton biomass (Pearson R
2 = -0.016, n =
14, p = 0.67, two tail)(Fig. 6b). The relationship between fish biomass and zooplankton biomass was positive and not
significant when Woss 2005 was included (Pearson R2 =
0.214, n = 14, p = 0.10, two tail) and significant when Woss 2005 was excluded (Pearson R
2 = 0.506, n = 13, p = 0.01,
two tail) (Fig. 6c). All of these results are contrary to den-sity-dependent predictions.
In Woss Lake, Daphnia were the preferred prey (Fig. 7a). During 2000-02, Daphnia biomasses were relatively high (Fig. 3), declined in 2003 and remained low in 2004-06. During the high biomass years, the proportion of Daphnia biomass consumed per day was slightly lower than later when Daphnia biomasses declined, but in all years percent biomass consumed per day was near 1% or less (Fig. 7a). In Vernon Lake, H. kenai was the most preferred prey (Fig. 7b). From year-to-year, the biomass of H. kenai varied (Fig. 4), but it remained the dominant prey and consumption by fish never accounted for more than 1.3% of H. kenai biomass per day.
In both Woss and Vernon lakes, daily bioenergetics-
based consumption by all pelagic O. nerka ( g L-1
d-1
dry
weight) divided by daily zooplankton production ( g L-1
d-1
dry weight) (i.e. C/P) gradually increased as the fish became
larger, but seldom exceeded 100% (Fig. 7c,d). In both lakes,
Daphnia were among the most preferred prey and the expec-
Fig. (5). Woss ( ) and Vernon (O) lake (2000-2006) bottom-up correlations based on summer (June-November) averages for adjacent tro-
phic-levels. The red symbols are for Woss Lake 2005.

56 The Open Fish Science Journal, 2011, Volume 4 Hyatt et al.
tation was that Daphnia should be the species most affected
by top-down predation. However in both lakes, C/P for
Daphnia was >100% on only 9 of 78 lake-days, and
C/biomass+production was >10% d-1
on only 1 of 78 lake-
days.
DISCUSSION
It is generally accepted that growth rates of juvenile sockeye salmon are regulated by nursery-lake water tempera-ture and zooplankton biomass [26]. It is also generally ac-cepted that nursery-lakes with more algae and higher rates of primary production, have more zooplankton and higher ju-venile sockeye carrying capacities [1, 3]. Early work [9-12, 15] has led to the assumption that there is an inverse density-dependent relationship between juvenile sockeye density and growth rate [17]. However, with the exception of high-density stocking experiments, there are few supporting stud-ies involving direct in-lake measures of natural fry densities and associated zooplankton biomasses. In fact, data-intensive studies such as those conducted at Great Central Lake (5100 ha) [24-27] show no effect of sockeye on their food, and virtually all bioenergetics-based food web studies show that natural densities of age 0 sockeye and age 0 kokanee cannot possibly consume enough prey to negatively impact zooplankton standing stocks [28-31, 51, 52]. That is the di-lemma faced by the density-dependent growth hypothesis, and it is the subject of our analysis of data from Great Cen-tral, Sproat, Woss and Vernon lakes. Our goal was to use
multi-year data sets to evaluate the hypotheses that (1) in-creased lake “productivity” is associated with higher abun-dances of zooplankton, more food for juvenile sockeye and therefore faster rates of growth and that (2) consumption by juvenile sockeye can reduce zooplankton biomasses to levels that are low enough to cause reduced sockeye growth-rates.
Do More Productive Lakes Produce Larger Juvenile Sockeye?
Both empirical and lake manipulation studies strongly support the generalization that increased nursery-lake pro-ductivity is associated with higher biomasses of zooplankton and larger fall-fry and/or smolts [1, 3-8, 20]. We also found exceptions that emphasized the importance of phytoplankton and zooplankton species composition. In Woss and Vernon lakes, fertilizer quantity was always correlated with phyto-plankton biovolume, but there was no clear relationship be-tween total phytoplankton biovolume and total zooplankton biomass (Fig. 5b). During some years, fertilizer additions stimulated the growth of large non-edible diatoms including Rhizosolenia and zooplankton abundance was lower than expected. During other years, fertilization stimulated edible phytoplankton including Leptocylindrus and zooplankton biomass was higher than expected (Fig. 5c, d). We also found that while there was always a significant positive rela-tionship between zooplankton biomass and mean weights of fall-fry (Fig. 5e), these relationships were even stronger when zooplankton species composition favoured large-bodied taxa such as Hesperodiaptomus and Daphnia (Fig. 5f).
What is the Evidence for Density-Dependent Growth Regulation?
The usual explanation for apparent density-dependent growth of nursery-lake sockeye is that increased consump-tion of zooplankton by higher densities of sockeye reduces availability of zooplankton and therefore limits growth-rates. However, when the supporting evidence is re-examined, this explanation becomes less compelling. Classic observational studies at Cultus Lake, British Columbia [9-10] used ratios of zooplankton biomass/sockeye density to conclude that growth was density-dependent. Reanalysis of the original data shows that in Cultus Lake, there was no relationship between fish density and zooplankton biomass. Data from another classic British Columbia nursery lake study has also been cited in support of the density-dependent hypothesis. At Babine-Nilkitkwa (475 km
2) [13-16], sockeye density was
estimated 17 times during 08 August and late October 1956, 57, 58. Juvenile sockeye were captured using a 1 m diameter trawl net deployed at seven stations arrayed down the long axis of the lake. Densities were estimated from swept vol-ume and a survival curve based on the literature was then applied to make all of the density data conform to the same theoretical August 21-25 sample period. It was assumed that over a three month period, the fish remained at specific sec-tions of the lake, did not mix with fish from other locations and consumed zooplankton populations that also remained in specific sections of the lake for three months in each year. Given all of these assumptions, we suggest that it is impossi-ble to conclude much, if anything, about relationships be-tween sockeye density and zooplankton biomass. Also, be-cause the Babine-Nilkitkwa study became the primary data
Fig. (6).Woss ( ) and Vernon (O) lake (2000-2006) top-down cor-
relations based on summer (June-November) averages for adjacent
trophic-levels. The red symbols are for Woss Lake 2005.

Density-Dependent Growth in Juvenile Sockeye Salmon (Oncorhynchus Nerka) The Open Fish Science Journal, 2011, Volume 4 57
source for the influential theoretical analysis by [17] Brock-sen et al., we suggest that compelling conclusions drawn from that work, are now highly questionable. More recent studies in British Columbia [3] and Alaska [3, 21-23] em-ployed much more sophisticated field and analytical tech-niques, but all relied on indirect measures of either juvenile sockeye density or zooplankton biomass. In fact, only very high-density fry stocking trials in relatively small, oligotro-phic Alaskan lakes provide strong evidence for density-dependent regulation of zooplankton biomass by juvenile sockeye [7]. For example, when Esther Pass Lake (surface area 0.2 km
2) was stocked for two years (1988-89) with ap-
proximately 7,700 fry ha-1
, zooplankton biomasses declined from 402 to 65 mg m
-2 dw and when stocking was halted
(1990), zooplankton biomass rebounded to 184 mg m-2
. When Pass Lake (surface area 0.5 Km
2) was stocked for two
years (1988-89) with approximately 12,000 fry ha-1
, mean summer zooplankton biomasses declined from 783 mg m
-2
dw during the control year (1985) to only 13 mg m-2
dw dur-ing the stocked year (1989). When stocking was halted and fertilizers applied (1990), zooplankton biomass remained depressed at 10 mg m
-2. Can these results be extended to
natural sockeye nursery lakes? We suggest that over the normal sockeye fry density range (500-4000 ha
-1) commonly
observed in coastal sockeye nursery lakes, the answer is no.
Woss Lake 2005
Woss Lake 2005 was the lake-year most likely to show top-down impacts of sockeye on zooplankton. During that year, edible algal biomass was the highest recorded, zooplankton biomass among the lowest and both fish density and biomass were the highest recorded (Fig. 3). The Woss
2005 observation was almost always the outlier in correla-tion plots involving phytoplankton, zooplankton or fish (red symbol Figs. 5, 6). Static measures of average biomass and density certainly suggest that during 2005, high fish density and biomass should have caused a trophic cascade (i.e. high fish biomass high rates of zooplankton consumption reduced zooplankton biomass reduced grazing rates high algal biomasses). However, dynamic estimates of pro-duction and consumption lead to a different conclusion. Total consumption by all fish was slightly higher than the six year average, average consumption per fish was slightly lower and fall-fry weight was equal to the average for all years. During 2005, consumption by fish averaged 15% d
-1
of total zooplankton production, 49% d-1
of production by the most preferred prey (Daphnia), but only 0.8% d
-1 of Daphnia
biomass+production. Daphnia production averaged 5% of biomass, so that the loss to predation was negligible. These data suggest that even in 2005, top-down regulation of zooplankton biomass was impossible and that Woss Lake fish likely had little difficulty finding their prey. Because Daphnia biomasses were relatively low, fish consumed Daphnia +Bosmina + Diacyclops (Fig. 7). Assuming that the fish consumed average sized prey, bioenergetics analysis suggested that the average fish required approximately 1000 Daphnia, 3000 Bosmina, and 1000 Diacyclops to meet the daily energy demand required to support their observed growth. Total prey density was 5.3 individuals L
-1. We know
it’s very likely that juvenile sockeye can detect all prey within a hemisphere having a radius of at least 5 cm, (i.e. can see prey up to 5 cm distant from the eye) in clear water [53] which means a fish would need to swim about 25 cm (cylin-der 10 cm diameter and 25 cm long = (12.8* 5
2) = 1000
Fig. (7). Woss and Vernon Lake (panels a, b) percentage of mean summer zooplankton standing stock consumed per day by fish, (panels c,
d) consumption / production expressed as a percentage.

58 The Open Fish Science Journal, 2011, Volume 4 Hyatt et al.
Appendix A. Woss and Vernon (2000-06), fry weight-at-age based on trawl samples and fish density per ha based on acoustic sampling.
Appendix B. Zooplankton biomasses g L-1
for Woss and Vernon lakes 2000-06. Sample sizes are summarized in Table 2. Daily counts are
based on combined samples from 4 stations in Woss Lake and 3 stations in Vernon Lake.
cm
3 1 L) in order to encounter 5 prey. Assuming a mean
fish length of 3 cm and an average swimming speed of 2 body lengths per second, 36 minutes of swim time plus han-dling time would be required to encounter 5000 prey. Of course the fish would very likely select larger than average prey. This would require additional swim time, but less prey would be needed to meet metabolic demands. Diel migration studies [31] showed that Woss Lake fish remained in the upper water column from dusk to dawn, and therefore it was probably quite easy for the average fish to satisfy daily en-ergy demands. During 2005, Woss Lake fish densities were
the highest recorded in the study and each fish occupied an average volume of 190 m
3 which was also occupied by
92,000 Daphnia. Since the average fish consumed <1000 Daphnia d
-1, it seems unlikely that predation by fish could
influence Daphnia densities and even more unlikely that consumption by fish could influence the densities of other more numerous zooplankton species.
Lake Carrying-Capacity
Simulated increases in fish density showed that zooplankton community resilience to changes in fish density
Density-Dependent Growth in Juvenile Sockeye Salmon (Oncorhynchus Nerka) The Open Fish Science Journal, 2011, Volume 4 59
was different in each of our four lakes. As simulated fish densities were increased, zooplankton biomasses remained unaltered until consumption > production. Beyond that point, there was a rapid decrease in zooplankton biomass. For our lakes, these trigger points varied from 12,798 fry ha
-1 in
Vernon Lake, to 9,500 fry ha-1
in Great Central Lake, 7,980 fry ha
-1 in Woss Lake, and 5,200 fry ha
-1 in Sproat Lake. A
number of potential errors are associated with these esti-mates of carrying-capacity. (1) Our simulations were based on the assumption that all zooplankton mortality is due to increased predation by fish. Zooplankton die for many rea-sons including predation by invertebrates and changes in food supply and water temperatures. We have attempted to account for some of this “unexplained” mortality and associ-ated loss of production capacity, by using production data derived directly from field samples. For both Woss and Vernon lakes, our production estimates are based on six lake years and are likely relatively robust. For Great Central and Sproat lakes, we had field estimates from only one year, and our conclusions are more tentative. (2) A second important assumption is that prey selection remains static at all levels of predation. The prey selection data used to parameterize the bioenergetics model were gathered at fry densities aver-aging 300-1400 ha
-1 in Woss and Vernon lakes and 1700-
2300 in Great Central and Sproat lakes, and prey electivity was assumed to remain constant at all simulated predator densities. As actual field densities increase, it is likely that the largest and most edible zooplankton species would be preferentially reduced, thus increasing the energy required for hunting thus decreasing sockeye growth rates. Although this will inevitably have consequences at very high predator densities, it is likely that the effects will be minimal at low and medium levels of sockeye abundance. Field data col-lected during 2005 from Woss Lake show that in the relative absence of the preferred prey species (Daphnia), the fish switched to alternatives (Bosmina and Diacyclops) with no loss in growth rate. Also, in all four of our lakes, produc-tion/consumption for vulnerable prey such as Daphnia, was relatively low averaging 14% d
-1 in Vernon Lake, 33% d
-1 in
Woss Lake, 11% d-1
in Sproat Lake and 18 % d-1
in Great Central Lake. This suggests that substantial increases of predator densities would be needed to significantly change prey species composition during most of the spring-summer interval. The antidote to both of these potential errors is more emphasis on detailed field work for lakes having im-portant ecological and economic importance. Future research should include field measurements of prey switching under various intensities of predation by juvenile sockeye salmon and the application of more sophisticated, dynamic produc-tion and consumption models. (3) Finally, our simulations are based on data gathered during the summer to early fall. There is no doubt that during the early spring and late fall when cool water is associated with substantially reduced rates of Cladoceran egg production, consumption by sockeye fry exceeds Cladoceran production. However, low tempera-tures are also associated with low metabolic rates, and the sockeye in our four lakes survive at these times on a diet made up almost exclusively of Diacyclops.
Two factors strongly influenced the carrying capacities estimated for our four lakes. (1) Lakes with higher areal rates of zooplankton production supported higher juvenile sockeye
growth rates (Pearson R2 = 0.339, n = 16, p = 0.01). (2) Phy-
toplankton and zooplankton species composition mediated zooplankton production and ultimately fish growth rates. In Woss and Vernon Lakes, periodic blooms of inedible and edible algae were associated with changes in zooplankton production and also with changes in fish growth rates. In Vernon Lake during 2000-01, high biomasses of the large copepod, Hesperodiaptomus, were associated with unusually high sockeye growth rates. In Great Central and Sproat lakes during 1999, nutrient concentrations, phytoplankton species compositions and biomasses of zooplankton were all very similar, yet Sproat Lake fish grew more quickly than Great Central Lake fish and Sproat Lake fish biomasses were more than twice as large. The single recorded difference was that Sproat Lake had higher concentrations of calcium and much higher biomasses of Daphnia (2.028 vs. 0.039 g L
-1 dw),
the most preferred prey in both lakes.
In summary our data suggest that over the range of densi-ties commonly found in Coastal British Columbia sockeye nursery lakes (500-4000 ha
-1), there was no evidence of den-
sity-dependent growth suppression of juvenile sockeye and even less evidence that consumption by sockeye was high enough to significantly reduce zooplankton biomasses. Over the last 20 years, several models have been used to estimate carrying capacities in sockeye nursery lakes [1, 3-5]. All are based on indirect or direct estimates of primary production and all provide only general levels of precision for specific lakes. Some British Columbia nursery lakes are large (>1000 ha) and individually may support commercial catches of adult sockeye valued at millions of dollars per year. Our study suggests that for important sockeye nursery lakes, 2-4 lake-years of detailed observations of zooplankton and fish production may be used in bioenergetics-based consumption analyses to produce more precise estimates of lake-specific carrying capacities for juvenile sockeye. The expense of es-tablishing reliable carrying capacities to inform production limits for fisheries management would seem to represent money well spent.
REFERENCES
[1] Koenings JP, Burkett RD. Population characteristics of sockeye
salmon (Oncorhynchus nerka) smolts relative to, euphotic volume, fry density, and forage base within Alaskan Lakes. In: Smith HD,
Margolis L, Wood CC, Eds. Sockeye Salmon (Oncorhyncus nerka) Population Biology and Future Management. Canadian Special Pub
Fish Aquat Sci 1987; 96: 216-234. [2] Kyle GB, Koenings JP, Edmonson JA. An overview of Alaska
lake-rearing salmon enhancement strategy: nutrient enrichment and juvenile stocking. In: Milner AM, Oswood MW, Eds. Freshwater
of Alaska Ecological Synthesis. Ecological Studies 119. New York Springer-Verlag, Inc 1997; pp 205-228.
[3] Hume JMB, Shortreed KS, Morton K. Juvenile sockeye rearing capacity of three lakes in the Fraser River system. Can J Fish Aquat
Sci 1996; 53: 719-33. [4] Shortreed KS, Hume JMB, Stockner JG. Using photosynthetic rates
to estimate the juvenile sockeye salmon rearing capacity of British Columbia Lakes. In: Knudsen EE, Steward CR, MacDonald DD,
Williams JE, Reiser DW. Eds. Sustainable Fisheries Management: Pacific Salmon. Boca Raton, New York: CRC Press LLC 2000; pp
505-521. [5] Shortreed KS, Morton KF, Malange K, Hume JMB. Factors limit-
ing juvenile sockeye production and enhancement potential for se-lected B.C. nursery lakes. Canadian Sci Advisory Sec 2001; 098:
69.
60 The Open Fish Science Journal, 2011, Volume 4 Hyatt et al.
[6] Cox-Rogers S, Hume JMB, Shortreed KS. Stock status and lake
based production relationships for wild Skeena River sockeye salmon. Canadian Sci Advisory Sec 2004; 010: 56.
[7] Koenings JP, Kyle GB. Consequences to juvenile sockeye salmon and the zooplankton community resulting from intense predation.
Alaska Fish Res Bull 1997; 4: 120-35 [8] Hyatt KD, McQueen DJ, Shortreed KS, Rankin DP. Sockeye
salmon (Oncorhynchus nerka) nursery lake fertilization: Review and summary of results. Envi Reviews 2004; 12: 133-62.
[9] Ricker WE. The food and food supply of sockeye salmon (On-corhynchus nerka Walbaum) in Cultis Lake, British Columbia. J
Biol Bd Can 1937; 3: 450-68 [10] Foerster RE. The sockeye salmon, Oncorhynchus nerka. Fish Res
Bd Canada Bull 1968; 162. pp1- 422. [11] Krogius FV, Krokhin EM. On the production of young sockeye
salmon (Oncorhynchus nerka Walb.). Fish Res Bd Canada Transla-tion Series 1958:109.
[12] Krogius FV. On the relation between rate of growth and population density in sockeye salmon. Fish Res Bd Canada Translation Series
1962: 411. [13] Johnson WE. On the distribution of young sockeye salmon (On-
corhynchus nerka) in Babine and Nilkitkwa lakes, BC. J Fish Res Bd Canada 1956; 13: 695-708.
[14] Johnson WE. Density and distribution of young sockeye salmon (Oncorhynchus nerka) throughout a multibasin lake system. J Fish
Res Bd Canada 1958; 15: 961-82. [15] Johnson WE. Aspects of the ecology of a pelagic, zooplankton-
eating fish. Verh Internat Verein Limnol 1961; 14: 727-31. [16] Johnson WE. Quantitative aspects of the pelagic, entomostracan
zooplankton of a multibasin lake system over a 6-year period. Verh Internat Verein Limnol 1964; 15: 727-34.
[17] Brockson RW, Davis GE, Warren CE. Analysis of trophic proc-esses on the basis of density-dependent functions. In Steele JH, Ed.
Marine Food Chains. Oliver and Boyd, Edinburgh 1970; pp 468-498.
[18] Kyle GB, Koenings JP, Barrett BM. Density dependent, trophic level responses to an introduced run of sockeye salmon Oncorhyn-
cus nerka at Fraser Lake, Kodiak Island, Alaska. Can J Fish Aquat Sci 1988; 45: 856-67.
[19] Kyle GB. Nutrient treatment of 3 coastal Alaskan lakes: trophic level responses and sockeye salmon production trends. Alaska Fish
Res Bull 1994; 1: 153-67. [20] Edmundson JA, Kyle GB, Carlson SR, Shields PA. Trophic-level
responses to nutrient treatment of meromictic and glacially influ-enced Coghill Lake. Alaska Fish Res Bull 1997; 4: 136-53.
[21] Martin PC, Lloyd DS. Aspects of sockeye salmon smolt production in the Egegik River system of Bristol Bay, Alaska. Alaska Fish Res
Bull 2006; 3: 59-63. [22] Schindler DE, Rogers DE, Scheuerell MD, Abrey CA. Effects of
changing climate on zooplankton and juvenile sockeye salmon growth in southwestern Alaska. Ecology 2005; 86: 198-209.
[23] Rich HB, Quinn TP, Scheuerell D, Schindler DE. Climate and interspecific competition control the growth and lifehistory of ju-
venile sockeye salmon (Oncorhynchus nerka) in Iliamna Lake, Alaska. Can J Fish Aquat Sci 2009; 66:238-46.
[24] Parsons TR, Stephens K, Takahashi M. The fertilization of Great Central Lake. I. Effect of primary production. Fish Bull 1972; 70:
13-23 [25] LeBrasseur RJ, Kennedy OD. The fertilization of Great Central
Lake II. Zooplankton standing stock. Fish Res Bd Canada 1972; 70: 25-36
[26] LeBrasseur RJ, McAllister CD, Barraclough WE, et al. Enhance-ment of sockeye salmon (Oncorhyncus nerka) by lake fertilization
in Great Central Lake: summary report. J Fish Res Bd Canada 1978; 35: 1580-96.
[27] Barraclough WE, Robinson D. The fertilization of Great Central Lake III. Effect on juvenile sockeye salmon. Fish Bull 1972; 70:
37-48. [28] Beauchamp DA, LaRiviere MG, Thomas GL. Evaluation of com-
petition and predation as limits to juvenile kokanee and sockeye salmon production in Lake Ozette, Washington. N Am J Fish Man-
age 1995; 15: 193-207. [29] Beauchamp DA, Sergeant CJ, Mazur MM. Spatial-temporal dy-
namics of early feeding demand and food supply for sockeye fry in Lake Washington. Trans Am Fish Soc 2004; 133: 1014-32.
[30] Beauchamp DA. Modeling the carrying capacity of zooplanktivo-
rous fishes in Lake Washington. Final report to Washington De-partment of Fisheries and Wildlife, Olympia 1996.
[31] McQueen DJ, Hyatt KD, Rankin DP, et al. Changes in algal spe-cies composition affected juvenile sockeye salmon production at
Woss Lake, British Columbia: a lake fertilization and food web analysis. N Am J Fish Manage 2007; 27: 369-86.
[32] Gjernes TW, Hyatt K D, Rankin DP. Development of specifica-tions for the use of an uncalibrated echo sounder to estimate popu-
lations of small limnetic fish. Can Tec Rep Fish Aquat Sci 1986; 1509.
[33] Hyatt KD, Rutherford D, Gjernes TW, et al. Lake Enrichment Program: juvenile sockeye unit survey guidelines. Can Man Rep
Fish Aquat Sci 1984; 1796. [34] Hyatt K D, Stockner JG. Responses of sockeye salmon (Oncorhyn-
chus nerka) to fertilization of British Columbia coastal lakes. Can J Fish Aquat Sci 1985; 42: 320-31.
[35] Balk H, Lindem T. Sonar4, Sonar5 and Sonar6 post processing systems, Operator manual version 5.9.6 412p. Lindem Data Acqui-
sition, Humleveien 4b. 0870 Oslo Norway 2006. [36] ALBY Systems Ltd and Northwest Hydraulic Consultants Ltd.
Nimpkish watershed restoration program overview assessment of fish habitat and hydrology (Volume 1 - Main Report). Canadian
Forest Products Ltd. for Forest Renewal BC 2000; [37] Utermöhl H. ZurVervollkommnung der quantitativen Phytoplank-
ton-Methodik. Mitteilungen der Internationalen Vereinigung für theoretische und angewandte Limnologie 1958; 9: 1-38.
[38] Cyr H. Cladoceran- and copepod-dominated zooplankton commu-nities graze at similar rates in low-productivity lakes. Can J Fish
Aquat Sci 1998; 55: 414-22. [39] Cottingham KL. Nutrients and zooplankton as multiple stressors on
phytoplankton communities: evidence from size structure. Limnol Oceanog 1999; 44: 810-27.
[40] Stutzman P. Food quality of gelatinous colonial chlorophytes to the freshwater zooplankters Daphnia pulicaria, Diaptomus oregonen-
sis. Freshwater Biol 1995; 34: 149-53 [41] Yan, N.D. Empirical prediction of crustacean zooplankton biomass
in nutrient-poor Canadian Shield lakes. Can J Fish Aquat Sci 1986; 43: 788-96.
[42] McQueen DJ, Yan ND. Metering filtration efficiency of freshwater zooplankton hauls: reminders from the past. J Plankton Res 1993;
5: 57-66. [43] Yan ND, Perez-Fuentetaja A, Ramcharan CW, et al. Changes in the
crustacean zooplankton communities of Mouse and Ranger lakes. Arc Hydrobiol Spec Issues Advanc Limnol 2001; 56: 127-50.
[44] Downing JA, Rigler FH, Eds. A manual on methods for the as-sessment of secondary productivity in fresh waters. Second Edition.
Blackwell Scientific Publications. Oxford 1984 [45] Allen G, Yan ND, Geiling WT. ZEBRA2, zooplankton enumera-
tion and biomass routines for APIOS: a semi-automated sample processing system for zooplankton ecologists; Ontario Ministry
Environment Report, Dorset, Ontario 1994. [46] Girard R, Clark BJ, Yan ND, et al. History of Chemical, Physical
and Biological Sampling Methods, Sampling Locations and Lake Morphometry For The Dorset Environmental Science Centre
(1973-2004). Ontario Ministry Environment Report. Technical Re-port Series 2004/1
[47] Borgmann U, Shear H, Moore J. Zooplankton and potential fish production in Lake Ontario. Can J Fish Aquat Sci 1984; 41: 1303-
9. [48] Cooley JM, Moore JE, Geiling WT. Population dynamics, biomass,
and production of the macrozooplankton in the Bay of Quinte dur-ing changes in phosphorus loading. In: Minns CK, Hurley DA,
Nichols KH. Eds. Project Quinte: point source phosphorus control and ecosystems response in the Bay of Quinte, Lake Ontario. Can
Spec Pub Fish Aquat Sci 1986; 86: 166-76. [49] Hanson PC, Johnson TB, Schindler DE, et al. Fish Bioenergetics
3.0. 1997; University of Wisconsin-Madison Centre for Limnology and University of Wisconsin Sea Grant Institute.
[50] Levy DA. Sensory mechanism and selective advantage for diel vertical migration in juvenile sockeye salmon, Oncorhynchus
nerka. Can J Fish Aquat Sci 1990; 47: 1796-802. [51] Hyatt KD, McQueen DJ, Cooper KL. Competition for food be-
tween juvenile sockeye salmon and the macroinvertebrate plank-tivore Neomysis mercedis, in Muriel Lake, British Columbia, Can-
ada. Eco Sci 2005; 12: 11-26.
Density-Dependent Growth in Juvenile Sockeye Salmon (Oncorhynchus Nerka) The Open Fish Science Journal, 2011, Volume 4 61
[52] Clarke LR, Bennett DH. Zooplankton production and planktivore
consumption in Lake Pend Oreille, Idaho. Northwest Sci 2007; 81: 215-23.
[53] Hyatt KD. Mechanisms of food resource partitioning and the forag-
ing strategies of rainbow trout (Salmogairdneri) and kokanee (On-corhynchus nerka) in Marion Lake, British Columbia. PhD Thesis,
University of British Columbia, Vancouver 1980; 258 p.
Received: March 31, 2011 Revised: June 29, 2011 Accepted: June 21, 2011
© Hyatt et al.; Licensee Bentham Open.
This is an open access article licensed under the terms of the Creative Commons Attribution Non-Commercial License (http://creativecommons.org/licenses/
by-nc/3.0/) which permits unrestricted, non-commercial use, distribution and reproduction in any medium, provided the work is properly cited.