density-dependent acquired resistance to ticks in natural hosts, independent of concurrent infection...
TRANSCRIPT

Medical and Veteritiary Etitomology (1994) 8, 35 1-368
Population dynamics and density-dependent seasonal mortality indices of the tick Rhipicephalus appendiculatus in eastern and southern Africa SARAH E . RANDOLPH Department of ZooIogy, University of Oxford, U.K.
Abstract. Eight sets of previously published data on the seasonal abundance of the tick Rhipicephalus appendiculatus in Burundi, Uganda, Tanzania and Zimbabwe are analysed to yield seasonal mortality indices. Correlations between these indices and abiotic (climatic) and biotic (tick density) variables suggest that it is the stage from females to larvae that is most sensitive to adverse abiotic conditions, specifically low moisture availability. Mortality at the other stages of the tick's life cycle is strongly density-dependent. The precise nature of this density-dependence suggests that it may be caused by acquired resistance to ticks by cattle. Robust correlations between satellite-derived vegetation indices, climatic factors and mortality indices suggest that detailed climatic data, often unavailable, may be replaced by satellite data, now widely available, for use in modelling tick populations.
Key words. Ticks, Rhipicephalus appendiculatus, mortality indices, density- dependence, satellite imagery, Africa.
Introduction
The tick Rhipicephalus appendiculatus Neumann (Acari: Ixodidae), vector of the Theileria parva group of blood protozoa (Piroplasmida: Theileriidae) throughout eastern and southern Africa, is economically the most important tick species in Africa (De Vos, 1981). Its distribution, abundance and seasonal dynamics directly determine the epidemiology of theileriosis. The population dynamics of any organism are the product of the interaction of the demographic processes, birth and death, whose rates may vary independently of each other, determined by both biotic and abiotic interactions (Rogers & Randolph, 1986). Hitherto, attempts to understand the seasonal dynamics of ticks have been based on relating climatic variables to the numbers of ticks rather than the underlying demographic rates (Randolph, 1993). An adverse season that always causes high tick mortality, however, may follow a period of population growth and thus be associated with high tick numbers and vice versa. Only by looking at demographic rates will the interaction of ticks with their natural environ- ment be correctly disentangled.
For ticks, birth rates are easy to quantify and do not vary much with natural environmental conditions. The
Correspondence: Dr S. E. Randolph, Department of Zoology, South Parks Road, Oxford OX1 3PS, U.K.
development rate, including the rate of egg-production, declines with falling temperatures, but the fecundity (total egg-production), although reduced by extremes of temperature, does not vary much within the temperature range normally encountered by ovipositing females (eastern Africa, mean temperatures throughout year 18-25"C, Branagan, 1973a; southern Africa, mean temperature during rainy season c. 20°C, Short et al . , 1989). Although standard tick census data cannot be used to estimate absolute levels of natural mortality, the following analysis shows how they can yield estimates of seasonal mortality indices and how these indices may be used to identify the abiotic and biotic factors critical to the survival of R.appendiculatus within its distributional limits and, by inference, its failure to survive outside these limits.
Materials and Methods
Sources of data. There are very few published records of numbers of all three life stages of R.uppendiculatus counted at regular (monthly) intervals over at least 1 year, accompanied by concurrent meteorological records from the same locality. For equatorial Africa, the best such records have been provided by Kaiser et al. for five loc- alities in Burundi (Kaiser et al., 1988) and for two localities in southern and northern Uganda (Kaiser et al . , 1982,
35 1

19YI). and b y McCulloch at Mwanza. Sukumalancl i n Tanzania (McCulloch P I (11.. 1968). \\here ticks were censused on cattle (and sheep and goats in Tanzania) at weekly or monthly intervals. In southern Africa, com- parable records are available from Lake Mcllwaine, Zimbabwe, where the ticks. maintained by wildlife. were sampled from the vegetation (Short & Nor\al, 19x1).
The details o f the census methodology are described in the original publications: f o r the purposes o f the present analysis, monthly indices o f tick numbers ha \e been extracted from figures showing the mean total number of ticks per host (or per fixed number o f hosts), or per standard area of vegetation in the case of Zimbabwe. (N.R. In Kaiser et ul. (1988) Figs 2(c)-6(c) are wrongly labelled: consistent with female ticks staying on the host for shorter periods than males. the counts of females were lower than those of males (Table 1 of Kaiser (’r d. . 1988). so the data for females are i n fact the lower curve on each graph, not the upper curve as stated in the legend.) Sinii- Iarly. the meteorological conditions (rainfall, tempera- ture and, in the case of Tanzania, relative humidity) were derived from the appropriate figures. Variation i n the precise protocol of counting ticks and recording the meteorological conditions between sites d o not affect the present analysis. which depends on seasonal variation within sites and not quantitative comparisons between sites.
Satellirr data. Details o f the satellite data, and a dis- cussion o f the validity of the use of non-coincident satellite imagery and population and climatic data sets for these sorts of studies, are given in Randolph (1993). Briefly, the satellite images were derived from 10-day whole Africa maximum value composites from the ARTEMIS program based in FAO. Rome, with a pixel resolution of c. 7.6 km. t o give a single image each month for the period January 1987 to December 1989, at each study site. These were processed to give normalized difference vegetation indices (NDVls). a measure of the photosynthetic activity and vegetation types that is closely correlated with long-term average saturation deficit and rainfall in Africa and with mortality rates and population densities of arthropods (Rogers 6i Randolph, 1991).
Estiniutioi~ o j niortulity iridiws. Monthly indices o f tick mortality rates (hereafter ‘mortality indices‘). in the form of k-values (Varley CI ul.. 1973). were estimated by sub- tracting the monthly loglo (numbers + 1) of one stage of tick (e.g. nymphs) from the log,,, (numbers + I ) o f thc preceding stage (e.g. larvae) with the appropriate time interyal equivalent to the development period. In the case o f mortality from adult females to larvae. reproduction must he taken into account by adding the log fecundity t o the log number of females before subtracting the log number of larvae. As long as tick fecundity does not vary seasoitally, its precise level is not critical because the aim i s to derive a seasonal index of mortality rather than estimate the precise level of mortality. Throughout this analysis a fecundity of 2000 eggs per female has been used. which, although conservative, was sufficient to give consistently positivc estimates o f female-to-larval
mortality. (Increasing the fecundity t o 3000 or 4000 eggs per female would merely h a w the effect of adding 0.176 o r 0.301 to each female-to-larval mortality estimate.)
A similar question o f scaling arises because fccding larval ticks are alniost always under-counted, both because they are difficult to see, and because they feed for much shortcr periods than d o females. Simply re-scaling the larval numbers by multiplying by 100 before logs wcrc taken (log ( 1 1 + I ) x 100) gave sensible positive estimates o f mortality rates from larvae to nymphs on most occasions, tcithout affecting the seasonal variation in the mortality index. The same situation is true, to a lesser extent, of nymphs. but in this case the numbers o f nymphs were not re-scaled before taking logs, resulting in some riegativc estimates of mortality froni nymphs to adults for each data set from equatorial Africa. Negative A-values, that arise when there are more of the later than earlier life stages. are clearly artefactual a s neither reproduction nor immigration occurs at this stage o f the tick’s life cycle. but they do not affect the pattern of seasonal variation in niortality indices. They indicate that the sampling procedures for the feeding immature stages of K . u p p c r d i ( a ~ u r ~ ~ . s d o not correctly reveal the relative iiuni-
hers o f each tick stage, but as long a s the accuracy with which these immature stages are counted does not change seasonally. these samples will give a useful index of the seasonal variation in abundance o f each stagc, upon which the seasonal variation in niortality indices i s basccl. Random sampling errors will show up a s noisci in the revealed patterns. Conversely, it is more difficult t o sample adults than larvae or nymphs on the vcgetation. .4t Lake Mcllwaine. Zimbabwe, questing larvae. nymphs and adults were counted in the ratio of approximately 3 7 0 3 : I respectively, and so no rescaling was necessary t o give positive mortality estimates in all but two instances. This is biologically sensible, but does not necessarily imply any prcater accuracy in questing tick counts.
The numbers of adults arising from the counted nymphs were calculated as twice the total numbers of females to avoid the problems of differential sampling of males and females.
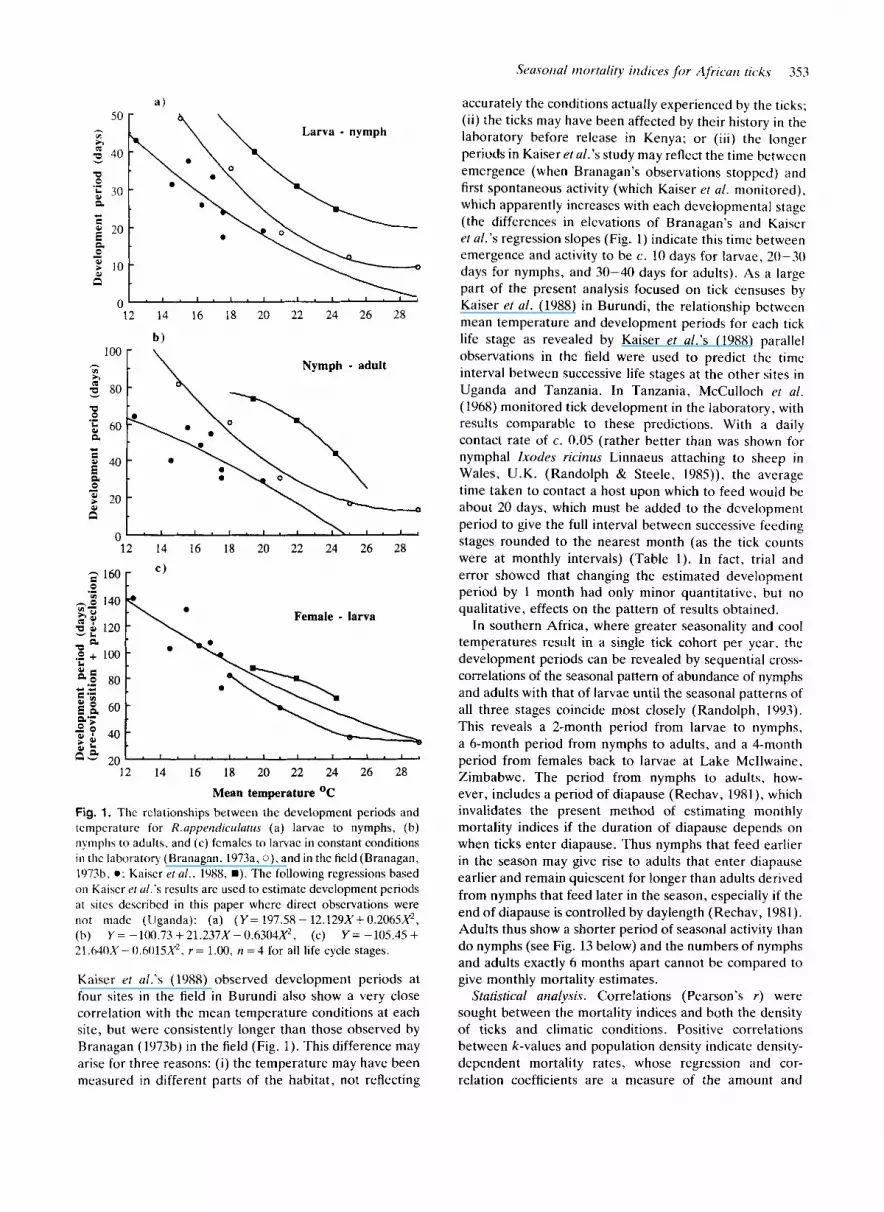
Dcwlopnicrit p r i o c l s . The development period at each stage of the tick’s life cycle is critical to the estimation of mortality indices. I n equatorial Africa, where the tick generations are continuous and overlapping, the develop- ment periods may be estimated either from the known relationship between temperature and development ratcs, or from experimental observations in the field. Unfor- tunately these methods d o not give consistent results. Branagan’s ( 1973a. b) results show that the devclopnient periods from engorged larvae and nymphs to cmcrgent nymphs and adults respectively were longer under constant conditions in the laboratory (which were very similar t o t h e results of Tukahirwa (1976) than at the same meat1 teniperaturcs under quasi-natural conditions in the field in Kenya (Fig. la . h ) , whcrcas the obscrvations f o r ~ l ~ c period froni engorged females to emergent larvae (pre- oviposition plus pre-eclosion) were at different parts o f the temperature range and do not differ s o clearly (Fig. Ic).
Srasorial mortality indices fo r A fricarr ticks 353
Larva - nymph
" 12 14 16 18 20 22 24 26 28
b )
0 ' ' ' I . ' . ' ' A , ' . I 4
12 14 16 18 20 22 24 26 28
Female - larva
L"
12 14 16 18 20 22 24 26 28
Mean temperature OC
Fig. 1. The rclationships between the development periods and tcmpcrature for R.uppendiculatus (a) larvac to nymphs, (b) nymphs to adults, and (c) fcmales to larvac in constant conditions in thc laboratory (Branagan. 1973a, 0). and in the field (Branagan, 107%. 0 ; Kaiscr e/ al.. 1988, B). The following regressions based on Kaiscr er ul.'s results arc used to estimate development periods at sitcs described in this paper where direct obscrvations were riot made (Uganda): (a) ( Y = 197.58- 12.129X+0.2065X2, (h) Y = -100.73 +21.237X-0.6304X2, (c) Y = -105.45 + 21.64OX- 0.6015X2. r = 1.00, n = 4 for all life cycle stages.
Kaiser rt al.'s (1988) observed development periods at four sites in the field in Burundi also show a very close correlation with the mean temperature conditions at each site, but were consistently longer than those observed by Branagan (197%) in the field (Fig. 1). This difference may arise for three reasons: (i) the temperature may have been measured in different parts of the habitat, not reflecting
accurately the conditions actually experienced by the ticks; (ii) the ticks may have been affected by their history in the laboratory before release in Kenya; or (iii) the longer periods in Kaiser etal.'s study may reflect the time between emergence (when Branagan's observations stopped) and first spontaneous activity (which Kaiser et al. monitored), which apparently increases with each developmental stage (the differences in elevations of Branagan's and Kaiser et al.'s regression slopes (Fig. 1) indicate this time between emergence and activity to be c. 10 days for larvae, 20-30 days for nymphs, and 30-40 days for adults). As a large part of the present analysis focused on tick censuses by Kaiser et al. (1988) in Burundi, the relationship between mean temperature and development periods for each tick life stage as revealed by Kaiser et al.'s (1988) parallel observations in the field were used to predict the time interval between successive life stages at the other sites in Uganda and Tanzania. In Tanzania, McCulloch rt al. (1968) monitored tick development in the laboratory, with results comparable t o these predictions. With a daily contact rate of c. 0.05 (rather better than was shown for nymphal Ixodes ricinus Linnaeus attaching to sheep in Wales, U.K. (Randolph & Steele, 1985)), the average time taken to contact a host upon which to feed would be about 20 days, which must be added to the development period to give the full interval between successive feeding stages rounded to the nearest month (as the tick counts were at monthly intervals) (Table 1) . In fact, trial and error showed that changing the estimated development period by 1 month had only minor quantitative, but no qualitative, effects on the pattern of results obtained.
In southern Africa, where greater seasonality and cool temperatures result in a single tick cohort per year. the development periods can be revealed by sequential cross- correlations of the seasonal pattern of abundance of nymphs and adults with that of larvae until the seasonal patterns of all three stages coincide most closely (Randolph, 1993). This reveals a 2-month period from larvae to nymphs, a 6-month period from nymphs to adults, and a 4-month period from females back to larvae at Lake Mcllwaine, Zimbabwe. The period from nymphs to adults, how- ever, includes a period of diapause (Rechav, 1981), which invalidates the present method of estimating monthly mortality indices if the duration of diapause depends on when ticks enter diapause. Thus nymphs that feed earlier in the season may give rise to adults that enter diapause earlier and remain quiescent for longer than adults derived from nymphs that feed later in the season, especially if the end of diapause is controlled by daylength (Rechav, 1981). Adults thus show a shorter period of seasonal activity than d o nymphs (see Fig. 13 below) and the numbers of nymphs and adults exactly 6 months apart cannot be compared to give monthly mortality estimates.
Statistical anal-ysis. Correlations (Pearson's r ) were sought between the mortality indices and both the density of ticks and climatic conditions. Positive correlations between k-values and population density indicate density- dependent mortality rates, whose regression and cor- relation coefficients are a measure of the amount and

354 Sarah E. Ruiidolph
Table 1. The estimated duration of the devclopmcnt periods for cach stagc of thc life cycle of R.appendicu1aru.y at sites in eastcrn and southern Africa uscd in the present analysis.
Site
Tcmpcraturc Larvae-to-nymphs Nymphs-to-adults Fcmalcs-to-larvac
Observed* Estimatcd Obscrved:~ Estimated Obscrved" Estimated Min. Max. Mcan (days) (months) (days) (months) (days) (months)
Zimbabwe 4 - 6' - Lake McIlwaine 10.0 25.0 17.5 - 2
Burundi Kirundo 15.9 27.0 21.4 31 2 62 3 80 4 Gihofi 15.2 28.6 21.9 31 2 62 3 80 4 Gitcga 13.4 25.4 19.4 40 2 74 3 88 4 Gatumba 18.1 311.3 24.2 25 1 44 2 66 3
Uganda 3 4
- 2 3
- Baker's Fort 17.25 29.5 23.4 - 1 - - Kigungui 17.0 26.0 21.5 - 2
Tanzania 34.3 - 159 1 2OP 1 5 9 3 Mwanza -
* Obscrvcd in the ticld, time from cngorgcment to first questing activity. but excluding contact time. ' Includes diapause. ' Temperatures taken from H.M.S.O. (1958). ' Observed in laboratory, time from engorgement to moult.
predictability respectively of the density-dependence. Correlations between k-values and abiotic variables exist where mortality rates are density-independent. The con- tribution of several independent variables as predictors of mortality was investigated by stepwise multiple regression using the Minitab package (copyright 1991 by Minitab Inc.). Each statistically revealed correlation was examined visually to guard against spurious results generated by isolated data points.
Results
The general features of the popclation dynamics of R. apperrdiculurus as revealed by this analysis will be pre- sented first, using data from Kirundo in northern Burundi (30°06'E, 2"35'S) as a detailed example. Additional fea- tures and points of contrast in the tick dynamics at the other sites will be related to the particular conditions of each place. Unfortunately, the data from the fifth site in Burundi, Ijenda, proved unusable because the zero larval counts recorded on cattle between November and February each year almost certainly represent the threshold of detection on cattle rather than a true absence of larvae (because nymphs and adults, that must be derived from larvae, are present throughout the year). This invalidates the seasonal mortality indices that depend on larval num- bers estimated at this site.
Kirurido, Rururzdi
The annual pattern of seasonal abundance of R . q -
perzdiculutus at Kirundo (Fig. 2a) gives the striking im- pression of a single annual cycle, with the numbers of all three stages of tick falling dramatically 2 months after the brief dry season (Fig. 2b). As the estimated total life cycle duration is at most about 9 months (Table l), the annual cycle cannot be due to the tick's development cycle, which is not synchronized with the annual climatic pattern in this region of equable, warm, moist conditions, presumably good for tick survival. Rather, the tick's life cycle is independent of the calendar year, but the brief dry season imposes a marked increase in mortality once a year. This effect is not, however, identical for all tick stages, and analysis has revealed the precise stages that are most affected by adverse weather conditions, and how the combination of ablotic and biotic factors produces the observed pattern.
Mortality from larvae to nymphs is markedly density- dependent, correlating most strongly with the numbers of feeding larvae upon which the mortality estimate is based (Fig. 3a). Stepwise multiple regression showed that the deviations from the density-dependent regression are negatively correlated with the rainfall of the month the larvae were feeding and thus entering their development phase (Table 2). The numbers of nymphs declined sharply in December/January of each year (Fig. 2a), for which no clear explanation consistent with the rest of the annual pattern has been found.
Density-dependence in the mortality from nymphs to adults is even more pronounced than during the preceding stage (Fig. 3b), giving remarkably constant numbers of adult ticks during the period of observation (Fig. 2a), apart from sharp decreases caused by increased mortality associated with the dry season. The four highest monthly
Seasorial mortality iiidicw for Africuri ticks 355
Kirundo. Burundi Kirundo, Burundi
4.50 1 a) n
6 12 18 24 1 S O 0
U
3 P 2 6 1 1 22
r L
2 18! 140 6 12 18 24
Sample month
Fig. 2. Kirundo, Burundi. (a) The seasonal variation in abun- dance of R.uppendiculutus larvae Xl00 (O), nymphs ( 0 ) and females ( W ) . (b) The seasonal pattern of rainfall. (c) The seasonal pattern of minimum ( 0 ) and maximum ( W ) temperatures. Sample month 1 is January 1980. Redrawn from Kaiser et ul. (1988).
mortality estimates of Fig. 3(b) are associated with the four months of zero rainfall (Fig. 4). T h e level of rainfall that occurs 1 month after the nymphs have fed is most strongly negatively correlated with deviations from the density-dependent mortality regression, implying that the stage most affected by dry conditions is the engorged nymphs as they are developing to adults (Fig. 4, Table 2). A t the same time there is a minor effect of temperature, the lower the minimum temperature the higher is the additional mortality (Table 2), presumably because develop-
2.0 F a) * .'
g 1.0
= = ? 3 0.5 t - ,.*- - ,..- * ,..*;
.f.
-1.5 1.5 2.0 2.5 3.0 3.5 4.0 4.5 5.0
Log (no. larvae x100)
2.0 2.5 3.0 3.5 Log no. nymphs
. *.. 3.0 .*. .. 7 5
. ... 1 .o I I . I
0 10 20 30 40 50 Mean weekly rainfall (mm) 2 months after females feedine
Fig. 3. Kirundo, Burundi. (a) The density-dependent relation- ship between the index of mortality from larvae to nymphs and the log number of R.appendiculutus larvae. Y = -2.477 + 0.892X. r = 0.899, n = 24, P < 0.001. (b) The density-dependent relation- ship between the index of mortality from nymphs to adults and the log number of R.uppendiculatus nymphs. Y = -3.797 + 1.350X, r = 0.935, n = 22, P < 0.001. (c) The relationship between the index of mortality from females to larvae and rainfall 2 months after female R.uppendicularus have fed. Y = 3.480 - 0.05629X, r = 0.844, n = 21, P < 0.001. one outlier omittcd from the regression, see text. In all cases the dotted line, described by each equation, is the single variable regression; full details of the stepwise multiple regression applied to the data are given in Table 2.
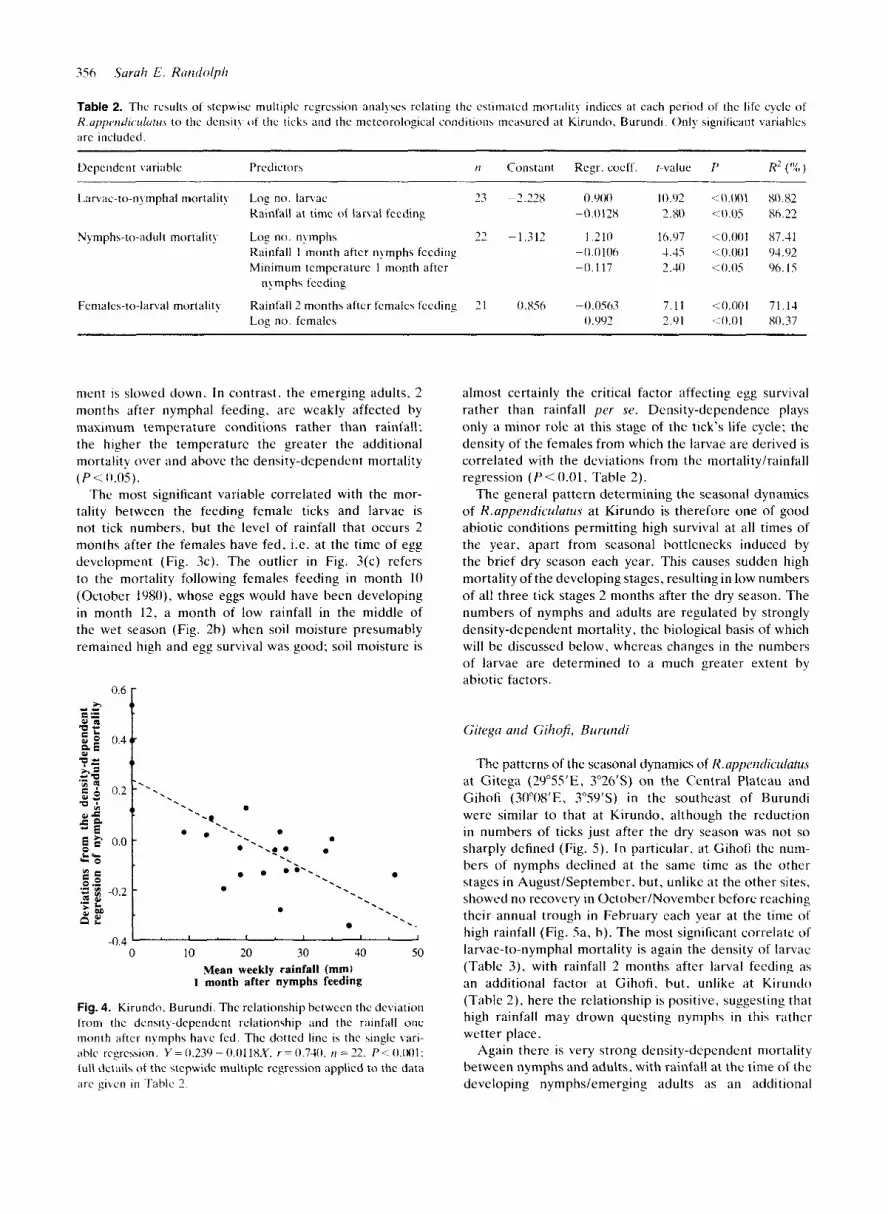
Table 2. The results o f stcpwisc multiple regression anal!.\e> relating the estimated mort;ilil! indices at cach period of the life cycle of K.uI'I'e"(Ii(.LIIU/~~~ t o the den\it! o f the ticks and the meteorological conditions measured at Kirundo. Burundi. Only significant variables arc included.
Dcpeiidcnt variahle Predictors t i Constant Regr. cocff. r-value P H' ( 1 % )
Ixvac-to-nymphal mortalit! Log no. larvae 23 -2.22s 0.90U 10.cJ2 <0.001 80.82 Rainfall at time of larval feeding -0.0128 2.80 <:o.os 86.22
Rainfall 1 month after nymphs feeding - 0.0 106 4.45 <0.001 94.92 Minimum temperature 1 month after -0.117 2.40 <0.05 96.15
Nymphs-to-adult mortality Log no. nymphs 22 -1.312 1.210 16.97 <0.001 87.41
nFrnpha feeding
Females-to-lanal mortality Rainfall 2 months after females feeding 2 1 0.856 -0.0563 7.11 4 . 0 0 1 71.13 Log n o . females 0.992 2.91 .:0.01 80.37
nient is slowed down. In contrast. the emerging adults. 2 months after nymphal feeding. are weakly affected by niaxinium temperature conditions rather than rainfall; the higher the temperature the greater the additional mortality over and above the density-dependent mortality ( P < 0.0s).
The most significant variable correlated with the mor- tality between the feeding female ticks and larvae is not tick numbers, but the level of rainfall that occurs 2 months after the females have fed, i.e. at the time of egg development (Fig. 3c). The outlier in Fig. 3(c) refers to the mortality following females feeding in month 1 0 (October 1980). whose eggs would have been developing in month 12, a month of low rainfall in the middle of the wet season (Fig. 2b) when soil moisture presumably remained high and egg survival was good; soil moisture is
a
. ... -0.4' ' ' ' ' ' ' ' ' . I
0 10 20 30 40 50 Mean weekly rainfall (mm)
1 month after nymphs feeding
Fig. 4. Kirundo. Burundi. Thc relationship between thc deviation Irom tlic dcnsit>-dependcnt relationship and the rainfall one month after nymphs have led. The dotted line is the single vari- able r q r c s i o n . Y = 0.23'1 - 0.0118X. r = 0.74). ti = 22. P C O , ( I O I : full details of the stepwide multiple rcgrcssion applied to the data iii-e $\en in Tahlc 2
almost certainly the critical factor affecting egg survival rather than rainfall per se. Density-dependence plays only a minor role at this stage of the tick's life cycle: the density of the females from which the larvae are derived is correlated with the deviations from the mortality/rainfall regression (P<O.Ol. Table 2).
The general pattern determining the seasonal dynamics of R.appetidiculuti4.s at Kirundo is therefore one of good abiotic conditions permitting high survival at all times of the year. apart from seasonal bottlenecks induced by the brief dry season each year. This causes sudden high mortality of the developing stages, resulting in low numbers of all three tick stages 2 months after the dry season. The numbers of nymphs and adults are regulated by strongly density-dependent mortality, the biological basis of which will be discussed below, whereas changes in the numbers of larvae are determined to a much greater extent by abiotic factors.
Gifegu arid Gihoji, Birnoidi
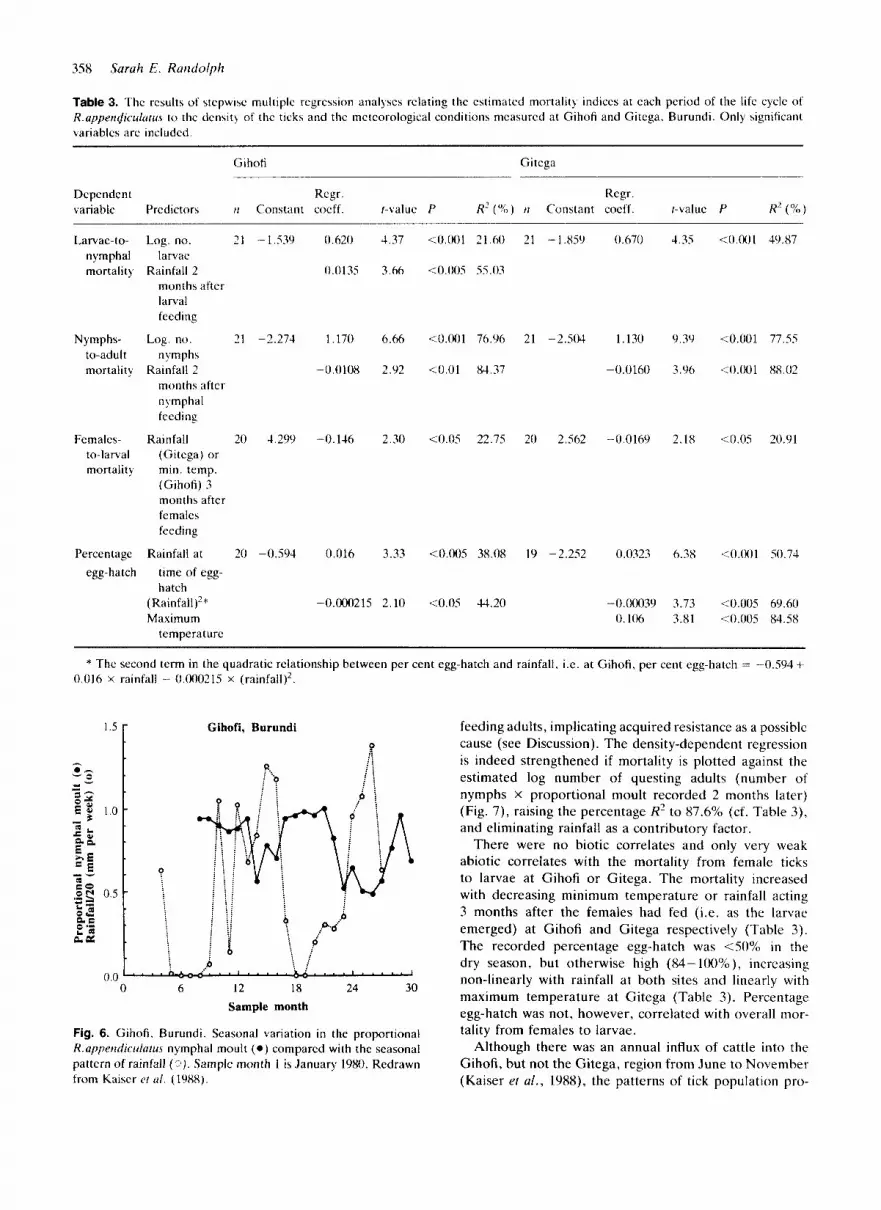
The patterns of the seasonal dynamics of R.upptzi1iculutu.s at Gitega (29'55'E, Y26'S) on the Central Plateau and Gihofi (30"08'E. 3'59's) in the southeast of Burundi were similar to that at Kirundo, although the reduction in numbers of ticks just after the dry season was not so sharply defined (Fig. 5 ) . In particular, at Gihofi the num- bers of nymphs declined at the same time as the other stages in August/September, but, unlike at the other sites, showed no recovery in October/November before reaching their annual trough in February cach year at the time of high rainfall (Fig. Sa, b). The most significant correlate of larvae-to-nymphal mortality is again the density o f larvae (Table 3), with rainfall 2 months after larval feeding as an additional factor at Gihofi. but, unlike at Kiruntlo (Table 2). here the relationship is positive, suggesting that high rainfall may drown questing nymphs in this rather wetter place.
Again there is very strong density-dependent mortality between nymphs and adults, with rainfall a t the time of the developing nymphdemerging adults a s an additional

Gihofi, Burundi a )
Seasorial mortality iridices f o r Afiicari rich
Gitega, Burundi
351
d )
1 , . . . . . I . . . . . I . . . . . I . . . . . 1 0 6 12 18
0 6 12 18 24 30 24
Fig. 5. Gihofi (a. b and e) and Gitega (d, e and f), Burundi. (a) and (d) The seasonal variation in abundance of R.appendicu1uru.s larvae x 100 ( 0 ) . nymphs ( 0 ) and females (a). (b) and (e) The seasonal pattern of rainfall. (e) and (f) The seasonal pattern of minimum ( 0 ) and maximum (m) tcmpcratures. Sample month 1 is January 1980. Redrawn from Kaiser et al. (1988).
factor negatively correlated with mortality (Table 3 ) . At both Gihofi and Gitega the data recorded by Kaiser et al. (1988) on the percentage nymphal moult adds insight to the likely cause of this density-dependent mortality. This will be illustrated by the data from Gihofi where the period of observation of nymphal moult coincides more completely with the period of tick counts on cattle. The recorded percentage nymphal moult was usually high (>SO%), but decreased during the wet season (Fig. 6), such that percentage nymphal moult was negatively cor-
related with contemporary rainfall ( r = 0.597, IZ = 20, P < 0.01), possibly due to drowning of developing nymphs/ emerging adults. Thus there is the counter-intuitive con- dition that rainfall is negatively correlated with both percentage nymphal moult and nymphs-to-adult mortality, and indeed high percentage nymphal moult is significantly associated with a high nymphs-to-adult mortality ( r = 0.464. t = 2.16, n = 19, P < 0.05). This suggests that the density- dependent mortality factor(s) acts after the nymphs have moulted, i.c. on the adults before they are counted as
358 Sarah E. Rarzdolpl?
Table 3. The rcsults of stcpwise multiplc rcgrcssion analyscs relating the estimated mortality indices at each period of the life cycle o f R.upperidiculuru\ to thc dcnsity of the ticks and the mctcorological conditions mcasurcd at Gihoti and Gitega, Burundi. Only significant variables arc included.
Gihoti Gitega
Dependent Regr. Rcgr. variable Predictors ti Constant cocff. r-value P R’ (“4)) ti Constant coeff. r-value P R’ (%)
Larvac-to- nymphal mortalit)
Nymphs- to-adult mortality
Females- to-ldrtal mortality
Pcrcen tage egg-ha tch
Log. no. 21 -1.539 0.620 4.37 larvac
months after larval feeding
Rainfall 2 0.0135 3.66
Log. no. 21 -2.274 1.170 6.66
Rainfall 2 -0.0108 2.92 11 ym p h s
months after nymphal feeding
Rainfall 20 4.299 -0.146 2.30 (Gitcga) or min. temp. (Gihofi) 3 months after females feeding
Rainfall at 20 -0.594 0.016 3.33 time of egg- hatch
Maximum (Rainfall)’” -0.000215 2.10
temperature
<(J 001 21 H J 21 - 1.859 0.670 4 35
1 0 o(J5 55.03
10.001 76.96 21 -2.504 1.130 9.39
<0.01 84.37 -0.0160 3.96
10.05 22.75 20 2.562 -0.0169 2.18
<0.005 38.08 19 -2.252 0.0323 0.38
<0.05 4‘4.20 -0.ooo39 3.73 0.106 3.81
<o 001 49.87
10.001 77.55
<O.OUI 88 02
10.05 20.91
10.001 50.74
<0.005 69.60 10.005 84.58
* Thc second term in the quadratic relationship between per cent egg-hatch and rainfall. i.e. a t Gihoti, per cent egg-hatch = -0.594+ 0.016 X rainfall - O.OOO215 x (rainfall)’
p
Gihofi, Burundi
P a : .. ; ? . . . . . .
i . . :
Fig. 6. Gihofi. Burundi. Seasonal variation in the proportional R.uppendiculutus nymphal moult ( 0 ) compared with the seasonal pattern of rainfall (0). Sample month 1 is January 1980. Redrawn from Kaiser er ul . (1988).
feeding adults, implicating acquired resistance as a possiblc cause (see Discussion). The density-dependent regression is indeed strengthened if mortality is plotted against the estimated log number o f questing adults (number of nymphs x proportional moult recorded 2 months later) (Fig. 7), raising the percentage R’ to 87.6% (cf. Table 3), and eliminating rainfall as a contributory factor.
There were no biotic correlates and only very weak abiotic correlates with the mortality from female ticks to larvae at Gihofi or Gitega. The mortality increased with decreasing minimum temperature or rainfall acting 3 months after the females had fed (i.e. as the larvae emerged) at Gihofi and Gitega respectively (Table 3). The recorded percentage egg-hatch was <SO% in the dry season, but otherwise high (84- 100%0), incrcasing non-linearly with rainfall at both sites and linearly with maximum temperature a t Gitega (Table 3). Percentage egg-hatch was not, however, correlated with overall mor- tality from females to larvae.
Although there was an annual influx of cattle into the Gihofi, but not the Gitega, region from June to November (Kaiser rt ul., 1988), the patterns of tick population pro-

Seasorial mortality iridices fo r Afrirari ticks 359
Gihofi, Burundi Gatumba, Burundi L a)
2
B k l t h
P ? ol 5
0
/
r"
Loo 1 SO 2.00 2.50 3.00 Log (no. nymphs x proportion nymphal moult)
i.e. log no. questing adults
Fig. 7. Gihofi, Burundi. The density-dependent relationship between the log,,, (number of R.appendicufatus nymphs X pro- portional nymphal moult) (i.e. the log number of questing adults) and the index of mortality from nymphs to adults. This single variable is the only significant correlate; Y = -2.836 + 1.337X, r=0.936. H = 19. P<O.OOl.
cesses at Gihofi and Gitega are very similar, with no sign of any discontinuity in the annual patterns at Gihofi. Intuitively one would expect a higher host density t o result in a higher tick feeding success, but its effect on the tick population would depend on the numbers of immigrant cattle relative to the numbers normally resident in the area and the proportion of the total questing tick popu- lation that normally succeeds in feeding, and would not necessarily be seen by the sampling procedure used in Kaiser et al. (1988) (see Randolph & Steele (1985) for a detailed example of the effect of host density on tick feeding success). Tick abundance (tickdhost) was in fact very much lower (c. one third) at Gihofi than at Gitega, but this comparison is confounded by the different abiotic conditions of the regions.
Gatumba, Burundi
Although the climate a t Gatumba (29"16'E, 3"19'S), in the western lowland plain of Burundi, was considerably hotter and drier than at the other sites in Burundi, the numbers of ticks did not show any consistent decline associated with the dry season, but rather showed remark- able constancy throughout the period of observation (Fig. 8). This was the only site at which considerable density-dependence was operating at all three stages of the tick's life cycle, including the stage from females to larvae (Table 4), and no correlations were found between mor- tality indices and either rainfall or temperature. Such strong density-dependence would mask any influence of climatic factors. Nevertheless, the numbers of larvae were
3.50
* G
a L 3.00
.- 3
d 9 2
< 2.50 L
2.00 M
1.50 6 12 18 24 30 36
6 12 18 24 30 36
8 18
2 14 U
=- g LO6 12 18 24 30 36
Sample month
Fig. 8. Gatumba, Burundi. (a) The seasonal variation in abun- dance of R.appendicularus larvae X l O O (*), nymphs ( 0 ) and females (w) . (b) The seasonal pattern of rainfall. (c) The seasonal pattern of minimum (0) and maximum (m) temperatures. Sample month 6 is June 1980. Redrawn from Kaiser er al. (1988).
occasionally dramatically reduced, specifically in months 8, 21, 25, 30 and 32 (Fig. 8a), which is reflected in the considerably higher mortality estimates for the progeny of females feeding 3 months earlier in months 18, 22, 27 and 29 (Fig. 9) (female tick counts had not yet started in month 5); on only two of these occasions would eggs be develop- ing during the dry season (Fig. 8b). This mortality is not related to the recorded percentage egg-hatch, which showed the usual positive non-linear correlation with rain- fall ( r = 0.647, n = 28, P < 0.001). Grass-burning between

360 Saruh E. Karrdolpli
5 4.50
treatment at Gatumba (Kaiser ct ul . , 1988) may have knocked tick numbers down at random, hut this does not seem to have affected all stages equally.
M
5; 4.00
Z P .;$ 3.50 * - 0-
3.00 d d
Table 4. The results of \tep&csc multiple regression analyses relating the e5timatcd mortality indices at each period of the life cycle of ft.up~enilic.rclurits t o the dcnsit! o f the ticks and the meteorological conditions measured at Gatumba. Burundi. Only significant variables are included.
5'00;i -
Dependent variable Prcdictors tI Conmii t Regr cocff. r-value P R2 (%, )
Larvae-to-nymphal mortalit) Log n o . Ian ae 27 -2.519 0.935 6.85 10.001 65.23 Nymphs-to-adult mortality Log no. nymphs 25 - 1.909 0.700 4.46 <0.00 1 46.39 Females-to-larval mortalit) Log no. females -- 37 -0.217 1.221 3.58 < 0.005 39.00
June and September and possible occasional acaricidal a ) Mwanza, Tanzania
At hlwanza in 'Tanzania (32"57'E, 2"29'S), McCulloch ('t d. (1968) recorded relative humidity as well as rainfall and maximum temperature (Fig. 10); rainfall and relative humidity are strongly non-linearly positively correlated (r=0.769, J I = ? I , P ~ 0 . 0 0 1 ) , but stepwise multiple regression reveals that it is relative humidity rather than rainfall per se that is correlated with the tick mortality indices (Table 5) . Mortality both from larvae to nymphs and from nymphs to adults is again density-dependent. Nymph-to-adult mortality also increases significantly with increasing maximum temperatures acting 1 month after nymphs have fed. by which time the adults are already
Gatumba, Burundi
18 a
2 9. /
1.6 1.8 2.0 2.2 2.4 2.6 2.8 3.0 3.2 Log no. females
Fig. 9. Gaturnha. Burundi. The density-dependent relationship hetwecn thc index o f mortalit) from females t o larvae and the log number o f li.ui'/J~~~idic.iclurus females. This single variable is the o n l y significant corrclatc: Y = -0.217 + 1.222X. r = I).Q4. tf = 22. P - ~ O . l X ) S . The numhers on the bod) of the graph refer to thc month\ in which fecding l'crnalcs were counted.
1.50' ' ' ' ' ' ' " ' ' ' ' " ' ' * ' ' -12 -4 4 12 20 28 36 44 52 60
'0. v
12
10
8
6
4
2
n -12 -4 4 12 20 28 36 44 52 60
-12 -4 4 12 20 28 36 44 52 60 Sample week
Fig. 10. Mwanza. TanLania. (a) The scasonal variation i n ahun- dance of R.uppendiculutuA larvae x 100 ( O ) , nymphs ( c ) and females (w) . (h) The seasonal pattern o f rainfall (0) and rclativc humidity ( 0 ) . (c) The seasonal pattern of maximum temperrlturcs. Sample week 0 is 1 January 1967. Redrawn from McCulloch er ul. (1968).

Seasotial mortality indices for African ticks 36 1
Table 5. The results of stepwise multiple rcgression analyses relating the cstimated mortality indices at cach period of thc life cycle of K.u~,i,eric/ic.irlutlr to thc density of the ticks and the meteorological conditions mcasured at Mwanza. Tanzania. Only significant variablcs arc included.
Depcndcnt variable Prcdictors n Constant Regr. coeff. r-value P R’ (91, )
Larvac-to-nymphal mortality Log no. larvae 18 -2.274 0.960 6.08 <0.001 69.77
Nymph>-to-adult mortality Log no. nymphs 18 -3.187 0.673 8.27 <0.001 59.18 Max. temp. 1 month after nymphs feeding 0.044 3.93 ~ O . O O 5 85.04 RH % 1 month after nymphs feeding -0.0048 2.58 <0.05 89.X7
Fcmalcs-to-larval mortality RH YO 1 month after females feeding 16 9.310 -0.0315 5.38 <0.001 30.45 Max. temp. 1 month after females feeding -0.168 4.88 <0.001 75.41 RH % 2 months after females feeding 16 5.055 -0.0332 6.80 <0.001 42.50 Max. temp. 2 months after females feeding -0.118 3.70 <0.005 77.11 Log no. females 0.960 2.51 <0.0.5 84.99
Log no. females 1.72 3.60 <0.005 68.92 RH% 3 month after females feeding 16 -1.798 -0.0226 4.18 <0.001 37.87
questing (development is very fast in the high tempera- ture conditions, see Table l ) , and to a lesser extent with decreasing relative humidity.
The full results of the sequentially lagged stepwise multiple regression for the female-to-larval mortality indices are presented in Table 5, because they reveal the differential effects of abiotic and biotic factors acting at each stage of the development from females to larvae. Throughout the development period mortality is signi- ficantly negatively correlated with relative humidity, but while the eggs are developing, 1-2 months after the females have fed, mortality is also strongly negatively correlated with maximum temperature, presumably because high temperatures speed up development without causing desiccation as long as humidity is high. Later in
this development period, when the larvae are questing 2-3 months after the females have fed, the density of female ticks (presumably actually the density of their larval progeny) becomes an increasingly significant factor.
These factors explain the overall pattern at Mwanza (Fig. lo), where larval numbers are seasonally reduced by conditions of low relative humidity, followed by increas- ingly constant numbers of the succeeding life stages as strong density-dependence regulates their numbers.
Baker’s Fort and Kigungu, Uganda
Analysis of the seasonal dynamics of R.appendiculutus at Baker’s Fort in northern Uganda (32”20’E, 2’45”) and
Table 6. The results of stepwise multiple regression analyses relating the cstimated mortality indices at cach period of the life cycle of R.uppendicu/urus to the density of the ticks and the meteorological Conditions measured at Baker’s Fort, north Uganda and Kigungu. south Uganda. Only significant variables arc included.
Baker’s Fort Kigungu
Dependent Rcgr. Regr. variable Prcdictors n Constant cocff. t-value P R2 (%) n Constant coeff. f-value P R2 (X,)
Larvac-to- nymphal mortality
Nymphs-to- adult mortality
Fcmalcs-to- larval mortality
Log. no. 15 -0.335 0.585 13.58 <0.001 91.29 19 -2.155 0.888 7.29 <0.001 75.75 larvae
month after larval feeding
Rainfall 1 -0.0052 2.46 c0.05 94.22
Log. no. 14 -2.518 1.281 nymphs
4.90 <0.001 66.70 18 -1.924 0.721 4.42 <0.001 55.00
Rainfall 2 or 3 13 3.029 -0.039 3.86 <0.005 57.50 12 1.797 -0.0031 2.39 <0.05 36.43 months aftcr fcmalc feeding
(omitting the first 5 months, sce text)

362 Saruh E,'. Ruridolpli
a) 5.0 r Baker's Fort, Uganda Kigungu, Uganda
c d )
6 12 18 24 6 12 18 24
2 250
200
150
E'EI 100
c- 50 *; d
0 & S
C
$ i B
Z E -
24 6 12 18 24 6 12 18
Sample month Sample month
Fig. 11. Baker's Fort. north Uganda (a , b and c) and Kigungu, south Uganda (d. e and f ) . (a) and (d) The seasonal variation in abundance of R.uyi,etrdictrlurus larvae x 100 (e) , nymphs (0) and females (m) . (b) and (e ) The seasonal pattern of rainfall. (c) and (f) The seasonal pattern o l minimum (0) and maximum (m) temperatures. At Baker's Fort. sample month 11 is November 1977, and at Kigungu sample month h k June 1975. Redrawn from Kaiser L'I ul. (1991. 1982). Temperature data for Kigungu from H.M.S.O. (19%).
Kigungu in southern Uganda (32"26'E, O"02'N). where the rainfall pattern is more markedly biannual (Fig. 11). reveals biotic and abiotic factors related t o the mortality indices in ways that are very similar to the other sites in equatorial Africa. Once again there is strong density- dependence in the mortality from larvae to nymphs and from nymphs to adults (Table 6). with a minor additional effect of increased larvae-to-nymphal mortality associated with the dry scason at Baker's Fort (Table 6). The mor- tality from fcnialcs to larvae fluctuates biannually, with
periods of high mortality coinciding with times of low rainfall acting 2 months (at Baker's Fort) o r 3 months (at Kigungu) after the females have fed (Fig. 12, Table 6), at the time the larvae are hatching and starting to quest (see Table 1 for development periods). At Kigungu the pattern is less clear during the first 6 months of observations. when tick numbers in the experimental paddocks were apparently building up (Kaiser et ul., 1982; this study, Fig. 1 Id), resulting in no significant correlation overall (Table 6). but a significant negative correlation ( r = 0.603,

Baker's Fort, Uganda a)
P
Kigungu, Uganda
0 6 12 18 24 Sample month, when feeding females counted
Fig. 12. Baker's Fort, north Uganda (a) and Kigungu, south Uganda (b). The seasonal variation in the indices of mortality from females to larvae of R.uppendiculutus ( 0 ) compared with the scasonal pattern of rainfall (0 ) .
P < 0.05) if these early months are omitted. Thus both seasons of reduced rainfall are followed by reduced num- bers of larval ticks, and these fluctuations feed through to the succeeding life stages, whose seasonal fluctuations are considerably buffered by the strong density-dependence operating between larvae and adults.
Lake Mcllwaine, Zimbabwe
As explained in the Methods section, diapause in the adults confounds estimates of mortality from nymphs to adults in southern Africa. The other stages of the life cycle, however, are not affected by diapause. At Lake Mcllwaine, in Zimbabwe (30"40'E, 17'50's) the mor-
Seasonal mortality iiidices for A fricaii ticks
Lake McIlwaine, Zimbabwe r a)
4.0
B ."
Lf
g 1.0
* 3.0
c .- * a- 2.0 '
c 0 h
3
s 0.0 '
C M
363
0 6 12 18 24 30
s o =! 0 6 12 18 24 30
Sample month
Fig. 13. Lake McIlwaine, Zimbabwe. (a) The seasonal variation in abundance of R.appendiculatus larvae (O), nymphs (0) and females (m). (b) The seasonal pattern of rainfall. (c) The seasonal pattern of minimum ( 0 ) and maximum (m) temperatures. Sample month 6 is June 1976. Redrawn from Short 6i Norval (1981).
tality between the single annual cohorts of larvae and nymphs (Fig. 13) is weakly density-dependent (mortality = 0.0387+0.248Xlog larvae, R2%=31.89, t=2.98, n = 21, P < 0.01), with the deviations from this regression correlated with neither temperature nor rainfall. Mortality from females to larvae, on the other hand, is not density- dependent, but is strongly correlated with temperature conditions at certain stages of the development period.

Lake McIlwaine, Zimbabwe
-1.0 r , . I I I
4 - [ , , . , , , * , , , . I 9 -1.5 ' 1 4 6 8 10 12 14 16
Minimum temperature OC, 3 months after questing females were counted
2
C) I 1 .o
0.5
0.0
-0.5
-1.0
-1.J
4 6 8 10 12 14 16 Minimum temperature OC,
4 months after questing females were counted
Fig. 14. Lake Mcllwaine, Zimbabwe. The relationships hetween the index of mortality from females to larvae of R.upperitliculntus and (a) the maximum temperature 2 months after questing fernales were counted ( Y = -5.466 + 0.2334X. r = 0.835. ti 10. I'< 0.01). (h) the minimum temperature 3 months after qucsting females were counted ( Y = - 1.780 + 0.1033,Y. r = 0.941. II = 1 0 . f'<: O.(MIl). and (c) 4 months after questing females were counted ( Y = -- 1.753 + O.lJ20X. r = 0.716. ti = 10. P < 0.05). (The number o f monthl \ mortalit) indices is limited to ten. because the cuunt \ o f fcmalcs and larvae did no t coincide full) . Fig. 13)
Sequentially lagged stepwise multiple regression shows that the mortality index is correlated with the maximum temperature acting 2 months after the questing females were counted, when the eggs would be developing, but with minimum temperature 3 and (to a much lesser extent) 4 months after questing females, when the larvae would be emerging and questing (Fig. 14). This is consistent with the known facts that eggs are highly susceptible to desiccation, but larvae can withstand desiccating conditions for up to h h per day (i.e. high daytime maximum temperatures) as long as humidity is high at other times (Tukahirwa, 1976) (i.e. when cool night-time temperatures provide high condensation conditions (Randolph, 1993)). The differ- ence between Figs 14(b) and 14(c) presumably reflects the greater susceptibility to desiccation of the more recently emerged larvae. whose cuticle is not yet fully hardened and waterproofed. Female-to-larval mortality is not cor- related with any recorded climatic conditions acting on questing, feeding or ovipositing females, testimony to the greater robustness of female ticks compared with larvae.
Satellite dutu a r i d niortulity iridiccs
Although the periods of field observations on ticks and climate and of available satellite data are separated by 7 years (for Burundi), 10-12 years (for Uganda and Zimbabwe) and 21 years (for Tanzania), nevertheless at each site (except Kigungu, south Uganda) there are good correlations between the mean monthly climatic factors and NDVIs 1 or 2 months later on a synoptic annual basis (Fig. 15). As the objective was to see whether satellite data could be used to predict tick mortality indices, the climatic factors chosen are those which are best correlated with tick mortality (from females to larvae).
Having confirmed that these climatic factors are also correlated with tick mortality indices on a synoptic annual basis (twelve mean monthly values) as well as on an in- dividual monthly basis, it was not surprising to find signifi- cant correlations between the indices of mortality from females to larvae and NDVI, with the appropriate time lag (Fig. 16). For example, at Kirundo, Burundi, NDVl is positively correlated with rainfall 1 month previously (Fig. 1 5 ) . female-to-larval mortality is negatively cor- related with rainfall 2 months after females have fed (Table 2, Fig. 3c). and this mortality index is negatively correlated with NDVI 3 months after females have fed (Fig. 16a). At Mwanza, Tanzania, it is relative humidity that is the critical climatic factor: female-to-larval mor- tality is most strongly negatively correlated with relative humidity 2 months after the females have fed (Table S ) , NDVl is strongly correlated with rclativc humidity 1 month previously (Fig. 1%). giving a very strong ncgativc cor- relation between this mortality and NDVl 3 months after the females have fed (Fig. lha). At some sites there is no correlation between mortality indices and NDVl, e.g. at Gatumba. Burundi, where there is also no discernible correlation between mortality and any climatic factor (Table 4) ; and at Gihofi and Gitega, Burundi, where

Seasorial mortality itidices for A fricatl ticks 365
Mwanza, Tanzania
40 50 60 70 80 Mean monthly relative humidity 46, month n
L. McIlwaine, Zimbabwe
0 10 20 30 40 50 60 70 Mean monthly rainfall (mm per week), month n
0.20 5 7 9 11 13 15
Mean monthly minimum temperature oC, month n
Fig. 15. The relationships between mean monthly NDVI and (a) rainfall in Burundi and Uganda, (b) relative humidity in Tanzania, and (c) minimum temperature in Zimbabwe. (a) the regression line shown is for all sites summed, Y = 0.338 + 0.0066X- 0.000066X2, r = 0.733, n = 72, P<0.001, but the relationship is significant for five of the six sites separately: Gatumba ( o ) , r = 0.891; Kirundo (o), r = 0.785: Gihofi (m), r = 0.912; Gitega (A), r = 0.911; Baker's Fort (o), r = 0.738; in each case n = 12, P < 0.01 or 0.001; Kigunga (*), r = 0.374;, n.s. (b) Y = 0.0259 + 0.00525X, r = 0.928, n = 12, P < 0.001. (c) Y = 0.570 + 0.0750X + 0.00453X2, r = 0.940, n = 12. P < 0.001.
- a - ?
-Y
4.0 -
3.0 -
2.0 -
1.0 -
0.2 0.3 0.4 0.5 0.6 0.25 0.35 0.45
Mean monthly NDVI, 3 months after females fed Mean monthly NDVI, 1 or 2 months after egg-hatch
-1.5 0.2 0.3 0.4 0.5
Mean monthly NDVI, 5 months after females questing
Fig. 16. (a) The relationships between annual mean monthly indices of mortality from females to larvae of R.uppendiculatus and NDVI at Kirundo (0-0) (Y=7.207- 11.468X, r=0.812, P<O.Ol); Gatumba ( o - - - O ) (r=0.536, n.s.); Baker's Fort (A-A) (Y=4.717- 6.467X. r=0.676, P(0.05); Kigungu (*-.-.-.* ) (r=0.544, n.s.); Mwanza (m-m) (Y=3.010-4.083X, r=0.896, P<O.OOl). (b) The relationship between annual mean monthly proportional egg-hatch and NDVI at Gihofi ( 0 ) ( Y = -3.080 + 17.124X- 18.039X2, r = 0.917, P < 0.001) and Gitega (0) ( Y = - 1.626 + 9.390X - 8.651X2, r = 0.863, P < 0.001). (c) The relationship between annual mcan monthly indices of mortality from females to larvae and NDVI at Lake McIlwaine, Zimbabwe (Y = -2.300 + 7.656X, r = 0.818, n = 10. P<0.01).
the very weak correlations between mortality and climatic The situation in Zimbabwe illustrates the difference factors on a monthly basis d o not hold up on an annual between southern and equatorial Africa; here moisture basis, it is proportional egg-hatch rather than mortality availability t o ticks depends on low night-time minimum that is positively correlated both with rainfall in the same temperatures rather than rainfall (Randolph, 1993), giving month (Table 3) and with NDVI 1 or 2 months later a strong positive correlation between female-to-larval (Fig. 16b). mortality and minimum temperatures 3 months after
366 Surah E. Ruridolph
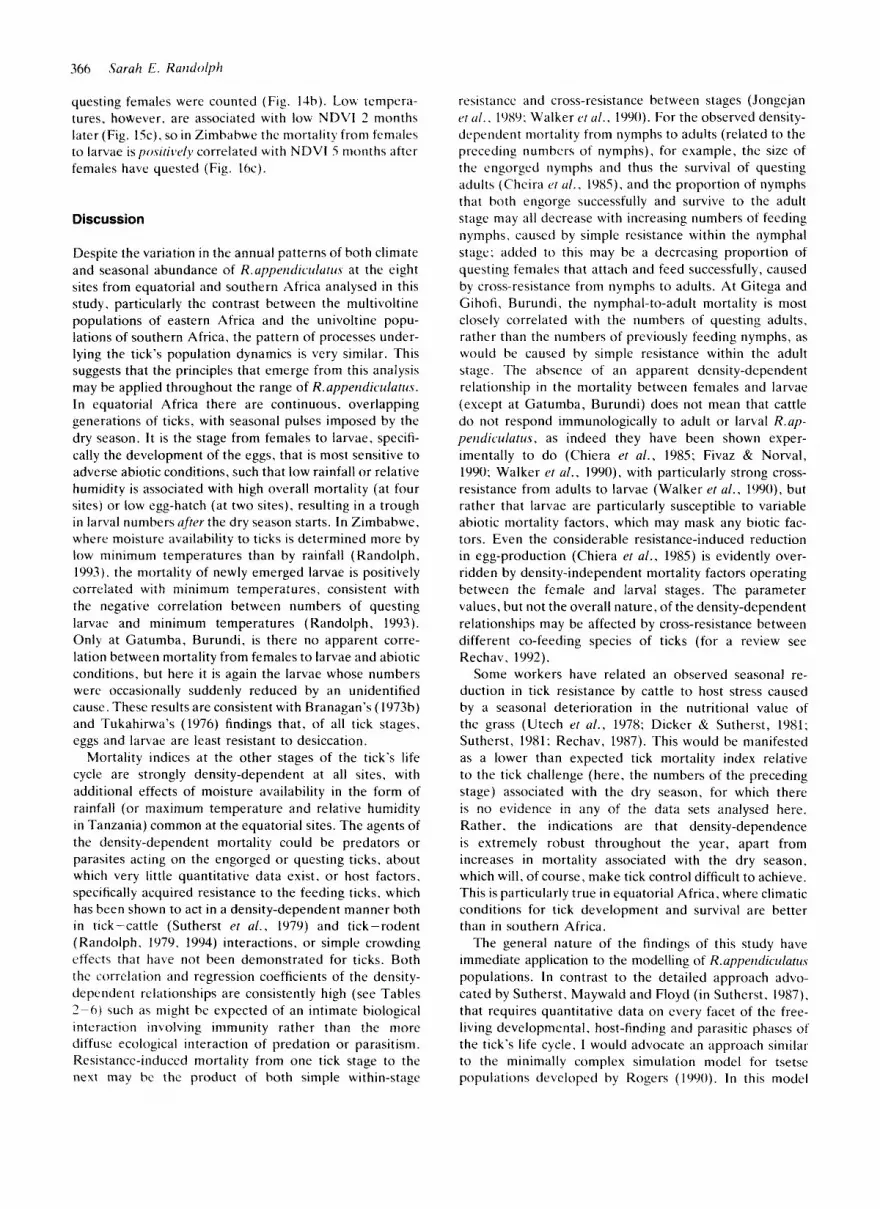
questing females were counted (Fig. I&). Low tempcra- tures, however, are associated with low NDVI 3 months later (Fig. 15c). so in Zimbabwe the mortality from femnles t o larvae is pmitiie/y correlated with NDVI 5 months after females have quested (Fig. 1 6 ~ ) .
Discussion
Despite the variation in the annual patterns of both climate and seasonal abundance of R.u~~i~etidiciclutirs at the eight sites from equatorial and southern Africa analysed in this study. particularly the contrast between the multivoltine populations of eastern Africa and the univoltine popu- lations of southern Africa, the pattern of processes under- lying the tick’s population dynamics is very similar. This suggests that the principles that emerge from this analysis may be applied throughout the range of R.ui,peridiculutit.s. In equatorial Africa there are continuous. overlapping generations of ticks, with seasonal pulses imposed by the dry season. It is the stage from females to larvae, specifi- cally the development of the eggs, that is most sensitive to adverse abiotic conditions, such that low rainfall o r relative humidity is associated with high overall mortality (at four sites) or low egg-hatch (at two sites), resulting in a trough in larval numbers ufier the dry season starts. In Zimbabwe. where moisture availability to ticks is determined more by low minimum temperatures than by rainfall (Randolph, 1993). the mortality of newly emerged larvae is positively correlated with niininium temperatures, consistent with the negative correlation hetween numbers of questing larvac and minimum temperatures (Randolph, 1993). Only at Gatumba, Burundi, is there no apparent corre- lation between mortality from females to larvae and abiotic conditions, but here it is again the larvae whose numbers were occasionally suddenly reduced by an unidentified cause. These results are consistent with Branagan’s (197%) and Tukahirwa’s (1976) findings that, o f all tick stages, eggs and l a n a e are least resistant to desiccation.
Mortality indices a t the other stages of the tick’s life cycle are strongly density-dependent at all sites, with additional effects of moisture availability in the form of rainfall (or maxinium temperature and relative humidity in Tanzania) common at the equatorial sites. The agents of the density-dependent mortality could be predators or parasites acting on the engorged or questing ticks, about which very little quantitative data exist. or host factors. specifically acquired resistance to the feeding ticks, which has been shown to act in a density-dependent manner hoth in rick-cattle (Sutherst ei al . , 1979) and tick-rodent (Randolph. 1979, 1994) interactions, or simple crowding effect5 that have not been demonstrated for ticks. Both the correlation and regression coefficients of the density- dependent relationships are consistently high (see Tables 7-61 such as might he expected o f an intimate biological interaction involving immunity rather than the more diffuse ecological interaction of predation or parasitism. Resistance-induced mortality from one tick stage to the next may he the product o f hoth simple within-stage
resistance and cross-resistance between stages (Jongejan 1’1 d.. 1989; Walker c’t d., 1990). For the observed density- dependent mortality from nymphs to adults (related to the preceding numbers of nymphs). for example, the size o f the engorged nymphs and thus the survival of questing adults (Cheira et d., 1985). and thc proportion of nymphs that both engorge successfully and survive to the adult stage may all decrease with increasing numbers of feeding nymphs. caused by simple resistance within the nymphal stage: atitled t o this may be a decreasing proportion of questing females that attach and feed successfully, caused by cross-resistance from nymphs to adults. At Gitega and Gihofi, Burundi. the nymphal-to-adult mortality is most closely correlated with the numbers of questing adults, rather than the numbers o f previously feeding nymphs, as would be caused by simple resistance within the adult stage. The absence o f an apparent density-dependent relationship in the mortality between females and larvae (except at Gatumba, Burundi) does not mean that cattle d o not respond immunologically to adult o r larval R.up- peridic~t/utirs. as indeed they have been shown exper- imentally to d o (Chiera et ul., 1985; Fivaz & Norval, 1990; Walker e/ d., 1990). with particularly strong cross- resistance from adults to larvae (Walker et al., 1990), but rather that larvae are particularly susceptible to variable abiotic mortality factors. which may mask any biotic fac- tors. Even the considerable resistance-induced reduction in egg-production (Chiera ef a / . . 1985) is evidently over- ridden by density-independent mortality factors operating between the female and larval stages. The parameter values, but not the overall nature, of the density-dependent relationships may be affected by cross-resistance between different co-feeding species of ticks (for a review see Rechav. 1992).
Some workers have related an observed seasonal re- duction in tick resistance by cattle t o host stress caused by a seasonal deterioration in the nutritional value o f the grass (Utech et ul., lY78; Dicker & Sutherst, 1981; Suthcrst, 1981; Rechav, 1987). This would be manifested as a lower than expected tick mortality index relative to the tick challenge (here, the numbers o f the preceding stage) associated with the dry season, for which there is no evidence in any of the data sets analysed here. Rather, the indications are that density-dependence is extremely robust throughout the year, apart from increases in mortality associated with the dry season. which will, of course, make tick control difficult to achieve. This is particularly true in equatorial Africa, where climatic conditions for tick development and survival are better than in southern Africa.
The general nature of the findings of this study have immediate application to the modelling of R.ui~per~dic.i4lui~4,~ populations. In contrast to the detailed approach advo- cated by Sutherst. Maywald and Floyd (in Sutherst, 1987). that requires quantitative data on evcry facet of the free- living developmental, host-finding and parasitic phases of the tick’s life cycle. I would advocate an approach similar to the minimally complex simulation model for tsetse populations devclopcd by Rogers ( 1990). I n this moclel

Seasorcal mortality indices f o r A,fricati ticks 367
seasonally varying density-independent (abiotic) mortality applied only to one stage of the life cycle, combined with density-dependence acting on two life stages, was adequate to describe tsetse population dynamics in Nigeria and Kenya. The present analysis of tick data sets has identified the elements necessary to apply the same modelling exer- cise to R.apprrzdiculatus, with the obvious advantage of requiring far fewer parameter values than the detailed approach. The results from equatorial and southern Africa show that regional variation in the tick’s demographic response to climate must be taken into account. The relationships between NDVIs and tick mortality indices indicate that detailed climatic data, which are often un- available, may be replaced by satellite data, that are now widely available. Although these relationships are no more than the product of the separate correlations between NDVI and mortality and climatic factors, nevertheless the fact that these expectations are borne out using temporally separated, synoptic annual data sets illustrates the poten- tial for using current data sets to analyse both past and present tick data sets, to predict future trends and as inputs in population models.
It will also be necessary to include diapause in any tick population model. In central and southern Africa the seasonal dynamics of R.appercdiculatus are critically affected by the occurrence of photoperiodically controlled behavioural diapause (as defined by Belozerov, 1982) in the adults (Rechav, 1981; Berkvens, 1990). Estimations of mortality indices for all stages of the life cycle and a complete tick population model applicable throughout the geographical range of this tick both depend on knowing the precise conditions that regulate the onset and termin- ation of diapause and the distribution of its occurrence.
This paper presents a biological approach t o under- standing the distribution of ticks, which complements the statistical approach, described in Rogers & Randolph (1993), that attempts to define, in multivariate space, the environmental characteristics of sites where ticks are known to occur and others where they do not. While the present study has identified moisture availability as the single most important abiotic variable correlated with tick mortality indices, the discriminant analysis techniques used by Rogers & Randolph (based on a single mean annual value for each climatic variable at each site where ticks are present or absent within each country) identified maximum temperature as the highest ranking variable predicting presence (in cooler places) and absence of R.appendiculatus in Zimbabwe, Kenya and Tanzania, with NDVI ranked second (Table 1 , Rogers & Randolph, 1993). Rainfall, however, was not available in the climatic data set used for the discriminant analysis, but, according to the data sets used in the present study, it is strongly negatively correlated with maximum temperature on a seasonal basis.
Acknowledgments
It is a pleasure to thank Dr D. J . Rogers for his critical
encouragement. The satellite images were provided by Dr J. Hielkema, Director of the ARTEMIS service in FAO, Rome, and processed by Drs Tim Robinson and David Rogers. I am most grateful to the Royal Society for financial support.
References
Belozerov. V.N. (1982) Diapause and biological rhythms in ticks. P1iysiology of Ticks (ed. by F. D. Obenchain and R. Galun), chap. 13, pp. 469-500. Pergamon Press. Oxford.
Berkvens, D.L. (1990) A study on thc ecology of thc Rhipicephalus appendiculatus complex with special reference to the castern province of Zambia. Ph.D. thcsis, Brunel University. U.K.
Branagan, D. (1973a) The developmental periods of thc lxodid tick Rhipicephalus appendiculatus Neum. under laboratory conditions. Bulletin of Entomological Research. 63. 155- 168.
Branagan, D. (1973b) Observations on the development and sur- vival of the ixodid tick Rhipicephalus appendiculatus Neumann, 1901 under quasi-natural conditions in Kenya. Tropical Animal Health and Production. 5 , 153-165.
Chiera, J.W., Newson, R.M. & Cunningham. M.P. (1’385) Cumulative effects of host resistance on Rhipicephalus appen- diculatus (Acarina: Ixodidae) in the laboratory. Parasitology,
Dc Vos, A.J. (1981) Rhipicephalus appendiculatus. Cause and vector of diseases in Africa. Journal of the South African Veterinary Association, 52, 315-322.
Dicker, R.W. & Sutherst, R.W. (1981) Control of the bush tick (Haemaphysalis longicornis) with Zebu X European cattle. Australian Veterinary Journal, 57, 66-68.
Fivaz, B.H. & Norval, R.A.I. (191) Immunity of the ox to thc brown ear tick Rhipicephalus appendiculatus. E.rperimental and Applied Acarology. 8, 51-63.
H.M.S.O. (1958) Tables of Temperature, Relative Humidity and Precipitation for the World. Part IV. Africa, the Atlantic Ocean south of 35”N and the Indian Ocean. H.M.S.O.. London.
Jongejan, F., Pegram, R.G., Zivkovic. D., Hensen, E.J.. Mwase. E.T., Thielcmans, M.J.C., Cosse, A,, Niewold. T.A.. El Said. A. & Uilenberg, G. (1989) Monitoring of naturally acquired and artificially induced immunity to Amblyomma variegation and Rhipicephalus appendiculatus ticks under field and labor- atory conditions. Experimental and Applied Acarologv. ?. 181 - 199.
Kaiser, M.N., Sutherst, R.W. & Bournc. A.S. (19x22) Relationship between ticks and zebu cattlc in southern Uganda. Tropical Animal Health and Production, 14, 63-74,
Kaiser, M.N., Sutherst. R.W. & Bourne. A.S. (1991) Tick (Acarina: ixodidac) infestations on zebu cattlc in northern Uganda. Bulletin of Entomological Research, 81, 257-262.
Kaiser, M.N., Suthcrst, R.W., Bournc. A.S.. Gorisscn. L. &L
Floyd, R.B. (1988) Population dynamics of ticks on Ankolc cattle in five ecological zones in Burundi and strategies for thcir control. Preventive Veterinarv Medicine. 6, 199-222.
McCulloch, B., Kalaye, W.J. , Tungaraza. R., Suda. B’0.J. & Mbasha, E.M.S. (1968) A study of the lifc history of the tick Rhipicephalus appendiculatus - the main vector of East Coast Fever - with reference to its behaviour under field conditions and with regard to itscontrol in Sukumaland. Tanzania. Bulletin of Epizootic Diseases of Africa. 16, 477-500.
Randolph, S.E. (1979) Population regulation in ticks: the rolc of acquired resistance in natural and unnatural hosts. Parasitology. 79, 141-156.
90, 401-408.

368 .Suruh E. Raridolph
Randolph, S.E. (lY93) Climatc. satellite imagery and thc seasonal abunda'ncc of the tick Rlripicephdus appendiculariic i n southcrn Africa: a new perspectivc. Medical arid L'erennury Enroi?iolog!.. 7. 243-258.
Randolph. S.E. (1994) Dcnsit!-dependcnt acquired resistance to ticks in natural hosts. independent of concurrent infection with Babetia microti. Purcisitolog,~. (in press).
Randolph, S.E. & Stccle, G.M. (1985) An cxpcrimental cvalu- ation of conventional control measures against the sheep tick /.codes ricinu5 (L.) (Acari: Ixodidae). 11. The dynamics of the tick-host interaction. Bufletrri of Entomological Reseurch. 75. so1 -5 18.
Rechav. Y. (1981) Ecological factors affecting the seasonal activity of the brown ear tick Rhipicephalus appendicrrlafus. Proceedings of the lnrernationul Conference on Tick Biology arid Conrrol. Graiiamsrown. pp. 187- 191.
Rechav. Y. (1987) Resistance of Brahman and Hereford cattle to African ticks with reference to serum gamma globulin levels and blood composition. Experimental and Applied Ararology. 3, 219-232.
Rechav. Y. (19Y2) Naturally acquired resistance to ticks - a global view. Insect Science and its Application. 13. 49s-504
Rogers, D.J. (1Y90) A general model for tsetse populations. Insecr Science and its Application. 11, 331-346.
Rogers. D.J. 8r Randolph. S.E. (1986) Distribution and abun- dance of tsetse flies (Glossinu spp.). Journal ofAni inal Ecology.
Rogers. D.J. & Randolph. S.E. (1991) Mortality rates and popu- lation density of tsetse flies correlated with satellite imagery. Nature, 351. 739-741.
Rogers. D.J. & Randolph. S.E. (1993) Distribution of tsetse and ticks in Africa: past, present and future. Parasirology Today. 9. 266-271.
Short. N.J.. Floyd, R.B.. Norval, R.A.I. & Sutherst. R.W. (1989) Development rates. fecundity and survival of developmental stages of the ticks Rhipicephufus appendiculatus, Boophilux
55, I(K)7- 1025.
decoloratus and B.rnicroplus under field conditions in Zimbabwc. E.vperil?1enru/ unrl Applied Acarology, 6, 123- 141.
Short. N.J. & Norval, R.A.L. (1981) The seasonal activity of Rhipicepphu1ir.s iippendiculutus Neumann I 0 1 (Acarina: lxodidae) in the highveld o f Zimbabwe Rhodesia. Journal of Parusirologv. 67. 77-84,
Sutherst. R.W. (1981) Is thc Australian pest management approach to tick control relevant to Africa'? Proceedings oftlie International Conference on Tick Biology and Control. Rhodes Utiiversitv. Grakamstonvi. South Africa. pp. 79-85.
Sutherst. R.W. (lY87) Ticks and Tick-Borne Diseases. Proceedings of an lnrernationul Workshop on the Eco1og.y of T k k s and Epide- rniolog? of' Tick-Borne Diseases, Nvungu. Zimbabwc, 17-21 Fehruury. I986 (ed. by R. W. Sutherst). ACIAR Procccdings No. 17. Australian Centre for International Agricultural Research. Canberra.
Sutherst. R.W., Utcch. K.B.W.. Kcrr. J.D. & Wharton, R.H. ( 1979) Density-dependcnt mortality of the tick. Boophilus microphrs. on cattle - further observations. Journal of Applied
Tukahinva. E.M. (1976) Thc effects of temperature and rclativc humidity on the development of Rhipirephaius uppendicufutus Neumann (Acarina. Ixodidae). Bulletin of Entomologicul Research. 66. 301-312.
Utech. K.B.W., Seifert. G.W. & Wharton, R.H. (1978) Breeding Australian IHawarra shorthorn cattle for resistance to Boophilus rnicroplus. 1. Factors affecting resistance. Aurtrulian Journul of Agricultural Research. 29, 41 1-422.
Varley. G.C.. Gradwell. G.R. & Hassell, M.P. (1973) Insecr Populurion Ecology: un anulwiral upproach. Blackwell Scientific Publications, Oxford.
Walker. A.R.. Fletcher. J.D. & Todd. L. (IYYO) Resistance bctwcc~: stages of the tick Rhipiceplialus appendiculatus (Acari: Ixodidae). Journal of Medic01 Entornoloxy. 27. 955-961.
Ecology. 16. 397-403.
Accepted 2 January 1994