degree of electric current neutralization and the activity in
TRANSCRIPT
MNRAS 486, 4936–4946 (2019) doi:10.1093/mnras/stz1020Advance Access publication 2019 April 23
Degree of electric current neutralization and the activity in solar activeregions
P. Vemareddy ‹
Sun and Solar System Division, Indian Institute of Astrophysics, Sarjapur road, II Block, Koramangala, Bengaluru-560 034, India
Accepted 2019 April 5. Received 2019 April 4; in original form 2019 February 10
ABSTRACTUsing time-sequence vector magnetic field observation from Helioseismic and MagneticImager, we examined the connection of non-neutralized currents and the observed activityin 20 solar active regions (ARs). The net current in a given magnetic polarity is algebraicsum of direct current (DC) and return current (RC) and the ratio |DC/RC| is a measure ofdegree of net current neutralization (NCN). In the emerging ARs, the non-neutrality of thesecurrents builds with the onset of flux emergence, following the relaxation to neutrality duringthe separation motion of bipolar regions. Accordingly, some emerging ARs are source regionsof CMEs occurring at the time of higher level non-neutrality. ARs in the post-emergencephase can be CME productive provided they have interacting bipolar regions with convergingand shearing motions. In these cases, the net current evolves with higher level (>1.3) ofnon-neutrality. Differently, the |DC/RC| in flaring and quiet ARs vary near unity. In all the ARsamples, the |DC/RC| is higher for chiral current density than that for vertical current density.Owing to the fact that the non-neutralized currents arise in the vicinity of sheared polarity-inversion-lines (SPILs), the profiles of the total length of SPIL segments and the degree ofNCN follow each other with a positive correlation. We find that the SPIL is localized assmall segments in flaring-ARs, whereas it is long continuous in CME-producing ARs. Theseobservations demonstrate the dividing line between the CMEs and flares with the differencebeing in global or local nature of magnetic shear in the AR that reflected in non-neutralizedcurrents.
Key words: Sun: magnetic fields – Sun: evolution – Sun: photosphere – Sun: coronal massejections (CMEs) – Sun: flares – Sun: fundamental parameters.
1 IN T RO D U C T I O N
It is widely accepted that solar eruptions including flares and CMEsare magnetically driven events and had been the subject of study forthe past four decades. Mainly, these transient, eruptive events derivetheir energy from electrical currents that pass through the solaratmosphere. There are evidential reports that the strong electricalcurrents involved in major flares are embedded within magnetic fluxemerged from convection zone through photosphere into the corona(e.g. Leka et al. 1996; Vemareddy, Ambastha & Maurya 2012).Other sources that generate these currents are plasma displacementson the surface of the sun (Leka & Barnes 2003a,b; Schrijveret al. 2005; Vemareddy et al. 2012; Vemareddy, Venkatakrishnan &Karthikreddy 2015). Dissipation of these electrical currents duringreconnection is the supposed mechanism of releasing magnetic
� E-mail: [email protected]
energy to thermal and kinetic energy during the transient activity ofthe Sun (Priest & Forbes 2002).
However, as theorized by Parker (1996), the net electric currentat any cross-section of a flux tube embedded in relatively field-freeplasma must result in a zero value. In this scenario, the net currentof a flux tube is a sum of direct current (DC) due to its twist/shearand the return current (RC) in an interface layer between the fluxtube and the surrounding plasma. These two (body and surface)currents are opposite in sign but equal in magnitude. As the fluxtubes emanate from the photosphere, which are confined by thedense plasma, the integrated net vertical current from the flux tubecross-section is expected to obey the above Parker’s paradigm ofneutralized current. However, the observations of net current overa polarity are quiet deviating from neutrality (Venkatakrishnan &Tiwari 2009; Ravindra et al. 2011; Georgoulis, Titov & Mikic 2012;Vemareddy et al. 2015) indicating controversial nature of theory andobservations.
In the presence of plasma flows, the field lines connecting thewell-isolated polarities are stressed; nevertheless, the generated
C© 2019 The Author(s)Published by Oxford University Press on behalf of the Royal Astronomical Society
Dow
nloaded from https://academ
ic.oup.com/m
nras/article/486/4/4936/5476507 by guest on 12 May 2022
Electrict current neutrality & the activity 4937
currents at their foot points remain neutralized, according to integralform of Ampere’s law. Even emergence of current carrying fluxtubes in the case of well-separated, carry vanishing currents. Indeed,using high-resolution observations of photospheric magnetic fields,it is found that the net current from many isolated sunspots is nearto neutrality (Venkatakrishnan & Tiwari 2009). The question to beasked is what are the factors that contribute to the net current from asingle polarity. Georgoulis et al. (2012) had investigated these issuesextensively in two ARs, where they concluded that intense polarityinversion lines (PILs) amid the compact polarity regions in the coreof the ARs support significantly for the non-neutralized currents.This result is further supplemented by a recent study of Vemareddyet al. (2015), where the length of strong magnetically sheared PIL(SPIL) was found to be proportional to the observed net current. Inthis context, a very early study by Falconer (2001) was the basis forthis well-proved relation according to which the presence of strongSPIL is an indicator for the occurrence of eruptions and its lengthis a measure of net vertical current.
The plasma β in the coronal environment is far less than unityyielding to gradually dominating field-aligned currents over theRCs along the flux tube. As a result, there is a net current overthe cross-section of the flux tube in the corona. Due to thisstratification in plasma-β, it is not well understood, how the netcurrent varies while emerging, especially at and after the instance ofemergence. Employing numerical simulations of emerging bipolaractive regions (AR), this issue was investigated by Torok et al.(2014). Neutralization was observed to increasingly break downduring emergence and retained at a slightly lower value afteremergence stopped. However, it has not yet been well investigatedwhether this is a characteristic evolution in all emerging ARs. Onthe other hand, what is the scenario in the post-emerged ARs wherea different boundary motions drive the evolution? In order to havemore insights, the net current evolution and its characteristic timeprofile of neutralization needs to be systematically examined fromobservations of different ARs, which is the motivation of this study.
Recently, systematic observational study of Liu et al. (2017)confirmed that the SPIL is the major contributor to DC and proposedthe degree of current-neutralization as the proxy for assessingthe ability of ARs to produce CMEs. In this view, it would beimportant to study the connection between the degree of net currentneutralization (NCN) with the nature of generated activity, viz.,CMEs or flares, in a large sample of ARs.
Further, recent study by Vemareddy (2017b) shows that thegradient of magnetic field strength contributes to opposite signed,although smaller in magnitude, current to that contributed bymagnetic field direction in the vertical component of current. Asa result, the NCN is enhanced in a polarity and could substantiatethe origins of sheath current in field strength gradients as firstindicated in Zhang (2010). This observational evidence also requiressolid basis in more AR cases. The now available uninterruptedvector magnetic field observations from Helioseismic and MagneticImager (HMI) are very identical for the objectives of this study, tosupplement possible scenarios of electric current evolution. Therest of the paper is organized as follows. The observational data andanalysis procedure are detailed in Section 2; the obtained results aredescribed in Section 3. A discussion is presented in Section 4, witha summary in Section 5.
2 O BSERVATIONA L DATA AND ANALYSISP RO C E D U R E
In this study of AR evolution, we used unprecedented, uninterruptedphotospheric vector magnetic field observations obtained by the
HMI (Schou et al. 2012) aboard Solar Dynamics Observatory.HMI observes the full solar disc in the Fe I 6173 Å spectral linewith a spatial resolution of 0.′′5 pixel−1. Filtergrams are obtainedat six wavelength positions about the line centre to computeStokes parameters I, Q, U, and V. These are then reduced withHMI science data processing pipeline (Hoeksema et al. 2014) toretrieve the vector magnetic field using Very Fast Inversion ofthe Stokes Vector algorithm (Borrero et al 2011) based on theMilne–Eddington atmospheric model. The inherent 180◦ azimuthalambiguity is resolved using the minimum energy method (Metcalf1994; Leka et al. 2009). Finally, the projection effects in the fieldcomponents in native AR patch are corrected by transformingthem to disc centre using cylindrical equal area (CEA) projectionmethod (Calabretta & Greisen 2002). These field components(Br, Bθ , Bφ) in heliocentric spherical coordinates are provided ashmi.sharp.cea 720s data product, which are approximatedto (Bz, −By, Bx) in Heliographic Cartesian coordinates for readyuse in various parameter studies (Gary & Hagyard 1990). Becausethe projection effects of the ARs situated beyond ±40◦ longitudeseverely underestimate the field values and could not be recoveredby disc transformation; we consider the AR’s disc passage withinthis limit for their evolution study of net vertical current.
Then, we derive the vertical component of electric current densityand its decomposed components to twist/chiral and shear terms(Zhang 2001):
Jz = 1
μ0
(∂By
∂x− ∂Bx
∂y
)
= B
μ0
(∂by
∂x− ∂bx
∂y
)+ 1
μ0
(by
∂B
∂x− bx
∂B
∂y
)
= Jzch + Jzsh, (1)
where bx, by, bz are components of the unit magnetic field vectorb = B/B with total field strength B = |B|. The partial derivativesare approximated by finite difference scheme employing three-point Lagrangian interpolation procedure (See Vemareddy 2017bfor more details). As the names suggest, the decomposition of thecurrent density (J) is not for twisted and sheared magnetic field. Jch
is connected to helicity term or force-free field but Jsh is not becausepart of the current is perpendicular to the magnetic field (cross-field current). Jzsh actually, provides a quantitative description ofthe relationship between the magnetic shear and gradient of themagnetic field and can be written in a form 1
μ0cos(θ )(∇B)⊥, where
θ is the shear angle of the photospheric transverse magnetic field,and (∇B)⊥ is the horizontal gradient of magnetic field (Zhang2001). This term connects with the heterogeneity and orientation ofmagnetic field. Here, field strength gradients play main role becausecosine of θ ranges between −1 and 1.
The net vertical flux and current are then deduced by summingthe pixels over a particular polarity as given by� = ∑
N pixBz and
I = ∑N pix
Jz, respectively. The net current in a given polarity flux (IS
in south (Bz < 0), IN in north (Bz > 0), similarly the decomposedcurrents Ich, Ish) has contribution from both positive and negativecurrents.
In order to have insight on the contribution of each signedcurrent in the neutralization of the current in each polarity, wefurther separate the net current in each polarity into positive (+)and negative (−) components. The individual net currents in eachpolarity always have a systematic evolution and thus provideinsights on their plausible generation mechanisms. We then evaluatethe absolute ratio of these individual currents, as dominant andnon-dominant net current in each polarity for the evaluation of the
MNRAS 486, 4936–4946 (2019)
Dow
nloaded from https://academ
ic.oup.com/m
nras/article/486/4/4936/5476507 by guest on 12 May 2022
4938 P. Vemareddy
absolute ratio of direct current (DC) and RC (Torok et al. 2014).Here, the dominant or non-dominant is with respect to the net currentvalue of positive (or negative) current over its countersigned netvalue in a given magnetic polarity. The sign of the dominant currentin a given magnetic polarity gives the chirality of the AR. With thisratio, it is easy to monitor their relative time evolution in concurrentwith the flux evolution. The ratio will always have a value greaterthan 1 in magnitude and a value of 1 indicates neutralized currentsin a polarity. Deviation from unity level signifies non-neutralizationand is a special case of non-potentiality.
From equation (1) of vertical current decomposition, fieldstrength gradients are known to contribute opposite signed currentsto that contributed by field direction in each polarity regions. Thecombined result is more NCN (Vemareddy 2017b). To know theextent of this contribution, we estimate |DC/RC| for Ich, in a similarway, by removing current contributed from field strength gradients(Ish).
For observationally reliable values, we consider pixels havingthreshold values |Btot| > 200 G in all above computations. Thesestrong fields also exist with uncertainties due to the field measure-ments and inversion procedure. The inversion products are givenwith estimated errors in the vertical component varying by about40 G and in horizontal components by 80 G. As a test case, wepropagate these uncertainties through equation (1; see details inVemareddy et al. 2015) by the equation
(δJz)i,j = 1
μ0
⎛⎜⎝
√(δBx )2
j−1 + (δBx )2j+1 + (
δBy
)2i−1 + (
δBy
)2i+1
2x
⎞⎟⎠ , (2)
where i, j refer to pixel indices in x- and y-direction, respectively.An equal spacing grid size in both x- and y-directions is assumedin arriving at the above expression. Taking an average error δBx =δBy = 40G in a typical distribution of n = 104 pixel, we found thatthe range of uncertainty (
√n × δJzdzxdx) of a signed net current
in a given polarity can never be larger than 0.1 × 10¹²A. Here, dxis HMI pixel size of 0.′′5 . Therefore, our estimation of |DC/RC|can have a maximum error limit of 0.14. As we will see in thelater section, this uncertainty is very small compared to the rangeof |DC/RC| evolution in CME and flare-producing ARs.
We also traced the SPILs in every 1-h snapshot by an automatedprocedure similar to the one applied for tracing PILs of strongvertical field gradients (Mason & Hoeksema 2010) and appliedin a statistical study (Vasantharaju et al. 2018). The SPIL is asegment with shear angle (difference between directions of observedtransverse fields Bo and potential transverse fields Bp and isgiven by, θsh = cos−1(Bo · Bp/|Bo||Bp|)) greater than 45◦. In thisprocedure, we smooth the vertical magnetic field (Bz) image to asmoothing factor of 8 pixels (4 arcsec) and identified the zero Gausscontour. Then, the potential magnetic field is calculated from thestrongly smoothed magnetogram and the shear map is generatedfrom the computed potential and the observed transverse field.On applying the thresholds of the strong observed transverse field(>300 G) and strong shear angle (>45◦) to contour segments, thestrong field and strong shear PILs are identified. The summation ofthese PIL segment lengths gives the total length of SPIL present inthe AR.
3 R ESULTS
The distribution of vertical current and its components are examinedin all the studied ARs. In all the cases, we notice that the Jz and Jzch
have similar distribution in terms of sign and morphology. However,
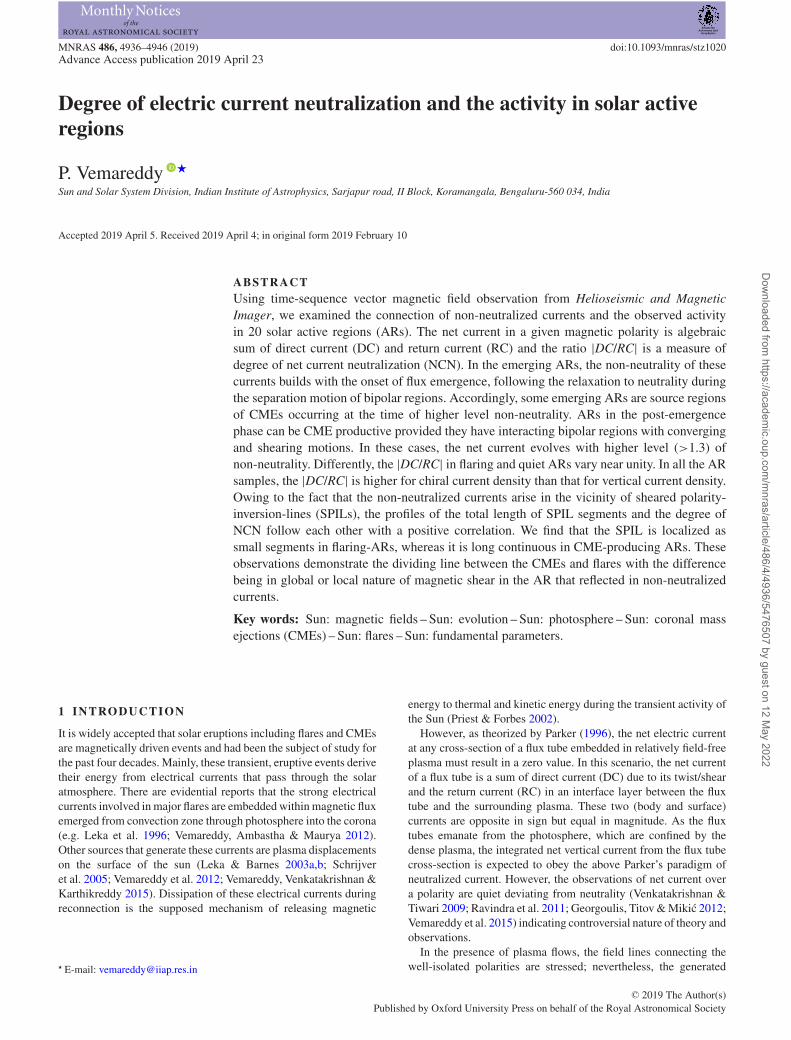
Jzch and Jzsh vary both in sign and magnitude. As exemplary cases,these distributions are shown in three ARs in Fig. 1. Signed mapsin the last column panels show distribution of currents that arehaving opposite (same) sign of Jzch and Jzsh and are indicated by−1 (1) value. These pixels of opposite sign current distributionare varying between 60 and 65 per cent in the studied AR cases.This kind of distribution indicates that the gradients of fieldstrength contribute to opposite signed current to that contributedby magnetic field direction in the vertical component of current,which was first found by Vemareddy (2017b). Further, the Jzsh
seems to show much higher spatial frequencies than Jzch. This maybe considered to be consistent with small-scale structures presentin sunspot penumbrae. The investigations by Zhang (2010) alsosupport our observations. They found that the individual fibrils aredominated by the current density component caused by magneticinhomogeneity, while the large-scale magnetic region is generallydominated by the twist component of the electric current density.Vemareddy (2017b) examined this concept of spacial frequenciesby smoothing the magnetograms with different spacial windows.Because of large-scale structure, the Jzch retains the spatial patternseven after smoothing, while Jzsh smears the patterns due to higherspatial frequencies related to small-scale structure.
Then, we observed the time evolution of net chiral (or twist)current (Ich) in a polarity that follows the trend of net current (I) ata higher magnitude level. Depending on the sign of Ish, the DC orRC of Jz will be differently deviated from the DC or RC of Jzch.We evidenced the sign of Ish is mostly (2/3) negative to that of Ich
in a given polarity, consequently decreasing the DC value (than thatof RC) of Jz resulting in higher degree of NCN than the net twistcurrent neutralization. In order to make this clear, we show thisdifference of neutralization for both Ich and I in each polarity ofan AR.
In the following, we study the evolution of |DC/RC| in 20different ARs of different coronal activity. Most of these regionsare well studied previously in different contexts. For clarity, weanalysed all of them, and then divided into groups of their evolutionphase and the nature of activity. The emerging ARs consist ofemerging bipolar regions with sub-photospheric twist and complexinteraction, whereas in the post-emerged cases, the AR emergencephase is missed and the evolution consists of flux fragmentation,diffusion, shear motions, and/or flux emergence in the pre-existingflux. As we already know that the ARs in decaying phase aresometimes very active (e.g. AR12371) and we search such casesto include here. On the other hand, there are ARs producing flaringactivity associated with/without coronal mass ejections (CMEs),the so-called confined/eruptive ARs. This classification hasimplications to the space–weather exploring the conditions of an ARto be CME productive. In principle, the sample can be more than 20,but restricted to put up results more clearly. Flares are classified bydisc-integrated GOES X-ray flux.1 CME is a large-scale expulsionof magnetic field and plasma from the AR disturbing the outercorona at least to the LASCO-C2 field-of-view extent. To associatethe CMEs with the studied source ARs, simultaneous coronalobservations are scrutinized in association with the LASCO-C2images2 (Yashiro et al. 2004). From this qualitative information,we noted the type of coronal activity in relevance to the net currentevolution in the AR. A summary of the AR cases in this study isgiven in Table 1. As providing the details of the individual events
1Provided at https://www.solarmonitor.org.2Obtained from http://cdaw.gsfc.nasa.gov/CME list/UNIVERSAL/.
MNRAS 486, 4936–4946 (2019)
Dow
nloaded from https://academ
ic.oup.com/m
nras/article/486/4/4936/5476507 by guest on 12 May 2022
Electrict current neutrality & the activity 4939
Figure 1. First column: distribution of Jzch, with the blue/red contours of Bz at ±150 G. Second column: distribution of Jzsh, all maps are scaled within±50 m Am−2. Third column: relative sign of Jzch and Jzsh. The black (white) pixels refer to those having opposite (same) sign of Jzch and Jzsh, which are60–65 per cent (35–40 per cent) in all over the AR.
in all 20 ARs is spatially prohibited, besides referring to the earlierstudies, we noted the timings of prominent CME/flare events inthe text.
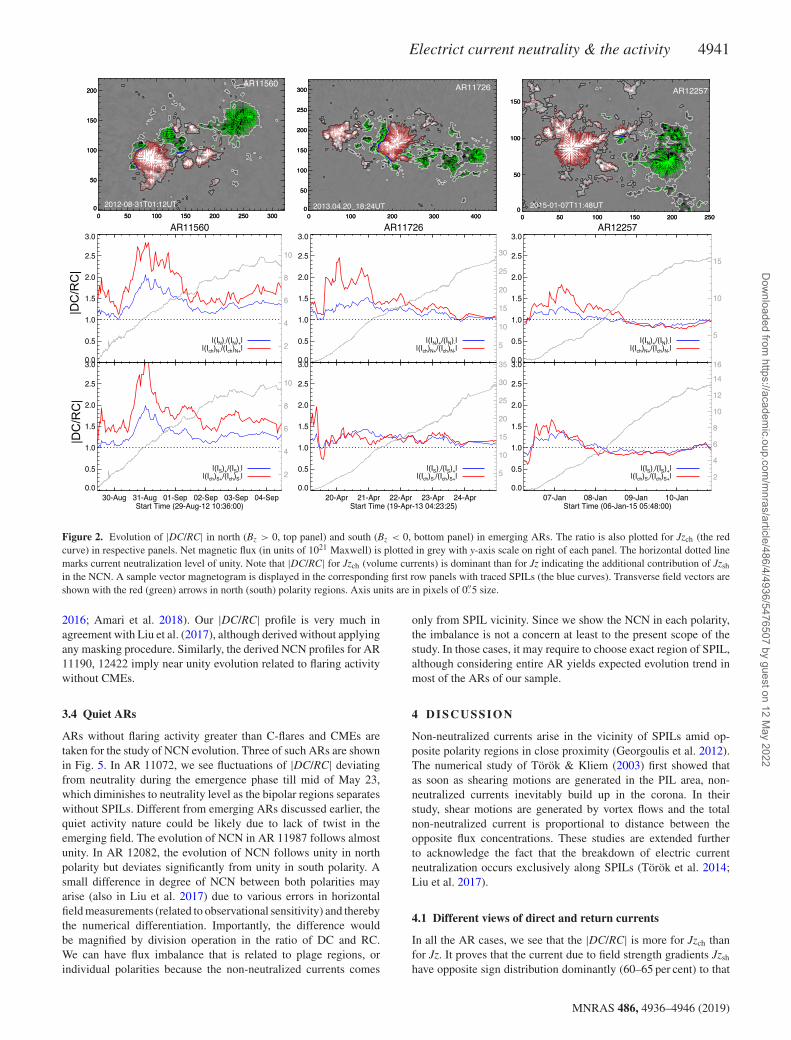
3.1 Emerging ARs
We choose set of five emerging ARs with CME and flaring activityand studied the NCN with time. In Fig. 2, time evolution of NCNis plotted only for three AR cases. The |DC/RC| is shown bothfor positive and negative magnetic polarity in separate panels.The horizontal dotted line indicates the NCN of unity referringto equal values of DC and RC in a magnetic polarity. The netflux of each polarity is also plotted in the same panels with y-axis scale (in units of 1021 Maxwell) on the right-hand side. Asample vector magnetogram is depicted in the corresponding firstrow panels with traced SPILs (the blue curve). In all five AR cases,the |DC/RC| starts near a value of 1 and increases rapidly with thefast flux emergence during about first 20 h. We noticed that thisfast emergence is given by appearance of compact bipolar regionshaving SPILs at the interface of opposite polarities. This phase isthen followed by separating motion of bipolar regions becoming
isolated bipolar regions. As a result, ARs become less compactwithout SPILs as the interface of opposite polarities diminishes.We see that the |DC/RC| decreases from the peak value (1.5–2)of highest compact phase to the unity of well-separated polarityregions. As we can notice that all the ARs have higher value of|DC/RC| for Jzch than for Jz.
All five AR cases (serial no. 1–5 in Table 1) follow the profile ofthe NCN exhibited by simulated emerging bipolar AR reported byTorok et al. (2014). The simulation results (their fig. 4) showed thedevelopment of strong deviation from NCN simultaneously with theonset of significant flux emergence into the corona, accompaniedby the development of substantial magnetic shear along the ARPIL. After the region has formed and flux emergence has ceased,the strong magnetic fields in the regions centre are connected solelyby DCs and the total DC is several times larger than the totalRC.
The AR 11560, 11726 are source regions of C-M flares and CMEsduring the present observation window. A prominent CME occurredin AR 11560 at 1:00 UT on 2012 September 2, which is after the peakphase of |DC/RC| value. In the AR 11726, the coronal eruptions areseen at 20/07:40 UT, 22/06:00 UT. Owing to the opposite chirality,
MNRAS 486, 4936–4946 (2019)
Dow
nloaded from https://academ
ic.oup.com/m
nras/article/486/4/4936/5476507 by guest on 12 May 2022
4940 P. Vemareddy
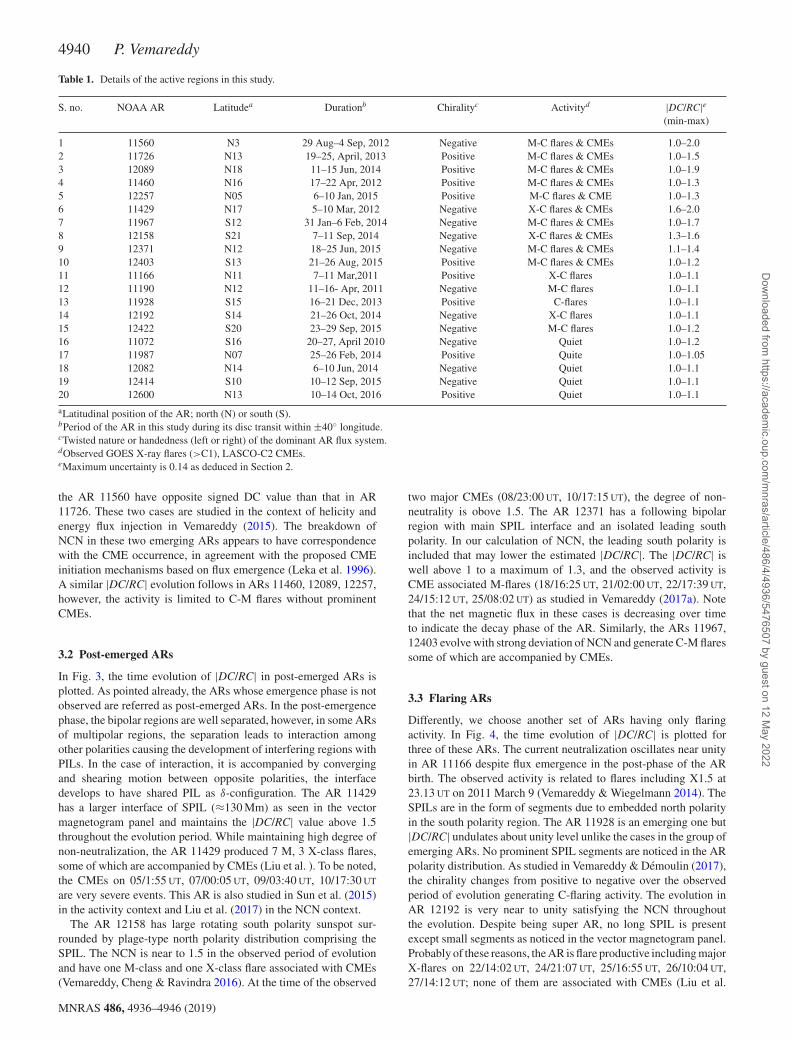
Table 1. Details of the active regions in this study.
S. no. NOAA AR Latitudea Durationb Chiralityc Activityd |DC/RC|e(min-max)
1 11560 N3 29 Aug–4 Sep, 2012 Negative M-C flares & CMEs 1.0–2.02 11726 N13 19–25, April, 2013 Positive M-C flares & CMEs 1.0–1.53 12089 N18 11–15 Jun, 2014 Positive M-C flares & CMEs 1.0–1.94 11460 N16 17–22 Apr, 2012 Positive M-C flares & CMEs 1.0–1.35 12257 N05 6–10 Jan, 2015 Positive M-C flares & CME 1.0–1.36 11429 N17 5–10 Mar, 2012 Negative X-C flares & CMEs 1.6–2.07 11967 S12 31 Jan–6 Feb, 2014 Negative M-C flares & CMEs 1.0–1.78 12158 S21 7–11 Sep, 2014 Negative X-C flares & CMEs 1.3–1.69 12371 N12 18–25 Jun, 2015 Negative M-C flares & CMEs 1.1–1.410 12403 S13 21–26 Aug, 2015 Positive M-C flares & CMEs 1.0–1.211 11166 N11 7–11 Mar,2011 Positive X-C flares 1.0–1.112 11190 N12 11–16- Apr, 2011 Negative M-C flares 1.0–1.113 11928 S15 16–21 Dec, 2013 Positive C-flares 1.0–1.114 12192 S14 21–26 Oct, 2014 Negative X-C flares 1.0–1.115 12422 S20 23–29 Sep, 2015 Negative M-C flares 1.0–1.216 11072 S16 20–27, April 2010 Negative Quiet 1.0–1.217 11987 N07 25–26 Feb, 2014 Positive Quite 1.0–1.0518 12082 N14 6–10 Jun, 2014 Negative Quiet 1.0–1.119 12414 S10 10–12 Sep, 2015 Negative Quiet 1.0–1.120 12600 N13 10–14 Oct, 2016 Positive Quiet 1.0–1.1
aLatitudinal position of the AR; north (N) or south (S).bPeriod of the AR in this study during its disc transit within ±40◦ longitude.cTwisted nature or handedness (left or right) of the dominant AR flux system.dObserved GOES X-ray flares (>C1), LASCO-C2 CMEs.eMaximum uncertainty is 0.14 as deduced in Section 2.
the AR 11560 have opposite signed DC value than that in AR11726. These two cases are studied in the context of helicity andenergy flux injection in Vemareddy (2015). The breakdown ofNCN in these two emerging ARs appears to have correspondencewith the CME occurrence, in agreement with the proposed CMEinitiation mechanisms based on flux emergence (Leka et al. 1996).A similar |DC/RC| evolution follows in ARs 11460, 12089, 12257,however, the activity is limited to C-M flares without prominentCMEs.
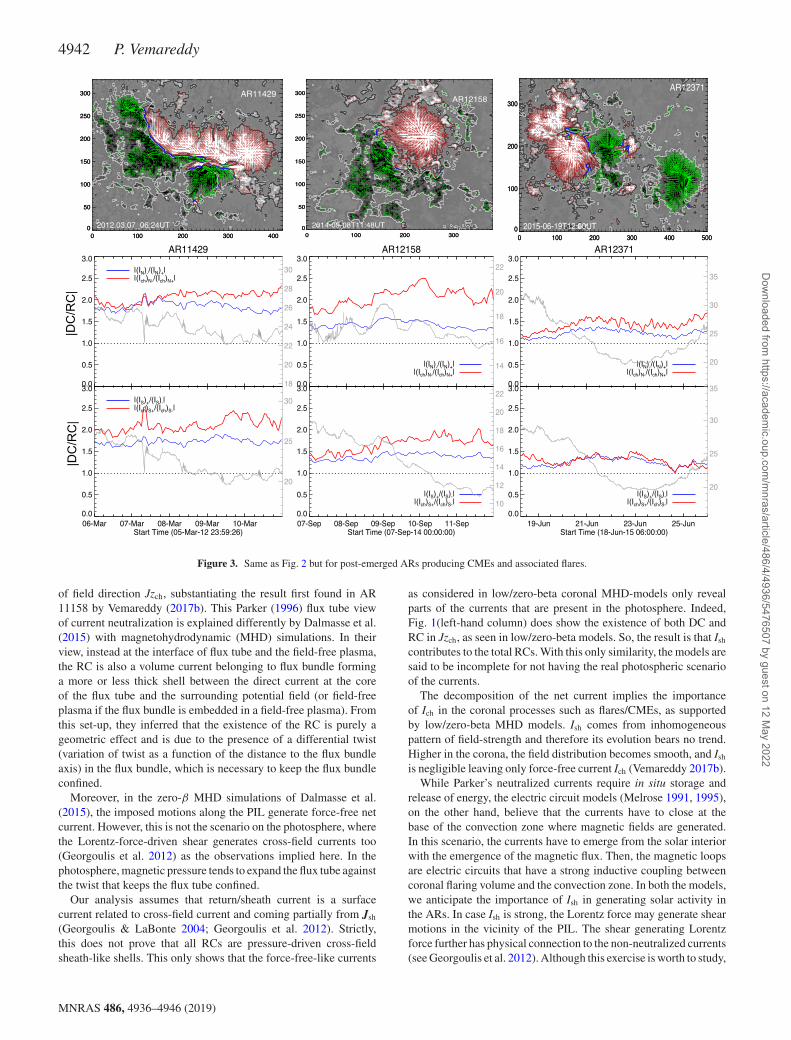
3.2 Post-emerged ARs
In Fig. 3, the time evolution of |DC/RC| in post-emerged ARs isplotted. As pointed already, the ARs whose emergence phase is notobserved are referred as post-emerged ARs. In the post-emergencephase, the bipolar regions are well separated, however, in some ARsof multipolar regions, the separation leads to interaction amongother polarities causing the development of interfering regions withPILs. In the case of interaction, it is accompanied by convergingand shearing motion between opposite polarities, the interfacedevelops to have shared PIL as δ-configuration. The AR 11429has a larger interface of SPIL (≈130 Mm) as seen in the vectormagnetogram panel and maintains the |DC/RC| value above 1.5throughout the evolution period. While maintaining high degree ofnon-neutralization, the AR 11429 produced 7 M, 3 X-class flares,some of which are accompanied by CMEs (Liu et al. ). To be noted,the CMEs on 05/1:55 UT, 07/00:05 UT, 09/03:40 UT, 10/17:30 UT
are very severe events. This AR is also studied in Sun et al. (2015)in the activity context and Liu et al. (2017) in the NCN context.
The AR 12158 has large rotating south polarity sunspot sur-rounded by plage-type north polarity distribution comprising theSPIL. The NCN is near to 1.5 in the observed period of evolutionand have one M-class and one X-class flare associated with CMEs(Vemareddy, Cheng & Ravindra 2016). At the time of the observed
two major CMEs (08/23:00 UT, 10/17:15 UT), the degree of non-neutrality is obove 1.5. The AR 12371 has a following bipolarregion with main SPIL interface and an isolated leading southpolarity. In our calculation of NCN, the leading south polarity isincluded that may lower the estimated |DC/RC|. The |DC/RC| iswell above 1 to a maximum of 1.3, and the observed activity isCME associated M-flares (18/16:25 UT, 21/02:00 UT, 22/17:39 UT,24/15:12 UT, 25/08:02 UT) as studied in Vemareddy (2017a). Notethat the net magnetic flux in these cases is decreasing over timeto indicate the decay phase of the AR. Similarly, the ARs 11967,12403 evolve with strong deviation of NCN and generate C-M flaressome of which are accompanied by CMEs.
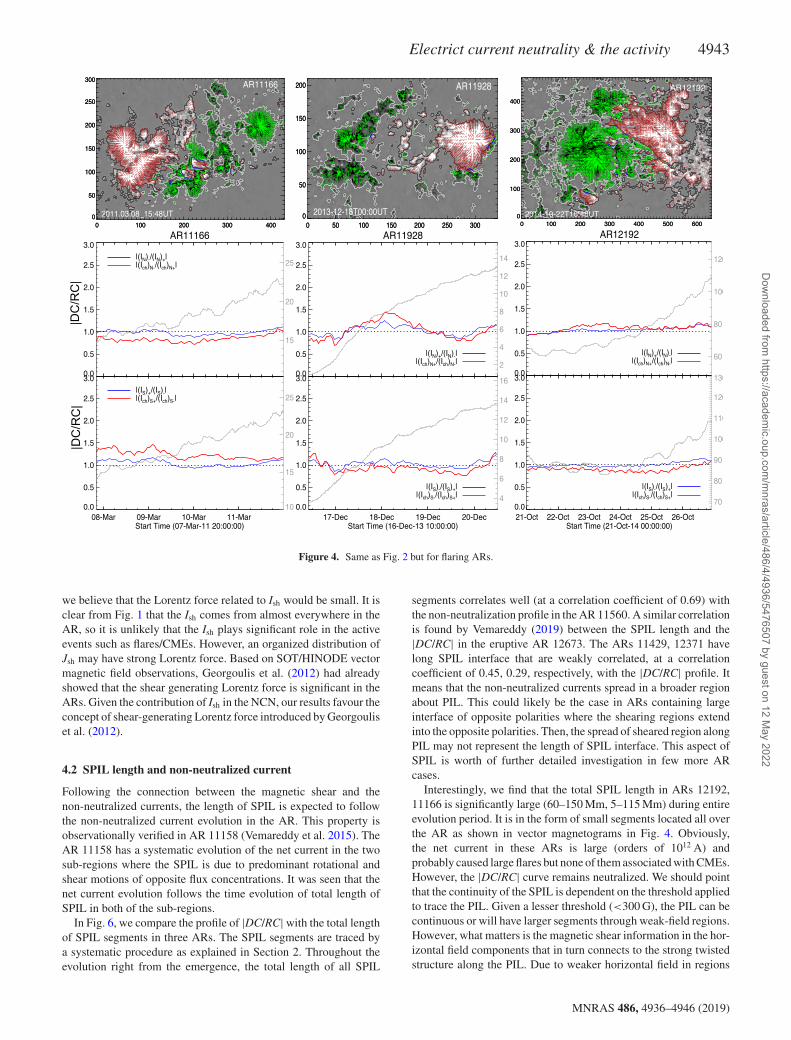
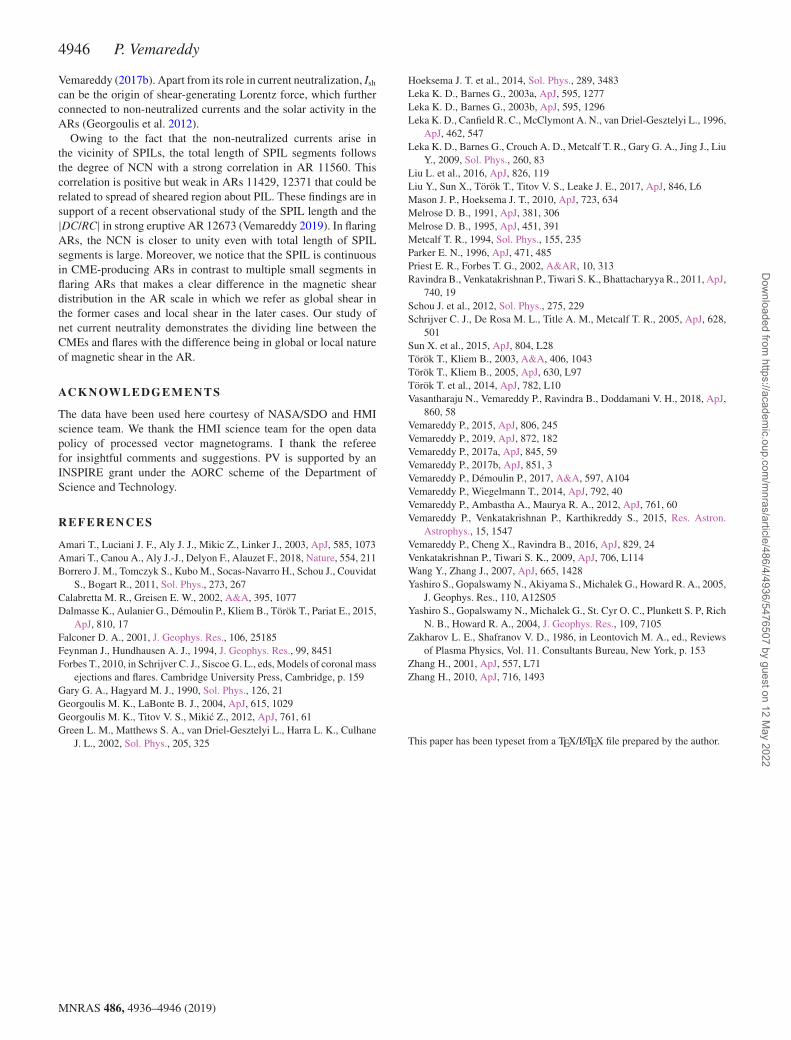
3.3 Flaring ARs
Differently, we choose another set of ARs having only flaringactivity. In Fig. 4, the time evolution of |DC/RC| is plotted forthree of these ARs. The current neutralization oscillates near unityin AR 11166 despite flux emergence in the post-phase of the ARbirth. The observed activity is related to flares including X1.5 at23.13 UT on 2011 March 9 (Vemareddy & Wiegelmann 2014). TheSPILs are in the form of segments due to embedded north polarityin the south polarity region. The AR 11928 is an emerging one but|DC/RC| undulates about unity level unlike the cases in the group ofemerging ARs. No prominent SPIL segments are noticed in the ARpolarity distribution. As studied in Vemareddy & Demoulin (2017),the chirality changes from positive to negative over the observedperiod of evolution generating C-flaring activity. The evolution inAR 12192 is very near to unity satisfying the NCN throughoutthe evolution. Despite being super AR, no long SPIL is presentexcept small segments as noticed in the vector magnetogram panel.Probably of these reasons, the AR is flare productive including majorX-flares on 22/14:02 UT, 24/21:07 UT, 25/16:55 UT, 26/10:04 UT,27/14:12 UT; none of them are associated with CMEs (Liu et al.
MNRAS 486, 4936–4946 (2019)
Dow
nloaded from https://academ
ic.oup.com/m
nras/article/486/4/4936/5476507 by guest on 12 May 2022
Electrict current neutrality & the activity 4941
Figure 2. Evolution of |DC/RC| in north (Bz > 0, top panel) and south (Bz < 0, bottom panel) in emerging ARs. The ratio is also plotted for Jzch (the redcurve) in respective panels. Net magnetic flux (in units of 1021 Maxwell) is plotted in grey with y-axis scale on right of each panel. The horizontal dotted linemarks current neutralization level of unity. Note that |DC/RC| for Jzch (volume currents) is dominant than for Jz indicating the additional contribution of Jzsh
in the NCN. A sample vector magnetogram is displayed in the corresponding first row panels with traced SPILs (the blue curves). Transverse field vectors areshown with the red (green) arrows in north (south) polarity regions. Axis units are in pixels of 0.′′5 size.
2016; Amari et al. 2018). Our |DC/RC| profile is very much inagreement with Liu et al. (2017), although derived without applyingany masking procedure. Similarly, the derived NCN profiles for AR11190, 12422 imply near unity evolution related to flaring activitywithout CMEs.
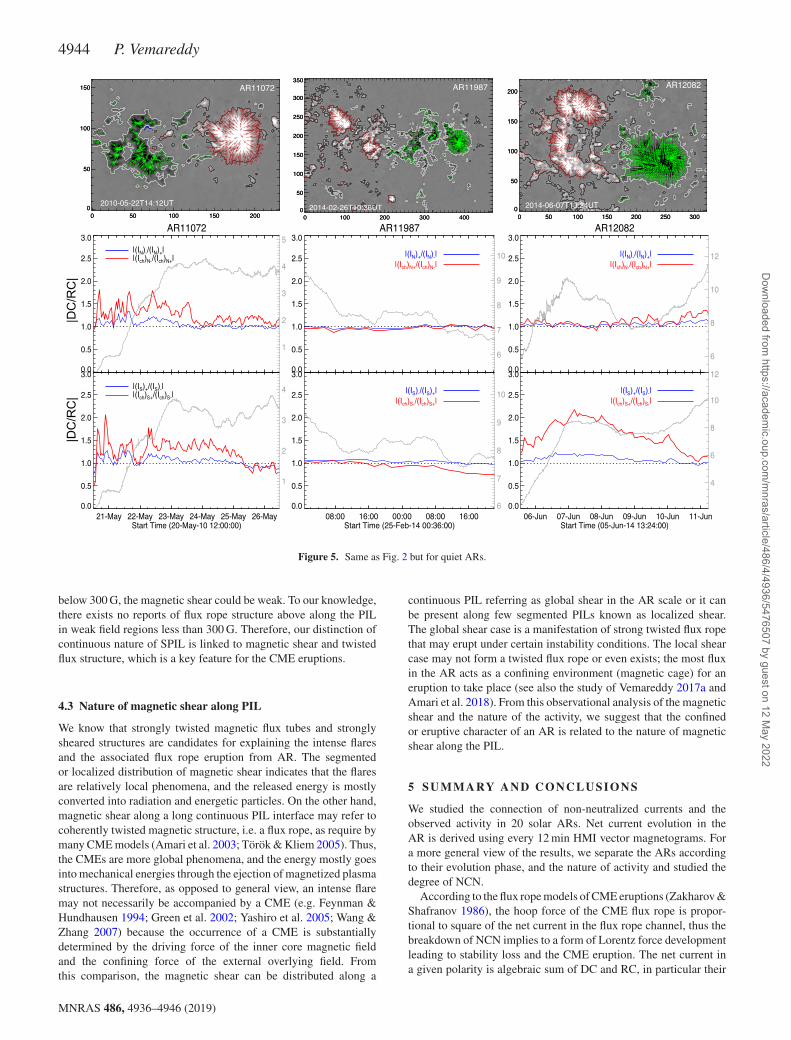
3.4 Quiet ARs
ARs without flaring activity greater than C-flares and CMEs aretaken for the study of NCN evolution. Three of such ARs are shownin Fig. 5. In AR 11072, we see fluctuations of |DC/RC| deviatingfrom neutrality during the emergence phase till mid of May 23,which diminishes to neutrality level as the bipolar regions separateswithout SPILs. Different from emerging ARs discussed earlier, thequiet activity nature could be likely due to lack of twist in theemerging field. The evolution of NCN in AR 11987 follows almostunity. In AR 12082, the evolution of NCN follows unity in northpolarity but deviates significantly from unity in south polarity. Asmall difference in degree of NCN between both polarities mayarise (also in Liu et al. 2017) due to various errors in horizontalfield measurements (related to observational sensitivity) and therebythe numerical differentiation. Importantly, the difference wouldbe magnified by division operation in the ratio of DC and RC.We can have flux imbalance that is related to plage regions, orindividual polarities because the non-neutralized currents comes
only from SPIL vicinity. Since we show the NCN in each polarity,the imbalance is not a concern at least to the present scope of thestudy. In those cases, it may require to choose exact region of SPIL,although considering entire AR yields expected evolution trend inmost of the ARs of our sample.
4 D ISCUSSION
Non-neutralized currents arise in the vicinity of SPILs amid op-posite polarity regions in close proximity (Georgoulis et al. 2012).The numerical study of Torok & Kliem (2003) first showed thatas soon as shearing motions are generated in the PIL area, non-neutralized currents inevitably build up in the corona. In theirstudy, shear motions are generated by vortex flows and the totalnon-neutralized current is proportional to distance between theopposite flux concentrations. These studies are extended furtherto acknowledge the fact that the breakdown of electric currentneutralization occurs exclusively along SPILs (Torok et al. 2014;Liu et al. 2017).
4.1 Different views of direct and return currents
In all the AR cases, we see that the |DC/RC| is more for Jzch thanfor Jz. It proves that the current due to field strength gradients Jzsh
have opposite sign distribution dominantly (60–65 per cent) to that
MNRAS 486, 4936–4946 (2019)
Dow
nloaded from https://academ
ic.oup.com/m
nras/article/486/4/4936/5476507 by guest on 12 May 2022
4942 P. Vemareddy
Figure 3. Same as Fig. 2 but for post-emerged ARs producing CMEs and associated flares.
of field direction Jzch, substantiating the result first found in AR11158 by Vemareddy (2017b). This Parker (1996) flux tube viewof current neutralization is explained differently by Dalmasse et al.(2015) with magnetohydrodynamic (MHD) simulations. In theirview, instead at the interface of flux tube and the field-free plasma,the RC is also a volume current belonging to flux bundle forminga more or less thick shell between the direct current at the coreof the flux tube and the surrounding potential field (or field-freeplasma if the flux bundle is embedded in a field-free plasma). Fromthis set-up, they inferred that the existence of the RC is purely ageometric effect and is due to the presence of a differential twist(variation of twist as a function of the distance to the flux bundleaxis) in the flux bundle, which is necessary to keep the flux bundleconfined.
Moreover, in the zero-β MHD simulations of Dalmasse et al.(2015), the imposed motions along the PIL generate force-free netcurrent. However, this is not the scenario on the photosphere, wherethe Lorentz-force-driven shear generates cross-field currents too(Georgoulis et al. 2012) as the observations implied here. In thephotosphere, magnetic pressure tends to expand the flux tube againstthe twist that keeps the flux tube confined.
Our analysis assumes that return/sheath current is a surfacecurrent related to cross-field current and coming partially from Jsh
(Georgoulis & LaBonte 2004; Georgoulis et al. 2012). Strictly,this does not prove that all RCs are pressure-driven cross-fieldsheath-like shells. This only shows that the force-free-like currents
as considered in low/zero-beta coronal MHD-models only revealparts of the currents that are present in the photosphere. Indeed,Fig. 1(left-hand column) does show the existence of both DC andRC in Jzch, as seen in low/zero-beta models. So, the result is that Ish
contributes to the total RCs. With this only similarity, the models aresaid to be incomplete for not having the real photospheric scenarioof the currents.
The decomposition of the net current implies the importanceof Ich in the coronal processes such as flares/CMEs, as supportedby low/zero-beta MHD models. Ish comes from inhomogeneouspattern of field-strength and therefore its evolution bears no trend.Higher in the corona, the field distribution becomes smooth, and Ish
is negligible leaving only force-free current Ich (Vemareddy 2017b).While Parker’s neutralized currents require in situ storage and
release of energy, the electric circuit models (Melrose 1991, 1995),on the other hand, believe that the currents have to close at thebase of the convection zone where magnetic fields are generated.In this scenario, the currents have to emerge from the solar interiorwith the emergence of the magnetic flux. Then, the magnetic loopsare electric circuits that have a strong inductive coupling betweencoronal flaring volume and the convection zone. In both the models,we anticipate the importance of Ish in generating solar activity inthe ARs. In case Ish is strong, the Lorentz force may generate shearmotions in the vicinity of the PIL. The shear generating Lorentzforce further has physical connection to the non-neutralized currents(see Georgoulis et al. 2012). Although this exercise is worth to study,
MNRAS 486, 4936–4946 (2019)
Dow
nloaded from https://academ
ic.oup.com/m
nras/article/486/4/4936/5476507 by guest on 12 May 2022
Electrict current neutrality & the activity 4943
Figure 4. Same as Fig. 2 but for flaring ARs.
we believe that the Lorentz force related to Ish would be small. It isclear from Fig. 1 that the Ish comes from almost everywhere in theAR, so it is unlikely that the Ish plays significant role in the activeevents such as flares/CMEs. However, an organized distribution ofJsh may have strong Lorentz force. Based on SOT/HINODE vectormagnetic field observations, Georgoulis et al. (2012) had alreadyshowed that the shear generating Lorentz force is significant in theARs. Given the contribution of Ish in the NCN, our results favour theconcept of shear-generating Lorentz force introduced by Georgouliset al. (2012).
4.2 SPIL length and non-neutralized current
Following the connection between the magnetic shear and thenon-neutralized currents, the length of SPIL is expected to followthe non-neutralized current evolution in the AR. This property isobservationally verified in AR 11158 (Vemareddy et al. 2015). TheAR 11158 has a systematic evolution of the net current in the twosub-regions where the SPIL is due to predominant rotational andshear motions of opposite flux concentrations. It was seen that thenet current evolution follows the time evolution of total length ofSPIL in both of the sub-regions.
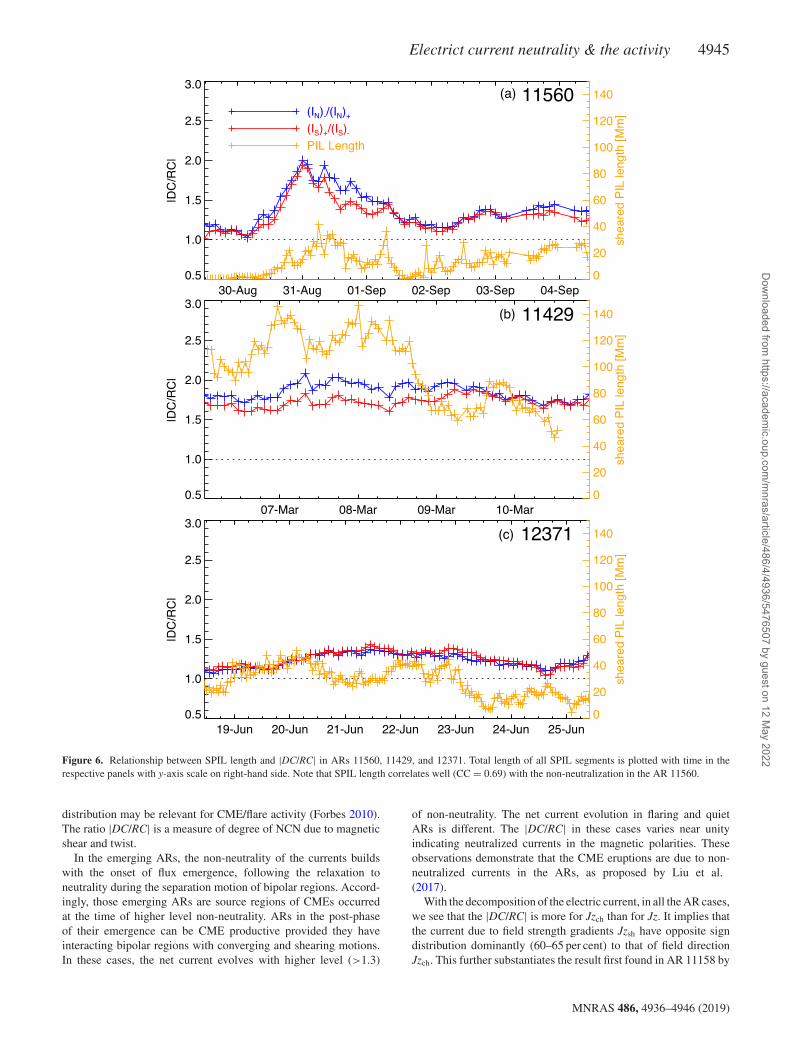
In Fig. 6, we compare the profile of |DC/RC| with the total lengthof SPIL segments in three ARs. The SPIL segments are traced bya systematic procedure as explained in Section 2. Throughout theevolution right from the emergence, the total length of all SPIL
segments correlates well (at a correlation coefficient of 0.69) withthe non-neutralization profile in the AR 11560. A similar correlationis found by Vemareddy (2019) between the SPIL length and the|DC/RC| in the eruptive AR 12673. The ARs 11429, 12371 havelong SPIL interface that are weakly correlated, at a correlationcoefficient of 0.45, 0.29, respectively, with the |DC/RC| profile. Itmeans that the non-neutralized currents spread in a broader regionabout PIL. This could likely be the case in ARs containing largeinterface of opposite polarities where the shearing regions extendinto the opposite polarities. Then, the spread of sheared region alongPIL may not represent the length of SPIL interface. This aspect ofSPIL is worth of further detailed investigation in few more ARcases.
Interestingly, we find that the total SPIL length in ARs 12192,11166 is significantly large (60–150 Mm, 5–115 Mm) during entireevolution period. It is in the form of small segments located all overthe AR as shown in vector magnetograms in Fig. 4. Obviously,the net current in these ARs is large (orders of 1012 A) andprobably caused large flares but none of them associated with CMEs.However, the |DC/RC| curve remains neutralized. We should pointthat the continuity of the SPIL is dependent on the threshold appliedto trace the PIL. Given a lesser threshold (<300 G), the PIL can becontinuous or will have larger segments through weak-field regions.However, what matters is the magnetic shear information in the hor-izontal field components that in turn connects to the strong twistedstructure along the PIL. Due to weaker horizontal field in regions
MNRAS 486, 4936–4946 (2019)
Dow
nloaded from https://academ
ic.oup.com/m
nras/article/486/4/4936/5476507 by guest on 12 May 2022
4944 P. Vemareddy
Figure 5. Same as Fig. 2 but for quiet ARs.
below 300 G, the magnetic shear could be weak. To our knowledge,there exists no reports of flux rope structure above along the PILin weak field regions less than 300 G. Therefore, our distinction ofcontinuous nature of SPIL is linked to magnetic shear and twistedflux structure, which is a key feature for the CME eruptions.
4.3 Nature of magnetic shear along PIL
We know that strongly twisted magnetic flux tubes and stronglysheared structures are candidates for explaining the intense flaresand the associated flux rope eruption from AR. The segmentedor localized distribution of magnetic shear indicates that the flaresare relatively local phenomena, and the released energy is mostlyconverted into radiation and energetic particles. On the other hand,magnetic shear along a long continuous PIL interface may refer tocoherently twisted magnetic structure, i.e. a flux rope, as require bymany CME models (Amari et al. 2003; Torok & Kliem 2005). Thus,the CMEs are more global phenomena, and the energy mostly goesinto mechanical energies through the ejection of magnetized plasmastructures. Therefore, as opposed to general view, an intense flaremay not necessarily be accompanied by a CME (e.g. Feynman &Hundhausen 1994; Green et al. 2002; Yashiro et al. 2005; Wang &Zhang 2007) because the occurrence of a CME is substantiallydetermined by the driving force of the inner core magnetic fieldand the confining force of the external overlying field. Fromthis comparison, the magnetic shear can be distributed along a
continuous PIL referring as global shear in the AR scale or it canbe present along few segmented PILs known as localized shear.The global shear case is a manifestation of strong twisted flux ropethat may erupt under certain instability conditions. The local shearcase may not form a twisted flux rope or even exists; the most fluxin the AR acts as a confining environment (magnetic cage) for aneruption to take place (see also the study of Vemareddy 2017a andAmari et al. 2018). From this observational analysis of the magneticshear and the nature of the activity, we suggest that the confinedor eruptive character of an AR is related to the nature of magneticshear along the PIL.
5 SU M M A RY A N D C O N C L U S I O N S
We studied the connection of non-neutralized currents and theobserved activity in 20 solar ARs. Net current evolution in theAR is derived using every 12 min HMI vector magnetograms. Fora more general view of the results, we separate the ARs accordingto their evolution phase, and the nature of activity and studied thedegree of NCN.
According to the flux rope models of CME eruptions (Zakharov &Shafranov 1986), the hoop force of the CME flux rope is propor-tional to square of the net current in the flux rope channel, thus thebreakdown of NCN implies to a form of Lorentz force developmentleading to stability loss and the CME eruption. The net current ina given polarity is algebraic sum of DC and RC, in particular their
MNRAS 486, 4936–4946 (2019)
Dow
nloaded from https://academ
ic.oup.com/m
nras/article/486/4/4936/5476507 by guest on 12 May 2022
Electrict current neutrality & the activity 4945
Figure 6. Relationship between SPIL length and |DC/RC| in ARs 11560, 11429, and 12371. Total length of all SPIL segments is plotted with time in therespective panels with y-axis scale on right-hand side. Note that SPIL length correlates well (CC = 0.69) with the non-neutralization in the AR 11560.
distribution may be relevant for CME/flare activity (Forbes 2010).The ratio |DC/RC| is a measure of degree of NCN due to magneticshear and twist.
In the emerging ARs, the non-neutrality of the currents buildswith the onset of flux emergence, following the relaxation toneutrality during the separation motion of bipolar regions. Accord-ingly, those emerging ARs are source regions of CMEs occurredat the time of higher level non-neutrality. ARs in the post-phaseof their emergence can be CME productive provided they haveinteracting bipolar regions with converging and shearing motions.In these cases, the net current evolves with higher level (>1.3)
of non-neutrality. The net current evolution in flaring and quietARs is different. The |DC/RC| in these cases varies near unityindicating neutralized currents in the magnetic polarities. Theseobservations demonstrate that the CME eruptions are due to non-neutralized currents in the ARs, as proposed by Liu et al.(2017).
With the decomposition of the electric current, in all the AR cases,we see that the |DC/RC| is more for Jzch than for Jz. It implies thatthe current due to field strength gradients Jzsh have opposite signdistribution dominantly (60–65 per cent) to that of field directionJzch. This further substantiates the result first found in AR 11158 by
MNRAS 486, 4936–4946 (2019)
Dow
nloaded from https://academ
ic.oup.com/m
nras/article/486/4/4936/5476507 by guest on 12 May 2022
4946 P. Vemareddy
Vemareddy (2017b). Apart from its role in current neutralization, Ish
can be the origin of shear-generating Lorentz force, which furtherconnected to non-neutralized currents and the solar activity in theARs (Georgoulis et al. 2012).
Owing to the fact that the non-neutralized currents arise inthe vicinity of SPILs, the total length of SPIL segments followsthe degree of NCN with a strong correlation in AR 11560. Thiscorrelation is positive but weak in ARs 11429, 12371 that could berelated to spread of sheared region about PIL. These findings are insupport of a recent observational study of the SPIL length and the|DC/RC| in strong eruptive AR 12673 (Vemareddy 2019). In flaringARs, the NCN is closer to unity even with total length of SPILsegments is large. Moreover, we notice that the SPIL is continuousin CME-producing ARs in contrast to multiple small segments inflaring ARs that makes a clear difference in the magnetic sheardistribution in the AR scale in which we refer as global shear inthe former cases and local shear in the later cases. Our study ofnet current neutrality demonstrates the dividing line between theCMEs and flares with the difference being in global or local natureof magnetic shear in the AR.
AC K N OW L E D G E M E N T S
The data have been used here courtesy of NASA/SDO and HMIscience team. We thank the HMI science team for the open datapolicy of processed vector magnetograms. I thank the refereefor insightful comments and suggestions. PV is supported by anINSPIRE grant under the AORC scheme of the Department ofScience and Technology.
RE FERENCES
Amari T., Luciani J. F., Aly J. J., Mikic Z., Linker J., 2003, ApJ, 585, 1073Amari T., Canou A., Aly J.-J., Delyon F., Alauzet F., 2018, Nature, 554, 211Borrero J. M., Tomczyk S., Kubo M., Socas-Navarro H., Schou J., Couvidat
S., Bogart R., 2011, Sol. Phys., 273, 267Calabretta M. R., Greisen E. W., 2002, A&A, 395, 1077Dalmasse K., Aulanier G., Demoulin P., Kliem B., Torok T., Pariat E., 2015,
ApJ, 810, 17Falconer D. A., 2001, J. Geophys. Res., 106, 25185Feynman J., Hundhausen A. J., 1994, J. Geophys. Res., 99, 8451Forbes T., 2010, in Schrijver C. J., Siscoe G. L., eds, Models of coronal mass
ejections and flares. Cambridge University Press, Cambridge, p. 159Gary G. A., Hagyard M. J., 1990, Sol. Phys., 126, 21Georgoulis M. K., LaBonte B. J., 2004, ApJ, 615, 1029Georgoulis M. K., Titov V. S., Mikic Z., 2012, ApJ, 761, 61Green L. M., Matthews S. A., van Driel-Gesztelyi L., Harra L. K., Culhane
J. L., 2002, Sol. Phys., 205, 325
Hoeksema J. T. et al., 2014, Sol. Phys., 289, 3483Leka K. D., Barnes G., 2003a, ApJ, 595, 1277Leka K. D., Barnes G., 2003b, ApJ, 595, 1296Leka K. D., Canfield R. C., McClymont A. N., van Driel-Gesztelyi L., 1996,
ApJ, 462, 547Leka K. D., Barnes G., Crouch A. D., Metcalf T. R., Gary G. A., Jing J., Liu
Y., 2009, Sol. Phys., 260, 83Liu L. et al., 2016, ApJ, 826, 119Liu Y., Sun X., Torok T., Titov V. S., Leake J. E., 2017, ApJ, 846, L6Mason J. P., Hoeksema J. T., 2010, ApJ, 723, 634Melrose D. B., 1991, ApJ, 381, 306Melrose D. B., 1995, ApJ, 451, 391Metcalf T. R., 1994, Sol. Phys., 155, 235Parker E. N., 1996, ApJ, 471, 485Priest E. R., Forbes T. G., 2002, A&AR, 10, 313Ravindra B., Venkatakrishnan P., Tiwari S. K., Bhattacharyya R., 2011, ApJ,
740, 19Schou J. et al., 2012, Sol. Phys., 275, 229Schrijver C. J., De Rosa M. L., Title A. M., Metcalf T. R., 2005, ApJ, 628,
501Sun X. et al., 2015, ApJ, 804, L28Torok T., Kliem B., 2003, A&A, 406, 1043Torok T., Kliem B., 2005, ApJ, 630, L97Torok T. et al., 2014, ApJ, 782, L10Vasantharaju N., Vemareddy P., Ravindra B., Doddamani V. H., 2018, ApJ,
860, 58Vemareddy P., 2015, ApJ, 806, 245Vemareddy P., 2019, ApJ, 872, 182Vemareddy P., 2017a, ApJ, 845, 59Vemareddy P., 2017b, ApJ, 851, 3Vemareddy P., Demoulin P., 2017, A&A, 597, A104Vemareddy P., Wiegelmann T., 2014, ApJ, 792, 40Vemareddy P., Ambastha A., Maurya R. A., 2012, ApJ, 761, 60Vemareddy P., Venkatakrishnan P., Karthikreddy S., 2015, Res. Astron.
Astrophys., 15, 1547Vemareddy P., Cheng X., Ravindra B., 2016, ApJ, 829, 24Venkatakrishnan P., Tiwari S. K., 2009, ApJ, 706, L114Wang Y., Zhang J., 2007, ApJ, 665, 1428Yashiro S., Gopalswamy N., Akiyama S., Michalek G., Howard R. A., 2005,
J. Geophys. Res., 110, A12S05Yashiro S., Gopalswamy N., Michalek G., St. Cyr O. C., Plunkett S. P, Rich
N. B., Howard R. A., 2004, J. Geophys. Res., 109, 7105Zakharov L. E., Shafranov V. D., 1986, in Leontovich M. A., ed., Reviews
of Plasma Physics, Vol. 11. Consultants Bureau, New York, p. 153Zhang H., 2001, ApJ, 557, L71Zhang H., 2010, ApJ, 716, 1493
This paper has been typeset from a TEX/LATEX file prepared by the author.
MNRAS 486, 4936–4946 (2019)
Dow
nloaded from https://academ
ic.oup.com/m
nras/article/486/4/4936/5476507 by guest on 12 May 2022