default price-quality path compliance statement
TRANSCRIPT
Default Price-Quality Path
Compliance Statement
For the Assessment Date 31 March 2016
8 June 2016
Pursuant to the requirements of clause 11.1 of the Electricity Distribution
Services Default Price-Quality Path Determination 2015
Alpine Energy Limited DPP Annual Compliance Statement 2016
Page 2 of 34
Contents
1. Summary of Compliance..................................................................................................... 3
2. Compliance with the Price Path ......................................................................................... 5
3. Compliance with the Quality Path ...................................................................................... 7
4. Restructure of prices ........................................................................................................ 10
5. Transactions ...................................................................................................................... 11
6. Director Certification ........................................................................................................ 12
7. Auditor’s Report ............................................................................................................... 13
Appendix A – Notional and Allowable Notional Revenue Calculations ................................... 16
Appendix B – Calculation of distribution and pass-through and recoverable revenues ......... 17
Appendix C – Pass-through and Recoverable Costs ................................................................ 19
Appendix D - Portion of distribution and pass-through and recoverable costs ...................... 25
Appendix E – Methodology used to forecast distribution and pass-through and recoverable
prices ........................................................................................................................................ 26
Appendix F – Quality Standard Compliance Calculations ........................................................ 28
Appendix G – Quality incentive scheme .................................................................................. 30
Appendix H – Prior Period Reliability Assessment ................................................................... 32
Appendix I – Policies and Procedures for Recording SAIDI and SAIFI ...................................... 33
Alpine Energy Limited DPP Annual Compliance Statement 2016
Page 3 of 34
1. Summary of Compliance
We have complied with the price path (clause 8), but have not complied with the quality
standards (clause 9) of the Commerce Act (Electricity Distribution Default Price-Quality Path)
Determination 2015 (“Determination”) for the assessment date ended 31 March 2016.
We submit the following information in our Default Price-Quality Path Compliance
Statement pursuant to the clause 11.1 of the Determination:
Price path under clauses 11.4(c) to (k):
o the amount of allowable notional revenue and notional revenue
o prices and quantities
o the amounts of Pass-through and Recoverable Costs and information used to
determine these amounts
o the methodology used to calculate Pass-through prices and Distribution
prices
o the amount of charge relating to New Investment Agreements
o the variances between the forecast and actual amounts of Pass-through
Costs and Recoverable Costs and explanatory notes of material variances.
o a reconciliation between Pass through Balance for this period and last.
Quality standards under clause 11.5(a), (b), (c), (e), and (f):
o reasons for non-compliance
o actions taken to mitigate non-compliance
o assessed values and reliability limits
o SAIDI and SAIFI statistics and calculations
o the annual reliability assessments for the two previous assessment periods
o a description of how SAIDI and SAIFI statistics were recorded, including
policies and procedures
o the cause of each Major Event Day within the assessment period.
Director certification under clause 11.3(a) as set out in Schedule 6.
An assurance report under clause 11.3(b) as set out in schedule 7.
Alpine Energy Limited DPP Annual Compliance Statement 2016
Page 4 of 34
Please note, under clause 11.2(a) to (f), we have:
complied with price path in clause 8 for the assessment period
not complied with the quality standards in clause 9 for the assessment period
not restructured prices during the assessment period with the meaning of
restructured prices set out under clause 4 (Interpretation) of the Determination
not received a transfer of transmission assets or transferred assets to Transpower
not amalgamated or merged with another party or participated in a Major
Transaction with the meaning set out in clause 4 of the Determination.
This compliance statement was certified by a director of the board on 8 June 2016.
In conjunction with this compliance statement, copies of our New Investment Agreements
with Transpower New Zealand have been submitted to the Commerce Commission in soft
copy format in accordance with clause 11.4(h).
Alpine Energy Limited DPP Annual Compliance Statement 2016
Page 5 of 34
2. Compliance with the Price Path
We have complied with the price path as specified by clause 8 of the Determination. Clause
8.3 ‘Compliance with allowable notional revenue ‘requires that:
The notional revenue of a Non-exempt EDB in an Assessment Period must not exceed the
allowable notional revenue for the Assessment Period, such that—
NR ≤ ANR
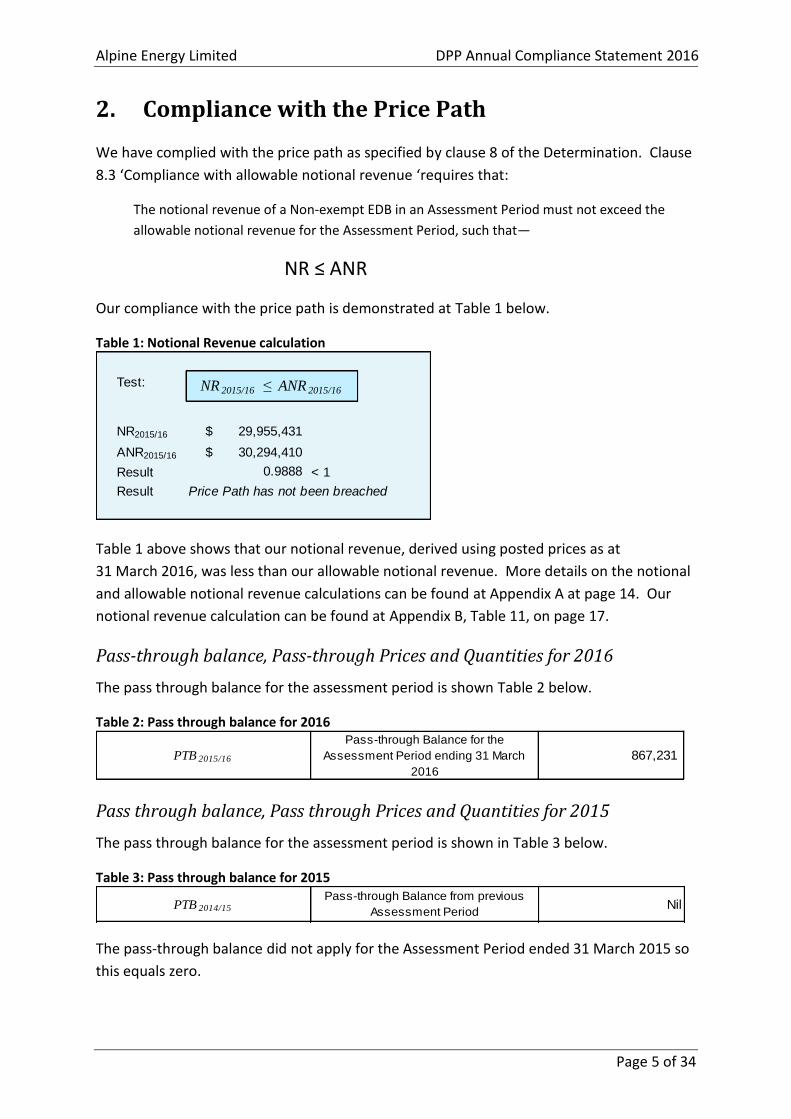
Our compliance with the price path is demonstrated at Table 1 below.
Table 1: Notional Revenue calculation
Table 1 above shows that our notional revenue, derived using posted prices as at
31 March 2016, was less than our allowable notional revenue. More details on the notional
and allowable notional revenue calculations can be found at Appendix A at page 14. Our
notional revenue calculation can be found at Appendix B, Table 11, on page 17.
Pass-through balance, Pass-through Prices and Quantities for 2016
The pass through balance for the assessment period is shown Table 2 below.
Table 2: Pass through balance for 2016
Pass through balance, Pass through Prices and Quantities for 2015
The pass through balance for the assessment period is shown in Table 3 below.
Table 3: Pass through balance for 2015
The pass-through balance did not apply for the Assessment Period ended 31 March 2015 so
this equals zero.
Test:
NR2015/16 29,955,431$
ANR2015/16 30,294,410$
Result < 1
Result Price Path has not been breached
0.9888
NR 2015/16 ≤ ANR 2015/16
PTB 2015/16
Pass-through Balance for the
Assessment Period ending 31 March
2016
867,231
PTB 2014/15
Pass-through Balance from previous
Assessment PeriodNil
Alpine Energy Limited DPP Annual Compliance Statement 2016
Page 6 of 34
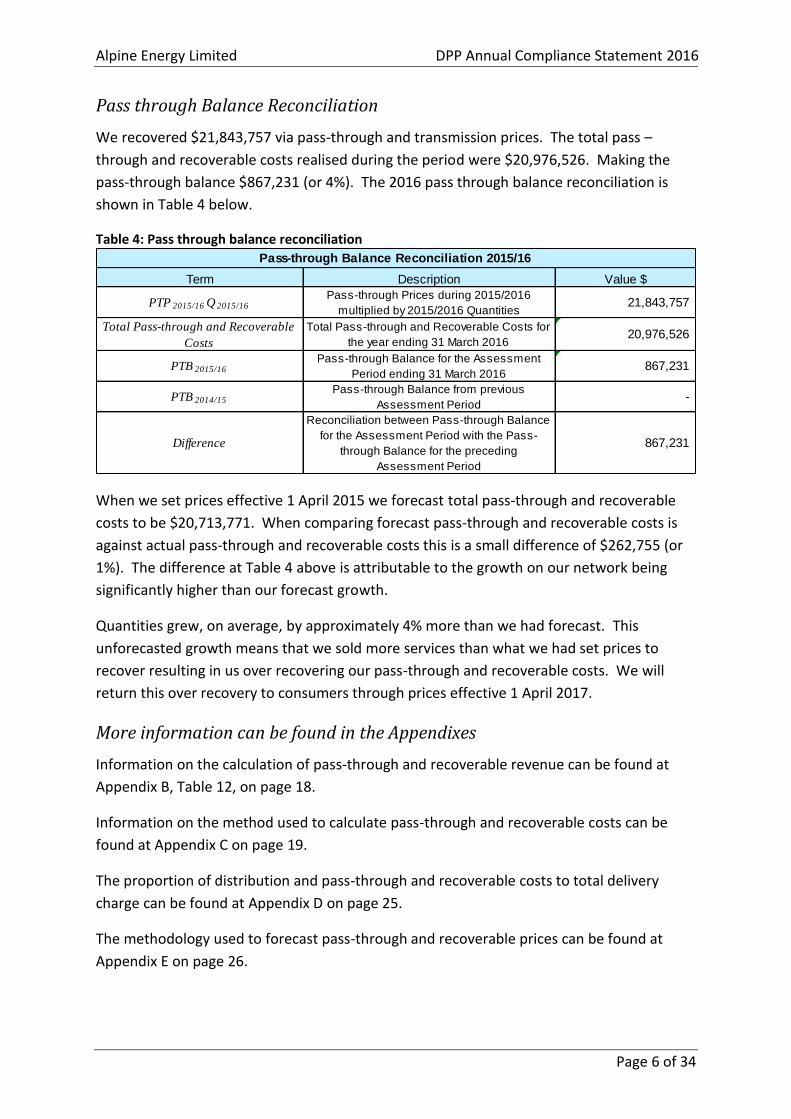
Pass through Balance Reconciliation
We recovered $21,843,757 via pass-through and transmission prices. The total pass –
through and recoverable costs realised during the period were $20,976,526. Making the
pass-through balance $867,231 (or 4%). The 2016 pass through balance reconciliation is
shown in Table 4 below.
Table 4: Pass through balance reconciliation
When we set prices effective 1 April 2015 we forecast total pass-through and recoverable
costs to be $20,713,771. When comparing forecast pass-through and recoverable costs is
against actual pass-through and recoverable costs this is a small difference of $262,755 (or
1%). The difference at Table 4 above is attributable to the growth on our network being
significantly higher than our forecast growth.
Quantities grew, on average, by approximately 4% more than we had forecast. This
unforecasted growth means that we sold more services than what we had set prices to
recover resulting in us over recovering our pass-through and recoverable costs. We will
return this over recovery to consumers through prices effective 1 April 2017.
More information can be found in the Appendixes
Information on the calculation of pass-through and recoverable revenue can be found at
Appendix B, Table 12, on page 18.
Information on the method used to calculate pass-through and recoverable costs can be
found at Appendix C on page 19.
The proportion of distribution and pass-through and recoverable costs to total delivery
charge can be found at Appendix D on page 25.
The methodology used to forecast pass-through and recoverable prices can be found at
Appendix E on page 26.
Term Description Value $
PTP 2015/16 Q 2015/16Pass-through Prices during 2015/2016
multiplied by 2015/2016 Quantities 21,843,757
Total Pass-through and Recoverable
Costs
Total Pass-through and Recoverable Costs for
the year ending 31 March 2016 20,976,526
PTB 2015/16Pass-through Balance for the Assessment
Period ending 31 March 2016 867,231
PTB 2014/15Pass-through Balance from previous
Assessment Period-
Difference
Reconciliation between Pass-through Balance
for the Assessment Period with the Pass-
through Balance for the preceding
Assessment Period
867,231
Pass-through Balance Reconciliation 2015/16
Alpine Energy Limited DPP Annual Compliance Statement 2016
Page 7 of 34
3. Compliance with the Quality Path
Our year end performance was 1.13 SAIDI minutes over the SAIDI limit and accordingly we
have not complied with the quality path as specified by clause 9.1(a) of the Determination.
Because this year is the second year at two immediately preceding extant Assessment
Periods that we have not complied with clause 9.1(a) we have also not complied with clause
9.1(b) and accordingly we have breached the quality standards.
Clause 9.1 ‘Compliance with the quality standards’ requires that:
A Non-exempt EDB must, in respect of each Assessment Period, either:
(a) Comply with the annual reliability assessment specified in clause 9.2 for that Assessment
Period; or
(b) Have complied with those annual reliability assessments for the two immediately
preceding extant Assessment Periods.
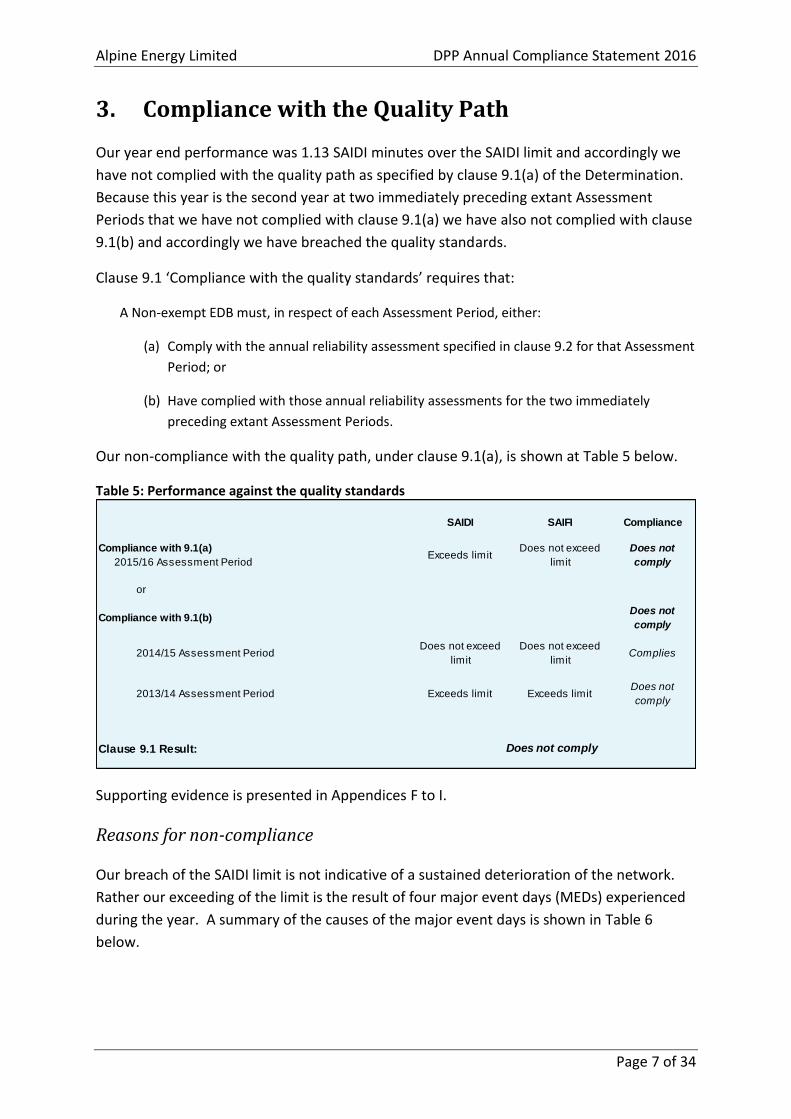
Our non-compliance with the quality path, under clause 9.1(a), is shown at Table 5 below.
Table 5: Performance against the quality standards
Supporting evidence is presented in Appendices F to I.
Reasons for non-compliance
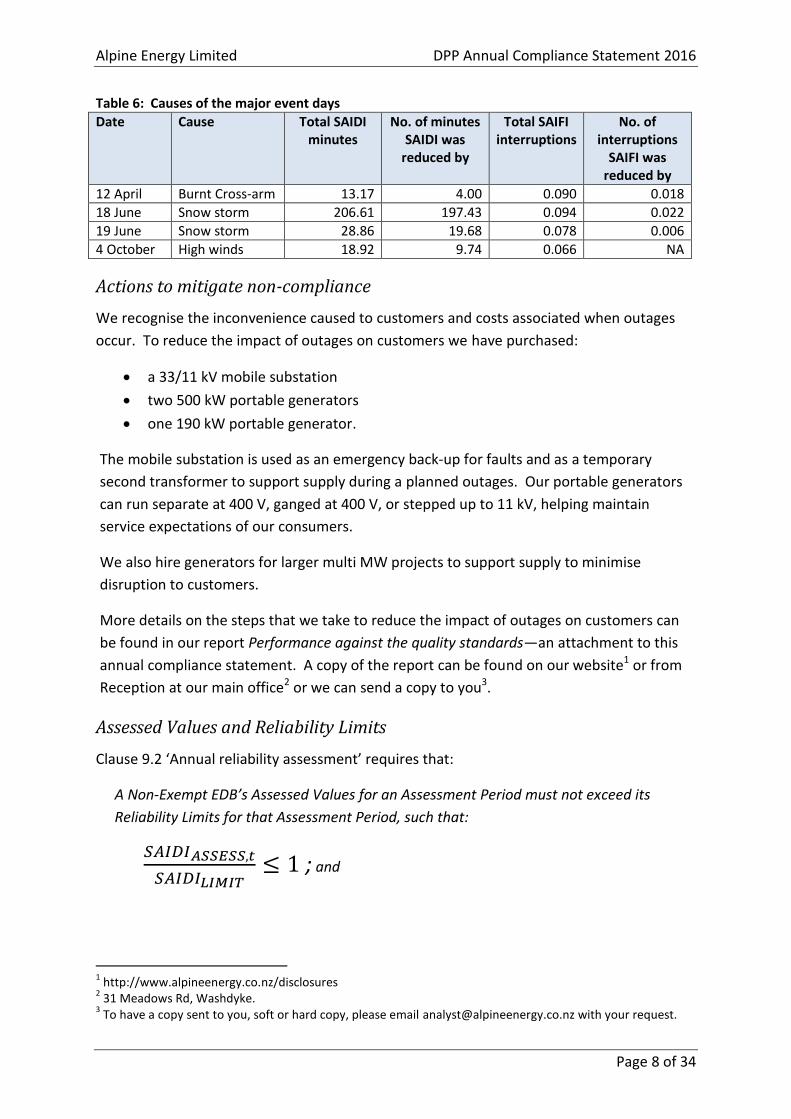
Our breach of the SAIDI limit is not indicative of a sustained deterioration of the network.
Rather our exceeding of the limit is the result of four major event days (MEDs) experienced
during the year. A summary of the causes of the major event days is shown in Table 6
below.
SAIDI SAIFI Compliance
Exceeds limitDoes not exceed
limit
Does not
comply
or
Compliance with 9.1(b)Does not
comply
2014/15 Assessment PeriodDoes not exceed
limit
Does not exceed
limitComplies
2013/14 Assessment Period Exceeds limit Exceeds limitDoes not
comply
Clause 9.1 Result: Does not comply
Compliance with 9.1(a)
2015/16 Assessment Period
Alpine Energy Limited DPP Annual Compliance Statement 2016
Page 8 of 34
Table 6: Causes of the major event days
Date Cause Total SAIDI minutes
No. of minutes SAIDI was
reduced by
Total SAIFI interruptions
No. of interruptions
SAIFI was reduced by
12 April Burnt Cross-arm 13.17 4.00 0.090 0.018
18 June Snow storm 206.61 197.43 0.094 0.022
19 June Snow storm 28.86 19.68 0.078 0.006
4 October High winds 18.92 9.74 0.066 NA
Actions to mitigate non-compliance
We recognise the inconvenience caused to customers and costs associated when outages
occur. To reduce the impact of outages on customers we have purchased:
a 33/11 kV mobile substation
two 500 kW portable generators
one 190 kW portable generator.
The mobile substation is used as an emergency back-up for faults and as a temporary
second transformer to support supply during a planned outages. Our portable generators
can run separate at 400 V, ganged at 400 V, or stepped up to 11 kV, helping maintain
service expectations of our consumers.
We also hire generators for larger multi MW projects to support supply to minimise
disruption to customers.
More details on the steps that we take to reduce the impact of outages on customers can
be found in our report Performance against the quality standards—an attachment to this
annual compliance statement. A copy of the report can be found on our website1 or from
Reception at our main office2 or we can send a copy to you3.
Assessed Values and Reliability Limits
Clause 9.2 ‘Annual reliability assessment’ requires that:
A Non-Exempt EDB’s Assessed Values for an Assessment Period must not exceed its
Reliability Limits for that Assessment Period, such that:
𝑆𝐴𝐼𝐷𝐼𝐴𝑆𝑆𝐸𝑆𝑆,𝑡
𝑆𝐴𝐼𝐷𝐼𝐿𝐼𝑀𝐼𝑇≤ 1 ; and
1 http://www.alpineenergy.co.nz/disclosures
2 31 Meadows Rd, Washdyke.
3 To have a copy sent to you, soft or hard copy, please email [email protected] with your request.
Alpine Energy Limited DPP Annual Compliance Statement 2016
Page 9 of 34
𝑆𝐴𝐼𝐹𝐼𝐴𝑆𝑆𝐸𝑆𝑆,𝑡
𝑆𝐴𝐼𝐹𝐼𝐿𝐼𝑀𝐼𝑇≤ 1
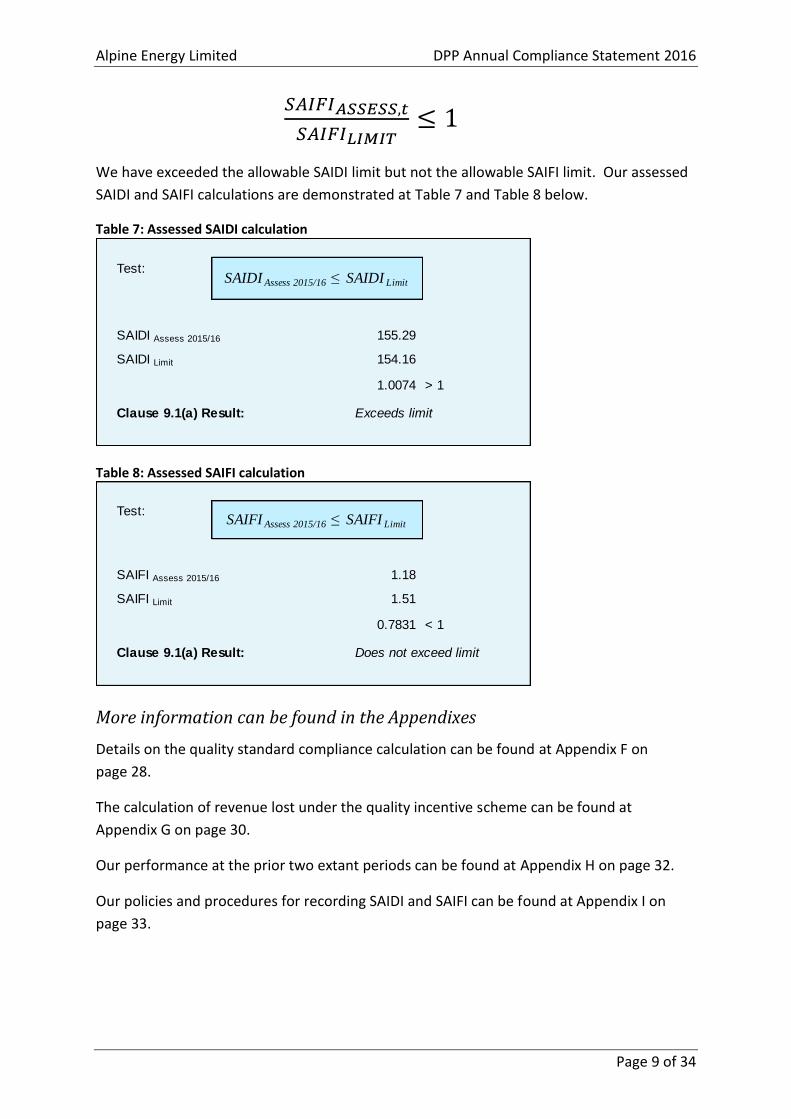
We have exceeded the allowable SAIDI limit but not the allowable SAIFI limit. Our assessed
SAIDI and SAIFI calculations are demonstrated at Table 7 and Table 8 below.
Table 7: Assessed SAIDI calculation
Table 8: Assessed SAIFI calculation
More information can be found in the Appendixes
Details on the quality standard compliance calculation can be found at Appendix F on
page 28.
The calculation of revenue lost under the quality incentive scheme can be found at
Appendix G on page 30.
Our performance at the prior two extant periods can be found at Appendix H on page 32.
Our policies and procedures for recording SAIDI and SAIFI can be found at Appendix I on
page 33.
Test:
SAIDI Assess 2015/16 155.29
SAIDI Limit 154.16
> 1
Clause 9.1(a) Result: Exceeds limit
SAIDI Assess 2015/16 ≤ SAIDI Limit
1.0074
Test:
SAIFI Assess 2015/16 1.18
SAIFI Limit 1.51
0.7831 < 1
Clause 9.1(a) Result: Does not exceed limit
SAIFI Assess 2015/16 ≤ SAIFI Limit
Alpine Energy Limited DPP Annual Compliance Statement 2016
Page 10 of 34
4. Restructure of prices
We did not restructure our prices that applied during the assessment period.
Alpine Energy Limited DPP Annual Compliance Statement 2016
Page 11 of 34
5. Transactions
We did not:
receive a transfer of transmission assets from Transpower that become System
Fixed Assets, or transferred System Fixed Assets to Transpower; or
amalgamate or merger with another regulated service; or
undertake any major transactions;
during the assessment period.
Alpine Energy Limited DPP Annual Compliance Statement 2016
Page 12 of 34
6. Director Certification
I, Alister John France, being a director of Alpine Energy Limited certify that, having made all
reasonable enquiry, to the best of my knowledge and belief, the attached Annual
Compliance Statement of Alpine Energy Limited, and related information, prepared for the
purposes of the Electricity Distribution Services Price-Quality Path Determination 2015 are
true and accurate.
Alister John France
8 June 2016
Alpine Energy Limited DPP Annual Compliance Statement 2016
Page 13 of 34
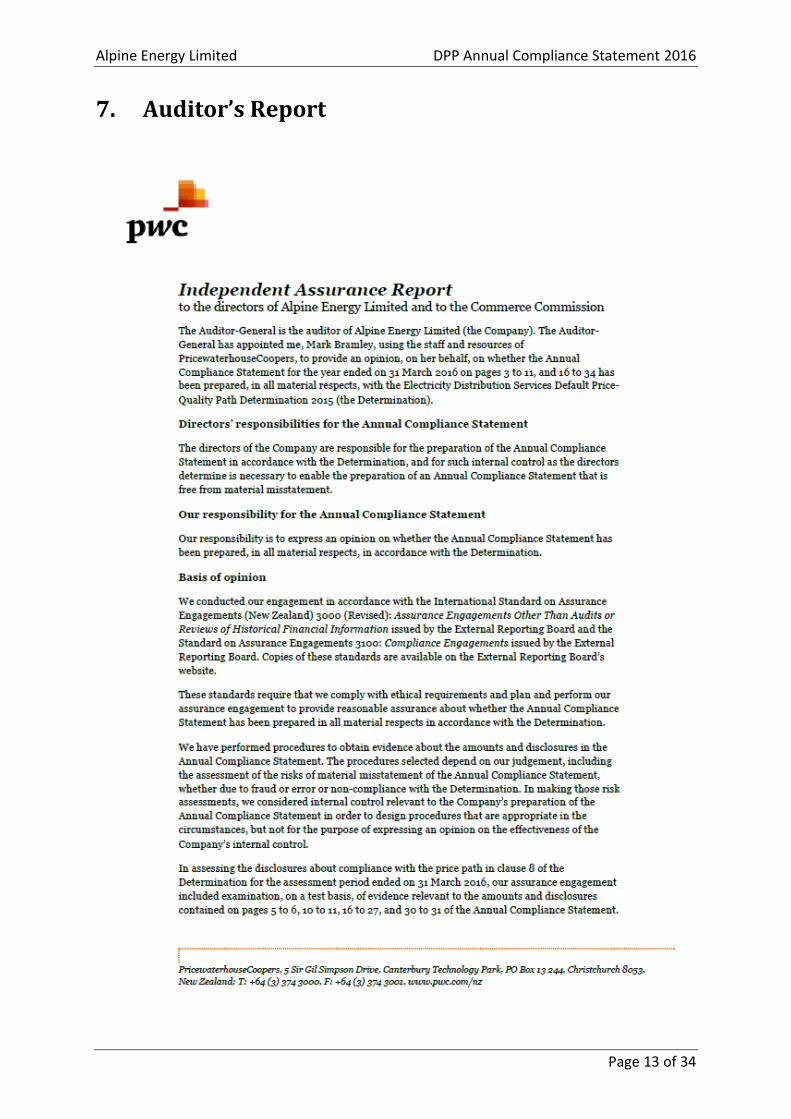
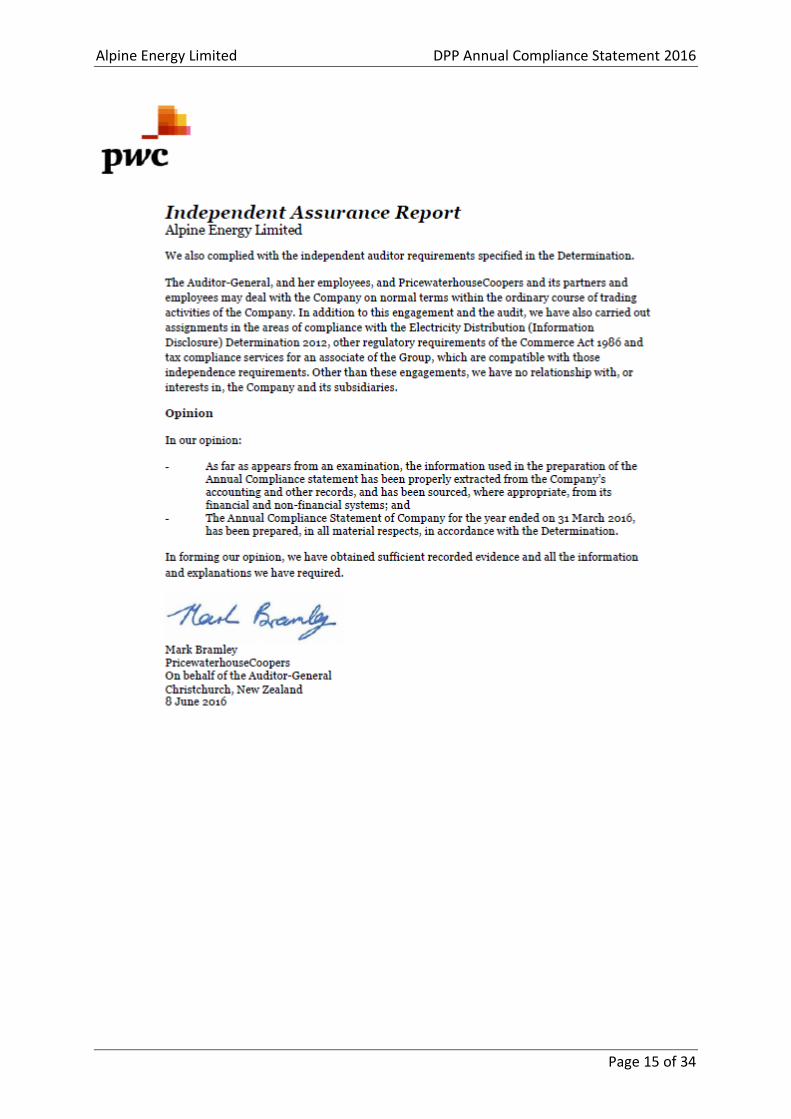
7. Auditor’s Report
Alpine Energy Limited DPP Annual Compliance Statement 2016
Page 14 of 34
Alpine Energy Limited DPP Annual Compliance Statement 2016
Page 15 of 34
Alpine Energy Limited DPP Annual Compliance Statement 2016
Page 16 of 34
Appendix A – Notional and Allowable Notional
Revenue Calculations
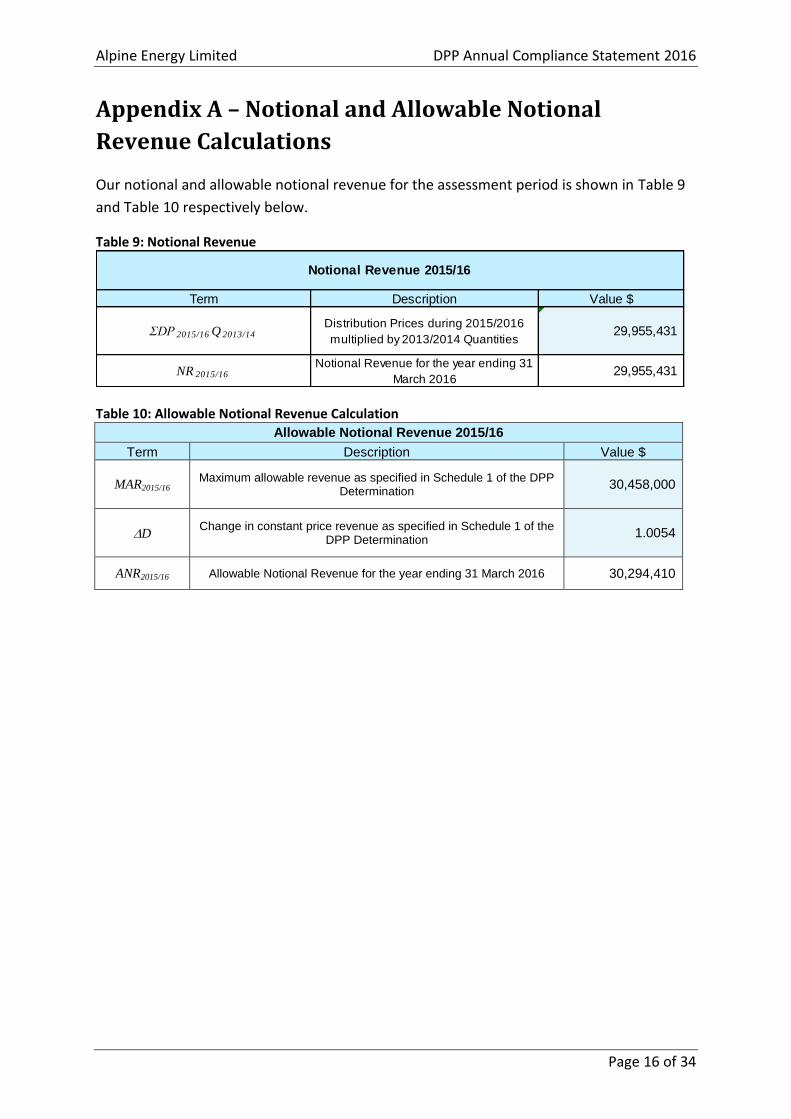
Our notional and allowable notional revenue for the assessment period is shown in Table 9
and Table 10 respectively below.
Table 9: Notional Revenue
Table 10: Allowable Notional Revenue Calculation
Allowable Notional Revenue 2015/16
Term Description Value $
MAR2015/16 Maximum allowable revenue as specified in Schedule 1 of the DPP
Determination 30,458,000
D Change in constant price revenue as specified in Schedule 1 of the
DPP Determination 1.0054
ANR2015/16 Allowable Notional Revenue for the year ending 31 March 2016 30,294,410
Term Description Value $
ΣDP 2015/16 Q 2013/14Distribution Prices during 2015/2016
multiplied by 2013/2014 Quantities 29,955,431
NR 2015/16Notional Revenue for the year ending 31
March 2016 29,955,431
Notional Revenue 2015/16
Alpine Energy Limited DPP Annual Compliance Statement 2016
Page 17 of 34
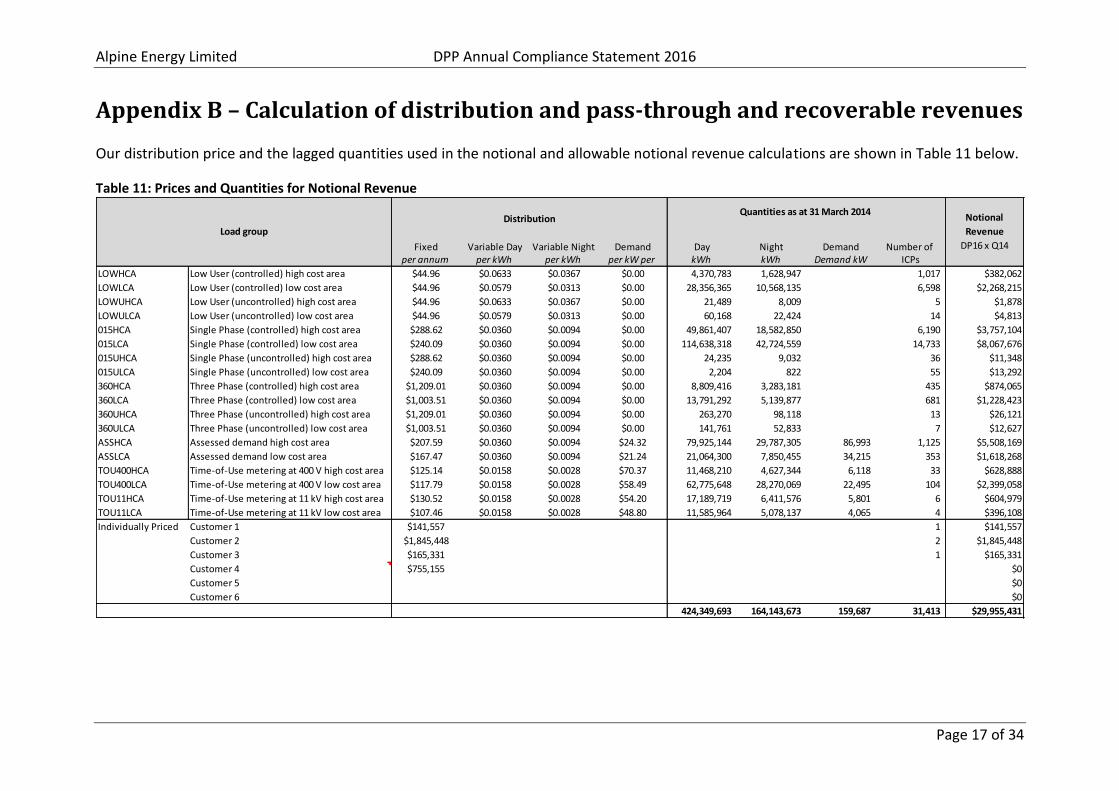
Appendix B – Calculation of distribution and pass-through and recoverable revenues
Our distribution price and the lagged quantities used in the notional and allowable notional revenue calculations are shown in Table 11 below.
Table 11: Prices and Quantities for Notional Revenue
Fixed Variable Day Variable Night Demand Day Night Demand Number of per annum per kWh per kWh per kW per kWh kWh Demand kW ICPs
LOWHCA Low User (controlled) high cost area $44.96 $0.0633 $0.0367 $0.00 4,370,783 1,628,947 1,017 $382,062
LOWLCA Low User (controlled) low cost area $44.96 $0.0579 $0.0313 $0.00 28,356,365 10,568,135 6,598 $2,268,215
LOWUHCA Low User (uncontrolled) high cost area $44.96 $0.0633 $0.0367 $0.00 21,489 8,009 5 $1,878
LOWULCA Low User (uncontrolled) low cost area $44.96 $0.0579 $0.0313 $0.00 60,168 22,424 14 $4,813
015HCA Single Phase (controlled) high cost area $288.62 $0.0360 $0.0094 $0.00 49,861,407 18,582,850 6,190 $3,757,104
015LCA Single Phase (controlled) low cost area $240.09 $0.0360 $0.0094 $0.00 114,638,318 42,724,559 14,733 $8,067,676
015UHCA Single Phase (uncontrolled) high cost area $288.62 $0.0360 $0.0094 $0.00 24,235 9,032 36 $11,348
015ULCA Single Phase (uncontrolled) low cost area $240.09 $0.0360 $0.0094 $0.00 2,204 822 55 $13,292
360HCA Three Phase (controlled) high cost area $1,209.01 $0.0360 $0.0094 $0.00 8,809,416 3,283,181 435 $874,065
360LCA Three Phase (controlled) low cost area $1,003.51 $0.0360 $0.0094 $0.00 13,791,292 5,139,877 681 $1,228,423
360UHCA Three Phase (uncontrolled) high cost area $1,209.01 $0.0360 $0.0094 $0.00 263,270 98,118 13 $26,121
360ULCA Three Phase (uncontrolled) low cost area $1,003.51 $0.0360 $0.0094 $0.00 141,761 52,833 7 $12,627
ASSHCA Assessed demand high cost area $207.59 $0.0360 $0.0094 $24.32 79,925,144 29,787,305 86,993 1,125 $5,508,169
ASSLCA Assessed demand low cost area $167.47 $0.0360 $0.0094 $21.24 21,064,300 7,850,455 34,215 353 $1,618,268
TOU400HCA Time-of-Use metering at 400 V high cost area $125.14 $0.0158 $0.0028 $70.37 11,468,210 4,627,344 6,118 33 $628,888
TOU400LCA Time-of-Use metering at 400 V low cost area $117.79 $0.0158 $0.0028 $58.49 62,775,648 28,270,069 22,495 104 $2,399,058
TOU11HCA Time-of-Use metering at 11 kV high cost area $130.52 $0.0158 $0.0028 $54.20 17,189,719 6,411,576 5,801 6 $604,979
TOU11LCA Time-of-Use metering at 11 kV low cost area $107.46 $0.0158 $0.0028 $48.80 11,585,964 5,078,137 4,065 4 $396,108
Individually Priced Customer 1 $141,557 1 $141,557
Customer 2 $1,845,448 2 $1,845,448
Customer 3 $165,331 1 $165,331
Customer 4 $755,155 $0
Customer 5 $0
Customer 6 $0
424,349,693 164,143,673 159,687 31,413 $29,955,431
Distribution Notional
Revenue
DP16 x Q14
Quantities as at 31 March 2014
Load group
Alpine Energy Limited DPP Annual Compliance Statement 2016
Page 18 of 34
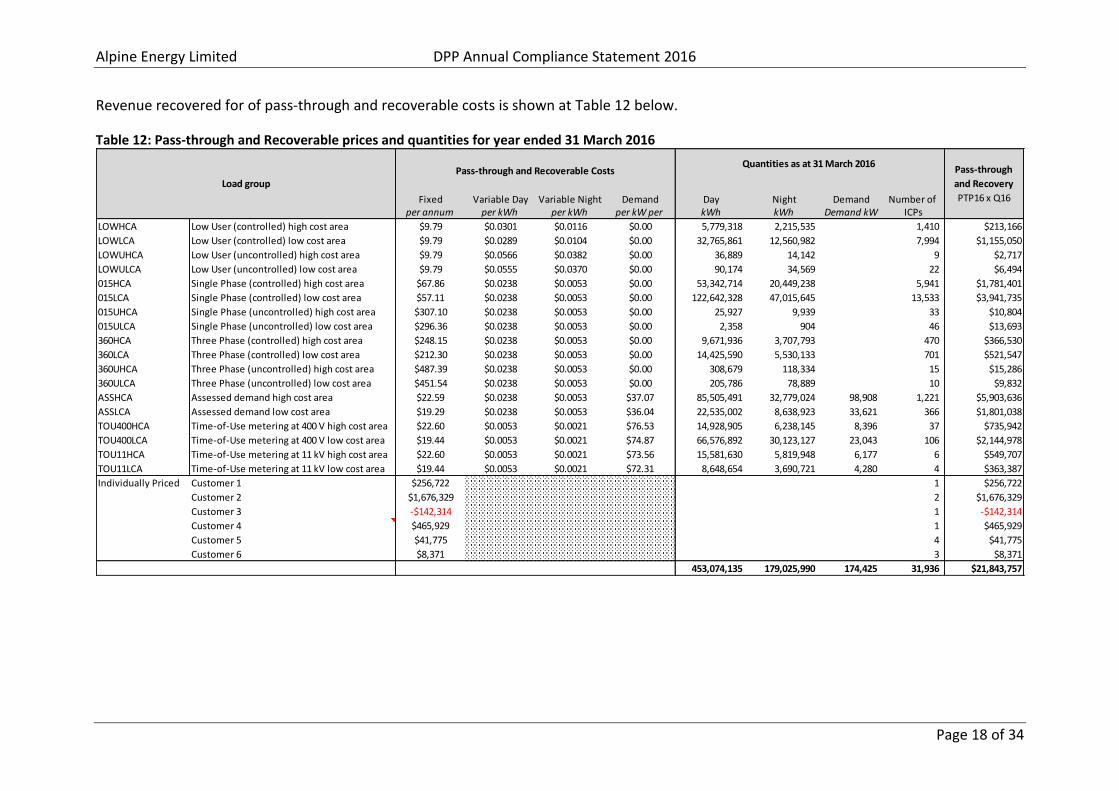
Revenue recovered for of pass-through and recoverable costs is shown at Table 12 below.
Table 12: Pass-through and Recoverable prices and quantities for year ended 31 March 2016
Fixed Variable Day Variable Night Demand Day Night Demand Number of per annum per kWh per kWh per kW per kWh kWh Demand kW ICPs
LOWHCA Low User (controlled) high cost area $9.79 $0.0301 $0.0116 $0.00 5,779,318 2,215,535 1,410 $213,166
LOWLCA Low User (controlled) low cost area $9.79 $0.0289 $0.0104 $0.00 32,765,861 12,560,982 7,994 $1,155,050
LOWUHCA Low User (uncontrolled) high cost area $9.79 $0.0566 $0.0382 $0.00 36,889 14,142 9 $2,717
LOWULCA Low User (uncontrolled) low cost area $9.79 $0.0555 $0.0370 $0.00 90,174 34,569 22 $6,494
015HCA Single Phase (controlled) high cost area $67.86 $0.0238 $0.0053 $0.00 53,342,714 20,449,238 5,941 $1,781,401
015LCA Single Phase (controlled) low cost area $57.11 $0.0238 $0.0053 $0.00 122,642,328 47,015,645 13,533 $3,941,735
015UHCA Single Phase (uncontrolled) high cost area $307.10 $0.0238 $0.0053 $0.00 25,927 9,939 33 $10,804
015ULCA Single Phase (uncontrolled) low cost area $296.36 $0.0238 $0.0053 $0.00 2,358 904 46 $13,693
360HCA Three Phase (controlled) high cost area $248.15 $0.0238 $0.0053 $0.00 9,671,936 3,707,793 470 $366,530
360LCA Three Phase (controlled) low cost area $212.30 $0.0238 $0.0053 $0.00 14,425,590 5,530,133 701 $521,547
360UHCA Three Phase (uncontrolled) high cost area $487.39 $0.0238 $0.0053 $0.00 308,679 118,334 15 $15,286
360ULCA Three Phase (uncontrolled) low cost area $451.54 $0.0238 $0.0053 $0.00 205,786 78,889 10 $9,832
ASSHCA Assessed demand high cost area $22.59 $0.0238 $0.0053 $37.07 85,505,491 32,779,024 98,908 1,221 $5,903,636
ASSLCA Assessed demand low cost area $19.29 $0.0238 $0.0053 $36.04 22,535,002 8,638,923 33,621 366 $1,801,038
TOU400HCA Time-of-Use metering at 400 V high cost area $22.60 $0.0053 $0.0021 $76.53 14,928,905 6,238,145 8,396 37 $735,942
TOU400LCA Time-of-Use metering at 400 V low cost area $19.44 $0.0053 $0.0021 $74.87 66,576,892 30,123,127 23,043 106 $2,144,978
TOU11HCA Time-of-Use metering at 11 kV high cost area $22.60 $0.0053 $0.0021 $73.56 15,581,630 5,819,948 6,177 6 $549,707
TOU11LCA Time-of-Use metering at 11 kV low cost area $19.44 $0.0053 $0.0021 $72.31 8,648,654 3,690,721 4,280 4 $363,387
Individually Priced Customer 1 $256,722 1 $256,722
Customer 2 $1,676,329 2 $1,676,329
Customer 3 -$142,314 1 -$142,314
Customer 4 $465,929 1 $465,929
Customer 5 $41,775 4 $41,775
Customer 6 $8,371 3 $8,371
453,074,135 179,025,990 174,425 31,936 $21,843,757
Pass-through
and Recovery
PTP16 x Q16
Pass-through and Recoverable CostsQuantities as at 31 March 2016
Load group
Alpine Energy Limited DPP Annual Compliance Statement 2016
Page 19 of 34
Appendix C – Pass-through and Recoverable Costs
Information and method used to calculate pass through costs
Pass-through costs are made up of four parts:
rates on system fixed assets
Commerce Act levies
Electricity Authority levies
Electricity and Gas Complaints Commission (EGCC) levies.
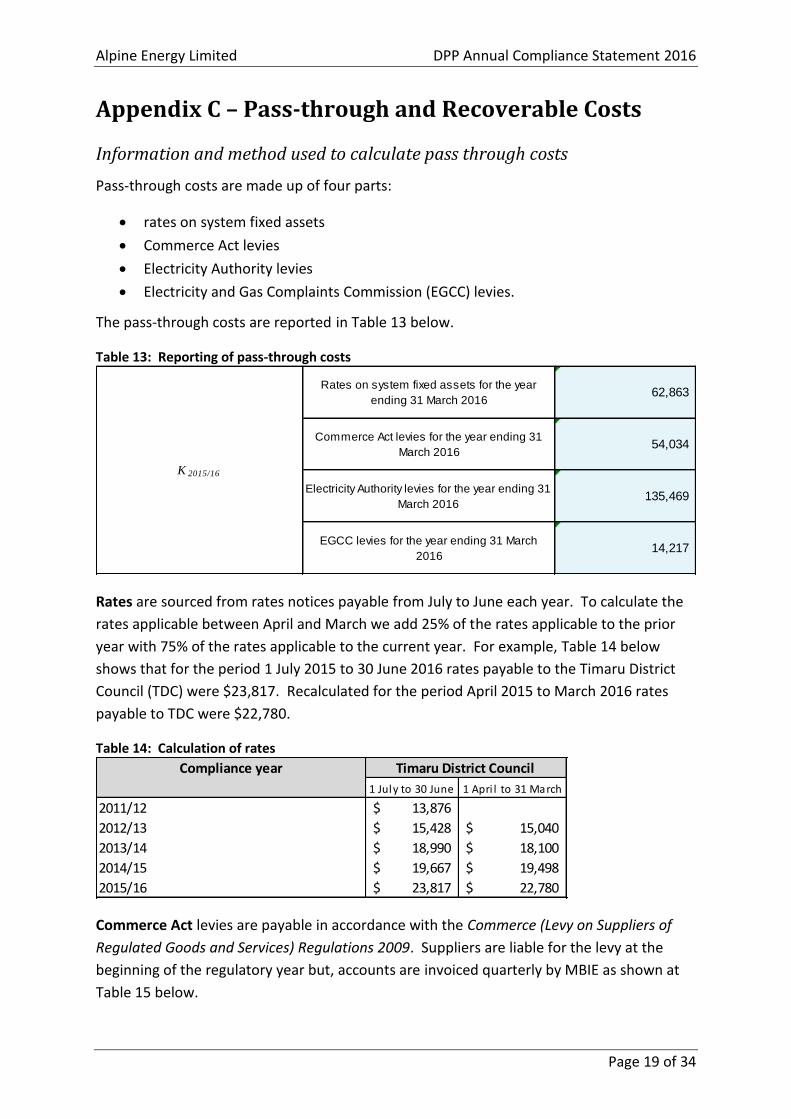
The pass-through costs are reported in Table 13 below.
Table 13: Reporting of pass-through costs
Rates are sourced from rates notices payable from July to June each year. To calculate the
rates applicable between April and March we add 25% of the rates applicable to the prior
year with 75% of the rates applicable to the current year. For example, Table 14 below
shows that for the period 1 July 2015 to 30 June 2016 rates payable to the Timaru District
Council (TDC) were $23,817. Recalculated for the period April 2015 to March 2016 rates
payable to TDC were $22,780.
Table 14: Calculation of rates
Commerce Act levies are payable in accordance with the Commerce (Levy on Suppliers of
Regulated Goods and Services) Regulations 2009. Suppliers are liable for the levy at the
beginning of the regulatory year but, accounts are invoiced quarterly by MBIE as shown at
Table 15 below.
Rates on system fixed assets for the year
ending 31 March 2016 62,863
Commerce Act levies for the year ending 31
March 2016 54,034
Electricity Authority levies for the year ending 31
March 2016 135,469
EGCC levies for the year ending 31 March
2016 14,217
K 2015/16
Compliance year Timaru District Council Environment
1 July to 30 June 1 Apri l to 31 March
2011/12 13,876$
2012/13 15,428$ 15,040$
2013/14 18,990$ 18,100$
2014/15 19,667$ 19,498$
2015/16 23,817$ 22,780$
Alpine Energy Limited DPP Annual Compliance Statement 2016
Page 20 of 34
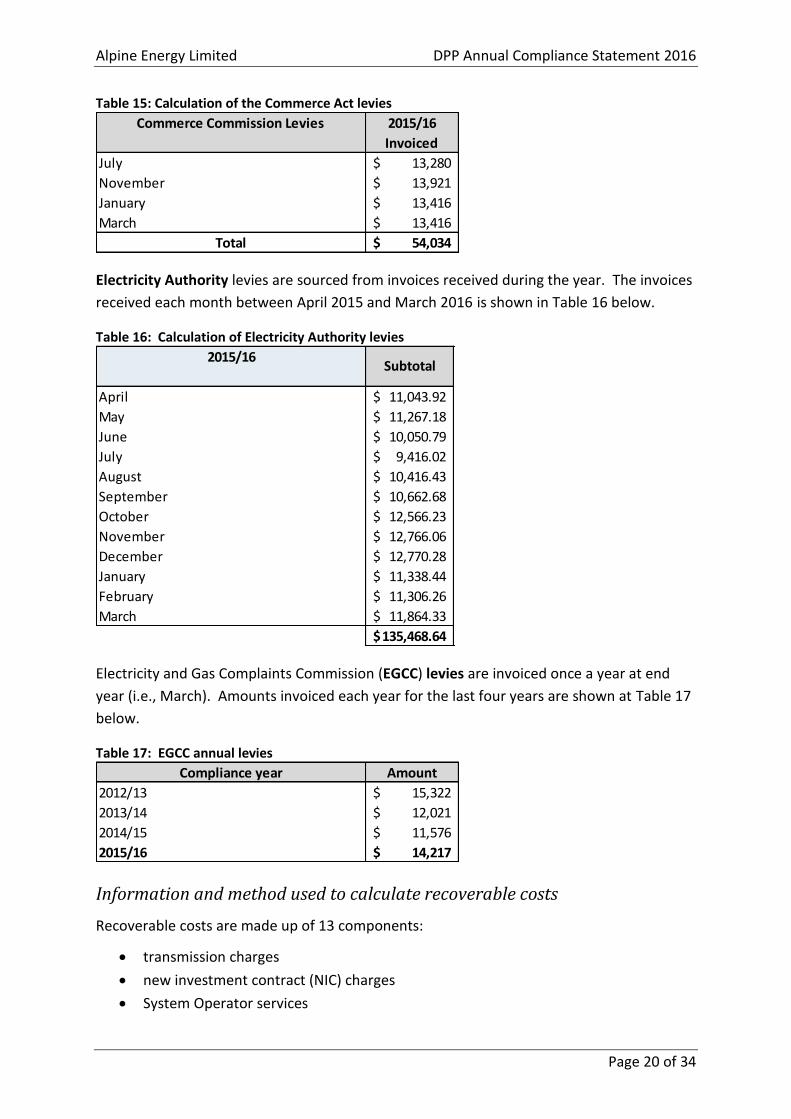
Table 15: Calculation of the Commerce Act levies
Electricity Authority levies are sourced from invoices received during the year. The invoices
received each month between April 2015 and March 2016 is shown in Table 16 below.
Table 16: Calculation of Electricity Authority levies
Electricity and Gas Complaints Commission (EGCC) levies are invoiced once a year at end
year (i.e., March). Amounts invoiced each year for the last four years are shown at Table 17
below.
Table 17: EGCC annual levies
Information and method used to calculate recoverable costs
Recoverable costs are made up of 13 components:
transmission charges
new investment contract (NIC) charges
System Operator services
Commerce Commission Levies 2015/16
Invoiced
July 13,280$
November 13,921$
January 13,416$
March 13,416$
Total 54,034$
2015/16
April 11,043.92$
May 11,267.18$
June 10,050.79$
July 9,416.02$
August 10,416.43$
September 10,662.68$
October 12,566.23$
November 12,766.06$
December 12,770.28$
January 11,338.44$
February 11,306.26$
March 11,864.33$
135,468.64$
Subtotal
Compliance year Amount
2012/13 15,322$
2013/14 12,021$
2014/15 11,576$
2015/16 14,217$
Alpine Energy Limited DPP Annual Compliance Statement 2016
Page 21 of 34
avoided transmission charges resulting from purchase of transmission asset from
Transpower
Distributed generation allowance
Claw-back
NPV Wash-up Allowance
Energy efficiency and demand-side management incentive
Catastrophic event allowance
Extended reserves allowance
Quality incentive adjustment
Capex wash-up adjustment
Reconsideration event allowance.
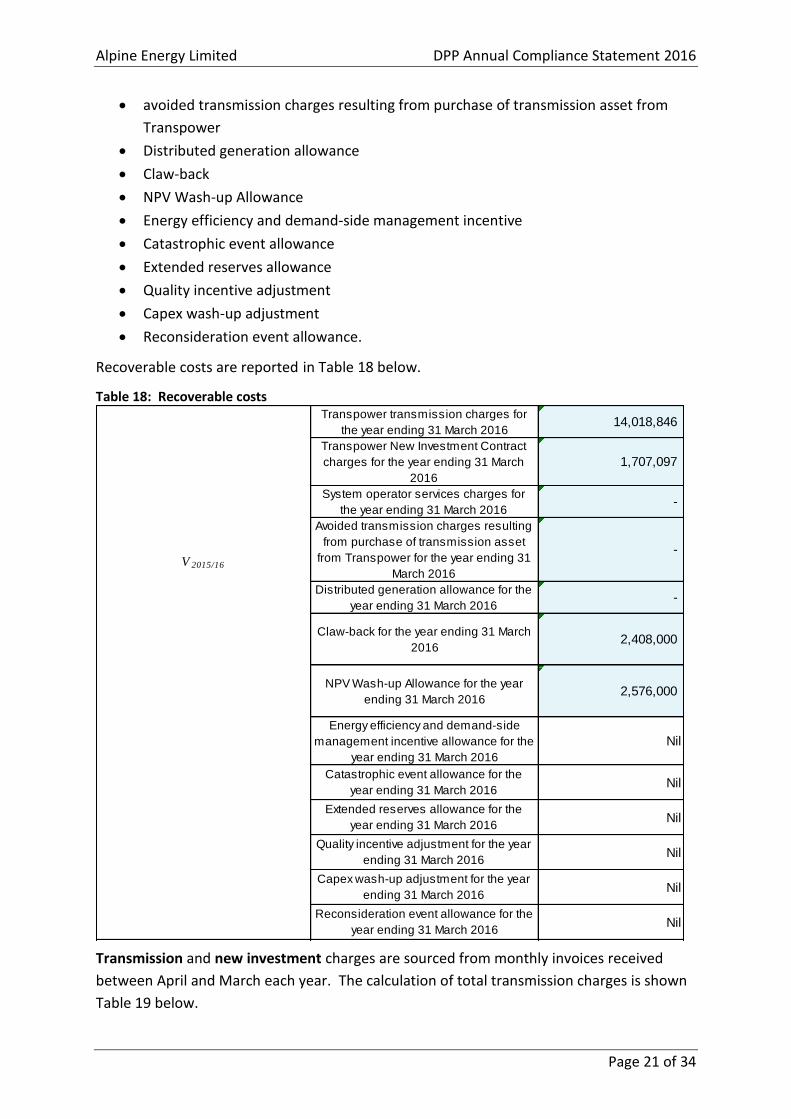
Recoverable costs are reported in Table 18 below.
Table 18: Recoverable costs
Transmission and new investment charges are sourced from monthly invoices received
between April and March each year. The calculation of total transmission charges is shown
Table 19 below.
Transpower transmission charges for
the year ending 31 March 2016 14,018,846
Transpower New Investment Contract
charges for the year ending 31 March
2016
1,707,097
System operator services charges for
the year ending 31 March 2016-
Avoided transmission charges resulting
from purchase of transmission asset
from Transpower for the year ending 31
March 2016
-
Distributed generation allowance for the
year ending 31 March 2016-
Claw-back for the year ending 31 March
2016 2,408,000
NPV Wash-up Allowance for the year
ending 31 March 2016 2,576,000
Energy efficiency and demand-side
management incentive allowance for the
year ending 31 March 2016
Nil
Catastrophic event allowance for the
year ending 31 March 2016Nil
Extended reserves allowance for the
year ending 31 March 2016Nil
Quality incentive adjustment for the year
ending 31 March 2016Nil
Capex wash-up adjustment for the year
ending 31 March 2016Nil
Reconsideration event allowance for the
year ending 31 March 2016Nil
V 2015/16
Alpine Energy Limited DPP Annual Compliance Statement 2016
Page 22 of 34
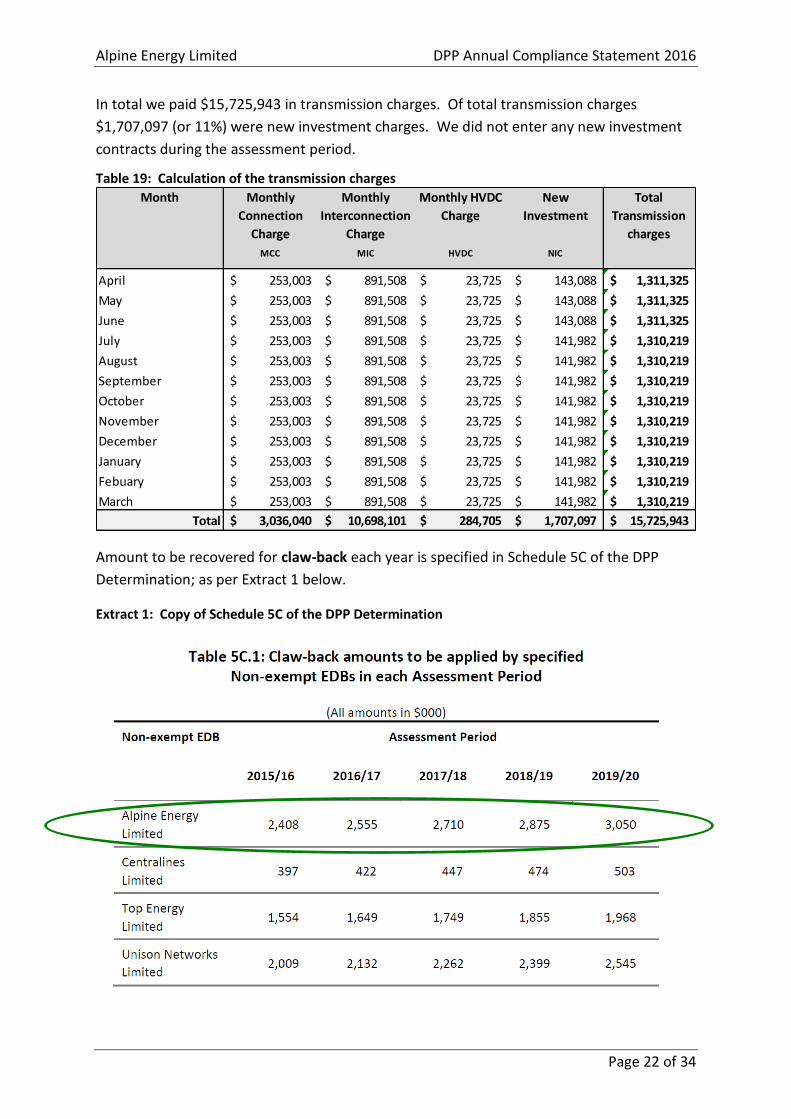
In total we paid $15,725,943 in transmission charges. Of total transmission charges
$1,707,097 (or 11%) were new investment charges. We did not enter any new investment
contracts during the assessment period.
Table 19: Calculation of the transmission charges
Amount to be recovered for claw-back each year is specified in Schedule 5C of the DPP
Determination; as per Extract 1 below.
Extract 1: Copy of Schedule 5C of the DPP Determination
Month Monthly
Connection
Charge
Monthly
Interconnection
Charge
Monthly HVDC
Charge
New
Investment
MCC MIC HVDC NIC
April 253,003$ 891,508$ 23,725$ 143,088$ 1,311,325$
May 253,003$ 891,508$ 23,725$ 143,088$ 1,311,325$
June 253,003$ 891,508$ 23,725$ 143,088$ 1,311,325$
July 253,003$ 891,508$ 23,725$ 141,982$ 1,310,219$
August 253,003$ 891,508$ 23,725$ 141,982$ 1,310,219$
September 253,003$ 891,508$ 23,725$ 141,982$ 1,310,219$
October 253,003$ 891,508$ 23,725$ 141,982$ 1,310,219$
November 253,003$ 891,508$ 23,725$ 141,982$ 1,310,219$
December 253,003$ 891,508$ 23,725$ 141,982$ 1,310,219$
January 253,003$ 891,508$ 23,725$ 141,982$ 1,310,219$
Febuary 253,003$ 891,508$ 23,725$ 141,982$ 1,310,219$
March 253,003$ 891,508$ 23,725$ 141,982$ 1,310,219$
Total 3,036,040$ 10,698,101$ 284,705$ 1,707,097$ 15,725,943$
Total
Transmission
charges
Alpine Energy Limited DPP Annual Compliance Statement 2016
Page 23 of 34
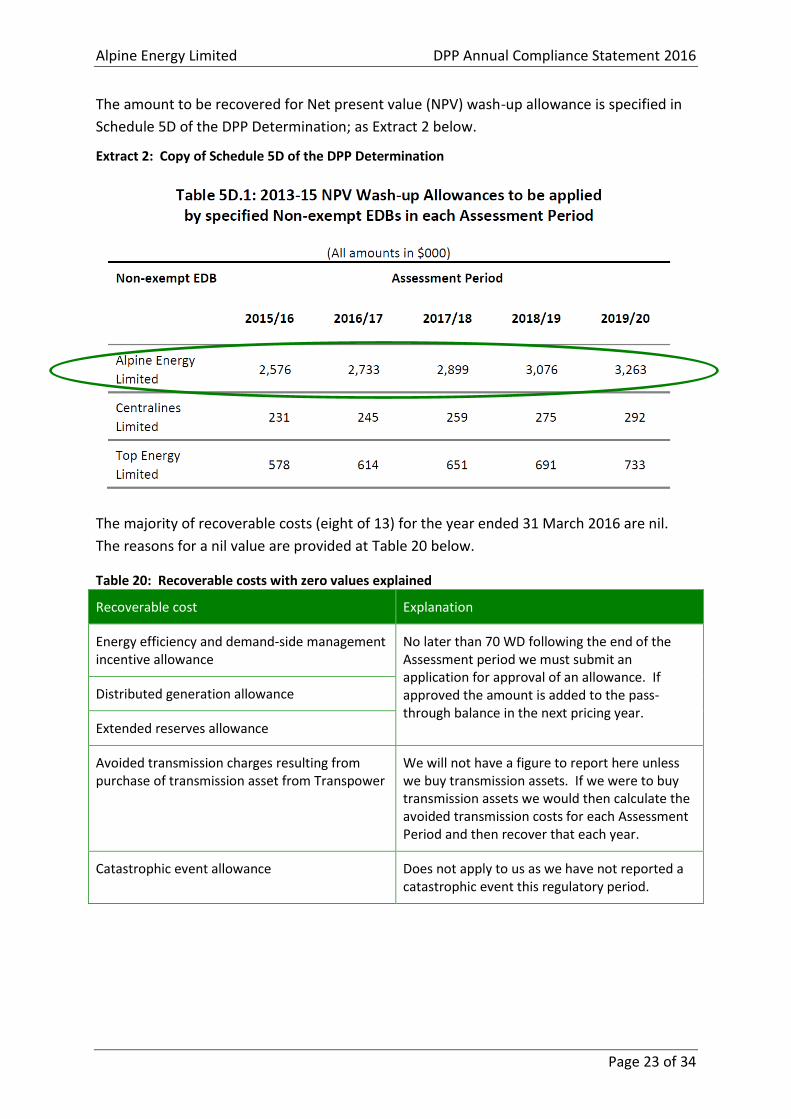
The amount to be recovered for Net present value (NPV) wash-up allowance is specified in
Schedule 5D of the DPP Determination; as Extract 2 below.
Extract 2: Copy of Schedule 5D of the DPP Determination
The majority of recoverable costs (eight of 13) for the year ended 31 March 2016 are nil.
The reasons for a nil value are provided at Table 20 below.
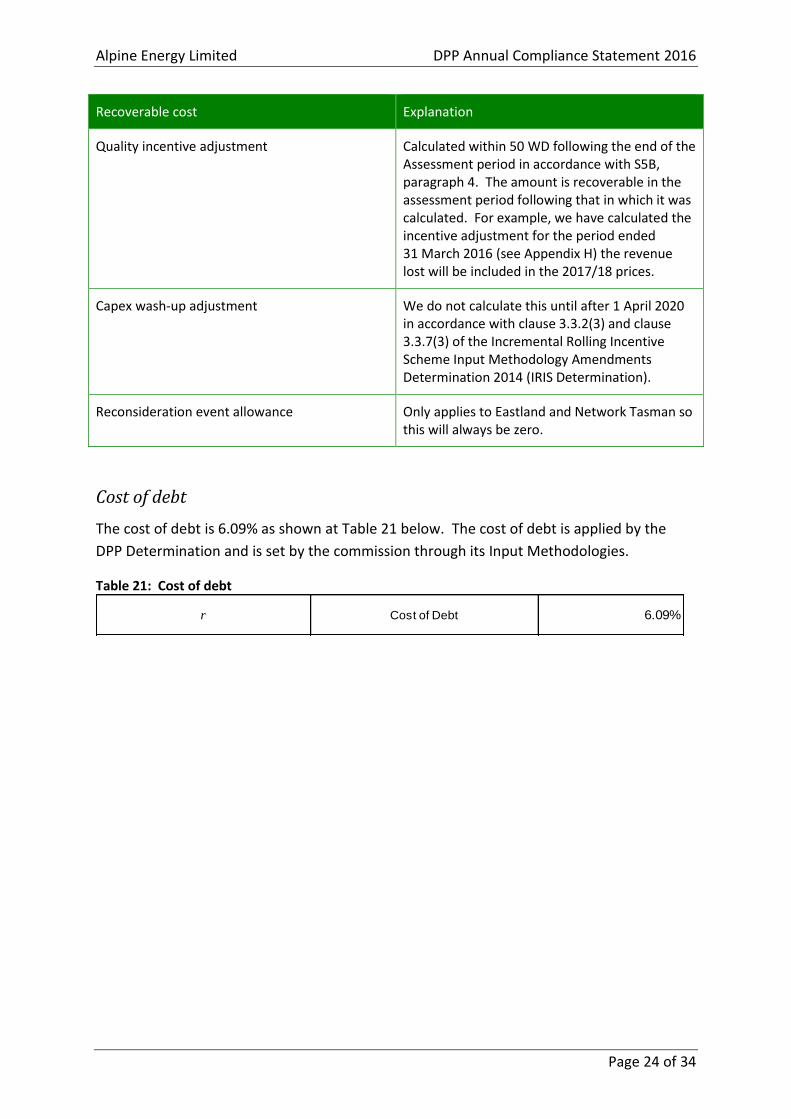
Table 20: Recoverable costs with zero values explained
Recoverable cost Explanation
Energy efficiency and demand-side management incentive allowance
No later than 70 WD following the end of the Assessment period we must submit an application for approval of an allowance. If approved the amount is added to the pass-through balance in the next pricing year.
Distributed generation allowance
Extended reserves allowance
Avoided transmission charges resulting from purchase of transmission asset from Transpower
We will not have a figure to report here unless we buy transmission assets. If we were to buy transmission assets we would then calculate the avoided transmission costs for each Assessment Period and then recover that each year.
Catastrophic event allowance Does not apply to us as we have not reported a catastrophic event this regulatory period.
Alpine Energy Limited DPP Annual Compliance Statement 2016
Page 24 of 34
Recoverable cost Explanation
Quality incentive adjustment Calculated within 50 WD following the end of the Assessment period in accordance with S5B, paragraph 4. The amount is recoverable in the assessment period following that in which it was calculated. For example, we have calculated the incentive adjustment for the period ended 31 March 2016 (see Appendix H) the revenue lost will be included in the 2017/18 prices.
Capex wash-up adjustment We do not calculate this until after 1 April 2020 in accordance with clause 3.3.2(3) and clause 3.3.7(3) of the Incremental Rolling Incentive Scheme Input Methodology Amendments Determination 2014 (IRIS Determination).
Reconsideration event allowance Only applies to Eastland and Network Tasman so this will always be zero.
Cost of debt
The cost of debt is 6.09% as shown at Table 21 below. The cost of debt is applied by the
DPP Determination and is set by the commission through its Input Methodologies.
Table 21: Cost of debt
r Cost of Debt 6.09%
Alpine Energy Limited DPP Compliance Statement 2016
Page 25 of 34
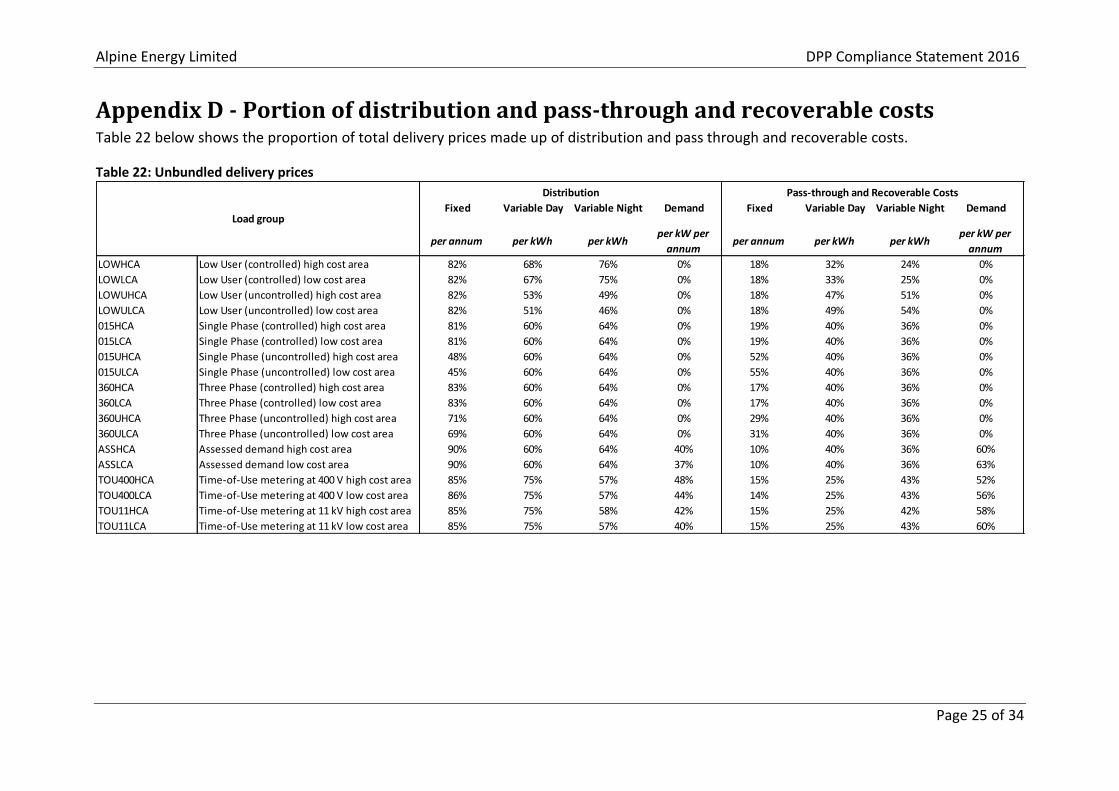
Appendix D - Portion of distribution and pass-through and recoverable costs Table 22 below shows the proportion of total delivery prices made up of distribution and pass through and recoverable costs.
Table 22: Unbundled delivery prices
Fixed Variable Day Variable Night Demand Fixed Variable Day Variable Night Demand
per annum per kWh per kWhper kW per
annumper annum per kWh per kWh
per kW per
annum
LOWHCA Low User (controlled) high cost area 82% 68% 76% 0% 18% 32% 24% 0%
LOWLCA Low User (controlled) low cost area 82% 67% 75% 0% 18% 33% 25% 0%
LOWUHCA Low User (uncontrolled) high cost area 82% 53% 49% 0% 18% 47% 51% 0%
LOWULCA Low User (uncontrolled) low cost area 82% 51% 46% 0% 18% 49% 54% 0%
015HCA Single Phase (controlled) high cost area 81% 60% 64% 0% 19% 40% 36% 0%
015LCA Single Phase (controlled) low cost area 81% 60% 64% 0% 19% 40% 36% 0%
015UHCA Single Phase (uncontrolled) high cost area 48% 60% 64% 0% 52% 40% 36% 0%
015ULCA Single Phase (uncontrolled) low cost area 45% 60% 64% 0% 55% 40% 36% 0%
360HCA Three Phase (controlled) high cost area 83% 60% 64% 0% 17% 40% 36% 0%
360LCA Three Phase (controlled) low cost area 83% 60% 64% 0% 17% 40% 36% 0%
360UHCA Three Phase (uncontrolled) high cost area 71% 60% 64% 0% 29% 40% 36% 0%
360ULCA Three Phase (uncontrolled) low cost area 69% 60% 64% 0% 31% 40% 36% 0%
ASSHCA Assessed demand high cost area 90% 60% 64% 40% 10% 40% 36% 60%
ASSLCA Assessed demand low cost area 90% 60% 64% 37% 10% 40% 36% 63%
TOU400HCA Time-of-Use metering at 400 V high cost area 85% 75% 57% 48% 15% 25% 43% 52%
TOU400LCA Time-of-Use metering at 400 V low cost area 86% 75% 57% 44% 14% 25% 43% 56%
TOU11HCA Time-of-Use metering at 11 kV high cost area 85% 75% 58% 42% 15% 25% 42% 58%
TOU11LCA Time-of-Use metering at 11 kV low cost area 85% 75% 57% 40% 15% 25% 43% 60%
Load group
Distribution Pass-through and Recoverable Costs
Alpine Energy Limited DPP Annual Compliance Statement 2016
Page 26 of 34
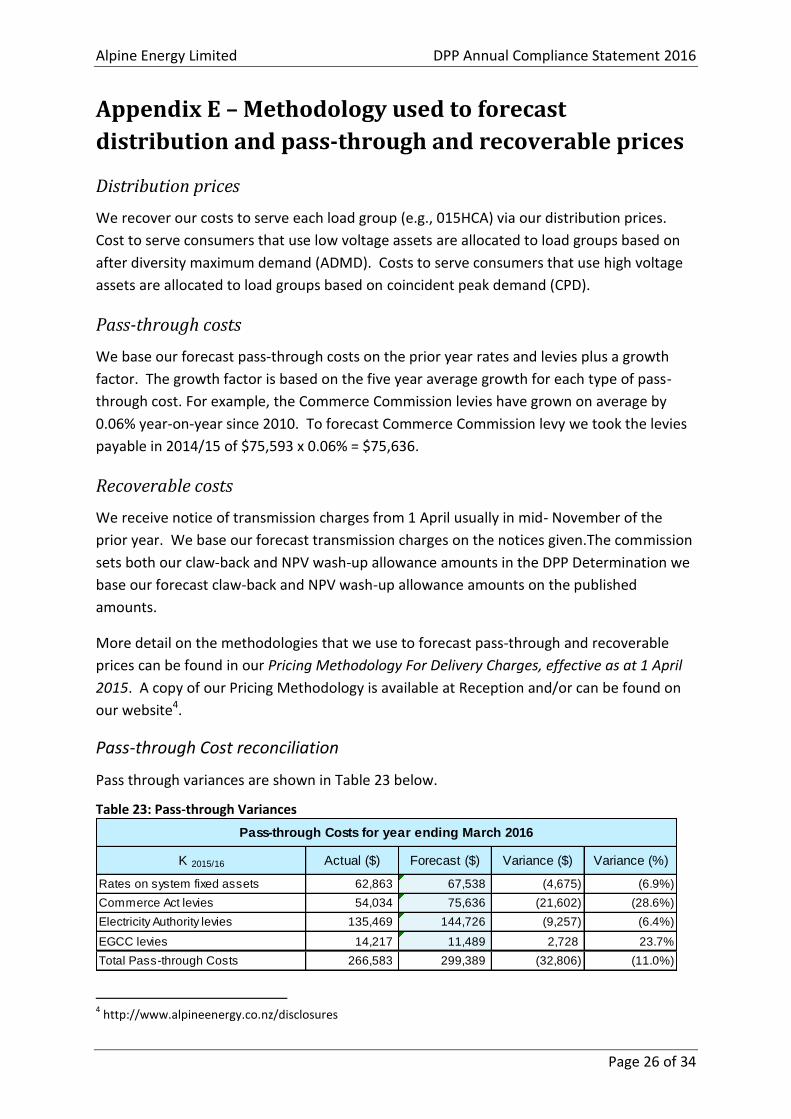
Appendix E – Methodology used to forecast
distribution and pass-through and recoverable prices
Distribution prices
We recover our costs to serve each load group (e.g., 015HCA) via our distribution prices.
Cost to serve consumers that use low voltage assets are allocated to load groups based on
after diversity maximum demand (ADMD). Costs to serve consumers that use high voltage
assets are allocated to load groups based on coincident peak demand (CPD).
Pass-through costs
We base our forecast pass-through costs on the prior year rates and levies plus a growth
factor. The growth factor is based on the five year average growth for each type of pass-
through cost. For example, the Commerce Commission levies have grown on average by
0.06% year-on-year since 2010. To forecast Commerce Commission levy we took the levies
payable in 2014/15 of $75,593 x 0.06% = $75,636.
Recoverable costs
We receive notice of transmission charges from 1 April usually in mid- November of the
prior year. We base our forecast transmission charges on the notices given.The commission
sets both our claw-back and NPV wash-up allowance amounts in the DPP Determination we
base our forecast claw-back and NPV wash-up allowance amounts on the published
amounts.
More detail on the methodologies that we use to forecast pass-through and recoverable
prices can be found in our Pricing Methodology For Delivery Charges, effective as at 1 April
2015. A copy of our Pricing Methodology is available at Reception and/or can be found on
our website4.
Pass-through Cost reconciliation
Pass through variances are shown in Table 23 below.
Table 23: Pass-through Variances
4 http://www.alpineenergy.co.nz/disclosures
K 2015/16 Actual ($) Forecast ($) Variance ($) Variance (%)
Rates on system fixed assets 62,863 67,538 (4,675) (6.9%)
Commerce Act levies 54,034 75,636 (21,602) (28.6%)
Electricity Authority levies 135,469 144,726 (9,257) (6.4%)
EGCC levies 14,217 11,489 2,728 23.7%
Total Pass-through Costs 266,583 299,389 (32,806) (11.0%)
Pass-through Costs for year ending March 2016
Alpine Energy Limited DPP Annual Compliance Statement 2016
Page 27 of 34
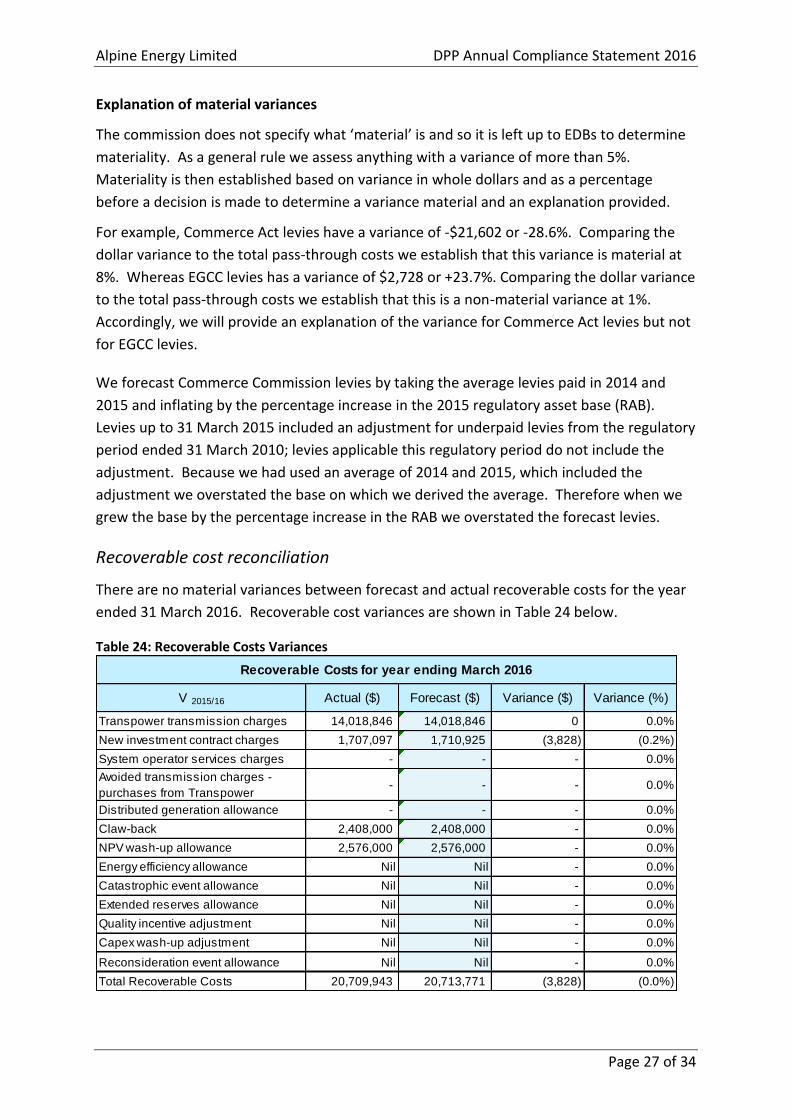
Explanation of material variances
The commission does not specify what ‘material’ is and so it is left up to EDBs to determine
materiality. As a general rule we assess anything with a variance of more than 5%.
Materiality is then established based on variance in whole dollars and as a percentage
before a decision is made to determine a variance material and an explanation provided.
For example, Commerce Act levies have a variance of -$21,602 or -28.6%. Comparing the
dollar variance to the total pass-through costs we establish that this variance is material at
8%. Whereas EGCC levies has a variance of $2,728 or +23.7%. Comparing the dollar variance
to the total pass-through costs we establish that this is a non-material variance at 1%.
Accordingly, we will provide an explanation of the variance for Commerce Act levies but not
for EGCC levies.
We forecast Commerce Commission levies by taking the average levies paid in 2014 and
2015 and inflating by the percentage increase in the 2015 regulatory asset base (RAB).
Levies up to 31 March 2015 included an adjustment for underpaid levies from the regulatory
period ended 31 March 2010; levies applicable this regulatory period do not include the
adjustment. Because we had used an average of 2014 and 2015, which included the
adjustment we overstated the base on which we derived the average. Therefore when we
grew the base by the percentage increase in the RAB we overstated the forecast levies.
Recoverable cost reconciliation
There are no material variances between forecast and actual recoverable costs for the year
ended 31 March 2016. Recoverable cost variances are shown in Table 24 below.
Table 24: Recoverable Costs Variances
V 2015/16 Actual ($) Forecast ($) Variance ($) Variance (%)
Transpower transmission charges 14,018,846 14,018,846 0 0.0%
New investment contract charges 1,707,097 1,710,925 (3,828) (0.2%)
System operator services charges - - - 0.0%
Avoided transmission charges -
purchases from Transpower- - - 0.0%
Distributed generation allowance - - - 0.0%
Claw-back 2,408,000 2,408,000 - 0.0%
NPV wash-up allowance 2,576,000 2,576,000 - 0.0%
Energy efficiency allowance Nil Nil - 0.0%
Catastrophic event allowance Nil Nil - 0.0%
Extended reserves allowance Nil Nil - 0.0%
Quality incentive adjustment Nil Nil - 0.0%
Capex wash-up adjustment Nil Nil - 0.0%
Reconsideration event allowance Nil Nil - 0.0%
Total Recoverable Costs 20,709,943 20,713,771 (3,828) (0.0%)
Recoverable Costs for year ending March 2016
Alpine Energy Limited DPP Annual Compliance Statement 2016
Page 28 of 34
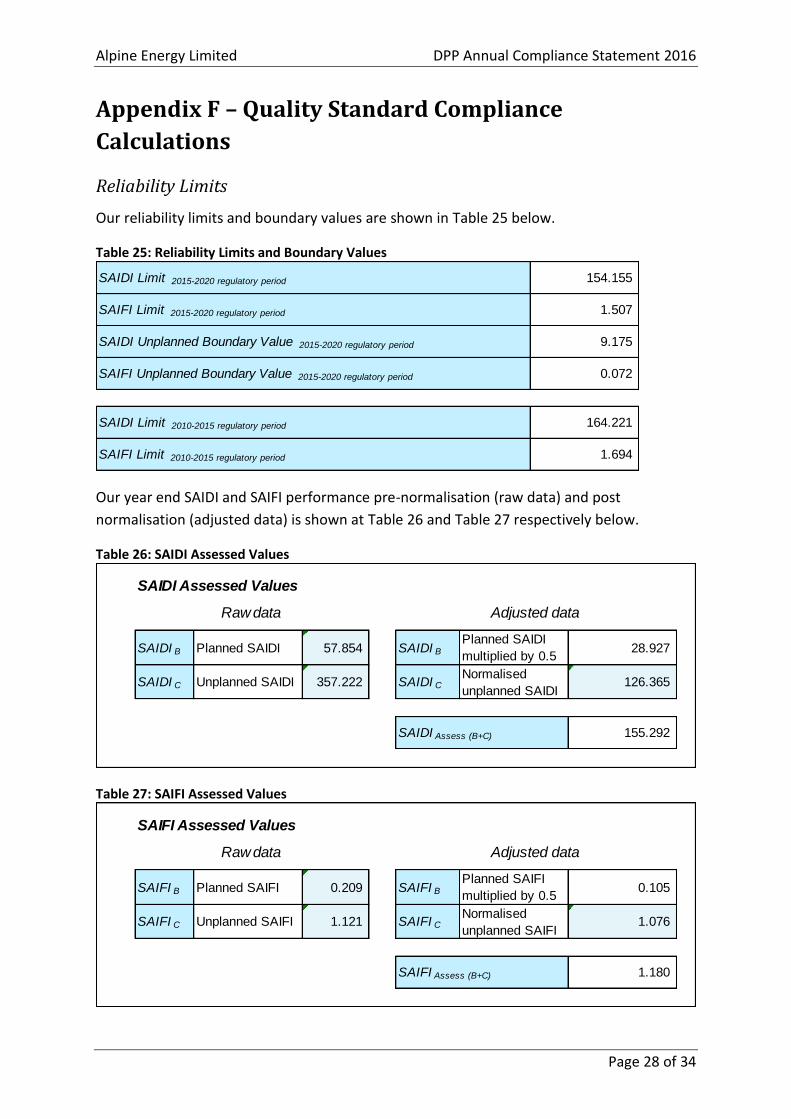
Appendix F – Quality Standard Compliance
Calculations
Reliability Limits
Our reliability limits and boundary values are shown in Table 25 below.
Table 25: Reliability Limits and Boundary Values
Our year end SAIDI and SAIFI performance pre-normalisation (raw data) and post
normalisation (adjusted data) is shown at Table 26 and Table 27 respectively below.
Table 26: SAIDI Assessed Values
Table 27: SAIFI Assessed Values
154.155
1.507
9.175
0.072
164.221
1.694
SAIDI Limit 2015-2020 regulatory period
SAIFI Limit 2015-2020 regulatory period
SAIDI Unplanned Boundary Value 2015-2020 regulatory period
SAIFI Unplanned Boundary Value 2015-2020 regulatory period
SAIDI Limit 2010-2015 regulatory period
SAIFI Limit 2010-2015 regulatory period
SAIDI Assessed Values
SAIDI B Planned SAIDI 57.854 SAIDI B
Planned SAIDI
multiplied by 0.5 28.927
SAIDI C Unplanned SAIDI 357.222 SAIDI CNormalised
unplanned SAIDI 126.365
155.292
Raw data Adjusted data
SAIDI Assess (B+C)
SAIFI Assessed Values
SAIFI B Planned SAIFI 0.209 SAIFI B
Planned SAIFI
multiplied by 0.5 0.105
SAIFI C Unplanned SAIFI 1.121 SAIFI CNormalised
unplanned SAIFI 1.076
1.180
Raw data Adjusted data
SAIFI Assess (B+C)
Alpine Energy Limited DPP Annual Compliance Statement 2016
Page 29 of 34
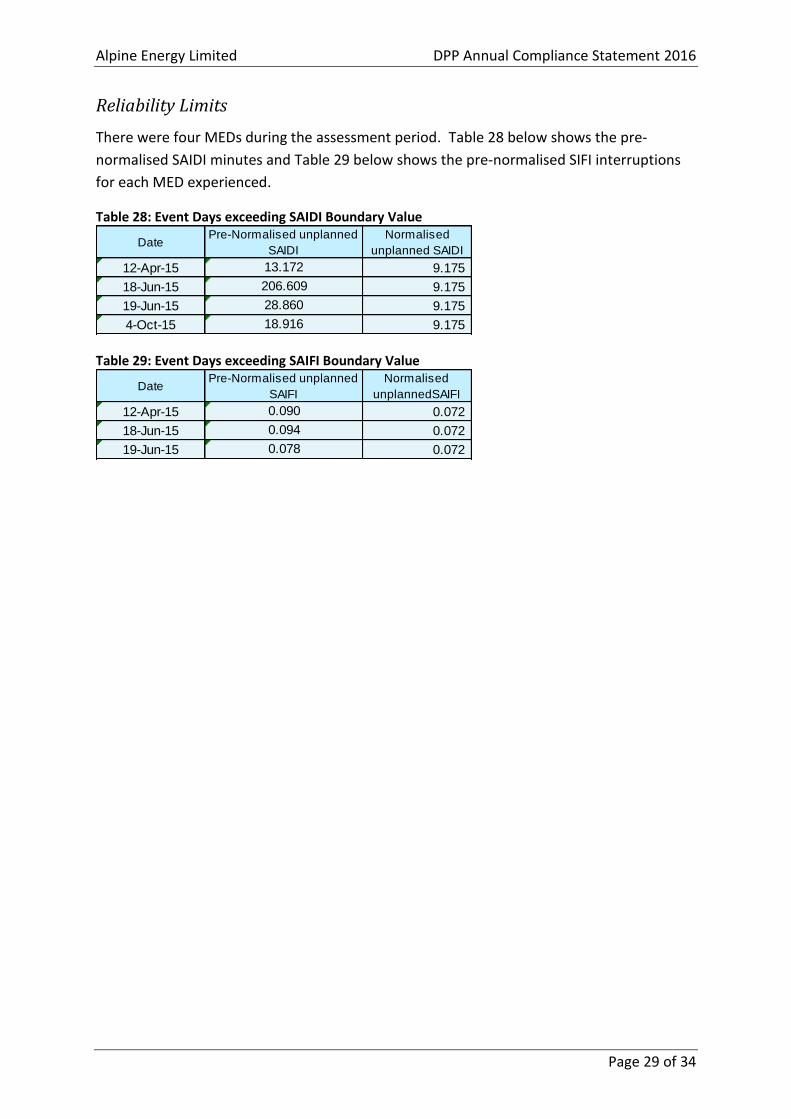
Reliability Limits
There were four MEDs during the assessment period. Table 28 below shows the pre-
normalised SAIDI minutes and Table 29 below shows the pre-normalised SIFI interruptions
for each MED experienced.
Table 28: Event Days exceeding SAIDI Boundary Value
Table 29: Event Days exceeding SAIFI Boundary Value
DateNormalised
unplanned SAIDI
12-Apr-15 9.175
18-Jun-15 9.175
19-Jun-15 9.175
4-Oct-15 9.175
Pre-Normalised unplanned
SAIDI
13.172
206.609
28.860
18.916
DateNormalised
unplannedSAIFI
12-Apr-15 0.072
18-Jun-15 0.072
19-Jun-15 0.072 0.078
Pre-Normalised unplanned
SAIFI
0.094
0.090
Alpine Energy Limited DPP Annual Compliance Statement 2016
Page 30 of 34
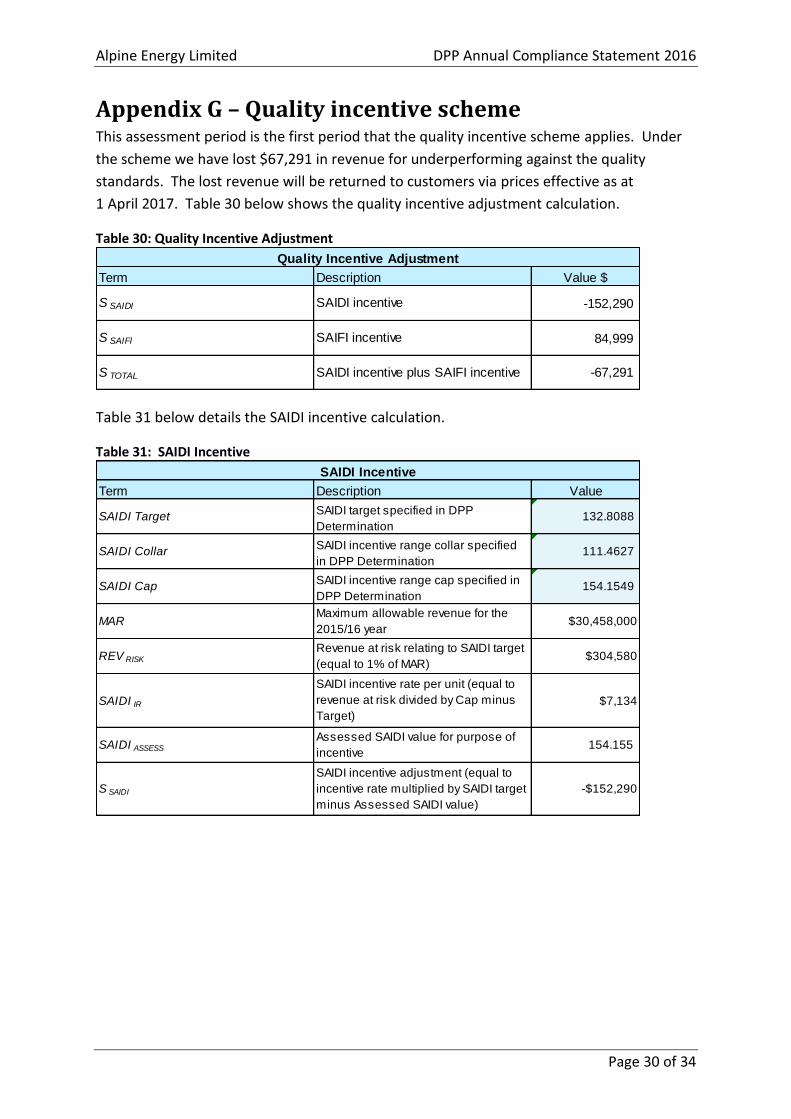
Appendix G – Quality incentive scheme This assessment period is the first period that the quality incentive scheme applies. Under
the scheme we have lost $67,291 in revenue for underperforming against the quality
standards. The lost revenue will be returned to customers via prices effective as at
1 April 2017. Table 30 below shows the quality incentive adjustment calculation.
Table 30: Quality Incentive Adjustment
Table 31 below details the SAIDI incentive calculation.
Table 31: SAIDI Incentive
Value $
-152,290
84,999
-67,291
Quality Incentive Adjustment
Term Description
S SAIFI SAIFI incentive
S SAIDI SAIDI incentive
S TOTAL SAIDI incentive plus SAIFI incentive
Value
132.8088
SAIDI Collar 111.4627
154.1549
$30,458,000
$304,580
SAIDI IR $7,134
SAIDI ASSESS 154.155
-$152,290
SAIDI Target
SAIDI Cap
SAIDI target specified in DPP
Determination
SAIDI incentive range collar specified
in DPP Determination
SAIDI incentive range cap specified in
DPP Determination
S SAIDI
SAIDI incentive adjustment (equal to
incentive rate multiplied by SAIDI target
minus Assessed SAIDI value)
Assessed SAIDI value for purpose of
incentive
SAIDI incentive rate per unit (equal to
revenue at risk divided by Cap minus
Target)
DescriptionTerm
SAIDI Incentive
REV RISK
Maximum allowable revenue for the
2015/16 year
Revenue at risk relating to SAIDI target
(equal to 1% of MAR)
MAR
Alpine Energy Limited DPP Annual Compliance Statement 2016
Page 31 of 34
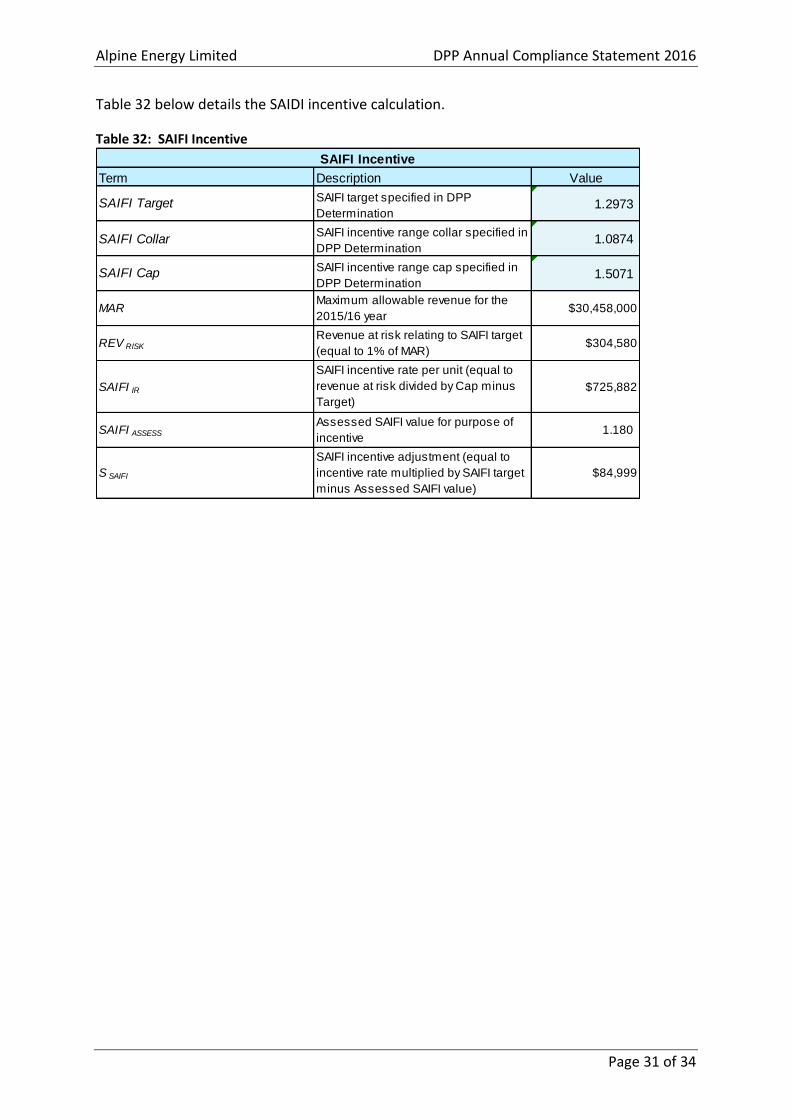
Table 32 below details the SAIDI incentive calculation.
Table 32: SAIFI Incentive
Value
1.2973
SAIFI Collar 1.0874
1.5071
$30,458,000
$304,580
SAIFI IR $725,882
SAIFI ASSESS 1.180
$84,999
SAIFI Cap
SAIFI target specified in DPP
Determination
SAIFI incentive range collar specified in
DPP Determination
SAIFI incentive range cap specified in
DPP Determination
SAIFI Incentive
Term Description
SAIFI Target
REV RISK
Revenue at risk relating to SAIFI target
(equal to 1% of MAR)
SAIFI incentive rate per unit (equal to
revenue at risk divided by Cap minus
Target)
S SAIFI
SAIFI incentive adjustment (equal to
incentive rate multiplied by SAIFI target
minus Assessed SAIFI value)
Assessed SAIFI value for purpose of
incentive
MARMaximum allowable revenue for the
2015/16 year
Alpine Energy Limited DPP Annual Compliance Statement 2016
Page 32 of 34
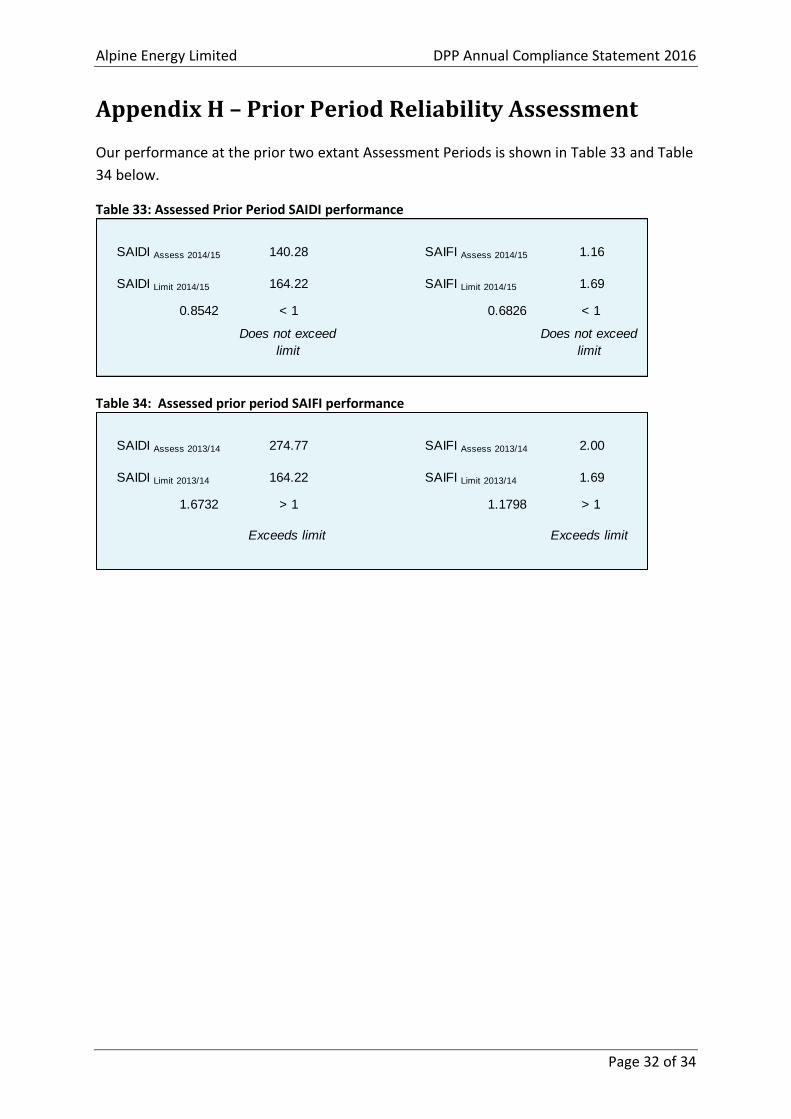
Appendix H – Prior Period Reliability Assessment
Our performance at the prior two extant Assessment Periods is shown in Table 33 and Table
34 below.
Table 33: Assessed Prior Period SAIDI performance
Table 34: Assessed prior period SAIFI performance
140.28 SAIFI Assess 2014/15 1.16
SAIDI Limit 2014/15 164.22 SAIFI Limit 2014/15 1.69
< 1 0.6826 < 1
Does not exceed
limit
Does not exceed
limit
SAIDI Assess 2014/15
0.8542
274.77 SAIFI Assess 2013/14 2.00
SAIDI Limit 2013/14 164.22 SAIFI Limit 2013/14 1.69
> 1 1.1798 > 1
Exceeds limit Exceeds limit
1.6732
SAIDI Assess 2013/14
Alpine Energy Limited DPP Annual Compliance Statement 2016
Page 33 of 34
Appendix I – Policies and Procedures for Recording
SAIDI and SAIFI
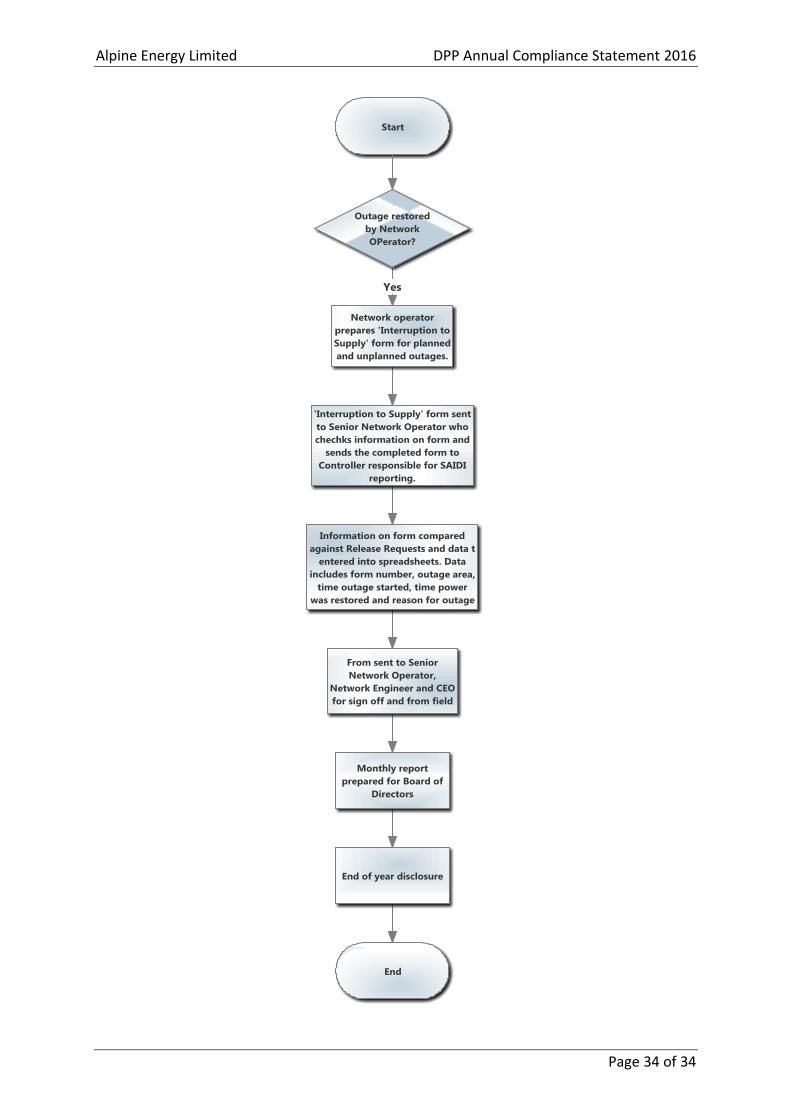
We apply the following policies and procedures to record our SAIDI and SAIFI:
all planned and unplanned outages 3.3kV and above are recorded
outages less than 1 minute are reported but do not affect SAIDI and SAIFI
outages are recorded on ‘Interruption to Supply’ forms by the Network Operator
the ICP database is interrogated for consumer numbers in the outage area
monthly reports are prepared for executive management and the Board.
Figure 1 over page outlines our process for recording outages.
Alpine Energy Limited DPP Annual Compliance Statement 2016
Page 34 of 34