deer management report and plan, game management unit 6
TRANSCRIPT
Species Management Report and Plan ADF&G/DWC/SMR&P–2018–41
Deer Management Report and Plan, Game Management Unit 6:
Report Period 1 July 2011–30 June 2016, and Plan Period 1 July 2016–30 June 2021
Charlotte L. Westing
2018 Alaska Department of Fish and Game Division of Wildlife Conservation

Species Management Report and Plan ADF&G/DWC/SMR&P-2018-41
Deer Management Report and Plan, Game Management Unit 6:
Report Period 1 July 2011–30 June 2016, and Plan Period 1 July 2016–30 June 2021
PREPARED BY: Charlotte L. Westing Wildlife Biologist III
APPROVED BY: Cynthia M. Wardlow Management Coordinator
REVIEWED BY: Laura A. McCarthy Publications Specialist II
©2018 Alaska Department of Fish and Game
Alaska Department of Fish and Game Division of Wildlife Conservation PO Box 115526 Juneau, AK 99811-5526
Funding for survey and inventory project 2.0 was provided through the Federal Aid in Wildlife Restoration grant program. Hunters are important founders of the modern wildlife conservation movement. They, along with trappers and sport shooters, provided funding for this publication through payment of federal taxes on firearms, ammunition, and archery equipment, and through state hunting license and tag fees.
Species management reports and plans provide information about species that are hunted or trapped and management actions, goals, recommendations for those species, and plans for data collection. Detailed information is prepared for each species every 5 years by the area management biologist for game management units in their areas, who also develops a plan for data collection and species management for the next 5 years. This type of report is not produced for species that are not managed for hunting or trapping or for areas where there is no current or anticipated activity. Unit reports are reviewed and approved for publication by regional management coordinators and are available to the public via the Alaska Department of Fish and Game’s website.
This species management report and plan was reviewed and approved for publication by Cynthia M. Wardlow, Management Coordinator for Region II for the Division of Wildlife Conservation, Anchorage.
Species management reports and plans are available via the Alaska Department of Fish and Game’s website (www.adfg.alaska.gov) or by contacting Alaska Department of Fish and Game, Division of Wildlife Conservation, PO Box 115526, Juneau, AK 99811-5526; phone: (907) 465-4190; email: [email protected]. The report may also be accessed through most libraries, via interlibrary loan from the Alaska State Library or the Alaska Resources Library and Information Services (www.arlis.org).
This document, published as a PDF only, should be cited as follows:
Westing, C. L. 2018. Deer management report and plan, Game Management Unit 6: Report period 1 July 2011–30 June 2016 and plan period 1 July 2016–30 June 2021. Alaska Department of Fish and Game, Species Management Report and Plan ADF&G/DWC/SMR&P-2018-41, Juneau.
The State of Alaska is an Affirmative Action/Equal Opportunity Employer. Contact the Division of Wildlife Conservation at (907) 465-4190 for alternative formats of this publication.
ADF&G does not endorse or recommend any specific company or their products. Product names used in this publication are included for completeness but do not constitute product endorsement.
Species Management Report and Plan ADF&G/DWC/SMR&P-2018-41 i
Contents Purpose of this Report ..................................................................................................................... 1 I. RY11–RY15 Management Report .............................................................................................. 1 Management Area ........................................................................................................................... 1 Summary of Status, Trend, Management Activities, and History of Deer in Unit 6 ...................... 1 Management Direction.................................................................................................................... 3
Existing Wildlife Management Plans ......................................................................................... 3 Goals ........................................................................................................................................... 3 Codified Objectives .................................................................................................................... 3
Amounts Reasonably Necessary for Subsistence Uses .......................................................... 3 Intensive Management ............................................................................................................ 3
Management Objectives.............................................................................................................. 3 Management Activities ............................................................................................................... 4
1. Population Status and Trend ............................................................................................... 4 2. Mortality–Harvest Monitoring and Regulations ............................................................... 13 3. Habitat Assessment–Enhancement ................................................................................... 19
Nonregulatory Management Problems or Needs ...................................................................... 19 Data Recording and Archiving ............................................................................................. 19 Agreements ........................................................................................................................... 19 Permitting .............................................................................................................................. 19
Conclusions and Management Recommendations ....................................................................... 19 II. Project Review and RY16–RY20 Plan .................................................................................... 20 Review of Management Direction ................................................................................................ 20
Management Direction.............................................................................................................. 20 Goals ......................................................................................................................................... 20 Codified Objectives .................................................................................................................. 20
Amounts Reasonably Necessary for Subsistence Uses ........................................................ 20 Intensive Management .......................................................................................................... 20
Management Objectives............................................................................................................ 21 Review of Management Activities............................................................................................ 21
1. Population Status and Trend ............................................................................................. 21 2. Mortality–Harvest Monitoring .......................................................................................... 21 3. Habitat Assessment–Enhancement ................................................................................... 22
Nonregulatory Management Problems or Needs ...................................................................... 22 Data Recording and Archiving ............................................................................................. 22 Agreements ........................................................................................................................... 22 Permitting .............................................................................................................................. 23
Acknowledgments......................................................................................................................... 23 References Cited ........................................................................................................................... 23
ii Species Management Report and Plan ADF&G/DWC/SMR&P-2018-41
List of Figures Figure 1. Map showing Game Management Unit 6, Prince William Sound and North Gulf Coast,
Alaska. ........................................................................................................................................ 2
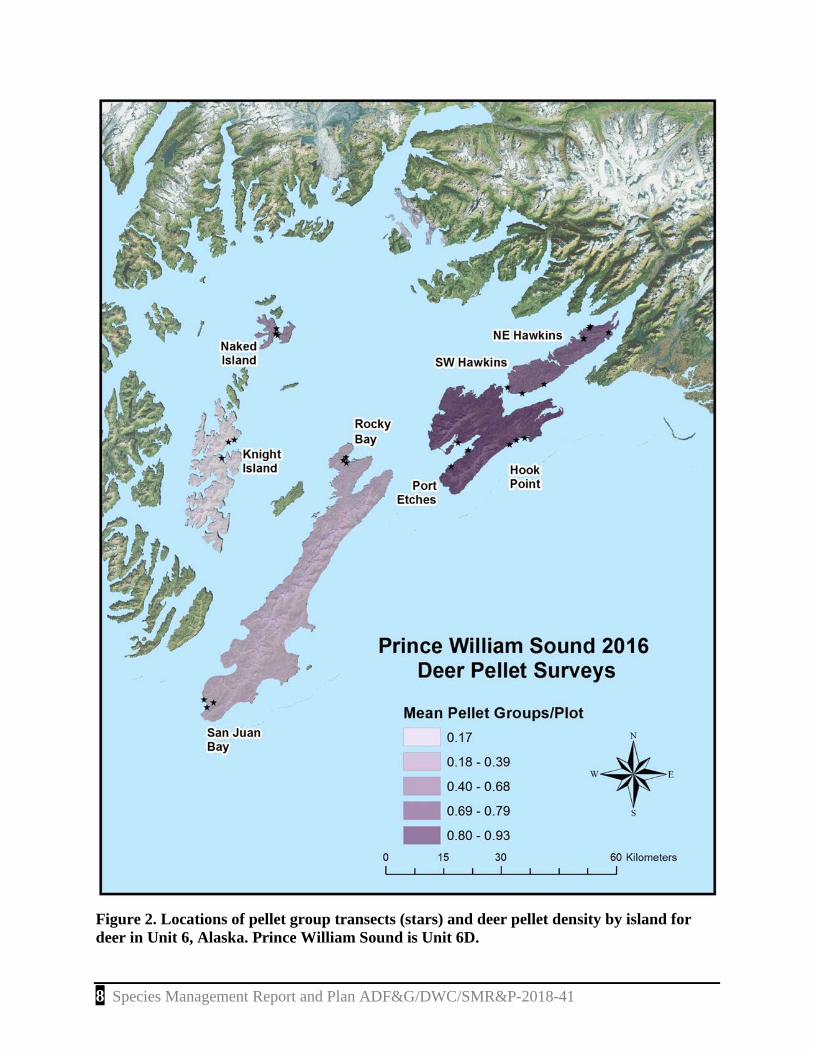
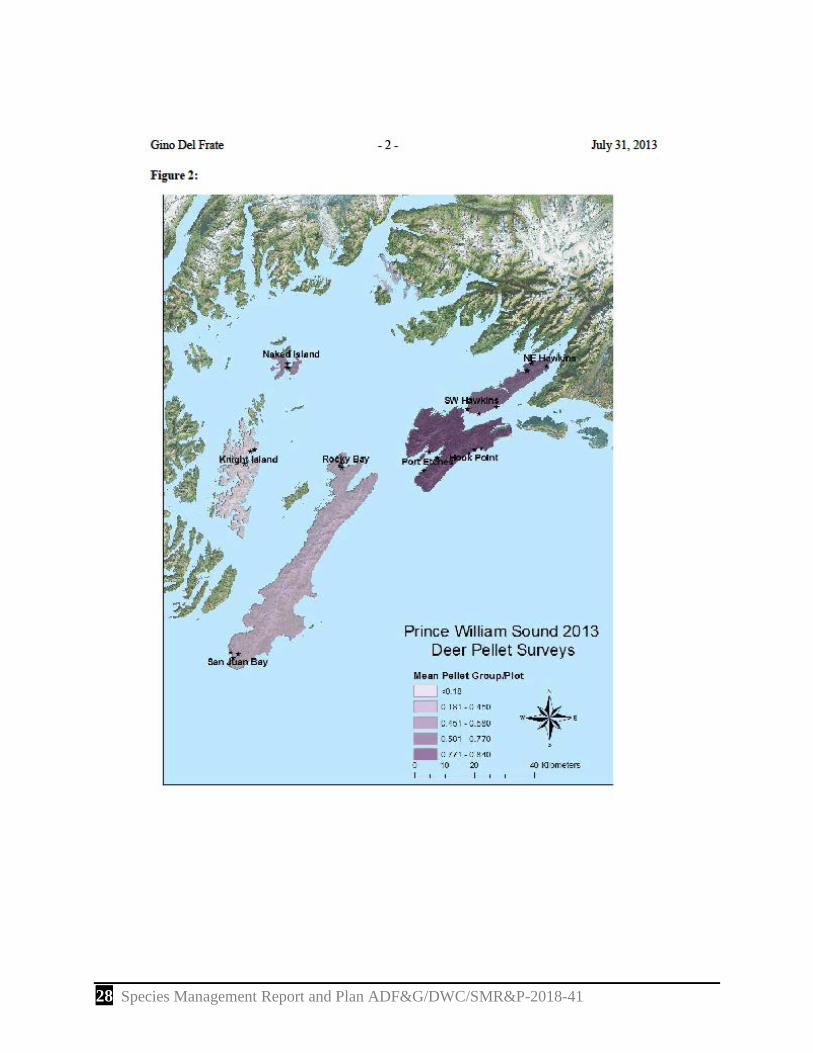
Figure 2. Locations of pellet group transects (stars) and deer pellet density by island for deer in Unit 6, Alaska. Prince William Sound is Unit 6D. ..................................................................... 8
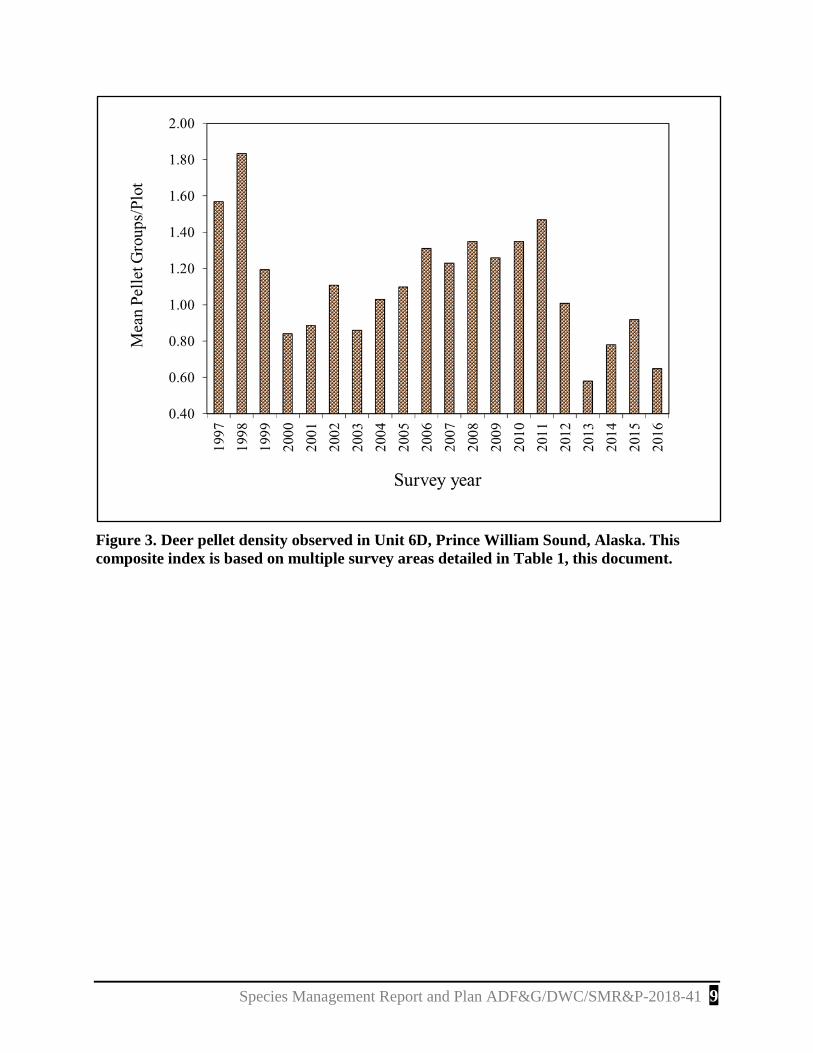
Figure 3. Deer pellet density observed in Unit 6D, Prince William Sound, Alaska. This composite index is based on multiple survey areas detailed in Table 1, this document. ............ 9
Figure 4. Average deer harvest estimates by hunt area in Unit 6D, Prince William Sound, Alaska, regulatory yearsa 2011–2015. ................................................................................................... 10
Figure 5. Weather data for Cordova as an index for weather in Prince William Sound, Alaska. 11
Figure 6. Estimated deer harvest by sex (percent male above bars) in Unit 6D, Prince William Sound, Alaska. Note gaps in regulatory yearsa (RY) prior to 1989. ......................................... 12
List of Tables Table 1. Unit 6D deer population trends as indicated by spring pellet-group surveys, Southcentral
Alaska, 2012–2016. .................................................................................................................... 6
Table 2. Unit 6 deer harvest, Southcentral Alaska, regulatory yearsa 2011–2015. ...................... 16
Table 3. Unit 6 deer hunter residency and success, Southcentral Alaska, regulatory yearsa 2011–2015. ......................................................................................................................................... 17
Table 4. Unit 6 deer harvest chronology percent by month, Southcentral Alaska, regulatory yearsa 2011–2015. ..................................................................................................................... 17
Table 5. Unit 6 deer harvest percent by transport method, Southcentral Alaska, regulatory yearsa 2011–2015. ............................................................................................................................... 18
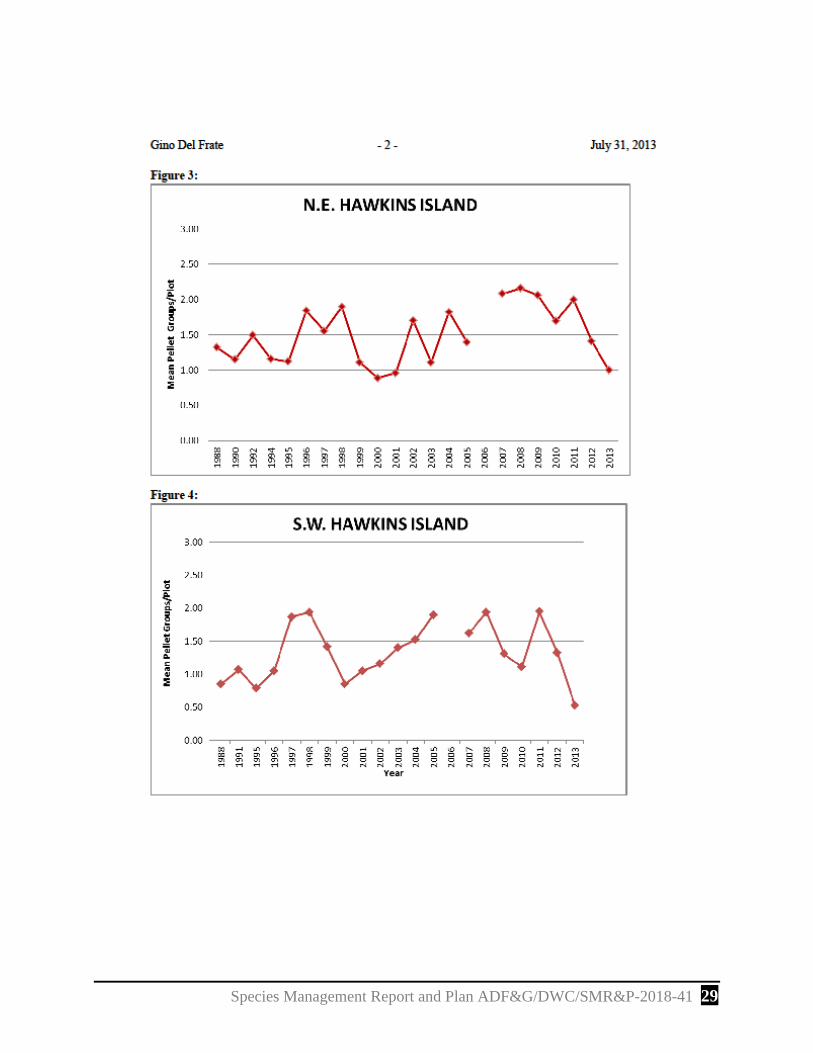
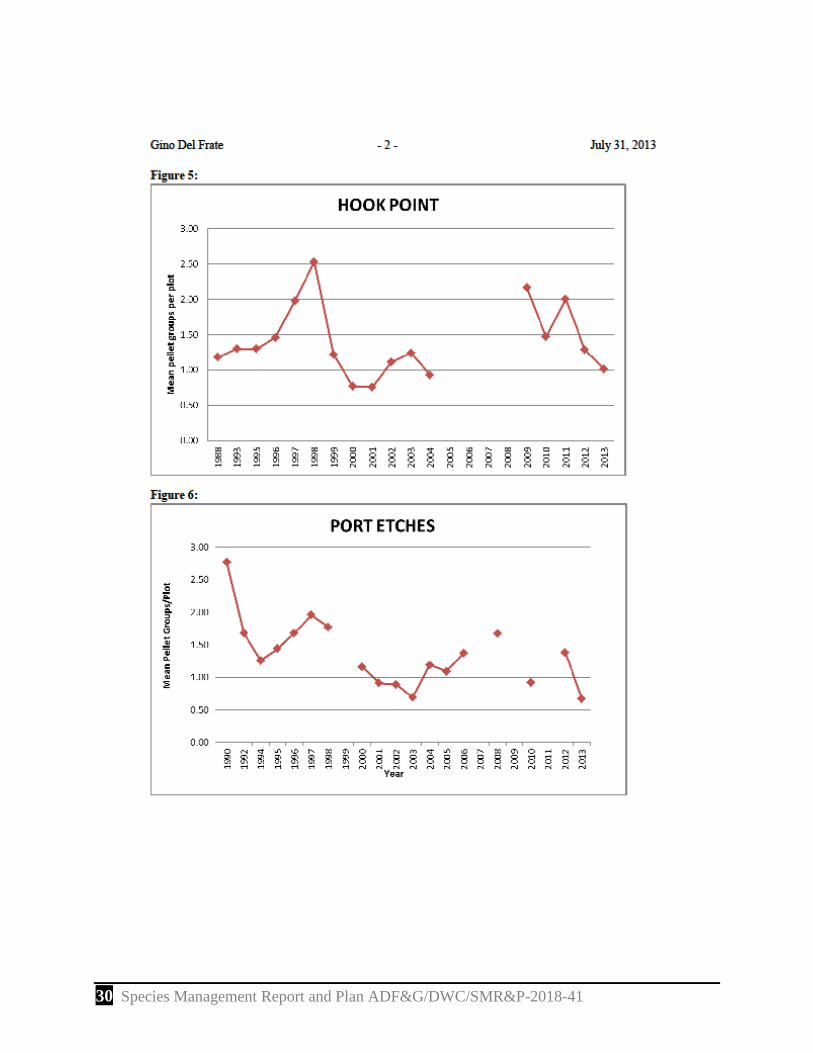
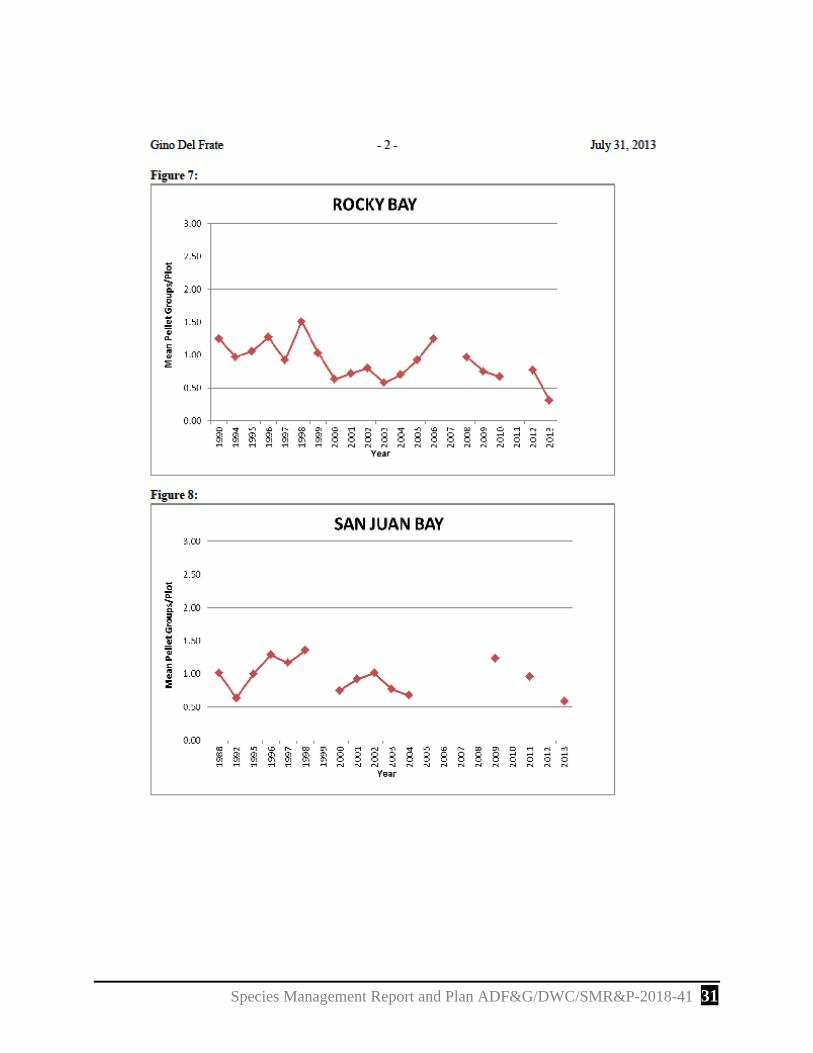
List of Appendices Appendix A. Survey memo for 2013 deer pellet surveys in Prince William Sound, Alaska. ...... 25
Appendix B. Survey memo for 2014 deer pellet surveys in Prince William Sound, Alaska. ...... 33
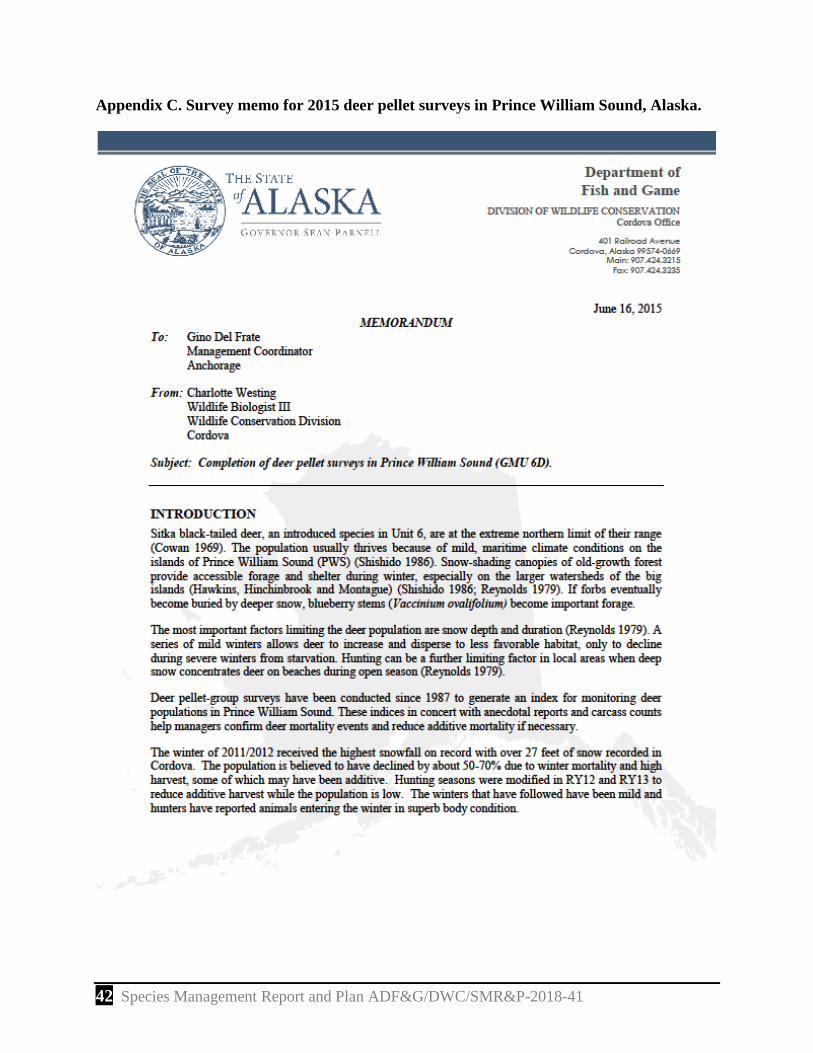
Appendix C. Survey memo for 2015 deer pellet surveys in Prince William Sound, Alaska. ...... 42
Appendix D. Survey memo for 2016 deer pellet surveys in Prince William Sound, Alaska. ...... 51
♦♦♦
Species Management Report and Plan ADF&G/DWC/SMR&P-2018-41 1
Purpose of this Report
This report provides a record of survey and inventory management activities for deer (Odocoileus hemionus sitkensis) in Unit 6 for the previous 5 regulatory years (RY11–RY15) and plans for survey and inventory management activities in the 5 years following the end of that period (RY16–RY20). A regulatory year (RY) begins 1 July and ends 30 June (e.g., RY10 = 1 July 2010–30 June 2011). This report is produced primarily to provide agency staff with data and analysis to help guide and record its own efforts but is also provided to the public to inform them of wildlife management activities. In 2016 the Alaska Department of Fish and Game’s (ADF&G) Division of Wildlife Conservation (DWC) launched this 5-year report to more efficiently report on trends and describe potential changes in data collection activities over the next 5 years. It replaces the deer management reports of survey and inventory activities that were previously produced every 2 years and supersedes the 1976 draft Alaska wildlife management plans (ADF&G 1976).
I. RY11–RY15 Management Report
Management Area
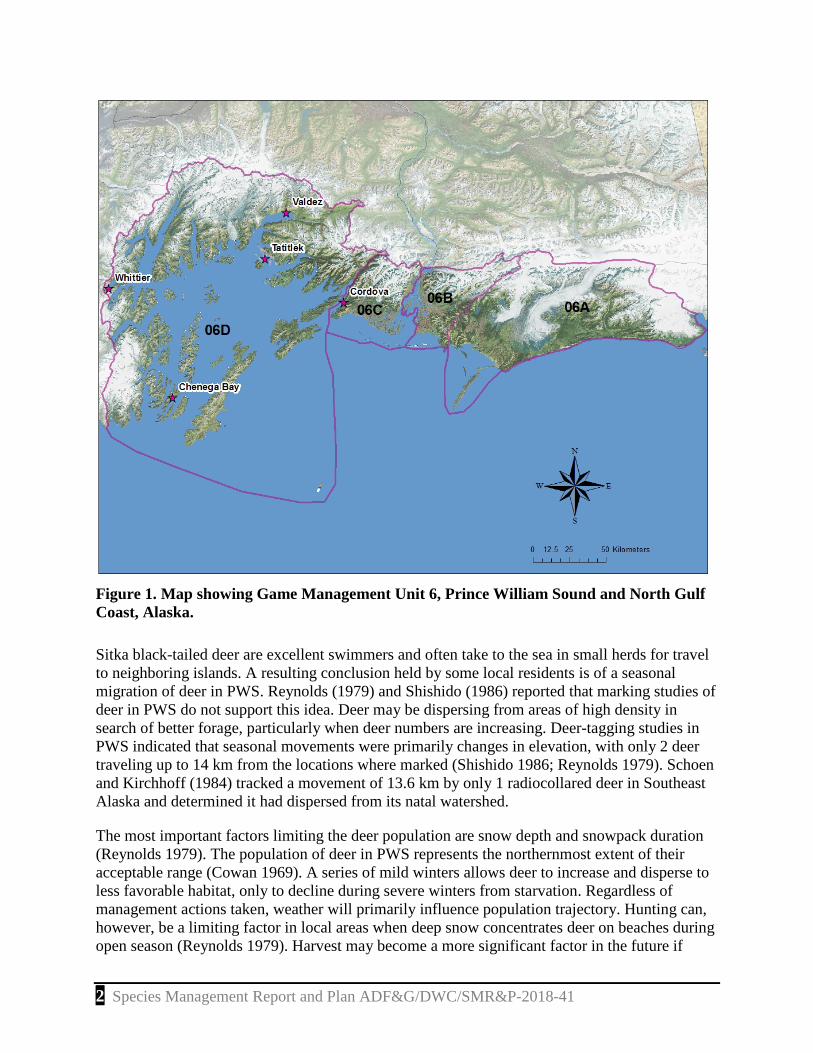
Game Management Unit 6 (10,140 mi2) is located in Prince William Sound (PWS) and North Gulf Coast, Alaska (Fig. 1).
Summary of Status, Trend, Management Activities, and History of Deer in Unit 6
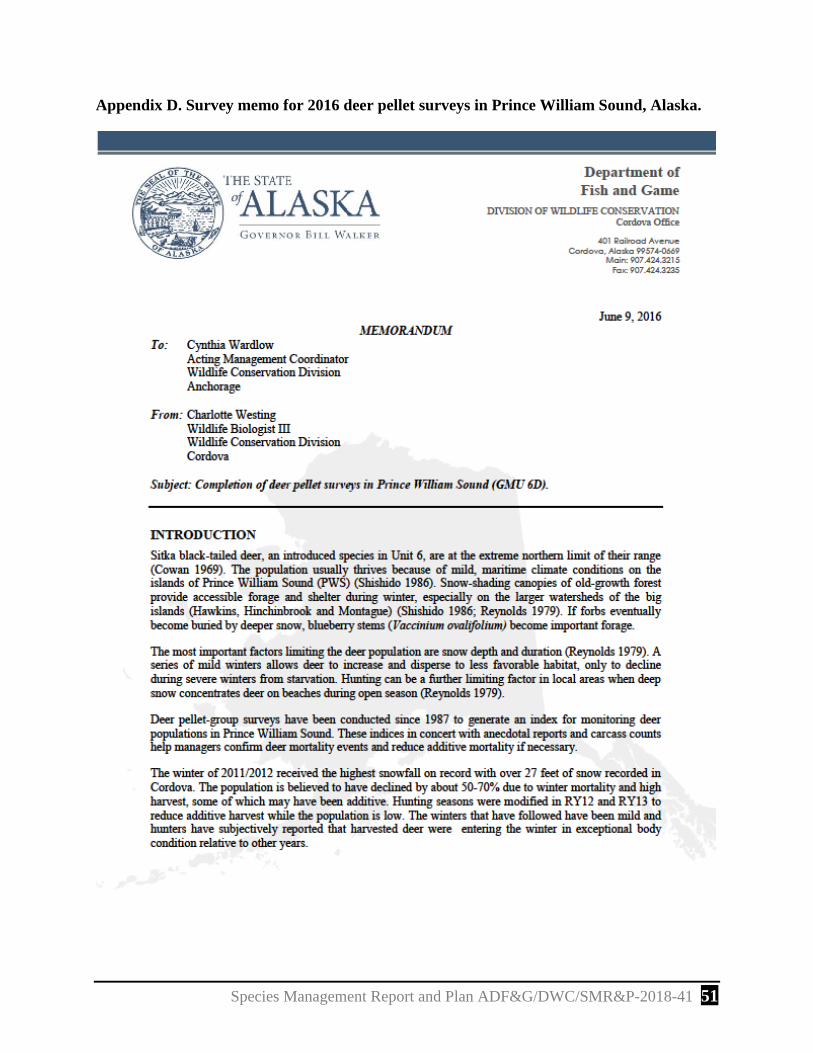
The Cordova Chamber of Commerce introduced Sitka black-tailed deer into Unit 6 between 1916 and 1923 (Paul 2009). At least 24 deer were released on Hawkins and Hinchinbrook islands in PWS. This was the first big game translocation in the state and was one of the most successful. Deer quickly occupied vacant habitat on most islands and adjacent mainland in PWS. Nearly the entire deer population occurs in Unit 6D. The population peaked in 1945, resulting in habitat damage and long-term reduction in carrying capacity (F. C. Robards, U.S. Fish and Wildlife Service, annual report game, fur and game fish, 1952, memorandum, Cordova). High winter mortality events occurred in the late 1940s, mid-1950s, late 1960s, early 1970s (Reynolds 1979), and late 1990s (Crowley 2001). Predation is minimal because there are few wolves and coyotes off the mainland and bears are believed to prey on them only opportunistically. Because nearly the entire population exists in Unit 6D, we focus all of our monitoring efforts there.
Sitka black-tailed deer in Unit 6 are at the extreme northern limit of their range (Cowan 1969). The population usually thrives because of mild, maritime climate conditions on islands in PWS (Shishido 1986). Snow-shading canopies of old-growth forest provide accessible forage and shelter during winter, especially on the larger watersheds of the big islands (Hawkins, Hinchinbrook, and Montague) (Shishido 1986; Reynolds 1979). If forbs eventually become buried by deeper snow, blueberry stems (Vaccinium ovalifolium) become important forage, as does kelp.
2 Species Management Report and Plan ADF&G/DWC/SMR&P-2018-41
Figure 1. Map showing Game Management Unit 6, Prince William Sound and North Gulf Coast, Alaska.
Sitka black-tailed deer are excellent swimmers and often take to the sea in small herds for travel to neighboring islands. A resulting conclusion held by some local residents is of a seasonal migration of deer in PWS. Reynolds (1979) and Shishido (1986) reported that marking studies of deer in PWS do not support this idea. Deer may be dispersing from areas of high density in search of better forage, particularly when deer numbers are increasing. Deer-tagging studies in PWS indicated that seasonal movements were primarily changes in elevation, with only 2 deer traveling up to 14 km from the locations where marked (Shishido 1986; Reynolds 1979). Schoen and Kirchhoff (1984) tracked a movement of 13.6 km by only 1 radiocollared deer in Southeast Alaska and determined it had dispersed from its natal watershed.
The most important factors limiting the deer population are snow depth and snowpack duration (Reynolds 1979). The population of deer in PWS represents the northernmost extent of their acceptable range (Cowan 1969). A series of mild winters allows deer to increase and disperse to less favorable habitat, only to decline during severe winters from starvation. Regardless of management actions taken, weather will primarily influence population trajectory. Hunting can, however, be a limiting factor in local areas when deep snow concentrates deer on beaches during open season (Reynolds 1979). Harvest may become a more significant factor in the future if
Species Management Report and Plan ADF&G/DWC/SMR&P-2018-41 3
numbers of hunters increase. However, weather will continue to constrain hunter access. ADF&G can and has adjusted season length for does or for any deer if needed to prevent additive harvest. The U.S. Forest Service (USFS) may follow state closures or they may adjust seasons and bag limits for federally qualified users on federal land or they may leave seasons only open to these users. These changes may be announced using emergency order authority in response to early and substantial snowfall that is likely to be persistent.
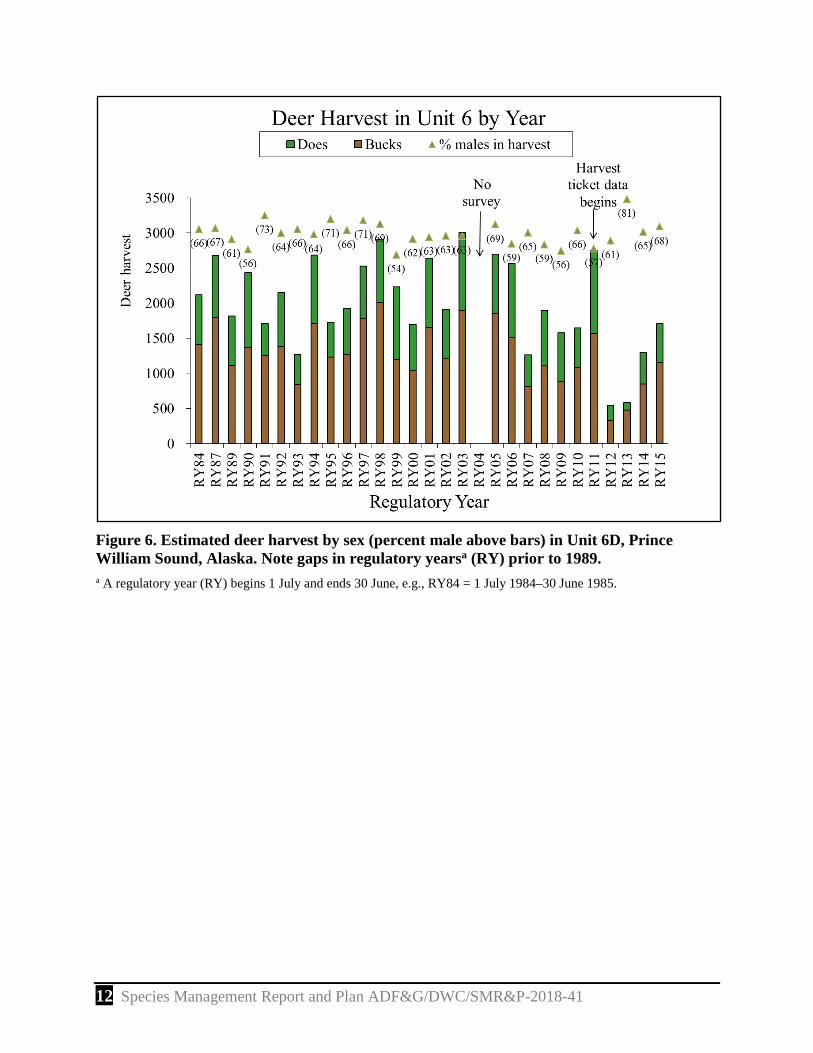
Legal deer hunting began in 1935. It was monitored from 1960 through 1979 by harvest reports and hunter contacts. Beginning in 1980, ADF&G collected most information through questionnaires mailed to deer harvest ticket holders. Annual harvests before 1978 probably ranged between 500 and 1,500 (Reynolds 1979). Harvests began to increase after 1978 and rose to 3,000 by 1987. The average estimated harvest during the 1990s was 2,160, ranging from 1,300 to 3,000 deer. The average estimated harvest during the 2000s was 2,460, ranging from 1,400 to 3,500 deer. In 2011, ADF&G began collecting deer harvest data within the harvest ticket system. Rather than sampling participants, gathering data from all individuals that acquired harvest tickets was pursued. Evaluation of this new system is ongoing.
Clear-cut logging of old-growth forest on private land in PWS was once the most important deer management concern in Unit 6 (Nowlin 1997). Currently there are no logging operations planned within important deer habitat. Intensive management objectives for population and harvest were set in 2001.
Management Direction
EXISTING WILDLIFE MANAGEMENT PLANS
None presently specific to deer. Direction in Southcentral Alaska management plan (ADF&G 1976) has been modified by Alaska Board of Game regulatory actions over the years.
GOALS
None in existing management report.
CODIFIED OBJECTIVES
Amounts Reasonably Necessary for Subsistence Uses
Deer unitwide: 1,000–1,250.
Intensive Management
Population objective: 24,000–28,000.
Harvest objective: 2,200–3,000.
MANAGEMENT OBJECTIVES
Current management objectives mirror legal objectives listed above.
4 Species Management Report and Plan ADF&G/DWC/SMR&P-2018-41
Additional objectives include:
Maintain at least 60% males in the harvest.
Maintain a minimum hunter success rate of 50%.
MANAGEMENT ACTIVITIES
Methods for data collection and results for all activities during RY09 are in Crowley (2011) and during RY10 and RY11 are in Westing (2015).
1. Population Status and TrendACTIVITY 1.1. Conduct deer pellet transects.
Data Needs Assess the general level of the population to attempt to understand if harvest is additive or compensatory. Deer pellets can give a general index of population level. Kirchhoff and Pitcher (1988) recommended the following classifications: <1.00 mean pellet groups/plot (MPGP) is a low-density population, 1.00–1.99 MPGP is a moderate density population, >2.00 MPGP is a high-density population. These densities were generated for Southeast Alaska and are not reasonable (have never been observed) in PWS. Deer are likely not as productive here with more rain and colder temperatures. Jenks natural breaks optimization was used to analyze the PWS deer pellet data into high, medium, and low categories. Based on these data, mean pellet groups per plot below 0.89 MPGP may indicate a low population, between 0.89 and 1.35 MPGP may indicate a medium population, and above 1.35 MPGP may indicate that the population is high.
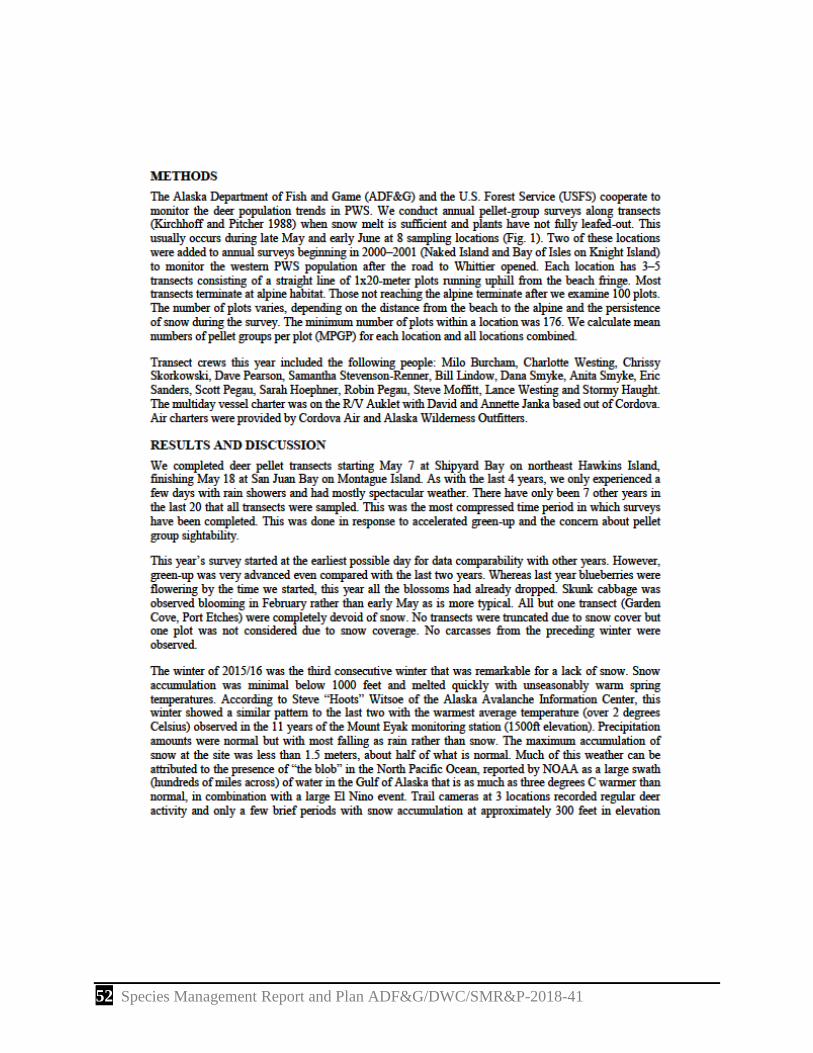
Methods ADF&G and USFS cooperate to monitor the population trend in PWS. We conduct annual pellet group surveys along transects (Kirchhoff and Pitcher 1988) during late May and early June at 8 sampling locations (Fig. 2). Each location has 3–5 transects consisting of a straight line of 1×20 meter plots running uphill from the beach fringe along a compass heading. Most transects terminate at alpine habitat. Those not reaching alpine habitat terminate after we examine 100 plots. The number of plots varies, depending on the distance from the beach to the alpine and the persistence of snow during the survey. The minimum number of plots within a location was 164. The number of plots completed in each area depends on the amount of persistent snow. Transects are terminated when snow cover approaches 100% for the remainder of the transect. We calculate MPGP for each location but combine all locations for an average MPGP for informing unitwide inferences on deer abundance.
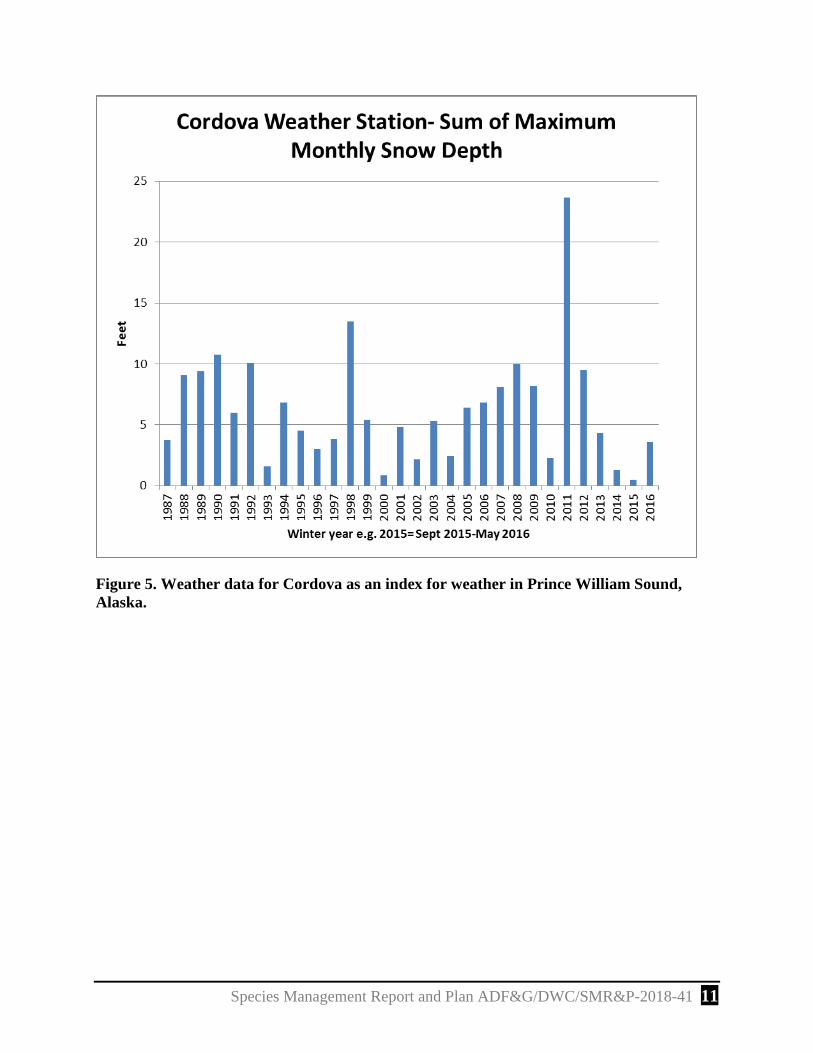
Results and Discussion Deer density indices in PWS, based on MPGP, were variable during the reporting period (Figs. 2 and 3; Table 1; Appendices A, B, C, and D). Deer numbers appear to have declined due to the winter of RY11, which was the most severe winter on record in terms of total snowfall and snow retention, particularly in western PWS (Figs. 4–6). These results correspond with anecdotal reports that estimated a 50–70% decline in the population. The first survey to detect the magnitude of this decline was in 2013 (RY12, Appendix A) because during the RY11 season, pellets were deposited by deer that later died. Since 2013, MPGP increased each year until the 2016 survey (Appendices B, C, and D). The decline in pellets between 2015 and 2016 may have
Species Management Report and Plan ADF&G/DWC/SMR&P-2018-41 5
been related to warmer than average temperatures and precipitation that predominantly fell as rain. We do not believe that this truly reflects the abundance of deer.
A few additional factors may have affected the observability of pellet groups. In most winters, snow influences the distribution of deer and concentrates them in lower elevations where pellet transects focus. However, with so little snow accumulation, this concentration may not have occurred at all. Additionally, since snowmelt and green-up were so early in 2016, an additional month of pellet deposition was missed compared with years prior to 2014. Observers were especially careful to part vegetation and look closely for pellets underneath, however, conditions were not ideal and pellet groups were undoubtedly missed. The influence of these factors on the overall number of pellet groups observed is unknown.
One factor that is somewhat understood is the impact of moisture on pellet persistence. One study that examined the persistence of black-tailed deer fecal pellets in coastal habitats found that moisture significantly reduced the persistence of pellets (Harestad and Bunnell 1987). In fact, moisture was the most important factor influencing pellet degradation. In addition, pellet degradation was accelerated in the summer months which may be from the confounding variables of temperature and summer diet.
With so much of our precipitation falling as rain instead of snow (which may preserve pellets), increased rates of pellet degradation may help explain why deer pellet densities do not seem to reflect the population trend. Additionally, with plants leafing out so soon, deer pellets may have transitioned earlier to feces that reflect their summer diet and are formed more as patties. Hard pellets are more durable against moisture than patties with dissolve into smudges. Many of these apparent smudges were observed this year.
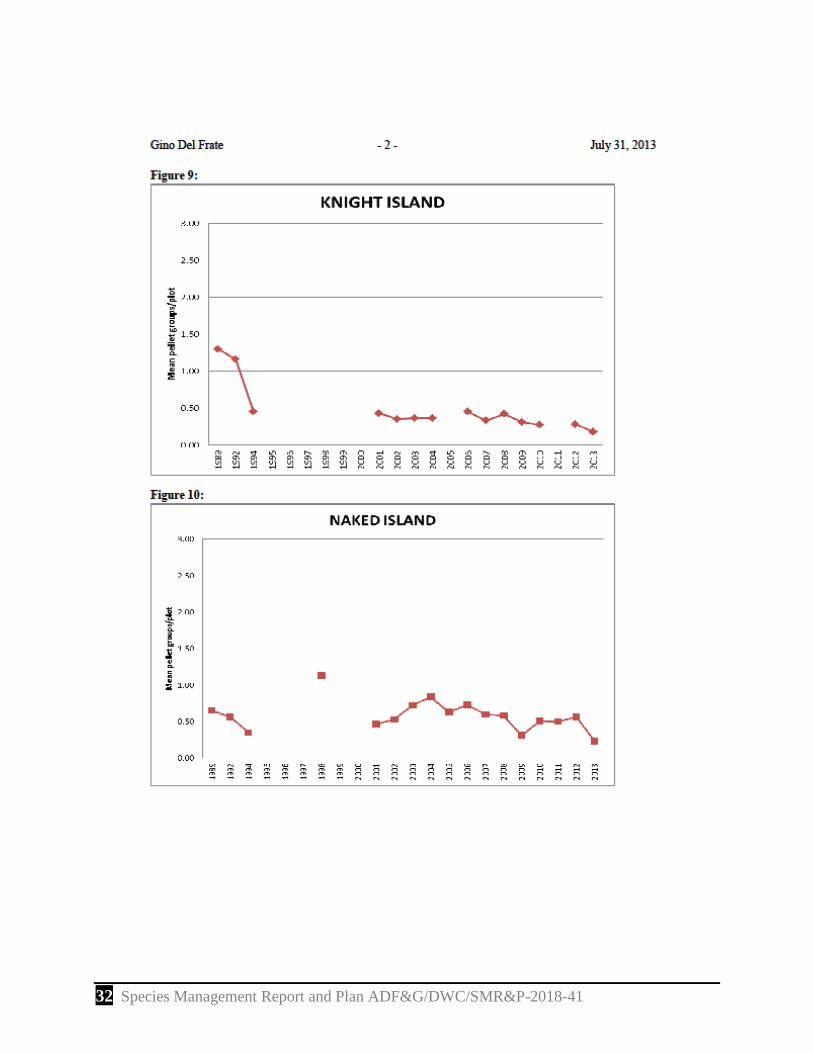
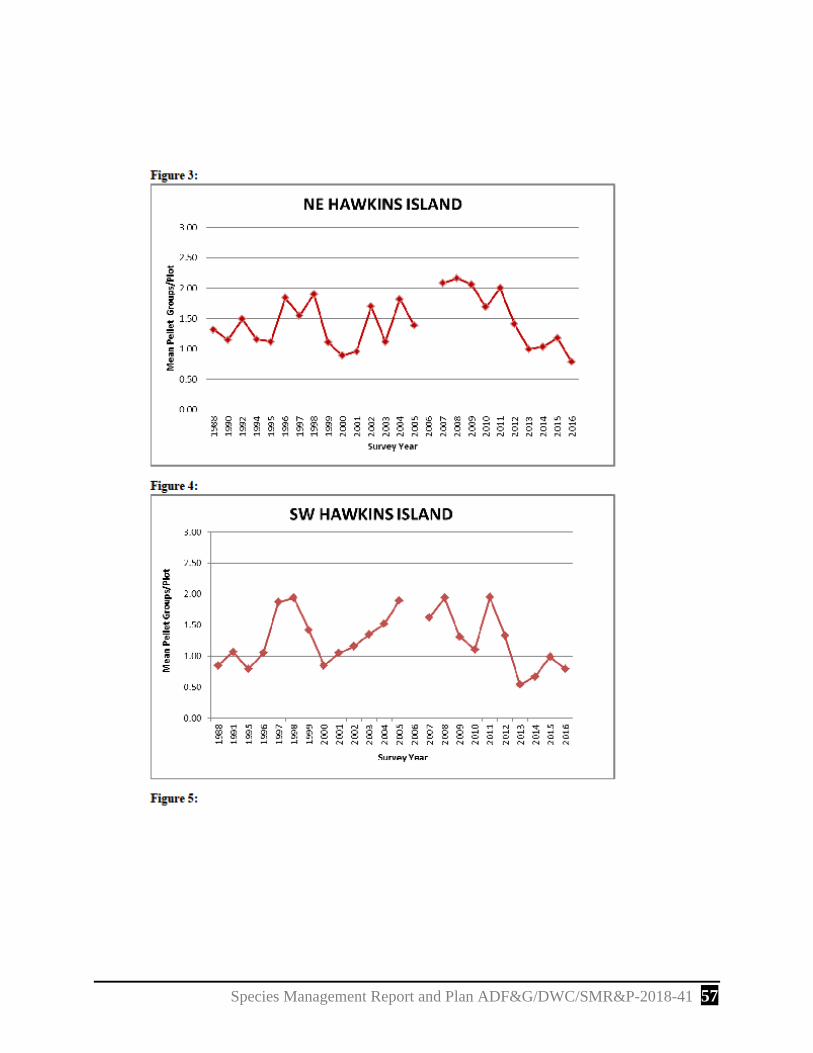
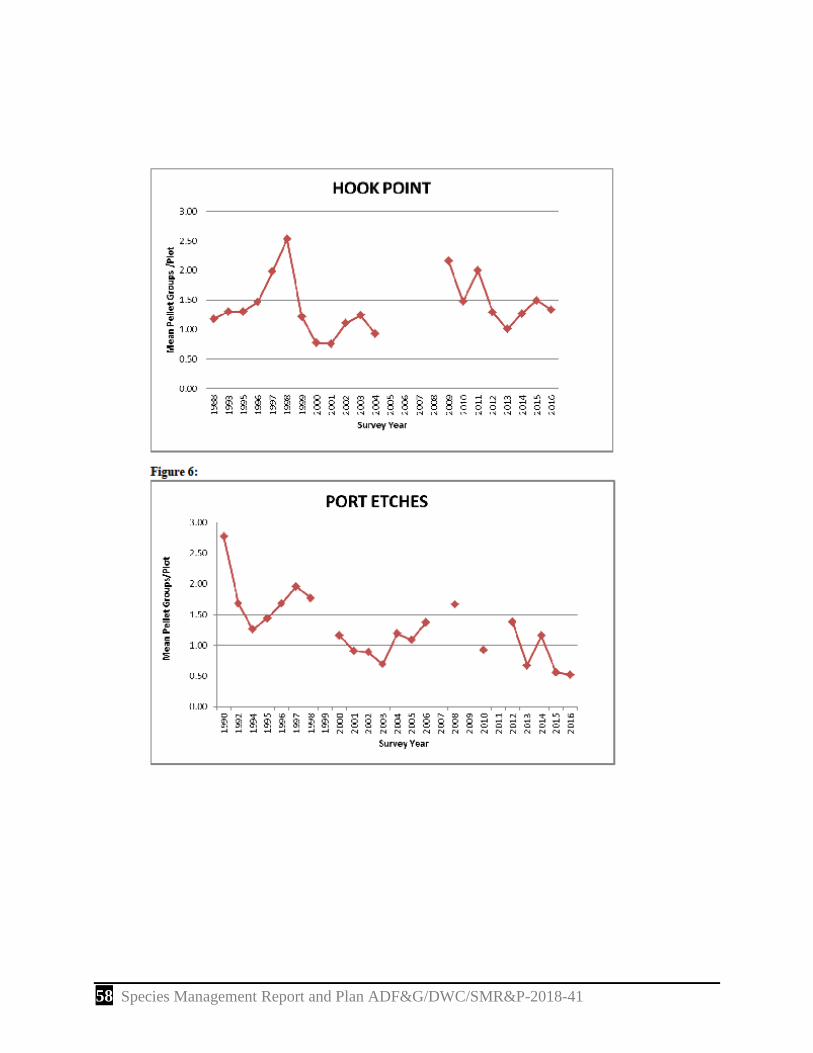
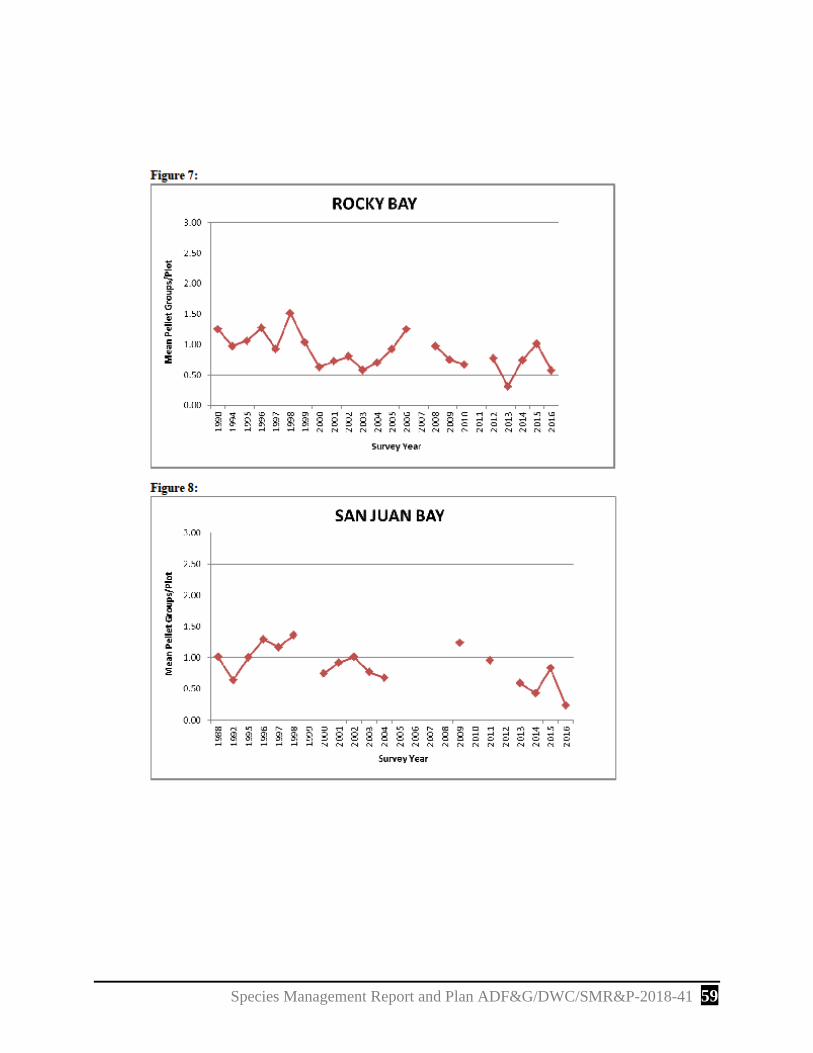
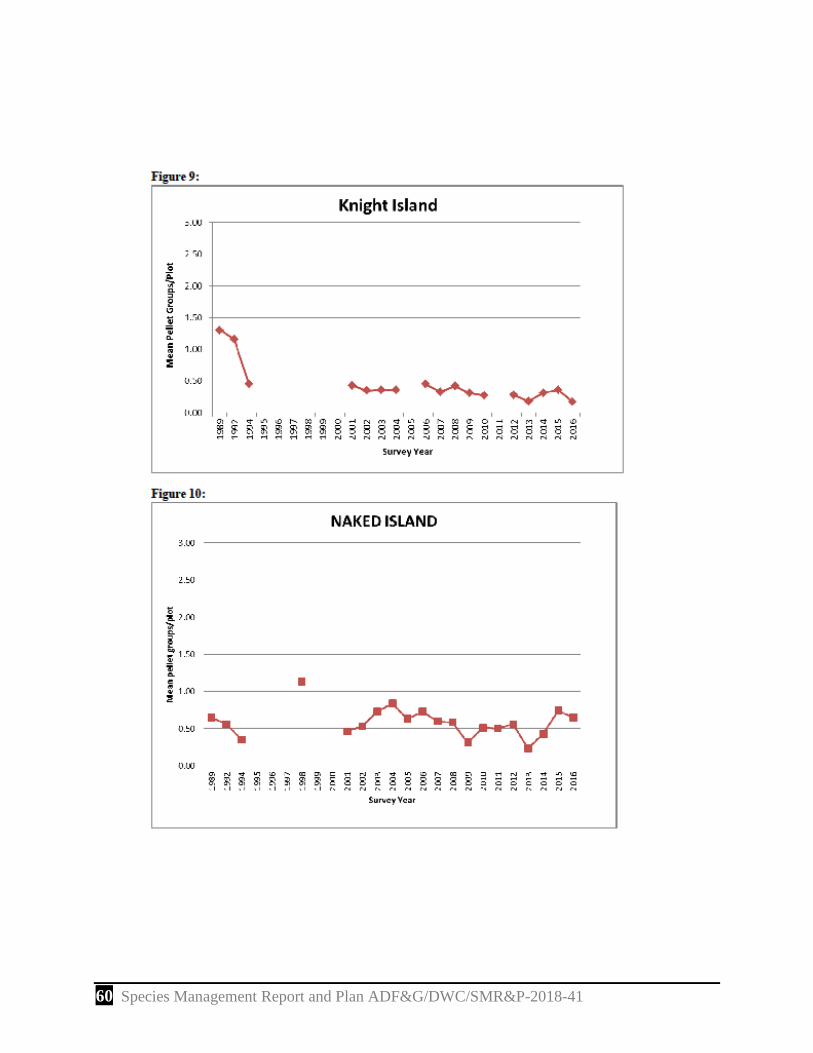
The Hawkins and Hinchinbrook islands tend to accumulate less snow than islands in western PWS because a slight temperature cline produces more rain in the east. Indeed, higher pellet group densities were observed there. In addition, both eastern islands have extensive old growth forests to support wintering deer, whereas the smaller islands of western PWS have smaller watersheds and much less winter habitat. Although Montague Island has large watersheds, much of the best deer winter habitat was clear-cut during the 1980s and 1990s and the island often receives tremendous amounts of snowfall. The deer pellet surveys in 2013, the first year expected to detect the results of the severe winter of RY11, found the lowest indices on record. The 2014 survey found slight improvement and corresponds with anecdotal reports that deer numbers are increasing.
Despite these improvements, deer pellet survey findings of ≤1 MPGP still indicate that deer may be occurring at low to moderate densities relative to other years.
Recommendations for Activity 1.1 Continue.
6 Species Management Report and Plan ADF&G/DWC/SMR&P-2018-41
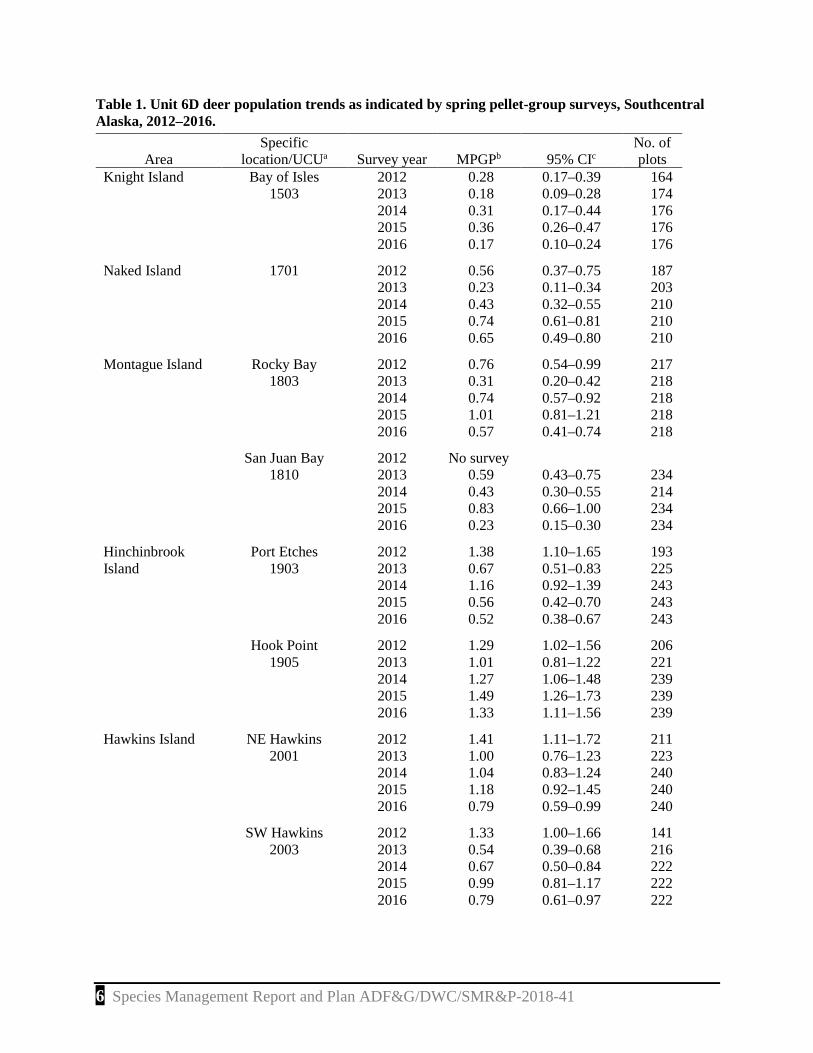
Table 1. Unit 6D deer population trends as indicated by spring pellet-group surveys, Southcentral Alaska, 2012–2016.
Area Specific
location/UCUa Survey year MPGPb 95% CIc No. of plots
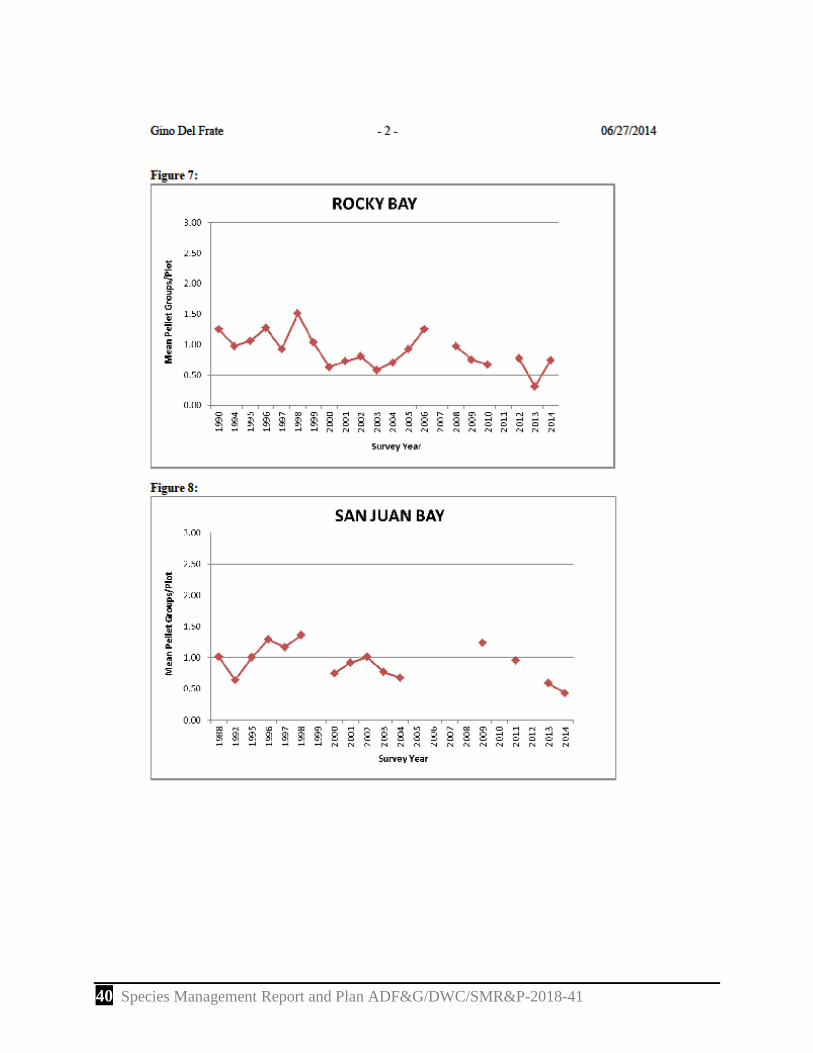
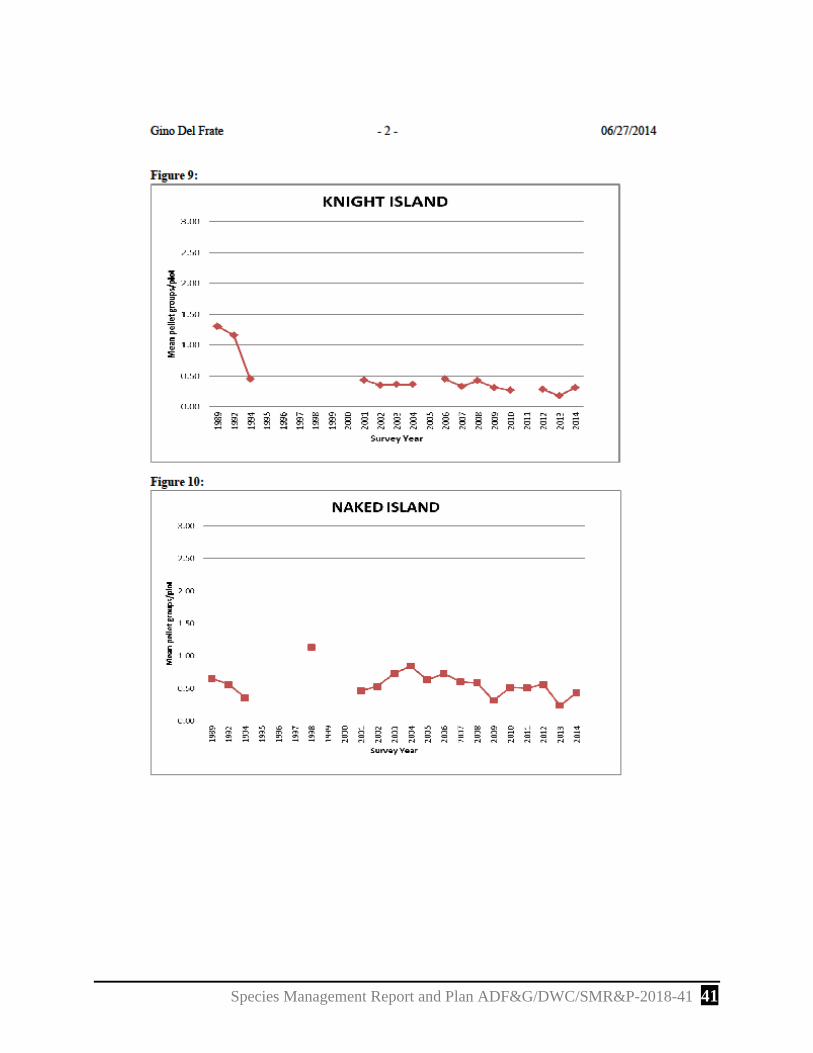
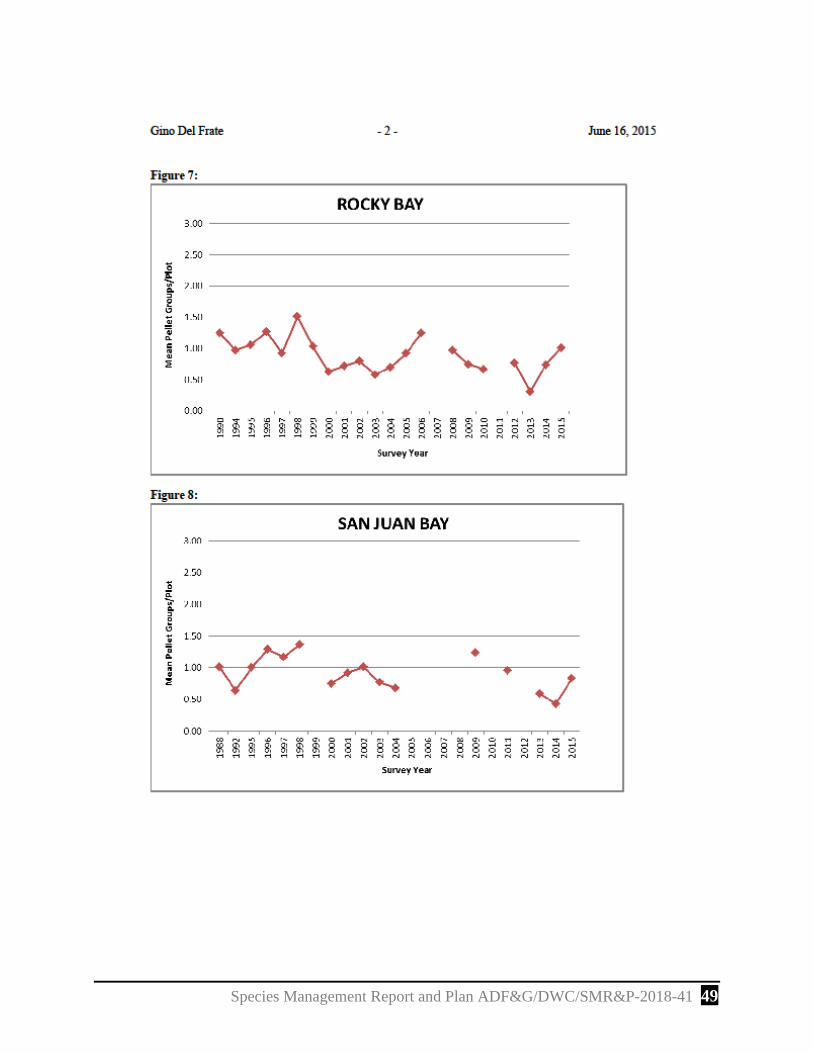
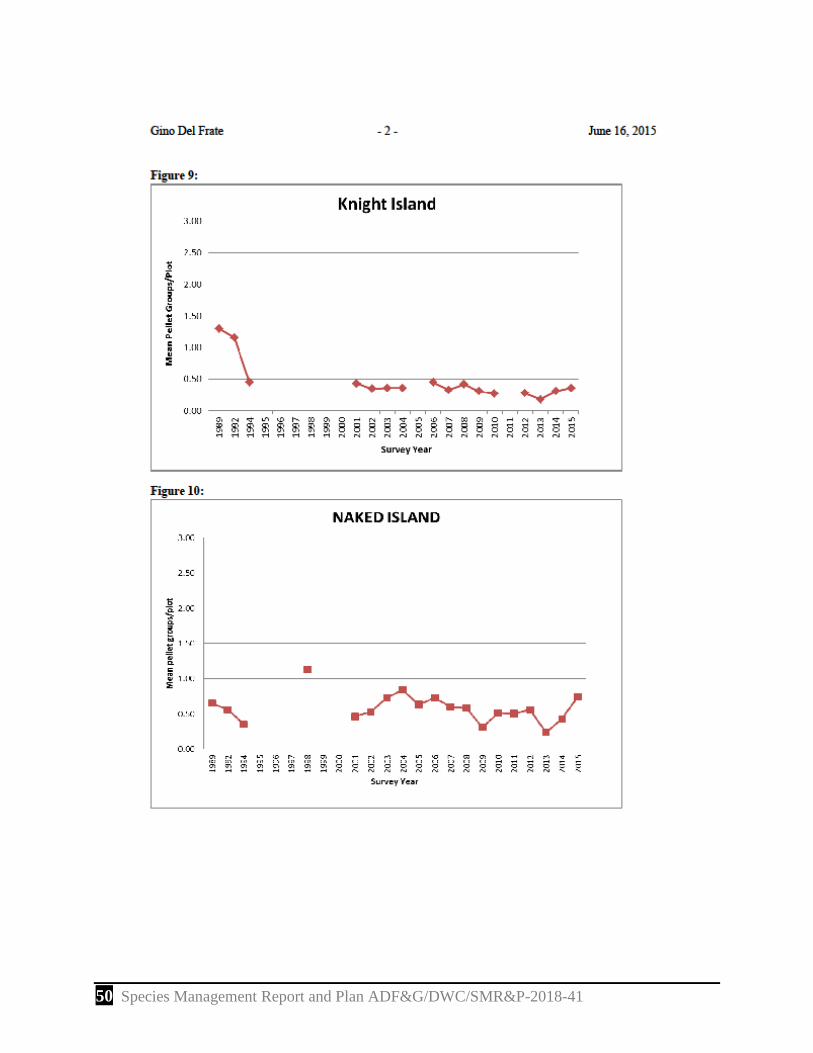
Knight Island Bay of Isles 2012 0.28 0.17–0.39 164 1503 2013 0.18 0.09–0.28 174 2014 0.31 0.17–0.44 176 2015 0.36 0.26–0.47 176 2016 0.17 0.10–0.24 176 Naked Island 1701 2012 0.56 0.37–0.75 187 2013 0.23 0.11–0.34 203 2014 0.43 0.32–0.55 210 2015 0.74 0.61–0.81 210 2016 0.65 0.49–0.80 210 Montague Island Rocky Bay 2012 0.76 0.54–0.99 217 1803 2013 0.31 0.20–0.42 218 2014 0.74 0.57–0.92 218 2015 1.01 0.81–1.21 218 2016 0.57 0.41–0.74 218 San Juan Bay 2012 No survey 1810 2013 0.59 0.43–0.75 234 2014 0.43 0.30–0.55 214 2015 0.83 0.66–1.00 234 2016 0.23 0.15–0.30 234 Hinchinbrook Port Etches 2012 1.38 1.10–1.65 193 Island 1903 2013 0.67 0.51–0.83 225 2014 1.16 0.92–1.39 243 2015 0.56 0.42–0.70 243 2016 0.52 0.38–0.67 243 Hook Point 2012 1.29 1.02–1.56 206 1905 2013 1.01 0.81–1.22 221 2014 1.27 1.06–1.48 239 2015 1.49 1.26–1.73 239 2016 1.33 1.11–1.56 239 Hawkins Island NE Hawkins 2012 1.41 1.11–1.72 211 2001 2013 1.00 0.76–1.23 223 2014 1.04 0.83–1.24 240 2015 1.18 0.92–1.45 240 2016 0.79 0.59–0.99 240 SW Hawkins 2012 1.33 1.00–1.66 141 2003 2013 0.54 0.39–0.68 216 2014 0.67 0.50–0.84 222 2015 0.99 0.81–1.17 222 2016 0.79 0.61–0.97 222
Species Management Report and Plan ADF&G/DWC/SMR&P-2018-41 7
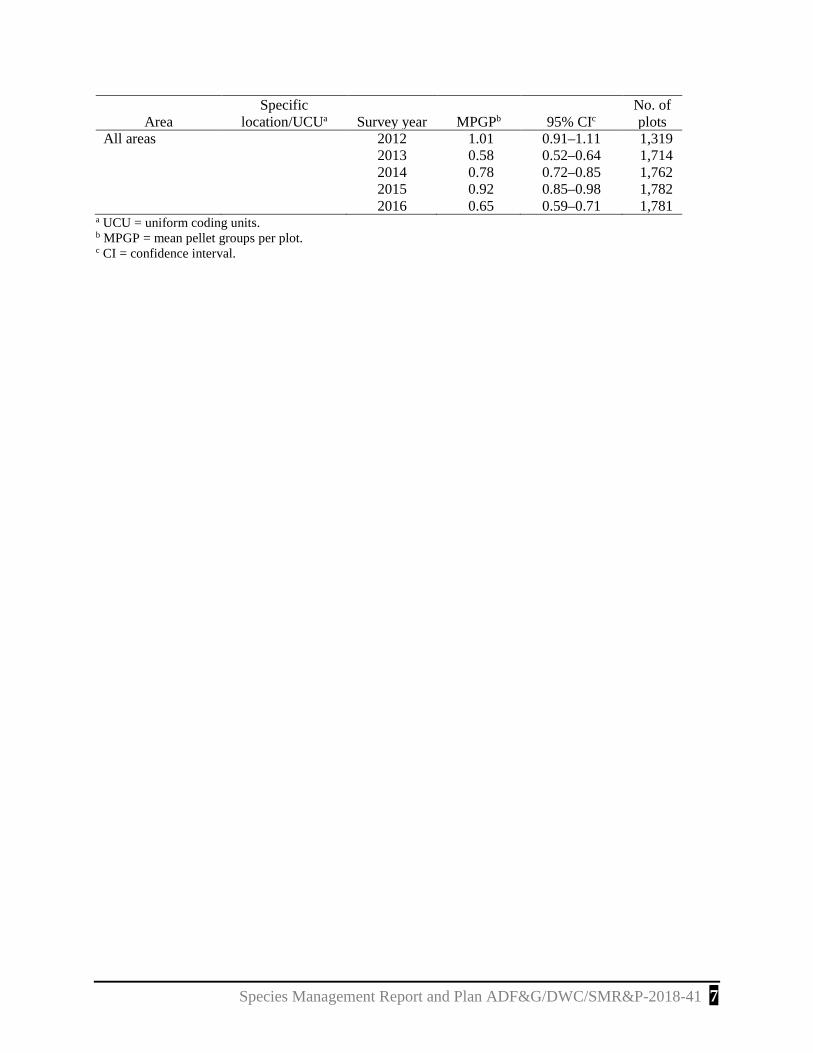
Area Specific
location/UCUa Survey year MPGPb 95% CIc No. of plots
All areas 2012 1.01 0.91–1.11 1,319 2013 0.58 0.52–0.64 1,714 2014 0.78 0.72–0.85 1,762 2015 0.92 0.85–0.98 1,782 2016 0.65 0.59–0.71 1,781
a UCU = uniform coding units. b MPGP = mean pellet groups per plot. c CI = confidence interval.
8 Species Management Report and Plan ADF&G/DWC/SMR&P-2018-41
Figure 2. Locations of pellet group transects (stars) and deer pellet density by island for deer in Unit 6, Alaska. Prince William Sound is Unit 6D.
Species Management Report and Plan ADF&G/DWC/SMR&P-2018-41 9
Figure 3. Deer pellet density observed in Unit 6D, Prince William Sound, Alaska. This composite index is based on multiple survey areas detailed in Table 1, this document.
10 Species Management Report and Plan ADF&G/DWC/SMR&P-2018-41
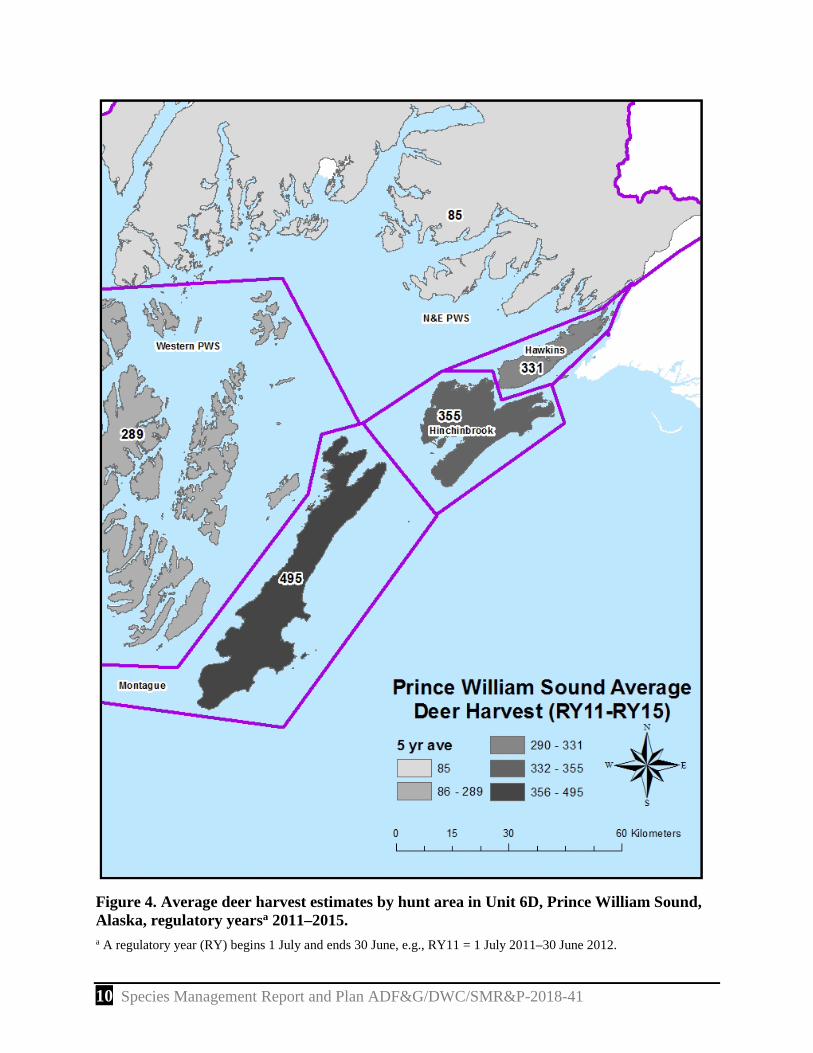
Figure 4. Average deer harvest estimates by hunt area in Unit 6D, Prince William Sound, Alaska, regulatory yearsa 2011–2015. a A regulatory year (RY) begins 1 July and ends 30 June, e.g., RY11 = 1 July 2011–30 June 2012.
Species Management Report and Plan ADF&G/DWC/SMR&P-2018-41 11
Figure 5. Weather data for Cordova as an index for weather in Prince William Sound, Alaska.
12 Species Management Report and Plan ADF&G/DWC/SMR&P-2018-41
Figure 6. Estimated deer harvest by sex (percent male above bars) in Unit 6D, Prince William Sound, Alaska. Note gaps in regulatory yearsa (RY) prior to 1989. a A regulatory year (RY) begins 1 July and ends 30 June, e.g., RY84 = 1 July 1984–30 June 1985.
Species Management Report and Plan ADF&G/DWC/SMR&P-2018-41 13
2. Mortality–Harvest Monitoring and Regulations
ACTIVITY 2.1. Quantify and analyze harvest data.
Data Needs With a positive customary and traditional finding and a corresponding amount reasonably necessary for subsistence established, as well as intensive management objectives, harvest must be assessed to evaluate the achievement of these goals. Current management objectives for harvest are not used as triggers for corrective action on perceived abundance of this introduced population that is primarily limited by winter severity.
Methods Harvest data are summarized by regulatory year. From RY80 to RY10, we estimated deer harvest from responses to questionnaires mailed to deer hunters who were issued harvest tickets in Southcentral Alaska. Approximately 3,000 questionnaires (30% of harvest ticket holders) were mailed to hunters annually, with a response rate averaging 66%. Follow-up letters were sent to nonresponders to attempt to achieve more complete data.
Data since RY11 was produced by using the harvest ticket system. Rather than select participants receiving questionnaires, all hunters are expected to report their activity. These data must be edited for accuracy in coding and reviewed for data entry errors. While the harvest questionnaire provided a map for hunters to indicate where they focused their effort, the harvest ticket system relies on an open-ended response to location. As a result, follow-up letters from the Cordova office must be sent to many hunters, to get more precise harvest location data. Response rates are low; therefore, harvest estimates must be expanded to account for nonresponse. This information was summarized for total harvest, hunter residency and success, harvest chronology, and transportation methods for Unit 6. Harvest data were grouped into geographic areas that included Hinchinbrook Island, Montague Island, Hawkins Island, western PWS, and northern and eastern PWS (Fig. 3).
Season and Bag Limit The season for resident and nonresident hunters was 1 August–31 December. The bag limit was 5 deer for residents and 4 for nonresidents. Female deer could be taken beginning 1 October.
Results and Discussion Harvest by Hunters
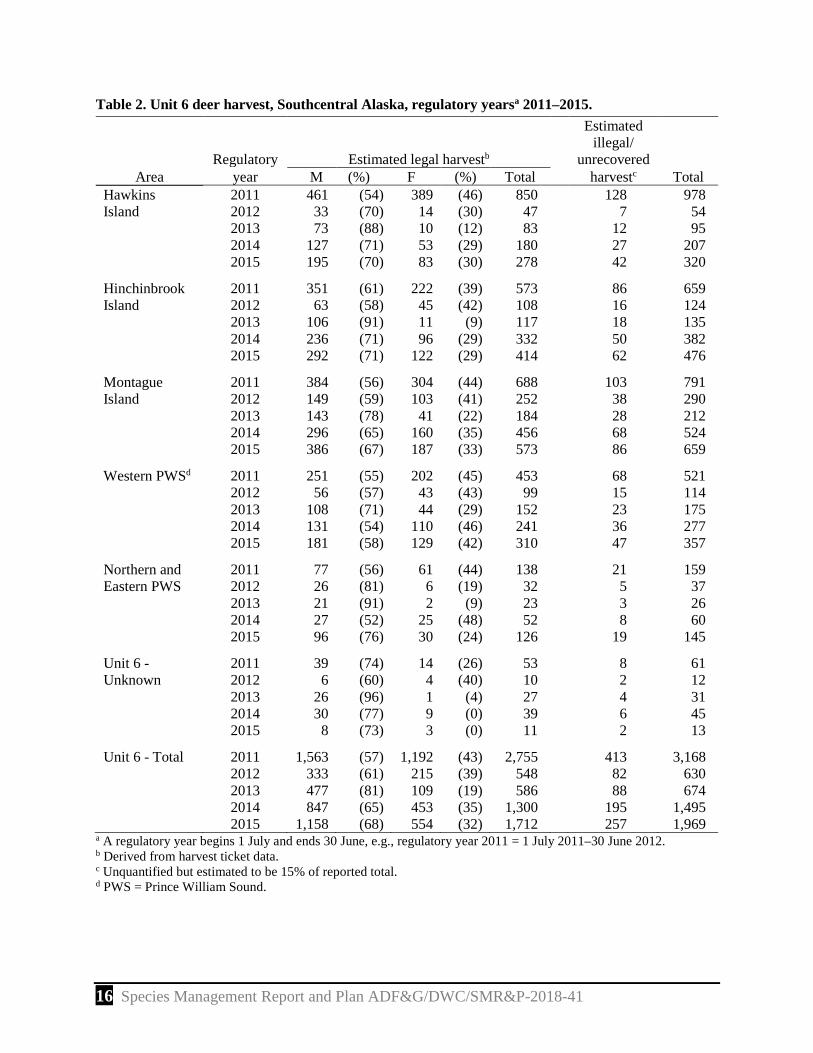
Although the deer population level is usually somewhat reflected by harvest, prevailing weather conditions during the season can influence hunter activity and harvest totals. Harvest was high in RY11 (3,168 deer) due to the early onset and persistence of significant snow that concentrated deer on the beach where they could be harvested (Table 2, Figs. 5 and 6). Conversely, the 2 years that followed the extreme weather event of RY11 have 2 of the lowest harvests on record. In RY12, the harvest was estimated at 630 deer. While this seems extreme, anecdotal reports suggest that many people perceived that the population was too low to present a reasonable chance of success. Harvest in RY13 increased slightly to 674 deer. Reduced effort and a low deer
14 Species Management Report and Plan ADF&G/DWC/SMR&P-2018-41
population contributed to this low harvest. The last 2 years of this reporting period, harvests have increased with 1,495 and 1,969 deer in RY14 and RY15 respectively.
Harvest declines were most significant on Hawkins Island where harvest dropped from 978 deer in RY11 to 54 in RY12 (a 95% decline) (Table 2). Hinchinbrook Island had the second largest decline in harvest, dropping from 659 deer in RY11 to 124 in RY12 (an 81% decline.) These declines may have been influenced by effort as well as population status. Cordova residents predominantly hunt on these 2 islands. Being keenly aware of the severity of winter 2011–2012 and the resulting deer die off, more hunters may have abstained from hunting in the years that have followed. Harvests in the western portion of PWS changed from 521 deer in RY11 to 114 in RY12 (a 78% decline). The effects of the RY11 winter were thought to have been worse in the western portion of PWS so the harvest decline is less severe compared to other areas. This may be a result of proportionally fewer hunters electing to not pursue deer.
The average (5-year) harvest of deer by area demonstrates that Montague Island (495 deer) yields the highest number of deer followed by Hinchinbrook (355 deer) and Hawkins Island (331 deer) (Fig. 4).
Harvest was composed of more than 60% males in most areas in most years. In RY11 when the harvest was exceptionally high, more areas exceeded the desired number of females in the harvest. The average male harvest for all areas is 64% (10-year average RY06–RY15). Hawkins Island had the highest proportion of males in the harvest with 70% males (10-year average). Western PWS had the lowest proportion of males in the harvest with 57% males (10-year average).
Hunters have been somewhat slow to acknowledge the mandatory reporting requirement that is being used instead of the previous survey system (used until RY11) which sampled hunters (only selected hunters were required to respond). Due to high rates of “nonreporting” adjustments are made to account for harvest that is likely to have come from nonresponders. Without these adjustments, harvest ticket data would not be comparable with past data.
Permit Hunts
None.
Hunter Residency and Success
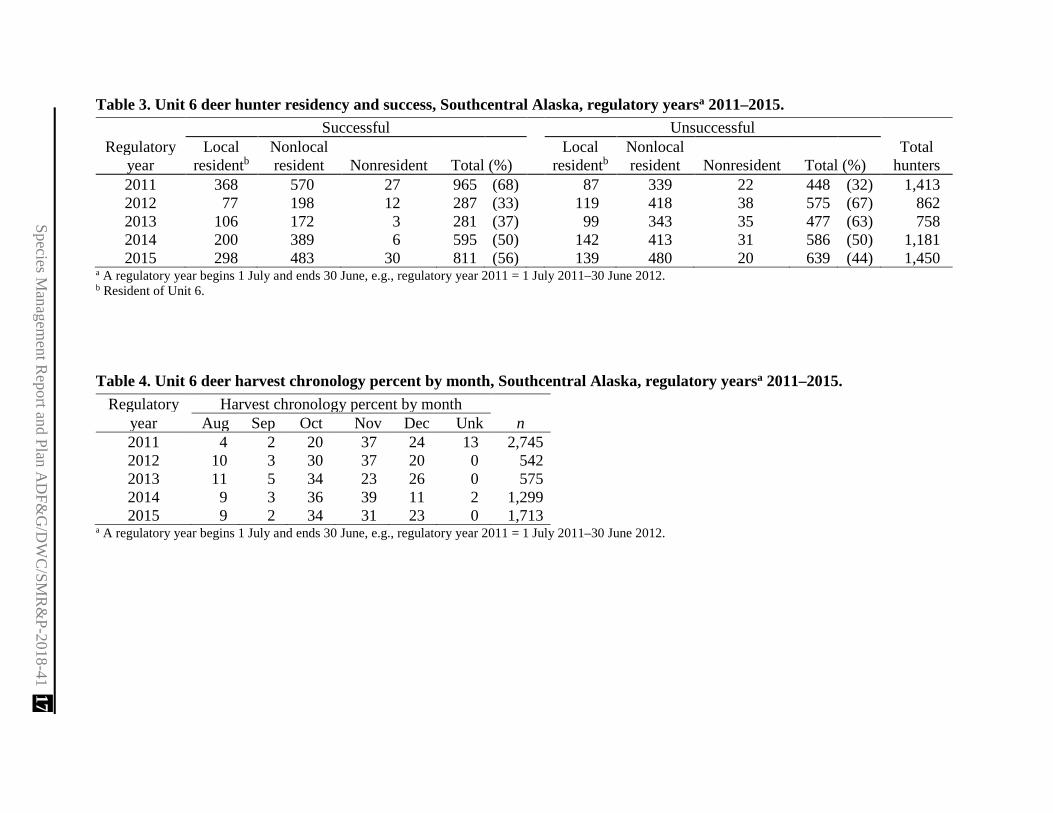
Deer hunters had annual success rates (harvest of at least 1 deer reported during the season) of 50% and 56%, respectively, during the 2 years of the reporting period. This is a return to more normal success rates following the previous 2 years (RY12 and RY13) which were the lowest since we began officially quantifying harvest in a comparable way in 1984 (Table 3). The success rate of 68% in RY11 may be a result of early and substantial snowfall, as mentioned above, that increased efficiency. Nonlocal residents represented 65% and 60% of successful hunters for RY14 and RY15 respectively. Local residents on average (5-year average) killed 1.5 deer per hunter compared to 1.0 deer per hunter for nonlocal residents. The number of deer taken per hunter in both years of this reporting period was lower than the 10-year average. For local residents, the number of deer harvested per hunter was slightly higher for the 2 years of this
Species Management Report and Plan ADF&G/DWC/SMR&P-2018-41 15
reporting period than RY12 and RY13 which were the lowest on record. Nonresidents remained minor contributors to the deer harvest.
Harvest Chronology
In this reporting period, hunters killed the most deer during October and November (Table 4). During November the rut was in progress, making bucks more vulnerable to harvest. A higher proportion of the harvest was taken in October than December which is a return to the more normal trend.
Transport Methods
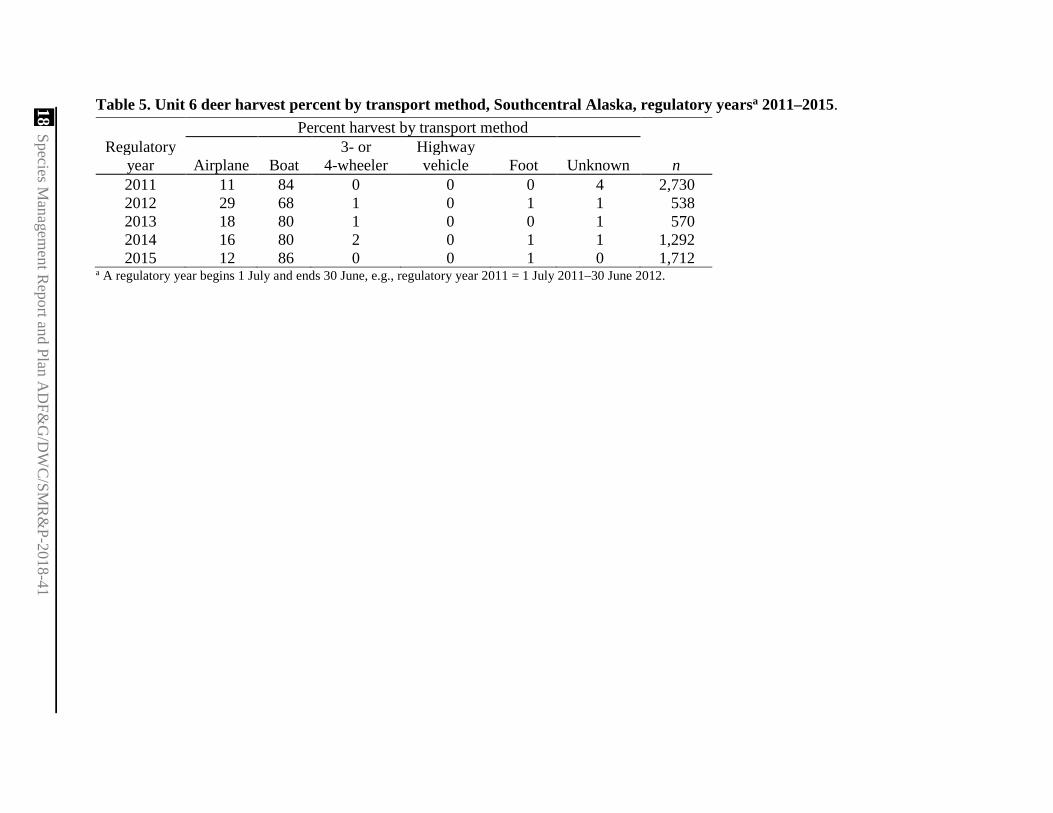
Similar to previous years, hunters primarily used boats (80% 5-year average) but some use airplanes (17% 5-year average). Other modes, including 3- and 4-wheelers, highway vehicles, and walking were not used significantly (Table 5).
Other Mortality Wounding loss and illegal harvest together was estimated to be at least 15% of the total reported harvest (Table 2). No major mortality events were observed during this reporting period.
Alaska Board of Game Actions and Emergency Orders An emergency order was issued that closed the state deer season on 7 December 2012 to respond to the extreme winter mortality event of the previous winter. The hunting season for federally qualified users on federal land closed for antlerless concurrently but remained open for antlered deer for the duration of the season.
In 2013, an emergency order was issued in response to the confirmed decline in the population. The buck season was unaffected, but the doe season was closed on 31 October 2013. The season for does on federal land was also closed on 1 November 2013. No emergency orders were issued in RY14 or RY15.
Recommendations for Activity 2.1 Modify – An important factor in the continuance of the harvest ticket system is to understand nonresponse bias that is evident. Validity of assumptions related to expansion factors need to be assessed for the new harvest ticket system.
Biometric review should focus on the assessment of nonresponse bias and developing a process for correcting for harvest that is unreported (approximately 30% of harvest is extrapolated to account for harvest of nonresponders.) One method would be to send multiple reminder letters or to use a random sample of responses (or nonresponses) to estimate for harvest that is not reported. This will require a unified, statewide approach however since these data are handled on a statewide level.
16 Species Management Report and Plan ADF&G/DWC/SMR&P-2018-41
Table 2. Unit 6 deer harvest, Southcentral Alaska, regulatory yearsa 2011–2015.
Regulatory Estimated legal harvestb
Estimated illegal/
unrecovered
Area year M (%) F (%) Total harvestc Total Hawkins 2011 461 (54) 389 (46) 850 128 978 Island 2012 33 (70) 14 (30) 47 7 54 2013 73 (88) 10 (12) 83 12 95 2014 127 (71) 53 (29) 180 27 207 2015 195 (70) 83 (30) 278 42 320 Hinchinbrook 2011 351 (61) 222 (39) 573 86 659 Island 2012 63 (58) 45 (42) 108 16 124 2013 106 (91) 11 (9) 117 18 135 2014 236 (71) 96 (29) 332 50 382 2015 292 (71) 122 (29) 414 62 476 Montague 2011 384 (56) 304 (44) 688 103 791 Island 2012 149 (59) 103 (41) 252 38 290 2013 143 (78) 41 (22) 184 28 212 2014 296 (65) 160 (35) 456 68 524 2015 386 (67) 187 (33) 573 86 659 Western PWSd 2011 251 (55) 202 (45) 453 68 521 2012 56 (57) 43 (43) 99 15 114 2013 108 (71) 44 (29) 152 23 175 2014 131 (54) 110 (46) 241 36 277 2015 181 (58) 129 (42) 310 47 357 Northern and 2011 77 (56) 61 (44) 138 21 159 Eastern PWS 2012 26 (81) 6 (19) 32 5 37 2013 21 (91) 2 (9) 23 3 26 2014 27 (52) 25 (48) 52 8 60 2015 96 (76) 30 (24) 126 19 145 Unit 6 - 2011 39 (74) 14 (26) 53 8 61 Unknown 2012 6 (60) 4 (40) 10 2 12 2013 26 (96) 1 (4) 27 4 31 2014 30 (77) 9 (0) 39 6 45 2015 8 (73) 3 (0) 11 2 13 Unit 6 - Total 2011 1,563 (57) 1,192 (43) 2,755 413 3,168 2012 333 (61) 215 (39) 548 82 630 2013 477 (81) 109 (19) 586 88 674 2014 847 (65) 453 (35) 1,300 195 1,495 2015 1,158 (68) 554 (32) 1,712 257 1,969
a A regulatory year begins 1 July and ends 30 June, e.g., regulatory year 2011 = 1 July 2011–30 June 2012. b Derived from harvest ticket data. c Unquantified but estimated to be 15% of reported total. d PWS = Prince William Sound.
Species Managem
ent Report and Plan A
DF&
G/D
WC
/SMR
&P-2018-41 17
Table 3. Unit 6 deer hunter residency and success, Southcentral Alaska, regulatory yearsa 2011–2015. Successful Unsuccessful
Regulatory Local Nonlocal Local Nonlocal Total year residentb resident Nonresident Total (%) residentb resident Nonresident Total (%) hunters 2011 368 570 27 965 (68) 87 339 22 448 (32) 1,413 2012 77 198 12 287 (33) 119 418 38 575 (67) 862 2013 106 172 3 281 (37) 99 343 35 477 (63) 758 2014 200 389 6 595 (50) 142 413 31 586 (50) 1,181 2015 298 483 30 811 (56) 139 480 20 639 (44) 1,450
a A regulatory year begins 1 July and ends 30 June, e.g., regulatory year 2011 = 1 July 2011–30 June 2012. b Resident of Unit 6. Table 4. Unit 6 deer harvest chronology percent by month, Southcentral Alaska, regulatory yearsa 2011–2015.
Regulatory Harvest chronology percent by month year Aug Sep Oct Nov Dec Unk n 2011 4 2 20 37 24 13 2,745 2012 10 3 30 37 20 0 542 2013 11 5 34 23 26 0 575 2014 9 3 36 39 11 2 1,299 2015 9 2 34 31 23 0 1,713
a A regulatory year begins 1 July and ends 30 June, e.g., regulatory year 2011 = 1 July 2011–30 June 2012.
18 Species Managem
ent Report and Plan A
DF&
G/D
WC
/SMR
&P-2018-41
Table 5. Unit 6 deer harvest percent by transport method, Southcentral Alaska, regulatory yearsa 2011–2015. Percent harvest by transport method
Regulatory 3- or Highway year Airplane Boat 4-wheeler vehicle Foot Unknown n 2011 11 84 0 0 0 4 2,730 2012 29 68 1 0 1 1 538 2013 18 80 1 0 0 1 570 2014 16 80 2 0 1 1 1,292 2015 12 86 0 0 1 0 1,712
a A regulatory year begins 1 July and ends 30 June, e.g., regulatory year 2011 = 1 July 2011–30 June 2012.
Species Management Report and Plan ADF&G/DWC/SMR&P-2018-41 19
3. Habitat Assessment–Enhancement
Currently, habitat has not been prioritized as a monitoring tool.
NONREGULATORY MANAGEMENT PROBLEMS OR NEEDS
We are transitioning to a new harvest reporting process. More work should be done to inform hunters about the new harvest reporting system. Additionally, the department must develop appropriate means of assessing unreported harvest within the new system.
Data Recording and Archiving
• Deer harvest data and survey memos are stored on an internal database housed on an internal server, ADF&G’s Wildlife Information Network (WinfoNet) (http://winfonet.alaska.gov/index.cfm).
• Data sheets are scanned and stored on the Cordova ADF&G server (O:\DWC\Deer).
• Original datasheets are stored in file folders located in the Cordova Area Biologist’s office.
• Historical survey notes and data sheets are being digitized and scanned for permanent storage on the file server.
Agreements
ADF&G and USFS–Chugach National Forest have a cooperative agreement that results in the sharing of costs to conduct deer pellet transects and the data that come from them.
Permitting
None.
Conclusions and Management Recommendations
Under intensive management law (AS 16.05.255) our mandated population objective is 24,000–28,000 deer and harvest objective 2,200–3,000. Because we have no estimate of population size, this objective is, at best, an educated guess at the number of deer required to support human needs. Obtaining a population estimate has not been identified as a priority because of the survey challenges associated with finding and counting forest dwelling animals. However, based on pellet-group density, reports from stakeholders, and carcass counts, it is likely that deer numbers declined in PWS because of unprecedented snowfall and are slowly rebuilding.
Deer pellet indices are highest on Hawkins and Hinchinbrook islands, possibly indicating that more deer occur there than on other islands. However, participation in the hunt (based on hunter days per area) is highest on Montague, followed by western PWS. This is likely due to access from Whittier and is not reflective of deer density. Although reasonable hunting opportunity exists to sustain the intensive management objective of 2,200–3,000 deer, hunters reported taking fewer deer during the reporting period. With increased fuel costs, effort may be focused in lower quality areas that are closer to port.
20 Species Management Report and Plan ADF&G/DWC/SMR&P-2018-41
Pellet-group surveys and harvest data (via hunter questionnaires and now harvest ticket data) seem to be effective tools to monitor and manage deer harvest within variation affected primarily by winters of deep snow in Unit 6. MPGP has been a reliable index to population trend. A research project is being developed using money from a legislative CIP to investigate accuracy of deer pellet data using DNA. Other components of the study will likely involve movement, nutrition, and carrying capacity comparing between high- and low-density areas. I believe the population is presently limited by access to forage during periods of deep snow, but if mild winters with little persistence of deep snow continue, understanding of forage limitation in accessible areas should be investigated as a limiting factor.
II. Project Review and RY16–RY20 Plan
Review of Management Direction
MANAGEMENT DIRECTION
• Provide a bag limit that allows for compensatory harvest and the prevention of habitat degradation from high abundance achievable following mild winters (5 deer for residents, 4 for nonresidents).
• Reduce additive harvest (in season when possible) following extreme weather events. Weather-caused mortality events cannot be prevented. Therefore, management decisions seek to build the population back to moderate levels quickly while maintaining reasonable harvest opportunity.
• Evaluate the current harvest objective based on improved harvest reporting and modify. Harvest objectives have only been met 11 times in 28 years.
GOALS
The management goal for Unit 6 deer is to maintain healthy, productive populations, sufficiently abundant and resilient to harsh winters to ensure good hunting opportunities and success.
CODIFIED OBJECTIVES
Amounts Reasonably Necessary for Subsistence Uses
Deer unitwide: 1,000–1,250.
Intensive Management
Population objective: 24,000–28,000.
Harvest objective: 2,200–3,000.
Species Management Report and Plan ADF&G/DWC/SMR&P-2018-41 21
MANAGEMENT OBJECTIVES
Management objectives will vary based on population status.
Review current objectives for feasibility and utility (likely eliminate):
• Maintain a minimum harvest of 60% males.
• Maintain a minimum hunter success rate of 50%.
Proposed new objectives:
• When deer pellet transects indicate that the population is low, the 3-year average buck harvest should be >60% of the harvest. Harvest opportunity will be reduced if snow levels are identified as deep and persistent. (new objective)
• If MPGP are >1.5 for 3 consecutive years, education efforts will focus on increasing doe harvest. Board of Game action may be pursued to liberalize deer harvest. (new objective)
REVIEW OF MANAGEMENT ACTIVITIES
1. Population Status and Trend
ACTIVITY 1.1. Conduct deer pellet transects.
Evaluate measures of variance for average MPGP with a biometrician to better inform strength of information based on pellet counts.
Data Needs No change from report section.
Methods We will continue to follow data collection methods from the prior reporting period.
2. Mortality–Harvest Monitoring
ACTIVITY 2.1. Monitor hunter harvest via WinfoNet data from harvest ticket reports.
Data Needs No change from report section.
Methods We will continue to follow data collection methods from the prior reporting period.
ACTIVITY 2.2. Mortality risk assessment: Additive or compensatory. (new activity)
Data Needs Identify whether annual hunting mortality is most likely additive or compensatory.
22 Species Management Report and Plan ADF&G/DWC/SMR&P-2018-41
Methods Collect and consider anecdotal reports of body condition. If fall and early winter are very mild and the population is low, body condition may be very good. If the population is high (based on deer pellet transect results) or the winter is dominated by below average temperatures and/or above average snow fall, animals may be entering the winter in poorer body condition. Evaluate game camera footage for changes in deer per day relative to other years. Use footage to document dramatic changes in body condition or inhibitive snow levels (sternum height). Monitor in-season harvest using anecdotal reports, dock checks, and reports from the Alaska Wildlife Troopers to assess harvest relative to established normal levels.
3. Habitat Assessment–Enhancement
ACTIVITY 3.1. Monitor snow depth. (new activity)
Data Needs Identify extreme weather events, specifically depth of snow that is limiting (Habitat Assessment–Enhancement from a quantity not quality standpoint).
Methods Deploy snow stakes that can be read via plane or trail camera at index stations in PWS (one in each hunt area: Montague, Hawkins [could use Cordova], Hinchinbrook, and Knight [could use Whittier depth]). Snow depth indicators could be deployed at SnoTel stations in the study area (ca. $1,000 per station in cooperation with National Resource Conservation Service). Existing weather stations–cameras in Cordova, and at Johnstone Point on Hinchinbrook, and Naked Island may also be used.
When Cordova snowfall gets to sternum height (>2 feet) and is expected to be persistent (more than 1 week), stakes are flown once a month while snow at that depth is persistent.
NONREGULATORY MANAGEMENT PROBLEMS OR NEEDS
Data Recording and Archiving
• Deer harvest data and survey memos are stored on the internal ADF&G database WinfoNet (http://winfonet.alaska.gov/index.cfm).
• Data sheets are scanned and stored on the Cordova ADF&G server (O:\DWC\Deer).
• Original datasheets are stored in file folders located in the Cordova Area Biologist’s office.
• Historical survey notes and data sheets are being digitized and scanned for permanent storage on the file server.
Agreements
ADF&G and USFS–Chugach National Forest have a cooperative agreement that results in the sharing of costs to conduct deer pellet transects and the data that come from them.
Species Management Report and Plan ADF&G/DWC/SMR&P-2018-41 23
Permitting
None.
Acknowledgments
USFS contributes financially and with personnel to deer monitoring in PWS.
References Cited
ADF&G (Alaska Department of Fish and Game). 1976. Alaska wildlife management plans: Southcentral Alaska (draft subsequently approved by the Alaska Board of Game). Division of Game, Federal Aid in Wildlife Restoration Project W-17-R, Juneau.
Cowan, M. I. 1969. What and where are the mule and black-tailed deer? Pages 335–360 [In] W. P. Taylor, editor. The deer of North America. Stackpole Co., Harrisburg, Pennsylvania.
Crowley, D. W. 2001. Unit 6 deer management report. Pages 82–92 [In] M. V. Hicks, editor. Deer management report of survey and inventory activities 1 July 1998–30 June 2000. Alaska Department of Fish and Game, Division of Wildlife Conservation, Federal Aid in Wildlife Restoration Project 2.0, Juneau.
Crowley, D. W. 2001. Unit 6 deer management report. Pages 81–95 [In] P. Harper, editor. Deer management report of survey and inventory activities 1 July 2008–30 June 2010. Alaska Department of Fish and Game, Division of Wildlife Conservation, Federal Aid in Wildlife Restoration Project 2.0, Juneau.
Harestad, A. S., and F. L. Bunnell. 1987. Persistence of black-tailed deer fecal pellets in coastal habitats. Journal of Wildlife Management 51(1):33–37. doi:10.2307/3801624
Kirchhoff, M. D., and K. W. Pitcher. 1988. Deer pellet-group surveys in Southeast Alaska, 1981–1987. Alaska Department of Fish and Game, Division of Game, Research Final Report, Federal Aid in Wildlife Restoration Job 2.9, Douglas.
Nowlin, R. 1997. Unit 6 deer. Pages 58–71 [In] M. V. Hicks, editor. Management report of survey–inventory activities 1 July 1994–30 June 1996. Alaska Department of Fish and Game, Division of Wildlife Conservation, Federal Aid in Wildlife Restoration Study 2.0, Juneau.
Paul, T. W. 2009. Game transplants in Alaska. Alaska Department of Fish and Game, Division of Wildlife Conservation, Technical Bulletin No. 4, 2nd edition, Juneau.
24 Species Management Report and Plan ADF&G/DWC/SMR&P-2018-41
Reynolds, J. L. 1979. History and current status of Sitka black-tailed deer in Prince William Sound. Pages 177–195 [In] O. C. Wallmo, and J. W. Schoen, editors. Sitka black-tailed deer: Proceedings of a conference in Juneau, Alaska, 22–24 February 1978. U.S. Department of Agriculture, Forest Service, in cooperation with Alaska Department of Fish and Game, Series No. R10-48.
Schoen, J. W., and M. D. Kirchhoff. 1984. Seasonal distribution and habitat use by Sitka black-tailed deer in southeastern Alaska. Alaska Department of Fish and Game, Division of Game, Progress Report 1 July 1982–30 June 1983, Federal Aid in Wildlife Restoration Job 2.6R, Juneau.
Shishido, N. 1986. Seasonal distribution and winter habitat use by Sitka black-tailed deer in the Prince William Sound region, Alaska. Master’s thesis, University of Alaska Fairbanks.
Westing, C. L. 2015. Unit 6 deer management report. Chapter 8, pages 8–1 through 8–15 [In] P. Harper and L. A. McCarthy, editors. Deer management report of survey and inventory activities 1 July 2012–30 June 2014. Alaska Department of Fish and Game, Species Management Report ADF&G/DWC/SMR-2015-3, Juneau.
♦♦♦
Species Management Report and Plan ADF&G/DWC/SMR&P-2018-41 25
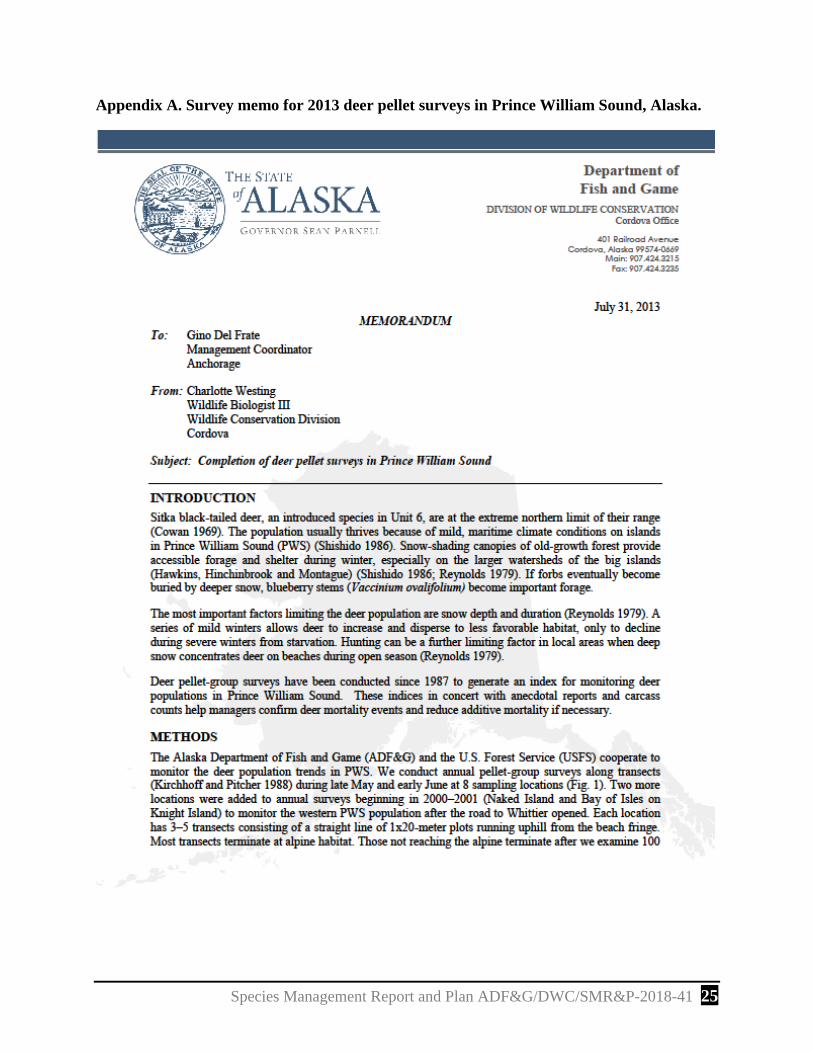
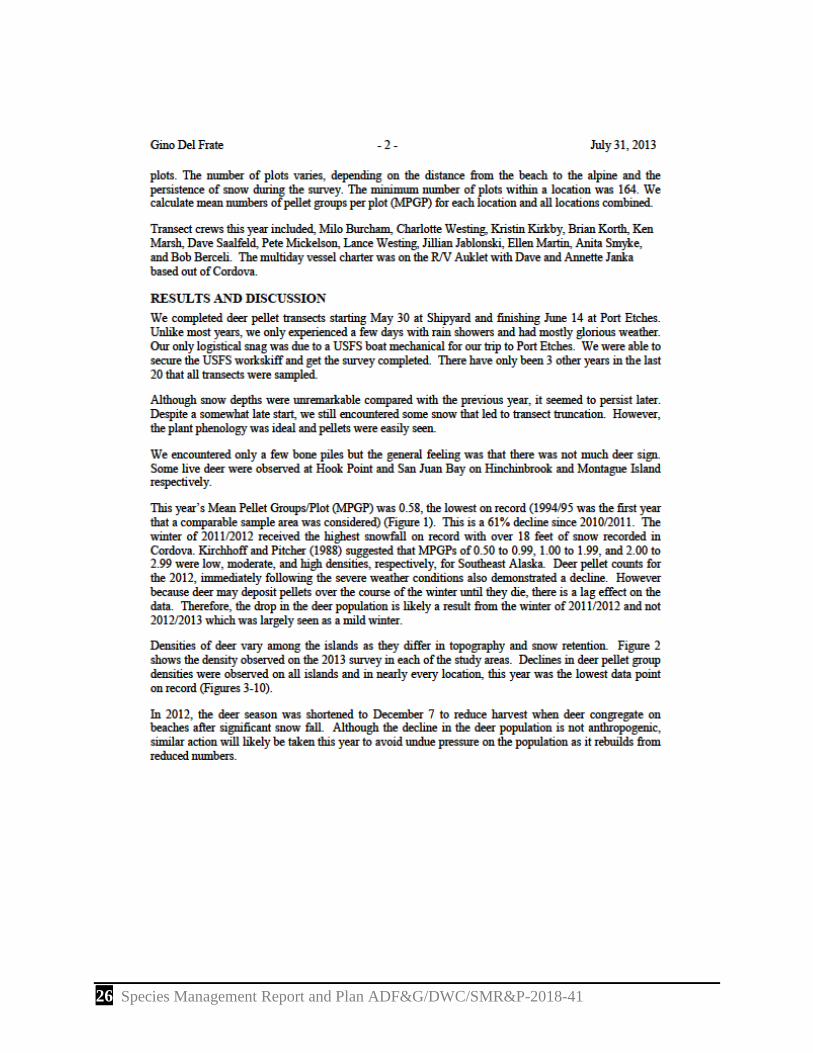
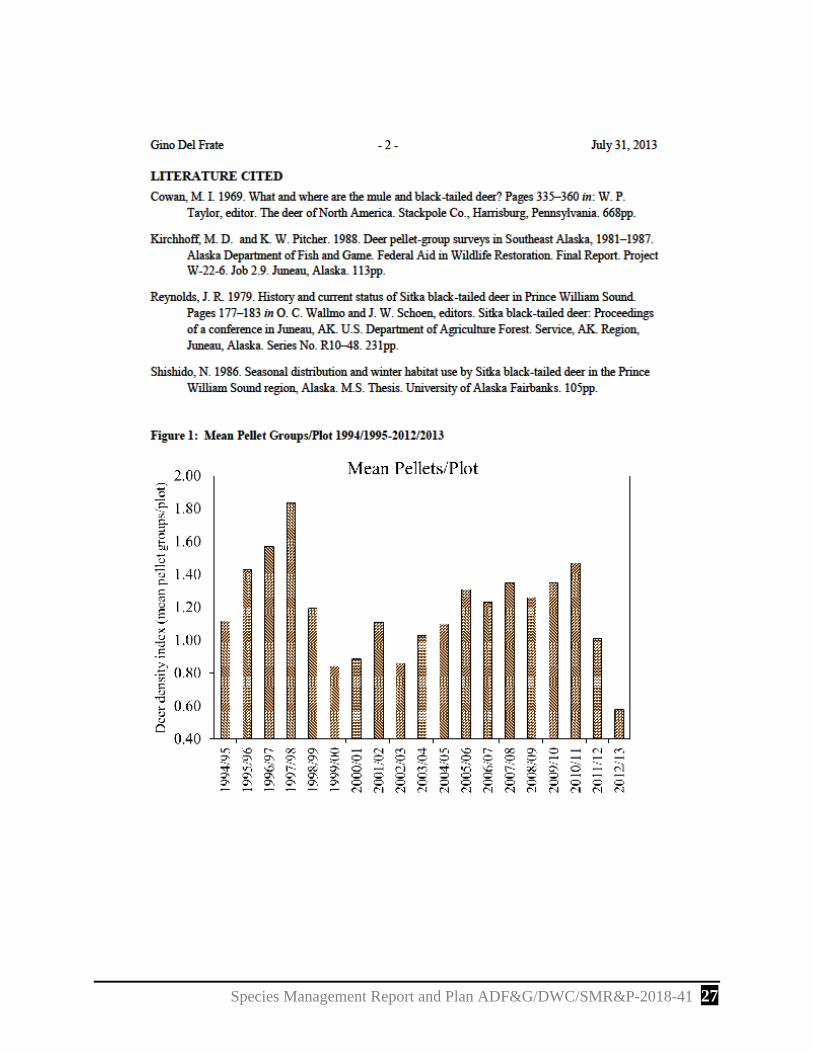
Appendix A. Survey memo for 2013 deer pellet surveys in Prince William Sound, Alaska.
26 Species Management Report and Plan ADF&G/DWC/SMR&P-2018-41
Species Management Report and Plan ADF&G/DWC/SMR&P-2018-41 27
28 Species Management Report and Plan ADF&G/DWC/SMR&P-2018-41
Species Management Report and Plan ADF&G/DWC/SMR&P-2018-41 29
30 Species Management Report and Plan ADF&G/DWC/SMR&P-2018-41
Species Management Report and Plan ADF&G/DWC/SMR&P-2018-41 31
32 Species Management Report and Plan ADF&G/DWC/SMR&P-2018-41
Species Management Report and Plan ADF&G/DWC/SMR&P-2018-41 33
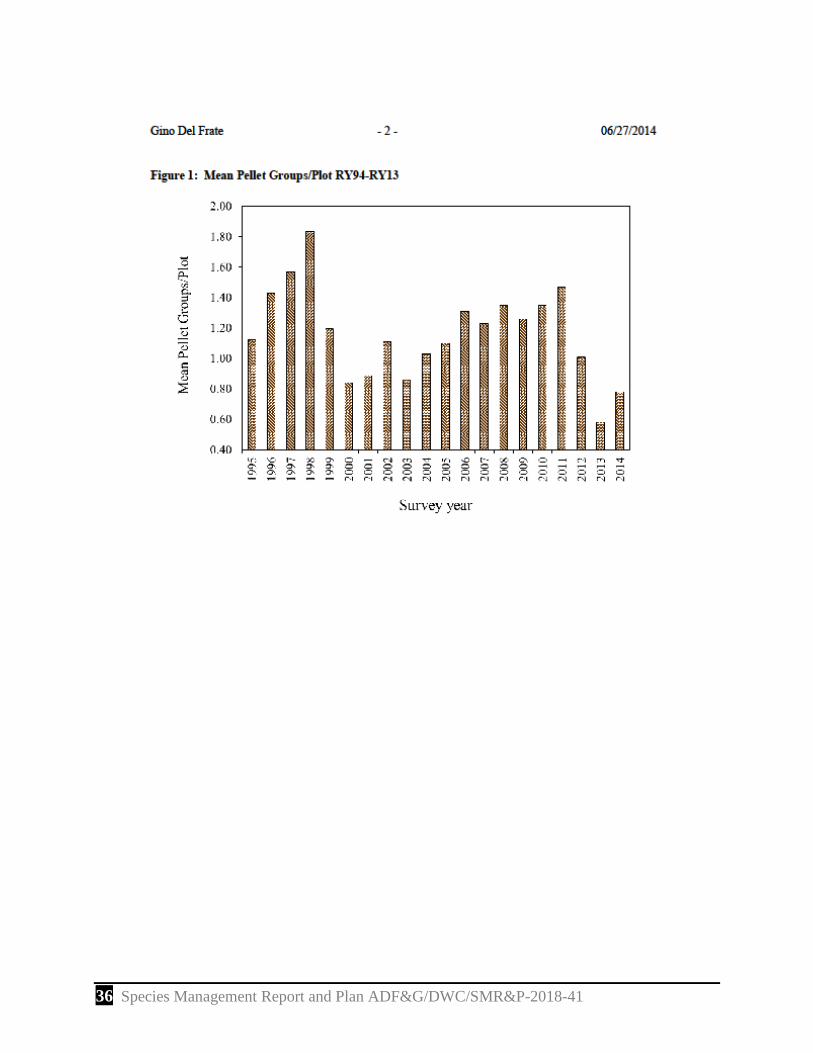
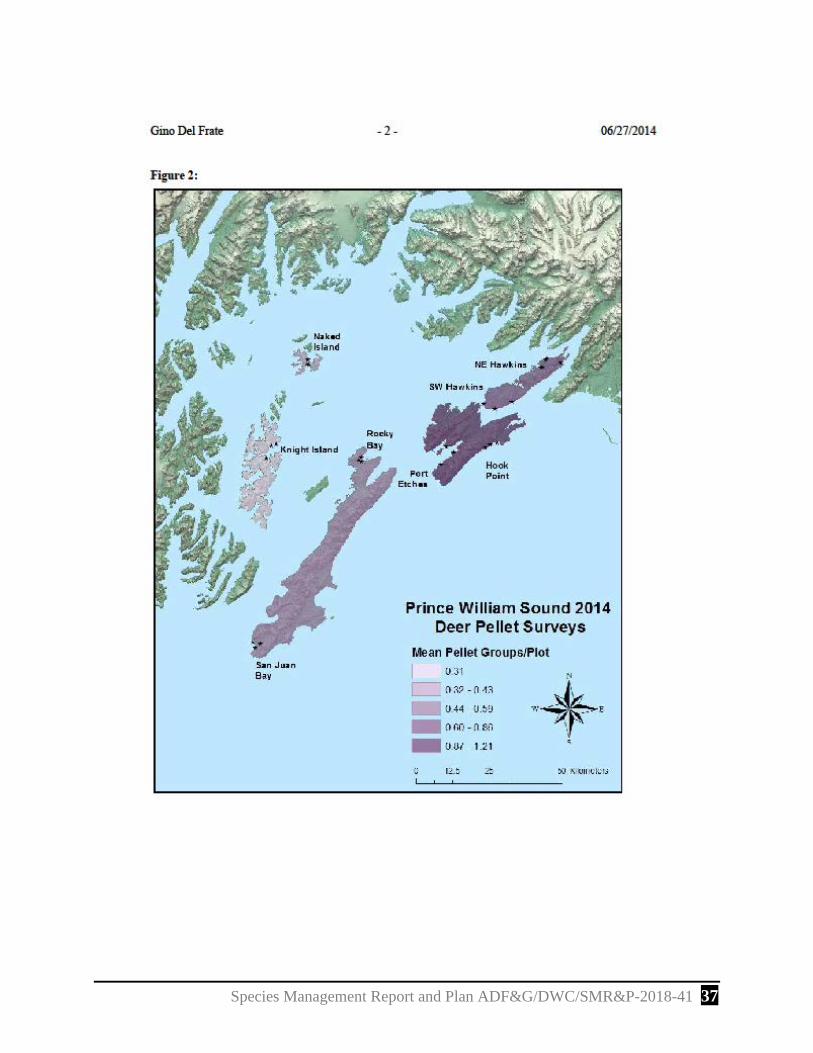
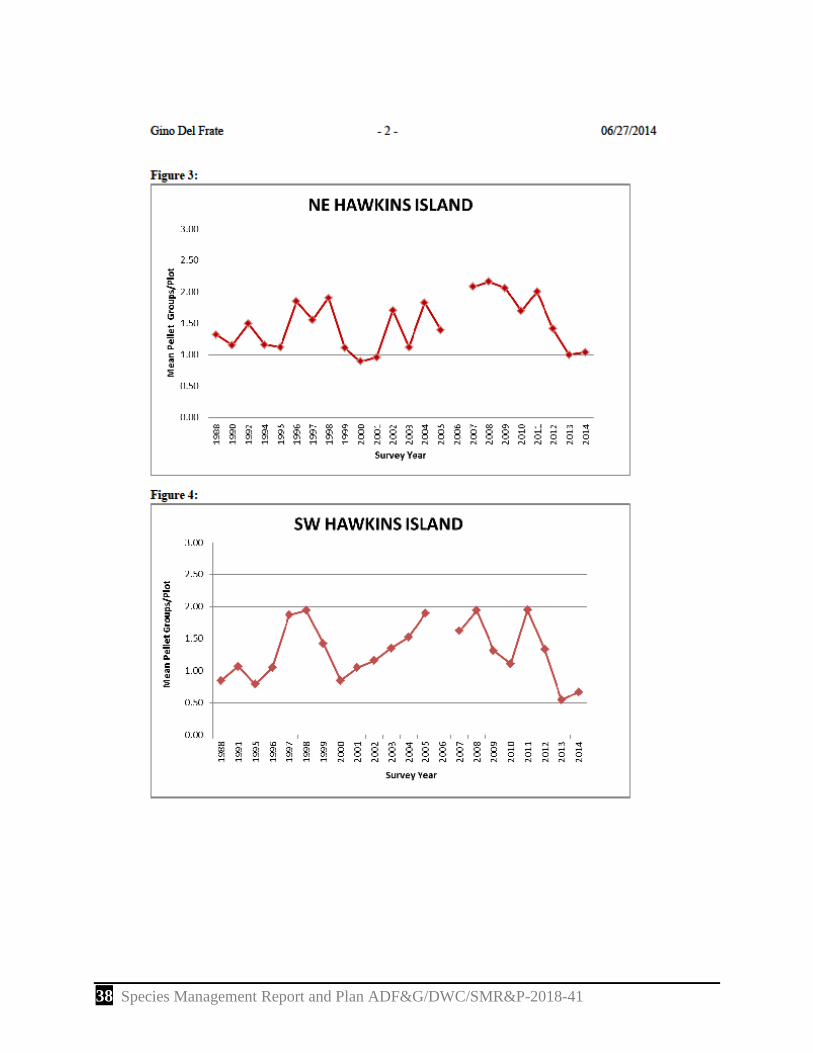
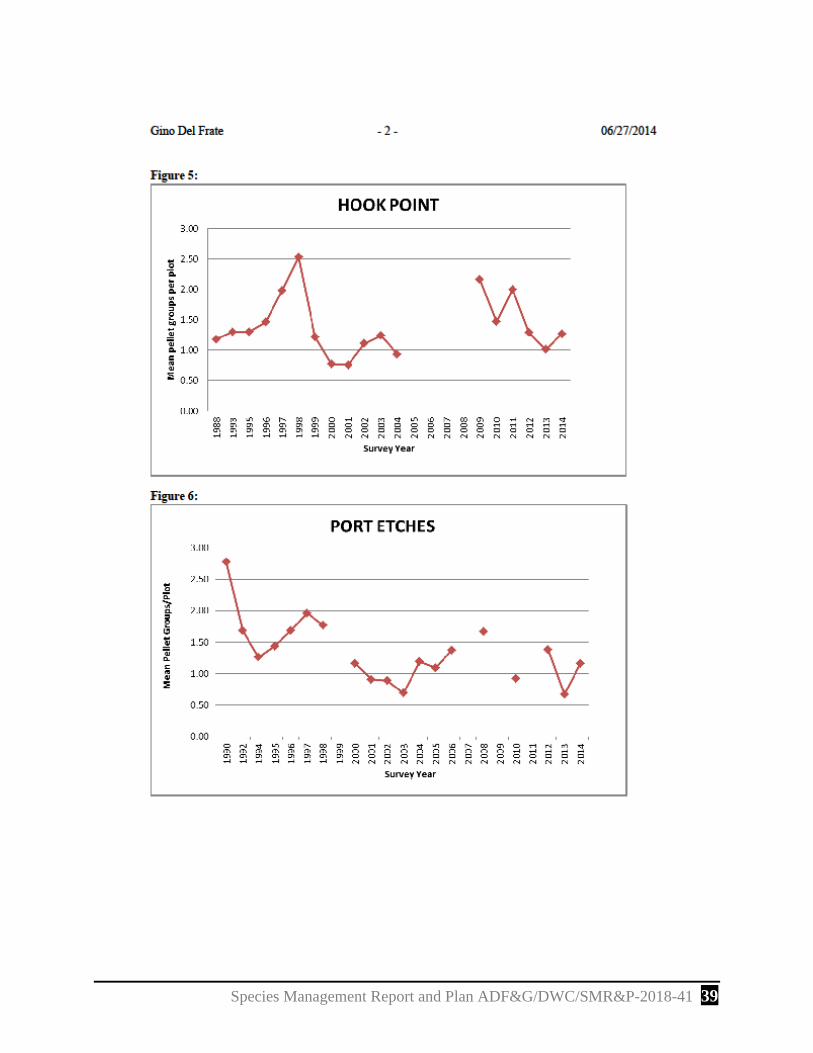
Appendix B. Survey memo for 2014 deer pellet surveys in Prince William Sound, Alaska.
34 Species Management Report and Plan ADF&G/DWC/SMR&P-2018-41
Species Management Report and Plan ADF&G/DWC/SMR&P-2018-41 35
36 Species Management Report and Plan ADF&G/DWC/SMR&P-2018-41
Species Management Report and Plan ADF&G/DWC/SMR&P-2018-41 37
38 Species Management Report and Plan ADF&G/DWC/SMR&P-2018-41
Species Management Report and Plan ADF&G/DWC/SMR&P-2018-41 39
40 Species Management Report and Plan ADF&G/DWC/SMR&P-2018-41
Species Management Report and Plan ADF&G/DWC/SMR&P-2018-41 41
42 Species Management Report and Plan ADF&G/DWC/SMR&P-2018-41
Appendix C. Survey memo for 2015 deer pellet surveys in Prince William Sound, Alaska.
Species Management Report and Plan ADF&G/DWC/SMR&P-2018-41 43
44 Species Management Report and Plan ADF&G/DWC/SMR&P-2018-41
Species Management Report and Plan ADF&G/DWC/SMR&P-2018-41 45
46 Species Management Report and Plan ADF&G/DWC/SMR&P-2018-41

Species Management Report and Plan ADF&G/DWC/SMR&P-2018-41 47
48 Species Management Report and Plan ADF&G/DWC/SMR&P-2018-41
Species Management Report and Plan ADF&G/DWC/SMR&P-2018-41 49
50 Species Management Report and Plan ADF&G/DWC/SMR&P-2018-41
Species Management Report and Plan ADF&G/DWC/SMR&P-2018-41 51
Appendix D. Survey memo for 2016 deer pellet surveys in Prince William Sound, Alaska.
52 Species Management Report and Plan ADF&G/DWC/SMR&P-2018-41
Species Management Report and Plan ADF&G/DWC/SMR&P-2018-41 53
54 Species Management Report and Plan ADF&G/DWC/SMR&P-2018-41
Species Management Report and Plan ADF&G/DWC/SMR&P-2018-41 55
56 Species Management Report and Plan ADF&G/DWC/SMR&P-2018-41
Species Management Report and Plan ADF&G/DWC/SMR&P-2018-41 57
58 Species Management Report and Plan ADF&G/DWC/SMR&P-2018-41
Species Management Report and Plan ADF&G/DWC/SMR&P-2018-41 59
60 Species Management Report and Plan ADF&G/DWC/SMR&P-2018-41


Alaska Department of Fish and Game Division of Wildlife Conservation