deepening integration in sadc : botswana
TRANSCRIPT
Deepening Integration inSADC
Regi
onal
Inte
grat
ion
in S
outh
ern
Afr
ica
- Vo
l. 5
A study conducted for theFriedrich Ebert Foundation
Grace G. Tabengwa, BIDPAJay Salkin, BIDPA
Botswana - a Benchmarkfor the Region

Regional Integration inSouthern AfricaVol 5
Deepening Integration in SADCBotswana - a Benchmarkfor the Region
A study conducted for theFriedrich Ebert Foundation
Authors:Grace G. TabengwaJay Salkin
October 2006
Impressum
Published by
Friedrich Ebert Foundation -Botswana OfficeISBN 99912-564-6-6October 2006
© Friedrich Ebert FoundationAll rights reserved
The material in this publication may not be reproduced,stored or transmitted without the prior permission ofthe copyright holder. Short extract may be quoted,provided the source is fully acknowledged. The viewsexpressed in this publication are not necessarily the onesof the Friedrich Ebert Foundation or of the organizationfor which the author works.
3
Preface
Regional integration can be a key force for sustainable development.
It can promote economic growth, reduce poverty, foster social
development or protect the environment. But, it can also have negative
economic and social impacts, notably when the domestic regulatory
framework is inadequate or not implemented effectively.
The Southern African Development Community, SADC is committed to
deepening the integration processes amongst its members and has adopted
the Regional Indicative Strategic Development Plan (RISDP) in order to provide
strategic direction in the design and formulation of SADC programmes,
projects and activities in order to achieve development and economic growth,
alleviate poverty, enhance the standard and quality of life of the people of
Southern Africa and support the socially disadvantaged, through regional
integration.
Amongst the various measures governments can implement to further
such integration, ensuring sound macroeconomic management is vital. Given
the commitment to deepening SADC integration through macroeconomic
policies, it is important that policy makers in SADC and its Member States
assess the impacts that such measures will have on the social well-being of
its people, both in the short term and the long term.
In view of the above, the Friedrich Ebert Foundation through its office in
Botswana and in close consultation with the Planning Unit of the SADC
Secretariat initiated a regional research programme on “Deepening
Integration in SADC – Macroeconomic Policies and their Impact”.
From the very beginning the programme was designed as a collective
effort of the leading economic research institutions of the region. A total of
14 institutes from 11 SADC member countries followed the call to join the
programme. In two workshops held in December 2004 in Gaborone,
Botswana and in April 2005 in Stellenbosch, South Africa the team developed
detailed terms of reference for the research programme. Phase 1 was to
begin at the country level with a comprehensive study on the present status
of the economies, their congruence with SADC convergence targets, the
respective policy frameworks as well as a social impact analysis. This more
theoretical desk study was complemented by an empirical survey of the
perceptions of Businesses and non-state actors vis a vis SADC. A study on
4
South Africa’s international trade diplomacy and its implications for regional
integration was to give a contextual perspective.
All members of the research team have spent a lot of time and energy
and produced excellent reports. The ideas and recommendations contained
therein have induced some lively as well as controversial discussion among
the participating institutions as well as with other experts. The content of
each study reflects of course solely the views of the authors. I commend all
of them for their great commitment as well as their great team spirit in this
endeavour. I also wish to acknowledge the substantial input we received
from the SADC Secretariat, especially the Head of the Strategic Planning
Unit, Dr. Angelo E. Mondlane, the then Technical Advisor on Finance, Dr.
Moeketsi Senaoana as well as other SADC experts. Other external experts
have also contributed to the final documents as part of the various reference
group meetings in all the participating countries. I wish to extend my greatest
thanks to all them.
In order to make the results of this research programme known to a
broader public, especially among the relevant policy and decision makers of
the SADC region, the Friedrich Ebert Foundation then decided to publish a
series of volumes entitled “Regional Integration in Southern Africa”.
The 5th volume, presented here, contains the findings of the Country
Study and Survey from Botswana by the Botswana Institute for DevelopmentPolicy Analysis, BIDPA in Botswana. My special thanks go to the authors, to
Grace G. Tabengwa and Jay Salkin for writing and revising the document,
to Mompoloki Bagwasi for editing as well as to Peter Maina Kamiti and
MacDonald Gotora for the design and layout.
Gaborone, October 2006
Dr. Marc Meinardus
Resident Representative
Friedrich Ebert Foundation
Botswana Office

5
Table of Contents
Preface........................................................................................... 3
Part 1: Macroeconomic Policies and Their Impact inBotswana
List of Tables.................................................................................. 10List of Chart.................................................................................. 11List of Figures................................................................................ 12Executive Summary...................................................................... 131 Introduction........................................................................... 33
1.1 Background.................................................................. 33
1.2 Objectives of the Study.................................................. 37
1.3 Structure of the Report................................................. 37
2 Regional Indicative Strategic Development Plan(RISDP) Goals and Objectives............................................... 412.1 The SADC Vision and Mission....................................... 41
3 Macroeconomic Convergence and SADC Policy.................. 453.1 Finance and Investment Protocol................................... 46
3.2 The SADC Trade Protocol.............................................. 48
3.3 SADC Labour Market Policies........................................ 49
4 Macroeconomic Stability Indicators..................................... 514.1 Numeric Values of Target Indicators............................... 51
4.2 Data Sources................................................................ 52
5 Macroeconomic Convergence in Botswana.......................... 535.1 Basic Elements and Targets............................................ 53
5.1.1 Inflation........................................................................ 53
5.1.2 Budget Deficit.............................................................. 54
5.1.3 Debt............................................................................. 55
5.1.4 Current Account ........................................................ 55
5.1.5 Other Indicators............................................................ 56
5.2 Botswana's Policy Framework......................................... 59
5.2.1 Current National Development Plan or Strategy............. 59
5.2.2 Botswana's Development Goals and Objectives............. 60
5.2.3 Qualitative Overview of the Domestic Economy............. 63
5.2.4 Government's Expectations about Future
Economic Developments.............................................. 66
6
5.2.5 Botswana's Broad Policy Approach and Priorities........... 68
5.2.6 Overview of Economic Policy......................................... 68
5.2.6.1 Macroeconomic Policy.................................................. 70
5.2.6.2 Fiscal Policy.................................................................. 71
5.2.6.3 Monetary Policy............................................................ 73
5.2.6.4 Exchange Rate Policy.................................................... 73
5.2.6.5 Trade Policy.................................................................. 74
5.2.6.6 Labour Market Policy Framework.................................. 75
5.2.6.7 Human Resources Development................................... 81
5.2.6.8 Employment Creation and Poverty Alleviation............... 82
5.2.6.9 Government’s Approach to Sequencing........................ 83
5.3 Successes and Problem in Achieving Macro-
economic Convergence Targets.................................... 83
6 Detailed Assessment of the Macroeconomic Framework... 856.1 Main Linkages Between Policy Frameworks
and Socio-Economic Impacts..........................................85
6.2 Macroeconomic Conditions Prevailing in Botswana....... 85
6.2.1 Gross Domestic Product ............................................ 85
6.2.2 Employment, Productivity and Unemployment.............. 91
6.2.3 Inflation and Interest Rates........................................... 96
6.2.4 Exchange Rates and Trade............................................ 97
6.2.5 Investment Flows in Botswana...................................... 100
6.2.6 Basic Approaches used in Determining Budgetary
Frameworks................................................................. 103
6.2.7 Recurrent and Development Expenditures and Net
Lending....................................................................... 106
6.2.8 Functional Expenditure Categories................................ 109
6.2.9 Other Policy Issues........................................................ 112
6.2.10 Monetary and Exchange Rate Policies and Trends.................... 113
6.2.10.1 Central Bank and Government Monetary-Fiscal Policy
Interrelationships........................................................................ 116
6.2.10.2 Institutional Arrangements Prevailling within Botswana........... 117
6.2.10.3 Botswana’s Capacity to Design and Implement
Programmes for Macroeconomic Convergence........................ 119
6.3 Botswana’s Political Priorities......................................... 121
6.4 Botswana’s Trade Policies and the Processes of SADC
Integration.................................................................... 122
7
6.4.1 Southern Africa Customs Union (SACU)........................ 122
6.4.2 SADC Free Trade Agreement......................................... 123
6.4.3 Trade Relations with the European Union...................... 124
6.4.4 Trade Relations with the United States of America......... 126
6.4.5 World Trade Organisation............................................. 127
6.5 Impact of WTO Rules on Botswana’s Integration............ 127
6.6 Botswana’s Progress Regarding the Implementation
of the SADC Trade Protocol.......................................... 129
6.7 Trade Flow Analysis....................................................... 129
6.7.1 Trade within SADC........................................................ 131
6.7.2 Trade with the Rest of the World................................... 136
6.7.3 SADC Trade Projections................................................. 136
6.8 Summary of Trade Facilitation Initiatives......................... 137
6.9 Barriers to Trade with other
Countries in the Region................................................ 139
6.10 Implications of Membership overlaps............................. 141
6.11 Botswana’s Labour Market Policy Framework................. 144
6.11.1 Labour Market Trends................................................................. 147
6.11.2 Labour Market Policy Issues for Deepening SADC Integration.. 151
6.12 Causes of Inadequate Income Growth........................... 152
6.13 Major Risks to Attaining the Macroeconomic
Convergence Programme.............................................. 152
7 Social Impact Analysis.......................................................... 1527.1 Social Impact Information Needed for Development
Decisions...................................................................... 155
7.2 Likely changes Induced by Macroeconomic Convergence
Policies......................................................................... 159
7.3 Social Impact and the Decision-Making Process ................. 161
7.4 Adequacy of the Existing Regulatory Framework for
Monitoring and Evaluation of Impacts........................... 162
8 Macroeconomic Challenges Facing Botswana.................... 1638.1 Poverty and Unemployment.......................................... 164
8.2 HIV/AIDS....................................................................... 167
8.3 Lack of Human Capital, Capacity................................... 168
8.4 Lack of Economic Diversification.................................... 169
8.5 Lack of Economic Infrastructure..................................... 172
8.6 Lack of Finance............................................................. 172
8
8.7 Environmental Degradation........................................... 173
8.8 Gender Discrimination................................................... 175
8.9 Governance Problems................................................... 177
9 Special Issues for Future Research....................................... 1799.1 Implications and Impact of Regional Integration............. 179
9.2 Multiple Membership, Overlaps and
Implementation Capacity............................................... 179
9.3 Research on the Trade and Poverty Links........................ 180
9.4 Diversification and Industrial Development..................... 180
9.5 Data Issues................................................................... 181
10 Conclusions and Recommendations.................................... 183References.................................................................................... 191
Part 2: Perception of Business and Non-State Actors inBotswana
List of Tables................................................................................. 194List of Figures................................................................................ 194Executive Summary...................................................................... 1951 Introduction........................................................................... 1972 Methodology......................................................................... 1993 Characteristics of Respondents............................................. 201
3.1 Businesses..................................................................... 201
3.2 Non-State Actors........................................................... 202
4 Perceptions on SADC Regional Integration......................... 2034.1 Impact of Regional Integration....................................... 203
4.2 Impact on Domestic Businesses...................................... 203
4.3 Barriers to Trade............................................................. 205
5 Policy Debate on SADC Integration andWay Forward......................................................................... 213
6 Conclusions............................................................................ 215Appendix......................................................................................... 217
9
Deepening Integration in SADC
Part: 1
Macroeconomic Policies and their Impactin Botswana
10
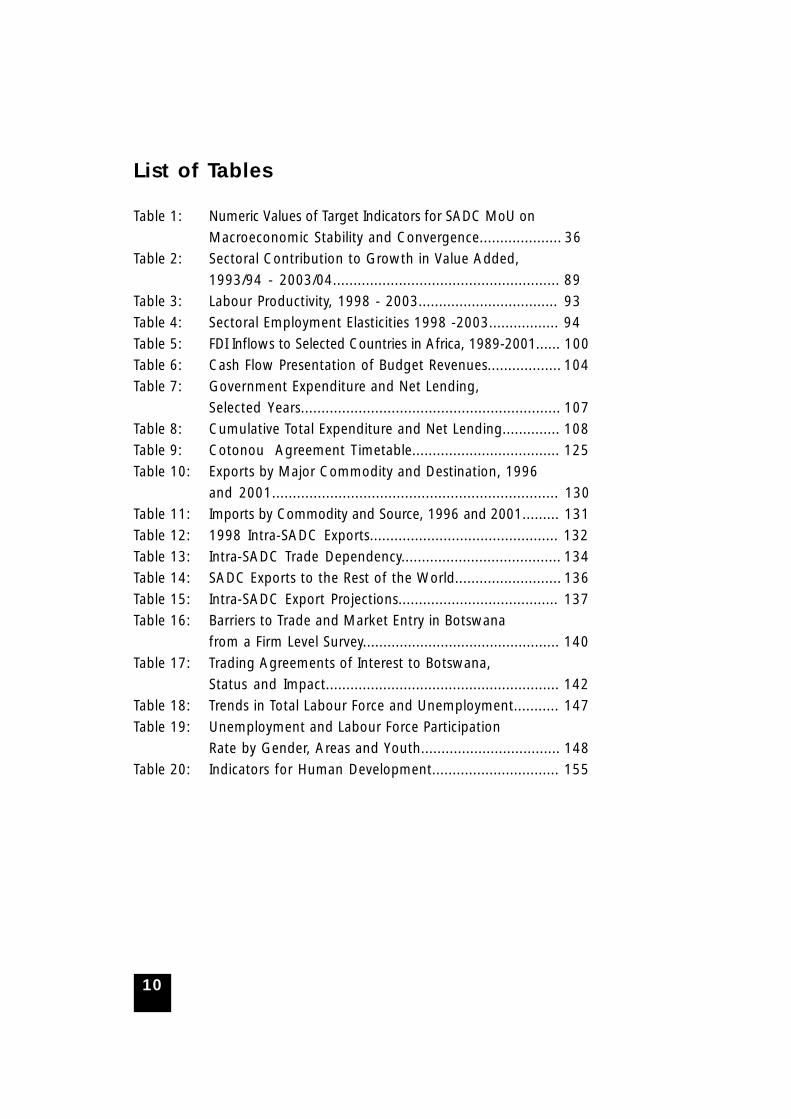
List of Tables
Table 1: Numeric Values of Target Indicators for SADC MoU on
Macroeconomic Stability and Convergence.................... 36
Table 2: Sectoral Contribution to Growth in Value Added,
1993/94 - 2003/04....................................................... 89
Table 3: Labour Productivity, 1998 - 2003.................................. 93
Table 4: Sectoral Employment Elasticities 1998 -2003................. 94
Table 5: FDI Inflows to Selected Countries in Africa, 1989-2001...... 100
Table 6: Cash Flow Presentation of Budget Revenues.................. 104
Table 7: Government Expenditure and Net Lending,
Selected Years............................................................... 107
Table 8: Cumulative Total Expenditure and Net Lending.............. 108
Table 9: Cotonou Agreement Timetable.................................... 125
Table 10: Exports by Major Commodity and Destination, 1996
and 2001..................................................................... 130
Table 11: Imports by Commodity and Source, 1996 and 2001......... 131
Table 12: 1998 Intra-SADC Exports.............................................. 132
Table 13: Intra-SADC Trade Dependency....................................... 134
Table 14: SADC Exports to the Rest of the World.......................... 136
Table 15: Intra-SADC Export Projections....................................... 137
Table 16: Barriers to Trade and Market Entry in Botswana
from a Firm Level Survey................................................ 140
Table 17: Trading Agreements of Interest to Botswana,
Status and Impact......................................................... 142
Table 18: Trends in Total Labour Force and Unemployment........... 147
Table 19: Unemployment and Labour Force Participation
Rate by Gender, Areas and Youth.................................. 148
Table 20: Indicators for Human Development............................... 155
11
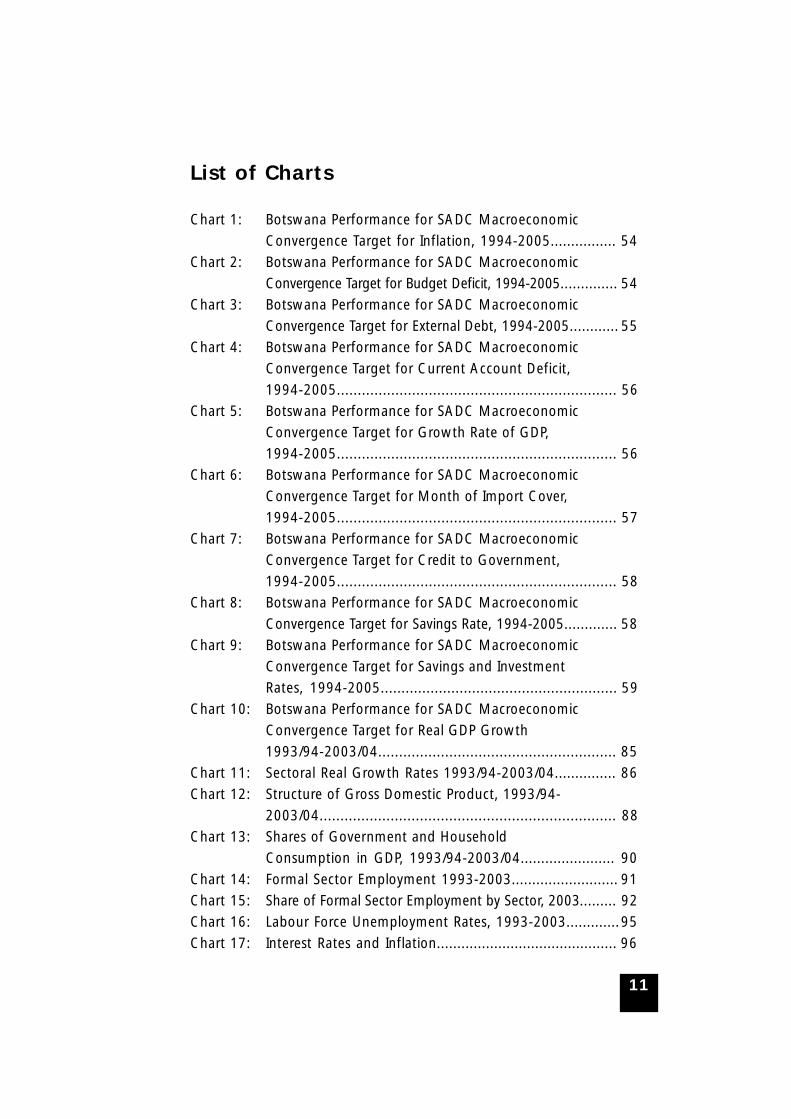
List of Charts
Chart 1: Botswana Performance for SADC Macroeconomic
Convergence Target for Inflation, 1994-2005................ 54
Chart 2: Botswana Performance for SADC Macroeconomic
Convergence Target for Budget Deficit, 1994-2005.............. 54
Chart 3: Botswana Performance for SADC Macroeconomic
Convergence Target for External Debt, 1994-2005............ 55
Chart 4: Botswana Performance for SADC Macroeconomic
Convergence Target for Current Account Deficit,
1994-2005................................................................... 56
Chart 5: Botswana Performance for SADC Macroeconomic
Convergence Target for Growth Rate of GDP,
1994-2005................................................................... 56
Chart 6: Botswana Performance for SADC Macroeconomic
Convergence Target for Month of Import Cover,
1994-2005................................................................... 57
Chart 7: Botswana Performance for SADC Macroeconomic
Convergence Target for Credit to Government,
1994-2005................................................................... 58
Chart 8: Botswana Performance for SADC Macroeconomic
Convergence Target for Savings Rate, 1994-2005............. 58
Chart 9: Botswana Performance for SADC Macroeconomic
Convergence Target for Savings and Investment
Rates, 1994-2005......................................................... 59
Chart 10: Botswana Performance for SADC Macroeconomic
Convergence Target for Real GDP Growth
1993/94-2003/04......................................................... 85
Chart 11: Sectoral Real Growth Rates 1993/94-2003/04............... 86
Chart 12: Structure of Gross Domestic Product, 1993/94-
2003/04....................................................................... 88
Chart 13: Shares of Government and Household
Consumption in GDP, 1993/94-2003/04....................... 90
Chart 14: Formal Sector Employment 1993-2003.......................... 91
Chart 15: Share of Formal Sector Employment by Sector, 2003......... 92
Chart 16: Labour Force Unemployment Rates, 1993-2003.............95
Chart 17: Interest Rates and Inflation............................................ 96
12
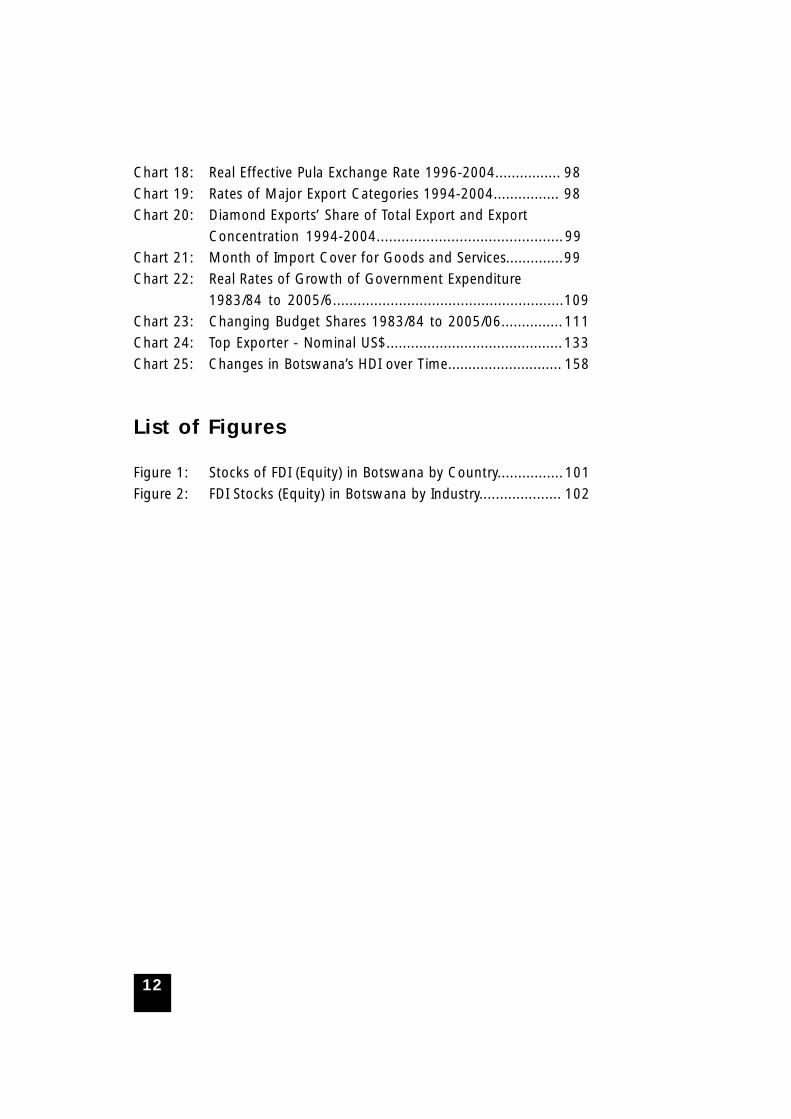
Chart 18: Real Effective Pula Exchange Rate 1996-2004................ 98
Chart 19: Rates of Major Export Categories 1994-2004................ 98
Chart 20: Diamond Exports’ Share of Total Export and Export
Concentration 1994-2004.............................................99
Chart 21: Month of Import Cover for Goods and Services..............99
Chart 22: Real Rates of Growth of Government Expenditure
1983/84 to 2005/6........................................................109
Chart 23: Changing Budget Shares 1983/84 to 2005/06...............111
Chart 24: Top Exporter - Nominal US$...........................................133
Chart 25: Changes in Botswana’s HDI over Time............................ 158
List of Figures
Figure 1: Stocks of FDI (Equity) in Botswana by Country................101
Figure 2: FDI Stocks (Equity) in Botswana by Industry.................... 102
13
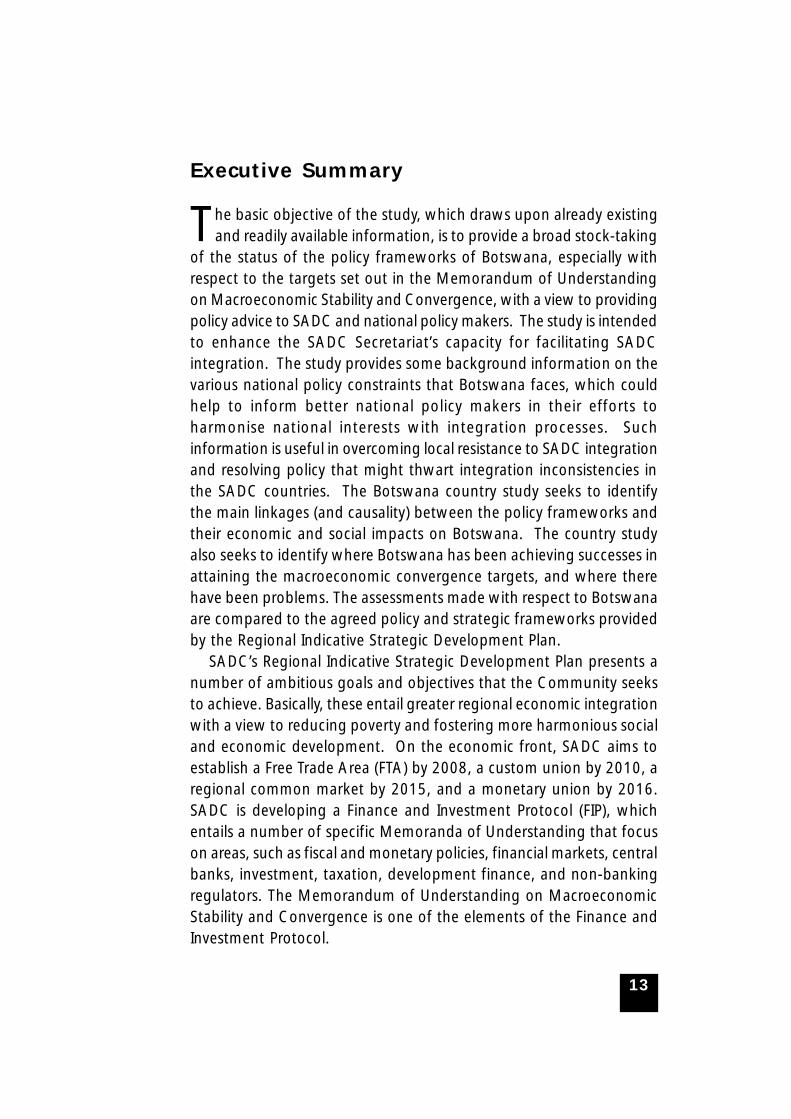
Executive Summary
The basic objective of the study, which draws upon already existingand readily available information, is to provide a broad stock-taking
of the status of the policy frameworks of Botswana, especially withrespect to the targets set out in the Memorandum of Understandingon Macroeconomic Stability and Convergence, with a view to providingpolicy advice to SADC and national policy makers. The study is intendedto enhance the SADC Secretariat’s capacity for facilitating SADCintegration. The study provides some background information on thevarious national policy constraints that Botswana faces, which couldhelp to inform better national policy makers in their efforts toharmonise national interests with integration processes. Suchinformation is useful in overcoming local resistance to SADC integrationand resolving policy that might thwart integration inconsistencies inthe SADC countries. The Botswana country study seeks to identifythe main linkages (and causality) between the policy frameworks andtheir economic and social impacts on Botswana. The country studyalso seeks to identify where Botswana has been achieving successes inattaining the macroeconomic convergence targets, and where therehave been problems. The assessments made with respect to Botswanaare compared to the agreed policy and strategic frameworks providedby the Regional Indicative Strategic Development Plan.
SADC’s Regional Indicative Strategic Development Plan presents anumber of ambitious goals and objectives that the Community seeksto achieve. Basically, these entail greater regional economic integrationwith a view to reducing poverty and fostering more harmonious socialand economic development. On the economic front, SADC aims toestablish a Free Trade Area (FTA) by 2008, a custom union by 2010, aregional common market by 2015, and a monetary union by 2016.SADC is developing a Finance and Investment Protocol (FIP), whichentails a number of specific Memoranda of Understanding that focuson areas, such as fiscal and monetary policies, financial markets, centralbanks, investment, taxation, development finance, and non-bankingregulators. The Memorandum of Understanding on MacroeconomicStability and Convergence is one of the elements of the Finance andInvestment Protocol.

14
The RISDP is designed to provide strategic direction with respect toSADC programmes, projects and activities. The RISDP aligns thestrategic objectives and priorities of SADC with the policies andstrategies to be pursued towards achieving those goals over a periodof ten to fifteen years. The RISDP is indicative in nature and outlinesthe necessary conditions that should be realised towards the attainmentof SADC’s regional integration and development goals. In view of theneed to monitor and measure progress, the RISDP sets targets that
The Memorandum of Understanding on MacroeconomicConvergence specifies that Member States should converge on stability-orientated economic policies in a co-operative manner. This is inrecognition that in order to accelerate growth of economic activity,investment and employment in the SADC region, there is need forincreased co-operation and co-ordination in the formulation andimplementation of macro-economic policies. In adopting theMemorandum of Understanding, the SADC leaders expressed theirconcerted view that regional economic integration and macroeconomicstability are preconditions for sustainable economic growth and forthe creation of a monetary union in the SADC Region. For them,Macroeconomic Convergence means that Member States movetowards having low and stable rates of inflation and sustainable levelsfor budget deficits, public and publicly guaranteed debt, and currentaccount balances. Thus, under the agreement, each Member Stateagrees to adopt stability-orientated economic policies aimed atrestricting inflation to low and stable levels, maintaining a prudentfiscal stance based on the avoidance of large budget deficits,monetisation of deficits and high or rising ratios of public and publiclyguaranteed debt to GDP, avoiding large financial imbalances in theeconomy and minimising market distortions.
It is therefore, the purpose and aim of this study that is also beingconducted in the various SADC countries, to assess the performanceof Botswana in attaining the SADC Macroeconomic convergencetargets, as well as to highlight the main challenges that the countryfaces in attaining some of the convergence targets.
Botswana’s Macroeconomic Convergence Programme andPerformance Botswana has not formally adopted a MacroeconomicConvergence Programme in line with the Memorandum of
15
Understanding on Macroeconomic Stability and Convergence.Nevertheless, Botswana has already made great strides in movingtowards and achieving most of the targets set for the Memorandumof Understanding. Indicated below is a summary, of the basic statusand performance of Botswana with respect to the targets, along withsome general discussion of the policy frameworks and issues regardingthe target variables. A more detailed discussion of these frameworksand issues is taken up in Section VI of the report.
Inflation
Since a serious episode of escalating inflation that peaked at 17.7percent in 1992, Botswana’s monetary policy has given highest priorityto achieving and maintaining monetary stability, which encompassesthe objective of a low and stable rate of inflation. Botswana broughtits average annual rate of inflation to within the SADC target by 1997;and, apart from an aberration in 2003 caused by the introduction ofVAT, Botswana has been able to stay within the target level since thentill 2005 when inflation started going up again following the changein the exchange rate policy and the devaluation of the currency.However, Botswana strives for an even lower upper limit for inflation,which is more in line with that in South Africa and other moredeveloped countries.
Budget Deficit
Because of the high variability of its major revenue source (i.e., mineralrevenues from diamonds), and to avoid having a pro-cyclical fiscalpolicy, the Government has traditionally adopted a fiscal strategy ofachieving a balanced budget over the medium term horizon; e.g., anational development plan period. Botswana has had deficits in fiveof the 12 years (1998, 2001, 2002, 2003 and 2004); but only in 1998did the deficit exceed the 5% upper bound of the SADCmacroeconomic convergence target. Over the entire period, therehas been a small budget surplus as a percent of GDP (1.2%).

16
Debt
The Government has traditionally espoused a policy of only taking onan external debt that it has good prospects of being able to service;i.e., serviced by the proceeds (additional incomes) deriving out of theprojects financed by such a debt. Once the country graduated frombeing a least developed country, and had accumulated substantial levelsof international reserves, very little additional debt was taken on; andthat was typically of a concessional nature. Botswana, with debt toGDP ratios ranging from 11 percent to 5 percent, has remained wellwithin the macroeconomic convergence upper bound of 60 percentfor debt to GDP. The Government, did not attempt to borrow fromthe domestic market once revenues from diamonds becamesignificant,. However, in 2003, Government initiated a programmeof issuing three Government bonds in order to develop the domesticcapital market, create a long-term yield curve, and provide aninvestment vehicle for insurance and pension funds, the latter of whichhad been generously endowed through the establishment of the PublicOfficers Pension Fund.
Current Account
Botswana has not adopted any explicit targets for the current accountbalance in recent years; in part because the country has recordedcurrent account surpluses since the early 1980s, mainly due to thehealthy performance of mineral export and thus, Botswana hasconsistently achieved the SADC macroeconomic convergence targetof having a current account deficit not greater than 9 percent of GDP.
Growth Rate
Botswana’s long-term Vision 2016 has a target growth rate of realGDP of 8% p.a. for the 20 year period from 1996 to 2016. Botswanahas not achieved that rate of growth on average for the period from1996 to 2003; although it was achieved on three occasions since 1996,mainly due to rapid growth of mineral production and Governmentexpenditure. The projected growth rate for the National Development
17
Plan 9 was only 5.5% p.a. The Mid-Term Review of NDP 9 forecaststhat an even lower average rate of growth will be achieved for thePlan period. Compared to the SADC target growth rate of at least 7percent per annum, Botswana has been experiencing problems. Thus,Botswana is challenged by sluggish growth, which poses furtherproblems for Botswana’s strategies for economic diversification,employment creation, poverty eradication and a more equitabledistribution of income.
Foreign Exchange Reserves
Since the early 1980s, Botswana has been able to accumulatesubstantial levels of international reserves, well in excess of the SADCmacroeconomic convergence target, and well in excess of the targetlevel felt to be appropriate for Botswana, given the structure of itseconomy and the risks-fluctuations to which it is subject. In pastNational Development Planning exercises, target levels for internationalreserves were estimated at 9-11 months of import cover for goodsand services in the 1980s and 7-9 months of import cover in the 1990s.Such targets are used in guiding the allocation of the investment ofthe international reserves into short term assets (the Liquidity Portfolio)and long-term assets (the Pula Fund). While still in excess of the SADCmacroeconomic convergence target of at least four months cover,there has been a notable drop in Botswana’s level of import cover dueto a decline in the level of official international reserves and risingimports in recent years.
Central Bank Credit to Government
The Bank of Botswana Act sets a limit on the extent to whichGovernment can borrow from the central bank. In general, in factthe Bank of Botswana has not lent any money to Government or anyparastatals during its 30 years of existence. Thus, over the last 12years, Botswana has satisfied the macroeconomic convergence targetof having central bank credit to Government not exceeding 10 percentof the previous year’s tax revenue. In contrast, the Government hasmaintained substantial cash balances (deposits) at the Bank of
18
Botswana, which have constituted the major portion of the country’sofficial international reserves until recently.
Domestic Savings Rates
Botswana has not established an explicit target savings rate, comparableto the SADC macroeconomic convergence target of 25% of GDP. But,one can be derived for Botswana from the target investment rate of40% of GDP and the target ratio of foreign direct investment relativeto GDP (which averaged 0.052 in NDP 9). Thus, Botswana’s targetsavings rate would be about 34.8% of GDP, something the countryhas been able to achieve over the past 10 years. Hence, Botswana hasbeen able to achieve the SADC target savings rate of 25 percent ofGDP.
Domestic Investment Rates
In order to achieve the target growth rate set in Vision 2016, of 8%p.a., with an estimated incremental capital-output ratio of 5.0,Botswana needs to have an investment of about 40% of GDP. Thattarget investment rate has not been achieved in recent years.Botswana’s investment rate averaged 25.3 percent from 1994 to 2003.
Prevailing Macroeconomic Policy Framework and EconomicChallenges Botswana’s macroeconomic policy framework is generallysupportive of the private sector and market-oriented development.Government has maintained a sound and stable fiscal position, runningbudget surpluses over most of the past two decades and accumulatingsubstantial long-term savings, which are reflected in the nation’srelatively high level of foreign exchange reserves. The country hasmaintained a relatively stable and, in the view of many analysts, areasonably competitive real exchange rate vis-à-vis its major tradingpartners. The Government has devalued the Pula exchange rate twicein the past 16 months in order to restore the internationalcompetitiveness of local producers. Positive real interest rates,comparable to those in major international markets, have supportedsound investments and allowed for progressive liberalisation andeventual abolition of exchange controls (Leith, 1997b, 2000). Sound
19
monetary policy has kept inflation fairly low and stable. The IncomesPolicy has attempted (with some success) to restrain wage increasesto be in line with productivity. Trade policy has been oriented towardshaving a relatively open-economy, with prices and costs in line withinternational norms. Shortages of skilled labour, while a cause forconcern, have been ameliorated through recruitment of expatriatesand generous government support for education and trainingprogrammes (BOB, 2000). Because the local market is so small,manufacturing and other industries in Botswana cannot expect toderive most of their growth or achieve large scale economies fromjust domestic demand (Jefferis, 1997a). The major challenge will beto promote manufacturing and other non-traditional exports, sincethey will face increasing competitive pressure in both domestic andforeign markets as regional and global trade barriers come down andthe flow of international goods and services becomes freer.
There are still a number of critical development challenges thatBotswana faces which the economy needs to deal with decisively inorder to realise sustainable development in the 21st century and tocontinue sustaining the level of stability the economy has attained sofar, which has played a crucial role in the good performance Botswanahas on attaining convergence in most of the macroeconomic targetsdiscussed above. These challenges include poverty, unemployment,HIV/AIDS and development of human capital, as well as speeding upthe process of economic diversification.
Poverty
It still remains important and urgent for the diversification strategy tobear fruit so that the unemployment problem can be reduced andthat the industries and sectors that should play a role on Botswana’sdevelopment be expanded in order that the poverty problem can beaddressed. This is quite a challenge for the country, especially in viewof the relatively slow pace of diversification to date and the continuinghigh rate of unemployment over the years. With these dynamics, therealisation of the goal of Vision 2016 to reduce the proportion of thepopulation living below the poverty datum line to 23% by the year2008, and to zero by 2016 is thus a great challenge for Botswana.
20
In dealing with the challenges of poverty in Botswana, strategiesfor poverty reduction and its eradication need to recognise some ofthe prevalent poverty dynamics in Botswana where many people inrural areas are poorer than those in urban areas, with female headedhouseholds being generally poorer than male headed households. Therelatively low impact of economic growth on poverty is also strainingBotswana’s development. Most countries with per capita GDPcomparable to Botswana’s have income poverty rates of less than 10%.Yet for Botswana, nearly one-third of the population subsists belowthe poverty line. One of the aspects of the dynamics of poverty inBotswana also involve Involves how to deal with the battle againstpoverty in the era of HIV/AIDS, which has implications for thepopulation’s health and other socio-economic indicators, as well asthe viability of the country’s institutions, especially public institutions.Indications are that HIV/AIDS could very easily generate governancefailures of catastrophic proportions. A 2000 BIDPA study on Povertyand HIV/AIDS indicates that with HIV/AIDS, poverty could increase byas much as 10 percent as opposed to a situation without HIV/AIDS,and the number of orphans and dependents could double.
HIV/AIDS
One of the major developmental challenges that Botswana faces isthe HIV/AIDS pandemic. The spread of HIV/AIDS represents a seriousthreat to Botswana’s development and the attainment of the nation’svision objectives. Planning for human development in the context ofHIV/AIDS poses serious challenges for Botswana, not only because ofthe high rate of prevalence which leads to human suffering and death,but also because of the macroeconomic impacts that HIV/AIDS has onthe labour market, human development processes and public finances.The high economic growth rates and progress on the humandevelopment front are being threatened by the pandemic, which affectsprogress made on health. Poor health easily translates into poverty forsick people who seldom earn an adequate income. The HIV epidemicthreatens to reverse the gains in public health and has implications forthe progress made on human development indicators such as lifeexpectancy, infant mortality and others.
21
The pandemic also poses a threat for the sustainability ofgovernment expenditure on health which has risen sharply as a resultof the growing demands on the health system and in the provision ofanti-retroviral therapy. While there are efforts that are currentlyunderway in Botswana to curb the spread of the virus through theprovision of antiretroviral drugs and counseling services to thoseaffected to prolong their lives, as well as the provision of preventionof mother to child transmission services, it still remains critical for thegovernment to implement the various programmes and policiesrigorously and effectively to ensure that the macroeconomic balanceand progress made on the development front are not seriously affected.The NGOs that have responded positively to working hand in handwith government in the fight against the scourge also need to continueplaying their role and ensuring their continued support with morerigor so that the fight against the HIV/AIDS pandemic is won.
Lack of Human Capital and Capacity
While there have been some positive achievements and plans tocontinue promoting skills and education to achieve one of the ambitiousvision objectives; “to have an Educated, Informed Nation by 2016,” itremains a challenge for Botswana to fill the existing gap in terms ofthe lack of educated and skilled personnel which forms one of themajor constraints to Botswana’s economic development. In enhancinghuman capital and capacity, it remains important for Botswana totrain its labour and match it with the skill requirements of the market.This would go a long way in reducing dependency on imported labourand the high incidence of high level posts being held by expatriates.While some notable progress has been achieved in attaining localexpertise that are capable of holding top positions that were originallyheld by expatriates, Botswana still faces an education policy challengethat should ensure that all training institutions, from primary to tertiarylevel, are set up in such a way that they address the skills gap thatexists in the economy. Human resources need to be geared towardsthe needs of the country and to the job market in particular, so thatmany citizens may enter the labour market with appropriate skills thatmatch the employment opportunities. In this regard, Botswana faces
22
the challenge of matching the human resource requirements andprovision across sectors by establishing proper frameworks andmanagement processes and developing a culture of life-long learning.The effect of HIV/AIDS upon the future availability of skilled andexperienced personnel must also be fully taken into account in theplanning process.
Lack of Economic Diversification
While Botswana’s diamond industry has experienced rapid growth overthe past three decades, it is unlikely that it will continue to grow sorapidly in the future. Botswana cannot expect to continue to find therichest, most profitable diamond deposits in the world within itsboundaries. Finding new engines of growth outside mining will becrucial for further rapid growth in real incomes. This has proved to bequite a challenge within this landlocked economy and small domesticmarket.
In implementing the Vision 2016 strategies, Botswana will need todevelop the capacity of small, mostly female operated and often ruralbased enterprises. The greatest challenges faced by businesses generallyare access to capital, a shortage of adequately trained personnel andlack of business management expertise. Government has madeeconomic diversification a priority. However, such an endeavourcontinues to progress slowly, despite government’s efforts to wooforeign investors, or develop indigenous entrepreneurship throughefforts such as the Citizen Entrepreneurial Development Agency(CEDA).
Special Issues for Future Research
Implications and Impact of Regional Integration
Given the commitment to deepening SADC integration throughmacroeconomic policies aimed at achieving certain agreedmacroeconomic convergence targets, it is important that policy makersin SADC and its member states assess the impacts that integration willhave on the social wellbeing of its people, both in the short term and
23
long term. Individual countries need to conduct research on theimplications of the various integration initiatives they are pursuing andbalance them in accordance with economic priorities. Botswana is amember of various regional integration blocks and trade agreements,including SACU, SADC, the Cotonou Partnership Agreement andAGOA. The objectives of regional integration in the various agreementsoverlap and, as such, it is imperative that research be carried out onthe possible benefits and the impact of the agreements on the country’slong term trade aspects and developmental aspirations. Such researchwill also identify which issues should be aligned and pursued within acertain agreement, and more importantly, where the benefits arehigher. Such research and information would help to ensure thatcountries reap the benefits of integration and are also guided by whatthey stand to benefit in any agreement.
Multiple Membership, Overlaps and Implementation Capacity
Botswana is a member of various trade agreements that are at differentlevels of negotiations. The implementation of the agreements overlapand this poses costs in the negotiation process and in fulfillingmembership obligations. It is also a complex task to ensure that thenegotiation mandates in the various arrangements do not conflict witheconomic objectives and those of the integration process. Also, thenegotiation process requires capacity and expertise to handle thecomplex issues involved. It is, therefore, important for research to beconducted on the costs of membership and implementation of thevarious trade arrangements. Having trained experts in the negotiationprocess could also enhance the benefits that can be derived from theintegration process and also ensure that the agreements are in harmony,both in their pursuit of regional objectives and national objectives ofdevelopment.
Research on the Trade and Poverty Links
While Botswana has made substantial progress on the developmentfront, it still faces widespread poverty and unemployment. Variousefforts and policies have been put in place to address the high incidence
24
of poverty and unemployment, but the incidence of both still remainshigh. It is, as such, important that research on identifying the possiblelinks between trade, employment and poverty be conducted and waysin which regional integration through trade can be exploited to addressthe poverty and unemployment problems. Such research will not onlygive us information on why the linkages may have been weak, but itwill also shed insight on how to maximise the benefits and how tostrengthen the linkages.
Diversification and Industrial Development
While Botswana is making efforts at the national level to diversify theeconomy, it still remains critical for the industrial sector to develop toa level where the industries can effectively play a role in expandingtrade at a regional level as envisaged in the SADC FTA. Focused researchon how these industries will be affected, especially at the early stagesof development, is critical. Without such research and information,some countries may end up as losers from the integration process.Also, issues on how economies may protect their industries as theyopen up markets to more free trade is important. For Botswana, witha limited industrial base and lack of a diversified export base, morecompetition may thwart the diversification exercise and result in greaterdependency on imports.
Data Issues
There are important data needs in Botswana to facilitate research workon the impact of regional integration on the broader economy. Theaspects that need particular attention in as far as data collection,compilation and dissemination are:• the frequency of the data• the timeliness of the data• the level of dissaggregation• broadness and coverage• consistency of the data• accuracy of the data

25
Areas where data is needed to facilitate research work in the specialissues identified in the previous section include: data on poverty whichis currently being compiled on a ten year cycle basis; trade data (whichis often late) not disaggregated to allow for more focused sectoralanalysis; data on employment where labour force surveys are conductedafter 10 year periods; relevant data on fiscal, monetary, educationand training health and capital market-related data. Harmonisation ofdata collected in the region will also allow for meaningful comparisonson what effects regional integration will have in the individual countries,as well as on monitoring the convergence programme. Further, moreresearch can be easily carried out on some of the important linksbetween trade and other important regional issues such as povertyand unemployment and its impact on social and economicdevelopment.
Conclusions
Botswana’s success lies in the prudent macroeconomic managementof resources through the national planning process, which is linked tothe national budgeting process and the Vision 2016 aspirations, whichemphasise and focus on themes that are in line with the SADC RIDSPgoals and objectives of achieving sustainable and equitable growthand socio-economic development through efficient productive systemsand good governance. Botswana’s growth, has been mainly driven bythe mining sector which coupled with the good macroeconomic policyframework that has existed have led to Botswana’s good performance.It is through prudent policy making and the availability of diamondrevenues that Botswana has had good fiscal and monetary policiesthat have contributed towards the achievement of high growth ratesand the attainment of most of the SADC macroeconomic convergencetargets. The economy has not formally adopted a MacroeconomicConvergence Programme in line with the Memorandum ofUnderstanding on Macroeconomic Stability and Convergence, since ithas made great strides in moving towards and achieving most of thetargets set for the Memorandum of Understanding.
Botswana is already compliant with most of the set SADCmacroeconomic convergence targets. The economy has low external
26
debt, as a result of many years of running budget surpluses andaccumulating substantial levels of international reserves. The budgetsurpluses are mainly the result of the Government fiscal policy ofavoiding pro-cyclical fiscal policy and adopting a strategy of having abalanced budget over the medium term. Since the 1980’s, Botswana’scurrent account has been in surplus and as such the country has nothad to adopt any explicit target for the current account balance in linewith the SADC macroeconomic convergence programme. Botswana’smonetary policy has also given highest priority to achieving andmaintaining monetary stability, which encompasses the objective of alow and stable rate of inflation. This has brought and maintainedinflation within the SADC target by 1997, and, apart from an aberrationin 2003 which was caused by the introduction of VAT, the country hasstayed within the target range since then until August 2005.
The two targets that Botswana is still not complying with are thegrowth rate which has remained lower than the SADC average targetof 7% and the rate of investment. Botswana’s GDP growth rate hasfluctuated mainly in response to developments in the mining sectorand generally has been lower in recent years, less than the Vision2016 target of 8% p.a, as well as the SADC target of 7%. NDP 9projects an average annual growth rate of of 5.5%, while the Mid-Term Review of NDP 9 forecasts even lower growth.
Investment has also been lower than the SADC target of 30% ofGDP and has also been concentrated in the mining and governmentsectors. Many efforts have been put in place to continue attractinghigher levels of investment particularly in the non-mining sectors ofthe economy. This is expected to contribute to the nation’sdiversification strategy.
Botswana has also not enjoyed the full benefits of trade emanatingfrom a diversified export base, since one sector has dominated itsexport profile. Botswana exports a few products, notably diamonds,beef, soda-ash, copper-nickel and textile products. The industrial baseremains small and the manufacturing sector is still in the early stagesof development. The domestic market is also small, limiting expandedtrade opportunities and effective participation in the integration processwithin the trade front.
27
While there are quite a number of good policies that havecontributed towards Botswana being a success story in the SADCregion, there is still widespread poverty in Botswana. Many Batswanaare still poor implying that the benefits of growth have not beenequitably distributed or re-distributed and targeted to effectivelyaddress the widespread poverty. Also linked to poverty is the prevailinghigh level of unemployment in the economy. The high incidence ofHIV/AIDS also poses a challenge in attaining high growth rates andaddressing policy priority areas such as poverty and unemployment.
Recommendations
Botswana Specific Recommendations
Botswana has made efforts and continues to refine some policies andinitiatives to address the areas where it is lagging behind in the SADCmacroeconomic convergence programme and its long termdevelopment. The economy pursues policies that are in line with theSADC vision of promoting sustainable growth and promoting moreproductive systems. Policies have also been formulated to address thelow investment, boosting GDP growth and promoting growth of thenon-mining sectors and enhancing private sector development. It is acommonly expressed view in Botswana that the problems that existare mainly not due to poor policies, rather they are largely the resultof a failure to implement the existing policies. For Botswana to realiseits vision, there will be a need to address implementation problems,and to introduce stringent monitoring mechanisms at every level ofthe public sector. There are policies that are targeted at the challengesthat Botswana faces, mainly, the high poverty levels, highunemployment and the HIV/AIDS problem. In this regard, therecommendations drawn below emphasize areas where these effortsneed to be strengthened and issues where Botswana can use theregional integration interface to enhance some of its policy aspects tobecome an effective player in the integration process, while alsopromoting its national interests. On the basis of this background andconclusions, for Botswana to be competitive, more productive andeffective in the regional integration process in the SADC region, it isrecommended that:
28
Botswana should build capacity in the existing institutional structuresto effectively implement policies that can address the problem areasthat may reverse the achievements made on the SADC macroeconomicconvergence targets and also identify areas where further regionalintegration can be used as a vehicle to achieve more growth anddevelopment. This is important in ensuring that issues of povertyreduction and high unemployment are given a stronger focus andthat the institutional mechanisms for policy implementation areadequate. In particular, Botswana should develop monitoringmechanisms and clear punishment and reward systems for both labourand management. There is also a need to speed up processes so thatdecisions do not take longer than necessary to be implemented.
It is imperative for Botswana to strengthen its diversification strategyso that other sectors of the economy, besides the mining sectors canplay a more significant role in GDP growth. Regional integration inSADC is one avenue that Botswana can explore to enhance its growthand tap on the growth opportunities that are available. Given thecurrent challenges of the economy, there is need to have industrialtargeting policies rather than the past ones that were not specificallytargeted. Government efforts to promote investments, both local andforeign, should be more selective, focused on investments that arelocal-resource based or whose outputs are targeted at export markets.As such, investments should be sought for such industries as tannery,leather products, meat processing, diamond processing and jewellery,etc. Such industries will enhance the values of those local resourcesthat are currently exported in less valuable raw state. In addition, theywould create employment opportunities’, diversify the country’sindustrial base, and enhance Botswana’s export earnings. An effectiveimplementation of this strategy requires a detailed inventory of inputmaterials (hides and skins, diamond, livestock etc) available in thecountry, the possible outputs from them, and the markets for suchoutputs. Efforts by BEDIA and other investment promotion agenciesto promote local as well as foreign investments should then be directedat those aimed at utilizing such available resources. The country shouldalso be identifying niche markets for some of its products.
The private sector has to play a role in Botswana’s developmentgiven the potential the sector has in generating more employment

29
opportunities and growth and, as such, it needs to be strengthened.The private sector also needs to participate fully in the integrationprocess and explore markets and other growth prospects that theprocesses of regional integration of SADC may avail. This requires thatthe private sector be taken on board in all negotiations and decisionmaking. The Botswana Government has already committed itself toplaying the role of a facilitator, while allowing the private sector totake the lead. The government’s facilitative role requires a closerrelationship with and understanding of the private sector. In order tofoster such understanding and relationship, government needs to bemore knowledgeable about the private sector. Such knowledge is bestprovided by periodic studies on the challenges industrialists face whichmay constitute barriers to their growth or even survival. For example,there is a concern on the low labour productivity in Botswana. TheBotswana National Productivity Centre (BNPC) should research thatproblem, establish its dimensions, causes and what could be done tosolve the problem.
Botswana should integrate its trade policy into its planning process,since this will help to ensure that trade is given priority and thatresources are committed towards pursuing trade initiatives that willbenefit the economy. In this regard, Botswana should align its tradedevelopment strategy to the SADC trade objectives, which aim todeepen integration while at the same time balancing it with nationalinterests and long term development objectives of the economy.
Efforts and initiatives aimed at attracting foreign investment needto be pursued with more rigour. FDI can play a significant role in thelong term growth of the economy through the technology, skills andproduct innovation that it brings to the economy, which can impactpositively on Botswana’s diversification policy. Some elements of theSADC Finance and Investment Protocol can be integrated intoBotswana’s investment strategy to allow the country to tap into someof the benefits that may be derived from pursuing regional investmentinitiatives. Some of the identified solutions to the constraints to FDIinflow should be implemented as a matter of urgency. For example,the issue of work permits which has been a challenge in terms ofgetting and keeping needed skilled labour in the country. Governmentrealizes that in view of the small size of Botswana’s domestic market,

30
the required economic growth and development can come only fromvigorous and sustained growth in international trade in goods andservices. Consequently, reform policies are being aimed at raisingproductivity and efficiency of domestic resources, aligning the exchangerate of the domestic currency and thereby improving the internationalcompetitiveness of Botswana producers. In addition to local resource-based industries, export-oriented industries promote growth and createemployment opportunities. Because they add value to any inputs theymight have imported, they are usually favoured with incentives andexemptions from import restrictions. The drive for FDI in particularshould accord greater priority and efforts to industries that are engagedin production for the export market.
Botswana needs to continue to deal with the HIV/AIDS challenge,particularly on its impact on the broader economy, such as on thesupply of skilled labour, government resources, and positivedevelopments made on the human development front. The war ondealing with the attitudes and stigma associated with the disease inparticular needs to be given a high priority. There is need to intensifyeducation regarding the diseases so that the country can slow downthe rate of new infections.
Industrial development should also form one of the priority areasfor Botswana. This can contribute to more production and products inthe market and enhance Botswana’s export profile, which is imperativeif Botswana is to compete successfully in the regional integrationprocess and benefit from trade. Also, promoting industries that canform linkages with others is quite important. The proximity to SouthAfrica constitutes both an opportunity and a threat to Botswana.Potential investors in productive enterprises in the southern Africanregion tend to favour South Africa, rather than Botswana, as theirdestination for a number of reasons––proximity to seaport, largedomestic market, low cost of utilities, affordability and availability ofinvestible funds, better infrastructure, higher technological skills andfacilities. On the other side of the coin these are the higher tax rate,the high crime rate and relative social instability, which constitute SouthAfrica’s weaknesses. A proactive reaction to these two dimensions ofthe proximity to South Africa can turn both into an advantage.Botswana can turn its relative disadvantage of size and lower level of
31
technological development into an opportunity by integrating itsindustrial activities into those of South Africa. Integrated manufacturingagreements could be negotiated with selected major manufacturersunder which Botswana would produce and supply component partsto South African producers, instead of establishing production unitsof competing brands. Such agreements seem viable in such industriesas motor vehicle manufacturing, electronic and household appliances,agricultural equipment, etc. The initiative for such contractualarrangements can be facilitated by a government to governmentapproach and negotiation, involving the ministries of Foreign Affairs,Trade and Industries, Finance and Economic Development and theprivate sector organisations such as BOCCIM.
Botswana has to strive to improve its labour productivity to becomemore competitive in the region. The efforts to this aspect have severaldimensions, some of which are embedded in the education system,the system of rewards and general incentives in the labour market,the general attitude towards work, etc. These issues need to be dealtwith urgently. Some of the solutions have already been identified andit is now a problem of slow implementation. For example, thePerformance Management System in government is moving at a pacethat is very slow. There is a general need for the country to implementstructural reforms that have been agreed upon in a timely manner.The privatisation policy, for instance, has been in place since 2000,and even though it was approved, to date not a single enterprise hasgone through the steps of privatisation. With deeper integration,productivity improvements will become increasingly important for thecountry’s survival and success in the global market.
It also remains important for Botswana to remove obstacles to tradeand investment and ensure that there is a conducive regulatoryenvironment that would facilitate a smooth integration process. Areview of current laws and regulations that may prevent local or foreigninvestments in several sectors is necessary. For example, the BotswanaMeat Commission Act, which confers monopolistic rights to exportfresh meat on the Commission, needs to be reviewed if newinvestments are to be attracted to the meat industry. Similar laws inother sectors need to be reviewed if there is to be new investments inthose sectors.
32
General Recommendations
While there are specific issues that Botswana needs to deal with at thenational level, as indicated above, for effective participation indeepening integration in SADC, there is need for a concerted effortby all SADC member states to make this a reality.
It is imperative that all SADC members states adopt stability-orientedpolicies in a cooperative manner. This is in recognition of the fact thatin order to accelerate the growth of economic activity, investmentand employment in the SADC region, there is need for increasedcooperation and co-ordination in the formulation and implementationof macro-economic policies. It is upon each member state to eliminateall obstacles on trade, investment and movement of labour that mayhinder the integration process, allowing for other countries to alsoparticipate effectively to achieve the benefits of deeper integration inSADC.
This calls for increased cooperation, co-ordination and managementof macroeconomic stability and implementation of monetary and fiscalpolicies in the region that are vital in accelerating growth, trade andinvestment, employment creation, and achieving reductions in povertyand high unemployment. Without a collective effort in dealing withthe challenges that face the individual member countries in strivingtowards deeper SADC regional integration, the regional integrationprocess may be a failure, with some of the important RISDP objectivesnot being met.
33
1 Introduction
1.1 Background
The Friedrich Ebert Foundation Botswana, in close consultation withthe SADC Secretariat, played a pivotal role in supporting this
research by organising a workshop on “Deepening Integration in SADC– Macroeconomic Policies and their Impact”. The workshop was heldon the 6th-7th December 2004 in Gaborone, Botswana. It broughttogether regional macroeconomic researchers and policy analysts, witha view to developing the concept and the terms of reference for aregion-wide study on deepening integration in SADC; one study foreach SADC country. The purpose of the various studies on Botswanaand the other SADC countries is to provide the SADC Secretariat andnational policy makers with macroeconomic policy advice on how theprocesses of SADC integration can be facilitated, as well as informationon the various options that could be pursued on the path of integration.In the process of formulating the Terms of Reference for the study, itwas agreed that the SADC Regional Indicative Strategic DevelopmentPlan (RISDP) would serve as the basic reference document for the study.
The workshop agreed that country studies would be carried out todescribe and analyse the present status of the implementation of thevarious SADC protocols and legal instruments aimed at deepeningSADC integration, especially the Memorandum of Understanding onMacroeconomic Convergence. The focus of the studies would be ontrade and macroeconomic convergence measures, along with labourmarket policy frameworks, and the economic and social impacts thatpolicies in this respect might have. The workshop felt that the countrystudies would serve to identify key areas for deepening SADCintegration, as well as additional studies that could then be undertakento further analyse the challenges and policy options. Subsequent tothe country studies, an overall assessment of the findings on impactwas sought and further areas to be addressed were identified. Inaddition, the workshop proposed that surveys of civil societyperceptions regarding the costs and benefits of SADC integration becarried out, along with a study on the regional and international contextaffecting SADC integration.
34
Botswana has long viewed regional integration in Southern Africaas a key force for sustainable development that can promote socialand economic development, as well as reduce poverty. Fostering suchintegration in while voiding negative economic and social impacts hasremained a formidable challenge, not only for Botswana, but for allthe member states. In order to help meet that challenge, SADC hasadopted a Regional Indicative Strategic Development Plan (RISDP),which seeks to provide strategic direction in the design and formulationof SADC programmes, projects and activities. The Plan sets out clearguidelines on SADC’s approved social and economic policies andpriorities. It also provides Member States with a coherent andcomprehensive agenda for social and economic policies. The ultimateobjective of the Regional Indicative Strategic Development Plan is “todeepen the integration agenda of SADC with a view to acceleratingpoverty eradication and the attainment of other economic and non-economic development goals.” (SADC, RISDP, p7)
The Regional Indicative Strategic Development Plan sets outambitious goals and objectives, such as SADC has to establish a FreeTrade Area (FTA) by 2008, a Custom Union by 2010, a regional commonmarket by 2015 and a monetary union by 2016. SADC’s Finance andInvestment Protocol (FIP), which commenced in 1998, entails thedevelopment of a number of specific Memoranda of Understandingthat focus on the areas of fiscal and monetary policies, financialmarkets, central banks, investment, taxation, development financeand non-banking regulators.
As noted by Gaolathe (2002), SADC is committed to deepeningthe integration processes amongst its members as part of its strategicplan to “achieve development and economic growth, alleviate poverty,enhance the standard and quality of life of the people of SouthernAfrica and support the socially disadvantaged, through regionalintegration.” Ensuring sound macroeconomic management is vital tothe integration process, which is reflected in the Memorandum ofUnderstanding (MOU) on Macroeconomic Convergence, which wasadopted in 2001. Four macroeconomic indicators were identified formonitoring the implementation of the MOU, viz.: a member state’srate of inflation; the ratio of the budget deficit to GDP; the ratio ofpublic and publicly guaranteed debt to GDP; and the balance and
35
structure of the current account. SADC has set convergence targetsfor these indicators and maintains that adopting the macroeconomicpolicy frameworks needed to achieve such targets is crucial for theeconomies of Southern Africa to be able to integrate into a fully-fledged economic union smoothly, while successfully achieving theMillennium Development Goals.
As noted by Senaoana (2005), “the essential aim of macroeconomicconvergence is to create regional levels of macroeconomic stability”.The basic elements of macroeconomic stability include low and stableinflation, sustainable levels of debt, exchange rates that are stableand sustainable, prudent and efficient fiscal management and soundand credible monetary policies. Macroeconomic stability is a crucialpre-condition for long-term sustained development, low and stablereal interest rates, increased investor confidence in the economies ofSADC Member States and job creating productive investment, which,in turn, is not only important in enabling many people to raise theirstandards of living above the poverty line, but also is critical in enablingincreased spending on poverty reducing social programmes.
Through the MOU on Macroeconomic Stability and Convergence,Member States agreed that a substantial degree of macroeconomicconvergence is necessary for effective policy coordination and regionalintegration. The MOU covers the following issues:• The principles of macroeconomic stability and convergence;• Indicators to measure macroeconomic stability and convergence;• The provision of data and information by Member States;• The establishment of a collective surveillance procedure;• The presentation of annual convergence programmes by Member• States to the Committee of Ministers; and,• The allocation of responsibility for implementation.
When adopting the MOU on Macroeconomic Convergence, identifieda set of economic indicators for measuring macroeconomicconvergence and the numeric targets they believed would beappropriate for the chosen indicators. These are reflected in the tablebelow.

36
TTTTTable 1: Numeric Vable 1: Numeric Vable 1: Numeric Vable 1: Numeric Vable 1: Numeric Values of Talues of Talues of Talues of Talues of Tarararararget Indicators for SADC MoU on Macrget Indicators for SADC MoU on Macrget Indicators for SADC MoU on Macrget Indicators for SADC MoU on Macrget Indicators for SADC MoU on MacroeconomicoeconomicoeconomicoeconomicoeconomicStability and ConvergenceStability and ConvergenceStability and ConvergenceStability and ConvergenceStability and Convergence
TTTTTarararararget Indicatorsget Indicatorsget Indicatorsget Indicatorsget Indicators 20082008200820082008 20122012201220122012 20182018201820182018
Core Inflation 9% 5% 3%
Budget Deficit as apercentage of GDP 5% 3% 1%
External Debt as apercentage of GDP 60% 60% 60%
Current Account Deficit asa percentage GDP 9% 9% 3%
Growth rate 7% 7% 7%
External Reserves (ImportCover in months) 3 6 6
Central Bank Credit toGovernment 10% 5% 5%
Domestic Savings Rates 25% 30% 35%
Source: Senaoana (2005)
Other macroeconomic targets covered by the MOU include: raisingdomestic investment levels to at least 30% of GDP by 2008;interconnection of the payments and clearing system in SADC by 2008;finalising the legal and regulatory framework for dual and cross listingof shares on the regional stock exchanges by 2008; and liberalisingexchange controls on current account transactions between MemberStates by 2006 and on the capital account by 2010.
Given the commitment to deepening SADC integration throughmacroeconomic policies aimed at achieving certain agreedmacroeconomic convergence targets, it is important that policy makersin SADC and its Member States assess the impacts that such measureswill have on the social well-being of its people, both in the short termand the long term. This study seeks to provide an assessment of theeconomic and social impacts that macroeconomic policy initiatives haveon Botswana.
This report provides the country study for Botswana’smacroeconomic policy framework, including the fiscal, monetary, tradeand labour market policy frameworks, as well as the social impactassessment of these policy frameworks.
37
1.2 Objectives of the Study
The basic objective of this desk study, which draws upon alreadyexisting and readily available information, is to provide a broad
stock-taking of the status of the policy frameworks of Botswana,especially with respect to the targets set out in the MOU onMacroeconomic Stability and Convergence, with a view to providingpolicy advice to SADC and national policy makers. The study is intendedto enhance the SADC Secretariat’s capacity for facilitating SADCintegration. The study provides some background information on thevarious national policy constraints that Botswana faces, which couldhelp to better inform national policy makers in their efforts toharmonise national interests with the integration processes. Suchinformation can help in overcoming local resistance to SADC integrationand can also help to resolve policy inconsistencies in the SADC countriesthat might thwart integration. The Botswana country study seeks toidentify the main linkages (and causality) between the policyframeworks and their economic and social impacts on Botswana. Thecountry study also seeks to identify where Botswana has been achievingsuccess in attaining the macroeconomic convergence targets, andwhere there have been problems. The assessments made with respectto Botswana are compared to the agreed policy and strategicframeworks provided by the Regional Indicative Strategic DevelopmentPlan.
1.3 Structure of the Report
Section II of the study considers the RISDP Goals and Objectives,especially with respect to the issues of poverty reduction, economic
and social development, as well as establishing a free trade area,customs union, a common market and eventually a monetary union.Section III briefly touches on the Memorandum of Understanding onMacroeconomic Stability and Convergence and SADC policy, in thecontext of the Finance and Investment Protocol, the Trade Protocoland labour market policies. Section IV broadly consider theMacroeconomic Stability Indicators, especially with respect to inflation,budget deficit, debt, the current account and other indicators, such
38
as growth rates, foreign exchange reserves, central bank credit togovernment, domestic savings rates and domestic investment rates.In this section, some consideration is given to data sources and dataissues, such as the need for consistency with internationally acceptablestandards and the quality, relevance, consistency and comparability ofthe data used.
Section V then considers the basic elements and targets ofBotswana’s Macroeconomic Convergence Programme, reviewing thebasic macroeconomic policy framework as reflected in the currentnational development plan. In general, the section reviews Botswana’sdevelopment goals and objectives and gives a qualitative overview ofthe domestic economy. Government’s expectations about futureeconomic developments are considered, along with the country’s broadpolicy approach and priorities. The section also includes a brief reviewof Botswana’s fiscal and monetary policies, its trade policy frameworkand its labour market policy framework. In addition, the study givessome indications of Botswana’s successes in achieving macroeconomicconvergence targets, some of the problem areas Botswana hasencountered in achieving the macroeconomic convergence targets andsome of the broad social impacts of the policy frameworks.
Section VI then provides a detailed assessment of Botswana’smacroeconomic convergence programme with a view to identifyingthe main linkages between the policy frameworks and their economicand social impacts. This involves taking a more detailed look at themacroeconomic conditions prevailing in Botswana, in terms of theeconomic structure, economic growth, employment andunemployment, investment flows to and from Botswana, the basicapproaches used in determining budgetary frameworks, the fiscaltrends, the causes of budget deficits and debt, where appropriate,the functional allocation of expenditure, monetary and exchange ratepolicies and trends (with a view to their impacts on macroeconomicstability), central bank and government monetary-fiscal policyinterrelationships, as well as the macroeconomic functions of the centralBank. The detailed assessment also looks at the institutionalarrangements that prevail within Botswana, the country’s capacity todesign and implement programmes for macroeconomic convergence,and, where there are capacity constraints, what can be done to remedy
39
them. Some consideration is given to Botswana’s trade policies, e.g.,the country’s existing multilateral commitments that may impact uponmacroeconomic stability, especially Botswana’s membership in SADC,and how that may influence the country’s macroeconomic policyframework, and/or whether it creates any macroeconomic policycontradictions at the national level. The section further highlightsissues that will need to be addressed at both country level and at theSADC level in order to meet the various goals set out in the RISDP,such as areas where there is need for improved coordination withother SADC member states.
The detailed assessment also looks at the major elements ofBotswana’s labour market policy framework, which includes an analysisof labour market trends, with a view to identifying the causes of thelow the country has been experiencing, the causes of risingunemployment and inadequate income growth, and the key labourmarket policy issues that need to be addressed in order to promotedeeper SADC integration. In doing this, the study identifies the keypolicy interrelationships between Botswana’s labour market policiesand other macroeconomic policies.
Section VII presents the social impact analysis, which entails an in-depth analysis of the changes that are likely to be induced by Botswana’smacroeconomic policies aimed at deepening SADC integration. Thisinvolves quantification of the potential economic and social costs thatmight arise for Botswana if the RIDSP’s strategies for deepeningintegration with SADC are followed, as well as the counter-factualcosts of non-integration, if Botswana does not adhere to the SADCtargets. The section considers how the social, economic andenvironmental aspects of SADC integration interface with Botswana’snational policies, as well as how decisions on trade policy and macro-economic management are taken, and the extent to which the viewsof civil society are taken on board in the decision-making process. Avariety of economic, environmental and social indicators are analysedin carrying out the social impact assessment, including: GDP per capita,employment, unemployment rates by gender, by age, by educationalattainment, the human development index, life expectancy, under-five mortality rate, HIV prevalence in the adult population, adult literacyrate, the net primary enrolment rate and the incidence of poverty.
40
The section also identifies several mitigation and enhancementmeasures that may enhance the overall impact of SADC integrationon Botswana’s development.
Section VIII discusses the major macroeconomic challenges facingBotswana, including HIV/AIDS, poverty, lack of human capital, lack ofimplementation capacity, lack of economic diversification, lack ofeconomic infrastructure, lack of finance, environmental degradation,gender discrimination and disparities and governance problems, whileSection IX, considers special issues for Botswana, including other criticalpolicy issues, data requirements and areas for future research. Finally,Section X contains the recommendations for the changes needed inBotswana’s macroeconomic policy framework and its institutionalstructures, along with some indications of the winners and losers, andcosts and benefits associated with such changes. The section considersthe strategies for implementing such changes in Botswana, along withadvice on the monitoring and evaluation of Botswana’s strategies formacroeconomic convergence in SADC.
41
2 Regional Indicative Strategic DevelopmentPlan (RISDP) Goals and Objectives
2.1 The SADC Vision and Mission
SADC has a vision of a shared future within the regional community,which serves to chart the region’s direction for development. This
vision provides the basic foundation for the Regional Indicative StrategicDevelopment Plan (RISDP). The SADC Vision of a common futureseeks to ensure that all the people of Southern Africa will enjoyeconomic well-being, decent standards of living and quality of life,freedom and social justice, and peace and security. This vision isfounded on the common values, principles, historical relationships andcultural affinities that exist between the peoples of Southern Africa.
The SADC mission statement is “to promote sustainable andequitable economic growth and socio-economic development throughefficient productive systems, deeper cooperation and integration, goodgovernance, and durable peace and security”. This is intended to enablethe region to emerge as a competitive and effective player in theinternational economy. The mission statement also provides a basicunderpinning to the Regional Indicative Strategic Development Plan.Five principles guide SADC in its pursuit of this mission:• Sovereign equality of all Member States;• Solidarity, peace and security;• Human rights, democracy, and the rule of law;• Equity, balance and mutual benefit; and• Peaceful settlement of disputes.
There is a Common Agenda of policies and strategies aimed at achievingSADC’s goals, which include promoting:• Deeper economic co-operation and integration, on the basis of
balance, equity and mutual benefit, providing for cross borderinvestment and trade, and freer movement of factors of production,goods and services across national borders;
• Common economic, political, social values and systems, enhancingenterprise and competitiveness, democracy and good governance,respect for the rule of law and the guarantee of human rights,popular participation and alleviation of poverty; and
42
• Strengthened regional solidarity, peace and security, in order forthe people of the region to live and work in peace and harmony.
SADC’s RISDP presents a number of ambitious goals and objectivesthat the Community seeks to achieve. Basically, these entail greaterregional economic integration with a view to reducing poverty andfostering harmonious social and economic development. On theeconomic front, SADC aims to establish a Free Trade Area (FTA) by2008, a custom union by 2010, a regional common market by 2015and a monetary union by 2016. SADC is developing a Finance andInvestment Protocol (FIP), which entails a number of specificMemoranda of Understanding that focus on areas, such as fiscal andmonetary policies, financial markets, central banks, investment,taxation, development finance and non-banking regulators. The MOUon Macroeconomic Stability and Convergence is one of the elementsof the Finance and Investment Protocol.
The RISDP is designed to provide strategic direction with respect toSADC programmes, projects and activities. The RISDP aligns thestrategic objectives and priorities of SADC with the policies andstrategies to be pursued towards achieving those goals over a periodof ten to fifteen years. The RISDP is indicative in nature and outlinesthe necessary conditions that should be realised towards the attainmentof SADC’s regional integration and development goals. In view of theneed to monitor and measure progress, the RISDP sets targets thatindicate major milestones towards the attainment of agreed goals. Inthis connection, the RISDP sets out a logical and coherentimplementation programme of the main activities necessary for theachievement of the region’s broader goals with a reasonable, feasibleand agreeable time frame that takes into account resource constraints.
The RISDP provides SADC Member States with a coherent andcomprehensive development agenda on social and economic policiesover the next ten to fifteen years. It also provides the SADC Secretariatand other SADC institutions with clear guidelines on SADC’s approvedsocial and economic priorities and policies. The RISDP, therefore,enhances the effectiveness of the SADC Secretariat and otherinstitutions in discharging their facilitating and coordinating roles. Inthe light of the SADC vision of a common future within a regional
43
community and its mission to promote sustainable and equitableeconomic growth and socio-economic development, the ultimateobjective of the RISDP is to deepen the integration agenda of SADC,with a view to accelerating poverty eradication and the attainment ofother economic and non-economic development goals.

44

45
3 Macroeconomic Convergence and SADCPolicy
The Memorandum of Understanding on MacroeconomicConvergence specifies that Member States should converge on
stability-orientated economic policies in a co-operative manner. Thisis in recognition of the fact that in order to accelerate growth ofeconomic activity, investment and employment in the SADC region,there is need for increased co-operation and co-ordination in theformulation and implementation of macro-economic policies. Inadopting the Memorandum of Understanding, the SADC leadersexpressed their concerted view that regional economic integration andmacroeconomic stability are preconditions for sustainable economicgrowth and for the creation of a monetary union in the SADC Region.For them, Macroeconomic Convergence means that Member Statesmove towards having low and stable rates of inflation and sustainablelevels for budget deficits, public and publicly guaranteed debt, andcurrent account balances. Thus, under the agreement, each MemberState agrees to adopt stability-orientated economic policies aimed atrestricting inflation to low and stable levels, maintaining a prudentfiscal stance based on the avoidance of large budget deficits,monetisation of deficits and high or rising ratios of public and publiclyguaranteed debt to GDP, avoiding large financial imbalances in theeconomy and minimising market distortions.
Article 3 of the Memorandum of Understanding identified a set ofIndicators of Macro-economic convergence to be used in monitoringthe Memorandum, these include:• The rate of inflation in the Member State;• The ratio of the budget deficit to GDP in the Member State;• The ratio of public and publicly guaranteed debt to GDP in the
Member State; and• The balance and structure of the current account in the Member State.
In the MOU, it was agreed that Member States would identify commonguidelines for each of the above indicators (such as those set out inTable 1), and such other complementary indicators as may be agreed,including structural performance and financial conditions. In addition,
46
in the MOU the Member States agreed to co-operate on their fiscaland monetary policies, especially with a view to formulating andimplementing sustainable fiscal and monetary policies that wouldminimise negative spillover effects to other Member States.
Moreover, Member States agreed to establish a collective surveillanceprocedure to monitor macroeconomic convergence, help to determinespecific targets, assess progress relative to those targets and provideadvice on corrective actions. It was also agreed that the Committeeof Ministers for Finance and Investment will evaluate and monitor theannual macroeconomic convergence programmes submitted byMember States, determine whether such Macroeconomic Convergenceprogrammes satisfy the common guidelines, advise on possiblechanges, compare outcomes with previous programmes and makerecommendations where necessary.
3.1 Finance and Investment Protocol
The SADC Finance and Investment Protocol, of which the MOU onMacroeconomic Stability and Convergence is a component, was
developed using the Regional Indicative Strategic Development Planas a road map for enhancing socio-economic development and deeperregional integration. The Member States recognised that such aprotocol was needed to achieve economic growth and balanced intra-regional development, as well as to foster compatibility among nationaland regional strategies and programmes. The Finance and InvestmentProtocol was aimed at developing policies that could lead to theprogressive elimination of obstacles to the free movement of capitaland labour, goods and services, and of the residents of the SADCMember States. This would involve improving economic managementand performance through regional co-operation, and help to createappropriate institutions and mechanisms for the implementation ofprogrammes and operations in the SADC Region. Increased co-operation, coordination and management of macroeconomic,monetary and fiscal policies was needed to establish and maintainmacroeconomic stability, which is viewed as a vital precondition foraccelerating growth, investment and employment creation in the SADCRegion, as well as for the creation of a monetary union. The Finance

47
and Investment Protocol was also viewed as important in developingand strengthening financial and capital markets, as well as in fosteringprivate sector investment. The Finance and Investment Protocol wasalso designed in recognition of the importance of the link betweeninvestment and trade, and the need to enhance the attractiveness ofthe SADC Region as an investment destination. Ultimately, the Financeand Investment Protocol is intended to facilitate regional integration,co-operation and co-ordination within the finance and investmentsectors. The aim is to diversify and expand the productive sectors ofthe economy, and enhance SADC regional trade in order to achievesustainable economic development and eradicate poverty. Thus, theFinance and Investment Protocol aims to:• Create a favourable investment climate within SADC with the
aim of promoting and attracting investment in the SADC Region;• Achieve and maintain macroeconomic stability and convergence
within the SADC region;• Promote co-operation in respect of taxation and related matters
within SADC;• Encourage co-operation and coordination by Member States
regarding exchange control policies;• Establish principles which will facilitate coherent and convergent
legal and operational frameworks of central banks;• Create co-operation and co-ordination in the operations of central
banks;• Establish a framework for co-operation and co-ordination between
central banks on payment, clearing and settlement systems;• Foster co-ordination of the activities of development finance
institutions in the SADC region so as to stimulate greater crossborder flows of finance for projects;
• Establish a SADC project preparation and development fund;• Facilitate the development of capital markets in the SADC region;
and• Promote co-ordination of the regulation of financial markets in
the SADC region
48
3.2 The SADC Trade Protocol
Botswana is a member of the 14-nation SADC, which startedimplementing a Free Trade Agreement (FTA) on 1st September
2000. The accord will cut tariffs on 12,000 defined product areas inthe SADC region. By 2008, implementation of the liberalisation ofproducts considered less sensitive will lead to freeing 85 percent ofintra-SADC trade from tariffs. From 2008 to 2012, the sensitiveproducts will be liberalised, creating a free trade area by 2012. Theprotocol covers 12 SADC countries: Angola, Botswana, Lesotho,Malawi, Mauritius, Mozambique, Namibia, South Africa, Swaziland,Tanzania, Zambia and Zimbabwe. The Democratic Republic of theCongo has indicated its intention to ratify the protocol. However,Seychelles has given notice that it is withdrawing from SADC.
The SADC FTA is governed by principles of asymmetry, which allowsthe weaker economic partners to have more time to implement onerousobligations of the agreement than the stronger ones. In terms of timeframe, the pace of tariff reduction and the coverage of the SADC FTA,the agreement is structured in such a way that the Southern AfricanCustoms Union (SACU) Member States will front load their tariffreductions (open their markets faster), Mauritius and Zimbabwe (thenon-SACU SADC developing countries) will mid-load their tariffreductions, while the least developed member states (Angola, Malawi,Mozambique, Tanzania and Zambia) will backload their tariffreductions.
The protocol is structured into four categories of trade liberalisation:Immediate liberalisation: Effective September 1, 2000, tariffs on non-sensitive products were reduced to zero on products that attract lessthan 17% import duty. Products in this category include copper, ironproducts and steel, wood and articles made of wood, machinery andappliances and paperboard and printed materials, hides, skins andleather.
Gradual liberalisation: Tariffs would be removed within three yearsof implementation on non-sensitive products that attract between18% and 25% of import duties (by 2003). Products in this categoryinclude furniture, bedding, selected chemicals, paper products,machinery and appliances.
49
Non-sensitive Products that attract duties above 25% would beduty free within 5 years of the implementation of the FTA (by 2005).Products in this category include articles of leather, rubber, selectedtextiles, vehicles, selected footwear, cutlery, ceramic kitchen andtableware. Sensitive list: Sensitive products are to be liberalised moregradually, starting in 2008 and fully liberalised by 2012. These arelargely textiles, clothing and footwear products that were the subjectof disagreement and outstanding negotiations among the SADCmember states at the time of drafting the SADC Trade Protocol.
Disagreements regarding the scope of liberalisation among themember states arose over the production, manufacture and retailingof fabrics and how they ought to be traded, and the origin of fabricsand what quantity should be imported. A new formula, resolving therules of origin, was agreed upon, allowing SADC’s least developedcountries (Malawi, Mozambique, Tanzania and Zambia) to apply a lessstringent system of rules of origin for clothing and textiles for 5 years.A quota arrangement was agreed on during the transition phase togovern trade in the clothing and textile industries. Within this period,the least-developed SADC countries would be expected to invest inthe capacity to meet the stricter rules of origin. Other members haveagreed to a stricter regime, requiring elaborate processing (substantialtransformation) of clothing and textiles being traded within the region.The SADC FTA has to be notified to the World Trade Organisation(WTO). For a trade protocol to be acceptable under the rules of theWTO, it must cover substantially all goods, which is usually interpretedas over 80%.
3.3 SADC Labour Market Policies
SADC’s main strategic objective in the area of employment and labouris to promote employment creation and efficient human resource
utilisation by stimulating demand for labour in the SADC economies,while ensuring acceptable levels of labour standards and socialprotection. In pursuing this objective, SADC seeks to address thechallenges of high levels of unemployment and underemployment,low productivity, low labour standards and significant differences inregulatory frameworks and the degree of social protection in the region.

50
The focus of the SADC’s Programme of Action for employment andlabour is on the formulation and harmonisation of employment andlabour policies with a view to contributing to SADC’s agenda for deeperintegration and reduction of poverty. The key employment and labourprogramme areas include: occupational health and safety; socialdialogue and social protection; productivity improvement; labourstandards; developing a database on employment and labour issues;and labour migration.
There are a number of important SADC policy documents onemployment and labour, including: the Charter of Fundamental SocialRights in SADC; the Declaration on Productivity; the Policies, Prioritiesand Strategies on Employment and Labour; the Code on HIV/AIDSand Employment; the Code of Practice on the Safe Use of Chemicals;and the Code of Conduct on Child Labour. Almost all SADC memberstates have ratified the International Labour Organisation (ILO) CoreConventions, covering areas of Freedom of Association and CollectiveBargaining (C.97 and C.98); Elimination of Forced Labour (C.29 andC.105); Abolition of Child Labour (C.138 and C.182); and Eliminationof Discrimination (C.100 and C.111).
Closely related to the objectives sought by SADC’s labour marketpolicies are the Community’s human resources development goals andstrategic objectives. As part of its Directorate on Social and HumanDevelopment and Special Programmes, SADC established the HumanResources Development (HRD) Unit, with a view to coordinating allhuman resource development activities in the various SADC MemberStates, and identifying the needs and priorities of Member States inthis area, while developing the necessary mechanisms and strategiesto meet these requirements. Raising productivity and standards ofliving and moving people out of poverty is sought by implementingthe provisions of the Protocol on Education and Training and theRegional Indicative Strategic Development Plan (RISDP).Implementation of this Protocol is focused primarily on skillsdevelopment and development management issues.

51
4 Macroeconomic Stability Indicators
Within the context of the Memorandum of Understanding onMacroeconomic Convergence, the Committee of Ministers for
Finance and Investment made two distinct decisions, namely: theyidentified the key economic indicators which will be used to measuremacroeconomic convergence; and secondly, they decided onappropriate numeric targets needed to be set for the chosen indicators.Since these numeric target indicators need to be internationally credibleto yield the full fruits of macroeconomic stability, they were bench-marked as shown in chart 1.
4.1 Numeric Values of Target Indicators
The core inflation target was set to decline from 9% in 2008, to 5%in 2012 and to 3% by 2018. The budget deficit as a percentage ofGDP was not to exceed 5% by 2008, and be kept below 3% and 1%by 2012 and 2018, respectively. External debt as a percentage of GDPwas set not to exceed 60% by 2008, and remain below that targetthereafter. The current account deficit as a percentage GDP was notto exceed 9% by 2008, and by 2018 it should be no greater than 3%.The current account deficit target of 9% of GDP by 2008 and 3% by2018 should be considered in conjunction with the country’s economicgrowth rate, its import cover and should exclude official transfers inits calculation. The real growth rate should be at least 7% by 2008and at the least remain at least that high throughout the period to2018. External reserves, in terms of import cover of goods and servicesshould be at least 3 months by 2008, and 6 months by 2012 andthereafter. Central bank credit to government should be no greaterthan 10% of government tax revenues in the previous year by 2008;and by 2012 and thereafter, it should be no more than 5%. Thedomestic savings rate should be at least 25% of GDP by 2008, risingto at least 30% by 2012, and to at least 35% by 2018.
Other macroeconomic target variables include having domesticinvestment levels of at least 30% of GDP by 2008; a gradualinterconnection of payments and clearing systems in SADC by 2008;finalising the legal and regulatory framework for dual and cross listing
52
on the regional stock exchanges by 2008; liberalisation of currentaccount transactions between Member States by 2006 and the capitalaccount by 2010.
4.2 Data Sources
Data for monitoring the economic and social impacts of policies aimedat fostering macroeconomic convergence exist within each of theindividual SADC Member States, as well as at the websites ofinternational organisations, such as the Secretariat for the SADCCommittee of Central Bank Governors (CCBG), the InternationalMonetary Fund’s African Department and the World Bank’s WorldDevelopment Indicators.
Botswana has adopted statistical reporting standards for nationalaccounts, employment and human resources, government financestatistics, money statistics and international trade statistics that areconsistent with the internationally acceptable standards as defined bythe IMF and the UN System of National Accounts. Thus, this study hasused officially available data from the Central Statistics Office, theBank of Botswana and the Ministry of Finance and DevelopmentPlanning. In general, Botswana has achieved a reasonably reliable levelof official statistics, of good quality, relevance, consistency that iscomparable to that reported by the international statistical sources.However, there are concerns about the timeliness of the data, andthere are some compatibility problems due to differences in the calendaryear used for financial and trade statistics, the fiscal year used forgovernment statistics, the national accounts year used for GDP andoutput statistics and the different periods (March and September versusAugust) used for employment and labour statistics versus populationstatistics, respectively.
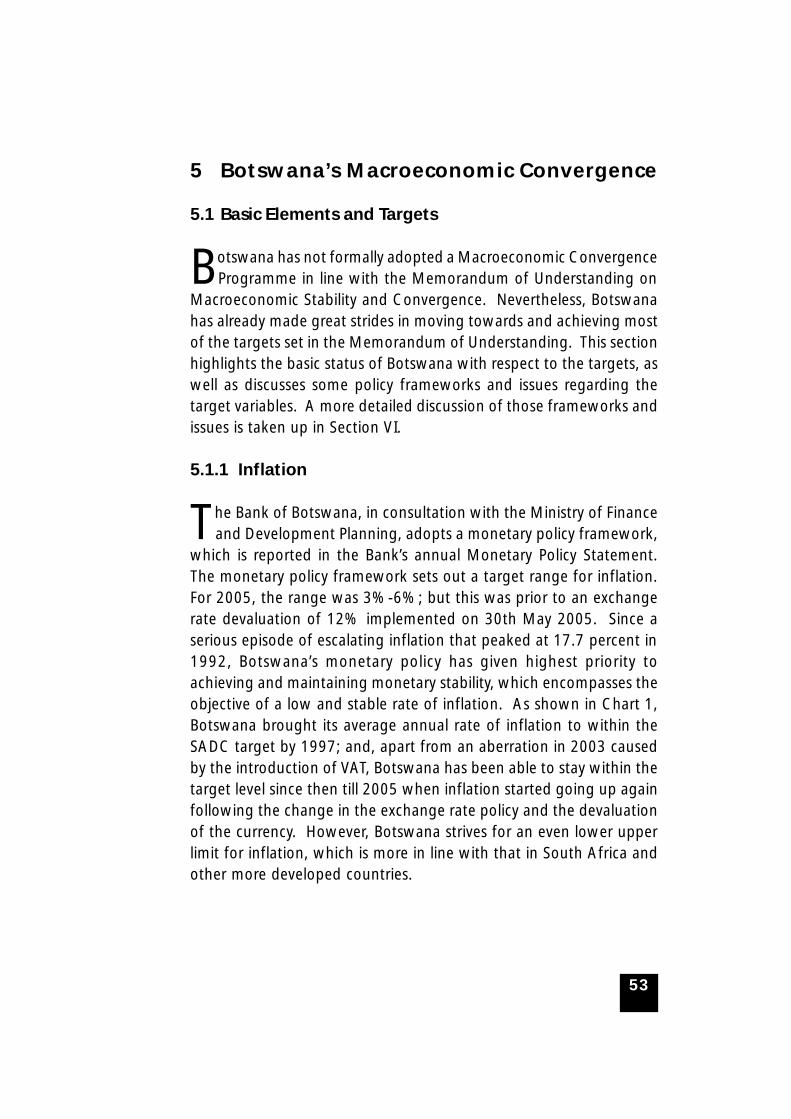
53
5 Botswana’s Macroeconomic Convergence
5.1 Basic Elements and Targets
Botswana has not formally adopted a Macroeconomic ConvergenceProgramme in line with the Memorandum of Understanding on
Macroeconomic Stability and Convergence. Nevertheless, Botswanahas already made great strides in moving towards and achieving mostof the targets set in the Memorandum of Understanding. This sectionhighlights the basic status of Botswana with respect to the targets, aswell as discusses some policy frameworks and issues regarding thetarget variables. A more detailed discussion of those frameworks andissues is taken up in Section VI.
5.1.1 Inflation
The Bank of Botswana, in consultation with the Ministry of Financeand Development Planning, adopts a monetary policy framework,
which is reported in the Bank’s annual Monetary Policy Statement.The monetary policy framework sets out a target range for inflation.For 2005, the range was 3%-6%; but this was prior to an exchangerate devaluation of 12% implemented on 30th May 2005. Since aserious episode of escalating inflation that peaked at 17.7 percent in1992, Botswana’s monetary policy has given highest priority toachieving and maintaining monetary stability, which encompasses theobjective of a low and stable rate of inflation. As shown in Chart 1,Botswana brought its average annual rate of inflation to within theSADC target by 1997; and, apart from an aberration in 2003 causedby the introduction of VAT, Botswana has been able to stay within thetarget level since then till 2005 when inflation started going up againfollowing the change in the exchange rate policy and the devaluationof the currency. However, Botswana strives for an even lower upperlimit for inflation, which is more in line with that in South Africa andother more developed countries.
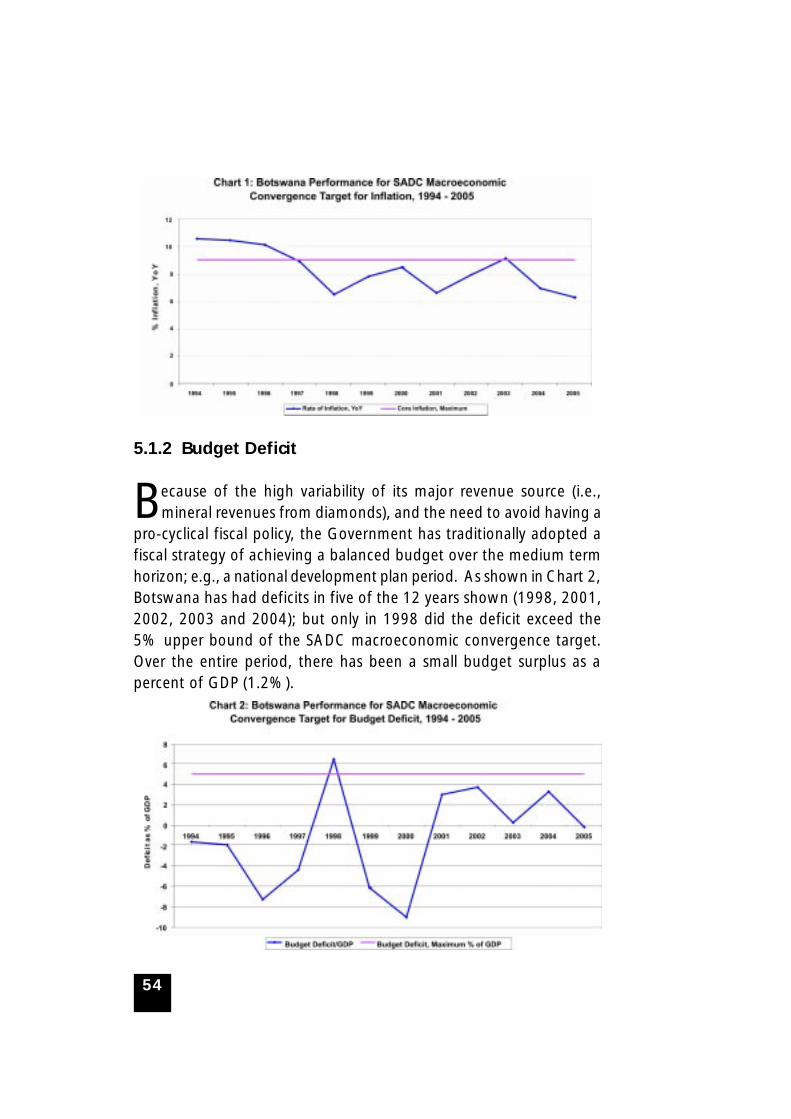
54
5.1.2 Budget Deficit
Because of the high variability of its major revenue source (i.e.,mineral revenues from diamonds), and the need to avoid having a
pro-cyclical fiscal policy, the Government has traditionally adopted afiscal strategy of achieving a balanced budget over the medium termhorizon; e.g., a national development plan period. As shown in Chart 2,Botswana has had deficits in five of the 12 years shown (1998, 2001,2002, 2003 and 2004); but only in 1998 did the deficit exceed the5% upper bound of the SADC macroeconomic convergence target.Over the entire period, there has been a small budget surplus as apercent of GDP (1.2%).
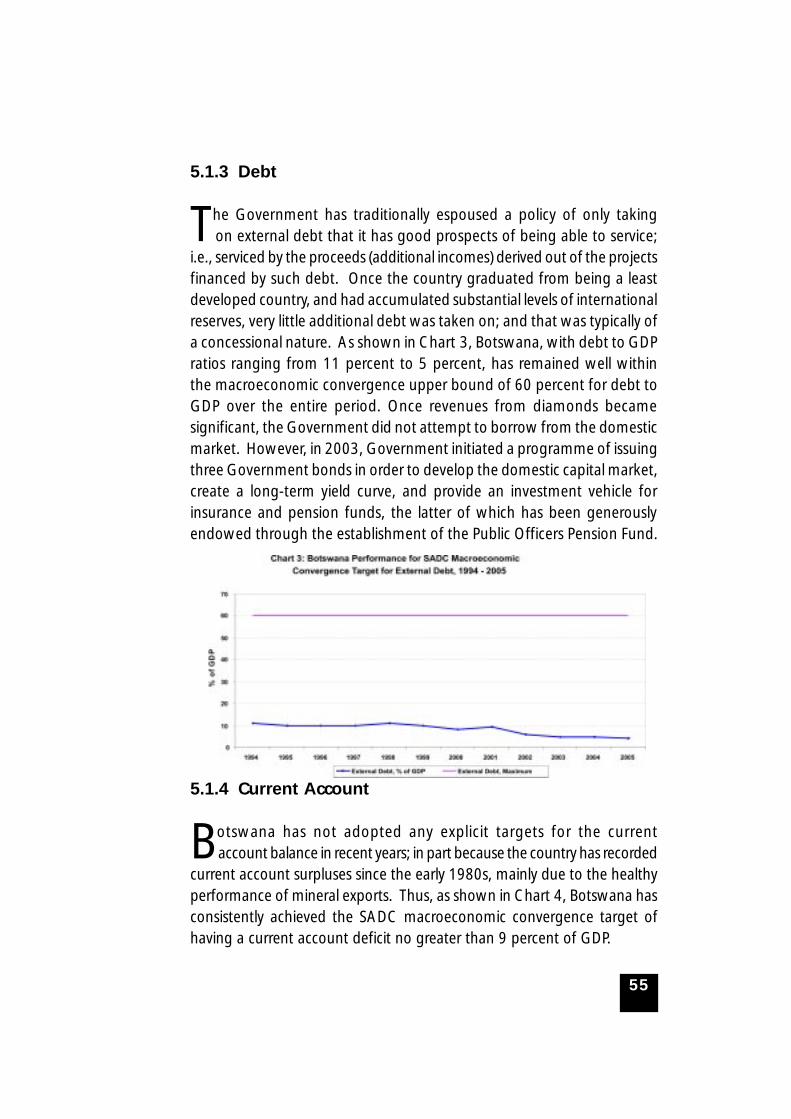
55
5.1.3 Debt
The Government has traditionally espoused a policy of only takingon external debt that it has good prospects of being able to service;
i.e., serviced by the proceeds (additional incomes) derived out of the projectsfinanced by such debt. Once the country graduated from being a leastdeveloped country, and had accumulated substantial levels of internationalreserves, very little additional debt was taken on; and that was typically ofa concessional nature. As shown in Chart 3, Botswana, with debt to GDPratios ranging from 11 percent to 5 percent, has remained well withinthe macroeconomic convergence upper bound of 60 percent for debt toGDP over the entire period. Once revenues from diamonds becamesignificant, the Government did not attempt to borrow from the domesticmarket. However, in 2003, Government initiated a programme of issuingthree Government bonds in order to develop the domestic capital market,create a long-term yield curve, and provide an investment vehicle forinsurance and pension funds, the latter of which has been generouslyendowed through the establishment of the Public Officers Pension Fund.
5.1.4 Current Account
Botswana has not adopted any explicit targets for the currentaccount balance in recent years; in part because the country has recorded
current account surpluses since the early 1980s, mainly due to the healthyperformance of mineral exports. Thus, as shown in Chart 4, Botswana hasconsistently achieved the SADC macroeconomic convergence target ofhaving a current account deficit no greater than 9 percent of GDP.

56
5.1.5 Other Indicators
Growth Rate
Botswana’s long-term Vision 2016 has a target rate of growth ofreal GDP of 8% p.a. for the 20 year period from 1996 to 2016.
On average Botswana has not achieved that rate of growth between1996 and 2003; however it was achieved on three occasions since1996, mainly due to rapid growth of mineral production andGovernment expenditure (see Chart 5). The projected growth ratefor the National Development Plan 9 was only 5.5% p.a. The Mid-Term Review of NDP 9 forecasts that an even lower average rate ofgrowth will be achieved for the Plan period. Compared to the SADCtarget rate of growth of at least 7 percent per annum, It is clear thatBotswana is experiencing problems. Thus, Botswana is challenged bysluggish growth, which poses further problems for Botswana’sstrategies for economic diversification, employment creation, povertyeradication and a more equitable distribution of income.

57
Foreign Exchange Reserves
Since the early 1980s, Botswana has been able to accumulatesubstantial levels of international reserves, well in excess of the SADCmacroeconomic convergence target (see Chart 6), and well in excessof the target level felt to be appropriate for Botswana, given thestructure of its economy and the risks-fluctuations to which it is subject.In past National Development Planning exercises, target levels forinternational reserves were estimated at 9-11 months of import coverfor goods and services in the 1980s and 7-9 months of import coverin the 1990s. Such targets are used in guiding the allocation of theinvestment of the international reserves into short term assets (theLiquidity Portfolio) and long-term assets (the Pula Fund). While still inexcess of the SADC macroeconomic convergence target of at leastfour months cover, there has been a notable drop in Botswana’s levelof import cover due to a decline in the level of official internationalreserves and rising imports in recent years.
Central Bank Credit to Government
The Bank of Botswana Act sets a limit on the extent to whichGovernment can borrow from the central bank. In fact, the Bank ofBotswana has not lent any money to Government or any parastatalsduring its 30 years of existence. Thus, as shown in Chart 7, in the last12 years, Botswana has satisfied the macroeconomic convergence
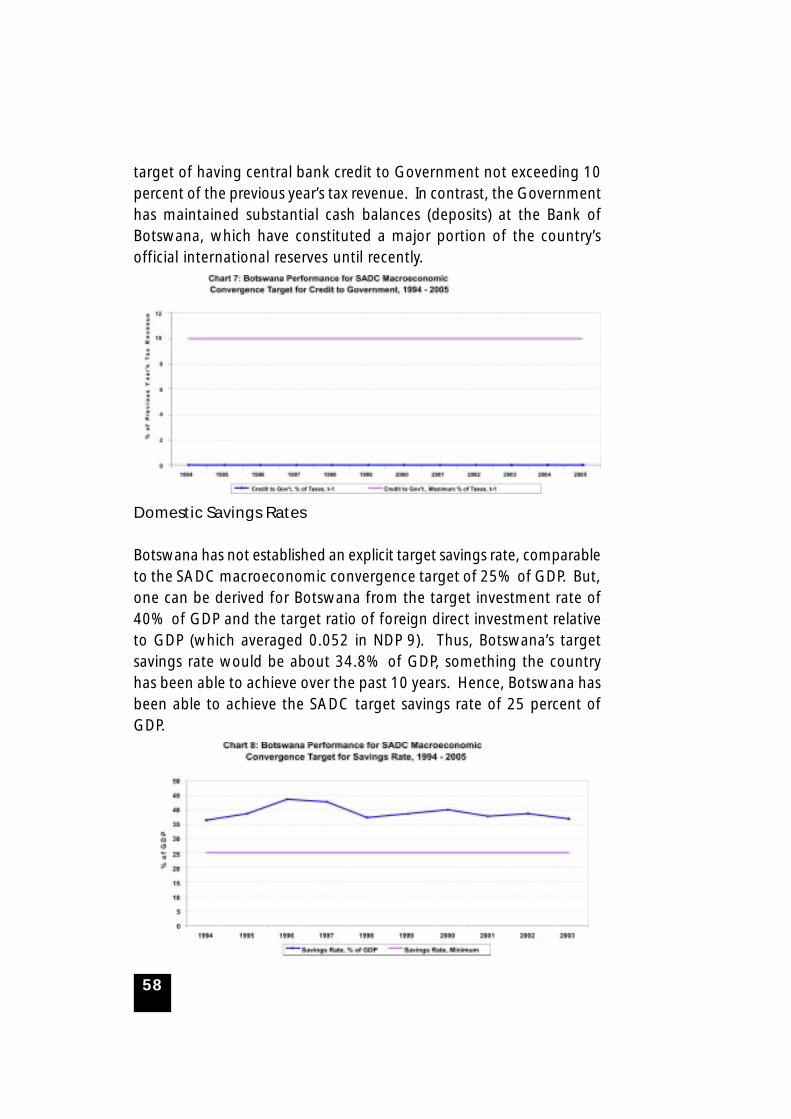
58
target of having central bank credit to Government not exceeding 10percent of the previous year’s tax revenue. In contrast, the Governmenthas maintained substantial cash balances (deposits) at the Bank ofBotswana, which have constituted a major portion of the country’sofficial international reserves until recently.
Domestic Savings Rates
Botswana has not established an explicit target savings rate, comparableto the SADC macroeconomic convergence target of 25% of GDP. But,one can be derived for Botswana from the target investment rate of40% of GDP and the target ratio of foreign direct investment relativeto GDP (which averaged 0.052 in NDP 9). Thus, Botswana’s targetsavings rate would be about 34.8% of GDP, something the countryhas been able to achieve over the past 10 years. Hence, Botswana hasbeen able to achieve the SADC target savings rate of 25 percent ofGDP.
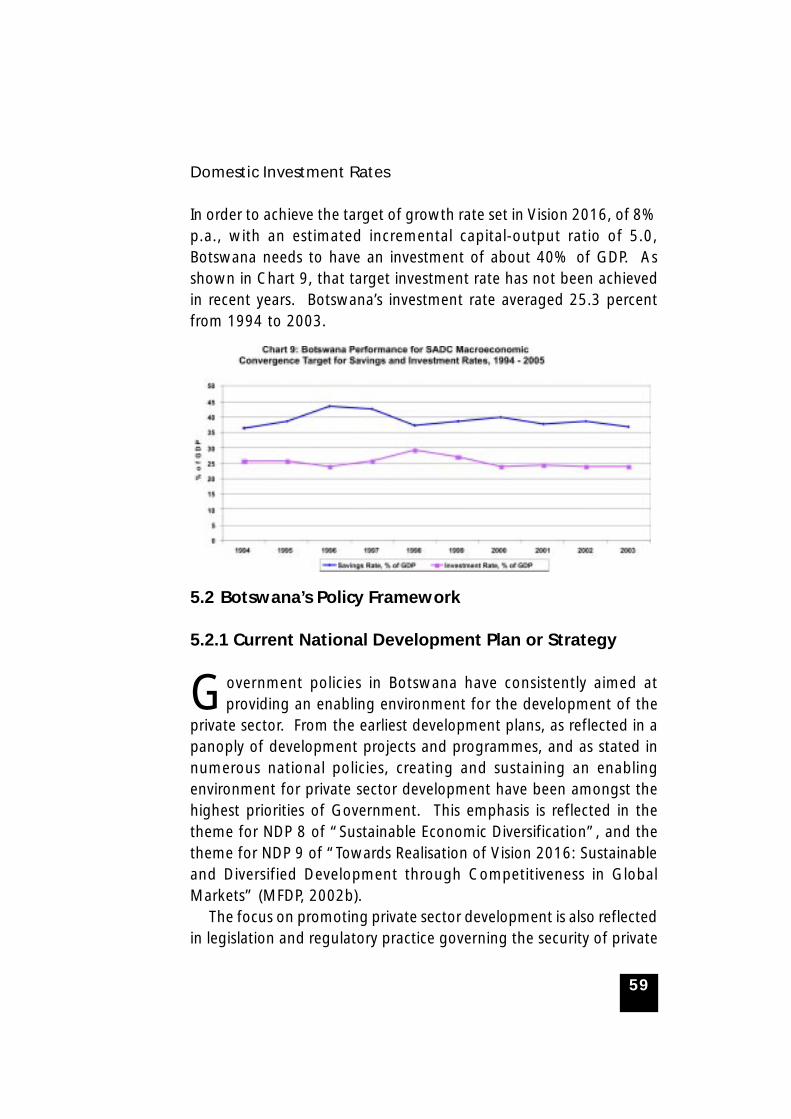
59
Domestic Investment Rates
In order to achieve the target of growth rate set in Vision 2016, of 8%p.a., with an estimated incremental capital-output ratio of 5.0,Botswana needs to have an investment of about 40% of GDP. Asshown in Chart 9, that target investment rate has not been achievedin recent years. Botswana’s investment rate averaged 25.3 percentfrom 1994 to 2003.
5.2 Botswana’s Policy Framework
5.2.1 Current National Development Plan or Strategy
Government policies in Botswana have consistently aimed atproviding an enabling environment for the development of the
private sector. From the earliest development plans, as reflected in apanoply of development projects and programmes, and as stated innumerous national policies, creating and sustaining an enablingenvironment for private sector development have been amongst thehighest priorities of Government. This emphasis is reflected in thetheme for NDP 8 of “Sustainable Economic Diversification”, and thetheme for NDP 9 of “Towards Realisation of Vision 2016: Sustainableand Diversified Development through Competitiveness in GlobalMarkets” (MFDP, 2002b).
The focus on promoting private sector development is also reflectedin legislation and regulatory practice governing the security of private
60
property, including land and other assets, as well as in the freedomsenjoyed by the population to trade anywhere in the country. A keyelement in the enabling economic environment in Botswana is havingan effective judicial system that allows for the enforcement of contracts,as well as suitable regulatory structures to allow for effective regulationof monopolies. While Botswana continues to improve such institutionalarrangements, there is widespread consensus that Botswana hasestablished reasonably efficient processes and procedures that supporthaving a private sector-friendly environment (UNDP, 1998). TheBotswana Government’s macroeconomic and fiscal policies havelikewise been directed at promoting business start-up and development,for both citizen and foreign investors.
5.2.2 Botswana’s Development Goals and Objectives
Multi-year economic planning in Botswana dates back to the timeof Independence, when the Government drafted a Transitional
Plan for Social and Economic Development. Since then, there havebeen nine successive National Development Plans aimed at guidingthe development of the economy and setting out programmes of publicexpenditure on recurrent budget items and development projects. Thepublic expenditure programmes have been based on the projectedrevenue resources of Government, including expected inflows ofexternal assistance in the form of grants and concessional loans.Botswana’s basic approach to national development planning, foundedon the national principles of democracy, development, self-reliance,and unity, has remained largely intact. The only major change thathas been made as a result of the adoption of Vision 2016, has beenthe inclusion of an additional national principle; that of ‘Botho’, whichis engrained in Botswana’s culture, and refers to a state of being human,courteous and highly disciplined.
Effective planning has contributed to the transformation ofBotswana from one of the poorest countries in the world atIndependence to a middle income country, with a per capita GDP ofP22 000 (or nearly US$5 000) in 2004. Since independence, Botswanahas been transformed from being essentially a cattle-rearing and ruralbased economy to one of the most consistent rapidly growing
61
economies in the world. The planning system has played a veryimportant role in the past development of the country; and it is well-positioned to play an equally important role in the future.
The preparation process for a national development plan, such asNDP 9, which covers the period from April 2003 to March 2009, isguided by a multi-sectoral reference group, which is comprised ofGovernment officials from the Ministry of Finance and DevelopmentPlanning, the Office of the President, the Ministry of Local Government,and representatives of the private sector, trade unions, non-governmental organisations, the Vision 2016 Council, and the Bankof Botswana, among others. The most recent Plan, which started withthe preparation of the Macroeconomic Outline and Policy Frameworkfor NDP 9, involved extensive consultation with the line Ministries,Local Authorities, the NDP 9 Reference Group, and the all-PartyParliamentary Caucus, and was approved by Cabinet in March 2002.The drafting of other Chapters of NDP 9 started thereafter and wentthrough similar stages of consultation and revision. A national planners’seminar of Local and Central Government Planners was held in June2002 to discuss issues of common interest, particularly to ensure thatLocal Authority concerns were incorporated into the NationalDevelopment Plan, as well as discuss the distribution of national projectsamongst the various Local Authorities. Subsequently, a Special NationalDistrict Development Conference (NDDC) was held to consult furtheron the draft NDP 9. The NDDC offered another opportunity forstakeholders, such as Local Authorities, the private sector, trade unionsand NGO to comment on the draft Plan and ensure that their viewswere taken on board in NDP 9. The draft Plan was subsequentlydiscussed by the Economic Committee of Cabinet in August and laterby Cabinet in October 2002. National Development Plan 9 wasapproved by Parliament in November 2002; and implementation ofthe Plan commenced on 1st April 2003.
The National Development Plan seeks to advance achievement ofthe pillars of Vision 2016; namely, ensuring that by 2016 Botswana is:educated and informed prosperous, productive and innovativecompassionate, just and caring safe and secure open, democratic andaccountable moral and tolerant and a united and proud nation.
62
The Plan recognises that given the small size of the Botswana market,global competitiveness is critical for achieving sustainable and diversifieddevelopment. The theme of National Development Plan 9 is TowardsRealisation of Vision 2016: Sustainable and Diversified Developmentthrough Competitiveness in Global Markets. The Plan, thus, supportsefforts aimed at enhancing Botswana’s competitiveness within theglobal economy through initiatives aimed at increasing the supply ofeducated and trained manpower, intensifying research anddevelopment, and fostering the development of financial markets.The Plan also seeks reforms that will improve the efficiency with whichdomestic resources (that is, labour, capital and natural resources) areutilised. The Plan recognises that continued sound macroeconomicpolicies will be essential prerequisites for effective engagement in theinternational market.
NDP 9 highlights issues of economic diversification, employmentcreation and poverty alleviation, maintaining macroeconomic stability,financial discipline, public sector reforms, environmental protection,rural development, human resource development, including the fightagainst HIV/AIDS, science and technology development, and disastermanagement. Policy strategies to address these issues are crucial ifBotswana is to achieve sustainable and diversified development throughcompetitiveness in global markets.
Botswana’s national vision, Vision 2016, sets out seven pillars ofwhat Botswana aspires to be by the time the nation is 50 years old.These include:• An Educated, Informed Nation
In 2016 Botswana should be an educated, informed society, withopportunities for lifelong human resources development, whetherin academic fields or in vocational and technical subjects. Thecountry will have joined the information age, with full access to themedia of communication and information flows.
• A Prosperous, Productive and Innovative NationBotswana should, in twenty years after 1996, be a prosperous,productive and innovative society. It should have a diversifiedeconomy with an average income level per person of three timesthe 1996 level, the equivalent of US$8,500 in 1996 prices. There
63
should be full employment, so that the job opportunities are inbalance with the number of people seeking work.
• A Compassionate, Just and Caring NationIn the year 2016, the Vision expects Botswana to be a just andcaring society, with an equitable distribution of income, and nopeople living in poverty. A strong social safety net should supportthose who are disadvantaged.
• A Safe and Secure NationIn the year 2016, Botswana should be a safe and secure society,with Batswana confident of their physical well-being and humanrights.
• An Open, Democratic and Accountable NationBy 2016, the Vision aspires for Botswana to be an open, democraticand accountable society, where the traditions of community orientedand decentralised democracy will be on a sound foundation. Allcitizens and those in positions of leadership will hold themselvesaccountable for their actions, and to those they represent.
• A Moral and Tolerant NationIn 2016 Botswana, should be a moral, ethical and tolerant society,with standards of personal morality of the highest quality. No citizenwill be disadvantaged by gender, age, religion, ethnic origin orpolitical opinions.
• A United and Proud NationThe seventh pillar foresees Botswana, by the year 2016, being aunited and proud nation, sharing common goals based on acommon heritage, national pride and a desire for stability. Thecountry will possess a diverse mix of cultures, languages, traditionsand peoples sharing a common destiny. The country will haveachieved ethnic integration and full partnership to create a nationin harmony with itself.
5.2.3 Qualitative Overview of the Domestic Economy
Botswana’s economy has been driven by a diamond boom for along time (nearly 35 years), which has allowed provision of many
social services for free or at a nominal fee. Over much of that period,social expenditures by Government on education, health, water, etc.,
64
have been taken for granted by society, even though some individualscould easily have paid for such services. The second half of NationalDevelopment Plan 9 appears to signal a period of real transition frombudget surpluses to budget deficits that previous plans, at least sinceNDP 6, have warned would be coming. After 16 years (1982-1998)of consistent budget surpluses Government has recorded budgetdeficits in the last two years of NDP 8. This has led to emphasis nowbeing placed on achieving greater cost-recovery for the provision ofGovernment services, improvements in productivity in the public serviceand the parastatal sector and the need to privatise some of theparastatals.
HIV/AIDS still remains a serious challenge for the country. At thenational level, providing anti-retroviral (ARV) drugs to a substantialpart of the population which is infected, estimated at 17.3 percent ofthose over 18 months of age, will require increasing proportions ofthe limited resources available. While recent surveys indicate that thelevel of infection may have stabilised, there is still a major problem ofensuring that a substantial proportion of the affected individuals livelong and productive lives.
Government has, quite prudently, used the earnings from thediamond mines to develop the nation’s economic infrastructure, whichhelped to create the environment needed for long-term development.Government has had a major role to play in ensuring thatmacroeconomic conditions supported the objective of diversifieddevelopment. This has included managing the exchange rate with aview to maintaining the competitiveness of domestic producers,especially producers of non-traditional exports (Leith, 1996, 1997b).Other supporting economic policies have included a liberal exchangecontrol regime, which culminated in the abolition of all exchangecontrols in 1999, and low rates of direct taxation, which were intendedto encourage foreign direct investment and business development.
Despite the stable economic and political environment in whichbusiness operates in Botswana, the economy still faces majorchallenges. Poverty and unemployment remain high and productivityis relatively low. Linkages among economic sectors are still very weak.The new engines of growth (Manufacturing, Tourism and FinancialServices), which the Government has targeted for rapid growth, are
65
not growing rapidly enough to propel the economy forward fastenough.
Government has supported particular economic sectors from timeto time, such as agriculture, manufacturing, tourism and, more recently,the international financial services centre. Government has alsosupported the development of small, medium and micro enterprisesthrough a number of programmes, since such enterprises are viewedto be critical for the socio-economic development of the country (BIDPA,1999). But the general thrust of development policy since the early1980s has been directed at the establishment of a viable manufacturingsector (Leith, 2000). Unfortunately, the manufacturing sector inBotswana has not turned out to be the engine of growth hoped for(BIDPA, 2000b).
In Botswana’s policy making, there has been a general acceptanceof the view that the underlying policy framework for diversifieddevelopment should be broadly neutral across sectors (ROB, 1998b;World Bank, 1989). This includes having a politically and economicallystable system, with a business-friendly environment, includingtransparent, credible policies, fiscal balance, low tax rates, lack ofcorruption, harmonious industrial relations, an educated and disciplinedworkforce, and a sound financial system.
However, Government has often been pressured to intervene andsteer the economy towards some desired outcomes, on the basis thatthe private sector is too small and underdeveloped. The small size ofthe domestic economy has, indeed, worked against development inseveral ways. While Government must provide the needed physicalpublic infrastructure, as well as an efficient legal and administrativesystem, if the private sector is to develop and become more diversified,more Government intervention in the economy must be exercised withcaution and assessed on its merits very carefully. Part of the problemis that Government intervention can foster a culture of dependency,in which Batswana will become excessively dependent on Governmentsubsidies for their continued well-being. Such dependency is notsustainable, and risks creating other problems of inefficiency, lack ofinnovation, abuse and corruption (BOB, 2001).
Botswana’s macroeconomic policy framework is generally supportiveof the private sector and market-oriented development. Government
66
has maintained a sound and stable fiscal position, running budgetsurpluses over most of the past two decades and accumulatingsubstantial long-term savings, which are reflected in the nation’srelatively high level of foreign exchange reserves. The country hasmaintained a relatively stable and, in the view of many analysts, areasonably competitive real exchange rate vis-à-vis its major tradingpartners. The Government has devalued the Pula exchange rate twicein the past 16 months in order to restore the internationalcompetitiveness of local producers. Positive real interest rates,comparable to those in major international markets, have supportedsound investments and allowed for progressive liberalisation andeventual abolition of exchange controls (Leith, 1997b, 2000). A Soundmonetary policy has kept inflation fairly low and stable. The IncomesPolicy has attempted (with some success) to restrain wage increasesto be in line with productivity. Trade policy has been oriented towardshaving a relatively open-economy, with prices and costs in line withinternational norms. Shortages of skilled labour, while a cause forconcern, have been ameliorated through recruitment of expatriatesand generous government support for education and trainingprogrammes (BOB, 2000).
Because the local market is so small, manufacturing and otherindustries in Botswana cannot expect to derive most of their growthor achieve economies of scale from just domestic demand (Jefferis,1997a). The major challenge will be to promote manufacturing andother non-traditional exports, since they will face increasing competitivepressure in both domestic and foreign markets as regional and globaltrade barriers come down and the flow of international goods andservices becomes freer.
5.2.4 Government’s Expectations about Future EconomicDevelopments
Unquestionably, the mining sector has contributed substantially tothe transformation of Botswana, with the large mines serving as
nodes for development. However, only the diamond mines have yieldedlarge positive net economic and financial returns to the nation. Becauseof the capital-intensive nature of the mines, they have relatively few
67
linkages with the rest of the private sector. Government has been themajor economic actor, using the returns from diamond mining anddonor assistance to develop the country, employ large numbers ofworkers and provide public goods and services. However, governmenthas become excessively dependent upon diamond revenues, whichare not expected to grow much in the future. Since other sources ofrevenue are unlikely to be as buoyant as the diamond revenues havebeen, the relative size and scope of government in the economy willneed to change in the future.
Manufacturing, financial services and tourism are viewed as keysectors for the success of Botswana’s strategies for sustainable economicdiversification. Manufacturing can employ large numbers of relativelyless skilled Batswana, and have substantial linkages to the rest of theeconomy. Botswana’s stable economic and political environment, itssound public finances, liberal market-oriented policies and relativelywell-educated young workforce gives the country a comparativeadvantage in the financial services sector. Similarly, those factors, alongwith the rich wildlife populations and pristine nature reserves, givesthe country a substantial advantage in developing its tourism industry,which could have important positive spillover effects on the incomegenerating opportunities of rural communities. But, all three sectorsare constrained by impediments to development, including regionaleconomic instability, inadequate telecommunications, shortages ofskilled manpower, sluggish bureaucratic processes, shortages ofserviced land, etc.
Thus, any serious review of the Botswana economy will easilyconclude that the theme of NDP 9, “Towards Realisation of Vision2016: Sustainable and Diversified Development throughCompetitiveness in Global Markets” is still relevant in 2005. In orderto sustain growth Botswana must invest in human resourcesdevelopment, so that Batswana can acquire needed skills, work moreefficiently and be innovative enough to be able to compete effectivelyin both regional and global markets.
68
5.2.5 Botswana’s Broad Policy Approach and Priorities
The Government sees its primary role in the diversification processas being able to provide an environment that is conducive for private
sector initiatives and innovations to take effect and be successful. Inthis respect, Government seeks to maintain favourable macroeconomicconditions in terms of competitive exchange rates, low tax rates, anenvironment free of exchange controls, easy access to credit and pricestability. Policies and programmes, such as the Privatisation Policy, theInternational Financial Services Centre and the review of the NationalPolicy on Incomes, Employment, Prices and Profits, among others, areintended to help Government to achieve these objectives.
Government believes that long-term solutions to the problem ofpoverty will be found in efforts to enhance job creation, along withfurther expansion of relevant education and training. In the short-term, Government is implementing and improving the effectivenessof existing programmes aimed at poverty alleviation. Government isformulating a National Strategy for Poverty Reduction, taking intoaccount the 2002/03 Household Income and Expenditure Survey, whichwill provide updated information on the nature and extent of povertyin Botswana.
5.2.6 Overview of Economic Policy
Maintaining macroeconomic stability as one of the strategies tocreate a conducive environment for rapid private sector
development has been the of government policy,. Accumulatinginternational reserves and government savings during good years toallow smooth adjustments to the contingencies to which the countryis subject is another key strategy. Re-investing the returns from mineralsector development into economic and social infrastructure that couldallow private firms to diversify the economy was also a principal elementof public policy.
Government has also played a pivotal role in influencing privatesector development. This is because government policies, in both theirdesign and implementation, significantly affect the performance anddevelopment of the private sector. Achievement of the NDP themes,
69
such as the NDP 8 theme of “Sustainable Economic Diversification”,was predicated on the development of the private sector. TheGovernment has put in place programmes and policies aimed atpromoting the development of the private sector, by helping the sectorto develop its managerial capacity and scale of operations in order tomeet competition. These initiatives have included, inter alia, the FAP,the Industrial Development Policy, the SMME Policy and CEDA.
The drafting of a Privatisation Policy in 1998 was intended to fosterprivate sector participation in the development process throughwithdrawing government from certain business activities as a meansto provide greater scope and markets for local entrepreneurship andprivate sector initiative. The major theme of the White Paper on theIndustrial Development Policy is the need to increase the scope for thegrowth of the private sector which also requires that governmentwithdraw from certain activities that can be better provided by theprivate sector. Such privatisation will have positive effects on privatesector ownership of assets and responsibility for the provision of goodsand services. In the privatisation process, some of the services thatgovernment requires for its operation, such as transportation services,cleaning and computer services, are to be provided by the privatesector.
Despite the rapid and broad-based development achieved,unemployment has remained a serious problem. The growth of themining sector has created relatively few jobs directly similarly the rapidgrowth of the rest of the modern economy has not been able to absorball the workers wishing to move out of traditional, subsistenceagriculture, as well as all the new workers entering the labour force(less attrition). The agriculture sector has experienced a long-termsecular decline, despite intense efforts by government to design, fundand support programmes that could raise productivity and incomes inthe sector. Nonetheless, many Batswana are still engaged in the sector,deriving significant portions of their livelihoods there; and the sectorhas widespread linkages throughout the economy, especially to meatprocessing, dairy production, beverage manufacturing and bakeries.
70
5.2.6.1 Macroeconomic Policy
The Ministry of Finance and Development Planning has a primaryresponsibility to formulate a of macroeconomic policy in
consultation with the Bank of Botswana and other stakeholders. Keyto the formulation of such a policy are the objectives of achieving andmaintaining macroeconomic stability in the context of an economythat is prone to large, unanticipated exogenous shocks (e.g., globalrecessions and drought). Botswana’s major sectors have typicallyexperienced large fluctuations in output and prices, which, in turn,have resulted in large fluctuations in incomes, foreign exchangeearnings, government revenues and even the need for compensatorygovernment expenditures (e.g., drought relief).
Another primary objective of macroeconomic policy is to create anenvironment that is conducive for private sector development thatcould lead to rapid employment growth and rising standards of living.The main elements of Botswana’s economic management strategyare articulated in the National Development Plans; and in generally,Government has generally been successful in avoiding an extremeboom and bust economic cycles.
A key element of Botswana’s macroeconomic strategy has beenthe accumulation of government savings during the good yearsGovernment can draw from these savings during economic downturnswhich usually entail sharp falls in government revenues. These savingsalso sustain Government expenditure levels, while adjustment measuresare designed and put in place to achieve a credible medium termpublic expenditure programme that is viable. Much of the governmentsavings go into foreign exchange reserves, which are managed by theBank of Botswana. But a substantial portion is also lent through thePublic Debt Service Fund to parastatals to finance their capitalexpenditure programmes.
Another key element in Botswana’s economic management strategyhas been the policy to re-invest most of the returns from the miningsector to develop the rest of the economy. This strategy was clearlyspelt out in early national policy statements, such as the 1972 IncomesPolicy (see Botswana Government, 1972) and the 1973 RuralDevelopment Policy, and was monitored through simple analytical tools

71
such as the Sustainable Budget Index. The funds reinvested byGovernment, combined with external resources contributed by donoragencies, along with funds from foreign investors, enabled Botswanato achieve and maintain investment rates as a percent of GDP thatwere very high by international standards. This policy of reinvestingthe returns from mining was extended beyond just investment inphysical capital (e.g., roads, schools, hospitals, serviced land, etc.); italso included investment in human capital (Bank of Botswana, 2001).
The accumulation of healthy levels of foreign exchange reserveswhich boosted investor confidence is another critical element in theeconomic management strategy. The international reserves allowedfor an open trade regime, within the framework of the SouthernAfrican Customs Union Agreement, that facilitated Botswana havingan exchange control regime that was not only quite liberal in developingcountry standards at the time, but also one that was progressivelyliberalised and eventually abolished. The strategy of accumulatinginternational reserves led to foreign exchange earnings that became amajor source of recurring revenues to Government: in essence, thestrategy amounted to converting one non-renewable, depleting asset(diamonds) to another sustainable income generating asset (profitableforeign investments).
There are a number of other government policies that arecomplementary to, and an integral part of, the macroeconomic policyframework.
5.2.6.2 Fiscal Policy
Fiscal policy concerns Government’s management of revenues andexpenditures in ways that are directed at satisfying the needs of
the population for public goods and services on a sustainable basis. Amajor concern of fiscal policy is to ensure that public resources areefficiently and effectively used to provide the economic and socialinfrastructure needed for rapid private sector development, includingthat which is needed for economic diversification and growth ofenterprises producing for export.
A major element of fiscal policy is the objective to balance the budgetover a medium term horizon, such as the six years of NDP 9. Failure to
72
achieve such a balanced budget objective would result in the depletionof Government’s cash balances and would soon result in Governmenthaving to borrow in order to finance its recurrent expenditures. Ifthat were to happen, payment of debt service obligations wouldbecome the first claim on Government’s revenues, which would thenconstrain or reduce the resources available for recurrent expendituresand new development projects.
During NDP 8, Government revenue exceeded expenditure(excluding net lending) by a small positive amount of 0.5 percent ofGDP on average. Due to substantial year to year fluctuations inGovernment’s revenues, the range of the difference between revenuesand expenditures was enormous, fluctuating from a surplus of 8.7percent of GDP to a deficit of -7.1 percent of GDP. The positive balancesaccumulated on average over the earlier years of NDP 8 permittedGovernment to set aside funds for future contingencies, includingdrought and the funding of the Public Officers’ Pension Fund.
The Government recognises that the high year to year variability ofrevenue must be taken into account in its planning. Temporary increasesin government revenue should not lead to increases in spending, sincetemporary revenue increases can be expected to be reversed in thenear future. In the other direction, Government should not respondto temporary decreases in revenues by cutting expenditures, since thatcould be destabilising to the rest of the economy. Because Governmentexpenditure is such a large share of total GDP expenditure, Governmenthas an important stabilising role to play in the macroeconomy. In lightof this, Government has set an objective that the budget must bebalanced over the medium term. This implies that in good years, theextra revenue is not spent, but saved and added to Government’sbalances, to be available for the difficult years, when Government’scash balances are drawn down.
The variability of revenues is not the only fiscal policy concern. Onrecent years, Government has been taking a bigger and bigger shareof the national pie, crowding out other uses and users of the goodsand services produced in the country. Government consumption as ashare of GDP has edged upwards from 27 percent of GDP in 1993/94to 34 percent of GDP in 2003/04, while household consumptionexpenditure, investment expenditure, and net exports of goods and
73
services have all dropped as a share of GDP. This trend is not sustainable.More importantly, the crowding out of investment expenditure andthe declining net exports threaten the achievement of NDP 9’sdiversified growth and employment targets, and ultimately theattainment of Vision 2016 objectives.
5.2.6.3 Monetary Policy
Monetary policy is formulated with the objective of maintaining alow and stable rate of inflation and a stable balance between
the growth rates of aggregate demand and aggregate supply. It alsoseeks to achieve a stable real exchange rate at a level which is supportiveof the international competitiveness of local producers. Thus, monetarypolicy aims at creating and maintaining a business environment whichis “friendly” towards producers of exports and other tradeable goods.A key aspect of this approach is to have the rate of inflation in Botswanabelow that of the average of its trading partners. Thus, with anexchange rate pegged to a basket of currencies reflecting the relevanttrading partners, the real effective exchange rate would depreciate, andlocal producers of exports and other tradeable goods would becomeincreasingly competitive. In addition, the monetary policy aims atmaintaining healthy and prudential levels of international reserves andunrestricted access to foreign exchange for international transactions.
5.2.6.4 Exchange Rate Policy
Exchange rate policy, which relates to both the monetary policy andthe trade policy (and even the fiscal policy) is directed at achieving
an equitable balance between maintaining the competitive positionof domestic producers, especially producers of non-traditional exports,and avoiding monetary instability and high inflation. Sustainableeconomic diversification, the creation of productive employmentopportunities and expanding economic opportunities for Batswanaentrepreneurs, which are high development priorities, means thatgreater emphasis in the formulation and implementation of theexchange rate policy must be given to maintaining the internationalcompetitiveness of domestic producers of exports and tradeable goods.
74
5.2.6.5 Trade Policy
Achieving the broadest possible free and reliable access to marketsfor Botswana’s exports of products and services, especially within
the Southern African region, is a major objective of Botswana’s tradepolicy. Also, enabling producers and consumers to have access to thewidest choices of international goods and services on the best possibleterms is another key objective of the trade policy. Such policy is limitedby the international trade agreements to which Botswana accedes,such as the Southern African Customs Union Agreement and the WorldTrade Organisation.
In light of Botswana’s membership to the Southern African CustomsUnion (and accession to the Southern African Development CommunityTrade Protocol), the market of South Africa is a logical extension tothe Botswana market for many Botswana firms. This means thatbusiness practices in South Africa are likely to have direct implicationson the Botswana economy and the ability of Botswana firms to competeeffectively in this large market.
In order to provide additional market access for Botswana goodsand services, the Government has participated and/or participates inthe negotiations of a number of trade agreements, such as the ACP-EU Economic Partnership Agreements, the EU/SACU Free TradeAgreement, and the USA/SACU Free Trade Agreement, as well as inthe implementation of the new SACU Agreement.
A related trade policy issue involves Botswana’s investment policy.The Botswana Export Development and Investment Authority has beenestablished and mandated to actively promote investment flows intothe country. It has developed a strategy for attracting Foreign DirectInvestment (FDI), especially manufacturing activities that can utilisethe country’s raw materials, such as leather, jewellery, glass and beefby-products, as well as service industries, like information technologyand tourism.

75
5.2.6.6 Labour Market Policy Framework
Incomes Policy
A major element of Botswana’s labour market policy frameworkhas been the Incomes Policy. Government wage and incomes
policy is intended to cover areas where the market forces determiningprices, wages and incomes may not result in efficient and/or equitableresults. Thus, minimum wage regulations are intended to preventexploitation and achieve other social policy objectives, while parastatals’wages and salaries are kept aligned with Government wages scales toforestall excessive wages and cost structures that could make theeconomy uncompetitive. Thus, the incomes policy aims at makingthe business climate attractive for investors, especially for investmentsin enterprises that could produce exportable goods and services.
Botswana’s Incomes Policy was adopted in 1972 with a view toavoiding rapid wage escalation that could lead to growing incomedisparities and social discord. At that time, the Incomes Policyemphasised rural development and employment creation, which wereviewed as key operational targets for achieving the nationaldevelopment goals and objectives. With most of the population livingin rural areas and engaged in subsistence farming as their mainlivelihood, there was concern that mineral developments underwayand the urbanisation processes that were occurring, especially inGaborone, would lead to manpower shortages, rapid wage escalation,widening income disparities, urban migration, growing urbanunemployment and social tensions. Government was concerned thatthe emergence of such problems could thwart its strategies foreconomic and social development. While Government would developskilled manpower as rapidly as possible, it viewed wage restraint as acrucial ingredient in its overall macroeconomic policy framework. Wagerestraint was considered important for promoting employment creationand enabling Government’s resources available for development to bespread as widely as possible. At the same time, Government recognisedthe need to protect workers and consumers from monopolisticexploitation.
76
Apart from statutory minimum wages and price controls, enforcementof the Incomes Policy was left to institutional structures; i.e., theNational Employment, Manpower and Incomes Council, its sub-committees and the Wages Policy Committee, which sought voluntarycompliance with the Policy.
The major features of the Revised National Policy on Incomes,Employment, Prices and Profits, Government Paper No. 1 of 1990included:• Statutory minimum wages in the private sector as a means of
protecting Batswana workers from monopsonistic exploitation.• Deregulated private sector salaries for skilled labour, since market
forces, the need to remain competitive and the profit motive are“expected to constrain the degree to which salaries can be raisedin the private sector.”
• Regulating parastatals’ salaries through a linkage to those ofGovernment, because parastatals have been given special positions,some even monopoly positions, in order to serve social, as well aseconomic objectives.
• Recognition that salaries should reward personnel for increasingresponsibility in order to provide suitable incentives to enhanceproductivity and efficiency, and allocate and retain labour where itis most productive.
• Government accepts responsibility for general training of thepopulation, since relying on the private sector for non-specifictraining would tend to result in too little training. Employers areexpected to train for their specific needs.
• Businesses are required to prepare and implement localisation plans,but there should be competition amongst Batswana for each ofthe expatriate posts to be localised.
• Manpower planning in order to provide important input for planningeducation and training facilities and programmes.
• The Bursaries system should aim for cost recovery and appropriateincentives for the development of the scarce manpower, the nationneeds more skilled man power for its continued development.
• Expatriate remuneration should be based on employers getting“value for money”, and localising posts at the earliest opportunity.
77
• Government policy on prices and rents is to encourage competition,which will curtail unjustified increases in prices and excessive profits.•Where prices need to be regulated because of actual or potentialmonopolistic exploitation, prices should reflect costs. Governmentsupport for particular groups (e.g., remote area dwellers) will bedone directly, not through price controls, which have distortingeffects throughout the economy.
• Housing should be provided and allocated by the private sector,using market prices as signals to encourage its efficient production,acquisition and allocation by firms and individuals. Government’smain goal is to ensure that an adequate number of servicedresidential plots are available for sale. As a transitional measure,Government will provide finance for house construction, preferablyby channelling funds into house financing institutions, such as BBS.
• Increasing productive employment in both the formal and informalsectors is the preferred way to raise social welfare. That would bemore sustainable and most likely to spread the benefits ofdevelopment widely throughout the country, as well as reduce theinterrelated problems of unemployment, poverty and incomeinequality.
The Revised National Policy on Incomes, Employment, Prices and Profitswas reviewed in 2003/04 with a view to aligning Botswana’s IncomesPolicy with best international practices, as well as with the country’sVision 2016 and other national policies. As a result of the review,Government is at advanced stages of adopting a new incomes policy.
Labour Law
Botswana’s business environment is conditioned by the country’sprimary labour legislation, including, inter alia: the Employment Act,the Workers Compensation Act, the Trade Unions and Employers’Organisations Act, the Employment of Non-Citizens Act, the FactoriesAct and the Trade Disputes Act. Other sources of labour law includeIndustrial Court decisions, which create case law, collective agreementswhich bind the parties to the agreement, contracts of employmentwhich specify the relationship between the employer and the employee,
78
and custom and practice which are employment practices which havecome to be used and accepted over a period of time.
The amended Employment Act of 1982 lays down minimumconditions of employment for employees, including, inter alia, workinghours, overtime, paid public holidays, leave, sick leave, maternity leave,minimum wages, employment records, probation, notice, suspensionand termination, severance benefit: the 5 year service award, andrepatriation. The Worker’s Compensation Act of 1998 requires anemployer to pay compensation to any employee who is incapacitatedthrough a work-related injury or occupational disease. Employers arealso required to take up an insurance policy to cover liability under theAct. The amended Trade Unions and Employers’ Organisations Act of1984 makes provision for, and sets out the rules for, three categoriesof organisation relating to the labour market: trade unions, federationsof trade unions and employers’ organisations. The Employment ofNon-Citizens Act serves to regulate the employment and otherengagement in occupations for reward or profit of certain personswho are not citizens of Botswana. The Factories Act, which isadministered by the Factories Inspectorate of the Department of Labourand Social Security, provides for the regulation of the conditions ofemployment in factories and other places regarding the safety, healthand welfare of persons employed. It also provides for the safety andinspection of certain plant and machinery with respect to employeehealth and safety. The Trade Disputes Act provides for settlement oftrade disputes generally, as well as the settlement of trade disputes inessential services. It also provides for the control and regulation ofindustrial action and related matters.
Botswana’s labour laws including the enactment of a new TradeDisputes Act, and the Trade Unions and Employers’ Organisations Actwere amended recently. These amendments were intended, partiallyat least, to bring labour laws in Botswana fully into compliance withrelevant international labour standards. From as far back as 1990, theGovernment has adopted a policy of reviewing labour legislation witha view to strengthening collective bargaining and the development ofTrade Unions. Ratification of a number of conventions in 1997,including the core Conventions on the right to organise and bargaincollectively was part of the implementation of the policy. Since then,
79
Government has embarked on a programme to give effect to itsinternational obligations. This has been a long process, but one inwhich Government has been determined to secure the fullest possibleconsensus between the social partners - business and labour - on theproposed changes, and to ensure that, as far as possible, the necessaryinfrastructure was created to ensure the smooth implementation ofthe new laws.
The international standards Botswana has adopted represent thefundamental rights necessary in any modern society to ensure socialstability and economic progress, both within States and between States.This is particularly so in the Southern African community, whereinternational labour standards have formed the basis of recent labourlaw reforms throughout the region. While these reforms acknowledgethe social dimension of globalisation and the universality of certainlabour rights, they also acknowledge the economic and socialinterdependence of the various nations in our region, and they reaffirmthe principle that fundamental labour rights must be secured ifeconomic and social progress is to be made. This process of reformhas resulted in closer harmonisation of employment laws within SADCthan ever before, and will ensure that fair labour standards prevailthroughout the region, and that the rights of employers and employees,respectively, will be safeguarded.
The labour laws in Botswana recognise the fundamental right ofemployers and employees to join organisations of their own choosing,to bargain collectively, and to establish conditions where the freeexercise of those rights is guaranteed. As a policy matter, collectivebargaining is the preferred means by which, in full autonomy, employerson the one hand and workers and their representatives on the otherhand, should together establish working conditions and terms ofemployment. While Government will continue to play its role indetermining minimum terms and conditions of employment at work,the legislation promotes free collective bargaining, not only as a meansof establishing terms and conditions of employment beyond theminimum provisions, but also as a mechanism through which employersand workers exchange views and resolve differences of opinion on awide variety of issues through a process of dialogue.
80
The labour laws acknowledge that conflict is inherent in and a realityof the employment relationship. More importantly however, the labourlaws reflect that this conflict is best dealt with within the confines ofthat relationship. Where the parties are themselves unable tosuccessfully resolve disputes, the legislation creates a system of disputeresolution aimed primarily at assisting parties to resolve their owndisputes with the help of third parties. Mediation and conciliation areaccorded primacy by the legislation as the means by which disputesmight be resolved, and comparative experience suggests that timeousand skilful intervention by a neutral third party can contributesignificantly to reducing levels of industrial conflict.
Another important point to be made in this respect is that theoverhaul of the statutory dispute settlement system is intended toensure expeditious access by both employers and employees to anefficient and inexpensive system of dispute resolution. Unfortunately,implementation of Botswana’s dispute settlement system hasexperienced some difficulties, and delays have occurred as aconsequence. However, the Government has stated that it is committedto continuing to address these hindrances in order that the systemoperates as was intended.
The labour law also recognises that parties to an employmentrelationship may not always be able to resolve their differences; andthat, on occasion, they may need to resort to industrial action to pursuetheir demands. Botswana’s legislation recognises the legitimacy ofindustrial action, both by employers and employees, and entrenchesthe rights to strike and to lock out, respectively. As with all rights,neither of these rights is absolute, and must yield to competing rightswhen this is necessary. The labour legislation achieves this by limitingthe issues that might be the subject of industrial action by requiring ameaningful attempt at resolving the dispute giving rise to the action,and by protecting the interests of third parties affected, for example,disputes involving essential services employees.
It is Government’s view that the right to resort to industrial action isa right that must be exercised with caution, and with due regard tothe damage that it is capable of inflicting, not only on the partiesinvolved in the dispute, but also on the broader society. This isparticularly so in those sectors on which Botswana is dependent for its
81
economic well-being. The more expansive rights that have beenextended to employers and employees by the new legislation demanda corresponding sense of responsibility from both parties.
The model of labour relations that is promoted by the legislation isnot one of hostility and unnecessary conflict. It is a model that promotesco-operation and partnership, and the recognition that the relationshipbetween employers and employees is ultimately one ofinterdependency. If either employers or employees, simply for short-term gain, exploit unwisely the rights established by the new legislation,the goals of the new labour law will not have been achieved. Theinstitution of collective bargaining is intended to guarantee seriousand committed engagement, and outcomes that account for theinterests of both parties. This is the best guarantee of industrial peace,which in itself is a basis for sustainable economic progress.
Botswana’s new labour laws reaffirm the significance of tri-partism.This recognition finds expression in a number of structures, such asthe Labour Advisory Board and the Minimum Wage Advisory Board,on which government, employers and employees are represented.These Boards are appointed primarily to advise the Minister of Labourand Home Affairs on employment-related matters. The tripartite natureof the Boards not only gives institutional expression to the principle oftri-partism, but also acknowledges that good labour relations are bestachieved by way of a partnership at national level, betweengovernment, business and labour. These tripartite structures enablethe parties, through a process of social dialogue, to debate how theirrespective interests might relate to the broader challenges of the societyas a whole. Such social dialogue has been a long-standing part ofBotswana’s tradition; and therefore, it is appropriate that it shouldapply to labour relations.
5.2.6.7 Human Resources Development
With respect to human resources development, Government haslong recognised the importance and significance of human
capital as a key element in achieving economic development, and,thus, in reducing levels of unemployment and poverty. During thecurrent Plan period, NDP 9, human resources development is focused
82
on the creation of a strong manpower base with the right knowledge,skills, attitude and values, which will enhance productivity andcompetitiveness. It is, therefore, important that manpower planningand human resources development focus on developing appropriatelytrained labour for the labour market.
Priorities for the human resources development sector during NDP 9involve: ensuring universal access to 10-years basic education;increasing access to senior secondary education; expanding vocationaland technical training; promoting life-long learning; increasing tertiaryeducation participation and attainment rates; improving access toeducation services by children and youth with special needs; andimproving the quality of education.
5.2.6.8 Employment Creation and Poverty Alleviation
Employment creation has long been a high priority in Botswana’snational development planning strategies. While formal sector
employment has grown rapidly over the past 3½ decades,unemployment in Botswana, with a national rate of nearly 24 percentin 2003, is a serious problem. Unemployment is concentrated amongthe youth and those who are unskilled; while, at the same time, theeconomy continues to suffer significant manpower shortages in higherskilled occupations; shortages which act to constrain development.The unemployment problem springs from a number of differentsources, and the challenge is to understand those sources and howbest to tackle them. One clear message that has emerged from studiesof the labour market and the manpower situation is that the country’shuman resources development system needs to be improved so thatthe education and training provided matches the needs of the economy.Development of the vocational education and training system is viewedas having an important role in this regard.
However, even if unemployment is significantly reduced, there willstill be segments of the population (e.g., destitutes, orphans, thedisabled) for which other poverty reduction strategies will be needed.Government is committed to intensifying its efforts to achieve theVision 2016 target of eradicating poverty through implementation ofthe National Poverty Reduction Strategy. As part of implementation
83
of the overall strategy, the different social safety net schemes are beingreviewed with a view to improving their efficiency and targeting.
5.2.6.9 Government’s Approach to Sequencing
Government’s approach to the sequencing of reforms has typicallyinvolved first undertaking comprehensive studies (often by
consultants) to thoroughly analyse the issues involved, identify therelevant alternatives, their costs and benefits, and provide some initialrecommendations on the preferred course(s) of action. This is thenfollowed by extensive consultative processes, sometimes involvingpresidential commissions and national symposia, to ensure a widelyunderstood and broadly supported consensus that can be achieved.Subsequent to that, the recommended action(s) is(are) considered byCabinet and ultimately the National Assembly. Associated with theintroduction of the policy reform is the need to get the appropriateinstitutional structures in place, for actually doing the implementation,for supervising the implementation and/or regulating the operationof the reform, for monitoring and evaluating the implementation ofthe reform, and for being able to make any revisions that may benecessary.
5.3 Successes and Problems in Achieving MacroeconomicConvergence Targets
As noted above, Botswana has been generally successful in achievingthe macroeconomic convergence targets for deepening
integration in SADC, when viewed from a medium term perspective.In terms of the target GDP growth rate Botswana has not been ableto achieve, on average, the specified 7 percent per annum rate ofgrowth. While in the past, prior to 1992, Botswana was able to achievean average annual rate of growth of GDP in excess of the SADC target,recent years have seen a slow down in the average growth rate, withcurrent expectations indicating a growth of only 4%-5% for the comingyears. This is not only below the SADC target, it is also far belowBotswana’s Vision 2016 target, implying that the country is unlikely toachieve the Vision objectives for per capita incomes and full
84
employment. Projections for GDP growth from the NDP 9 Mid-TermReview for 2006/07, 2007/08 and 2008/09 are 4.3%, 4.4% and 4.4%for the respective years. The lower growth rates have implications forthe attainment and sustainability of the other SADC macroeconomicconvergence targets that Botswana has achieved so far. If growth doesnot recover, Botswana may face difficulties in sustaining the record ithas on the convergence targets.
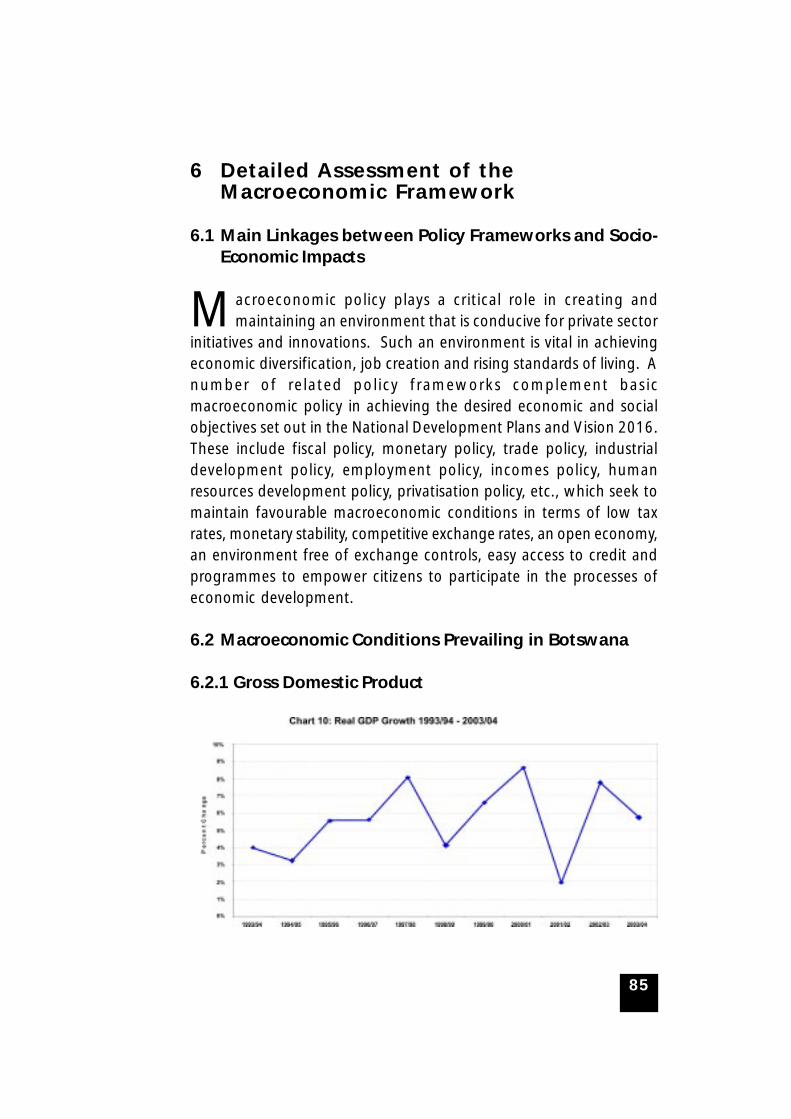
85
6 Detailed Assessment of theMacroeconomic Framework
6.1 Main Linkages between Policy Frameworks and Socio-Economic Impacts
Macroeconomic policy plays a critical role in creating andmaintaining an environment that is conducive for private sector
initiatives and innovations. Such an environment is vital in achievingeconomic diversification, job creation and rising standards of living. Anumber of related policy frameworks complement basicmacroeconomic policy in achieving the desired economic and socialobjectives set out in the National Development Plans and Vision 2016.These include fiscal policy, monetary policy, trade policy, industrialdevelopment policy, employment policy, incomes policy, humanresources development policy, privatisation policy, etc., which seek tomaintain favourable macroeconomic conditions in terms of low taxrates, monetary stability, competitive exchange rates, an open economy,an environment free of exchange controls, easy access to credit andprogrammes to empower citizens to participate in the processes ofeconomic development.
6.2 Macroeconomic Conditions Prevailing in Botswana
6.2.1 Gross Domestic Product
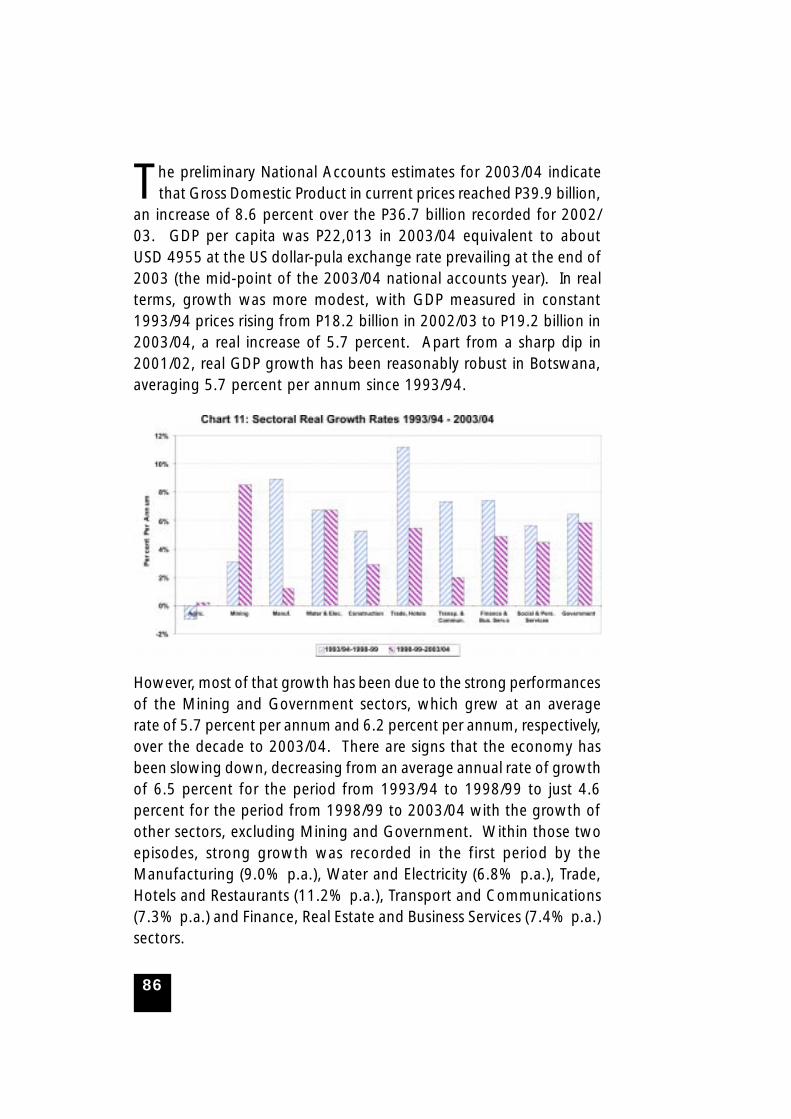
86
The preliminary National Accounts estimates for 2003/04 indicatethat Gross Domestic Product in current prices reached P39.9 billion,
an increase of 8.6 percent over the P36.7 billion recorded for 2002/03. GDP per capita was P22,013 in 2003/04 equivalent to aboutUSD 4955 at the US dollar-pula exchange rate prevailing at the end of2003 (the mid-point of the 2003/04 national accounts year). In realterms, growth was more modest, with GDP measured in constant1993/94 prices rising from P18.2 billion in 2002/03 to P19.2 billion in2003/04, a real increase of 5.7 percent. Apart from a sharp dip in2001/02, real GDP growth has been reasonably robust in Botswana,averaging 5.7 percent per annum since 1993/94.
However, most of that growth has been due to the strong performancesof the Mining and Government sectors, which grew at an averagerate of 5.7 percent per annum and 6.2 percent per annum, respectively,over the decade to 2003/04. There are signs that the economy hasbeen slowing down, decreasing from an average annual rate of growthof 6.5 percent for the period from 1993/94 to 1998/99 to just 4.6percent for the period from 1998/99 to 2003/04 with the growth ofother sectors, excluding Mining and Government. Within those twoepisodes, strong growth was recorded in the first period by theManufacturing (9.0% p.a.), Water and Electricity (6.8% p.a.), Trade,Hotels and Restaurants (11.2% p.a.), Transport and Communications(7.3% p.a.) and Finance, Real Estate and Business Services (7.4% p.a.)sectors.
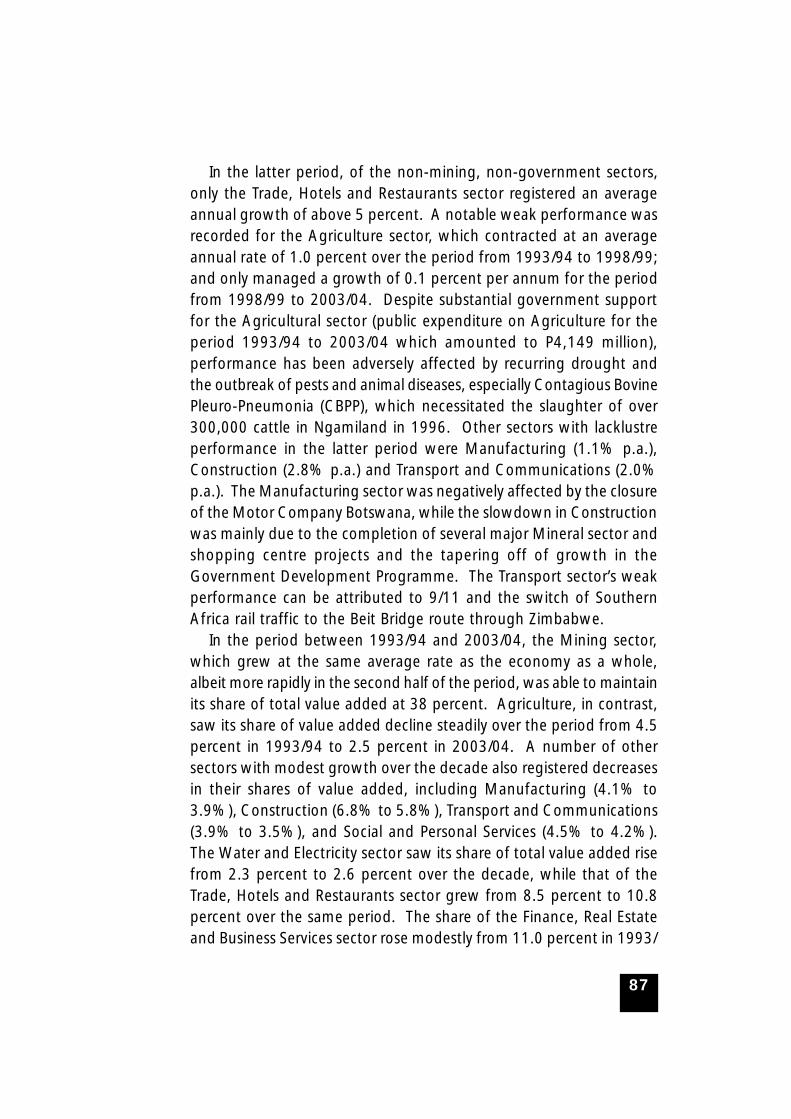
87
In the latter period, of the non-mining, non-government sectors,only the Trade, Hotels and Restaurants sector registered an averageannual growth of above 5 percent. A notable weak performance wasrecorded for the Agriculture sector, which contracted at an averageannual rate of 1.0 percent over the period from 1993/94 to 1998/99;and only managed a growth of 0.1 percent per annum for the periodfrom 1998/99 to 2003/04. Despite substantial government supportfor the Agricultural sector (public expenditure on Agriculture for theperiod 1993/94 to 2003/04 which amounted to P4,149 million),performance has been adversely affected by recurring drought andthe outbreak of pests and animal diseases, especially Contagious BovinePleuro-Pneumonia (CBPP), which necessitated the slaughter of over300,000 cattle in Ngamiland in 1996. Other sectors with lacklustreperformance in the latter period were Manufacturing (1.1% p.a.),Construction (2.8% p.a.) and Transport and Communications (2.0%p.a.). The Manufacturing sector was negatively affected by the closureof the Motor Company Botswana, while the slowdown in Constructionwas mainly due to the completion of several major Mineral sector andshopping centre projects and the tapering off of growth in theGovernment Development Programme. The Transport sector’s weakperformance can be attributed to 9/11 and the switch of SouthernAfrica rail traffic to the Beit Bridge route through Zimbabwe.
In the period between 1993/94 and 2003/04, the Mining sector,which grew at the same average rate as the economy as a whole,albeit more rapidly in the second half of the period, was able to maintainits share of total value added at 38 percent. Agriculture, in contrast,saw its share of value added decline steadily over the period from 4.5percent in 1993/94 to 2.5 percent in 2003/04. A number of othersectors with modest growth over the decade also registered decreasesin their shares of value added, including Manufacturing (4.1% to3.9%), Construction (6.8% to 5.8%), Transport and Communications(3.9% to 3.5%), and Social and Personal Services (4.5% to 4.2%).The Water and Electricity sector saw its share of total value added risefrom 2.3 percent to 2.6 percent over the decade, while that of theTrade, Hotels and Restaurants sector grew from 8.5 percent to 10.8percent over the same period. The share of the Finance, Real Estateand Business Services sector rose modestly from 11.0 percent in 1993/
88
94 to 11.4 percent in 2003/04, while that of General Governmentincreased from 16.4 percent to 17.1 percent over the same period.
The changes in sectoral shares also reflected the contribution thatindividual sectors made to total GDP growth over the period, with theMining sector’s growth accounting for 38.3 percent of the total growthin value added; and the Government sector accounting for another18.2 percent of that growth. The Trade, Hotels and Restaurants sector’sperformance contributed 14.0 percent of the total growth in valueadded; and the Finance, Real Estate and Business Services sectoraccounted for a further 12.1 percent. The growth in those four sectorsexplained nearly 83 percent of the growth in value added, dwarfingthe contributions made by the other sectors over the decade.
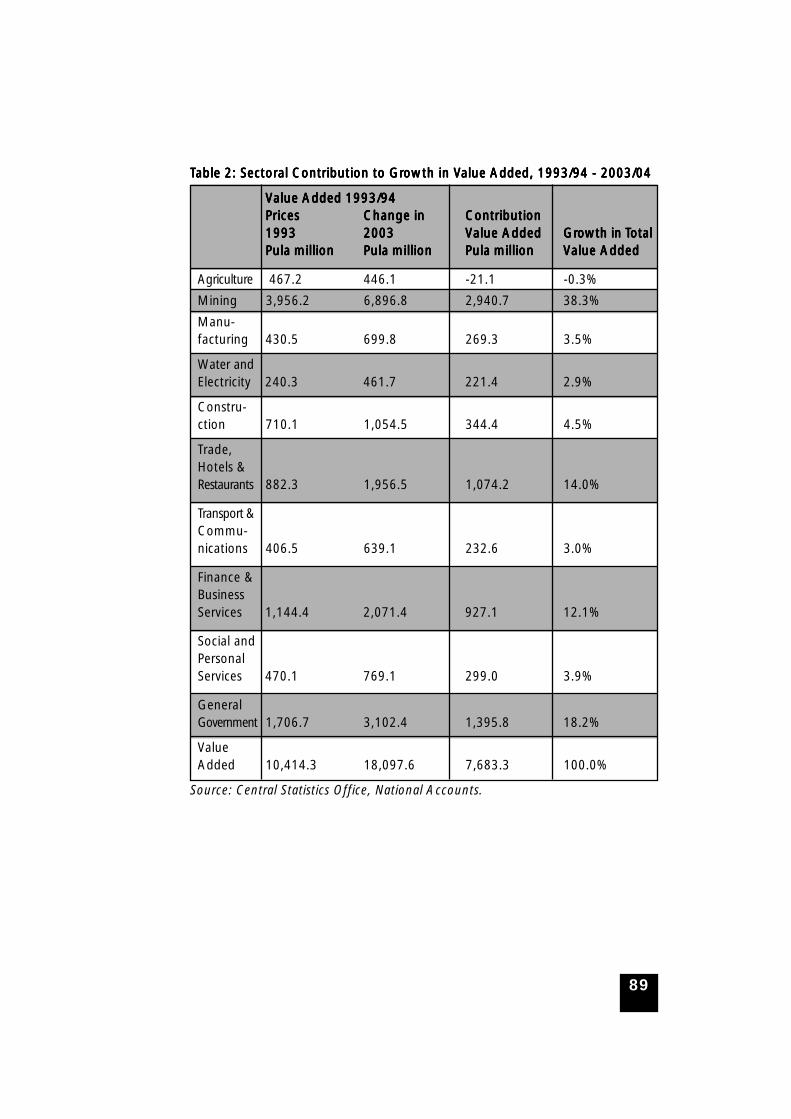
89
TTTTTable 2: Sectoral Contribution to Grable 2: Sectoral Contribution to Grable 2: Sectoral Contribution to Grable 2: Sectoral Contribution to Grable 2: Sectoral Contribution to Growth in Vowth in Vowth in Vowth in Vowth in Value Added, 1993/94 - 2003/04alue Added, 1993/94 - 2003/04alue Added, 1993/94 - 2003/04alue Added, 1993/94 - 2003/04alue Added, 1993/94 - 2003/04
VVVVValue Added 1993/94alue Added 1993/94alue Added 1993/94alue Added 1993/94alue Added 1993/94PricesPricesPricesPricesPrices Change inChange inChange inChange inChange in ContributionContributionContributionContributionContribution19931993199319931993 20032003200320032003 VVVVValue Addedalue Addedalue Addedalue Addedalue Added GrGrGrGrGrowth in Towth in Towth in Towth in Towth in TotalotalotalotalotalPula millionPula millionPula millionPula millionPula million Pula millionPula millionPula millionPula millionPula million Pula millionPula millionPula millionPula millionPula million VVVVValue Addedalue Addedalue Addedalue Addedalue Added
Agriculture 467.2 446.1 -21.1 -0.3%
Mining 3,956.2 6,896.8 2,940.7 38.3%
Manu-facturing 430.5 699.8 269.3 3.5%
Water andElectricity 240.3 461.7 221.4 2.9%
Constru-ction 710.1 1,054.5 344.4 4.5%
Trade,Hotels &Restaurants 882.3 1,956.5 1,074.2 14.0%
Transport &Commu-nications 406.5 639.1 232.6 3.0%
Finance &BusinessServices 1,144.4 2,071.4 927.1 12.1%
Social andPersonalServices 470.1 769.1 299.0 3.9%
GeneralGovernment 1,706.7 3,102.4 1,395.8 18.2%
ValueAdded 10,414.3 18,097.6 7,683.3 100.0%
Source: Central Statistics Office, National Accounts.
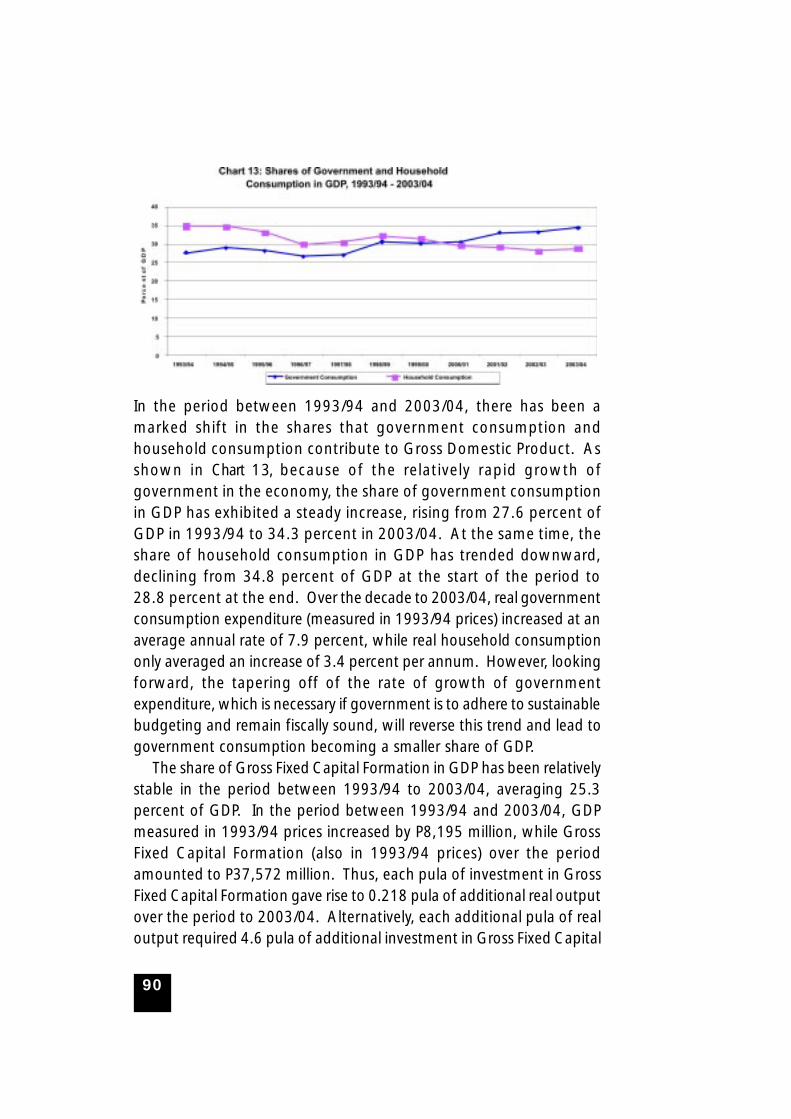
90
In the period between 1993/94 and 2003/04, there has been amarked shift in the shares that government consumption andhousehold consumption contribute to Gross Domestic Product. Asshown in Chart 13, because of the relatively rapid growth ofgovernment in the economy, the share of government consumptionin GDP has exhibited a steady increase, rising from 27.6 percent ofGDP in 1993/94 to 34.3 percent in 2003/04. At the same time, theshare of household consumption in GDP has trended downward,declining from 34.8 percent of GDP at the start of the period to28.8 percent at the end. Over the decade to 2003/04, real governmentconsumption expenditure (measured in 1993/94 prices) increased at anaverage annual rate of 7.9 percent, while real household consumptiononly averaged an increase of 3.4 percent per annum. However, lookingforward, the tapering off of the rate of growth of governmentexpenditure, which is necessary if government is to adhere to sustainablebudgeting and remain fiscally sound, will reverse this trend and lead togovernment consumption becoming a smaller share of GDP.
The share of Gross Fixed Capital Formation in GDP has been relativelystable in the period between 1993/94 to 2003/04, averaging 25.3percent of GDP. In the period between 1993/94 and 2003/04, GDPmeasured in 1993/94 prices increased by P8,195 million, while GrossFixed Capital Formation (also in 1993/94 prices) over the periodamounted to P37,572 million. Thus, each pula of investment in GrossFixed Capital Formation gave rise to 0.218 pula of additional real outputover the period to 2003/04. Alternatively, each additional pula of realoutput required 4.6 pula of additional investment in Gross Fixed Capital
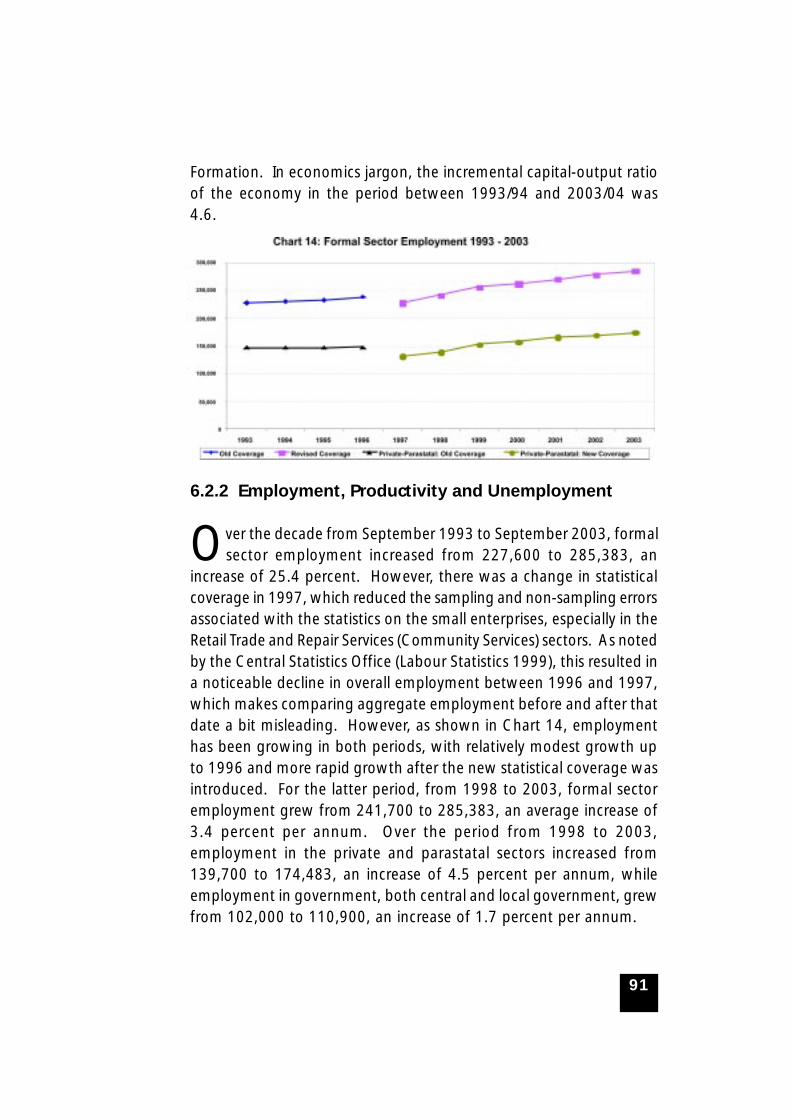
91
Formation. In economics jargon, the incremental capital-output ratioof the economy in the period between 1993/94 and 2003/04 was4.6.
6.2.2 Employment, Productivity and Unemployment
Over the decade from September 1993 to September 2003, formalsector employment increased from 227,600 to 285,383, an
increase of 25.4 percent. However, there was a change in statisticalcoverage in 1997, which reduced the sampling and non-sampling errorsassociated with the statistics on the small enterprises, especially in theRetail Trade and Repair Services (Community Services) sectors. As notedby the Central Statistics Office (Labour Statistics 1999), this resulted ina noticeable decline in overall employment between 1996 and 1997,which makes comparing aggregate employment before and after thatdate a bit misleading. However, as shown in Chart 14, employmenthas been growing in both periods, with relatively modest growth upto 1996 and more rapid growth after the new statistical coverage wasintroduced. For the latter period, from 1998 to 2003, formal sectoremployment grew from 241,700 to 285,383, an average increase of3.4 percent per annum. Over the period from 1998 to 2003,employment in the private and parastatal sectors increased from139,700 to 174,483, an increase of 4.5 percent per annum, whileemployment in government, both central and local government, grewfrom 102,000 to 110,900, an increase of 1.7 percent per annum.

92
With data on value added and employment by sector, it is possible toprovide some estimates of labour productivity for the period between1998 and 2003. Improvement in labour productivity is key toBotswana’s strategies for international competitiveness, economicdiversification, poverty reduction and raising standards of living.Improvements in labour productivity can be brought about by increasesin the capital employed per worker (e.g., automation), improvementsin workers’ skills and their application, improvement in managementand improvements in the institutional and regulatory frameworks underwhich private sector enterprises operate. Table 3 presents the estimatesof value added per employee, excluding Agriculture, which iscomplicated by the large proportion of the workforce that is notcaptured in the statistics on formal sector employment. A substantialincrease in labour productivity was recorded in the mining sector, whereemployment contracted 1.5 percent over the period from 1998 to2003, while real output expanded by 40.5 percent. As a consequence,value added per employee in the mining sector grew from P533,545in 1998 to P865,567 in 2003, an increase of 62.2 percent. Suchproductivity improvements can be attributed mainly to the substantialcapital investments made by Debswana in the Fully Integrated SortingHouse (FISH) and the Completely Automated Recovery Plant (CARP),the adoption of Continuous Operations at the mines, and the continuedupgrading of the skills of the workers and managers.
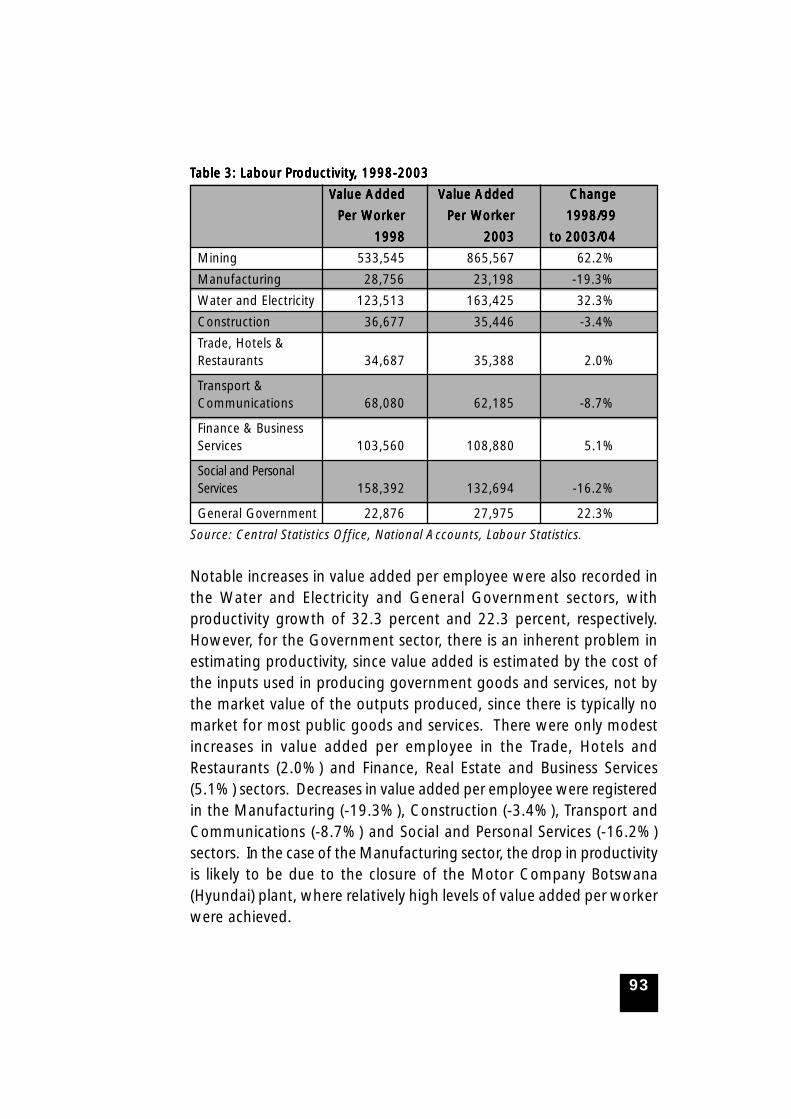
93
TTTTTable 3: Labour Prable 3: Labour Prable 3: Labour Prable 3: Labour Prable 3: Labour Productivityoductivityoductivityoductivityoductivity, 1998-2003, 1998-2003, 1998-2003, 1998-2003, 1998-2003
V V V V Value Addedalue Addedalue Addedalue Addedalue Added VVVVValue Addedalue Addedalue Addedalue Addedalue Added ChangeChangeChangeChangeChange
Per W Per W Per W Per W Per Workerorkerorkerorkerorker Per WPer WPer WPer WPer Workerorkerorkerorkerorker 1998/991998/991998/991998/991998/99
19981998199819981998 20032003200320032003 to 2003/04to 2003/04to 2003/04to 2003/04to 2003/04
Mining 533,545 865,567 62.2%
Manufacturing 28,756 23,198 -19.3%
Water and Electricity 123,513 163,425 32.3%
Construction 36,677 35,446 -3.4%
Trade, Hotels &Restaurants 34,687 35,388 2.0%
Transport &Communications 68,080 62,185 -8.7%
Finance & BusinessServices 103,560 108,880 5.1%
Social and PersonalServices 158,392 132,694 -16.2%
General Government 22,876 27,975 22.3%
Source: Central Statistics Office, National Accounts, Labour Statistics.
Notable increases in value added per employee were also recorded inthe Water and Electricity and General Government sectors, withproductivity growth of 32.3 percent and 22.3 percent, respectively.However, for the Government sector, there is an inherent problem inestimating productivity, since value added is estimated by the cost ofthe inputs used in producing government goods and services, not bythe market value of the outputs produced, since there is typically nomarket for most public goods and services. There were only modestincreases in value added per employee in the Trade, Hotels andRestaurants (2.0%) and Finance, Real Estate and Business Services(5.1%) sectors. Decreases in value added per employee were registeredin the Manufacturing (-19.3%), Construction (-3.4%), Transport andCommunications (-8.7%) and Social and Personal Services (-16.2%)sectors. In the case of the Manufacturing sector, the drop in productivityis likely to be due to the closure of the Motor Company Botswana(Hyundai) plant, where relatively high levels of value added per workerwere achieved.
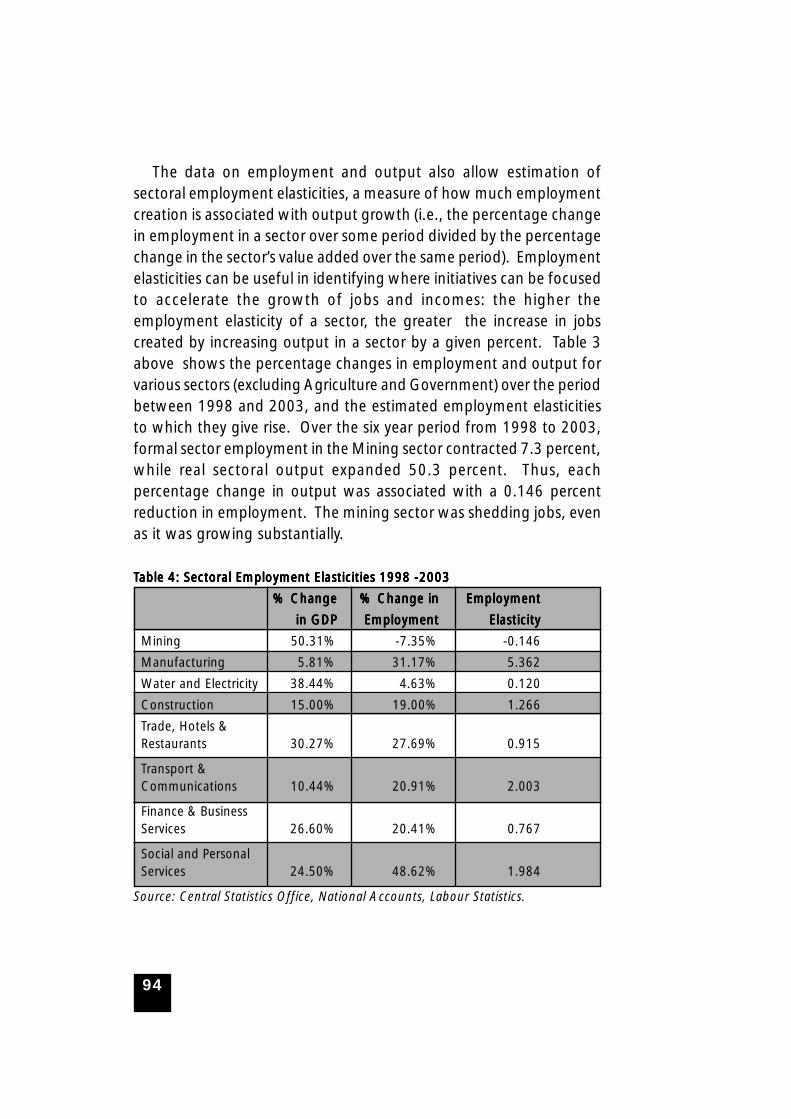
94
The data on employment and output also allow estimation ofsectoral employment elasticities, a measure of how much employmentcreation is associated with output growth (i.e., the percentage changein employment in a sector over some period divided by the percentagechange in the sector’s value added over the same period). Employmentelasticities can be useful in identifying where initiatives can be focusedto accelerate the growth of jobs and incomes: the higher theemployment elasticity of a sector, the greater the increase in jobscreated by increasing output in a sector by a given percent. Table 3above shows the percentage changes in employment and output forvarious sectors (excluding Agriculture and Government) over the periodbetween 1998 and 2003, and the estimated employment elasticitiesto which they give rise. Over the six year period from 1998 to 2003,formal sector employment in the Mining sector contracted 7.3 percent,while real sectoral output expanded 50.3 percent. Thus, eachpercentage change in output was associated with a 0.146 percentreduction in employment. The mining sector was shedding jobs, evenas it was growing substantially.
TTTTTable 4: Sectoral Employment Elasticities 1998 -2003able 4: Sectoral Employment Elasticities 1998 -2003able 4: Sectoral Employment Elasticities 1998 -2003able 4: Sectoral Employment Elasticities 1998 -2003able 4: Sectoral Employment Elasticities 1998 -2003
% Change% Change% Change% Change% Change % Change in% Change in% Change in% Change in% Change in EmploymentEmploymentEmploymentEmploymentEmployment
in GDPin GDPin GDPin GDPin GDP EmploymentEmploymentEmploymentEmploymentEmployment ElasticityElasticityElasticityElasticityElasticity
Mining 50.31% -7.35% -0.146
Manufacturing 5.81% 31.17% 5.362
Water and Electricity 38.44% 4.63% 0.120
Construction 15.00% 19.00% 1.266
Trade, Hotels &Restaurants 30.27% 27.69% 0.915
Transport &Communications 10.44% 20.91% 2.003
Finance & BusinessServices 26.60% 20.41% 0.767
Social and PersonalServices 24.50% 48.62% 1.984
Source: Central Statistics Office, National Accounts, Labour Statistics.
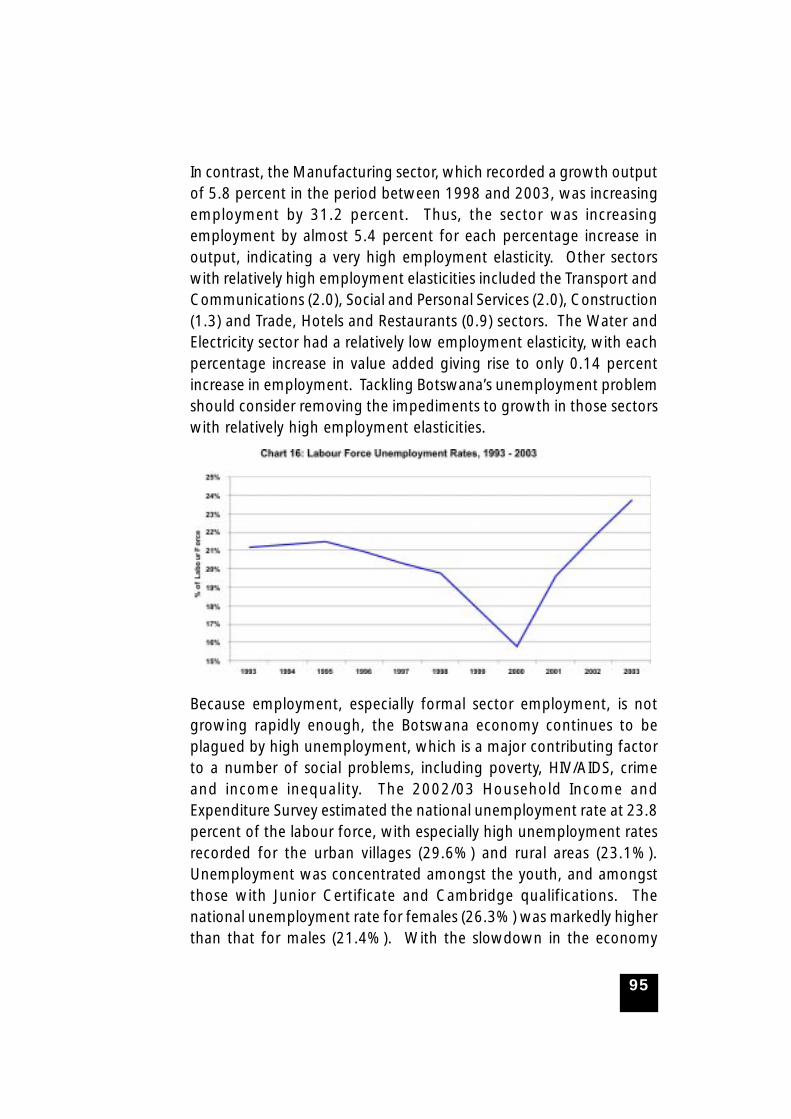
95
In contrast, the Manufacturing sector, which recorded a growth outputof 5.8 percent in the period between 1998 and 2003, was increasingemployment by 31.2 percent. Thus, the sector was increasingemployment by almost 5.4 percent for each percentage increase inoutput, indicating a very high employment elasticity. Other sectorswith relatively high employment elasticities included the Transport andCommunications (2.0), Social and Personal Services (2.0), Construction(1.3) and Trade, Hotels and Restaurants (0.9) sectors. The Water andElectricity sector had a relatively low employment elasticity, with eachpercentage increase in value added giving rise to only 0.14 percentincrease in employment. Tackling Botswana’s unemployment problemshould consider removing the impediments to growth in those sectorswith relatively high employment elasticities.
Because employment, especially formal sector employment, is notgrowing rapidly enough, the Botswana economy continues to beplagued by high unemployment, which is a major contributing factorto a number of social problems, including poverty, HIV/AIDS, crimeand income inequality. The 2002/03 Household Income andExpenditure Survey estimated the national unemployment rate at 23.8percent of the labour force, with especially high unemployment ratesrecorded for the urban villages (29.6%) and rural areas (23.1%).Unemployment was concentrated amongst the youth, and amongstthose with Junior Certificate and Cambridge qualifications. Thenational unemployment rate for females (26.3%) was markedly higherthan that for males (21.4%). With the slowdown in the economy
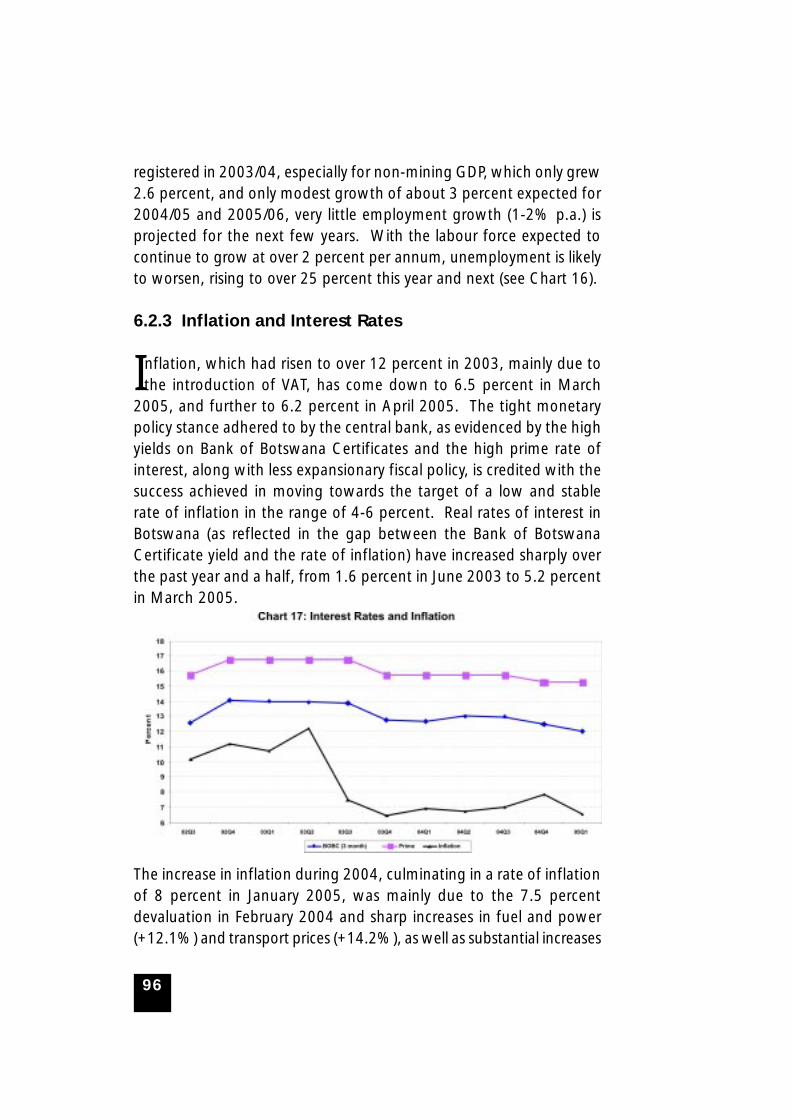
96
registered in 2003/04, especially for non-mining GDP, which only grew2.6 percent, and only modest growth of about 3 percent expected for2004/05 and 2005/06, very little employment growth (1-2% p.a.) isprojected for the next few years. With the labour force expected tocontinue to grow at over 2 percent per annum, unemployment is likelyto worsen, rising to over 25 percent this year and next (see Chart 16).
6.2.3 Inflation and Interest Rates
Inflation, which had risen to over 12 percent in 2003, mainly due tothe introduction of VAT, has come down to 6.5 percent in March
2005, and further to 6.2 percent in April 2005. The tight monetarypolicy stance adhered to by the central bank, as evidenced by the highyields on Bank of Botswana Certificates and the high prime rate ofinterest, along with less expansionary fiscal policy, is credited with thesuccess achieved in moving towards the target of a low and stablerate of inflation in the range of 4-6 percent. Real rates of interest inBotswana (as reflected in the gap between the Bank of BotswanaCertificate yield and the rate of inflation) have increased sharply overthe past year and a half, from 1.6 percent in June 2003 to 5.2 percentin March 2005.
The increase in inflation during 2004, culminating in a rate of inflationof 8 percent in January 2005, was mainly due to the 7.5 percentdevaluation in February 2004 and sharp increases in fuel and power(+12.1%) and transport prices (+14.2%), as well as substantial increases
97
in a number of non-tradeable good prices (e.g., water andtelecommunications). Of the 7.8 percent national rate of inflationrecorded in the year to December 2004, increases in housing costsaccounted for 16.9 percent, increases in transport accounted for 34.8percent and increases in fuel and power accounted for 3.9 percent.
The Bank of Botswana announced a reduction in the Bank Rate onApril 25th 2005 by one quarter percentage point (25 basis points) to14 percent, reflecting the generally positive outlook it perceived forlower inflation. This expectation was based relatively benigninternational inflationary pressures and the lower rates of growth ofcommercial bank credit and government expenditure that have beenrecorded recently. However, the Bank of Botswana cautioned the publicthat it would continue to monitor financial and inflationarydevelopments with a view to taking whatever actions may be necessaryto meet its monetary policy objective of maintaining inflation at a lowand stable level.
6.2.4 Exchange Rates and Trade
The exchange rate of the pula against the South African rand camedown sharply in the early part of 2004, decreasing from R1.488 in
December 2003 to R1.379 in February 2004 as a result of the 7.5percent devaluation. But since then, the rand-pula exchange rate hasexhibited more stability than it did during 2003, hovering in the rangeof R1.39 to R1.32 per pula. The pula depreciated by 4.3 percentagainst the euro and the British pound during 2004. But, against theUS dollar, the pula, which appreciated sharply during 2002 and 2003by 27.7 percent and 23.1 percent, respectively, recorded a small gainof 3.8 percent in 2004; in part because of the 7.5 devaluation inFebruary 2004. The pula’s gains against the US dollar reflected thecontinuing weakness of the greenback. During the course of the yearto the end of December 2004, the US dollar depreciated by 7.8 percentagainst the euro and the British pound, and by 14.3 percent againstthe South African rand.

98
Despite the Pula’s depreciation against the South African rand, theeuro and the British pound as a result of the 7.5 percent devaluation,and the fast rising of prices in Botswana its major trading partners,the real effective exchange rate only depreciated by 3.8 percent during2004. Compared to a benchmark period of 1996, the real effectiveexchange rate had appreciated by nearly 21 percent at the end of2004, making it very difficult for Botswana exporters to compete inforeign markets and for domestic producers to compete with importedgoods and services. The devaluation of the currency by 12% in May2005 was meant to promote the competitiveness of producers.
On the trade front, Botswana has continued to register a healthybalance of trade through 2004, mainly due to the growth of diamondexports, which increased 12.0 percent from P11.7 billion in 2003 to

99
P13.1 billion in 2004. Other exports recorded a lacklustre performance,declining from P3,266 million in 2003 to P3,161 million in 2004, adecrease of 3.2 percent.
Imports of goods grew sharply from P10.5 billion in 2003 to P13.3billion in 2004, an increase of 26.6 percent. Nevertheless, the countryregistered a merchandise surplus of P2,939 million and an overallcurrent account surplus of P3,985 million. While the merchandisesurplus in 2004 was smaller than the P4,477 million surplus recordedin 2003, the current account surplus was larger than the P2,288 millionsurplus achieved in 2003. Despite capital outflows that totalled P3,609million in 2004, Botswana’s international reserves increased from P23.7billion (USD5.3b) in 2003 to P24.2 billion (USD5.7b) in 2004. Thesereserves continue to provide the country with a very healthy level ofimport cover, although it is clear the level was on a declining trend.
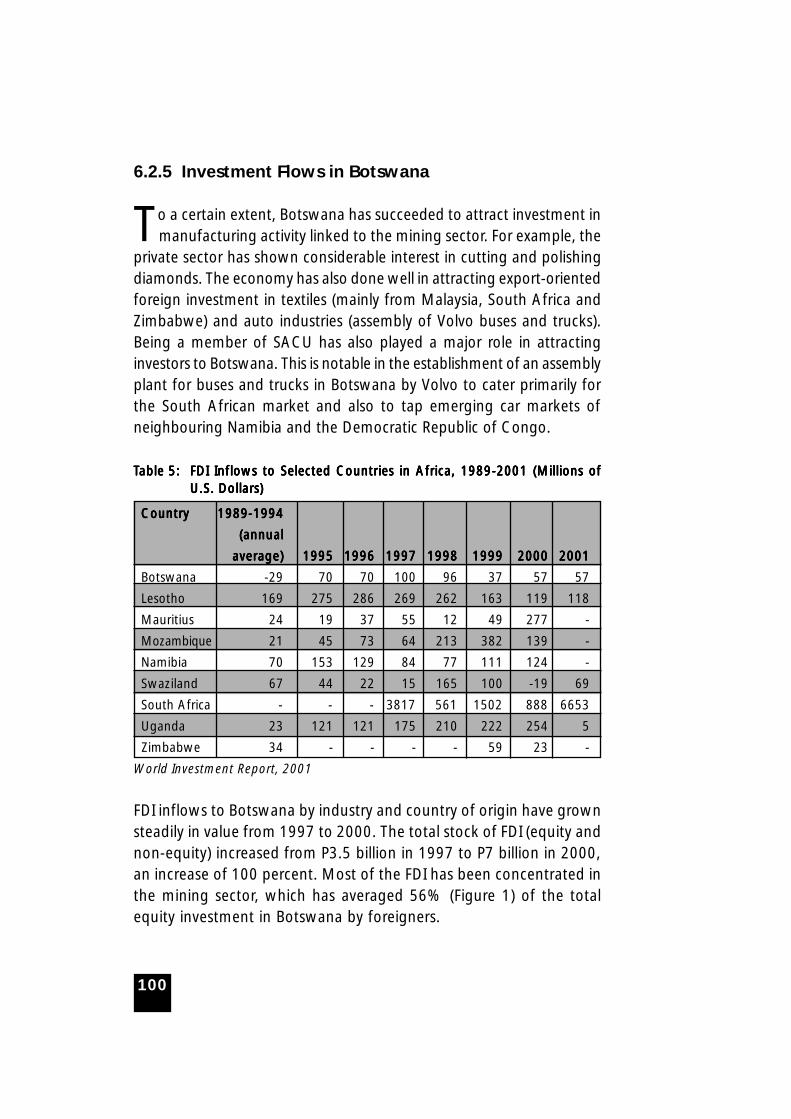
100
6.2.5 Investment Flows in Botswana
To a certain extent, Botswana has succeeded to attract investment inmanufacturing activity linked to the mining sector. For example, the
private sector has shown considerable interest in cutting and polishingdiamonds. The economy has also done well in attracting export-orientedforeign investment in textiles (mainly from Malaysia, South Africa andZimbabwe) and auto industries (assembly of Volvo buses and trucks).Being a member of SACU has also played a major role in attractinginvestors to Botswana. This is notable in the establishment of an assemblyplant for buses and trucks in Botswana by Volvo to cater primarily forthe South African market and also to tap emerging car markets ofneighbouring Namibia and the Democratic Republic of Congo.
TTTTTable 5:able 5:able 5:able 5:able 5: FDI Inflows to Selected Countries in Africa, 1989-2001 (Millions ofFDI Inflows to Selected Countries in Africa, 1989-2001 (Millions ofFDI Inflows to Selected Countries in Africa, 1989-2001 (Millions ofFDI Inflows to Selected Countries in Africa, 1989-2001 (Millions ofFDI Inflows to Selected Countries in Africa, 1989-2001 (Millions ofU.S. Dollars)U.S. Dollars)U.S. Dollars)U.S. Dollars)U.S. Dollars)
CountryCountryCountryCountryCountry 1989-19941989-19941989-19941989-19941989-1994
(annual(annual(annual(annual(annual
average)average)average)average)average) 19951995199519951995 19961996199619961996 19971997199719971997 19981998199819981998 19991999199919991999 20002000200020002000 20012001200120012001
Botswana -29 70 70 100 96 37 57 57
Lesotho 169 275 286 269 262 163 119 118
Mauritius 24 19 37 55 12 49 277 -
Mozambique 21 45 73 64 213 382 139 -
Namibia 70 153 129 84 77 111 124 -
Swaziland 67 44 22 15 165 100 -19 69
South Africa - - - 3817 561 1502 888 6653
Uganda 23 121 121 175 210 222 254 5
Zimbabwe 34 - - - - 59 23 -
World Investment Report, 2001
FDI inflows to Botswana by industry and country of origin have grownsteadily in value from 1997 to 2000. The total stock of FDI (equity andnon-equity) increased from P3.5 billion in 1997 to P7 billion in 2000,an increase of 100 percent. Most of the FDI has been concentrated inthe mining sector, which has averaged 56% (Figure 1) of the totalequity investment in Botswana by foreigners.
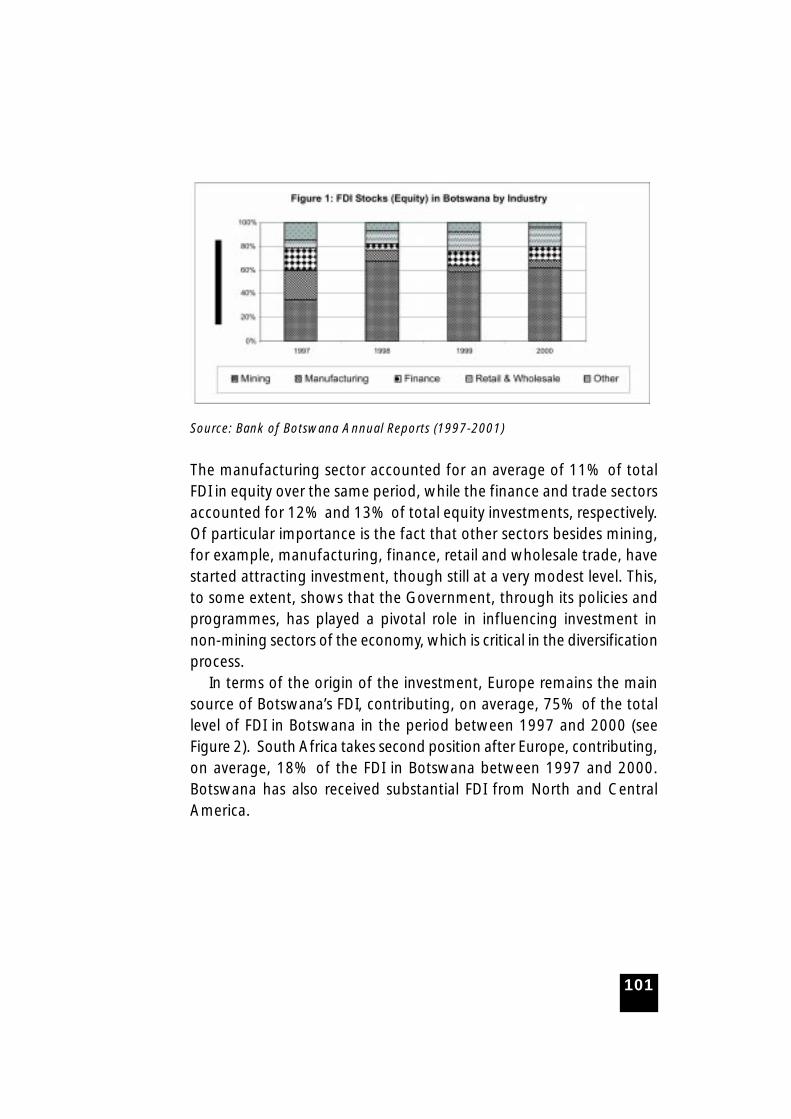
101
Source: Bank of Botswana Annual Reports (1997-2001)
The manufacturing sector accounted for an average of 11% of totalFDI in equity over the same period, while the finance and trade sectorsaccounted for 12% and 13% of total equity investments, respectively.Of particular importance is the fact that other sectors besides mining,for example, manufacturing, finance, retail and wholesale trade, havestarted attracting investment, though still at a very modest level. This,to some extent, shows that the Government, through its policies andprogrammes, has played a pivotal role in influencing investment innon-mining sectors of the economy, which is critical in the diversificationprocess.
In terms of the origin of the investment, Europe remains the mainsource of Botswana’s FDI, contributing, on average, 75% of the totallevel of FDI in Botswana in the period between 1997 and 2000 (seeFigure 2). South Africa takes second position after Europe, contributing,on average, 18% of the FDI in Botswana between 1997 and 2000.Botswana has also received substantial FDI from North and CentralAmerica.
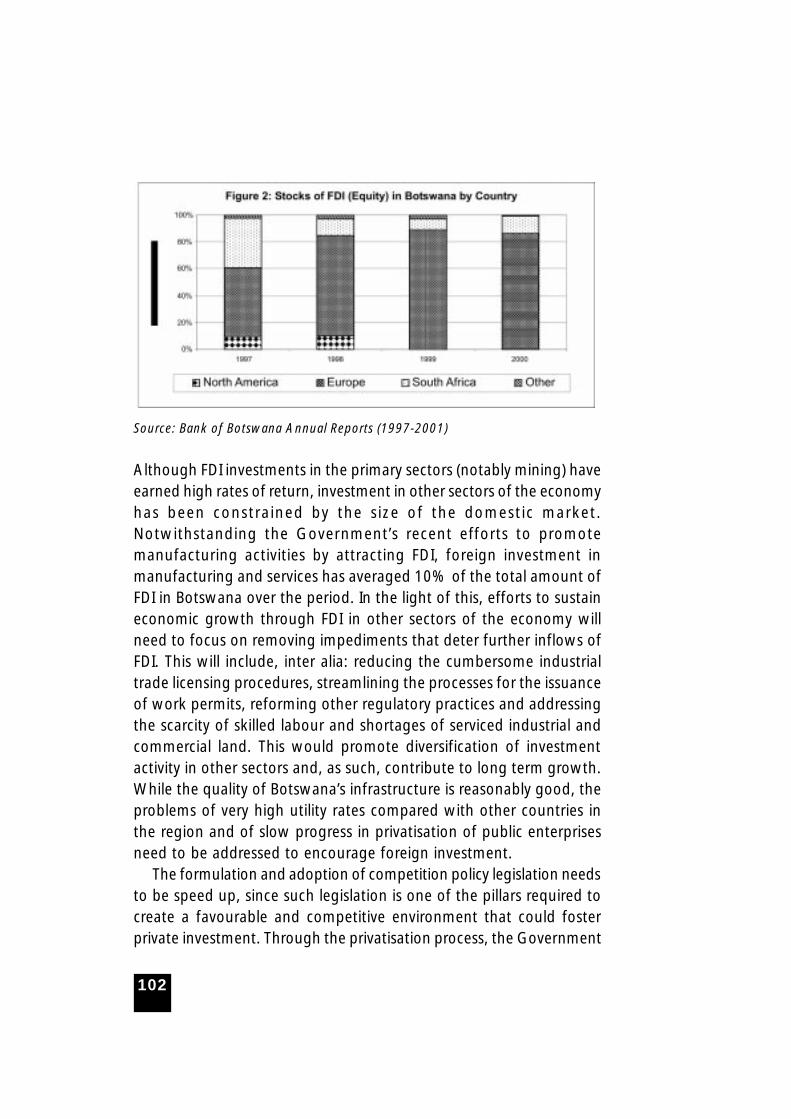
102
Source: Bank of Botswana Annual Reports (1997-2001)
Although FDI investments in the primary sectors (notably mining) haveearned high rates of return, investment in other sectors of the economyhas been constrained by the size of the domestic market.Notwithstanding the Government’s recent efforts to promotemanufacturing activities by attracting FDI, foreign investment inmanufacturing and services has averaged 10% of the total amount ofFDI in Botswana over the period. In the light of this, efforts to sustaineconomic growth through FDI in other sectors of the economy willneed to focus on removing impediments that deter further inflows ofFDI. This will include, inter alia: reducing the cumbersome industrialtrade licensing procedures, streamlining the processes for the issuanceof work permits, reforming other regulatory practices and addressingthe scarcity of skilled labour and shortages of serviced industrial andcommercial land. This would promote diversification of investmentactivity in other sectors and, as such, contribute to long term growth.While the quality of Botswana’s infrastructure is reasonably good, theproblems of very high utility rates compared with other countries inthe region and of slow progress in privatisation of public enterprisesneed to be addressed to encourage foreign investment.
The formulation and adoption of competition policy legislation needsto be speed up, since such legislation is one of the pillars required tocreate a favourable and competitive environment that could fosterprivate investment. Through the privatisation process, the Government
103
should also aim to reduce its direct involvement in a number of businessactivities. This would stimulate market activity and provide scope forlocal entrepreneurship and private sector initiatives in the investmentprocess.
The Government should also continue to improve its promotionalefforts. Collaboration with other countries could play a major role, bothin mounting collective promotional initiatives and in establishing sub-regional markets that are more attractive to potential investors.Government should also exploit opportunities available under various tradeagreements and programmes offered by developed countries; e.g., theCotonou Agreement with the EU to promote trade and investment inAfrican countries and the USA’s African Growth and Opportunity Act.
6.2.6 Basic Approaches used in Determining BudgetaryFrameworks
Through the national development planning processes, governmentbudgets are set taking into account the expected resources
(revenues, grants and loans) available to Government, the existingcommitments for Government expenditures, the priorities establishedover the allocation of the resources available, the recurrent budgetimplications of development expenditures and the sustainability of theexpenditure frameworks, given the reliance on mineral revenues, whichcome from the exploitation and sale of a non-replenishable asset.
“Meeting the Millennium Development Goals and Vision 2016through a Self-Reliant Approach to Development” was the theme forthe 2005 Budget Speech. The call for greater self-reliance reflectedthe growing awareness that not only were the Government’s existingand prospective resources already stretched to the limit, but also thatthe dependency syndrome that had evolved over the past decade orso was becoming increasingly unsustainable. While the public sectorstill has major roles to play in the economy, Government signalled thatmembers of the society must take greater individual responsibility fortheir economic and social development. The Budget Speech themealso stressed that while Botswana was committed to achieving thegoals of the Millennium Declaration and its own Vision 2016, it wasalso committed to pursuing sound and sustainable financial
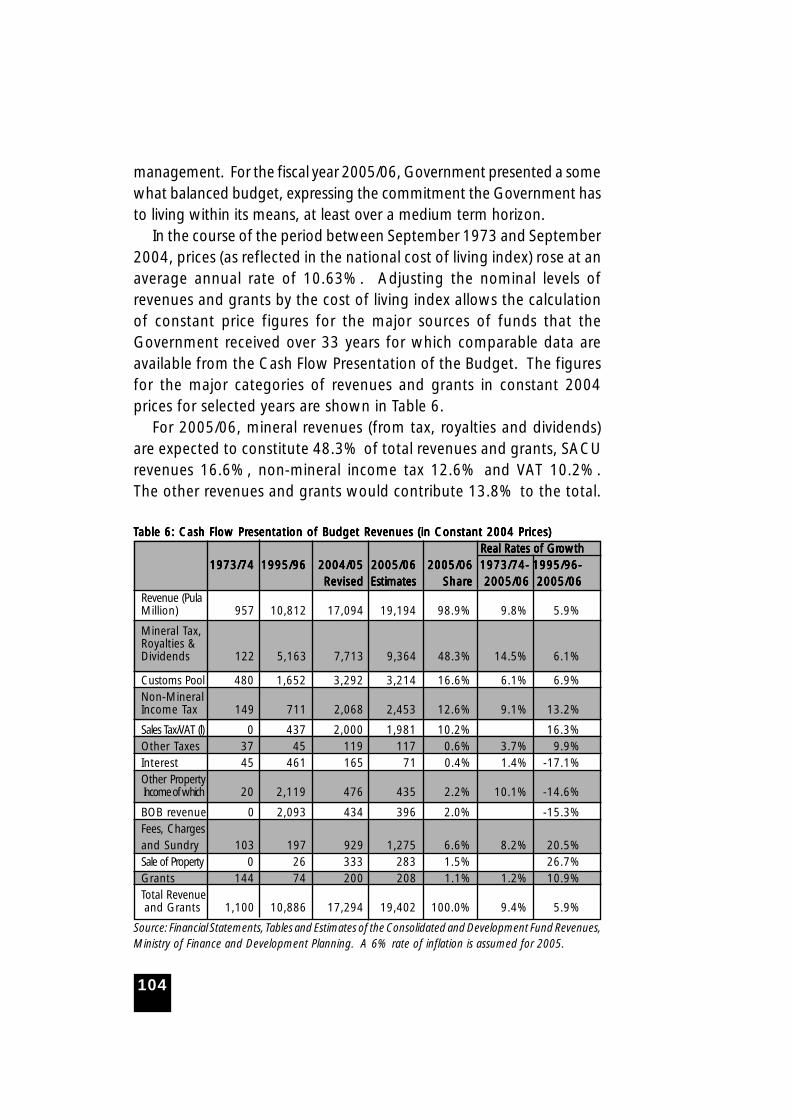
104
management. For the fiscal year 2005/06, Government presented a somewhat balanced budget, expressing the commitment the Government hasto living within its means, at least over a medium term horizon.
In the course of the period between September 1973 and September2004, prices (as reflected in the national cost of living index) rose at anaverage annual rate of 10.63%. Adjusting the nominal levels ofrevenues and grants by the cost of living index allows the calculationof constant price figures for the major sources of funds that theGovernment received over 33 years for which comparable data areavailable from the Cash Flow Presentation of the Budget. The figuresfor the major categories of revenues and grants in constant 2004prices for selected years are shown in Table 6.
For 2005/06, mineral revenues (from tax, royalties and dividends)are expected to constitute 48.3% of total revenues and grants, SACUrevenues 16.6%, non-mineral income tax 12.6% and VAT 10.2%.The other revenues and grants would contribute 13.8% to the total.
TTTTTable 6: Cash Flow Prable 6: Cash Flow Prable 6: Cash Flow Prable 6: Cash Flow Prable 6: Cash Flow Presentation of Budget Revenues (in Constant 2004 Prices)esentation of Budget Revenues (in Constant 2004 Prices)esentation of Budget Revenues (in Constant 2004 Prices)esentation of Budget Revenues (in Constant 2004 Prices)esentation of Budget Revenues (in Constant 2004 Prices) Real Rates of GrReal Rates of GrReal Rates of GrReal Rates of GrReal Rates of Growthowthowthowthowth
1973/741973/741973/741973/741973/74 1995/961995/961995/961995/961995/96 2004/052004/052004/052004/052004/05 2005/062005/062005/062005/062005/06 2005/062005/062005/062005/062005/06 1973/74-1973/74-1973/74-1973/74-1973/74- 1995/96-1995/96-1995/96-1995/96-1995/96-RevisedRevisedRevisedRevisedRevised EstimatesEstimatesEstimatesEstimatesEstimates SharSharSharSharShareeeee 2005/062005/062005/062005/062005/06 2005/062005/062005/062005/062005/06
Revenue (PulaMillion) 957 10,812 17,094 19,194 98.9% 9.8% 5.9%
Mineral Tax,Royalties &Dividends 122 5,163 7,713 9,364 48.3% 14.5% 6.1%
Customs Pool 480 1,652 3,292 3,214 16.6% 6.1% 6.9%Non-MineralIncome Tax 149 711 2,068 2,453 12.6% 9.1% 13.2%
Sales Tax/VAT (l) 0 437 2,000 1,981 10.2% 16.3%Other Taxes 37 45 119 117 0.6% 3.7% 9.9%Interest 45 461 165 71 0.4% 1.4% -17.1%Other Property Income of which 20 2,119 476 435 2.2% 10.1% -14.6%
BOB revenue 0 2,093 434 396 2.0% -15.3%Fees, Chargesand Sundry 103 197 929 1,275 6.6% 8.2% 20.5%Sale of Property 0 26 333 283 1.5% 26.7%Grants 144 74 200 208 1.1% 1.2% 10.9%Total Revenue
and Grants 1,100 10,886 17,294 19,402 100.0% 9.4% 5.9%
Source: Financial Statements, Tables and Estimates of the Consolidated and Development Fund Revenues,Ministry of Finance and Development Planning. A 6% rate of inflation is assumed for 2005.

105
From 1973/74 to 2005/06, total revenues and grants, in real terms,grew at an average annual rate of 9.8%. However, real growth hasslowed over the past decade to 5.9% p.a. In the period from 1973 to2005, real mineral revenues increased twenty fold, averaging an annualincrease of 14.5%. However, over the past decade from 1995/95 to2005/06, growth has slowed to 6.1% p.a. Indeed, excluding the 2005/06 estimate, which may have been boosted by the negotiations forthe new mining leases, the real rate of growth of mineral revenuesfrom 1990/91 to 2004/05 has been a modest 0.4%.1 With only modestincreases in diamond production expected over the next decade, afterwhich operations will need to go underground, resulting in lessproduction and higher costs, future real revenue increases from thediamond sector are likely to be quite modest. Other mineral sectorrevenues to Government, however optimistic one might be, will besmall compared to the diamond revenues.
SACU revenues have maintained a strong real growth of over 6%p.a. from 1973/74 up to 2005/06; although the growth in real termsfrom 2004/05 to 2005/06 is expected to be negative. With tradeliberalisation between SACU and other regional groups (e.g., EU,Mercosur, SADC, USA, etc.), as well as WTO agreed tariff reductions,this revenue source should not be expected to contribute much, ifanything, to increased Government revenues in the years ahead. Witheconomic diversification and improved upstream and downstreamlinkages in the economy, SACU revenues should grow less rapidly thanNon-Mining GDP. Non-mineral income tax has registered strong realgrowth, both over the longer period from 1973 (9.1% p.a.), as well asfrom 1995/96 to 2005/06 (13.2% p.a.; although as noted above, thefigure for 2005/06 may be somewhat over-optimistic). However, non-mineral income tax should not be expected to grow much faster thanNon-Mining GDP, since the most highly profitable business ventures havealready established themselves here, yielding the highest sources ofcompany income tax. Other investments that might be undertaken inBotswana, while profitable, are likely to be less profitable than thosethat have already occurred; and thus, they are likely to yield lower taxesper unit of GDP than the already established enterprises. In economicsjargon, the newer investments are likely to be moving down the marginalefficiency of investment curve, yielding lower taxable incomes.1 In constant 2004 prices, real mineral revenues in 1990/91 amounted to P7,280 million. By
2004/05, they had grown to P7,713 million, an average increase of 0.41% p.a.
106
VAT, which took over from the Sales Tax, has grown rapidly (16.3% p.a.) inreal terms over the past decade. But, in future, such growth should be morein line with the real growth of the economy, now estimated at about 4%-5% p.a. Other property income, mainly revenues from the Bank of Botswana,peaked in real terms in 1996, and have decreased substantially (-15.3% p.a.)since then. Future revenues from the Bank of Botswana, mainly based onthe earnings on the Government Investment Account, will continue to bemodest. Fees, charges and sundry revenues have grown about 8.2% p.a. inreal terms since 1973, and more rapidly at 20.5% p.a. since 1995, reflectingsuccess in improving cost-recovery measures. As emphasised by theHonourable Minister of finance, this is an area where Government hopes tomake substantial progress in the coming years. There has also been substantialreal growth in revenues from the sale of Government property, averaging26.7% p.a. in the period between 1995/96 and 2005/06. However, thebudget for 2005/06 estimates a real decrease in such revenues.
6.2.7 Recurrent and Development Expenditures and NetLending2
The 2005/06 Budget provides for Expenditures and Net Lending toincrease from an expected P18.7 billion in 2004/05 to P20.5 billion
in 2005/06, an increase of 9.3%. Recurrent expenditures are estimatedto increase by 7.5%, from P14.6 billion to P15.7 billion, whileDevelopment expenditures are forecast to grow by 12.3%, from P4.3billion to P4.9 billion. Net lending is estimated to continue to be negative,as repayment of PDSF/RSF loans is forecast at P124 million; and no newPDSF loans are expected. Recurrent expenditures are expected toconstitute 77% of total Expenditure and Net Lending; and of that,Personal Emoluments are forecast to comprise 27%, Other Charges tobe 49%, and Public Debt Interest to be 2%. Development Expenditureis estimated to amount to 24% of total Expenditure and Net Lending,while the Net Lending will subtract about 1% from the total.
The breakdown of the budget into the expenditure components ofthe Recurrent Budget, Development Budget, PDSF/RSF Loans,2 The Recurrent Budget covers the continuing administration and service costs of government.
Specific projects (e.g., capital expenditure) are financed from the Development Budget, whichgenerally covers any addition to the stock of government assets. Net Lending refers to loans(less repayments) made by Government to parastatals and local authorities, mainly from thePublic Debt Service Fund, but also from the Revenue Stabilisation Fund and, in the case oflocal authorities, the Development Fund.
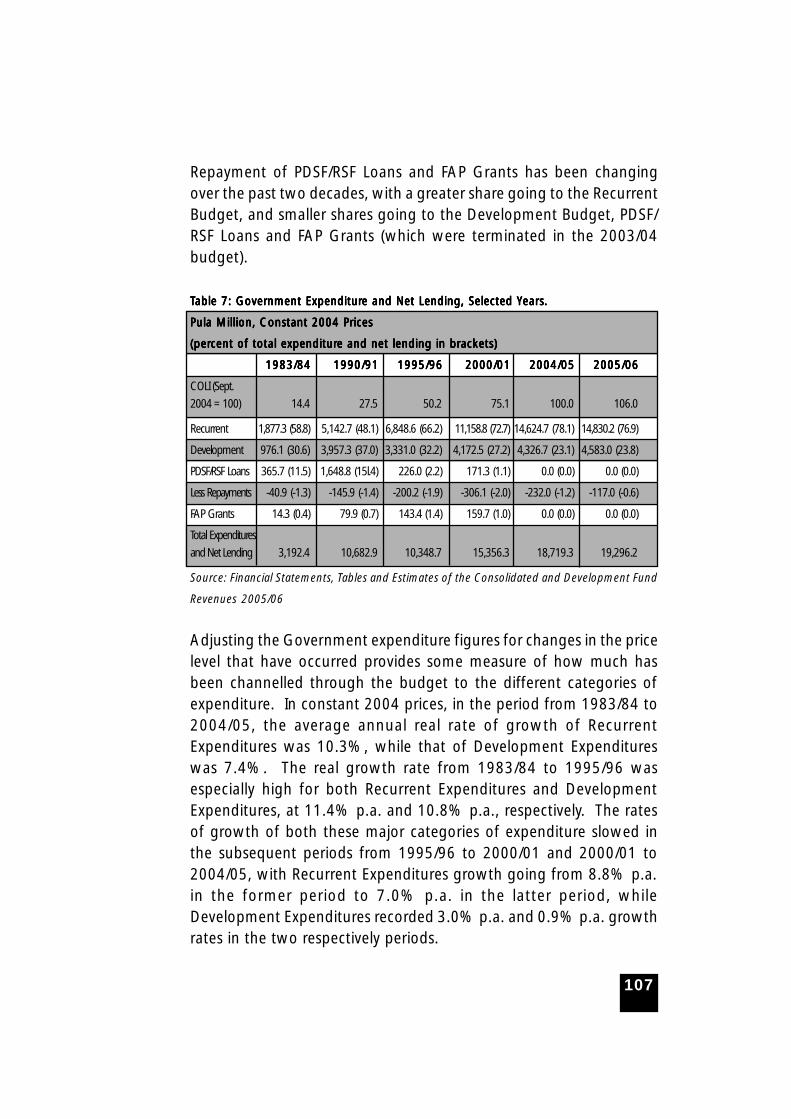
107
Repayment of PDSF/RSF Loans and FAP Grants has been changingover the past two decades, with a greater share going to the RecurrentBudget, and smaller shares going to the Development Budget, PDSF/RSF Loans and FAP Grants (which were terminated in the 2003/04budget).
TTTTTable 7: Goverable 7: Goverable 7: Goverable 7: Goverable 7: Government Expenditurnment Expenditurnment Expenditurnment Expenditurnment Expenditure and Net Lending, Selected Ye and Net Lending, Selected Ye and Net Lending, Selected Ye and Net Lending, Selected Ye and Net Lending, Selected Years.ears.ears.ears.ears.
Pula Million, Constant 2004 PricesPula Million, Constant 2004 PricesPula Million, Constant 2004 PricesPula Million, Constant 2004 PricesPula Million, Constant 2004 Prices
(per(per(per(per(percent of total expenditurcent of total expenditurcent of total expenditurcent of total expenditurcent of total expenditure and net lending in brackets)e and net lending in brackets)e and net lending in brackets)e and net lending in brackets)e and net lending in brackets)
1983/84 1983/84 1983/84 1983/84 1983/84 1990/911990/911990/911990/911990/91 1995/961995/961995/961995/961995/96 2000/012000/012000/012000/012000/01 2004/052004/052004/052004/052004/05 2005/062005/062005/062005/062005/06
COLI (Sept.
2004 = 100) 14.4 27.5 50.2 75.1 100.0 106.0
Recurrent 1,877.3 (58.8) 5,142.7 (48.1) 6,848.6 (66.2) 11,158.8 (72.7) 14,624.7 (78.1) 14,830.2 (76.9)
Development 976.1 (30.6) 3,957.3 (37.0) 3,331.0 (32.2) 4,172.5 (27.2) 4,326.7 (23.1) 4,583.0 (23.8)
PDSF/RSF Loans 365.7 (11.5) 1,648.8 (15l.4) 226.0 (2.2) 171.3 (1.1) 0.0 (0.0) 0.0 (0.0)
Less Repayments -40.9 (-1.3) -145.9 (-1.4) -200.2 (-1.9) -306.1 (-2.0) -232.0 (-1.2) -117.0 (-0.6)
FAP Grants 14.3 (0.4) 79.9 (0.7) 143.4 (1.4) 159.7 (1.0) 0.0 (0.0) 0.0 (0.0)
Total Expenditures
and Net Lending 3,192.4 10,682.9 10,348.7 15,356.3 18,719.3 19,296.2
Source: Financial Statements, Tables and Estimates of the Consolidated and Development Fund
Revenues 2005/06
Adjusting the Government expenditure figures for changes in the pricelevel that have occurred provides some measure of how much hasbeen channelled through the budget to the different categories ofexpenditure. In constant 2004 prices, in the period from 1983/84 to2004/05, the average annual real rate of growth of RecurrentExpenditures was 10.3%, while that of Development Expenditureswas 7.4%. The real growth rate from 1983/84 to 1995/96 wasespecially high for both Recurrent Expenditures and DevelopmentExpenditures, at 11.4% p.a. and 10.8% p.a., respectively. The ratesof growth of both these major categories of expenditure slowed inthe subsequent periods from 1995/96 to 2000/01 and 2000/01 to2004/05, with Recurrent Expenditures growth going from 8.8% p.a.in the former period to 7.0% p.a. in the latter period, whileDevelopment Expenditures recorded 3.0% p.a. and 0.9% p.a. growthrates in the two respectively periods.
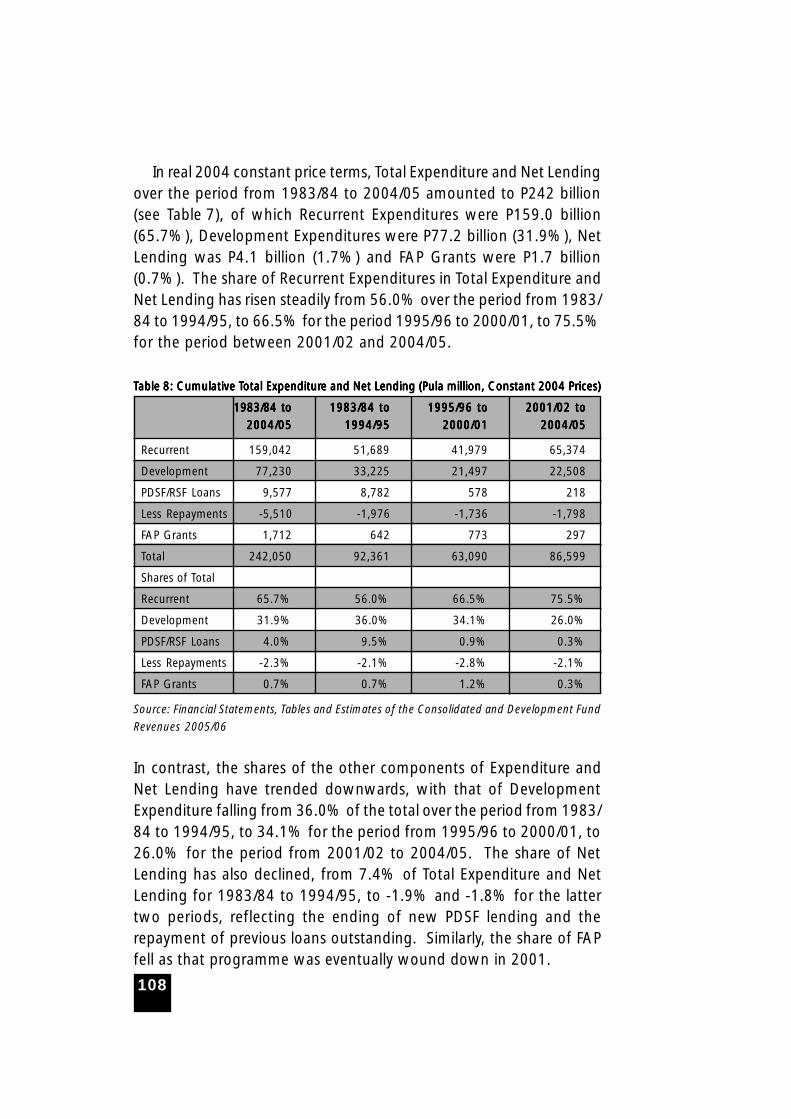
108
In real 2004 constant price terms, Total Expenditure and Net Lendingover the period from 1983/84 to 2004/05 amounted to P242 billion(see Table 7), of which Recurrent Expenditures were P159.0 billion(65.7%), Development Expenditures were P77.2 billion (31.9%), NetLending was P4.1 billion (1.7%) and FAP Grants were P1.7 billion(0.7%). The share of Recurrent Expenditures in Total Expenditure andNet Lending has risen steadily from 56.0% over the period from 1983/84 to 1994/95, to 66.5% for the period 1995/96 to 2000/01, to 75.5%for the period between 2001/02 and 2004/05.
TTTTTable able able able able 88888: Cumulative T: Cumulative T: Cumulative T: Cumulative T: Cumulative Total Expenditurotal Expenditurotal Expenditurotal Expenditurotal Expenditure and Net Lending (Pula million, Constant 2004 Prices)e and Net Lending (Pula million, Constant 2004 Prices)e and Net Lending (Pula million, Constant 2004 Prices)e and Net Lending (Pula million, Constant 2004 Prices)e and Net Lending (Pula million, Constant 2004 Prices)
1983/84 to 1983/84 to 1983/84 to 1983/84 to 1983/84 to 1983/84 to1983/84 to1983/84 to1983/84 to1983/84 to 1995/96 to1995/96 to1995/96 to1995/96 to1995/96 to 2001/02 to2001/02 to2001/02 to2001/02 to2001/02 to
2004/052004/052004/052004/052004/05 1994/951994/951994/951994/951994/95 2000/012000/012000/012000/012000/01 2004/052004/052004/052004/052004/05
Recurrent 159,042 51,689 41,979 65,374
Development 77,230 33,225 21,497 22,508
PDSF/RSF Loans 9,577 8,782 578 218
Less Repayments -5,510 -1,976 -1,736 -1,798
FAP Grants 1,712 642 773 297
Total 242,050 92,361 63,090 86,599
Shares of Total
Recurrent 65.7% 56.0% 66.5% 75.5%
Development 31.9% 36.0% 34.1% 26.0%
PDSF/RSF Loans 4.0% 9.5% 0.9% 0.3%
Less Repayments -2.3% -2.1% -2.8% -2.1%
FAP Grants 0.7% 0.7% 1.2% 0.3%
Source: Financial Statements, Tables and Estimates of the Consolidated and Development Fund
Revenues 2005/06
In contrast, the shares of the other components of Expenditure andNet Lending have trended downwards, with that of DevelopmentExpenditure falling from 36.0% of the total over the period from 1983/84 to 1994/95, to 34.1% for the period from 1995/96 to 2000/01, to26.0% for the period from 2001/02 to 2004/05. The share of NetLending has also declined, from 7.4% of Total Expenditure and NetLending for 1983/84 to 1994/95, to -1.9% and -1.8% for the lattertwo periods, reflecting the ending of new PDSF lending and therepayment of previous loans outstanding. Similarly, the share of FAPfell as that programme was eventually wound down in 2001.
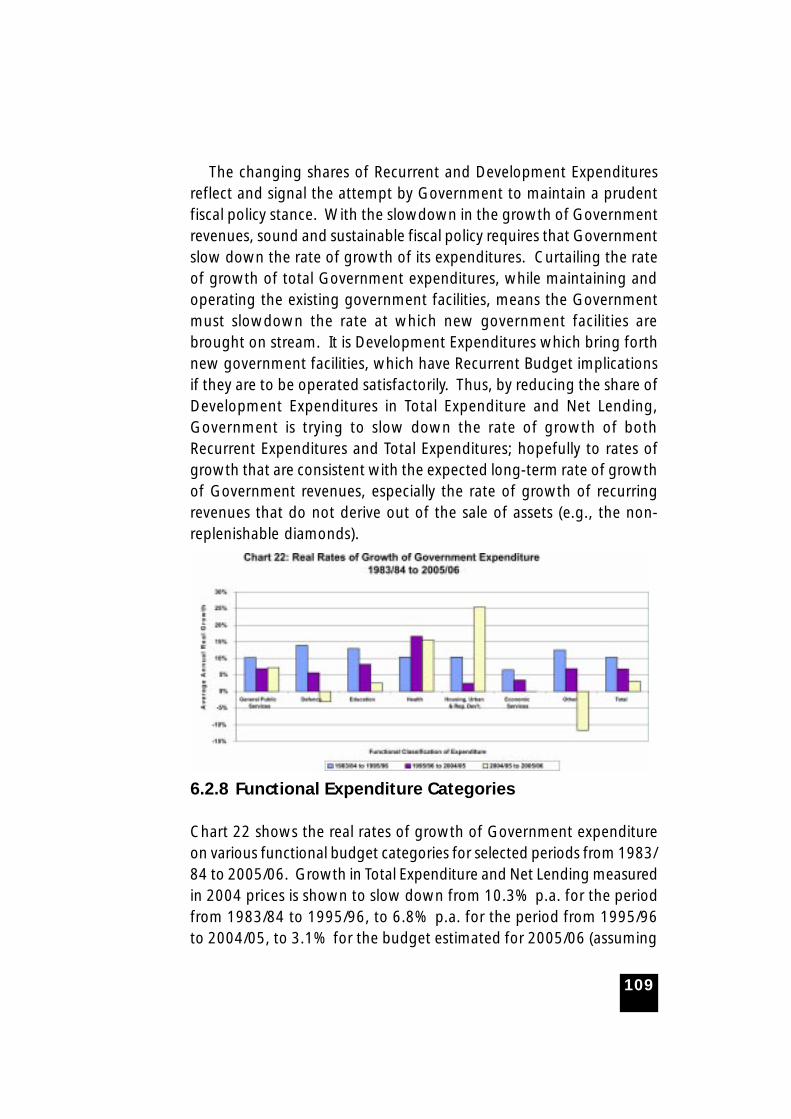
109
The changing shares of Recurrent and Development Expendituresreflect and signal the attempt by Government to maintain a prudentfiscal policy stance. With the slowdown in the growth of Governmentrevenues, sound and sustainable fiscal policy requires that Governmentslow down the rate of growth of its expenditures. Curtailing the rateof growth of total Government expenditures, while maintaining andoperating the existing government facilities, means the Governmentmust slowdown the rate at which new government facilities arebrought on stream. It is Development Expenditures which bring forthnew government facilities, which have Recurrent Budget implicationsif they are to be operated satisfactorily. Thus, by reducing the share ofDevelopment Expenditures in Total Expenditure and Net Lending,Government is trying to slow down the rate of growth of bothRecurrent Expenditures and Total Expenditures; hopefully to rates ofgrowth that are consistent with the expected long-term rate of growthof Government revenues, especially the rate of growth of recurringrevenues that do not derive out of the sale of assets (e.g., the non-replenishable diamonds).
6.2.8 Functional Expenditure Categories
Chart 22 shows the real rates of growth of Government expenditureon various functional budget categories for selected periods from 1983/84 to 2005/06. Growth in Total Expenditure and Net Lending measuredin 2004 prices is shown to slow down from 10.3% p.a. for the periodfrom 1983/84 to 1995/96, to 6.8% p.a. for the period from 1995/96to 2004/05, to 3.1% for the budget estimated for 2005/06 (assuming
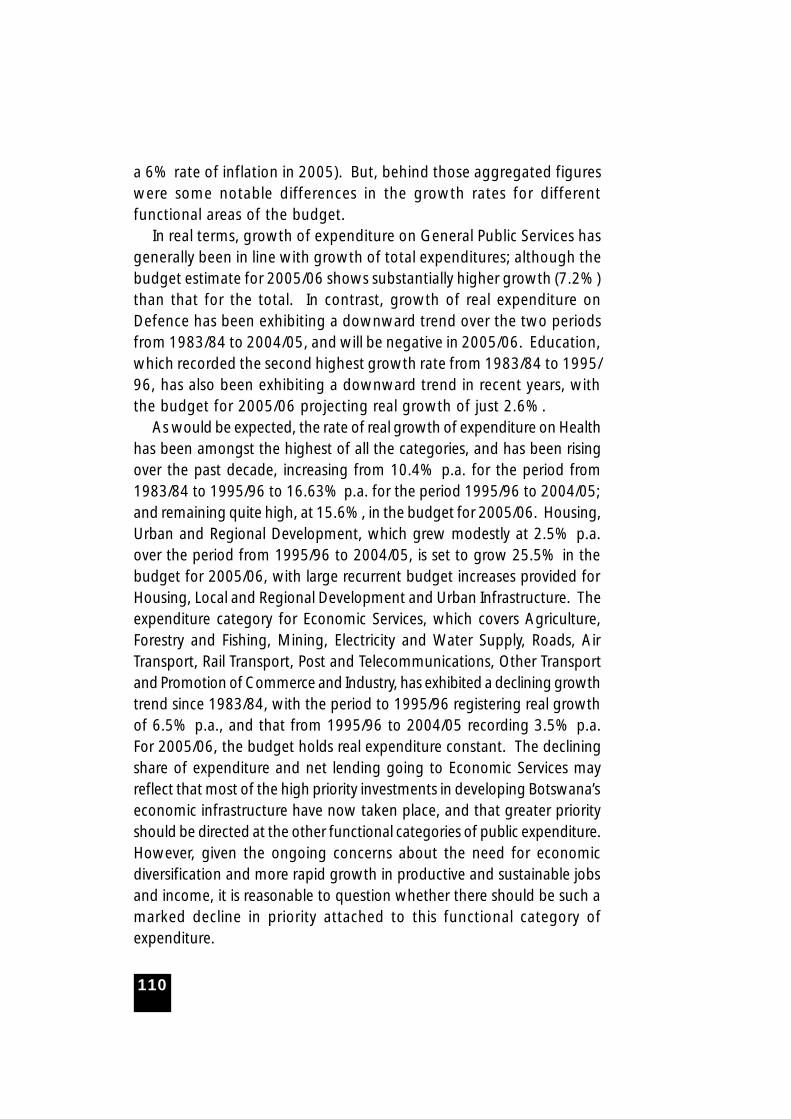
110
a 6% rate of inflation in 2005). But, behind those aggregated figureswere some notable differences in the growth rates for differentfunctional areas of the budget.
In real terms, growth of expenditure on General Public Services hasgenerally been in line with growth of total expenditures; although thebudget estimate for 2005/06 shows substantially higher growth (7.2%)than that for the total. In contrast, growth of real expenditure onDefence has been exhibiting a downward trend over the two periodsfrom 1983/84 to 2004/05, and will be negative in 2005/06. Education,which recorded the second highest growth rate from 1983/84 to 1995/96, has also been exhibiting a downward trend in recent years, withthe budget for 2005/06 projecting real growth of just 2.6%.
As would be expected, the rate of real growth of expenditure on Healthhas been amongst the highest of all the categories, and has been risingover the past decade, increasing from 10.4% p.a. for the period from1983/84 to 1995/96 to 16.63% p.a. for the period 1995/96 to 2004/05;and remaining quite high, at 15.6%, in the budget for 2005/06. Housing,Urban and Regional Development, which grew modestly at 2.5% p.a.over the period from 1995/96 to 2004/05, is set to grow 25.5% in thebudget for 2005/06, with large recurrent budget increases provided forHousing, Local and Regional Development and Urban Infrastructure. Theexpenditure category for Economic Services, which covers Agriculture,Forestry and Fishing, Mining, Electricity and Water Supply, Roads, AirTransport, Rail Transport, Post and Telecommunications, Other Transportand Promotion of Commerce and Industry, has exhibited a declining growthtrend since 1983/84, with the period to 1995/96 registering real growthof 6.5% p.a., and that from 1995/96 to 2004/05 recording 3.5% p.a.For 2005/06, the budget holds real expenditure constant. The decliningshare of expenditure and net lending going to Economic Services mayreflect that most of the high priority investments in developing Botswana’seconomic infrastructure have now taken place, and that greater priorityshould be directed at the other functional categories of public expenditure.However, given the ongoing concerns about the need for economicdiversification and more rapid growth in productive and sustainable jobsand income, it is reasonable to question whether there should be such amarked decline in priority attached to this functional category ofexpenditure.
111
The Other functional category of expenditure, comprising budget itemssuch as Food and Social Welfare Programmes, Other Community & SocialServices and Unallocated Expenditure (e.g., Public Debt Interest, RevenueSupport Grants to local authorities and FAP Grants), have also shownslower real rates of growth over the past two decades, with real growthdecreasing from 12.6% p.a. over the period from 1983/84 to 1995/96 to6.9% p.a. from 1995/96 to 2004/05. The budget for 2005/06 estimatesa further real decrease in this category of expenditure of 11.7%.
The changing budget shares over the past two decades give someindications of the changes in priorities that have occurred asGovernment has responded to new challenges, e.g., HIV/AIDS, andadopted new initiatives (or terminated old ones as in the case of PDSFlending and FAP grants). General Public Services3 , measured in 2004constant prices, have recorded a growing share of Total Expenditureand Net Lending, rising from 17.1% for the period 1983/84 to 1994/95, to 19.2% for the period 1995/96 to 2004/05, and 19.7% in thebudget for 2005/06. The share of Defence in total expenditure hasdeclined from 9.7% over the period 1983/84 to 1994/95, to 8.7%from 1995/96 to 2004/05, and further to 7.6% in the 2005/06 budget.Education, on the other hand, has been a big winner in the budgetallocations, with its share of total real expenditures rising from 17.3%for the period 1983/84 to 1994/95, to 24.2% for the period 1995/96to 2004/05, and to 25.0% in the budget for 2005/06.3 This covers expenditure on the Legislature, Foreign Affairs, Financial Administration,
Government Construction, Services and Buildings, Government Transport Services,
Immigration, Courts and Legal Administration, Police, Prisons, etc.
112
The fight against HIV/AIDS and other diseases is reflected in whathappened to the share of Health budget allocations. Health’s sharehas grown rapidly, from 4.6% for the period from 1983/84 to 1994/95, to 6.8% for the period from 1995/96 to 2004/05. The 2005/06budget allocates 12.2% of Total Expenditure and Net Lending to Health.The share of the budget going to Housing, Urban and RegionalDevelopment decreased from 10.7% for the period 1983/84 to 1994/95 to 6.0% over the period from 1995/96 to 2004/05. It is expectedto increase slightly to 6.6% in the new budget year. Because of themodest increases in real expenditure by Government on EconomicServices, that category of expenditure has recorded the largest dropsin budget shares, falling from 28.1% of Total Expenditure and NetLending for the period 1983/84 to 1994/95, to 19.1% for the period1995/96 to 2004/05, and to 16.1% for the 2005/06 fiscal year. Theshare of total expenditure going to the Other functional categoryrecorded an increase to 16.1% during the period from 1995/96 to2004/05, compared to 12.5% for the period from 1983/84 to 1994/95. However, the budget for 2005/06 sees that share dropping backto 12.9%.
6.2.9 Other Policy Issues
There are a number of critical issues that need to be addressed ifBotswana is to be successful in achieving the Millennium
Development Goals and Vision 2016 through a Self-Reliant Approachto Development. Some of these issues directly impact upon theGovernment budget, and its ability to fund development projects andthe provision of public goods and services. Others have their mainimpacts on the private sector and its ability to supply the goods andservices needed to raise the standards of living of Batswana profitablyon a sustained basis. For both the public and private sectors, raisingthe real productivity of Batswana workers, managers and entrepreneursremains the crucial challenge if the real standard of living and qualityof life of Batswana is to continue to rise. Without real productivityincreases, any increases in consumption that Batswana get to enjoy inthe short term cannot be sustained in the longer term. Withoutproductivity improvements, short term gains for some Batswana can
113
only come at the expense of the welfare of other Batswana, either inthe present or in the future. It is for that reason that Governmentmust always press for efficiency, for value for money, for cost-effectiveness and for living within its means, lest it ends up reducingthe welfare of Batswana in the aggregate.
From the Government side, given the limited resources, greatercost-recovery on the basis of ability to pay becomes an increasinglyimportant issue, not only because it helps to put the public financeson a sounder footing, but also because it is efficient and socially just.Botswana has been keen on avoiding the debt trap, something manyother developing countries, especially in Africa, fell into. Governmentpolicy is that Botswana should only borrow for projects that can yielda high enough return to first be able to service the debt and thenprovide some net benefits that can be enjoyed by Batswana in thefuture.
One of the major reasons that Botswana’s economy is slowing down,and thus jeopardising attainment of the Millennium Development Goalsand Vision 2016, is that the investment occurring in Botswana is notas productive as it should be. Low productivity investments, investmentswith low or negative real return rates, result in small or even negativeincreases in real incomes for Batswana. The slowing down of theeconomy is a clear indication that high productivity projects are notbeing identified and invested in.
6.2.10 Monetary and Exchange Rate Policies and Trends
Botswana’s monetary policy is anchored by having the Pula exchangerate pegged to a basket of currencies comprising the South Africarand and the IMF’s unit of account, the SDR (which is comprised of theUS dollar, the euro, the British pound and the Japanese yen). As clearlyarticulated in the central bank’s annual monetary policy statement,the country’s monetary policy aims to support the national objectivesof economic diversification and export competitiveness by attemptingto keep the real effective exchange rate of the Pula broadly stable at acompetitive level. This is to be achieved with a pegged nominalexchange rate by having inflation in Botswana no greater than theaverage inflation rate of its trading partners.
114
The 7.5 percent devaluation of the pula in February partly offsetthe real effective exchange rate appreciation that had been registeredover the period from 2000, as prices in Botswana rose faster thanprices in trading partner countries. The 12 percent devaluation effectedin May 2005 is believed by the authorities to have returned the realeffective exchange rate to a level consistent with the fundamentals ofthe economy. Along with the devaluation, the authorities introduceda crawling peg exchange rate mechanism to ensure that the realeffective exchange rate does not get out of line with the economy’sfundamental in the future. The authorities now feel that issues ofcompetitiveness must focus on broader issues affecting Botswana’sprospects for economic diversification, including the need to maintaina prudent fiscal policy and to press ahead with pending structuralreforms.
As part of its monetary policy framework, the central bank sets aninflation target range that is mainly based on the average inflationrate in trading-partner countries. It was the role played by higherdomestic inflation than the average inflation in trading partnercountries that generated a real effective appreciation of the Pula overthe last several years. This suggests that the central bank may need toadopt and achieve a more ambitious inflation target in order to sustainthe policy of having a pegged nominal exchange rate, while improvingthe competitiveness of local producers, especially of non-traditionalexports.
The monetary policy authorities have followed a cautious approachin reducing interest rates as inflation subsided, because of theuncertainty about the fiscal situation. The central bank feels that thefeasibility of reducing Botswana’s relatively high real interest rates willdepend ultimately on containing the rapid growth in governmentspending, which has averaged 12 percent per annum over the lastfive years and 15 percent for the two years to the current fiscal year2005/06. With the ongoing financial sector reforms and the eventualloss of monetary independence that a pegged exchange rate entails,the current exchange rate regime would need to be supported byappropriately tight credit policies. Under the current peg system, thecentral bank retains some monetary independence because financialmarkets are not adequately developed to permit full arbitrage. This

115
situation is, however, not likely to persist for long, given various ongoingreforms by the authorities.
The central bank is implementing a number of reforms to strengthenthe conduct of monetary policy, including, inter alia: (a) introducinggreater transparency in monetary management; (b) enhancingunderstanding of the policy transmission mechanism; and (c) improvingthe functioning of the money market; and (d) strengthening theeffectiveness of monetary policy. The need for these reforms has arisen,in part, because of: (a) the large transfer of financial resources fromthe government to private fund managers for the Public OfficersPension Fund; (b) the establishment of an International FinancialServices Centre (IFSC); and (c) the introduction of government bonds.The introduction of the 2-year, 5-year and 12-year government bondsin 2003, which are now listed on the Botswana Stock Exchange (BSE),has allowed for the derivation of a domestic yield curve.
Botswana’s banking system continues to be assessed as broadlysound; and supervision of the sector is generally viewed as adequate.The commercial banks maintain a capital adequacy ratio of 15 percentor above, and the proportion of non-performing loans in their loansbooks is small. However, Botswana has a sizable number of non-bankfinancial institutions (NBFIs), including some that operate in theInternational Financial Services Centre and the private pension funds,which are not adequately supervised by a regulatory body.Responsibility for regulating and supervising banks lies with the centralbank, whereas responsibility for the NBFIs currently falls under theMinistry of Finance and Development Planning, which has a limitedcapacity to supervise them. Given the concerns about moneylaundering and considering the size of the pension funds, efforts areunderway to reform the existing prudential framework. A review ofthe 1987 Pensions Act has been initiated, and authorities are workingon a revision to the Stock Exchange Act. In addition, authorities aremoving towards setting up an autonomous Financial SupervisoryAuthority to regulate and supervise the NBFIs.
116
6.2.10.1 Central Bank and Government Monetary-FiscalPolicy Interrelationships
As stated in the Bank of Botswana Mission Statement, the primaryobjective of the Central Bank is to promote and maintain monetary
stability. The Bank is also responsible for ensuring that Botswana hasan efficient payments system and that the banking system is sound.These functions of the Bank support the broad national macroeconomicobjectives, including the promotion of sustainable economicdiversification. As set out in the Bank of Botswana Act, 1996, themajor responsibilities of the Bank include the conduct of monetarypolicy; provision of banking services to the Government, banks andselected public sector organisations; regulation and supervision of banksand other financial institutions; issuance of currency; implementationof exchange rate policy; management of foreign exchange reserves;and provision of monetary and financial policy advice to theGovernment.
The implementation of monetary policy is directed mainly atachieving the primary objective of the central bank; i.e., the promotionand maintenance of monetary stability. The Bank implements monetarypolicy, using instruments such as the Bank Rate, the Repo Rate,engaging in open market operations, setting reserve requirements,etc., with a view to achieving a low and stable rate of inflation, whichcontributes to the stability and sustainability of Botswana’ domesticmonetary and financial system. This objective, together with fiscal,wage, trade and exchange rate policies, fosters macroeconomicstability, which is a crucial precondition for achieving sustaineddevelopment, high rates of employment and raising standards of livingfor Batswana.
The Bank of Botswana implements Botswana’s exchange rate policyon behalf of the Government in the overall context of soundmacroeconomic management. The key objective of exchange ratepolicy is to promote export competitiveness without compromisingmacroeconomic stability. The Bank of Botswana also managesBotswana’s official foreign exchange reserves on behalf of theGovernment. The Bank ensures their safety and return by diversifyingthe investments within a framework of acceptable risks. The Bank
117
also provides economic analysis and policy advice to Government andthe public more generally through regular economic and financialreports, published research papers and statistical documents.
6.2.10.2 Institutional Arrangements Prevailing withinBotswana
As noted previously, the political environment in Botswana, withits free and fair democratic elections every five years, where various
political parties compete for power, provides an environment that issupportive of private sector development. Government policies havebeen formulated with a view to providing an enabling environmentfor the private sector to develop and prosper. Creating and maintainingan environment that promotes private sector development have beenamongst the highest priorities of Government, as reflected in the themefor NDP 9 of “Towards Realisation of Vision 2016: Sustainable andDiversified Development through Competitiveness in Global Markets”(MFDP, 2002b).
Botswana has adopted legislation and regulatory practice governingthe security of private property, including land and other assets, aswell as economic freedoms to trade and do business anywhere in thecountry with a view to promoting private sector development.Botswana has also established an effective judicial system that allowsfor the enforcement of contracts, as well as suitable regulatorystructures to allow for effective regulation of monopolies. Botswanahas received favourable assessments and ratings by TransparencyInternational, Moody’s, Standard and Poor’s, the World CompetitivenessReport, the Economist Intelligence Unit and the World Bank that attestto the fact that Botswana has established reasonably efficient processesand procedures that support having a private sector-friendlyenvironment (UNDP, 1998). Botswana’s macroeconomic and fiscalpolicies have been generally directed at promoting business start-upand development, for both citizen and foreign investors.
The Government of Botswana has developed open and systematicprocedures for public consultation, with all of its stakeholders, includinglocal authorities, private sector representatives and independentcommunity service organisations (CSOs), regarding government policy
118
and legislation. The four main national consultative mechanisms haveincluded the Rural Development Council, the National Employment,Manpower and Incomes Council, the High Level Consultative Counciland the Vision 2016 Council (Botswana Government, 1997). A numberof other national councils have been established to address keystakeholder issues, such as population and development, women anddevelopment, youth, HIV/AIDS, tertiary education, etc. TheGovernment also consults bi-annually with the private sector (and otherstakeholders) at the National Business Conference held in Francistown.There are also a number of other consultative processes that havebeen regularly used to ensure widespread, active participation in thepolicy formulation processes. For many key policy areas, Governmenthas established commissions with tripartite membership and mandatesthat include holding meetings and taking evidence from around thecountry regarding the topic(s) of the respective commission. Suchprocedures for consultation serve to ensure that all relevant interestsand views are taken on board in formulating policy and legislation,which improves the effectiveness of policy implementation in practice.
In order to ensure strict adherence to proper financial managementpractices and combat corruption, Government established theDirectorate on Corruption and Economic Crime (DCEC) in 1994, inaddition to the Auditor General that is provided for in the Constitution.Both institutions have strong legal mandates and powers to investigateand report on possible violations of the Finance and Audit Act andfinancial regulations, which are two of the major legal frameworksdesigned to protect the public interest.
The Directorate is responsible for investigating any alleged orsuspected contraventions of the fiscal laws of the country. It alsoassists other law enforcement agencies in investigating public officerssuspected of dishonesty. In addition, it assists governmentdepartments, local authorities and parastatals in identifying weaknessesin their operating procedures that may give rise to opportunities forcorruption, and in developing systems that may enable thoseinstitutions to detect and prevent corruption better.
The Auditor General is mandated by the Constitution to audit andreport to Government and Parliament on the public accounts ofGovernment and most statutory authorities and agencies. The Auditor
119
General seeks to ensure that ministries, departments and agencies, aswell as parastatals and other public bodies, adhere to best financialand performance practices (Botswana Government, 1997). The AuditorGeneral is required to be satisfied that all reasonable precautions aretaken to safeguard the collection, custody and use of public fundsand assets. The Auditor General is also mandated to ensure that thestipulated laws, financial regulations, instructions and directions relatingto public funds and assets are duly observed.
6.2.10.3 Botswana’s Capacity is to Design andImplement Programmes for MacroeconomicConvergence
Botswana has already demonstrated it has the capacity to designand implement programmes that can achieve the macroeconomic
convergence targets set for SADC (see Table 1). The systems for stronggovernance that Botswana has established and adhered to sinceindependence, which provide for democracy, transparency andaccountability, provide much of the framework needed by responsiblegovernment officials to develop and implement policies andprogrammes that are consistent with achieving and sustaining themacroeconomic convergence targets. Botswana’s nationaldevelopment planning process plays a critical role in the formulationof economic strategies that are credible, sound and sustainable froma macroeconomic point of view. Botswana’s Vision 2016 also plays akey role in engendering the formulation and adoption of developmentpolicies and strategies that have a long-term focus, and that areconsistent with achieving the long-term goals and objectives that arebroadly supported by the population.
However, there are areas where the capacity constraints continueto impede Botswana’s progress, and thus act to thwart Botswana’sefforts to achieve some of the macroeconomic convergence targetsset by SADC, especially achieving a 7 percent per annum growth rate.Botswana continues to suffer serious manpower shortages, especiallytechnical and professional manpower, which means government andparastatal programmes are not implemented as timeously and/oreffectively as intended, which further serves to constrain, delay and/or
120
discourage private sector development. In addition, manpowershortages in the private sector make various economic activities morecostly and uncompetitive in Botswana, which serves to thwartBotswana’s efforts to grow rapidly and diversify the economic base.
A related, problem area involves the issue of productivity, especiallylabour productivity in Botswana, where many employers report andlament about the poor work habits and work ethics of many membersof the workforce, including those in the public and parastatal sectors.This problem also retards Botswana’s development, and its efforts tointernationally, create productive jobs and profitable opportunities andfor Batswana entrepreneurs.
Botswana has in the past initiated a number of programmes andstrategies to remedy the above capacity constraints in Government.These include national manpower development planning and humanresources development strategies that ameliorate the manpowershortages, and institutional reforms and productivity improvementprogrammes that remedy the productivity problems. Key among theseinitiatives is the introduction of the Performance Management Systemwithin Government, along with the introduction of the PerformanceBased Reward System. The Botswana Government has invested heavilyin human resources development programmes, with the educationbudget taking up 25 percent of the total budget. Government hasalso adopted a National Privatisation Policy, which is aimed primarilyat achieving productivity improvements in the economy. A NationalPrivatisation Master Plan has been approved by Government. Inaddition, Government has been moving ahead with the establishmentof new regulatory authorities, which aims to produce the bestinternational practice in the areas where government intervention and/or regulation is needed in order to ensure an efficient and equitableenterprise environment.
As noted above, Botswana’s institutional reforms, including legalreforms, which it has proposed to implement during NDP 9, are aimedat enhancing the country’s ability to achieve the SADC macroeconomicconvergence targets. These reforms are likely to impact on theefficiency of the public sector and the international competitivenessof the private sector. However, there is concern that delays inimplementing the reforms will also delay Botswana’s ability to accelerate
121
its growth rate up to the SADC target, as well as up to the rate neededto achieve the Vision 2016 target for per capita incomes.
6.3 Botswana’s Political Priorities
Botswana has a multiparty constitutional democracy, free and fairelections are contested every five years with civil and political rights
that are entrenched under the Constitution. One of the politicalpriorities is to ensure that there is freedom of association, of worshipand of expression in a competitive, multiparty system, with universaladult suffrage. The voting age is a minimum of 18 years. Botswanaemphasizes an open and free electoral process in which all citizens,irrespective of gender, social background, race, colour, or economicstatus, are able to contest political office at both the national andlocal government levels as one of its top political priorities.
In order to ensure that the political priorities that the economypursues are not overtaken by time and global dynamics, Botswanahas, since 2000, amended various Acts, to remove discrimination, andenhance the position of women. This follows from the inaugurationin 1999 of the Botswana National Council for Women (BNCW), whichadvises the government on matters relating to women. As one of itspriorities, Botswana shows respect for the rights of women throughthe existence of both official (Division of Women’s’ Affairs in the Ministryof Labour and Home Affairs) and unofficial women’s associations (suchas Women, Law and Development in Southern Africa) that operatefreely in the political system. Women’s representation in parliamenthas also been increasing. Special election has boosted women’sparliamentary representation, and their elevation to ministerial positionshas ensured their enhanced participation in national (political)decision-making.
The foregoing indicates that Botswana follows a liberal democraticpolitical tradition despite the fact that single party dominance hascharacterised the political system since independence, which is non-discriminatory and socially inclusive.
122
6.4 Botswana’s Trade Policies and the Processes of SADCIntegration
Botswana is an active member of the Southern Africa DevelopmentCommunity (SADC) and the Southern Africa Customs Union
(SACU), as well as the African Union. Botswana has traditionallyenjoyed good relations with the EU and values its participation in theCotonou Agreement and the ACP group. Botswana is a signatory tothe successive Lome’ Conventions and to the Cotonou PartnershipAgreement. The sections below give a brief highlight of Botswana’smembership in these agreements and the effects they have onBotswana’s macroeconomic performance, as well as their implicationsfor the regional integration process.
6.4.1 Southern Africa Customs Union (SACU)
Botswana is a member of the SACU agreement, this agreementhas governed its Botswana’s trade policy for the past four decades.
The Agreement provides for the free movement of goods and theright of transit among and through member states. The members ofSACU comprise of South Africa and its smaller BLNS neighbours(Botswana, Lesotho, Namibia and Swaziland). The original SACUagreement of 1910 has undergone a series of revisions to ensure thatthe needs of the BLNS countries are met, as well as to take into accountchanges that have occurred in the trade patterns of the membercountries, such as the revisions which aimed to increase the share ofthe revenue that other SACU members were getting from the revenuepool, the effects of concentrated production in South Africa, and theloss of sovereignty over the trade and excise policy.
Within this agreement, Botswana faces challenges in as far asrevenue from the pool is concerned. SACU revenue may decline andmay be further reduced by new preferential trading agreements,notably the EU-SA FTA and the implementation of the SADC FTA andby reductions in the common external tariff of SACU. The Agreementswhich Botswana is a member to will also increase competition in theSouth African market, which will reduce some of the benefits Botswanaenjoys by being in a customs union. These dynamics obviously have
123
implications for the macroeconomic environment of Botswana as theystand to affect the revenue that Botswana has been gaining from itsmembership to SACU. This revenue has been used to pursue Botswanadevelopment objectives.
European Union-South Africa Free Trade Agreement (EU-SA FTA)On January 1, 2000 the EU-SA FTA went into practice (apart fromcontinuing disagreements over wine, spirits and fisheries, which donot affect Botswana). Because of the strong economic ties to SouthAfrica through SACU, the Agreement means that the BLNS countriesare obliged to accept de facto free trade with the EU. The Agreementis asymmetrical in both timing and content. The EU will liberalise 95percent of its imports from South Africa within a 10-year transitionalperiod, while South Africa will liberalise 86 percent of its imports fromthe EU within a 12-year transitional period. It provides for the protectionof South Africa’s and the BLNS’s sensitive sectors and commits the EUto provide support for SACU adjustment to the FTA.
There are implications of this agreement for Botswana whichtranslate into macroeconomic impacts. Since the SACU countries sharea common external tariff, reductions in tariffs will reduce customsrevenue, and cause transitional unemployment and idle capacity inindustries due to competition from the EU in the South African market.The Agreement has the potential to create substantial welfare gainsthrough “dynamic” increases in total factor productivity and higherlevels of investment. However, such benefits are only attainable in thelong run and are a function of many other macro-economicadjustments. The benefits are unlikely to offset the loss in revenue.
6.4.2 SADC Free Trade Agreement
Botswana is a member of SADC, which started implementing afree trade agreement on September 1, 2000. The intention of the
free trade agreement is that by 2008, trade in products consideredless sensitive will be liberalised. This will free 85 percent of intra-SADCtrade from tariffs. From 2008 to 2012, trade in the sensitive productswill be liberalised.
Botswana, by being a member of SACU, will have to front-loadimplementation of the FTA (open markets faster). The impact on
124
Botswana’s macro economy involves the potential for the agreementto increase intra-SADC trade. Also, producers are expected to benefitfrom a larger export market of the combined population of over 200million people in the SADC region. The agreement is also expected tolead to increased interest in Botswana as a gateway to the region. Thecountry’s economic and political stability should attract foreign investorswho want to export to the region.
The SADC FTA will reduce customs revenues upon which many SADCcountries are heavily dependent. The direct impact on SACU is minor,since imports from non-SACU SADC members form a small proportionof total SACU imports. The most serious implication of the agreementfor the BLNS countries is the increased competition in the SACU market(especially from Zimbabwe and Mauritius). The business communityhas expressed concern that there are non-tariff measures that impedethe movement of cargo by land transport. The SADC countries havenot yet committed themselves to removing non-tariff barriers. Thecontinued presence of non-tariff barriers has a potential to contributeto the for failure of establishment of an FTA.
6.4.3 Trade Relations with the European Union
Botswana has had long standing trade relations with the EU. Butnow these trade relations with the EU have been complicated by
the EU-SA FTA. As a signatory to the Lomé Convention (now Cotonou),Botswana has access to the EU market for most of its products onnon-reciprocal terms. Because of the EU-SA FTA and the strongeconomic ties with South Africa, Botswana ends up participating in areciprocal FTA with the EU. However, the Lomé Convention expiredon February 29, 2000. On June 23, 2000 the EU and ACP countries(excluding South Africa) signed a new partnership agreement inCotonou, Benin, replacing the Lomé IV Convention. The agreementspecifies arrangements for negotiating how to replace the non-reciprocal preferential (Lomé) regime with WTO-compatible (reciprocal)Economic Partnership Agreements (EPAs). The new agreement is a20-year accord under which the current Lomé trade terms will beextended at least through 2008 (see Table 9).
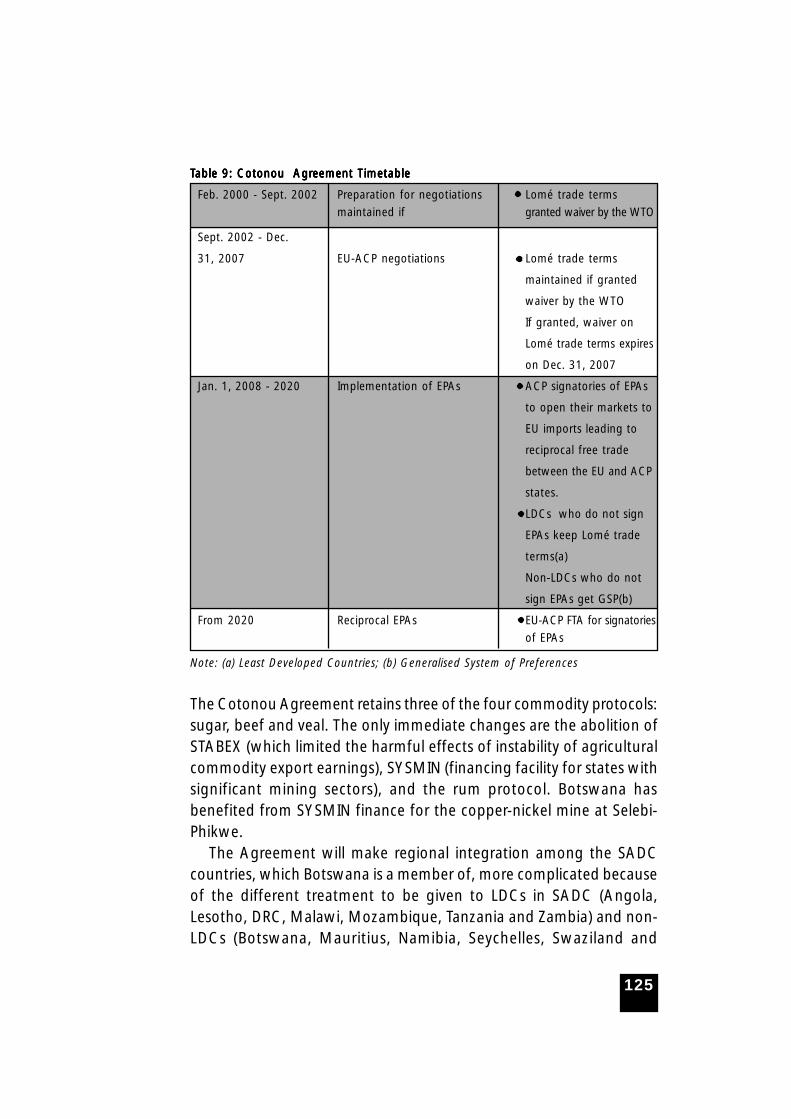
125
TTTTTable 9: Cotonou Agrable 9: Cotonou Agrable 9: Cotonou Agrable 9: Cotonou Agrable 9: Cotonou Agreement Teement Teement Teement Teement Timetableimetableimetableimetableimetable
Feb. 2000 - Sept. 2002 Preparation for negotiations Lomé trade terms
maintained if granted waiver by the WTO
Sept. 2002 - Dec.
31, 2007 EU-ACP negotiations Lomé trade terms
maintained if granted
waiver by the WTO
If granted, waiver on
Lomé trade terms expires
on Dec. 31, 2007
Jan. 1, 2008 - 2020 Implementation of EPAs ACP signatories of EPAs
to open their markets to
EU imports leading to
reciprocal free trade
between the EU and ACP
states.
LDCs who do not sign
EPAs keep Lomé trade
terms(a)
Non-LDCs who do not
sign EPAs get GSP(b)
From 2020 Reciprocal EPAs EU-ACP FTA for signatories
of EPAs
Note: (a) Least Developed Countries; (b) Generalised System of Preferences
The Cotonou Agreement retains three of the four commodity protocols:sugar, beef and veal. The only immediate changes are the abolition ofSTABEX (which limited the harmful effects of instability of agriculturalcommodity export earnings), SYSMIN (financing facility for states withsignificant mining sectors), and the rum protocol. Botswana hasbenefited from SYSMIN finance for the copper-nickel mine at Selebi-Phikwe.
The Agreement will make regional integration among the SADCcountries, which Botswana is a member of, more complicated becauseof the different treatment to be given to LDCs in SADC (Angola,Lesotho, DRC, Malawi, Mozambique, Tanzania and Zambia) and non-LDCs (Botswana, Mauritius, Namibia, Seychelles, Swaziland and
126
Zimbabwe). The ongoing reform of the European Commission, in thecontext of changing economic and political priorities of the Union,may also influence (negatively) future EU trade negotiations with theACP. Also, like the other SADC countries, Botswana has inadequatecapacity in negotiating for such a complex trade arrangement.
6.4.4 Trade Relations with the United States of America
The USA accounts for around 1 percent of Botswana’s exports andunder 2 percent of its imports. It should, however, be noted that
although the bulk of Botswana’s diamonds go initially to the UK, it isestimated that half of global diamond sales in recent years have beensent to the USA. Trade with the USA was governed by the GeneralisedSystem of Preferences (GSP). However, on May 18, 2000, PresidentClinton signed into law the African Growth and Opportunity Act(AGOA). The Act extends GSP for eligible Sub-Saharan Africanbeneficiaries until September 30, 2008. Eligibility is based on countrieshaving established, or making continued progress toward establishing,among other things: (i) market-based economies; (ii) elimination ofbarriers to U.S. trade and investment (i.e., provision of nationaltreatment to US investment); (iii) protection of intellectual property;(iv) policies to reduce poverty; (v) protection of human rights and workerrights; and (viii) elimination of certain child labor practices. In addition,the designated country should not engage in activities that undermineUS national security or foreign policy interests.
Though Botswana has benefited in that it has been able to exportsome of its textile products under the AGOA umbrella, market accesswill not be limited and textile exports would be carefully regulated.Duty-free and quota-free access for apparel is restricted to productsmade from U.S. fabric, yarn, and thread. Apparel imports made withregional (African) fabric and yarn are subject to a cap of 1.5% ofoverall USA apparel imports. AGOA specifies only one cap, which isnot further sub-divided. It is conceivable that a beneficiary country orcountries with a strong apparel manufacturing sector could monopolisethe benefits available before others are able to establish theinfrastructure and the required visa system (documentation to preventillegal transshipment and procedures to prevent use of counterfeitdocumentation).
127
6.4.5 World Trade Organisation
In principle, WTO membership allows countries to participate fully inthe WTO process and in decisions about the future development of
the global trading system. In practice, however, SADC countries, whichBotswana is a member of, face a number of obstacles the impedeeffective participation. Most of the countries in the region, includingBotswana are unable to: (i) fully understand and internalise theimplications and constraints of WTO Agreements; (ii) formulate andpursue trade and development strategies consistent with their WTOobligations; and (iii) assert and defend their trade-related rights againstinfringements.
The lack of capacity makes it difficult to draft appropriate legislationand regulations, meet the requirements for procedural notifications,staff government institutions with technical personnel able toimplement the policies and commitments undertaken, and monitortrading partners’ implementation of WTO obligations.
6.5 Impact of WTO Rules on Botswana’s Integration
Botswana attaches great importance to its WTO membership andis committed to a liberal and fair trade regime. This is reflected in
the various notifications that Botswana made to the WTO that itrecognizes the need to implement legislation on anti-dumping,safeguards and countervailing measures. Enhancing Botswana’scapacity to develop such rule-based trade measures may help reducethe scope for disruptions and reforms. It can also contribute to stableand predictable trade policies within the SACU region. Botswana needsassistance in identifying measures that are WTO consistent, and thatdo not introduce inefficiency in its export and FDI promoting policiesthat are not currently harmonized across SACU. In this regard, assistancein developing a WTO-consistent set of policies amongst members willcontribute to strengthening SACU by ensuring that its members donot engage in practices that could cause injury to regional partners.
As noted above, Botswana, like other SADC countries, faces achallenge to implement trade agreements that it is a signatory to,while at the same time, ensuring that the agreements are WTO

128
compatible. The required rules in the WTO system emphasize theremoval of all trade obstacles progressively and this has effects fordeveloping countries like Botswana, which at times need to protecttheir industries which are at the early stages of development and facetariff losses and revenue shocks from fast liberalization. The erosion oftrade preferences for developing countries in WTO negotiations is quitea challenge which impacts on the macroeconomic and developmentfabrics of developing countries like Botswana which have benefitedfrom the trade preferences offered but are now declining as a resultof liberalization. For Botswana to benefit from the liberalization processas required by the WTO system, it is imperative that the resources,capacity and expertise to negotiate a beneficial liberalization forBotswana be made available.
Related to this issue is the complexity involved in the negotiationprocesses on the time frame envisaged for progressive removal of tradeobstacles which may not necessarily favour Botswana. While the WTOrules and objectives in their generality and principle favour Botswana’smacroeconomic policy objectives on its liberalization process and theneed to attract productive FDI inflows, their pursuit of assistingdeveloping countries with their integration into the world tradingsystem, enhancing and increasing supply and production capacities ofdeveloping countries, as well as the competitiveness of their productsin world markets, the negotiation process is quite complex and requiresexpertise to maximize the benefits that Botswana’s integration intothe global system may confer. One of the major implications forBotswana’s integration within the region is to ensure that theimplementation of the agreements to which it is signatory to are notin violation of the WTO rules of origin where there are alreadycomplexities in the application of WTO rules of origin. More flexibilityand ease of understanding in the application of the rules would surelyincrease the benefits of trade for developing countries such asBotswana.
Also, a balanced and more transparent trading system wouldenhance the benefits of trade for all participants and within the WTOrules. An analysis of the implementation of agricultural subsidies, thatthe playing field was not fair as WTO was protecting agriculturalactivities in developed countries through high tariffs. These dynamics
129
reflect the importance of having expertise and capacity to handle tradenegotiations with the WTO and also to have concerns that affectdeveloping countries being addressed effectively and timeously in theglobal trading system.
6.6 Botswana’s Progress Regarding the Implementationof the SADC Trade Protocol
Botswana has achieved significant progress in the attainment ofmost of the objectives of the SADC Trade Protocol, notably on the
gradual reduction of tariffs. Botswana’s achievements have largely beendriven by the liberalisation process and faster pace in the SACUAgreement. The SADC trade protocol aimed to reduce tariffs within aperiod of eight years, commencing in 2000. Botswana and othermembers of the Southern African Customs Union (SACU) haveundertaken to implement the SADC Trade Protocol as a unit and haveemerged as countries at the top of the liberalisation process throughtariff reductions, with over 50% of products now being traded dutyfree.
For the implementation of the Trade Protocal to be a success thatneed to be resolved, not only for Botswana, but also for other SADCcountries in the region there are still some issues such as; rules oforigin and definitions.
6.7 Trade Flow Analysis
Botswana’s trade pattern is dominated by South Africa, mainly as aresult of the SACU Agreement, which has governed its trade policy
since independence. The SACU Agreement has had a major impacton Botswana’s trade structure, where South Africa more developedcountry among the other SACU members has acted as the majormarket for exports of the BLNS countries, as well a the major sourceof imports. Other markets that Botswana has accessed include the EUmarket. This was as a result of the preferential access that the thenLome Convention and now the Cotonou Agreement offereddeveloping countries. Following the implementation of the African
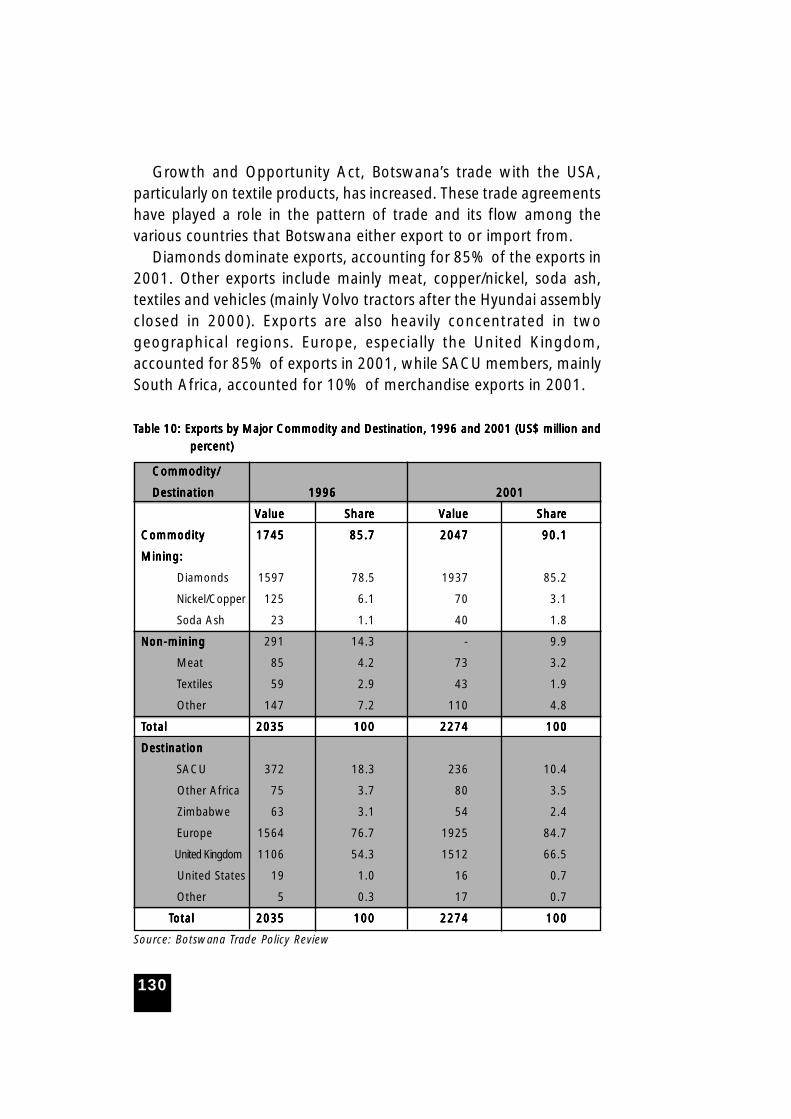
130
Growth and Opportunity Act, Botswana’s trade with the USA,particularly on textile products, has increased. These trade agreementshave played a role in the pattern of trade and its flow among thevarious countries that Botswana either export to or import from.
Diamonds dominate exports, accounting for 85% of the exports in2001. Other exports include mainly meat, copper/nickel, soda ash,textiles and vehicles (mainly Volvo tractors after the Hyundai assemblyclosed in 2000). Exports are also heavily concentrated in twogeographical regions. Europe, especially the United Kingdom,accounted for 85% of exports in 2001, while SACU members, mainlySouth Africa, accounted for 10% of merchandise exports in 2001.
TTTTTable able able able able 1010101010::::: ExporExporExporExporExports by Major Commodity and Destination, 1996 and 2001 (US$ million andts by Major Commodity and Destination, 1996 and 2001 (US$ million andts by Major Commodity and Destination, 1996 and 2001 (US$ million andts by Major Commodity and Destination, 1996 and 2001 (US$ million andts by Major Commodity and Destination, 1996 and 2001 (US$ million and
perperperperpercent)cent)cent)cent)cent)
Commodity/Commodity/Commodity/Commodity/Commodity/
DestinationDestinationDestinationDestinationDestination 1996 1996 1996 1996 1996 2001 2001 2001 2001 2001
VVVVValuealuealuealuealue SharSharSharSharShareeeee VVVVValuealuealuealuealue SharSharSharSharShareeeee
CommodityCommodityCommodityCommodityCommodity 17451745174517451745 85.785.785.785.785.7 20472047204720472047 90.190.190.190.190.1
Mining:Mining:Mining:Mining:Mining:
Diamonds 1597 78.5 1937 85.2
Nickel/Copper 125 6.1 70 3.1
Soda Ash 23 1.1 40 1.8
Non-miningNon-miningNon-miningNon-miningNon-mining 291 14.3 - 9.9
Meat 85 4.2 73 3.2
Textiles 59 2.9 43 1.9
Other 147 7.2 110 4.8
TTTTTotalotalotalotalotal 20352035203520352035 100100100100100 22742274227422742274 100100100100100
DestinationDestinationDestinationDestinationDestination
SACU 372 18.3 236 10.4
Other Africa 75 3.7 80 3.5
Zimbabwe 63 3.1 54 2.4
Europe 1564 76.7 1925 84.7
United Kingdom 1106 54.3 1512 66.5
United States 19 1.0 16 0.7
Other 5 0.3 17 0.7
T T T T Totalotalotalotalotal 20352035203520352035 100100100100100 22742274227422742274 100100100100100
Source: Botswana Trade Policy Review
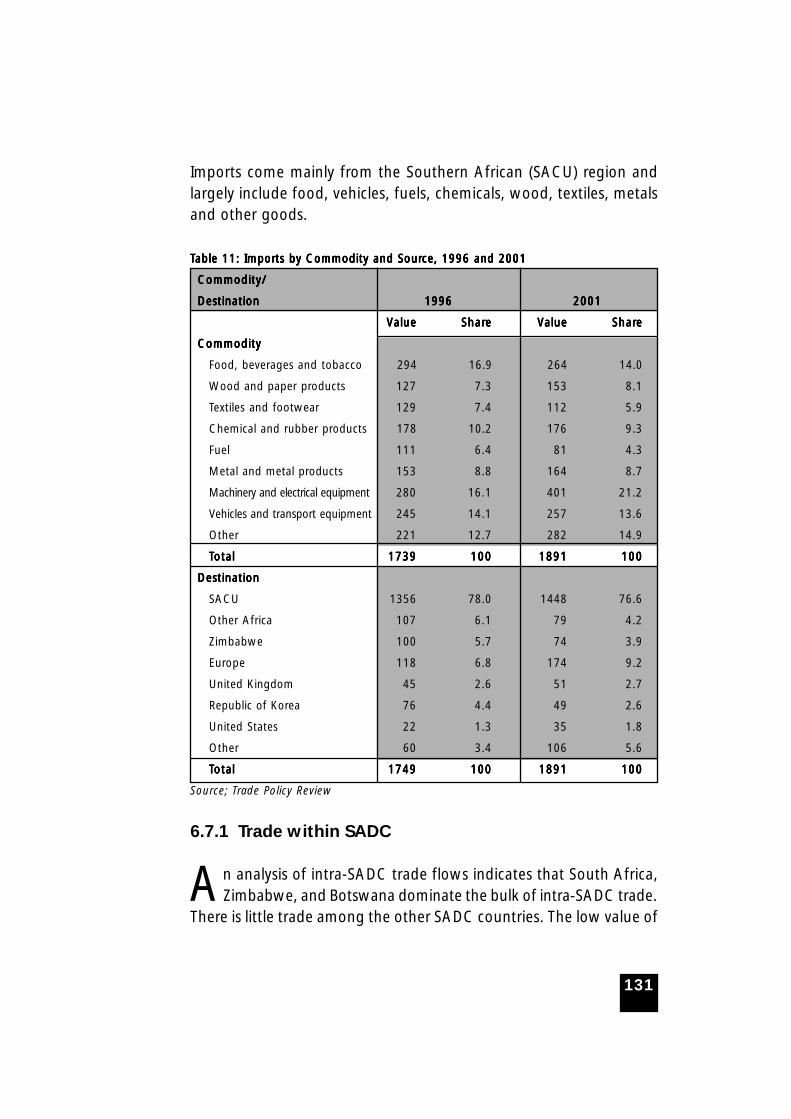
131
Imports come mainly from the Southern African (SACU) region andlargely include food, vehicles, fuels, chemicals, wood, textiles, metalsand other goods.
TTTTTable 11: Imporable 11: Imporable 11: Imporable 11: Imporable 11: Imports by Commodity and Sourts by Commodity and Sourts by Commodity and Sourts by Commodity and Sourts by Commodity and Source, 1996 and 2001ce, 1996 and 2001ce, 1996 and 2001ce, 1996 and 2001ce, 1996 and 2001
Commodity/Commodity/Commodity/Commodity/Commodity/
DestinationDestinationDestinationDestinationDestination 1996 1996 1996 1996 1996 20012001200120012001
VVVVValuealuealuealuealue SharSharSharSharShareeeee VVVVValuealuealuealuealue SharSharSharSharShareeeee
CommodityCommodityCommodityCommodityCommodity
Food, beverages and tobacco 294 16.9 264 14.0
Wood and paper products 127 7.3 153 8.1
Textiles and footwear 129 7.4 112 5.9
Chemical and rubber products 178 10.2 176 9.3
Fuel 111 6.4 81 4.3
Metal and metal products 153 8.8 164 8.7
Machinery and electrical equipment 280 16.1 401 21.2
Vehicles and transport equipment 245 14.1 257 13.6
Other 221 12.7 282 14.9
TTTTTotalotalotalotalotal 17391739173917391739 100100100100100 18911891189118911891 100100100100100
DestinationDestinationDestinationDestinationDestination
SACU 1356 78.0 1448 76.6
Other Africa 107 6.1 79 4.2
Zimbabwe 100 5.7 74 3.9
Europe 118 6.8 174 9.2
United Kingdom 45 2.6 51 2.7
Republic of Korea 76 4.4 49 2.6
United States 22 1.3 35 1.8
Other 60 3.4 106 5.6
TTTTTotalotalotalotalotal 17491749174917491749 100100100100100 18911891189118911891 100100100100100
Source; Trade Policy Review
6.7.1 Trade within SADC
An analysis of intra-SADC trade flows indicates that South Africa,Zimbabwe, and Botswana dominate the bulk of intra-SADC trade.
There is little trade among the other SADC countries. The low value of
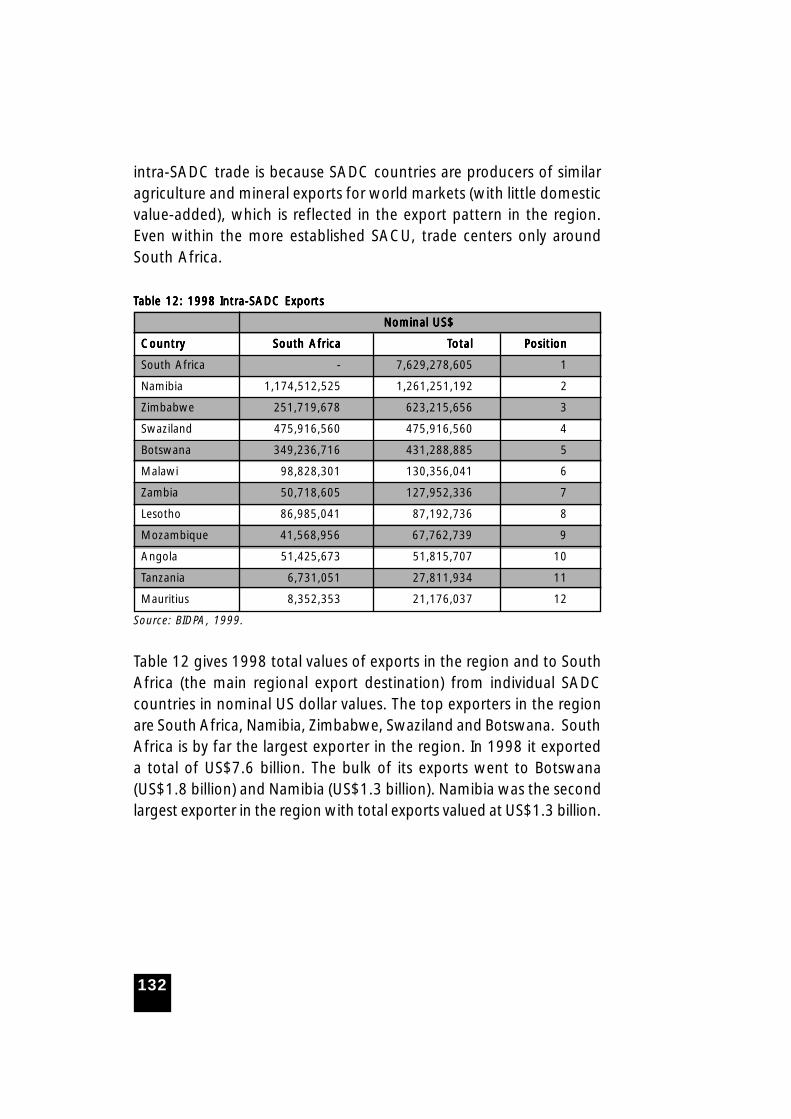
132
intra-SADC trade is because SADC countries are producers of similaragriculture and mineral exports for world markets (with little domesticvalue-added), which is reflected in the export pattern in the region.Even within the more established SACU, trade centers only aroundSouth Africa.
TTTTTable 12: 1998 Intra-SADC Exporable 12: 1998 Intra-SADC Exporable 12: 1998 Intra-SADC Exporable 12: 1998 Intra-SADC Exporable 12: 1998 Intra-SADC Exportststststs
Nominal US$ Nominal US$ Nominal US$ Nominal US$ Nominal US$
CountryCountryCountryCountryCountry South AfricaSouth AfricaSouth AfricaSouth AfricaSouth Africa TTTTTotalotalotalotalotal PositionPositionPositionPositionPosition
South Africa - 7,629,278,605 1
Namibia 1,174,512,525 1,261,251,192 2
Zimbabwe 251,719,678 623,215,656 3
Swaziland 475,916,560 475,916,560 4
Botswana 349,236,716 431,288,885 5
Malawi 98,828,301 130,356,041 6
Zambia 50,718,605 127,952,336 7
Lesotho 86,985,041 87,192,736 8
Mozambique 41,568,956 67,762,739 9
Angola 51,425,673 51,815,707 10
Tanzania 6,731,051 27,811,934 11
Mauritius 8,352,353 21,176,037 12
Source: BIDPA, 1999.
Table 12 gives 1998 total values of exports in the region and to SouthAfrica (the main regional export destination) from individual SADCcountries in nominal US dollar values. The top exporters in the regionare South Africa, Namibia, Zimbabwe, Swaziland and Botswana. SouthAfrica is by far the largest exporter in the region. In 1998 it exporteda total of US$7.6 billion. The bulk of its exports went to Botswana(US$1.8 billion) and Namibia (US$1.3 billion). Namibia was the secondlargest exporter in the region with total exports valued at US$1.3 billion.
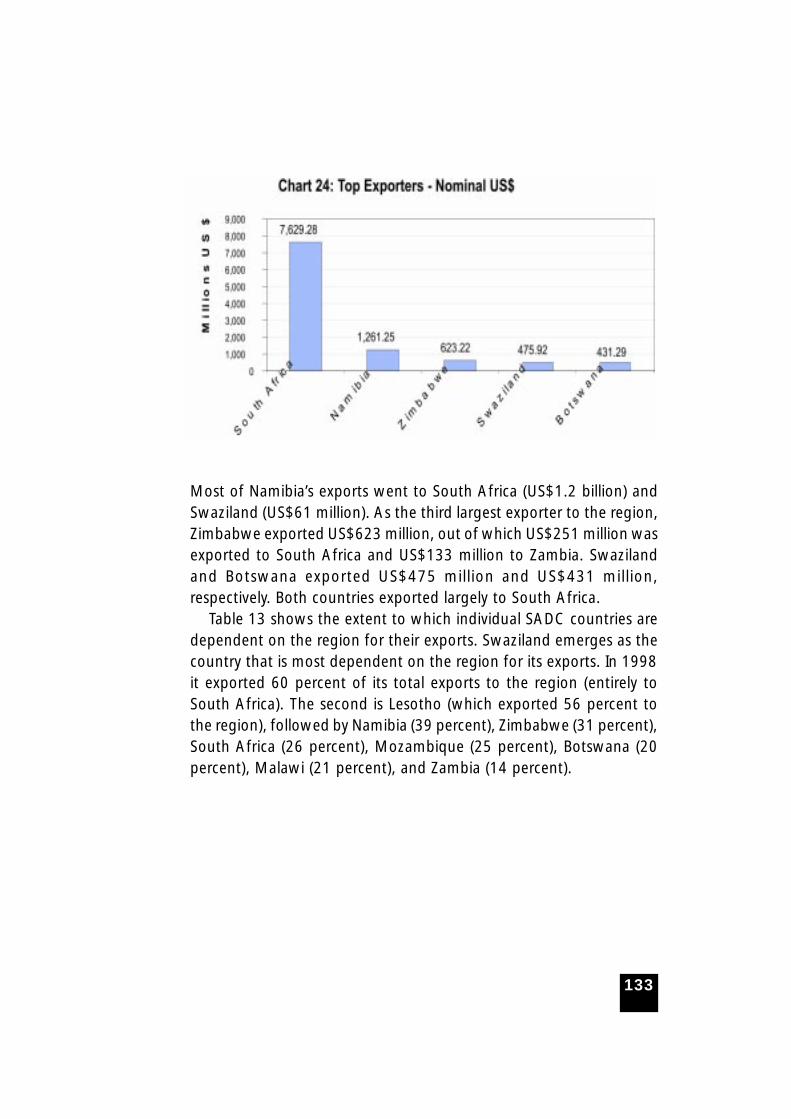
133
Most of Namibia’s exports went to South Africa (US$1.2 billion) andSwaziland (US$61 million). As the third largest exporter to the region,Zimbabwe exported US$623 million, out of which US$251 million wasexported to South Africa and US$133 million to Zambia. Swazilandand Botswana exported US$475 million and US$431 million,respectively. Both countries exported largely to South Africa.
Table 13 shows the extent to which individual SADC countries aredependent on the region for their exports. Swaziland emerges as thecountry that is most dependent on the region for its exports. In 1998it exported 60 percent of its total exports to the region (entirely toSouth Africa). The second is Lesotho (which exported 56 percent tothe region), followed by Namibia (39 percent), Zimbabwe (31 percent),South Africa (26 percent), Mozambique (25 percent), Botswana (20percent), Malawi (21 percent), and Zambia (14 percent).
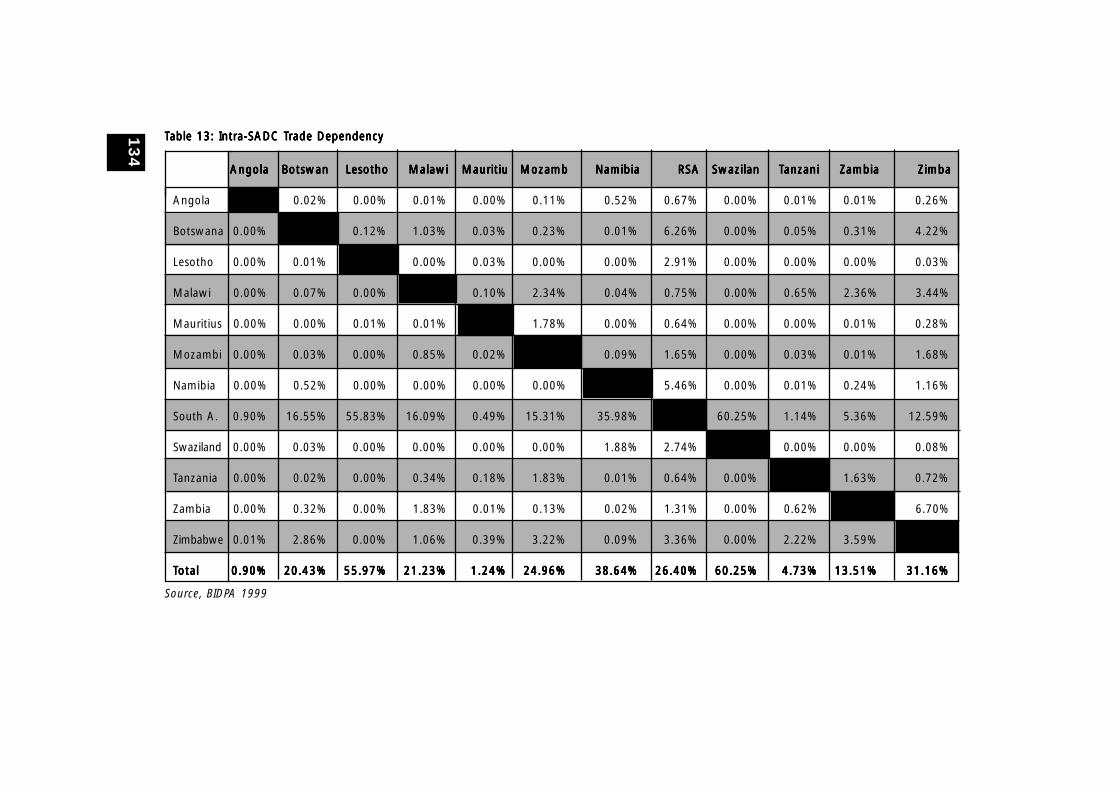
13
4
AngolaAngolaAngolaAngolaAngola BotswanBotswanBotswanBotswanBotswan LesothoLesothoLesothoLesothoLesotho MalawiMalawiMalawiMalawiMalawi MauritiuMauritiuMauritiuMauritiuMauritiu MozambMozambMozambMozambMozamb NamibiaNamibiaNamibiaNamibiaNamibia RSARSARSARSARSA SwazilanSwazilanSwazilanSwazilanSwazilan TTTTTanzanianzanianzanianzanianzani ZambiaZambiaZambiaZambiaZambia ZimbaZimbaZimbaZimbaZimba
Angola 0.02% 0.00% 0.01% 0.00% 0.11% 0.52% 0.67% 0.00% 0.01% 0.01% 0.26%
Botswana 0.00% 0.12% 1.03% 0.03% 0.23% 0.01% 6.26% 0.00% 0.05% 0.31% 4.22%
Lesotho 0.00% 0.01% 0.00% 0.03% 0.00% 0.00% 2.91% 0.00% 0.00% 0.00% 0.03%
Malawi 0.00% 0.07% 0.00% 0.10% 2.34% 0.04% 0.75% 0.00% 0.65% 2.36% 3.44%
Mauritius 0.00% 0.00% 0.01% 0.01% 1.78% 0.00% 0.64% 0.00% 0.00% 0.01% 0.28%
Mozambi 0.00% 0.03% 0.00% 0.85% 0.02% 0.09% 1.65% 0.00% 0.03% 0.01% 1.68%
Namibia 0.00% 0.52% 0.00% 0.00% 0.00% 0.00% 5.46% 0.00% 0.01% 0.24% 1.16%
South A. 0.90% 16.55% 55.83% 16.09% 0.49% 15.31% 35.98% 60.25% 1.14% 5.36% 12.59%
Swaziland 0.00% 0.03% 0.00% 0.00% 0.00% 0.00% 1.88% 2.74% 0.00% 0.00% 0.08%
Tanzania 0.00% 0.02% 0.00% 0.34% 0.18% 1.83% 0.01% 0.64% 0.00% 1.63% 0.72%
Zambia 0.00% 0.32% 0.00% 1.83% 0.01% 0.13% 0.02% 1.31% 0.00% 0.62% 6.70%
Zimbabwe 0.01% 2.86% 0.00% 1.06% 0.39% 3.22% 0.09% 3.36% 0.00% 2.22% 3.59%
TTTTTotalotalotalotalotal 0.90%0.90%0.90%0.90%0.90% 20.43%20.43%20.43%20.43%20.43% 55.97%55.97%55.97%55.97%55.97% 21.23%21.23%21.23%21.23%21.23% 1.24%1.24%1.24%1.24%1.24% 24.96%24.96%24.96%24.96%24.96% 38.64%38.64%38.64%38.64%38.64% 26.40%26.40%26.40%26.40%26.40% 60.25%60.25%60.25%60.25%60.25% 4.73%4.73%4.73%4.73%4.73% 13.51%13.51%13.51%13.51%13.51% 31.16%31.16%31.16%31.16%31.16%
TTTTTable 13: Intra-SADC Table 13: Intra-SADC Table 13: Intra-SADC Table 13: Intra-SADC Table 13: Intra-SADC Trade Dependencyrade Dependencyrade Dependencyrade Dependencyrade Dependency
Source, BIDPA 1999
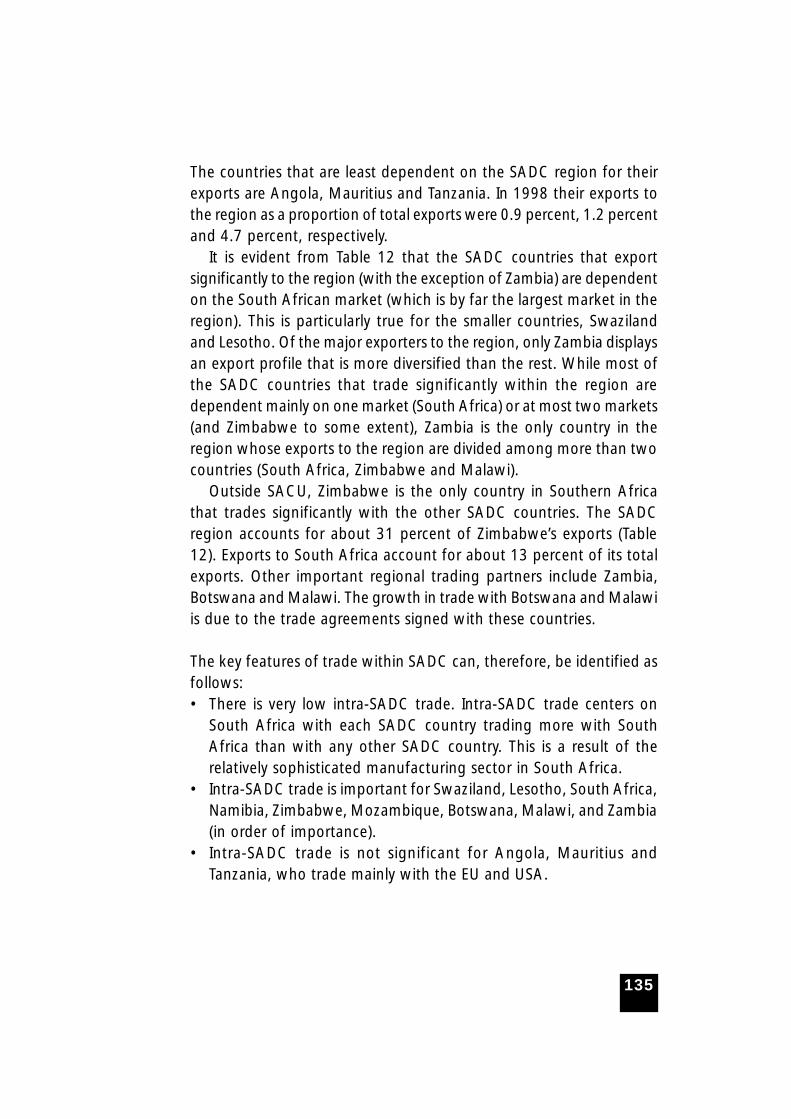
135
The countries that are least dependent on the SADC region for theirexports are Angola, Mauritius and Tanzania. In 1998 their exports tothe region as a proportion of total exports were 0.9 percent, 1.2 percentand 4.7 percent, respectively.
It is evident from Table 12 that the SADC countries that exportsignificantly to the region (with the exception of Zambia) are dependenton the South African market (which is by far the largest market in theregion). This is particularly true for the smaller countries, Swazilandand Lesotho. Of the major exporters to the region, only Zambia displaysan export profile that is more diversified than the rest. While most ofthe SADC countries that trade significantly within the region aredependent mainly on one market (South Africa) or at most two markets(and Zimbabwe to some extent), Zambia is the only country in theregion whose exports to the region are divided among more than twocountries (South Africa, Zimbabwe and Malawi).
Outside SACU, Zimbabwe is the only country in Southern Africathat trades significantly with the other SADC countries. The SADCregion accounts for about 31 percent of Zimbabwe’s exports (Table12). Exports to South Africa account for about 13 percent of its totalexports. Other important regional trading partners include Zambia,Botswana and Malawi. The growth in trade with Botswana and Malawiis due to the trade agreements signed with these countries.
The key features of trade within SADC can, therefore, be identified asfollows:• There is very low intra-SADC trade. Intra-SADC trade centers on
South Africa with each SADC country trading more with SouthAfrica than with any other SADC country. This is a result of therelatively sophisticated manufacturing sector in South Africa.
• Intra-SADC trade is important for Swaziland, Lesotho, South Africa,Namibia, Zimbabwe, Mozambique, Botswana, Malawi, and Zambia(in order of importance).
• Intra-SADC trade is not significant for Angola, Mauritius andTanzania, who trade mainly with the EU and USA.

136
6.7.2 Trade with the Rest of the World
Table 14 gives the value of 1998 exports to the USA, Europe andrest of the world in nominal US$. Europe is by far the major export
destination for the SADC countries. The European destination is largelydue to the preferences under the Lome’ Convention and to someextent colonial ties to Europe. The only exception is Angola, whichexports largely to the USA. This is due to oil exports, which is by farAngola’s largest export commodity.
TTTTTable 14: SADC Exporable 14: SADC Exporable 14: SADC Exporable 14: SADC Exporable 14: SADC Exports to the Rest of the Wts to the Rest of the Wts to the Rest of the Wts to the Rest of the Wts to the Rest of the World (US$)orld (US$)orld (US$)orld (US$)orld (US$)
EurEurEurEurEuropeopeopeopeope USAUSAUSAUSAUSA ROWROWROWROWROW TTTTTotal (minus SADC)otal (minus SADC)otal (minus SADC)otal (minus SADC)otal (minus SADC)
Angola 591,425,627 2,227,909,091 2,871,150,425 5,690,485,143
Botswana 1,224,645,880 21,816,881 432,908,251 1,679,371,012
Lesotho 346,550 67,399,411 853,594 68,599,554
Malawi 171,115,006 58,818,182 253,747,601 483,680,789
Mauritius 1,224,110,221 284,884,693 173,932,385 1,682,927,299
Mozambiq 113,420,000 25,000,000 65,310,000 203,730,000
Namibia 499,470,685 52,136,847 1,451,624,960 2,003,232,492
South Africa 8,429,422,602 2,007,034,295 10,835,343,470 21,271,800,368
Swaziland n/a n/a n/a 313,949,366
Tanzania 239,112,915 13,454,967 308,040,870 560,608,751
Zambia 283,175,212 43,454,545 492,519,600 819,149,357
Zimbabwe 677,985,790 128,752,180 569,785,626 1,376,523,596
Total 13,454,230,487 4,930,661,092 17,455,216,782 36,154,057,727
Source: BIDPA, 1999.
The major exporters to the rest of the world are South Africa, Angola,Mauritius, Botswana and Zimbabwe (Table 13). South Africa is thelargest exporter outside SADC. In 1998 her exports reached US$21billion, followed by Angola (US$5.7 billion), Mauritius (US$1.7 billion),Botswana (US$1.68 billion) and Zimbabwe (US$1.4 billion).
6.7.3 SADC Trade Projections
Table 15 indicates trade projections among the SADC countries fromthe year 2000 to 2006. 5 percent is the growth rate used to project
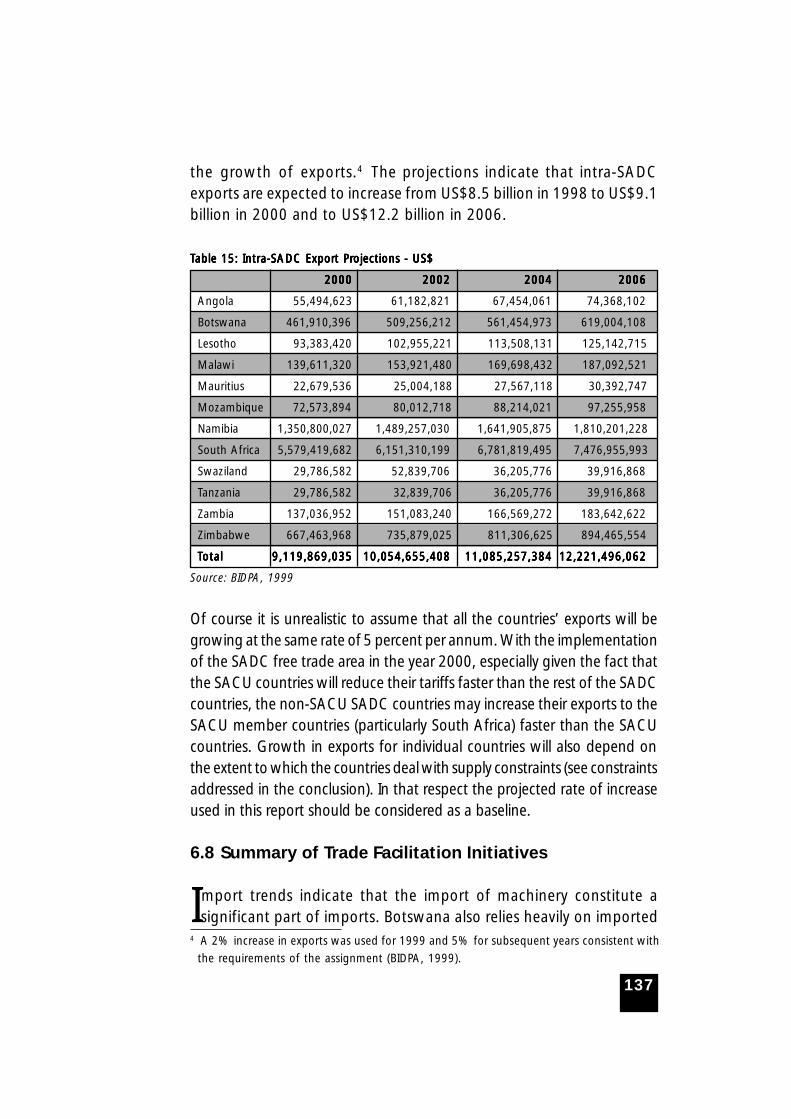
137
4 A 2% increase in exports was used for 1999 and 5% for subsequent years consistent with
the requirements of the assignment (BIDPA, 1999).
the growth of exports.4 The projections indicate that intra-SADCexports are expected to increase from US$8.5 billion in 1998 to US$9.1billion in 2000 and to US$12.2 billion in 2006.
TTTTTable 15: Intra-SADC Exporable 15: Intra-SADC Exporable 15: Intra-SADC Exporable 15: Intra-SADC Exporable 15: Intra-SADC Export Prt Prt Prt Prt Projections - US$ojections - US$ojections - US$ojections - US$ojections - US$
20002000200020002000 20022002200220022002 20042004200420042004 20062006200620062006
Angola 55,494,623 61,182,821 67,454,061 74,368,102
Botswana 461,910,396 509,256,212 561,454,973 619,004,108
Lesotho 93,383,420 102,955,221 113,508,131 125,142,715
Malawi 139,611,320 153,921,480 169,698,432 187,092,521
Mauritius 22,679,536 25,004,188 27,567,118 30,392,747
Mozambique 72,573,894 80,012,718 88,214,021 97,255,958
Namibia 1,350,800,027 1,489,257,030 1,641,905,875 1,810,201,228
South Africa 5,579,419,682 6,151,310,199 6,781,819,495 7,476,955,993
Swaziland 29,786,582 52,839,706 36,205,776 39,916,868
Tanzania 29,786,582 32,839,706 36,205,776 39,916,868
Zambia 137,036,952 151,083,240 166,569,272 183,642,622
Zimbabwe 667,463,968 735,879,025 811,306,625 894,465,554
TTTTTotalotalotalotalotal 9,119,869,0359,119,869,0359,119,869,0359,119,869,0359,119,869,035 10,054,655,40810,054,655,40810,054,655,40810,054,655,40810,054,655,408 11,085,257,38411,085,257,38411,085,257,38411,085,257,38411,085,257,384 12,221,496,06212,221,496,06212,221,496,06212,221,496,06212,221,496,062
Source: BIDPA, 1999
Of course it is unrealistic to assume that all the countries’ exports will begrowing at the same rate of 5 percent per annum. With the implementationof the SADC free trade area in the year 2000, especially given the fact thatthe SACU countries will reduce their tariffs faster than the rest of the SADCcountries, the non-SACU SADC countries may increase their exports to theSACU member countries (particularly South Africa) faster than the SACUcountries. Growth in exports for individual countries will also depend onthe extent to which the countries deal with supply constraints (see constraintsaddressed in the conclusion). In that respect the projected rate of increaseused in this report should be considered as a baseline.
6.8 Summary of Trade Facilitation Initiatives
Import trends indicate that the import of machinery constitute asignificant part of imports. Botswana also relies heavily on imported
138
inputs to produce manufactured exports. Given the importance ofimports in the success of the export-led growth strategy and the needto develop competitive export products, delays and inefficiencies intransport and clearance of goods may adversely affect production,increase costs and thwart efforts to achieve sustainable economicgrowth and diversification. Timely delivery of imported goods,particularly for a country that significantly depends on imported inputsand machinery is crucial for export-oriented industries. While NDP 9 isnot specific on what measures should be put in place to create anenabling business environment, it does point out the need for theprivate sector to be competitive and to penetrate global markets. It isincreasingly being acknowledged that as international trade increases,it is crucial to have among other measures, efficient customs clearanceto ensure a cost effective business environment.
Like other countries in the region which consider trade facilitationan important factor in attracting FDI, a number of trade facilitationinitiatives on trade are ongoing in Botswana. Institutions, such as theBotswana Export Development and Investment Authority (BEDIA) andthe Botswana Export Credit Insurance and Guarantee Company (BECI),have been formulated mainly to facilitate the trade and investmentinitiatives of the country.
The Botswana Trade and Poverty Programme is at its formative stageswith the main objective being to identify the trade and poverty linksthat may be explored in trade facilitation. Some developments thatare still underway that should ultimately lead to a smooth tradeenvironment include the development of the Competition Policy, whichwould play a role in fostering a competitive trade environment.Research work that focuses on identifying the regulatory andadministrative costs of doing business in Botswana by the World BankForeign Investment Advisory Service in conjunction with BIDPA, hasbeen completed and various recommendations on improving thecumbersome regulatory and administrative issues, such as on licensing,work and residence permits, as well as export and import restraints,are being considered by Government. Botswana is also currently inthe process of revising various policies, programmes and regulationsthat act as impediments to trade and development, such as in theDepartment of Customs and Excise which plays a crucial role in trade

139
facilitation. Botswana has streamlined its customs procedures and hasadopted the Automated System for Customs Data (ASYCUDA) system.A total of 14 customs stations (all commercial border posts and 5regional offices) have been computerized, allowing for clearance ofcommercial goods to take a shorter time. A number of other initiativesinclude achieving transparency in customs procedures and attaining areduction in the cumbersome paper work at borders which are stillnot computerized. In August 2005, the Department of Customs andExcise was merged with the Department of Taxes to form the BotswanaUnified Revenue Service as a way of enhancing the collection of taxrevenue and effectiveness of the system and procedures. A pilot projecton the use of a computerized system for goods on transit is alsocurrently in progress.
There are still a number of trade facilitation initiatives that Botswanahas to undertake with regard to the permit systems, restrictions oncapital and financial services in areas such as Animal Health andProduction, health and safety, crop production and forestry and, moreimportantly, on quality standards.
6.9 Barriers to Trade with Other Countries in the Region
Botswana’s trade has largely been with South Africa within the SACUagreement arrangement and, to a significant extent, has reflected
heavy reliance on imports from the South African market. The lack ofa developed industrial sector and formation of sectoral linkages hasacted as a major constraint on Botswana’s trade with other countries.The limited industrial base is a barrier to the ability and capacity of theeconomy to exploit other trade opportunities with other SADCcountries in the region. Botswana’s productive capacity is quite smalland the export profile is quite limited and dominated by diamondexports, which are not exported to SADC countries. The low productivecapacity constrains Botswana from exploiting the benefits of trade inthe region, since it ultimately translates into a lack of supply potential.
Another important barrier on Botswana’s trade capacity is the smalldomestic market which has negative implications for more productiveinvestments that could play a role in enhancing the nation’s tradeprofile with other countries in the region. Research on the business
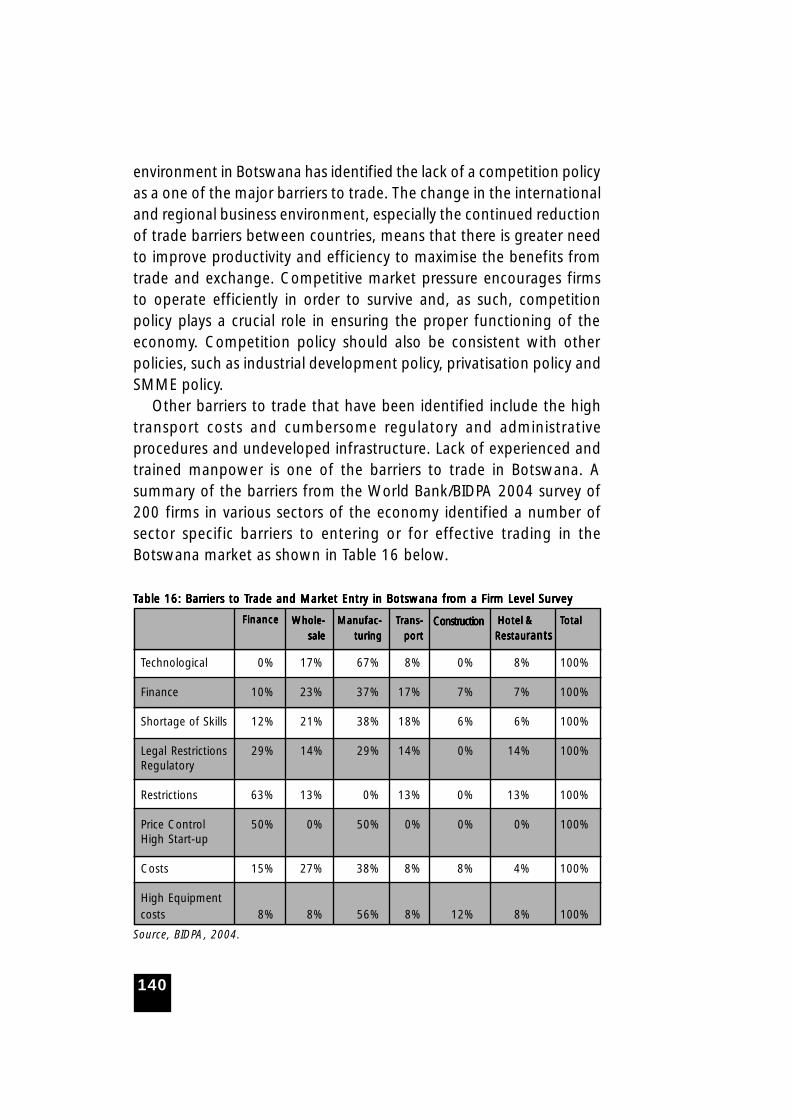
140
environment in Botswana has identified the lack of a competition policyas a one of the major barriers to trade. The change in the internationaland regional business environment, especially the continued reductionof trade barriers between countries, means that there is greater needto improve productivity and efficiency to maximise the benefits fromtrade and exchange. Competitive market pressure encourages firmsto operate efficiently in order to survive and, as such, competitionpolicy plays a crucial role in ensuring the proper functioning of theeconomy. Competition policy should also be consistent with otherpolicies, such as industrial development policy, privatisation policy andSMME policy.
Other barriers to trade that have been identified include the hightransport costs and cumbersome regulatory and administrativeprocedures and undeveloped infrastructure. Lack of experienced andtrained manpower is one of the barriers to trade in Botswana. Asummary of the barriers from the World Bank/BIDPA 2004 survey of200 firms in various sectors of the economy identified a number ofsector specific barriers to entering or for effective trading in theBotswana market as shown in Table 16 below.
TTTTTable 16: Barable 16: Barable 16: Barable 16: Barable 16: Barriers to Triers to Triers to Triers to Triers to Trade and Market Entrrade and Market Entrrade and Market Entrrade and Market Entrrade and Market Entry in Botswana fry in Botswana fry in Botswana fry in Botswana fry in Botswana from a Firom a Firom a Firom a Firom a Firm Level Surm Level Surm Level Surm Level Surm Level Surveyveyveyveyvey
Whole-Whole-Whole-Whole-Whole- Manufac-Manufac-Manufac-Manufac-Manufac- TTTTTrans-rans-rans-rans-rans- Hotel &Hotel &Hotel &Hotel &Hotel & TTTTTotalotalotalotalotal
salesalesalesalesale turingturingturingturingturing portportportportport Restau Restau Restau Restau Restaurantsrantsrantsrantsrants
Technological 0% 17% 67% 8% 0% 8% 100%
Finance 10% 23% 37% 17% 7% 7% 100%
Shortage of Skills 12% 21% 38% 18% 6% 6% 100%
Legal Restrictions 29% 14% 29% 14% 0% 14% 100%Regulatory
Restrictions 63% 13% 0% 13% 0% 13% 100%
Price Control 50% 0% 50% 0% 0% 0% 100%High Start-up
Costs 15% 27% 38% 8% 8% 4% 100%
High Equipment costs 8% 8% 56% 8% 12% 8% 100%
Source, BIDPA, 2004.
FinanceFinanceFinanceFinanceFinance ConstructionConstructionConstructionConstructionConstruction
141
Table 15 shows that prevailing regulatory and legal restrictions,shortage of skills and inadequate infrastructure and the high costs ofdoing business are among the major barriers to trade in the economy.In this regard, these barriers affect Botswana is potential on trade byfirst deterring trade in the domestic market which can ultimately be agrowth engine to trade with other countries with a varied range ofproducts from more market entrants.
There are however, efforts that need to be acknowledged on thepart of the government to address the barriers highlighted above. Ofparticular importance is the national development planning processwhich emphasizes the need to promote other industries besides miningso that they can contribute to Botswana’s trade. The development ofthe competition policy legislation is currently on going as well as thenational export strategy policy. Other important research work aimedat enhancing Botswana’s trade is the investment on research thatidentifies possible trade opportunities that Botswana can venture into.
6.10 Implications of Membership Overlaps
There are a number of challenges that Botswana faces as a result ofthe changes that have occurred on its external trading environment.The global trading environment has changed dramatically since the1980s with proliferation of regional trading arrangements, theincreased role of the World Trade Organisation (WTO) and IMF/WorldBank imposed structural adjustment programs that have acceleratedthe process of opening developing countries’ domestic markets toimports and reducing tariffs. In the context of Botswana and Botswana’smembership to regional and multilateral trading organisations thecountry is required to negotiate and implement six trading agreementssimultaneously as summarized in Table 17 below. The impacts of thenegotiations on the macroeconomic fabric of the economy and theextent of overlaps are also indicated in the table. It is envisaged thatthe agreements will reduce the prices of imported raw materials andother imported goods, and may have other longer-term benefits thatwill benefit Botswana. Also, there would be negative impacts that will
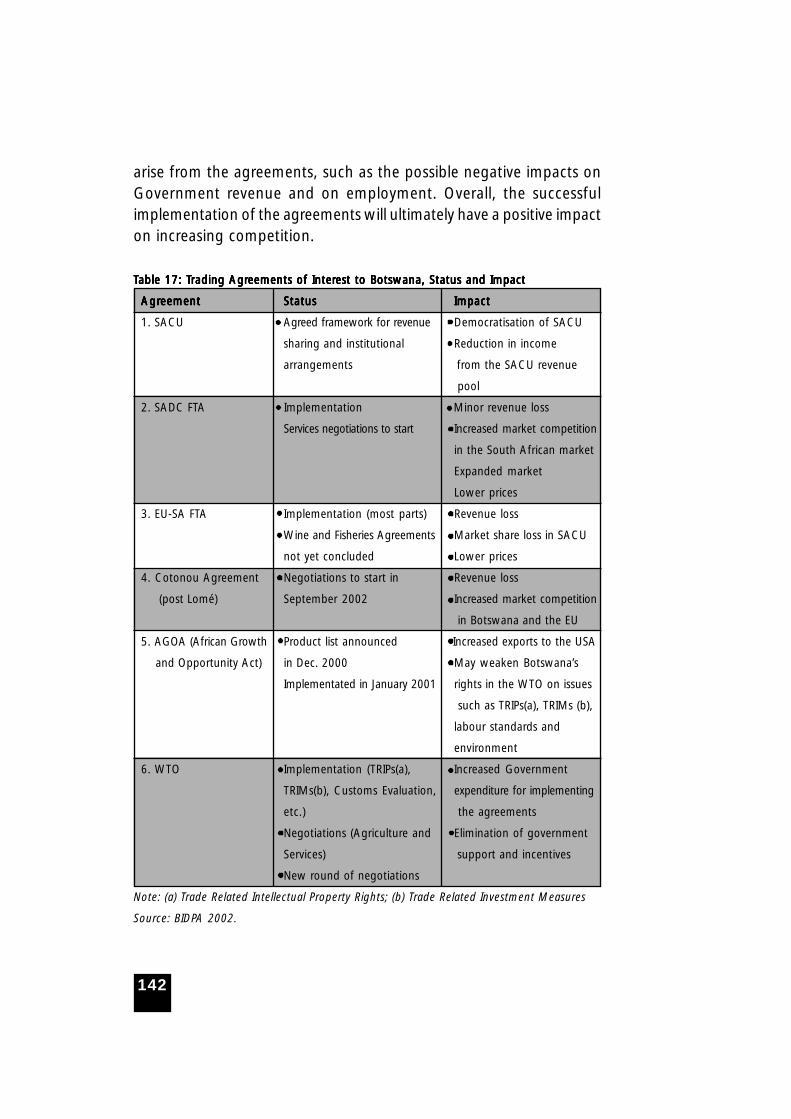
142
arise from the agreements, such as the possible negative impacts onGovernment revenue and on employment. Overall, the successfulimplementation of the agreements will ultimately have a positive impacton increasing competition.
TTTTTable 17: Table 17: Table 17: Table 17: Table 17: Trading Agrrading Agrrading Agrrading Agrrading Agreements of Intereements of Intereements of Intereements of Intereements of Interest to Botswana, Status and Impactest to Botswana, Status and Impactest to Botswana, Status and Impactest to Botswana, Status and Impactest to Botswana, Status and Impact
AgrAgrAgrAgrAgreementeementeementeementeement StatusStatusStatusStatusStatus ImpactImpactImpactImpactImpact
1. SACU Agreed framework for revenue Democratisation of SACU
sharing and institutional Reduction in income
arrangements from the SACU revenue
pool
2. SADC FTA Implementation Minor revenue loss
Services negotiations to start Increased market competition
in the South African market
Expanded market
Lower prices
3. EU-SA FTA Implementation (most parts) Revenue loss
Wine and Fisheries Agreements Market share loss in SACU
not yet concluded Lower prices
4. Cotonou Agreement Negotiations to start in Revenue loss
(post Lomé) September 2002 Increased market competition
in Botswana and the EU
5. AGOA (African Growth Product list announced Increased exports to the USA
and Opportunity Act) in Dec. 2000 May weaken Botswana’s
Implementated in January 2001 rights in the WTO on issues
such as TRIPs(a), TRIMs (b),
labour standards and
environment
6. WTO Implementation (TRIPs(a), Increased Government
TRIMs(b), Customs Evaluation, expenditure for implementing
etc.) the agreements
Negotiations (Agriculture and Elimination of government
Services) support and incentives
New round of negotiations
Note: (a) Trade Related Intellectual Property Rights; (b) Trade Related Investment Measures
Source: BIDPA 2002.
143
As demonstrated above, Botswana is involved in trade negotiations ata number of levels. These include the EU-ACP Cotonou Agreement,SADC, SACU, including the SACU-US FTA and the Doha DevelopmentAgenda. The overlapping negotiating agenda entails a need to developand coordinate negotiating positions. Since negotiations are often ameans of strengthening and “locking in” domestic reforms, capacitybuilding should focus on formulating negotiating positions andstrategies that are anchored in the domestic reform process.
In relation to multilateral trade negotiations under the DohaDevelopment Agenda, the Government has highlighted services asbeing a key area for technical assistance and capacity building. Threepriority areas for Botswana are financial services, telecommunicationsand tourism, which have been identified as having a key role inBotswana’s economic diversification. Assistance is, therefore, neededto craft offers that are integrated, and to reinforce the Government’sstrategy in these three sub-sectors in the regional integration andnegotiation process involved in the various agreements, which can bequite difficult without the right capacity and expertise.
In the process of harmonizing trade agreements, participating inthe various trade agreements and building the necessary capacity andexpertise required in trade negotiations, Botswana incurs high costsfor negotiations by being a member of overlapping agreements. Thereare also the costs of time and resource allocations that occur whenbalancing issues where the agreements are in conflict. This has beennotable for Botswana when South Africa was negotiating the EU-South Africa FTA which Botswana and the other smaller SACU membersended up being de-facto members of the agreement since they weremembers of SACU. The BLNS suffered revenue losses and the costs ofadjustments to the new trading relationships, as well as the additionalcompetition that their industries would have to face from EU productsthat would now compete with their products. This shows that resultsof overlaps in membership in various trade agreements may havesignificant resulting in adverse effects on industrial development,competition and growth of industries implications in the regionalintegration of other countries if they not conducted effectively.
A common result of overlapping membership is conflictingliberalization obligations and requirements in various agreements which
144
can be complex to handle but that a country has to fulfil; for example,in the case of Botswana, where there are liberalisation requirementsand schedules under the SADC and Cotonou agreements, as well asthe obligations set out under the SACU agreement that have to bemet by being a member.
6.11 Botswana’s Labour Market Policy Framework
Botswana’s labour market has been guided by a number of policiesmainly emanating from the 1972 Incomes Policy. In the initial stages
of the development of the economy, the market was not allowed toplay a major role in the determination of earnings, as almost all formalsector wages and salary earnings were determined by Governmentthrough a consultative process. The private and parastatal sector’swages and salaries were tied job to job to the public sector, and thesesectors were expected to practice voluntary restraint in terms of wageincreases. The incomes policy was revised in 1990, on the basis of thecountry’s changed economic conditions compared to the 1970’s. Asan outcome of that revision, the new incomes policy had, as its majorchange, the freeing of private sector wages from being tied toGovernment pay structure. The only remaining Governmentintervention for the private sector was the maintenance of minimumwages, which is still applicable. The parastatal sector pay structurewas still to be tied to Government in terms of the upper and lowerbounds. In between these limits, parastatals were allowed to determinetheir own pay structure. The revised incomes policy of 1990 wasreviewed in 2002/2003 and, if most of the recommendations are takenon board, there will be further liberalisation of the labour market.Among the major recommendations are the need to allow parastatalpay to be determined by productivity and to no longer be pegged thewages and salaries of Government as per the current incomes policy.
As part of the incomes policy, a number of institutions weredeveloped as part of the tripartite system to bring together workers,employers and Government. Some of these institutions are: theNational Employment, Manpower and Incomes Council (NEMIC), theWages Policy Committee (WPC) and the Minimum Wages AdvisoryBoard. NEMIC’s terms of reference include monitoring and periodically
145
making recommendations concerning the general levels of Governmentwages, taking into account the wider impact on employment creation.In addition to NEMIC and in keeping with the undertaking to reviewpublic sector wages and salaries periodically, government has reviewedpublic sector wages and salaries through a series of Salary ReviewCommissions.
The impact of these salaries reviews commissions on Botswana’sindustrial relations scene have been far reaching. In formulating thewages policy, Government undertook to review the wage and salarysituation regularly, whilst at the same time cautioning the private sectornot to anticipate the outcome of such commissions. This meant thatthe private sector have to wait for the recommendations of the salariesreview commission before they could review their own wages andsalaries. It was only after the Government had released its White Paperon the agreed changes in the level of public sector wages that theprivate sector had responded, adopting the same percentage withlittle or no consultation with the workers’ organisations (Mogalakwe1997). Since pay increases were not a result of either productivity ornegotiations between the employers and the employees, collectivebargaining was not done. It was only at the beginning of the 1990sthat the labour market was deregulated; and it is only now thatcollective bargaining is being institutionalised. As a result there is still alot of mistrust between employers and employees, a mistrust that iscompounded by the absence of a requirement on the part of theemployer to disclose to the workers, information relevant to collectivebargaining. This is notwithstanding the fact that Section 50 of theTrade Unions and Employers Act compels an employer to recognise alegally registered trade union as a bargaining partner.
In December 1997, Botswana ratified ILO Convention No. 87 whichconcerns Freedom of Association and Protection of the Right toOrganise; Convention No. 98 concerns the Right to Organise andCollective Bargaining and Convention No. 151 on the Protection ofthe Right to Organise and the Procedures for Determining Conditionsof Employment in the Public service. However, for workers in the publicsector to start organising, the government has to amend those aspectsof the national laws that curtail the rights and freedoms of publicsector workers to give effect to the spirit of Convention No. 151. The
146
necessary amendments to law have been taken to parliament and theprocess of turning public service associations into unions is still at anegotiating level. In the meantime, wages and terms of conditions ofservice continue to be dealt with through consultative bodies and thereis a complete lack of collective bargaining in the public sector. Labourunions in Botswana are still very weak compared to others in the region.The positive outcome of weak labour unions has been more stableindustrial relations with few industrial strikes. That should have servedto attract more foreign direct investment, but it has not. Firms stillprefer to locate in South Africa despite the militant labour movementand, frequent strikes.
The effectiveness of the tripartite structures of industrial relations isfurther undermined by the fact that all of them are advisory. That isto say that, although the structures are comprised of the representativesof all the social partners, it is the Ministers that make final decisions.Tripartite structures can only make recommendations to variousministries. The tripartite structures are, therefore, consultative bodiesand not negotiating bodies. The difference between consultation andnegotiation is an important one. Consultation refers to a processwhere one party (or partner) seeks the views of the other parties, butretains the right to decide the final outcome without subjecting it tojoint agreement with the other parties (Salamon, 1987: 243). On theother hand, negotiation refers to a process whereby parties (or partners)come together in the spirit of collective bargaining, in order to resolvetheir differences and reach an agreement (ibid). In Botswana, thetripartite structures operate in such a way that they are forums toarticulate views of the two main stakeholders, namely, the employersand employees, so that Government, in making a decision, is awareof the views and expectations of the two partners. In other words,the tripartite structure debates issues and generates useful informationto enable Government to make informed decisions, but it isGovernment that makes final decisions. Although the tripartitestructures are in place, it seems that there is still room for improvement.
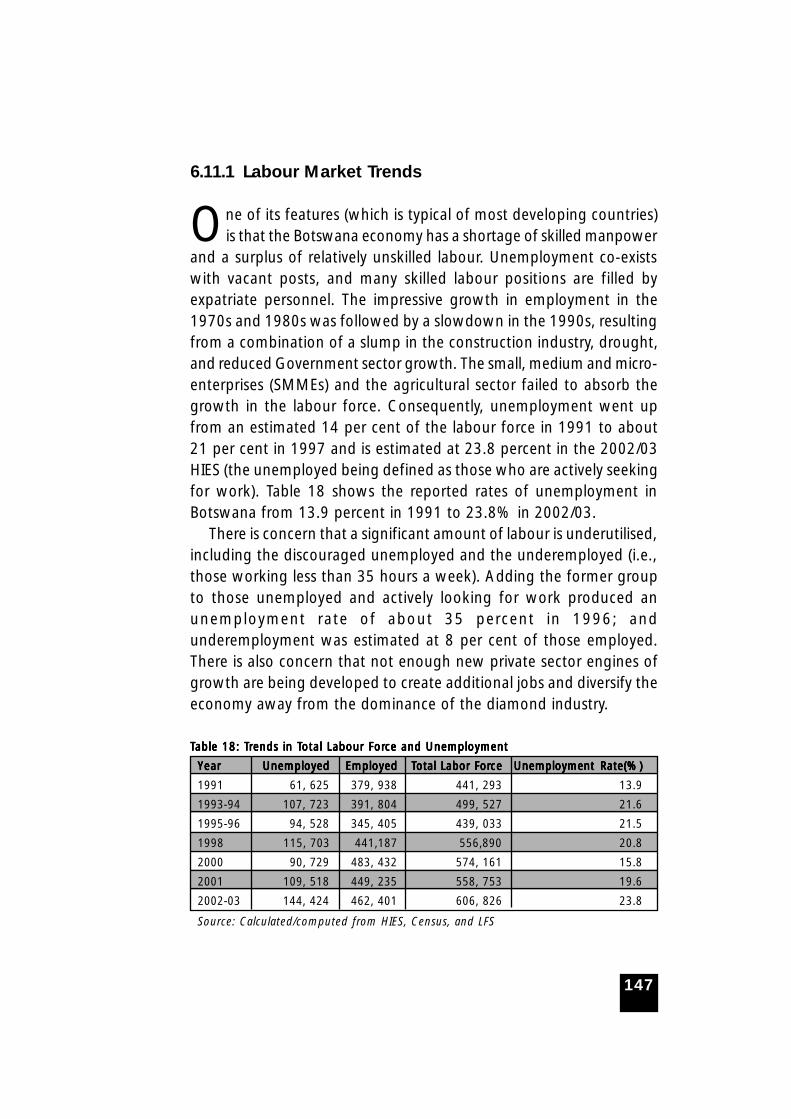
147
6.11.1 Labour Market Trends
One of its features (which is typical of most developing countries)is that the Botswana economy has a shortage of skilled manpower
and a surplus of relatively unskilled labour. Unemployment co-existswith vacant posts, and many skilled labour positions are filled byexpatriate personnel. The impressive growth in employment in the1970s and 1980s was followed by a slowdown in the 1990s, resultingfrom a combination of a slump in the construction industry, drought,and reduced Government sector growth. The small, medium and micro-enterprises (SMMEs) and the agricultural sector failed to absorb thegrowth in the labour force. Consequently, unemployment went upfrom an estimated 14 per cent of the labour force in 1991 to about21 per cent in 1997 and is estimated at 23.8 percent in the 2002/03HIES (the unemployed being defined as those who are actively seekingfor work). Table 18 shows the reported rates of unemployment inBotswana from 13.9 percent in 1991 to 23.8% in 2002/03.
There is concern that a significant amount of labour is underutilised,including the discouraged unemployed and the underemployed (i.e.,those working less than 35 hours a week). Adding the former groupto those unemployed and actively looking for work produced anunemployment rate of about 35 percent in 1996; andunderemployment was estimated at 8 per cent of those employed.There is also concern that not enough new private sector engines ofgrowth are being developed to create additional jobs and diversify theeconomy away from the dominance of the diamond industry.
TTTTTable 18: Table 18: Table 18: Table 18: Table 18: Trrrrrends in Tends in Tends in Tends in Tends in Total Labour Forotal Labour Forotal Labour Forotal Labour Forotal Labour Force and Unemploymentce and Unemploymentce and Unemploymentce and Unemploymentce and Unemployment
YYYYYearearearearear UnemployedUnemployedUnemployedUnemployedUnemployed EmployedEmployedEmployedEmployedEmployed TTTTTotal Labor Forotal Labor Forotal Labor Forotal Labor Forotal Labor Forcecececece Unemployment Rate(%)Unemployment Rate(%)Unemployment Rate(%)Unemployment Rate(%)Unemployment Rate(%)
1991 61, 625 379, 938 441, 293 13.9
1993-94 107, 723 391, 804 499, 527 21.6
1995-96 94, 528 345, 405 439, 033 21.5
1998 115, 703 441,187 556,890 20.8
2000 90, 729 483, 432 574, 161 15.8
2001 109, 518 449, 235 558, 753 19.6
2002-03 144, 424 462, 401 606, 826 23.8
Source: Calculated/computed from HIES, Census, and LFS
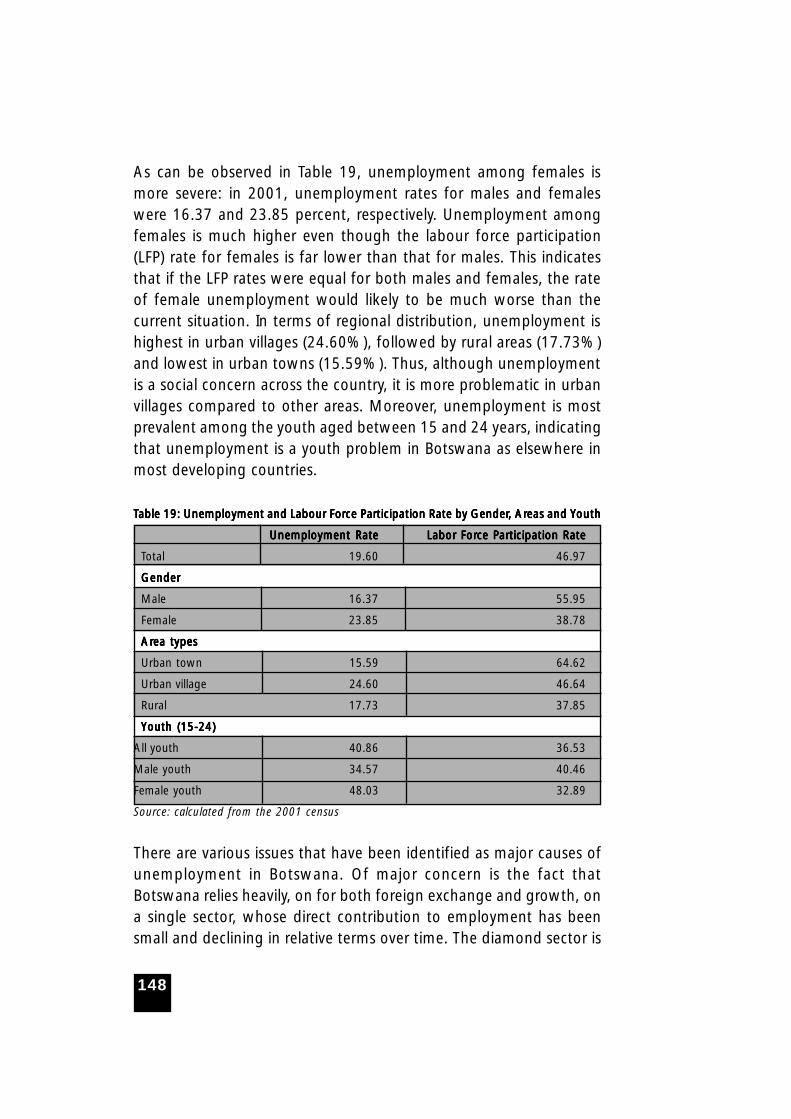
148
As can be observed in Table 19, unemployment among females ismore severe: in 2001, unemployment rates for males and femaleswere 16.37 and 23.85 percent, respectively. Unemployment amongfemales is much higher even though the labour force participation(LFP) rate for females is far lower than that for males. This indicatesthat if the LFP rates were equal for both males and females, the rateof female unemployment would likely to be much worse than thecurrent situation. In terms of regional distribution, unemployment ishighest in urban villages (24.60%), followed by rural areas (17.73%)and lowest in urban towns (15.59%). Thus, although unemploymentis a social concern across the country, it is more problematic in urbanvillages compared to other areas. Moreover, unemployment is mostprevalent among the youth aged between 15 and 24 years, indicatingthat unemployment is a youth problem in Botswana as elsewhere inmost developing countries.
TTTTTable 19: Unemployment and Labour Forable 19: Unemployment and Labour Forable 19: Unemployment and Labour Forable 19: Unemployment and Labour Forable 19: Unemployment and Labour Force Parce Parce Parce Parce Participation Rate by Genderticipation Rate by Genderticipation Rate by Genderticipation Rate by Genderticipation Rate by Gender, Ar, Ar, Ar, Ar, Areas and Yeas and Yeas and Yeas and Yeas and Youthouthouthouthouth
Unemployment RateUnemployment RateUnemployment RateUnemployment RateUnemployment Rate Labor ForLabor ForLabor ForLabor ForLabor Force Parce Parce Parce Parce Participation Rateticipation Rateticipation Rateticipation Rateticipation Rate
Total 19.60 46.97
GenderGenderGenderGenderGender
Male 16.37 55.95
Female 23.85 38.78
ArArArArArea typesea typesea typesea typesea types
Urban town 15.59 64.62
Urban village 24.60 46.64
Rural 17.73 37.85
YYYYYouth (15-24)outh (15-24)outh (15-24)outh (15-24)outh (15-24)
All youth 40.86 36.53
Male youth 34.57 40.46
Female youth 48.03 32.89
Source: calculated from the 2001 census
There are various issues that have been identified as major causes ofunemployment in Botswana. Of major concern is the fact thatBotswana relies heavily, on for both foreign exchange and growth, ona single sector, whose direct contribution to employment has beensmall and declining in relative terms over time. The diamond sector is
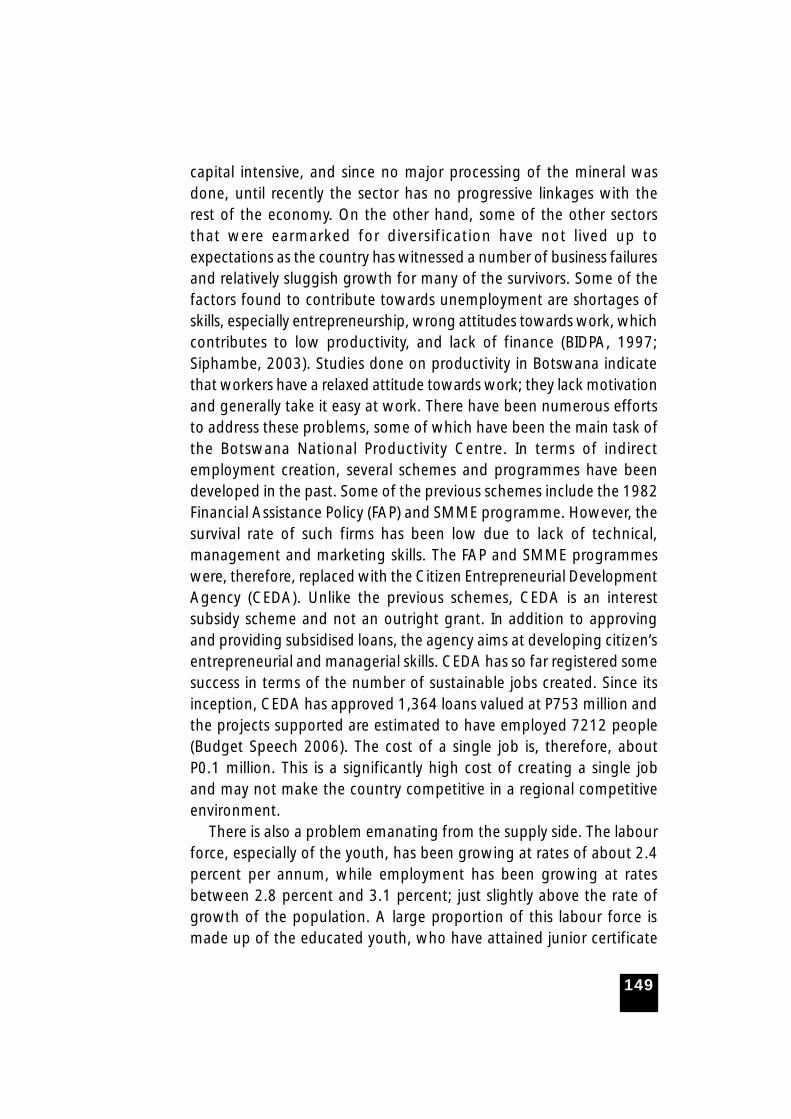
149
capital intensive, and since no major processing of the mineral wasdone, until recently the sector has no progressive linkages with therest of the economy. On the other hand, some of the other sectorsthat were earmarked for diversification have not lived up toexpectations as the country has witnessed a number of business failuresand relatively sluggish growth for many of the survivors. Some of thefactors found to contribute towards unemployment are shortages ofskills, especially entrepreneurship, wrong attitudes towards work, whichcontributes to low productivity, and lack of finance (BIDPA, 1997;Siphambe, 2003). Studies done on productivity in Botswana indicatethat workers have a relaxed attitude towards work; they lack motivationand generally take it easy at work. There have been numerous effortsto address these problems, some of which have been the main task ofthe Botswana National Productivity Centre. In terms of indirectemployment creation, several schemes and programmes have beendeveloped in the past. Some of the previous schemes include the 1982Financial Assistance Policy (FAP) and SMME programme. However, thesurvival rate of such firms has been low due to lack of technical,management and marketing skills. The FAP and SMME programmeswere, therefore, replaced with the Citizen Entrepreneurial DevelopmentAgency (CEDA). Unlike the previous schemes, CEDA is an interestsubsidy scheme and not an outright grant. In addition to approvingand providing subsidised loans, the agency aims at developing citizen’sentrepreneurial and managerial skills. CEDA has so far registered somesuccess in terms of the number of sustainable jobs created. Since itsinception, CEDA has approved 1,364 loans valued at P753 million andthe projects supported are estimated to have employed 7212 people(Budget Speech 2006). The cost of a single job is, therefore, aboutP0.1 million. This is a significantly high cost of creating a single joband may not make the country competitive in a regional competitiveenvironment.
There is also a problem emanating from the supply side. The labourforce, especially of the youth, has been growing at rates of about 2.4percent per annum, while employment has been growing at ratesbetween 2.8 percent and 3.1 percent; just slightly above the rate ofgrowth of the population. A large proportion of this labour force ismade up of the educated youth, who have attained junior certificate
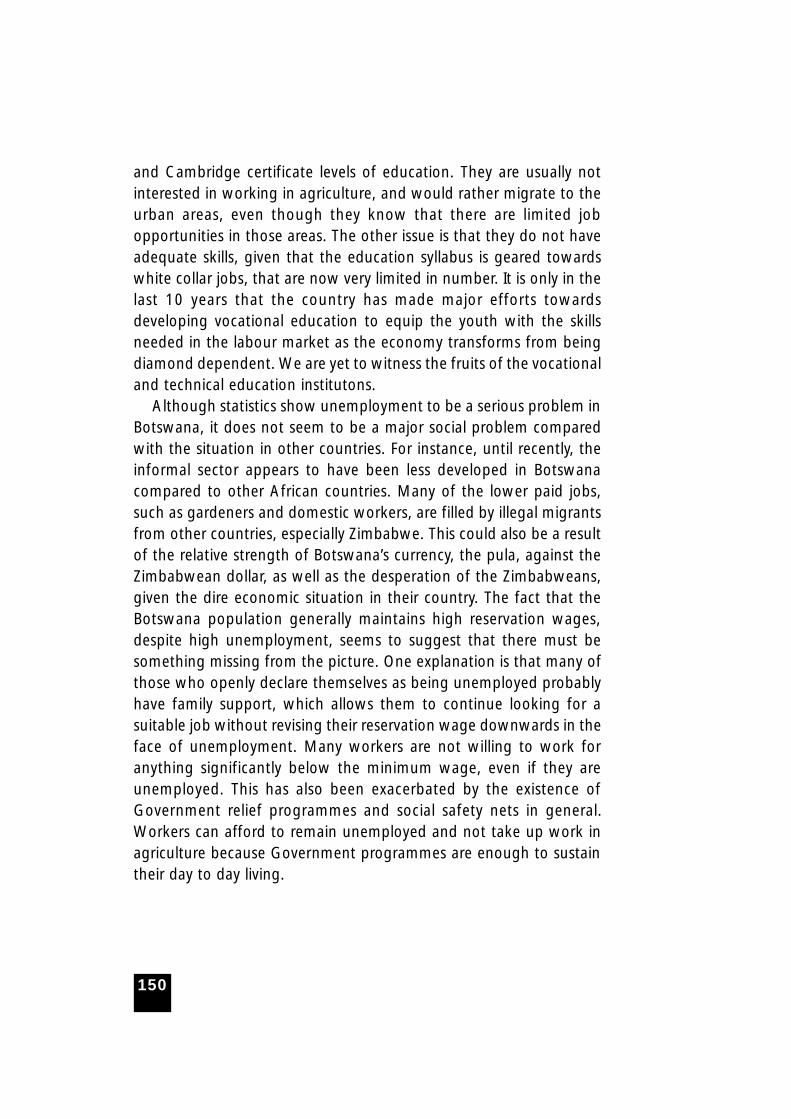
150
and Cambridge certificate levels of education. They are usually notinterested in working in agriculture, and would rather migrate to theurban areas, even though they know that there are limited jobopportunities in those areas. The other issue is that they do not haveadequate skills, given that the education syllabus is geared towardswhite collar jobs, that are now very limited in number. It is only in thelast 10 years that the country has made major efforts towardsdeveloping vocational education to equip the youth with the skillsneeded in the labour market as the economy transforms from beingdiamond dependent. We are yet to witness the fruits of the vocationaland technical education institutons.
Although statistics show unemployment to be a serious problem inBotswana, it does not seem to be a major social problem comparedwith the situation in other countries. For instance, until recently, theinformal sector appears to have been less developed in Botswanacompared to other African countries. Many of the lower paid jobs,such as gardeners and domestic workers, are filled by illegal migrantsfrom other countries, especially Zimbabwe. This could also be a resultof the relative strength of Botswana’s currency, the pula, against theZimbabwean dollar, as well as the desperation of the Zimbabweans,given the dire economic situation in their country. The fact that theBotswana population generally maintains high reservation wages,despite high unemployment, seems to suggest that there must besomething missing from the picture. One explanation is that many ofthose who openly declare themselves as being unemployed probablyhave family support, which allows them to continue looking for asuitable job without revising their reservation wage downwards in theface of unemployment. Many workers are not willing to work foranything significantly below the minimum wage, even if they areunemployed. This has also been exacerbated by the existence ofGovernment relief programmes and social safety nets in general.Workers can afford to remain unemployed and not take up work inagriculture because Government programmes are enough to sustaintheir day to day living.

151
6.11.2 Labour Market Policy Issues for Deepening SADCIntegration
A major issue in Botswana’s economy is the lack of absorption of agrowing young labour force into the labour market. From a
demand side, one could increase labour absorption through increasingthe demand for the product produced by labour. Deepening SADCintegration has the potential to increase the market for goods andservices produced in Botswana, especially given the small market thatBotswana currently provides with a population of just 1.8 million. Asecond way of increasing labour absorption is through increasing thenumber of firms operating in Botswana. Government is currentlypushing that objective through the provision of an enablingenvironment (good macroeconomic policies, including stable and lowinflation, tight fiscal policy, competitive exchange rate, etc.) and throughprogrammes such as CEDA. To complement this effort, BEDIA hasbeen endeavouring to attract FDI into the country so as to boostemployment and non-mineral output in the economy. An additionaleffort aimed at increasing labour absorption is through initiatives toincrease productivity of labour. Efforts are ongoing in Governmentand the private sector to implement programmes that are gearedtowards increasing labour productivity. Some of the major effortsinclude the introduction of Performance Management Systems (PMS),which will ultimately lead to Performance Based Pay. It is recognisedthat the long term success of the Botswana economy in competingregionally, especially with the deepening of integration of theeconomies, will lie in its ability to raise labour’s productivity. Suchproductivity improvements may also result from education and trainingin skills that are necessary for the diversification of the economy. Butthere will also be need to ensure that the labour market incentives areright and in line with the need to enhance productivity of the workforce.To complement the other macroeconomic policies that the countryhas already put in place, there will be a need to also strengthen labouras one of the social partners so as to get the maximum cooperationand output from it. There is therefore a need to speed up the processof labour reforms, including the promulgation of laws that have beentaken through parliament. In terms of labour market policies geared

152
towards meeting the SADC target growth rates, there is an urgentneed to speed up the reforms needed to improve productivity of labourin order to make the country more competitive.
6.12 Causes of Inadequate Income Growth
Botswana’s growth has been heavily dependent on the performanceof the diamond sector. The non-mining sector has generally grown
at rates which are lower than those envisaged for attaining both theMillennium Development Goals and the country’s Vision 2016. Someof the major explanations for the inadequate growth of the economyare: poor performance of the private sector; low productivity in general;lack of business entrepreneurship; inability to attract adequate foreigndirect investment due to certain impediments like high utility costs;small market, etc. These are the general problems and concernscaptured in the main studies investigating the problems associatedwith the lack of economic diversification. There is an urgent need toaddress these problems if the SADC convergence goals are to be metin a timely manner.
6.13 Major Risks for Attaining the MacroeconomicConvergence Programme
Botswana’s heavy dependence on minerals, especially diamonds,dominates the country’s projected outcomes with respect to
achieving and maintaining compliance with the macroeconomicconvergence targets. Diamonds are sold in international markets whichdetermine the price and demand for Botswana’s diamonds. It is forthis reason that Botswana still remains vulnerable to external shocksand large fluctuations in the growth of GDP. Other variables such asthe growth in the economy’s revenues and its budget and foreignexchange reserves have also to a large extent been determined by theperformance of the mining sector. The macroeconomic convergenceprogramme for Botswana as such will be heavily influenced bydevelopments in the mining sector. There are efforts underway in theform of accelerating the diversification process to promote growth ofother sectors so that the vulnerability and sensitivity of the country is
153
reduced as other sectors play a more important role in Botswana’sperformance. While Botswana has been mainly on the right track interms of achieving the SADC macroeconomic convergence targets,the positive progress made in maintaining a sound budget, low debt,high GDP and per capita growth as well as in achieving progress onhuman development indicators has depended mainly on theperformance of one sector. As such, Botswana’s macroeconomicconvergence programme is quite sensitive since changes in many ofthe other variables are highly aligned to the mining sector’sperformance.
The sound and prudent economic policies on the fiscal and monetarypolicy front have also allowed the country to maintain spendingpatterns that would not result in high debts, deficits and high inflationrates that would ultimately result in authorities missing their targetsand having the key indicators at unmanageable levels. It is within thisframework that it is reasonable to assume that Botswana will continuemanaging its resources prudently, and that the macroeconomicconvergence programme targets will be achieved.

154
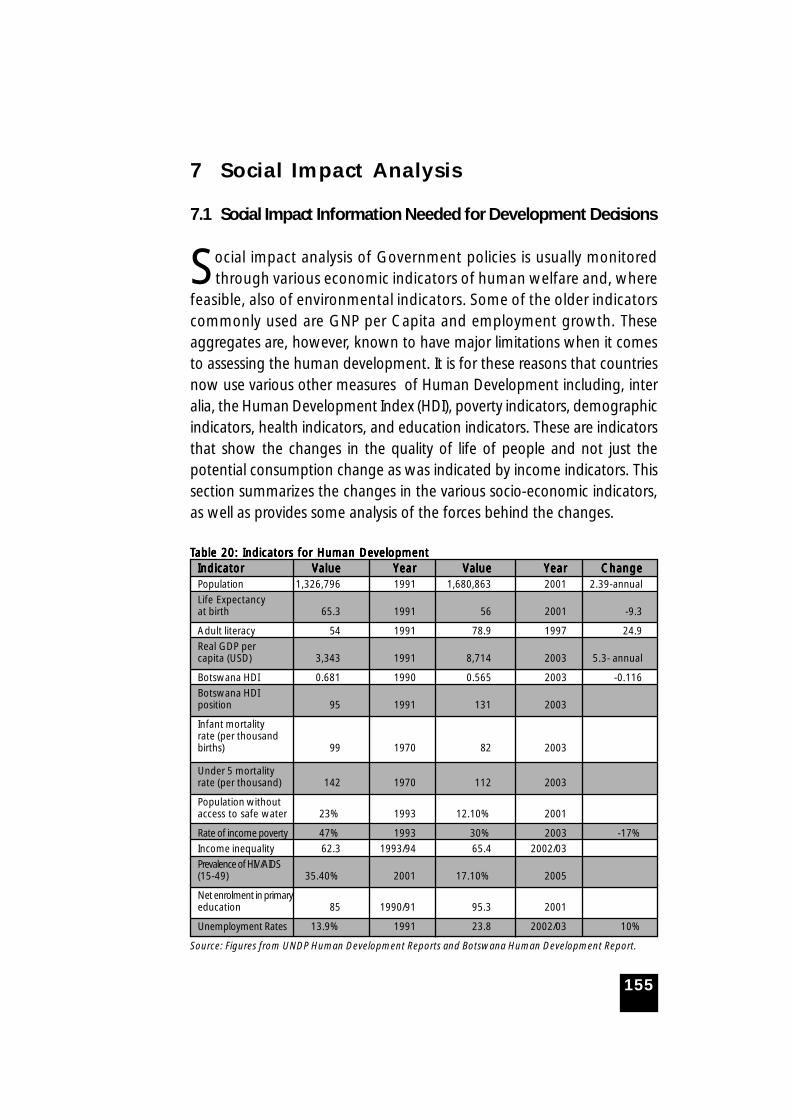
155
7 Social Impact Analysis
7.1 Social Impact Information Needed for Development Decisions
Social impact analysis of Government policies is usually monitoredthrough various economic indicators of human welfare and, where
feasible, also of environmental indicators. Some of the older indicatorscommonly used are GNP per Capita and employment growth. Theseaggregates are, however, known to have major limitations when it comesto assessing the human development. It is for these reasons that countriesnow use various other measures of Human Development including, interalia, the Human Development Index (HDI), poverty indicators, demographicindicators, health indicators, and education indicators. These are indicatorsthat show the changes in the quality of life of people and not just thepotential consumption change as was indicated by income indicators. Thissection summarizes the changes in the various socio-economic indicators,as well as provides some analysis of the forces behind the changes.
TTTTTable 20: Indicators for Human Developmentable 20: Indicators for Human Developmentable 20: Indicators for Human Developmentable 20: Indicators for Human Developmentable 20: Indicators for Human DevelopmentIndicatorIndicatorIndicatorIndicatorIndicator VVVVValuealuealuealuealue YYYYYearearearearear VVVVValuealuealuealuealue YYYYYearearearearear ChangeChangeChangeChangeChangePopulation 1,326,796 1991 1,680,863 2001 2.39-annual
Life Expectancyat birth 65.3 1991 56 2001 -9.3
Adult literacy 54 1991 78.9 1997 24.9
Real GDP percapita (USD) 3,343 1991 8,714 2003 5.3- annual
Botswana HDI 0.681 1990 0.565 2003 -0.116
Botswana HDIposition 95 1991 131 2003
Infant mortalityrate (per thousandbirths) 99 1970 82 2003
Under 5 mortalityrate (per thousand) 142 1970 112 2003
Population withoutaccess to safe water 23% 1993 12.10% 2001
Rate of income poverty 47% 1993 30% 2003 -17%
Income inequality 62.3 1993/94 65.4 2002/03
Prevalence of HIV/AIDS(15-49) 35.40% 2001 17.10% 2005
Net enrolment in primaryeducation 85 1990/91 95.3 2001
Unemployment Rates 13.9% 1991 23.8 2002/03 10%
Source: Figures from UNDP Human Development Reports and Botswana Human Development Report.
156
GNP per capita
Botswana has recorded impressive growth rates over time, even thoughthe growth rates in the late 90s and new millennium are lower at about5 percent per annum. The growth was mainly from mining, especiallydiamond mining. The non-mining sector has been growing at lowerrates than those anticipated, posing a serious challenge for the economyin terms of its ability to diversify its growth from diamonds. The overallgrowth has also been lower than the anticipated 7 percent needed forthe fulfilment of the MDGs and the 8 percent required for fulfilling theVision 2016 goals. The current (2004/05) period recorded an impressivegrowth of 8.3 in real terms compared to 2003/04. The mining sectorgrew by 18.2 percent, while the non-mining sector grew by only 1.9percent during the 2004/05. The challenge to achieving sustainablehuman development is about achieving economic diversification beyondthe mineral sector, especially since that sector is capital intensive.
Employment and Unemployment
Due to the capital intensive nature of the mining industry and the inabilityto substantially diversify the economy substantially from it, Botswanahas had serious unemployment problems. Unemployment has generallybeen rising, and was estimated at 23.8 percent in 2003, which was anincrease of about 10 percent from the 13.9 percent figure recorded 12years earlier. The unemployment rate is higher for youths with secondaryeducation. Given the lack of diversification and the increase in labourforce over time, it is likely that the unemployment rate may have increasedsince the last survey in 2002/03. The country, therefore, has a majorchallenge of fostering growth that is employment intensive.
Poverty
The incidence of absolute poverty has been declining over the past 20years, and is now estimated at about 30 percent of the population,which a fall of 17 percent from 1993/94, when it was 47 percent.There are, however, concerns that the incidence of poverty is notdeclining at an rate, especially in terms of meeting the Vision 2016
157
goal of eradicating poverty by 2016. The year 2016 is not too far off,and yet, the poverty rate is still as high as 30 percent. There is, therefore,a big challenge of not only making the country’s growth employmentintensive, but also making it pro-poor. There are indications that thegrowth of the economy between 1993 and 2003 was not very pro-poor, as the gini coefficient rose slightly over the period.
Access to Education and Other Services
Botswana’s prudent use of the diamond revenue has served to greatlyincrease access to education and other public services, including waterand health. The country has invested heavily into the development ofthe health and education sectors. Were it not for the HIV/AIDSpandemic, the country would have recorded substantial returns tothe large investments. The Ministries of Education and LocalGovernment (primary education falls under local government) havecontinued to get the lion’s share of both the development and recurrentbudgets. As a result, the net enrolment rate for primary educationincreased from 85 percent in 1990 to 95.3 percent in 2001. Adultliteracy also increased from 54 percent in 1991 to 79 percent in 1997.Enrolment in all levels of education is almost 50 percent male and 50percent female. The percent of the population without access to safewater also declined from 23% in 1993 to 12.1 percent in 2001.
Health and HIV/AIDS
As a result of large investments in the health sector over the 25 yearsof her independence, Botswana was able to reap good returns in termsof improved life expectancy and reduced mortality rates. Life expectancyrose from a low of 55.5 in 1971, reaching a high of 67 years in 1999,before beginning to decline to 56 in 2001. The decline was mainlydue to the HIV/AIDS pandemic. Mortality rates for many age cohortswere, however, still declining despite the HIV/AIDS pandemic. The HIV/AIDS prevalence rate was quite high in earlier periods, estimated atabout 35% and has now stabilized at about 17 percent5 . Part of the
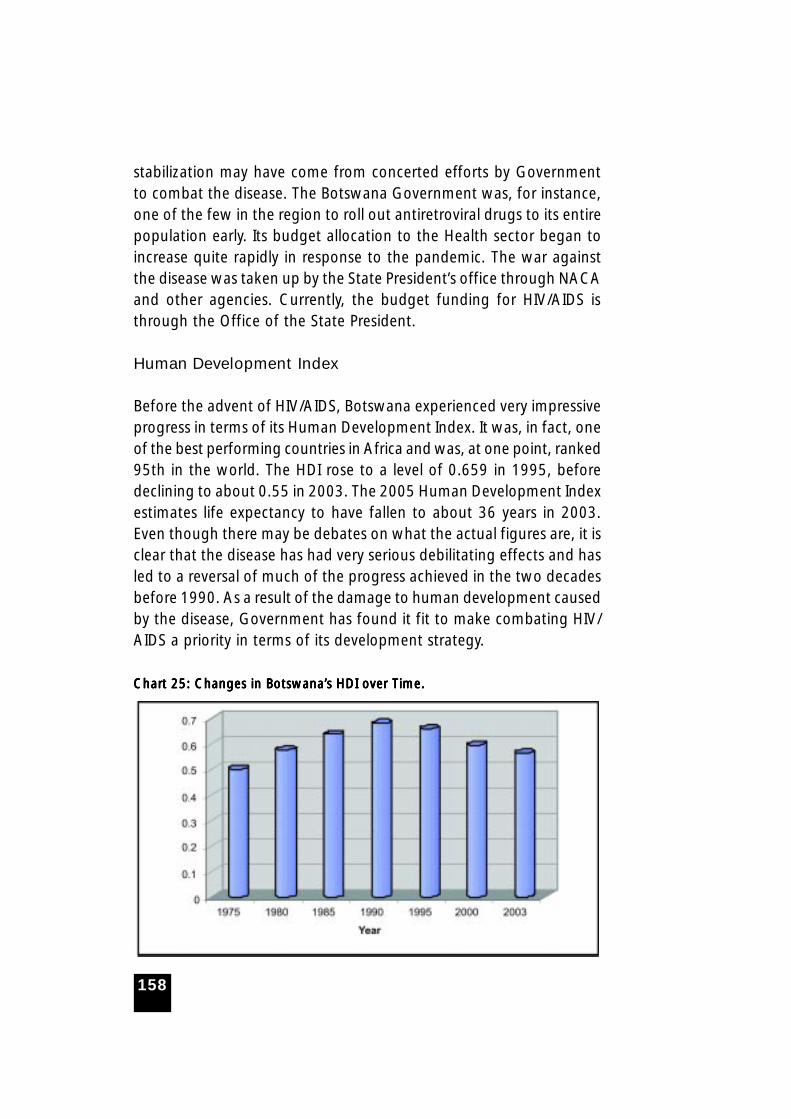
158
stabilization may have come from concerted efforts by Governmentto combat the disease. The Botswana Government was, for instance,one of the few in the region to roll out antiretroviral drugs to its entirepopulation early. Its budget allocation to the Health sector began toincrease quite rapidly in response to the pandemic. The war againstthe disease was taken up by the State President’s office through NACAand other agencies. Currently, the budget funding for HIV/AIDS isthrough the Office of the State President.
Human Development Index
Before the advent of HIV/AIDS, Botswana experienced very impressiveprogress in terms of its Human Development Index. It was, in fact, oneof the best performing countries in Africa and was, at one point, ranked95th in the world. The HDI rose to a level of 0.659 in 1995, beforedeclining to about 0.55 in 2003. The 2005 Human Development Indexestimates life expectancy to have fallen to about 36 years in 2003.Even though there may be debates on what the actual figures are, it isclear that the disease has had very serious debilitating effects and hasled to a reversal of much of the progress achieved in the two decadesbefore 1990. As a result of the damage to human development causedby the disease, Government has found it fit to make combating HIV/AIDS a priority in terms of its development strategy.
CharCharCharCharChart 25: Changes in Botswana’t 25: Changes in Botswana’t 25: Changes in Botswana’t 25: Changes in Botswana’t 25: Changes in Botswana’s HDI over Ts HDI over Ts HDI over Ts HDI over Ts HDI over Time.ime.ime.ime.ime.
159
7.2 Likely Changes Induced by MacroeconomicConvergence Policies
As noted in other sections of this paper, except in respect tomaintaining a sustainable rate of growth and investment,
Botswana conforms well to the SADC macroeconomic convergencetargets. The country has been a major part of a customs union withthe major SADC player, South Africa, and has had free trade withinthat union for a long time. The country has already pursued a soundmonetary policy that has kept inflation at low and stable rates. Thecountry’s inflation target has been set at 3-6% and only adjusted to 4-7% when exogenous shocks made that necessary. This target, whichis less than the SADC target of 9 percent, has been met over most ofthe period, although there have been occasions when the targetboundary was breached due to changes in macroeconomic policiesand external shocks. A case in point is the 2005 devaluation of thePula that was a result of the country moving to a crawling peg exchangerate mechanism, which resulted in the annual rate of inflation risingto 11%. On an annual basis, the average inflation rate of 8.6% is stilllower than the SADC target upper bound. The country has alsomaintained a sound fiscal policy stance geared towards having lowbudget deficits and low debt to GDP ratio. The country has maintaineda strong balance of payments with the level of international reserveswell above the 4 months imports cover target. The current accountdeficit has never been greater than the 9 percent of GDP target limit.It has reserves that can cover imports of goods and services for 29months currently compared to the 4 months minimum required forSADC convergence. The country’s external debt as a percentage ofGDP is below 10 percent and has been declining over time. Unlikeother countries in the region, the Government has not at any pointborrowed from the central bank. Botswana has also been able toachieve the 25% of GDP target for saving, with a savings ratio ofabout 35 percent.
Botswana has been unable to achieve only a few of the SADC targetsfor macroeconomic convergence over the past decade. The two mainareas where the SADC targets have not been met are domestic
160
investment, with an investment ratio of 25% of GDP instead of the40% needed to achieve the 8% per annum growth required in orderto achieve the Vision 2016 goal for per capita income. Related tothat, the other target that has been elusive is the growth target. GDPgrowth for most years has been lower than the 7 percent SADCconvergence target. Raising growth and domestic investment are twoof the main challenges facing the country as it strives to achieve targetsrequired for macroeconomic convergence.
Botswana already conforms to the various SADC targets formacroeconomic convergence and deep integration not only in termsof the numbers, but also in terms of policies. The country has beenpursuing policies that were meant to enhance the participation andperformance of the private sector in the economiy. A number of policiesare already in place to consolidate the achievements. These includethe privatization policy, competition policy, investment policy, newincomes policy, poverty reduction strategy, etc. The country, therefore,does not need to pursue any major new policies as a means of achievingthe SADC targets. Moreover, the country has always been pursuing arelatively liberal framework as a member of SACU. Therefore, thereshould be very little economic and social costs for Botswana as it strivesto achieve the SADC targets, since that will require only minor policyshifts since the country already meets most of the targets.
A major area that will need new direction and emphasis is economicgrowth, which as indicated, has on average been below the 7 percentper annum target. One of the main ways to enhance that growthwithin the evolving competitive environment is through enhancementof labour productivity. This will enable Botswana’s goods and servicesto be more competitive in foreign markets. This is particularly importantgiven Botswana’s small market. Further, trade liberalization is likely tolead to tariff reductions, which should result in increased competition.If efforts to increase productivity are enhanced, the country is likely toincrease the growth rate, reduce unemployment and poverty and beable to meet the SADC targets. Widening of markets from the furthertrade liberalization may result in the economy being able to achieveeconomies of scale, especially with the larger SADC market. But allthese gains do depend on the country becoming more competitivethrough major improvements in labour productivity. Given that the
161
country is already integrated into the SADC market, especially withthe major market of South Africa, there are, however, likely to berelatively few new benefits from further integration. On the otherhand, there are likely to be some revenue losses from the tariffreduction. Given that the revenue from SACU is the second largestsource of revenue for government after diamonds, there is likely to bepressure on Government to cut down its expenditure as it faces lowerrevenues.
7.3 Social Impact Issues and the Decision-Making Process
Since independence, Botswana has had a comprehensive system ofplanning for development in a consultative manner that was
entrenched in the National Development Plan formulation processes.All policy proposals tended to follow the same principles in terms ofconsultation with the various stakeholders. There are structures in placefrom the local villages up to the national assembly that are gearedtowards allowing every citizen to participate effectively in policyformulation and implementation. At the apex of the local structuresare the Kgotla and the Village Development Committees (VDCs). Insome occasions, the Chiefs and Members of Parliament and councillorsuse the Kgotla to discuss publicly and gather views on matters affectingtheir communities before Government makes policy decisions. Thisforum, together with the freedom square, has been used extensivelyfor getting inputs from the locals, as well as communicating newpolicies.
For most policy decisions, there is generally a consultative process,as well as debates on what the social impacts are likely to be, before adecision to proceed with implementation is made. Sometimes, however,the public is not capable of comprehending some of the major policyissues; and therefore, the consultative process becomes a mereformality. But there are also times when consultation with the generalpublic is skipped in the interest of speedy action in terms ofimplementation. A case in point was the 2005 twelve percentdevaluation and the shift to a crawling peg. But for most of theproposed policy changes, stakeholders are consulted and their views
162
taken on board. In some cases, private sector is included in theformulation of trade policy, as part of the team to go and negotiatenew trade issues. Most proposed new policies go through a process ofconsultation with the major key stakeholders in order to not only gettheir views, but also to take into consideration the possible socialimpacts and, if necessary, to find ways of mitigating any serious negativeimpacts.
7.4 Adequacy of the Existing Regulatory Framework forMonitoring and Evaluation of Impacts
Botswana has over the years developed very strong institutions thatare capable of monitoring and evaluating impacts of deeper
regional integration. Unfortunately, some of the activities are scatteredamongst the different ministries, which leads to coordination problems.There are also major problems in terms of the lack of capacity to monitorand evaluate impacts of new policies timeously, which sometimes leavesroom for programmes and policies to go on for a while withoutnecessary corrections and adjustments being made. This is also relatedto the common implementation capacity problem that the countryfaces. There is, therefore, need to address some of the implementationcapacity problems as the country moves towards being more deeplyintegrated into SADC.
163
8 Macroeconomic Challenges FacingBotswana
As noted in earlier sections, Botswana’s economic developmentstrategy has been to exploit the economy’s mineral wealth, and
invest the proceeds from mining to improving social and economicconditions and creating new economic opportunities and additionalemployment. This strategy recognises both the importance of takingadvantage of available opportunities for economic growth, and theneed to use such growth for the benefit of all. The need to provide forequity, the development of education and health services and othersocial services, and the provision of transport and communicationsinfrastructure, has been based on making a defined level of servicesavailable to people living in all parts of the country. In Botswana, areview of the national development plans over the past 25 yearsindicates that macroeconomic policies have been conducted on thebasis of two main objectives: achieving sustainable economic growth,and diversification on the economy away from dependence on mineralled economic development. The current National Development Plan(NDP 9) features a third main objective- sustainable and diversifieddevelopment through competitiveness in global markets. The additionof global markets recognises the role of globalisation in achieving thecountry’s economic and social goals.
Based on this strategy, Botswana formulated a simple transparentset of national policies and priorities for improving economic and socialconditions, and established a national commitment to pursue theseconsistently for a sustained period. After three decades, many of theseplans have been realised and there have been substantial improvementsin people’s standards of living of and level of economic development.However, there are still a number of critical development challengesthat Botswana faces which the economy needs to deal with decisivelyin order to realise sustainable development in the 21st century. Thesechallenges include poverty, unemployment, HIV/AIDS and developmentof human capital, as well as speeding up the process of economicdiversification. The dynamics of these challenges, which are alludedto in some parts of this report, are discussed below.
164
8.1 Poverty and Unemployment
Poverty and unemployment have been subjects of considerable policyattention and resource commitment since the early 1980s. They
are, quite naturally, key objectives of Vision 2016, which sets ambitioustargets for poverty reduction and employment creation, halving theproportion of Batswana living below the poverty line by the year 2006,reducing it to zero by the year 2016 and securing full employment.
Despite the progress made by Botswana in achieving high rates ofper capita income growth in the past decade, poverty still remainswidespread. There are three primary sources of poverty in Botswana.The first is Botswana’s adverse physical and climatic conditions, whichhave limited the role of agriculture in addressing the most basic ofhuman needs - the need for food. The second is the country’s narroweconomic base, comprised mainly of diamond mining, which directlyemploys only a small number of people. In addition, with domesticpopulation of only 1.8 million, Botswana has a small domestic market,which constrains the capacity for inward-driven economic growth.Botswana is also landlocked, and this creates high export and importcosts due to the considerably more expensive road haulage and airtransport when compared to shipping costs. Also, the size of thecountry and sparse distribution of the population make service provisionto this fragmented market costly and difficult.
The impact of these economic factors is exacerbated by a range of socio-economic problems that adversely affect the poor. With this backgroundon the nature and dynamics of the causes of poverty in Botswana, it is clearthat there is need for the Government to have a well thought out andencompassing policy strategy that would deal with poverty reduction anderadication as envisaged in the long tern vision of the country.
There are some efforts already underway aimed at mitigating theworst effects of poverty, such as the range of relief schemes and socialsafety nets that Government has implemented through the newNational Strategy for Poverty Reduction. A number of policies, projectsand programmes, such as the Destitutes Policy, the Old Age Pension,the Arable Lands Development Programme, the Services to LivestockOwners in Communal Areas project, the Financial Assistance Policy,various drought relief programmes, etc., have been designed with a
165
view towards their poverty reduction impacts. A number ofarrangements have been put in place for social security, with a focusmainly on poor people. These include: programmes for people livingin a poor family, programmes for orphans, the Remote Area DwellersProgramme (RADP) and the destitute persons policy for low incomeearners, drought relief programmes for those vulnerable to the adverseshocks of drought, policies for home-based care support and for peoplewith disabilities, who are unable to work; the old age pensioners andWorld War II veterans allowances. At the same time, the Governmentcontinues to explore every available avenue to diversify the economy,upgrade the skills of the workforce and reduce unemployment. TheGovernment’s approach to poverty reduction has always encompassedthree complementary elements, being:••••• AggrAggrAggrAggrAggressive investment in human capitalessive investment in human capitalessive investment in human capitalessive investment in human capitalessive investment in human capital
This is essentially the Government’s basic empowerment strategy. Itentails public investment in building essential capabilities such asknowledge, skills and health to enhance human agency andempower people to earn a living. The main interventions areuniversal access to education, training and health, universal provisionfor basic needs through public and private means and extensionservices for small, medium and micro enterprises, including farmers.
••••• InfrastrInfrastrInfrastrInfrastrInfrastructuructuructuructuructure Developmente Developmente Developmente Developmente DevelopmentInfrastructure development may be seen as part of the broaderstrategy to expand local productive capacity by linking producersto markets and sources of inputs and creating locational incentivesfor investors in order to create jobs.
••••• Employment CrEmployment CrEmployment CrEmployment CrEmployment CreationeationeationeationeationInterventions in this area seek to address the underlying structuralcauses of poverty: a narrow economic base, lack of access to formalsector employment and the low economic potential of agriculturegiven local and environmental constraints. These measures seek todiversify the economy towards sectors with high labour absorptioncapacities. To this end, they create opportunities for people to createemployment for themselves and others. The most prominent ofthese are run under the Industrial Development Policy and the SMMEPolicy. They include the now defunct FAP and its successor, theCitizen Entrepreneurial Development Agency.
166
••••• Social Safety NetsSocial Safety NetsSocial Safety NetsSocial Safety NetsSocial Safety NetsThese measures are intended to address chronic poverty resultingfrom social disadvantage or adverse circumstances resulting fromshocks such as drought, other natural disasters, disease, and infirmity.The programmes include systematic Government support for thedestitute, the aged, orphans and people with disabilities. They alsoinclude direct food transfers to vulnerable groups such as pregnantwomen, nursing mothers and school children. Drought relief, ameasure intended to help people cope with temporary povertyinduced by drought, falls in this category.
It still remains important and urgent for the diversification strategy tobear fruit so that the unemployment problem can be reduced andthat the industries and sectors that could play a role in Botswana’sdevelopment are expanded so that the poverty problem can beaddressed. This is quite a challenge for the country, especially in viewof the relatively slow pace of diversification to date and the continuinghigh rate of unemployment over the years. With these dynamics, therealisation of the goal of Vision 2016 to reduce the proportion of thepopulation living below the poverty datum line to 23% by the year2008, and to zero by 2016 is thus a great challenge for Botswana.
In dealing with the challenges of poverty in Botswana, strategiesfor poverty reduction and its eradication need to recognise some ofthe prevalent poverty dynamics in Botswana where many people inrural areas are poorer than those in urban areas, with female headedhouseholds being generally poorer than male headed households. Therelatively low impact of economic growth on poverty is also strainingBotswana’s development. Most countries with per capita GDPcomparable to Botswana’s have income poverty rates of less than 10%.Yet for Botswana, nearly one-third of the population subsists belowthe poverty line. This surmise is based on the BIDPA 1997 analysis of1985/86 and 1993/94 household Income and Expenditure Surveys.According to the 2002/03 HIES surveys that the incidence of povertydeclined by only 12 percentage points from 59% to 47% between1985/86 and 1993/94 and by 17 percentage points to 90 percent in2002/03.
167
One of the aspects of the dynamics of poverty in Botswana Involveshow to deal with the battle against poverty in the era of HIV/AIDS,which has implications for the population’s health and other socio-economic indicators, as well as the viability of the country’s institutions,especially public institutions. Indications are that HIV/AIDS could veryeasily generate governance failures of catastrophic proportions. A 2000BIDPA study on Poverty and HIV/AIDS indicates that with HIV/AIDS,poverty could increase by as much as 10 percent as opposed to asituation without HIV/AIDS, and the number of orphans anddependents could double.
8.2 HIV/AIDS
One of the major developmental challenges that Botswana facesis the HIV/AIDS pandemic. The spread of HIV/AIDS represents a
serious threat to Botswana’s development and the attainment of thenation’s vision objectives. In 1997, Botswana had one of the highestrates of HIV prevalence in the world. After adjustment for the possibleimpact of HIV/AIDS, UNDP’s 1997 Human Development Report rankedBotswana 97th in the world and 4th in Sub-Saharan Africa in terms ofthe human development index.
Planning for human development in the context of HIV/AIDS posesserious challenges for Botswana, not only because of the high rate ofprevalence which leads to human suffering and death, but also becauseof the macroeconomic impacts that HIV/AIDS has on the labour market,human development processes and public finances. The high economicgrowth rates and progress on the human development front are beingthreatened by the pandemic, which affects progress made on health.Poor health easily translates into poverty for sick people who seldomearn an adequate income. The HIV epidemic threatens to reverse thegains in public health and has implications for the progress made onhuman development indicators such as life expectancy, infant mortalityand others.
The pandemic also poses a threat for the sustainability ofGovernment expenditure on health which has risen sharply as a resultof the growing demands on the health system and in the provision ofanti-retroviral therapy. The World Summit on Sustainable Development
168
in Johannesburg espoused the view that a country in crisis should leadother nations in providing solutions. While there are efforts that arecurrently underway in Botswana to curb the spread of the virus throughthe provision of antiretroviral drugs and counselling services to thoseaffected to prolong their lives, as well as the provision of preventionof mother to child transmission services, it still remains critical for theGovernment to implement the various programmes and policieseffectively and rigorously to ensure that the macroeconomic balanceand progress made on the development front are not seriously affected.The NGOs that have responded positively in working hand in handwith Government in the fight against the scourge also need to continueplaying their role and ensuring their continued support with morerigour so that the fight against the HIV/AIDS pandemic is won.
8.3 Lack of Human Capital, Capacity
Botswana has achieved notable success in human development,transforming the population from being largely uneducated,
illiterate and unskilled to being literate, with a basic 9-10 years ofeducation and some training in basic skills for the world of work.There have been dramatic, rapid increases in the numbers of Batswanawith secondary and tertiary qualifications, as well as with technicaland professional qualifications, although the latter are still in shortsupply (BIDPA, 2001a).
Botswana’s labour force has grown rapidly since independence dueto rapid population growth and increases in labour force participationrates. This latter factor reflects a number of contradictory forces atwork within the socio-economic environment. The improved accessto education has served to reduce the labour force participation ratesfor the youth, while the higher levels of educational attainmentachieved have served to increase labour force participation rates moregenerally, especially for females. The rapid growth in formal sectoremployment opportunities has also served to raise labour forceparticipation rates, especially in rural areas, where in earlier periodsmany people of a working age would be classified as not economicallyactive, or just “sitting at home”. While the rapid growth in formalsector employment opportunities during the 1980s was enough to
169
absorb the growth in the size of the labour force, however it was notenough, to absorb all the rural dwellers who wanted to get out ofsubsistence agriculture (BIDPA, 2001a).
While there have been some positive achievements and plans tocontinue promoting skills and education to achieve one of the ambitiousvision objectives to have an Educated, Informed Nation by 2016, itremains a challenge for Botswana to fill the existing gap in terms ofthe lack of educated and skilled personnel which forms one of themajor constraints to Botswana’s economic development. In enhancinghuman capital and capacity, it remains important for Botswana totrain its labour and match it with the skill requirements of the market.This would go a long way in reducing dependency on imported labourand the high incidence of high level posts being held by expatriates.While some notable progress has been achieved in attaining localexpertise that are capable of holding top positions that were originallyheld by expatriates, Botswana still faces an education policy challengethat should ensure that all training institutions, from primary to tertiarylevel, are set up in such a way that they address the skills gap thatexists in the economy. Human resources need to be geared towardsthe needs of the country and to the job market, in particular so thatmany citizens may enter the labour market with appropriate skills thatmatch the employment opportunities. In this regard, Botswana facesthe challenge of matching the human resource requirements andprovision across sectors by establishing proper frameworks andmanagement processes and developing a culture of life-long learning.The effect of HIV/AIDS upon the future availability of skilled andexperienced personnel must also be fully taken into account in theplanning process.
8.4 Lack of Economic Diversification
Past efforts to diversify the economy have not been fully successfulto the extent that Botswana’s economy is still heavily dependent
on the mining sector. Botswana does not have a well developed privatesector and diversification away from the diamond sector is a necessity.It is imperative to strengthen efforts to enhance private sectordevelopment and speed the process of diversification. The last three
170
development plans focussed on developing the capacity of the privatesector to become the main engine of growth. In 2002, the Governmentput in place the Public Enterprises Evaluation and Privatisation Agency(PEEPA) as the body responsible for the orderly privatisation ofparastatals and other public sector entities and activities. Alongsidedeveloping a robust private sector, the Government has beenpromoting economic diversification through a number of schemes suchas the Financial Assistance Policy, the Small, Medium and MicroEnterprises Policy, and currently CEDA. Earlier focus on developing amanufacturing base, followed recently by development of the servicessector, particularly tourism and the concept of the InternationalFinancial Services Centre, all point to the Government efforts inrecognition of the need for diversification.
The degree of inter-sectoral linkages amongst the various sectors isimportant for an economy like Botswana’s, since such linkages canhave significant implications for economic diversification andemployment creation as a sector grows, as well as for the vulnerabilityof the economy to external shocks. Botswana is heavily dependent onimports for final consumption and as inputs to production. As a result,linkages between the economic sectors in Botswana are generally weak.
Successful implementation of the strategies for sustainable economicdiversification is crucial for Botswana. The importance of the miningsector, especially diamond mining, in GDP, and the dependence ofGovernment on mineral revenues leaves the country vulnerable to thevagaries of developments in the sector. Such vulnerability is neitherhealthy nor prudent. Being highly dependent upon the performance ofone economic activity exposes the Botswana economy to greater risksof fluctuations in GDP, export earnings and the balance of payments,Government revenues and the budget balance than would occur witha more broadly based economic structure. Botswana’s mineral basedeconomy, heavily dependent on diamonds, faces risks due to fluctuationsin prices and demand patterns. The notoriety of “conflict diamonds”has recently highlighted the potential risk Botswana faces from changesin consumer demand (BIDPA, 2001e). In Botswana’s case, the nature ofthe export commodity, a luxury good, exposes the country to greaterrisks associated with fluctuations in market demand, since such goodstend to have higher income and price elasticities of demand.
171
Countries that are primary commodity producers are not onlyvulnerable to instability of prices and export earnings, they are alsosubject to long-term adverse movements in terms of trade of theircommodity the prices of their exports have typically risen less than theprices of their imports. While this has not happened to diamonds, ithas happened to Botswana’s other main minerals, e.g., copper-nickel,coal and soda ash. A relatively undiversified economy also typicallyhas greater difficulties adjusting to external shocks, such as a downturnin the diamond market, or a global economic recession (Hill and Knight,1999). More diversified economies are generally better able to respondand adjust to shocks. In addition, the more diversified the economyis, the more likely it is to create a broader spectrum of incomegenerating opportunities, which, in turn, will lead to a more equitableincome distribution (BoB, 2001). Mining, while being a majorcomponent of GDP, is highly capital intensive, creating relatively fewdirect jobs for the many Batswana who need employment. Economicdiversification beyond mining would almost invariably be more“employment-intensive”, resulting in faster employment growth, lessunemployment and reduced poverty levels (NDP 8, 1997). Anotheradvantage of sustainable economic diversification is that the morediversified an economy, the greater will be the domestic inter-sectorallinkages will be, and the greater the impact that an increase in outputof any one sector will be on the rest of the economy.
While Botswana’s diamond industry has experienced rapid growthover the past three decades, it is unlikely to continue to grow anywherethat fast in the future. Botswana cannot expect to be able to continueto find the richest, most profitable diamond deposits in the worldwithin its boundaries. Finding new engines of growth outside miningwill be crucial for further rapid growth in real incomes. This has provedto be quite a challenge with the landlocked economy and smalldomestic market.
In implementing the Vision 2016 strategies, Botswana will need todevelop the capacity of small, mostly female operated and often ruralbased enterprises. The greatest challenges faced by businesses generallyare access to capital, a shortage of adequately trained personnel andlack of business management expertise. Government has madeeconomic diversification a priority. However, such an endeavour
172
continues to progress slowly, despite Government’s efforts to wooforeign investors, or develop indigenous entrepreneurship throughefforts such as the Citizen Entrepreneurial Development Agency(CEDA).
8.5 Lack of Economic Infrastructure
Much of the investment in the early years was directed at buildingbasic infrastructure and major mineral projects, e.g., diamonds
at Orapa and copper-nickel at Selebi-Phikwe. Since independence,Botswana has sustained high levels of investment relative to GDP,comparable to the rates of investment achieved by the East AsianTigers. As a result, the country has built an impressive stock of economicand social infrastructure, including tarred roads to virtually all parts ofthe country, an electricity system, a telephone system, water systemsto most communities, schools and health clinics, Government offices,and a substantial stock of modern sector housing.
A key element of the economic management strategy fordevelopment was the heavy investment in building basic infrastructureand major mineral projects. The prudent economic managementpractised by Government in reinvesting the returns from the sale ofdiamonds to develop the nation’s economic infrastructure helped tocreate the economic environment needed for long-term development.Other supporting economic policies included a liberal exchange controlregime and low rates of direct taxation, which were intended toencourage foreign direct investment and business development.
8.6 Lack of Finance
Lack of finance is one of the challenges that Botswana faces,particularly in the development of small enterprises. While there have
been policies and programmes that have been put in place to assist inthe provision of finance, such as the Financial Assistance Policy, CitizenEntrepreneurial Development Agency, National Development Bank,Botswana Export Credit Insurance and Guarantee Company BotswanaDevelopment Corporation and others, operations of small scaleenterprises have been affected to a large extent by the lack of finance.
173
Commercial bank conditions and requirements have been cited asstringent and costly for small scale businesses, mainly due to the riskswith regard to their sustainability and lack of collateral. There is nodoubt that Small and Medium Scale Enterprises (SMEs) have an importantrole to play in Botswana’s development. As in other developing countries,they provide a significant proportion of total employment, and in mostcases do so at a smaller capital cost per job created than larger businesses.The SME sector also creates potential for the growth of locally-ownedprivate sector businesses, by providing an entry point and relevantexperience for Batswana entrepreneurs. In the past, local people hadlittle experience in business other than in agriculture, while other sectorshave been dominated by foreign ownership since independence.
For these reasons, Government policy towards SMEs is of exceptionalpublic interest. Much of that public interest has focused, and still doesfocus, on the availability and cost of SME credit. There is a widespreadbelief that not enough credit has been made available to SMEs, that thebanks impose lending conditions which wrongly exclude most SMEs,and that whatever credit is available is so expensive that it damagesSME prospects of survival and growth. This belief is supported by surveysof SME owners and managers, who invariably cite high credit as oneconstraints that they face, and, in fact, usually identify credit as thedominant constraint.6 The Government has, therefore, been urged tomake more credit available to SMEs, with subsidy as required. This hasbeen done in a number of ways. In addition, there has been a smallnumber of private sector and donor initiatives. The National DevelopmentBank and the Botswana Cooperative Bank were initially well managedand relatively sound, but were eventually overwhelmed by bad debts.
8.7 Environmental Degradation
Botswana faces a challenge in dealing with the problems ofenvironmental degradation. It is important that the country’s
resources are used sustainably, but this becomes problematic with thelow unreliable rainfall which characterises Botswana. Botswana’s naturalresources consist of range and arable land, water, air, woodlands and6 See for example the 1992 survey of 1140 micro-enterprises in seven urban centres and
villages in Botswana. Even though all possible constraints were discussed, 74% identifiedlack of finance as the primary constraint. Next was marketing [Morewagae et al, 1995].

174
wetlands, veld products, wildlife and mineral resources. The dramaticchanges that have occurred in Botswana since independence haveplaced many of these resources under increasing stress and strain.Botswana’s population has more than trebled since independence andthe country is characterised by low and unreliable rainfall and relativelyinfertile soils. The increasing population has raised the rate of use ofthe natural resources, while the adverse climatic conditions impactnegatively on the rate of growth of the resources and their renewal.Botswana’s environmental problems are categorised as follows:• The degradation of rangeland pastures• The depletion of water resources• The over-use of woodland and veld products• Pressure on wildlife• Pollution, waste and sanitation• The potential impact of global climate change on weather patterns,
especially on temperatures and rainfall in Botswana.
In view of changes that have occurred which have impacted negativelyon Botswana’s environmental resources, the Government hascommitted to the sustainable utilisation of the country’s resources, aswell as ensuring that the environment is taken care off. Civil societyorganisations are also playing an increasingly important role in raisingpublic awareness of the environmental issues and problems which thecountry now faces. One of the vision objectives aspires to ensure thatby 2016, renewable resources will be used at a rate that is in balancewith their regeneration capacity and that Botswana’s wildlife will bemanaged for the sustainable benefit of the local communities, and inthe interests of the environment as a whole. Also, the national visionenvisages that by 2016 the country will take strong measures to limitpollution that has resulted from rapid industrialisation. Various policieson sustainable resource use and environment-related legislation are inplace to avoid depletion of resources and environmental degradation.These include:• The National Policy on Natural Resource Conservation and
Development of 1990, this policy is concerned with the overallcoordination of natural resource management.
175
• The Tourism Policy which promotes low-volume, high value tourism• The Agricultural Policy (1991), which advocates for food security
and sustainable methods of production• The National Water Master Plan (1992) which guides the
development of the water sector• The National Settlement Policy, aimed at rationalising the distribution
and development of settlements• The Water Act (1968), which defines water use rights and establishes
a regime over all surface and ground water• The Tribal Land Act (1970), which provides for the establishment of
tribal land boards with the responsibility of managing tribal land• The Agricultural Resources Conservation Act (1974), which provides
for the conservation and improvement of soils, water, flora andfauna
• The Wildlife Conservation and National Parks Act (1992), whichprovides for the conservation and management of Botswana’swildlife resources and the enforcement of international treaties andconventions to which Botswana is party.
• The Waste Management Act (1998), which provides for efficientwaste management on a national basis.
Botswana is also party to several international conventions, protocolsand other agreements on environment and natural resource use whichaim to protect the environment. While there are efforts underway toavoid the worst states of environmental degradation, it remains achallenge for Botswana to ensure that necessary public awarenesscampaigns for the public who are users of natural resources and theenvironment, are conducted. Regional integration among SADCcountries and the mounted effort on dealing with the environmentalproblems are essential and can be used to enhance the public awarenesscampaigns.
8.8 Gender Discrimination
Women in Botswana have made great gains in education, health andemployment since independence. However, there are a number ofeconomic and socio-economic cultural practices, as well as laws, which

176
work against women’s empowerment and full participation in society.Of particular concern are issues of unequal access to training andemployment, rising levels of violence against women, and higher levelsof poverty amongst women than men. Women are also greatly affectedby the HIV/AIDS epidemic: young women have higher levels of HIVinfection than young men, and female-headed households have moredependants than male headed ones. Female-headed households alsohave fewer income earners and and are charged with the responsibilityto take care for the sick.
One of the key problem areas for women is their unequal treatmentunder the law, compared to men. It, therefore, remains a challengefor Botswana to ensure that these laws are continually reviewed andrevised to ensure that all parties receive equal treatment in the face ofthe law. In the area of education, female enrolment is generally slightlyhigher than that of males at primary school and at junior secondaryschool and higher levels of education female enrolment has beenincreasing. But there are still disparities in terms of participation inscience and engineering courses, with women still highly unde-represented.
Many women live in rural areas, where employment opportunitiesare most limited. Women also account for three quarters of informalsector enterprises, and tend to occupy activities with the lowest returnsand limited opportunities for credit, skills training and materials. Theyhave limited access to productive resources, particularly cattle, land,cash, labour and credit. The formal sector offers the most reliable andbest-paid job opportunities, but this sector is dominated by men.
Violence against women is a serious problem in Botswana: reports ofrape, domestic violence, battering, incest and emotional abuse areincreasing year by year. The Government has responded by amendingthe Penal Code to carry stiffer sentences for rapists, including a compulsoryHIV test, with higher sentences for those who knew their HIV-positivestatus prior to the assault. Several NGOs in different parts of the countryactively campaign against violence against women, and a women’s shelterhas been opened in Gaborone. The Government acceded to theInternational Convention on the Elimination of All Forms of DiscriminationAgainst Women (CEDAW) in August 1996, but there are other conventionsrelating to women that Botswana has not yet signed.
177
Female representation in parliament improved somewhat after thegeneral 1999 election of but is still relatively low. A political educationproject was launched to mobilise more people to vote and to increasethe number of women in parliament. This achieved some success sincethe representation of women in parliament increased and therepresentation of women on boards of parastatals has also improved.
Following the UN Fourth World Conference on Women held inBeijing in September 1995, a new collaboration between the Botswanagovernment and NGOs concerned with women’s issues began. In theyear that followed, the Government formulated a new policy onWomen in Development, which identified critical areas of concern,namely, women and poverty, women and health, the girl-child, andviolence against women. The policy has since been translated into theNational Gender Programme, launched in November 1998. TheDepartment of Womens Affairs is in the process of developing acomprehensive advocacy and mobilisation strategy for gender anddevelopment, and will be working closely with NGOs in itsimplementation.
8.9 Governance Problems
The impacts of economic management in Botswana, and the relatedaspects of governance, are reflected in a number of economic and
social indicators; both relatively objective indicators, such as GDP andthe Government budget, and other more subjective indicators, suchas people’s perception of public sector performance and accountability.Botswana has an enviable reputation for good governance and isregarded as the least corrupt nation in the African continent. Of thetotal number of countries listed in Transparency International’sCorruption Perception Index, Botswana ranks significantly higher (lesscorrupt) than any other African country. Botswana also compares wellwith developing countries in other parts of the world. The CountryRisk Report for 2000 published by the Economist Intelligence Unitrated Botswana as the seventh least risky country out of 93 “emergingmarket economies” surveyed.
Botswana has its own Directorate on Corruption and EconomicCrime, established in 1996. A review of legal policies, laws and
178
institutional capacity to combat corruption are generally adequatethough there is still room for improvement in the administration ofjustice relating to cases of corruption. Carried out in conjunction withthe newly formed Botswana Chapter of Transparency International, thereview highlights the need for more openness about Governmentprogrammes and activities, particularly with regard to implementation ofplans and policies. It also calls on politicians to enunciate clear cut policiesrelated to corruption. Botswana’s processes of economic managementand governance have not only resulted in rapid and sustained economicgrowth, they have also contributed to the major structural transformationsthat have occurred in the economy since 1966, which have createdfavourable conditions for public and private sector development.
With a population of about 1.7 million people in 2001, dispersedover a large semi-arid area that is subject to low and erratic rainfalland prone to drought, Botswana has recorded remarkable success inimproving both economic and social indicators of development. Theprogress Botswana has achieved is due to many factors – goodeconomic management and governance, cultural and political – thesehave combined favourably to create conditions that have yielded pastachievements and will set the stage for future success.
Botswana’s procedures and practices of economic management andgovernance have evolved over time, in line with perceived needs andbest international practice. The formulation of macroeconomic policieson the basis of solid multi-disciplinary policy analysis has been a keyinput to the decision making processes. The strict adherence to soundfinancial management processes and procedures has also been key toensuring that decisions, once taken, are implemented effectively, andthat the resources required are efficiently allocated and properlyaccounted for. The economic management and governance processesprovide for broad consultation and consensus building before decisionsare made and policies, programmes and projects are implemented.This serves to further ensure that better outcomes are reached; onesthat accord with the best information available and are broadlysupported by stakeholders. The review and evaluation mechanisms inplace provide means to identify needed changes, not only in thedevelopment strategies to be pursued, but also in the procedures andprocesses needed for effective economic management.
179
9 Special Issues for Future Research
9.1 Implications and Impact of Regional Integration
Given the commitment to deepening SADC integration throughmacroeconomic policies aimed at achieving certain agreed
macroeconomic convergence targets, it is important that policy makersin SADC and its member states assess the effects that the integrationwill have on the social wellbeing of its people, both in the short termand long term. Individual countries need to conduct research on theimplications of the various integration initiatives they are pursuing andbalance them in accordance with economic priorities. Botswana is amember of various regional integration blocks and trade agreements,including SACU, SADC, the Cotonou Partnership Agreement andAGOA. The objectives of regional integration in the various agreementsoverlap and, as such, it is imperative that research be carried out onthe possible benefits and the impact of the agreements on the country’slong term trade aspects and developmental aspirations. Such researchwill also identify which issues should be aligned and pursued within acertain agreement, and more importantly, where the benefits arehigher. Such research and information would help to ensure thatcountries reap the benefits of integration and are also guided by whatthey stand to benefit in any agreement.
9.2 Multiple Membership, Overlaps and ImplementationCapacity
Botswana is a member of various trade agreements that are atdifferent levels of negotiations. The implementation of the
agreements overlap and this poses costs in the negotiation processand in fulfilling membership obligations. It is also a complex task toensure that the negotiation mandates in the various arrangements donot conflict with economic objectives and those of the integrationprocess. Also, the negotiation process requires capacity and expertiseto handle the complex issues involved. It is, therefore, important forresearch to be conducted on the costs of membership andimplementation of the various trade arrangements. Having trained
180
experts in the negotiation process could also enhance the benefitsthat can be derived from the integration process and also ensure thatthe agreements are in harmony, both in their pursuit of regionalobjectives and national objectives of development.
9.3 Research on the Trade and Poverty Links
While Botswana has made substantial progress on thedevelopment front, it still faces widespread poverty and
unemployment. Various efforts and policies have been put in place toaddress the high incidence of poverty and unemployment, but theincidence of both still remains high. It is, as such, important thatresearch on identifying the possible links between trade, employmentand poverty be conducted and ways in which regional integrationthrough trade can be exploited to address the poverty andunemployment problems. Such research will not only give usinformation on why the linkages may have been weak, but it will alsoshed insight on how to maximise the benefits and how to strengthenthe linkages.
9.4 Diversification and Industrial Development
While Botswana is making efforts at the national level to diversifythe economy, it still remains critical for the industrial sector to
develop to a level where the industries can effectively play a role inexpanding trade at a regional level as envisaged in the SADC FTA.Focused research on how these industries will be affected, especiallyat the early stages of development, is critical. Without such researchand information, some countries may end up as losers from theintegration process. Also, issues on how economies may protect theirindustries as they open up markets to more free trade is important.For Botswana, with a limited industrial base and lack of a diversifiedexport base, more competition may thwart the diversification exerciseand result in greater dependency on imports.
181
9.5 Data Issues
Data is needed to facilitate research work on the impact of regionalintegration on the broader economy in Botswana. The aspects thatneed particular attention in as far as data collection, compilation anddissemination are:• The frequency of the data• The timeliness of the data• The level of dissaggregation• Broadness and coverage• Consistency of the data• Accuracy of the data
Areas where data is needed to facilitate research work in the specialissues identified in the previous section include: data on poverty whichis currently being compiled on a ten year cycle basis; trade data (whichis often late) not disaggregated to allow for more focused sectoralanalysis; data on employment where labour force surveys are conductedafter 10 year periods; relevant data on fiscal, monetary, educationand training health and capital market-related data. Harmonisation ofdata collected in the region will also allow for meaningful comparisonson what effects regional integration will have in the individual countries,as well as on monitoring the convergence programme. Further, moreresearch can be easily carried out on some of the important linksbetween trade and other important regional issues such as povertyand unemployment and its impact on the social and economicdevelopment.

182
183
10 Conclusions and Recommendations
Botswana’s success lies in the prudent macroeconomic managementof resources through the national planning process which is linked
to the national budgeting process and the Vision 2016 aspirationsthese aspirations emphasise and focus on themes that are in line withthe SADC RIDSP goals and objectives of achieving sustainable andequitable growth and socio-economic development through efficientproductive systems and good governance. Botswana’s growth, hasbeen mainly driven by the mining sector, which coupled with the goodmacroeconomic policy framework that has existed, have led toBotswana’s good performance. It is through prudent policy makingand the availability of diamond revenues that Botswana has had goodfiscal and monetary policies that have contributed towards theachievement of high growth rates and the attainment of most of theSADC macroeconomic convergence targets. The economy has notformally adopted a Macroeconomic Convergence Programme in linewith the Memorandum of Understanding on Macroeconomic Stabilityand Convergence, since it has made great strides in moving towardsand achieving most of the targets set for the Memorandum ofUnderstanding.
Botswana is already compliant with most of the set SADCmacroeconomic convergence targets. The economy has low externaldebt, as a result of many years of running budget surpluses andaccumulating substantial levels of international reserves. The budgetsurpluses are mainly the result of the Government fiscal policy ofavoiding pro-cyclical fiscal policy and adopting a strategy of having abalanced budget over the medium term. Since the 1980’s, Botswana’scurrent account has been in surplus and as such the country has nothad to adopt any explicit target for the current account balance in linewith the SADC macroeconomic convergence programme. Botswana’smonetary policy has also given high priority to achieving andmaintaining monetary stability, which encompasses the objective of alow and stable rate of inflation. This has brought and maintainedinflation within the SADC target by 1997, and, apart from an aberrationin 2003 which was caused by the introduction of VAT, the country hasstayed within the target range since then until August 2005.
184
The two targets that Botswana is still not complying with are thegrowth rate which has remained lower than the SADC average targetof 7% and the rate of investment. Botswana’s GDP growth rate hasfluctuated mainly in response to developments in the mining sectorand generally has been lower in recent years, less than the Vision2016 target of 8% p.a, as well as the SADC target of 7%. NDP 9projects an average annual growth rate of of 5.5%, while the Mid-Term Review of NDP 9 forecasts even lower growth.
Investment has also been lower than the SADC target of 30% ofGDP and has also been concentrated in the mining and Governmentsectors. Many efforts have been put in place to continue attractinghigher levels of investment particularly in the non-mining sectors ofthe economy. This is expected to contribute to the nation’sdiversification strategy.
Botswana has also not enjoyed the full benefits of trade emanatingfrom a diversified export base, since one sector has dominated itsexport profile. Botswana exports a few products, notably diamonds,beef, soda-ash, copper-nickel and textile products. The industrial baseremains small and the manufacturing sector is still in the early stagesof development. The domestic market is also small, limiting expandedtrade opportunities and effective participation in the integration processwithin the trade front.
While there are quite a number of good policies that havecontributed towards Botswana being a success story in the SADCregion, there is still widespread poverty in Botswana. Many Batswanaare still poor with the implications that the benefits of growth havenot been equitably distributed or re-distributed and targeted toeffectively address the widespread poverty. Also linked to poverty isthe prevailing high level of unemployment in the economy. The highincidence of HIV/AIDS also poses a challenge in attaining high growthrates and addressing policy priority areas such as poverty andunemployment.
Botswana Specific Recommendations
Botswana has made efforts and continues to refine some policies andinitiatives to address the areas where it is lagging behind in the SADC
185
macroeconomic convergence programme and its long termdevelopment. The economy pursues policies that are in line with theSADC vision of promoting sustainable growth and promoting moreproductive systems. Policies have also been formulated to address thelow investment, boosting GDP growth and promoting growth of thenon-mining sectors and enhancing private sector development. It is acommonly expressed view in Botswana that the problems that existare mainly not the result of poor policies, rather they are largely theresult of a failure to implement the existing policies. For Botswana torealise its vision, there will be a need to address implementationproblems, and to introduce stringent monitoring mechanisms at everylevel of the public sector. There are policies that are targeted at thechallenges that Botswana faces, mainly, the high poverty levels, highunemployment and the HIV/AIDS problem. In this regard, therecommendations drawn below emphasize areas where these effortsneed to be strengthened and issues where Botswana can use theregional integration interface to enhance some of its policy aspects tobecome an effective player in the integration process, while alsopromoting its national interests. With this background and conclusions,for Botswana to be competitive, more productive and effective in theregional integration process in the SADC region, it is recommendedthat:• Botswana should build capacity in the existing institutional structures
to effectively implement policies that can address the problem areasthat may reverse the achievements made on the SADCmacroeconomic convergence targets and also identify areas wherefurther regional integration can be used as a vehicle to achievemore growth and development. This is important in ensuring thatissues of poverty reduction and high unemployment are given astronger focus and that the institutional mechanisms for policyimplementation are adequate. In particular, Botswana shoulddevelop monitoring mechanisms and clear punishment and rewardsystems for both labour and management. There is also a need tospeed up processes so that decisions do not take longer thannecessary to be implemented.
• It is imperative for Botswana to strengthen its diversification strategyso that other sectors of the economy, besides the mining sectors
186
can play a more significant role in GDP growth. Regional integrationin SADC is one avenue that Botswana can explore to enhance itsgrowth and tap on the growth opportunities that are available.Given the current challenges of the economy, there is need todevelop industrial targeting policies rather than the old ones thatare not specifically targeted. Government efforts to promoteinvestments, both local and foreign, should be more selective,focused on investments that are local-resource based or whoseoutputs are targeted at export markets. As such, investments shouldbe sought for such industries as tannery, leather products, meatprocessing, diamond processing and jewellery, etc. Such industrieswill enhance the values of those local resources that are currentlyexported in less valuable raw state. In addition, they would createemployment opportunities’, diversify the country’s industrial base,and enhance Botswana’s export earnings . An effectiveimplementation of this strategy requires a detailed inventory of inputmaterials (hides and skins, diamond, livestock etc) available in thecountry, the possible outputs from them, and the markets for suchoutputs. Efforts by BEDIA and other investment promotion agenciesto promote local as well as foreign investments should then bedirected at those aimed at utilizing such available resources. Thecountry should also identify niche markets for some of its products.
• The private sector has to play a role in Botswana’s developmentgiven the potential the sector has in generating more employmentopportunities and growth and, as such, it needs to be strengthened.The private sector also needs to participate fully in the integrationprocess and explore markets and other growth prospects that theprocesses of regional integration of SADC may avail. This requiresthat the private sector be taken on board in all negotiations anddecision making. The Botswana Government has already committeditself to playing the role of facilitator, while allowing the privatesector to take the lead. The Government’s facilitative role requires acloser relationship with and understanding of the private sector. Inorder to foster such understanding and relationship, Governmentneeds to be more knowledgeable about the private sector. Suchknowledge is best provided by periodic studies on the challengesindustrialists face which may constitute barriers to their growth or
187
even survival. For example, there is a concern on the low labourproductivity in Botswana. The Botswana National Productivity Centre(BNPC) should research that problem, establish its dimensions, causesand what could be done to solve the problem.
• Botswana should integrate its trade policy into its planning process,since this will help to ensure that trade is given priority and thatresources are committed towards pursuing trade initiatives that willbenefit the economy. In this regard, Botswana should align its tradedevelopment strategy to the SADC trade objectives, which aim todeepen integration while at the same time balancing it with nationalinterests and long term development objectives of the economy.
• Efforts and initiatives aimed at attracting foreign investment needto be pursued with more rigour. FDI can play a significant role inthe long term growth of the economy through the technology,skills and product innovation that it brings to the economy, whichcan impact positively on Botswana’s diversification policy. Someelements of the SADC Finance and Investment Protocol can beintegrated into Botswana’s investment strategy to allow the countryto reap some of the benefits that may be derived from pursuingregional investment initiatives. Some of the identified solutions tothe constraints of FDI inflow should be implemented as a matter ofurgency. For example, the issue of work permits which has been achallenge in terms of getting and keeping needed skilled labour inthe country. Government realizes that in view of the small size ofBotswana’s domestic market, the required economic growth anddevelopment can come only from vigorous and sustained growthin international trade of goods and services. Consequently, reformpolicies are being aimed at raising productivity and efficiency ofdomestic resources, aligning the exchange rate of the domesticcurrency and thereby improving the international competitivenessof Botswana producers. In addition to local resource-basedindustries, export-oriented industries promote growth and createemployment opportunities. Because they add value to any inputsthey might have imported, they are usually favoured with incentivesand exemptions from import restrictions. The drive for FDI inparticular should accord greater priority and efforts to industriesthat are engaged in production for the export market.
188
• Botswana needs to continue to deal with the HIV/AIDS challenge,particularly on its impact on the broader economy, such as on thesupply of skilled labour, government resources, and positivedevelopments made on the human development front. The war ondealing with the attitudes and stigma associated with the diseasein particular needs to be given a high priority. There is need tointensify education regarding the diseases so that the country canslow down the rate of new infections.
• Industrial development should also form one of the priority areasfor Botswana. This can contribute to more production and productsin the market and enhance Botswana’s export profile, which isimperative if Botswana is to compete successfully in the regionalintegration process and benefit from trade. Also, promotingindustries that can form linkages with others is quite important.The proximity to South Africa constitutes both an opportunity anda threat to Botswana. Potential investors in productive enterprisesin the southern African region tend to favour South Africa, ratherthan Botswana, as their destination for a number of reasons––proximity to seaport, large domestic market, low cost of utilities,affordability and availability of investible funds, better infrastructure,higher technological skills and facilities. On the other side of thecoin are the higher tax rate, the high crime rate and relative socialinstability, which constitute South Africa’s weaknesses. A proactivereaction to these two dimensions of the proximity to South Africacan turn both into an advantage. Botswana can turn its relativedisadvantage of size and lower level of technological developmentinto an opportunity by integrating its industrial activities into thoseof South Africa. Integrated manufacturing agreements could benegotiated with selected major manufacturers under whichBotswana would produce and supply component parts to SouthAfrican producers, instead of establishing production units ofcompeting brands. Such agreements seem viable in such industriesas motor vehicle manufacturing, electronic and householdappliances, agricultural equipment, etc. The initiative for suchcontractual arrangements can be facilitated by a government togovernment approach and negotiation, involving the ministries ofForeign Affairs, Trade and Industries, Finance and Economic
189
Development and the private sector organisations such as BOCCIM.• Botswana has to strive to improve its labour productivity to become
more competitive in the region. The efforts in this aspect have severaldimensions, some of which are embedded in the education system,the system of rewards and general incentives in the labour market, thegeneral attitude towards work, etc. These issues need to be dealt withurgently. Some of the solutions have already been identified and it isnow a problem of slow implementation. For example, the PerformanceManagement System in Government is moving at a pace that is veryslow. There is a general need for the country to implement structuralreforms that have been agreed upon in a timely manner. Theprivatisation policy, for instance, has been in place since 2000, andeven though it was approved, to date not a single enterprise has gonethrough the steps of privatisation. With deeper integration, productivityimprovements will become increasingly important for the country’ssurvival and success in the global market.
• It also remains important for Botswana to remove obstacles to tradeand investment and ensure that there is a conducive regulatoryenvironment that would facilitate a smooth integration process. Areview of current laws and regulations that may prevent local orforeign investments in several sectors is necessary. For example, theBotswana Meat Commission Act, which confers monopolistic rightsto export fresh meat on the Commission, needs to be reviewed ifnew investments are to be attracted to the meat industry. Similarlaws in other sectors need to be reviewed if there is to be newinvestments in those sectors.
General Recommendations
While there are specific issues that Botswana needs to deal with at thenational level, (as indicated above,) for effective participation indeepening integration in SADC, there is need for a concerted effortby all SADC member states to make this a reality.
It is imperative that all SADC members states adopt stability-orientedpolicies in a cooperative manner. This is in recognition of the fact thatin order to accelerate the growth of economic activity, investmentand employment in the SADC region, there is need for increased
190
cooperation and co-ordination in the formulation and implementationof macro-economic policies. It is upon each member state to eliminateall obstacles on trade, investment and movement of labour that mayhinder the integration process, allowing for other countries to alsoparticipate effectively to achieve the benefits of deeper integration inSADC.
This calls for increased cooperation, co-ordination and managementof macroeconomic stability and implementation of monetary and fiscalpolicies in the region that are vital in accelerating growth, trade andinvestment, employment creation, and achieving reductions in povertyand high unemployment. Without a collective effort in dealing withthe challenges that face the individual member countries in strivingtowards deeper SADC regional integration, the regional integrationprocess may be a failure, with some of the important RISDP objectivesnot being met.
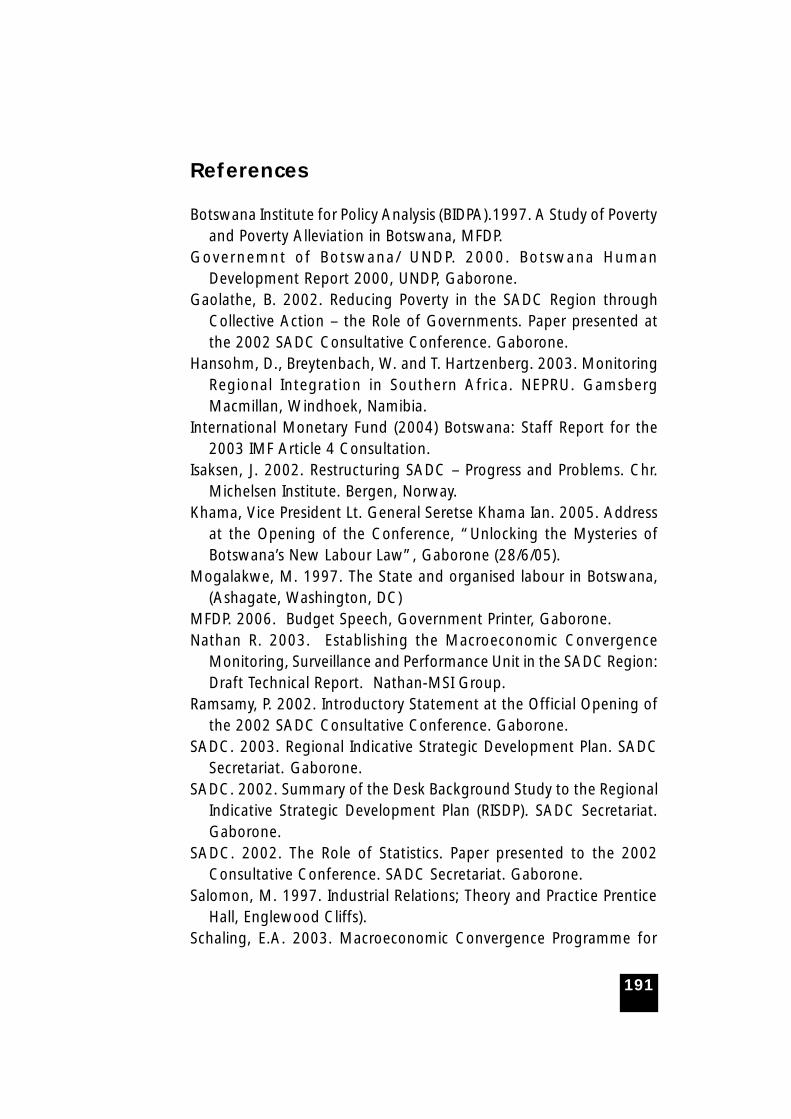
191
References
Botswana Institute for Policy Analysis (BIDPA).1997. A Study of Povertyand Poverty Alleviation in Botswana, MFDP.
Governemnt of Botswana/ UNDP. 2000. Botswana HumanDevelopment Report 2000, UNDP, Gaborone.
Gaolathe, B. 2002. Reducing Poverty in the SADC Region throughCollective Action – the Role of Governments. Paper presented atthe 2002 SADC Consultative Conference. Gaborone.
Hansohm, D., Breytenbach, W. and T. Hartzenberg. 2003. MonitoringRegional Integration in Southern Africa. NEPRU. GamsbergMacmillan, Windhoek, Namibia.
International Monetary Fund (2004) Botswana: Staff Report for the2003 IMF Article 4 Consultation.
Isaksen, J. 2002. Restructuring SADC – Progress and Problems. Chr.Michelsen Institute. Bergen, Norway.
Khama, Vice President Lt. General Seretse Khama Ian. 2005. Addressat the Opening of the Conference, “Unlocking the Mysteries ofBotswana’s New Labour Law”, Gaborone (28/6/05).
Mogalakwe, M. 1997. The State and organised labour in Botswana,(Ashagate, Washington, DC)
MFDP. 2006. Budget Speech, Government Printer, Gaborone.Nathan R. 2003. Establishing the Macroeconomic Convergence
Monitoring, Surveillance and Performance Unit in the SADC Region:Draft Technical Report. Nathan-MSI Group.
Ramsamy, P. 2002. Introductory Statement at the Official Opening ofthe 2002 SADC Consultative Conference. Gaborone.
SADC. 2003. Regional Indicative Strategic Development Plan. SADCSecretariat. Gaborone.
SADC. 2002. Summary of the Desk Background Study to the RegionalIndicative Strategic Development Plan (RISDP). SADC Secretariat.Gaborone.
SADC. 2002. The Role of Statistics. Paper presented to the 2002Consultative Conference. SADC Secretariat. Gaborone.
Salomon, M. 1997. Industrial Relations; Theory and Practice PrenticeHall, Englewood Cliffs).
Schaling, E.A. 2003. Macroeconomic Convergence Programme for
192
SADC. Rand Africaans University and Genesis Group.Senaoana, M.P. 2005. Deepening Regional Integration in SADC: The
Current Status of Macroeconomic Convergence in the SADC Region.Paper presented to the Friedrich Ebert Foundation Workshop onDeepening Regional Integration in SADC – Macroeconomic Policiesand Their Impact. Stellenbosch, South Africa.
Siphambe, H. K. 2003. Understanding Unemployment in Botswana,South African Journal of Economics. Vol. 71 (3): 480-495.
193
Deepening Integration in SADC
Part: 2
Perception of Business and Non-State Actors inBotswana
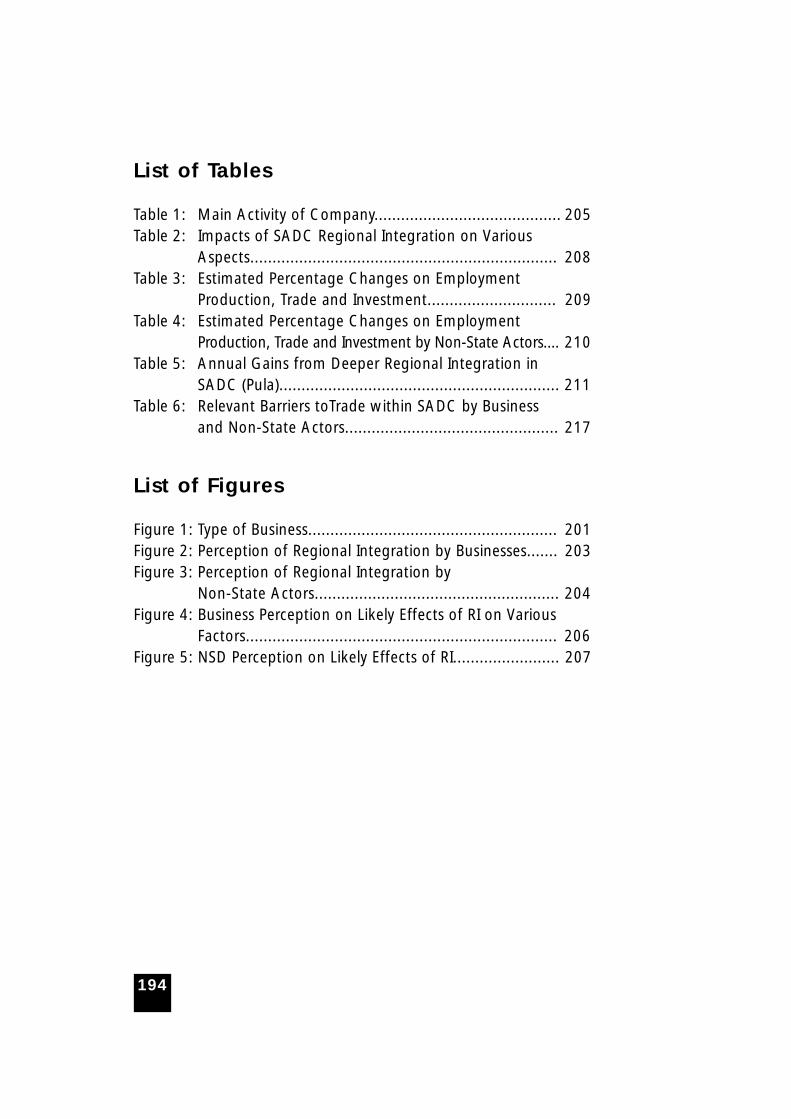
194
List of Tables
Table 1: Main Activity of Company.......................................... 205Table 2: Impacts of SADC Regional Integration on Various
Aspects..................................................................... 208Table 3: Estimated Percentage Changes on Employment
Production, Trade and Investment............................. 209Table 4: Estimated Percentage Changes on Employment
Production, Trade and Investment by Non-State Actors.... 210Table 5: Annual Gains from Deeper Regional Integration in
SADC (Pula)............................................................... 211Table 6: Relevant Barriers toTrade within SADC by Business
and Non-State Actors................................................ 217
List of Figures
Figure 1: Type of Business........................................................ 201Figure 2: Perception of Regional Integration by Businesses....... 203Figure 3: Perception of Regional Integration by
Non-State Actors....................................................... 204Figure 4: Business Perception on Likely Effects of RI on Various
Factors...................................................................... 206Figure 5: NSD Perception on Likely Effects of RI........................ 207
195
Executive Summary
The report focuses on an analysis of the responses from a survey ofperceptions of businesses and non-state actors on SADC regional
integration. The analysis centers on the major sections of thequestionnaires which sought to capture the respondents' generalinformation. It also evaluate perceptions of non-state actors andbusinesses on the impact of regional integration within SADC, possibleimpacts on the domestic economy and the businesses, the benefitsand losses that could be realised from integration and lastly, the extentof the public debate on regional integration and the involvement ofrespondents in the SADC policy debate.
The survey reveals that, to a larger extent, both businesses andnon-state actors share common views on the impacts of regionalintegration within SADC. The broader conclusion that emanates fromboth quarters of respondents in the Botswana survey is that there aresome benefits and losses that are likely to occur from greater regionalintegration of SADC countries. Countries, such as Botswana, wherethere is no strong industrial base as well as a favourable business andeconomic climate for investment and business growth, may not realizesuch benefits in the near term. Some respondents, especially from themanufacturing sector, have cited the new diversification strategy inBotswana and its infancy and the slow growth process by businessesin taking up trade and investment opportunities as challenges. As such,there are fears that freer trade may find them not ready to competewith more efficient producers.
The views of both non-state actors and businesses overlap on whatimpact regional integration would have on business operation andactivities. Both anticipate that regional integration will result in moretrade with cheaper inputs and more new business activities. At thesame time, not all see regional integration playing a major role inopening up more employment opportunities, raising domesticproduction and the level of investments abroad. The views of non-state actors and businesses on the anticipated changes to the costs oflabour, and access to cheaper inputs and the impact on domesticproduction vary.
196
The results from the analysis of the quantified estimated percentagechanges on employment, production, trade, investment, exports andimports to some extent tally for both businesses and non-state actors.Regional integration will have a positive impact on trade through anincrease in imports and exports among the SADC countries. Bothindicate that there will be a positive change on investment andproduction, while the effect on employment is largely not positive.That is, a significant proportion of businesses and non-state actorsreport that regional integration may not necessarily result in moreemployment.
With regard to the ongoing policy debate on SADC regionalintegration, non- state actors have not been involved to a significantextent on SADC regional integration issues. The same applies tobusinesses. The NSAs and the business community believe that theirinvolvement and participation on SADC regional integration issues,either through membership to SADC umbrella organisations orinvitation to workshops and seminars on relevant matters, may enhancetheir understanding of integration and how they can positionthemselves to exploit, to the maximum, the benefits and opportunitiesof greater SADC integration.
197
1 Introduction
In the past decade, countries in the SADC region have been strivingto achieve greater regional integration. The main overriding objective
for greater integration among SADC countries is to promote sustainableand equitable economic growth and socio-economic developmentthrough efficient productive systems, deeper cooperation andintegration, good governance, and durable peace and security. This isintended to enable the region to emerge as a competitive and effectiveplayer in the international economy.
This study is an initiative of the Friedrich Ebert Foundation inBotswana, in close consultation with the SADC Secretariat, to conductresearch that largely aims to assess the extent of regional integrationamong SADC countries through a series of country studies that focuson the impact of various macro-economic policies on the individualcountries in as far as greater integration is concerned. A central aspectof the study is to conduct a survey of non-state actors and businessesin each of the SADC countries, with a view to identifying theperceptions of businesses and non-state actors on regional integration.Also, the survey is intended to identify priority areas that need to beaddressed to accelerate the process of regional integration in SADCand to make it a success In addition. The analysis is intended to revealfactors that act as barriers to trade and highlight factors that businessesand non-state actors perceive as the possible impacts of regionalintegration in the broader economy and on their production activities,as well, as identify the costs and benefits of SADC integration.
The remainder of the report is structured as follows: Section III ofthe report details the methodology adopted in the survey, Section IVfocuses on the analysis of the data compiled from the business sectorand the non-state actors on their perceptions regarding regionalintegration in SADC. This section is divided into three subsections thatdiscuss the impact of regional integration as perceived by the businessand non-state actors, the perceived impact on domestic businessesand the factors that act as barriers to trade in the SADC region. SectionV analyses responses on respondents' involvement in policy debatesand the policy making process in SADC, while Section VI gives theconclusions drawn from the analysis of the survey in Botswana.

198
199
2 Methodology
A survey instrument with coded questions was developed for boththe non state actors and business community. The terms of
reference stipulated that the survey cover a minimum of 30 companiesand 10 non-state actor organisations or associations. The modeadopted for dispatching the survey instrument and for communicationor reaching the respondents was the e-mail system. The sample ofcompanies was selected from the various BIDPA project data basessuch as the Global Competitiveness Survey Data Base, theManufacturing Companies Data Base and the World Bank/BIDPA SurveyData Base. The list of non-state actors covered in the survey wascompiled from the Botswana Council of Non-GovernmentalOrganisations (BOCONGO) membership list, the BOCONGO BusinessDirectory and the national telephone directory, the Vision 2016 list ofstakeholders and companies, as well as the list of unions, associationsand civil society organisations provided by the FEF office in Botswana.
The response rate from the business sectors was low despite thenumerous follow up attempts through phone calls, re-sending the e-mails as well as faxing. Previous surveys that our institute has conductedin the business sector, have been more successful, due to the fact thatinterviews or survey were done on a one to one basis. In this study, theresponse rate was very low in Botswana because of the use of email.Phone and faxing. We have had numerous error messages from the e-mails that were sent to the businesses but despite the rigorous followup made with the contact persons, the rate of response was stilldisappointingly low. This is attributed the fact that e-mail is relatively anew mode of communication in the community and some companieshave difficulty with accessing their mails or server problems thatprohibited the efficient communication between ourselves and thebusiness which adversely affected our ability to obtain more responses.It is therefore, imperative that in analyzing the sample and drawingthe conclusion, one bears in mind the small size of the sample.
The non-state actors response rate was very high, 3 times thetargeted number compared to that of the businesses. This was achievedthrough a close interaction with FEF office in Gaborone which hasbeen running some workshop activities that provided a close working
200
relationship with the non-state actors. The poor communicationssystem made it difficult to cover other areas outside Gaborone due tolack of a proper functional e-mail system.
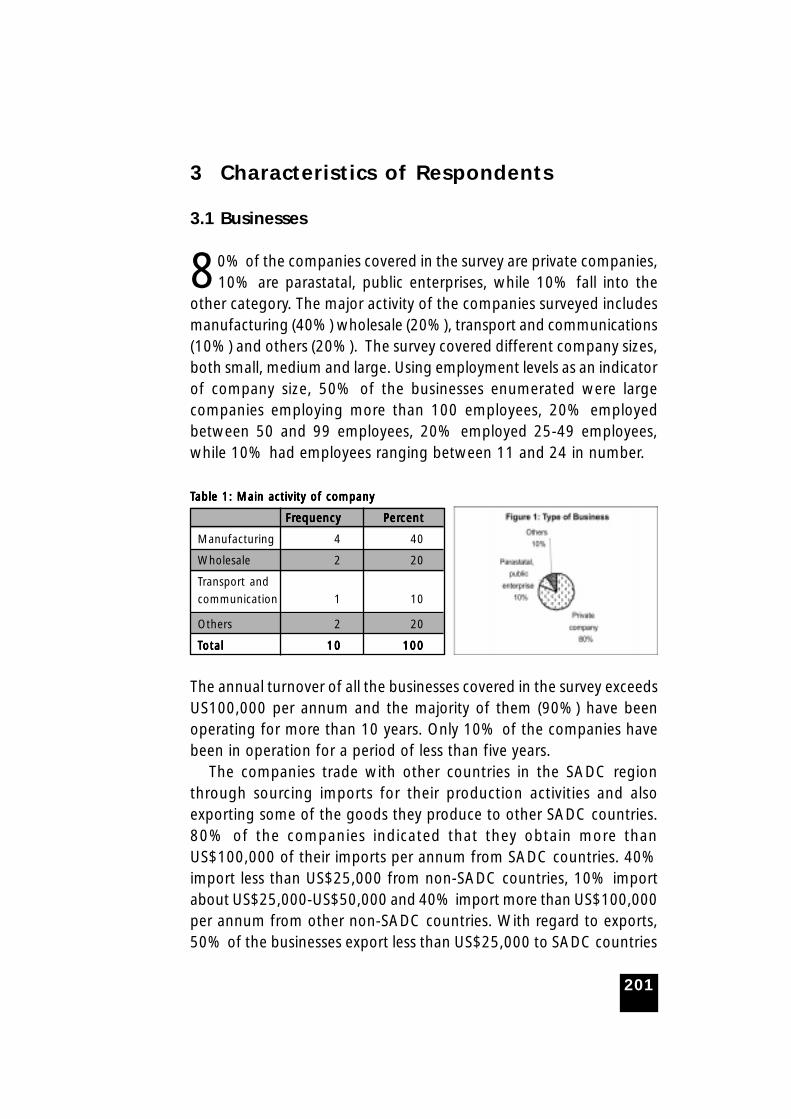
201
3 Characteristics of Respondents
3.1 Businesses
80% of the companies covered in the survey are private companies,10% are parastatal, public enterprises, while 10% fall into the
other category. The major activity of the companies surveyed includesmanufacturing (40%) wholesale (20%), transport and communications(10%) and others (20%). The survey covered different company sizes,both small, medium and large. Using employment levels as an indicatorof company size, 50% of the businesses enumerated were largecompanies employing more than 100 employees, 20% employedbetween 50 and 99 employees, 20% employed 25-49 employees,while 10% had employees ranging between 11 and 24 in number.
TTTTTable 1: Main activity of companyable 1: Main activity of companyable 1: Main activity of companyable 1: Main activity of companyable 1: Main activity of company
FrFrFrFrFrequencyequencyequencyequencyequency PerPerPerPerPercentcentcentcentcent
Manufacturing 4 40
Wholesale 2 20
Transport and
communication 1 10
Others 2 20
TTTTTotalotalotalotalotal 1010101010 100100100100100
The annual turnover of all the businesses covered in the survey exceedsUS100,000 per annum and the majority of them (90%) have beenoperating for more than 10 years. Only 10% of the companies havebeen in operation for a period of less than five years.
The companies trade with other countries in the SADC regionthrough sourcing imports for their production activities and alsoexporting some of the goods they produce to other SADC countries.80% of the companies indicated that they obtain more thanUS$100,000 of their imports per annum from SADC countries. 40%import less than US$25,000 from non-SADC countries, 10% importabout US$25,000-US$50,000 and 40% import more than US$100,000per annum from other non-SADC countries. With regard to exports,50% of the businesses export less than US$25,000 to SADC countries
202
annually, 30% export more than US$100,000 to SADC countries. Notmany companies in the sample of companies covered export to non-SADC countries, those that reported exports to other non-SADCcountries indicate that they export move to end goods valued at lessthan US$25,000 on an annual basis. The major export countriesidentified are South Africa, Namibia, Swaziland, and EU. The secondtier countries of export are South Africa, Zimbabwe and EU. Third tiercountries that businesses in Botswana export to include Lesotho,Namibia and South Africa. South Africa emerges as the major exportdestination, as well as a major source of imports.
70% of the companies indicate that they face strong competitionfrom South Africa and 20% indicate the existence of moderatecompetition from South Africa. The analysis reveals that 40% of thecompanies face strong to moderate competition from BLNS countries.The competition faced by Botswana firms from other SADC excludingthe BLNS, rest of Africa, EU Asia, USA, and the ROW is relatively weak.This analysis is consistent with trade statistics which have shown thatBotswana imports most of its goods from South Africa and thatBotswana firms do most of their business in South Africa.
3.2 Non-State Actors
The survey covered 29 non-state actor companies with 41% beingorganised labour organisations, 3% being other professionalassociations, 35% being other civil society organisations and 6% beingothers as indicated in the pie chart below. 55% of the organisationshave been in operation for more than 10 years, while 21% had beenoperating for a period of between 6 and 10 years. About 24% of theorganizations reported to have been operating for a period of 2-5years.
A very low number of the organisations, 10%, covered in the surveyare members of the SADC National Committee, while 52% reportedthat they had have membership to a regional umbrella organisation.

203
4 Perceptions on SADC RegionalIntegration
4.1 Impact of Regional Integration
The survey asked quite a number of questions aimed at assessingthe perceptions of both the businesses and non-state actors on
SADC regional integration. The following discussion highlights whatemerged from the analysis of responses given by the businesscommunity and non-state actors with regard to SADC regionalintegration in Botswana, mainly what possible impact regionalintegration may have on various factors.
A significant proportion of businesses, 80%, feel that regionalintegration in SADC will result in increased competition in the domesticmarket, provide new export opportunities and result in an influx ofimmigrants. From the figure below, it can be seen that 70% agreethat regional integration will result in a reduction in prices of consumergoods and provide new investment opportunities. A reduction in inputprices, increased efficiency and competitiveness, positive impact onother domestic producers, benefit the economy in general were someof the benefits that 60% of the companies believe will emanate fromSADC regional integration. A lower proportion of businesses, 40%,agree on the potential benefits of regional integration to reduceunemployment rates, lower costs of labour, as well as improve thehuman rights and political situation the country. Only 30% agree thatregional integration will have a positive impact on turnover.
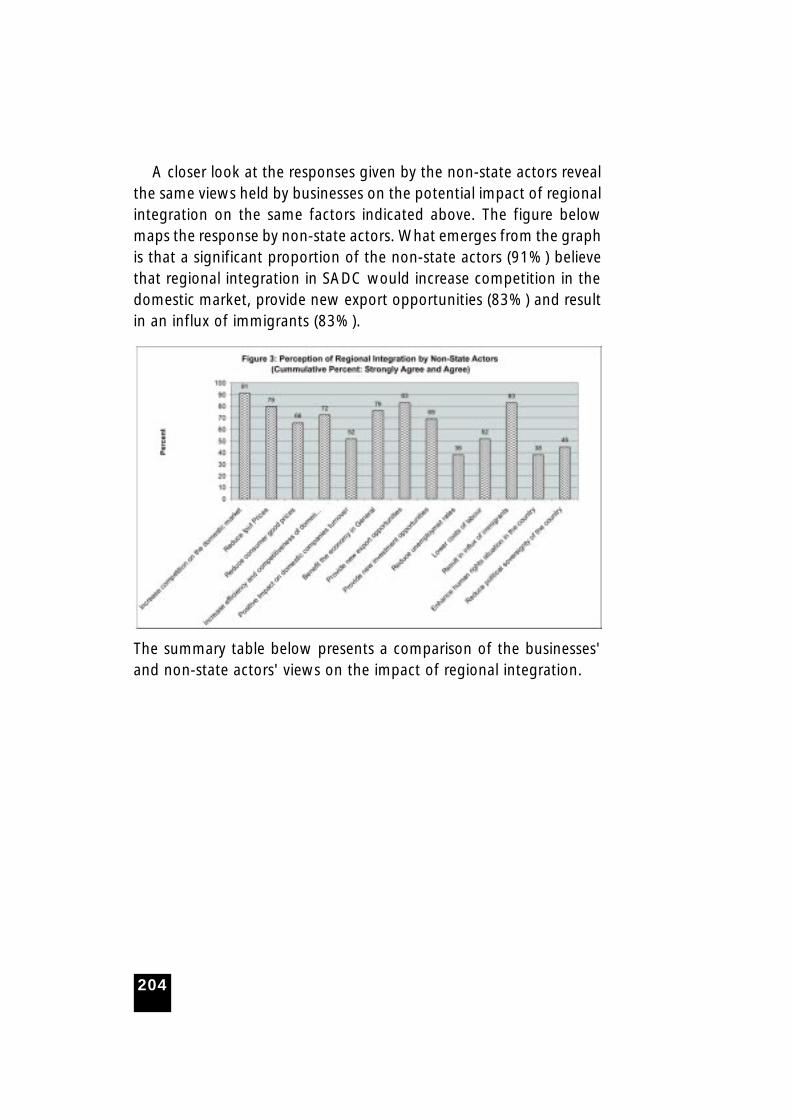
204
A closer look at the responses given by the non-state actors revealthe same views held by businesses on the potential impact of regionalintegration on the same factors indicated above. The figure belowmaps the response by non-state actors. What emerges from the graphis that a significant proportion of the non-state actors (91%) believethat regional integration in SADC would increase competition in thedomestic market, provide new export opportunities (83%) and resultin an influx of immigrants (83%).
The summary table below presents a comparison of the businesses'and non-state actors' views on the impact of regional integration.

205
TTTTTable 2: Impacts of SADC Regional Integration on Vable 2: Impacts of SADC Regional Integration on Vable 2: Impacts of SADC Regional Integration on Vable 2: Impacts of SADC Regional Integration on Vable 2: Impacts of SADC Regional Integration on Various Aspectsarious Aspectsarious Aspectsarious Aspectsarious Aspects
BusinessesBusinessesBusinessesBusinessesBusinesses Non-State Actors (PerNon-State Actors (PerNon-State Actors (PerNon-State Actors (PerNon-State Actors (Percent)cent)cent)cent)cent)
(Per(Per(Per(Per(Percent)cent)cent)cent)cent)
Increase competition in domestic market 80 91
Provide export opportunities 80 83
Result in influx of immigrants 80 83
Provide new investment opportunities 70 69
Reduce prices of consumer goods 70 66
Reduce input prices 60 79
Benefit the economy in general 60 76
Result in increased efficiency and
competitiveness 60 72
Positive impact on other domestic
producers 60
Reduce political sovereignty of country 50 45
Lower costs of labour 40 52
Reduce unemployment rates 40 38
Enhance human rights situation in the
country 40 38
Positive impact on turnover 30 52
The businesses, the non-state actors share the common view held bybusinesses that regional integration will reduce unemployment ratesand enhance the human rights situation in the country. What emergesfrom the analysis of both the business and non-state actor perceptions,is that there are some benefits and losses that may be derived fromgreater regional integration of SADC countries but, at the same time,there are fears that in countries where there is no strong industrialbase, as well as a favourable business and economic climate forinvestment and business growth, such benefits may not be realized inthe near future.
4.2 Impact on Domestic Businesses
The regional integration process in SADC ultimately aims to achievea free trade area among the SADC countries, more trade and a
reduction in the barriers for efficient trade among firms and countries.
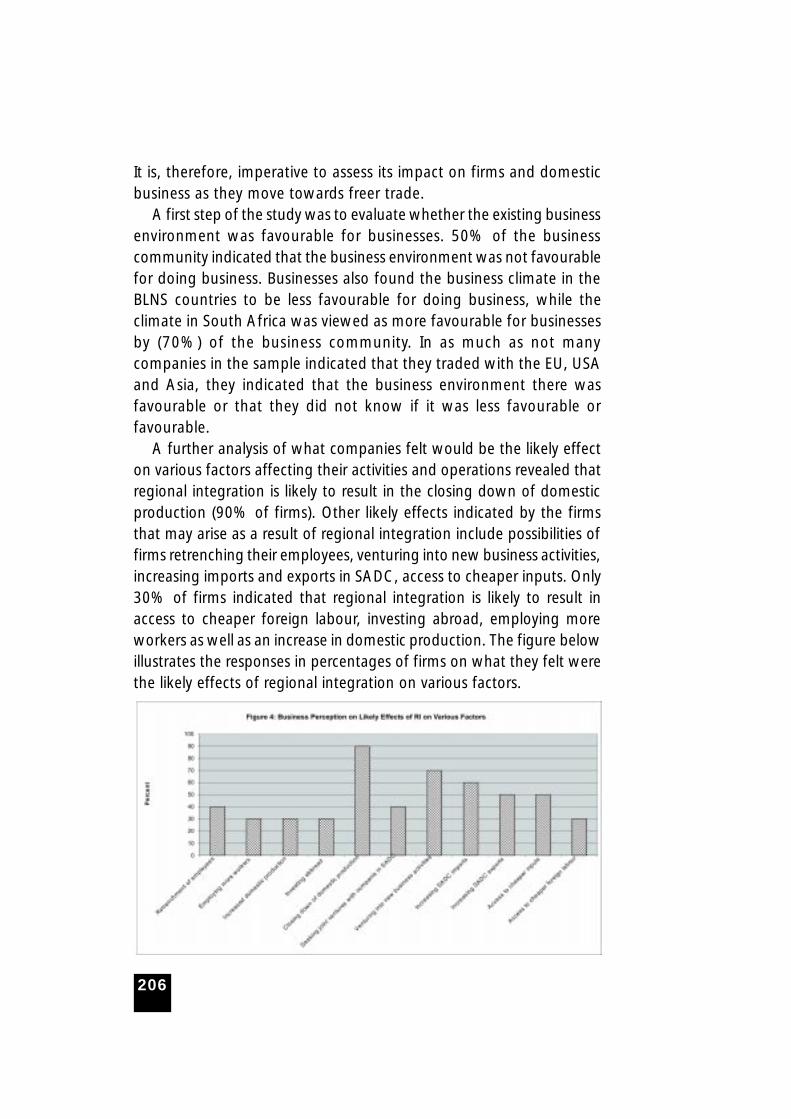
206
It is, therefore, imperative to assess its impact on firms and domesticbusiness as they move towards freer trade.
A first step of the study was to evaluate whether the existing businessenvironment was favourable for businesses. 50% of the businesscommunity indicated that the business environment was not favourablefor doing business. Businesses also found the business climate in theBLNS countries to be less favourable for doing business, while theclimate in South Africa was viewed as more favourable for businessesby (70%) of the business community. In as much as not manycompanies in the sample indicated that they traded with the EU, USAand Asia, they indicated that the business environment there wasfavourable or that they did not know if it was less favourable orfavourable.
A further analysis of what companies felt would be the likely effecton various factors affecting their activities and operations revealed thatregional integration is likely to result in the closing down of domesticproduction (90% of firms). Other likely effects indicated by the firmsthat may arise as a result of regional integration include possibilities offirms retrenching their employees, venturing into new business activities,increasing imports and exports in SADC, access to cheaper inputs. Only30% of firms indicated that regional integration is likely to result inaccess to cheaper foreign labour, investing abroad, employing moreworkers as well as an increase in domestic production. The figure belowillustrates the responses in percentages of firms on what they felt werethe likely effects of regional integration on various factors.
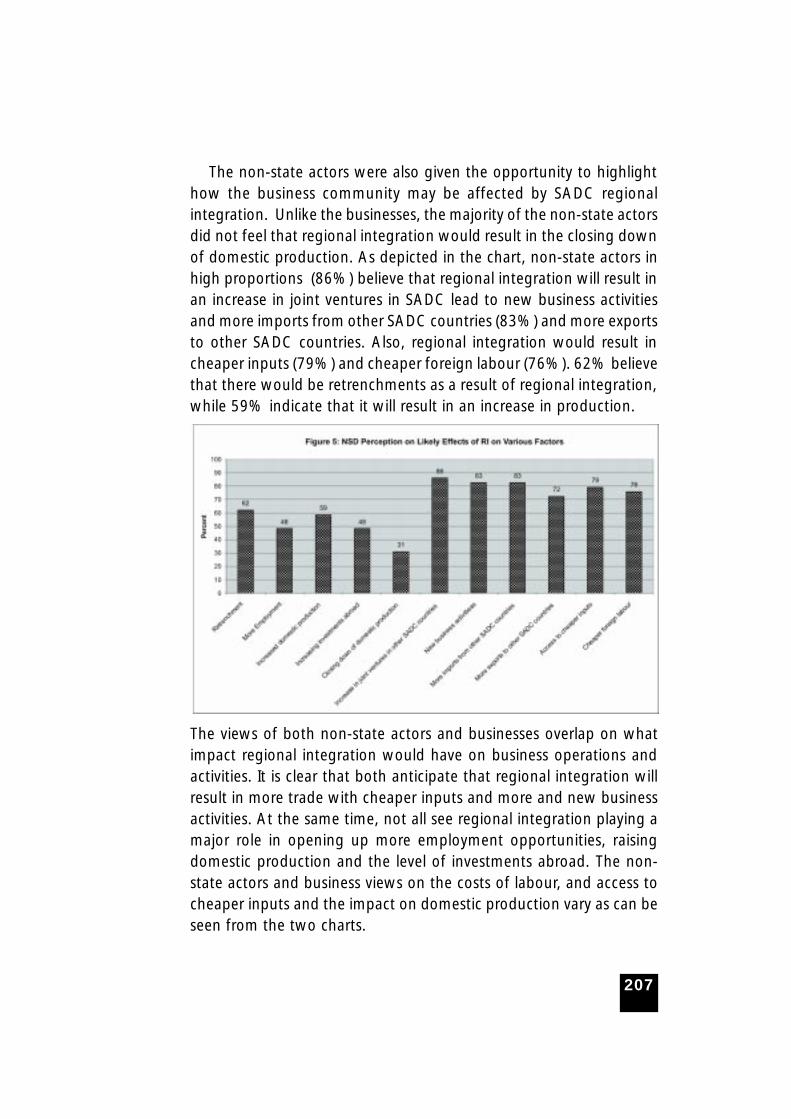
207
The non-state actors were also given the opportunity to highlighthow the business community may be affected by SADC regionalintegration. Unlike the businesses, the majority of the non-state actorsdid not feel that regional integration would result in the closing downof domestic production. As depicted in the chart, non-state actors inhigh proportions (86%) believe that regional integration will result inan increase in joint ventures in SADC lead to new business activitiesand more imports from other SADC countries (83%) and more exportsto other SADC countries. Also, regional integration would result incheaper inputs (79%) and cheaper foreign labour (76%). 62% believethat there would be retrenchments as a result of regional integration,while 59% indicate that it will result in an increase in production.
The views of both non-state actors and businesses overlap on whatimpact regional integration would have on business operations andactivities. It is clear that both anticipate that regional integration willresult in more trade with cheaper inputs and more and new businessactivities. At the same time, not all see regional integration playing amajor role in opening up more employment opportunities, raisingdomestic production and the level of investments abroad. The non-state actors and business views on the costs of labour, and access tocheaper inputs and the impact on domestic production vary as can beseen from the two charts.
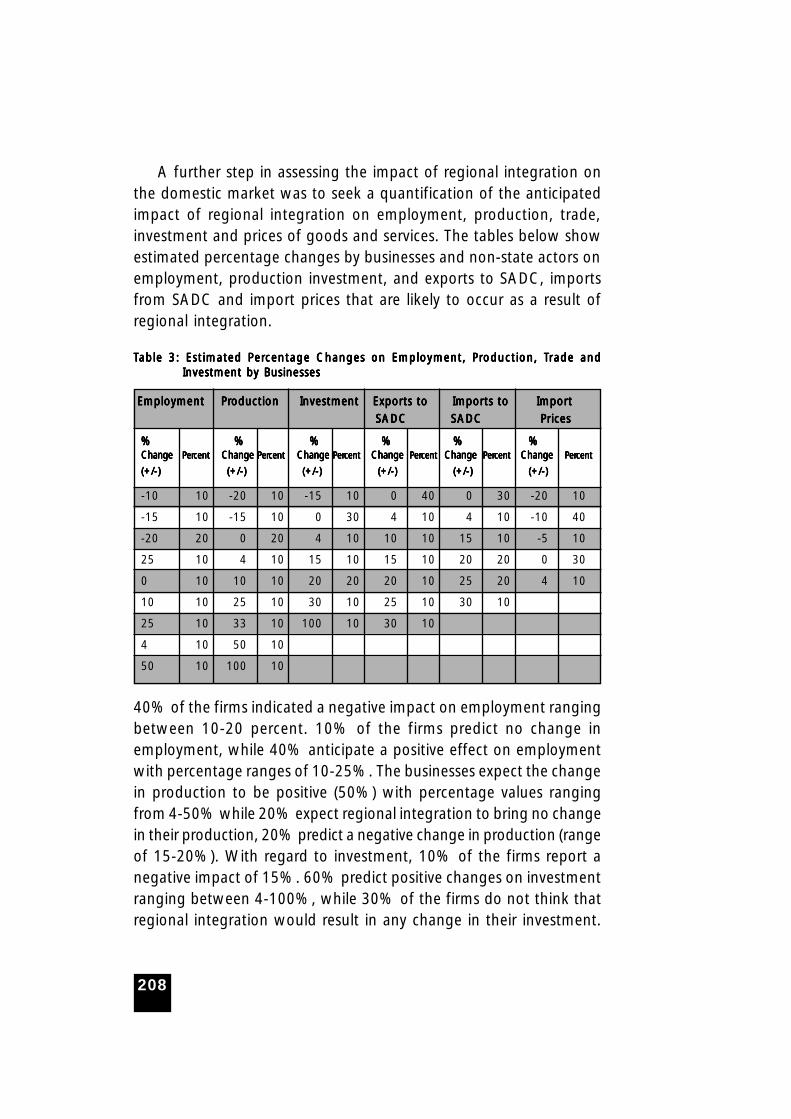
208
A further step in assessing the impact of regional integration onthe domestic market was to seek a quantification of the anticipatedimpact of regional integration on employment, production, trade,investment and prices of goods and services. The tables below showestimated percentage changes by businesses and non-state actors onemployment, production investment, and exports to SADC, importsfrom SADC and import prices that are likely to occur as a result ofregional integration.
TTTTTable 3: Estimated Perable 3: Estimated Perable 3: Estimated Perable 3: Estimated Perable 3: Estimated Percentage Changes on Employment, Prcentage Changes on Employment, Prcentage Changes on Employment, Prcentage Changes on Employment, Prcentage Changes on Employment, Production, Toduction, Toduction, Toduction, Toduction, Trade andrade andrade andrade andrade andInvestment by BusinessesInvestment by BusinessesInvestment by BusinessesInvestment by BusinessesInvestment by Businesses
Employment PrEmployment PrEmployment PrEmployment PrEmployment Production Investmentoduction Investmentoduction Investmentoduction Investmentoduction Investment Exports to Imports toExports to Imports toExports to Imports toExports to Imports toExports to Imports to Import Import Import Import Import
SADC SADC SADC SADC SADC SADC SADC SADC SADC SADC Prices Prices Prices Prices Prices
%%%%% %%%%% %%%%% %%%%% %%%%% %%%%%ChangeChangeChangeChangeChange PerPerPerPerPercentcentcentcentcent ChangeChangeChangeChangeChange PerPerPerPerPercentcentcentcentcent ChangeChangeChangeChangeChange PerPerPerPerPercentcentcentcentcent ChangeChangeChangeChangeChange PerPerPerPerPercentcentcentcentcent ChangeChangeChangeChangeChange PerPerPerPerPercentcentcentcentcent ChangeChangeChangeChangeChange PerPerPerPerPercentcentcentcentcent
(+/-)(+/-)(+/-)(+/-)(+/-) (+/-)(+/-)(+/-)(+/-)(+/-) (+/-)(+/-)(+/-)(+/-)(+/-) (+/-)(+/-)(+/-)(+/-)(+/-) (+/-)(+/-)(+/-)(+/-)(+/-) (+/-)(+/-)(+/-)(+/-)(+/-)
-10 10 -20 10 -15 10 0 40 0 30 -20 10
-15 10 -15 10 0 30 4 10 4 10 -10 40
-20 20 0 20 4 10 10 10 15 10 -5 10
25 10 4 10 15 10 15 10 20 20 0 30
0 10 10 10 20 20 20 10 25 20 4 10
10 10 25 10 30 10 25 10 30 10
25 10 33 10 100 10 30 10
4 10 50 10
50 10 100 10
40% of the firms indicated a negative impact on employment rangingbetween 10-20 percent. 10% of the firms predict no change inemployment, while 40% anticipate a positive effect on employmentwith percentage ranges of 10-25%. The businesses expect the changein production to be positive (50%) with percentage values rangingfrom 4-50% while 20% expect regional integration to bring no changein their production, 20% predict a negative change in production (rangeof 15-20%). With regard to investment, 10% of the firms report anegative impact of 15%. 60% predict positive changes on investmentranging between 4-100%, while 30% of the firms do not think thatregional integration would result in any change in their investment.
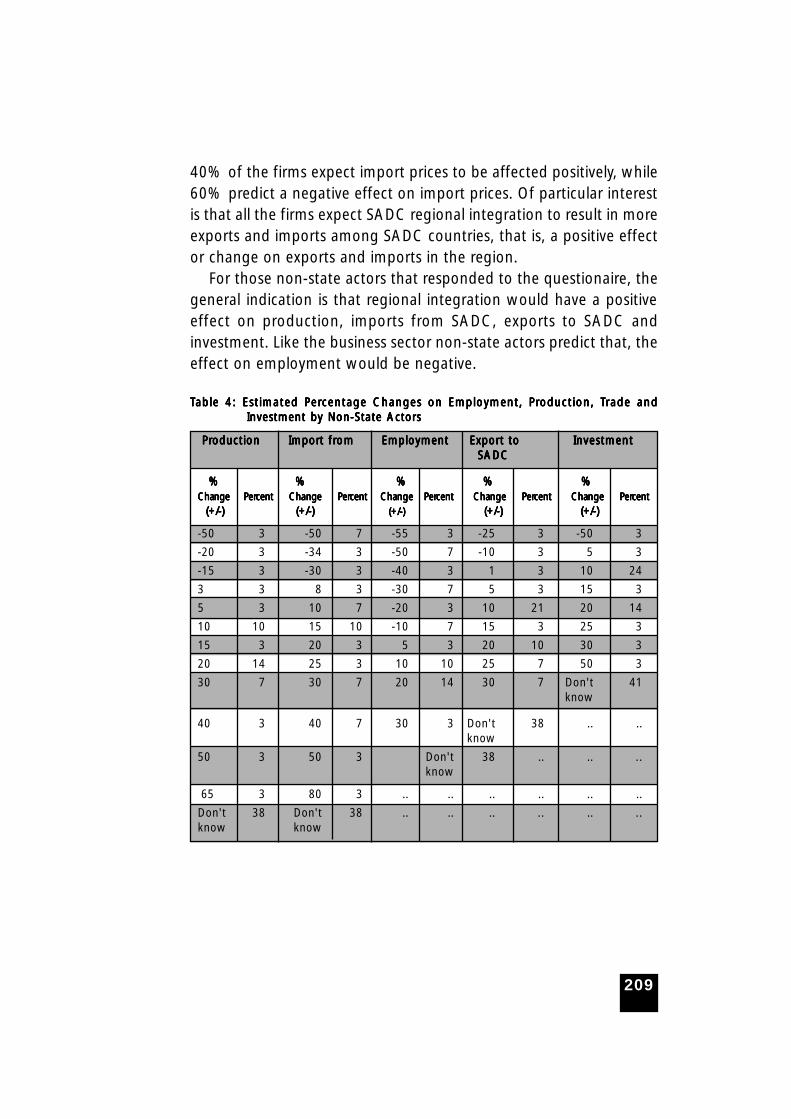
209
40% of the firms expect import prices to be affected positively, while60% predict a negative effect on import prices. Of particular interestis that all the firms expect SADC regional integration to result in moreexports and imports among SADC countries, that is, a positive effector change on exports and imports in the region.
For those non-state actors that responded to the questionaire, thegeneral indication is that regional integration would have a positiveeffect on production, imports from SADC, exports to SADC andinvestment. Like the business sector non-state actors predict that, theeffect on employment would be negative.
TTTTTable 4: Estimated Perable 4: Estimated Perable 4: Estimated Perable 4: Estimated Perable 4: Estimated Percentage Changes on Employment, Prcentage Changes on Employment, Prcentage Changes on Employment, Prcentage Changes on Employment, Prcentage Changes on Employment, Production, Toduction, Toduction, Toduction, Toduction, Trade andrade andrade andrade andrade andInvestment by Non-State ActorsInvestment by Non-State ActorsInvestment by Non-State ActorsInvestment by Non-State ActorsInvestment by Non-State Actors
Pr Pr Pr Pr Production Imporoduction Imporoduction Imporoduction Imporoduction Import frt frt frt frt fromomomomom Employment Export toEmployment Export toEmployment Export toEmployment Export toEmployment Export to InvestmentInvestmentInvestmentInvestmentInvestment SADC SADC SADC SADC SADC
%%%%% %%%%% %%%%% %%%%% %%%%%ChaChaChaChaChangengengengenge PerPerPerPerPercentcentcentcentcent ChangeChangeChangeChangeChange PerPerPerPerPercentcentcentcentcent ChaChaChaChaChangengengengenge PerPerPerPerPercentcentcentcentcent ChaChaChaChaChangengengengenge PerPerPerPerPercentcentcentcentcent ChaChaChaChaChangengengengenge PerPerPerPerPercentcentcentcentcent
(+/-)(+/-)(+/-)(+/-)(+/-) (+/-)(+/-)(+/-)(+/-)(+/-) (+/-)(+/-)(+/-)(+/-)(+/-) (+/-)(+/-)(+/-)(+/-)(+/-) (+/-)(+/-)(+/-)(+/-)(+/-)
-50 3 -50 7 -55 3 -25 3 -50 3
-20 3 -34 3 -50 7 -10 3 5 3
-15 3 -30 3 -40 3 1 3 10 24
3 3 8 3 -30 7 5 3 15 3
5 3 10 7 -20 3 10 21 20 14
10 10 15 10 -10 7 15 3 25 3
15 3 20 3 5 3 20 10 30 3
20 14 25 3 10 10 25 7 50 3
30 7 30 7 20 14 30 7 Don't 41know
40 3 40 7 30 3 Don't 38 .. ..know
50 3 50 3 Don't 38 .. .. ..know
65 3 80 3 .. .. .. .. .. ..
Don't 38 Don't 38 .. .. .. .. .. ..know know
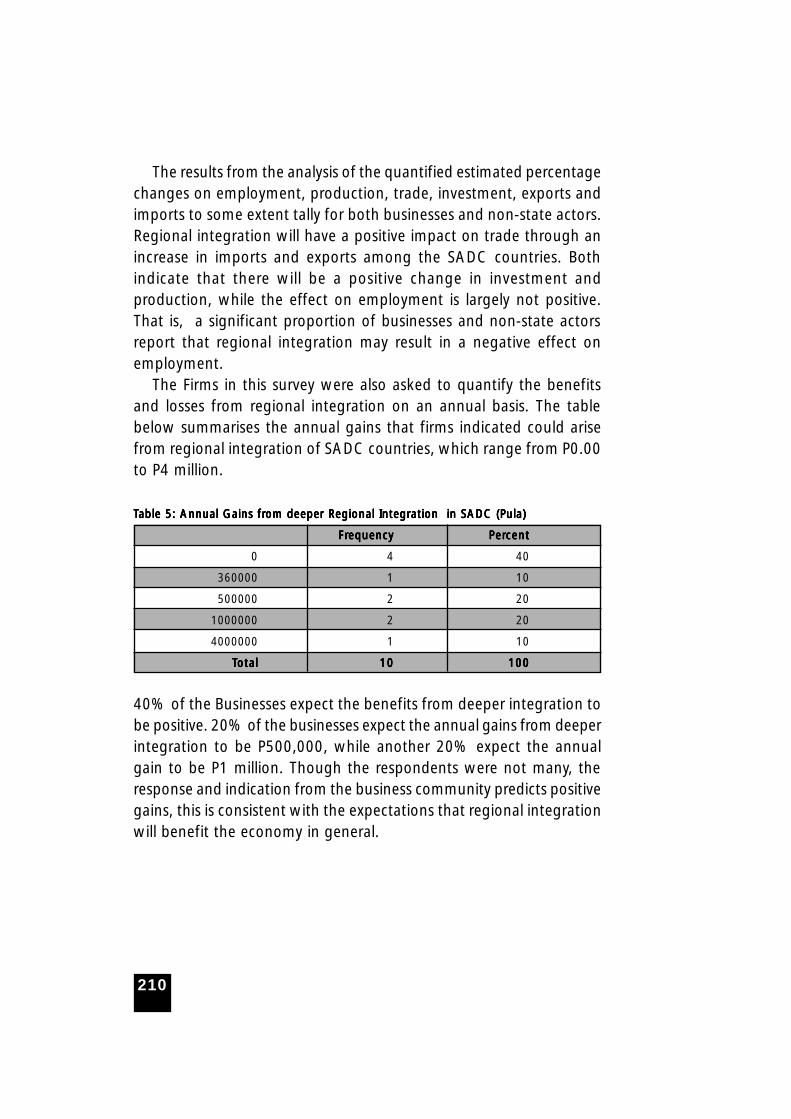
210
The results from the analysis of the quantified estimated percentagechanges on employment, production, trade, investment, exports andimports to some extent tally for both businesses and non-state actors.Regional integration will have a positive impact on trade through anincrease in imports and exports among the SADC countries. Bothindicate that there will be a positive change in investment andproduction, while the effect on employment is largely not positive.That is, a significant proportion of businesses and non-state actorsreport that regional integration may result in a negative effect onemployment.
The Firms in this survey were also asked to quantify the benefitsand losses from regional integration on an annual basis. The tablebelow summarises the annual gains that firms indicated could arisefrom regional integration of SADC countries, which range from P0.00to P4 million.
TTTTTable 5: Annual Gains frable 5: Annual Gains frable 5: Annual Gains frable 5: Annual Gains frable 5: Annual Gains from deeper Regional Integration in SADC (Pula)om deeper Regional Integration in SADC (Pula)om deeper Regional Integration in SADC (Pula)om deeper Regional Integration in SADC (Pula)om deeper Regional Integration in SADC (Pula)
FrFrFrFrFrequencyequencyequencyequencyequency PerPerPerPerPercentcentcentcentcent
0 4 40
360000 1 10
500000 2 20
1000000 2 20
4000000 1 10
TTTTTotalotalotalotalotal 1010101010 100100100100100
40% of the Businesses expect the benefits from deeper integration tobe positive. 20% of the businesses expect the annual gains from deeperintegration to be P500,000, while another 20% expect the annualgain to be P1 million. Though the respondents were not many, theresponse and indication from the business community predicts positivegains, this is consistent with the expectations that regional integrationwill benefit the economy in general.

211
4.3 Barriers to Trade
The table below gives a summary break down of factors thatemerged as barriers to trade that were identified by businesses
and non-state actors in order of importance.
TTTTTable 6: Relevant Barable 6: Relevant Barable 6: Relevant Barable 6: Relevant Barable 6: Relevant Barriers to Triers to Triers to Triers to Triers to Trade within SADC by Businesses and Non-State Actorsrade within SADC by Businesses and Non-State Actorsrade within SADC by Businesses and Non-State Actorsrade within SADC by Businesses and Non-State Actorsrade within SADC by Businesses and Non-State Actors
BusinessesBusinessesBusinessesBusinessesBusinesses PerPerPerPerPercentcentcentcentcent Non State ActorsNon State ActorsNon State ActorsNon State ActorsNon State Actors PerPerPerPerPercentcentcentcentcent
High regional communication costs 80 High regional communication costs 86
High transport costs 70 Lack of information about foreign markets 83
Import duties and taxes paid in cash 70 High transport costs 83
Weak regional transport infrastructure 70 Export/import licenses and permitsrequired 76
Lack of information about foreignmarkets 60 Bureaucracy 76
Exchange rate uncertainty 60 Time consuming customs procedures 72
Poor regional communicationinfrastructure 60 Exchange rate uncertainty 72
Visa requirements for traveling Import Duties and taxes 62
abroad 60
Customs tariffs 60 Poor regional communication
infrastructure 55
Risk of non payment by customs Weak regional transport infrastructure 55abroad 60
Export/import licenses and permits Non-transparent rules and regulations 55required 50 abroad
Substantial paper works andbureaucracy 50 Visa requirements for traveling abroad 55
Time consuming customs Customs tariffs as trade barriers 52procedures 50
Weak law enforcement in export Risk of non-payment of customsdestination 50 abroad 52
Lack of transparency of rules and Export Insurance to cover forregulations abroad 40 exports abroad 45
Corruption of officials 40 Corrupt officials 41
Rules of origin 30 Rules of origin 41
No export insurance to cover Weak law enforcement inpayment risks of exports 20 export destinations 38
SPS regulations 20 Sanitary and phyto-sanitory
regulations 35
Both businesses (80%) and non-state actors (86%) found highregional communication costs to be a major barrier to trade in the
212
region. The other important barriers to trade identified by a highpercentage of businesses and non-state actors, as indicated in thetable above are the high transport costs and weak regionalinfrastructure, lack of information about foreign markets, export/importlicenses and permits required and the time consuming customsprocedures. The factors identified as barriers to trade are similar tothose that were identified in a country-wide study in Botswana thatsought to identify the administrative and regulatory costs of doingbusiness in Botswana. The high transport costs, high costs for licensesand permits as well as the cumbersome and time consumingprocedures, emerged as the major barriers to doing business inBotswana (BIDPA/World Bank, 2004). Exchange rate uncertainty wasalso found to be a major barrier to trade in Botswana; and this iscurrently a major topic of debate following the two currencydevaluations and the introduction of a new exchange rate policy (7.5%devaluation in February 2004, 12% devaluation in May 2005 andintroduction of the crawling peg).
213
5 Policy Debate on SADC Integration andThe Way Forward
As already alluded to in the above sections, only 10% of the non-state actors indicated that they were members of the SADC
National Committee. Businesses reported that they were not involvedin the SADC debate and there were no workshops and seminars towhich that addressed issues pertaining to SADC regional integrationthat they were invited to participate . The non-state actors in generalfelt that regional integration in SADC would slightly strengthen theirinvolvement in policy making slightly. 12% of the non-state actorsbelieved that their involvement in policy making would be stronger asa result of regional integration. 10% indicated that their involvementwould weaken slightly, while 19% did not expect regional integrationto bring any changes to their involvement in policy making. 30% didnot know whether regional integration would have any impact ontheir involvement in the policy making sphere.
The Non-state actors also share the same concerns as the businesseson the lack of involvement in SADC meetings, workshops and thepolicy making/design. In Botswana, both respondents indicate no activeparticipation in COMESA or EAC regional integration issues and mostof them did not have knowledge about the ongoing policy debates inas far as the integration of EAC and COMESA is concerned.
Despite the lack of active participation in the SADC regional policydebate that is ongoing, businesses and non-state actors are in favourof SADC regional integration.
Taking the cumulative percentages for those that agree stronglyand agree slightly as reflecting the position of the parties on theimplementation of regional integration in SADC, it can be concludedthat generally the support for regional integration is positive althoughthere are costs as indicated in the previous discussion which alluded tothe fact that the benefits for regional integration will be higher incountries where the industrial and production base is already stronger.30% of the businesses indicate that they are strongly in favour ofregional integration, while 14% of the non-state actors are stronglyin favour of SADC integration. 50% of businesses are slightly in favour.
214
Higher percentages are reported by both businesses (50%) and nonstate actors (69%) on their being in favour of regional integration ingeneral.
While the respondents support regional integration within SADC,there are a host of factors that they wish regional integration to addressand there is variation in the extent to which they want regionalintegration to go. All businesses (100%) and about 85% of the non-state actors want regional integration to reduce tariffs within the SADCregion. Other factors deemed important for regional integration includeremoval of restrictions on the free movement of services within SADC,design of competition policies for SADC as a whole, removing tariffsand establishing a common external tariff with all other countries.The two charts below map out these factors in order of importance asreported by the respondents from the businesses and non-state actors.
The views of both businesses and non-state actors regarding whatregional integration should entail within the SADC region are notsignificantly different. The factors that are deemed the most importantoverlap for the first top 5 factors.
The respondents emphasise the need for capacity building for themto be able to understand regional integration issues, its benefits andwhat role they can play to maximize the benefits of SADC regionalintegration. The type of capacity building should include assistancewith critical information that would enhance the roles thatorganizations and businesses have to play. The importance of raisingawareness through workshops and seminars, as well as the involvementof businesses and non state actors in SADC National Committeemeetings and national policy making, are critical issues that should beconsidered in promoting the role played by businesses and non actorsin SADC regional integration. Transparency and access to informationpertaining to SADC issues and assistance with the necessary fundingare among the important factors that the respondents indicated asvital if they are to exploit the benefits of regional integration and makeit a success in SADC.
215
6 Conclusions
What emerges from this survey is that there is general supportfor SADC regional integration by both businesses and non-state
actors in Botswana. Both expect deeper SADC integration to benefitthe economy in general, bring new trade and investment opportunities.The views of both non-state actors and businesses overlap on whatimpact regional integration would have on business operation andactivities. Both anticipate that regional integration will result in moretrade with cheaper inputs and more and new business activities. Atthe same time, not all see regional integration playing a major role inopening up more employment opportunities, raising domesticproduction and the level of investments abroad.
The results from the analysis of the quantified estimated percentagechanges on employment, production, trade, investment, exports andimports to some extent tally for both businesses and non-state actors.Regional integration will have a positive impact on trade through anincrease in imports and exports among the SADC countries. Bothindicate that there will be a positive change in investment andproduction, while the effect on employment is largely not positive.
A further analysis of what companies felt would be the likely effecton various factors affecting their activities and operations revealedthat regional integration is likely to result in the closing down ofdomestic production. Other likely effects, indicated by the firms, thatmay arise as a result of regional integration include of firms retrenchingtheir employees, venturing into new business activities, increasingimports and exports in SADC, access to cheaper inputs. Only 30%indicated that regional integration is likely to result in access to cheaperforeign labour, investing abroad, employing more workers, as well asan increase in domestic production.
The survey reveals that the businesses and non-state actors are notactively involved in the SADC regional integration policy makingprocess. This is one area where policy makers need to enhance publicawareness mechanisms to ensure information sharing either throughworkshops or seminars that will engage both non-state actors andthe business community. Such a step will go a long way in ensuringthat non-state actors and businesses play a role on issues that are

216
relevant to them and allow them to position themselves effectively toexplore the benefits of regional integration.
The respondents emphasise the need for capacity building for themto be able to understand regional integration issues, its benefits andwhat role they can play to maximize the benefits of SADC regionalintegration. Transparency and access to information pertaining to SADCissues and assistance with the necessary funding are among theimportant factors that the respondents indicated as vital if they are toexploit the benefits of regional integration and make it a success inSADC.
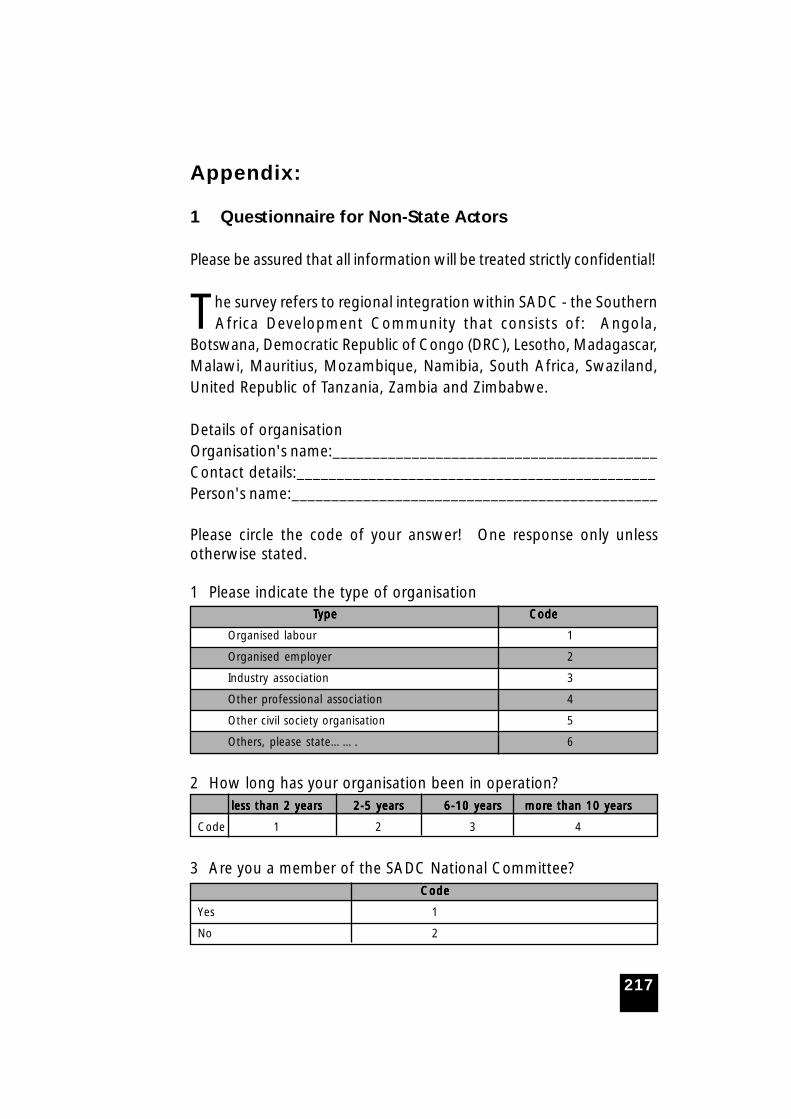
217
Appendix:
1 Questionnaire for Non-State Actors
Please be assured that all information will be treated strictly confidential!
The survey refers to regional integration within SADC - the SouthernAfrica Development Community that consists of: Angola,
Botswana, Democratic Republic of Congo (DRC), Lesotho, Madagascar,Malawi, Mauritius, Mozambique, Namibia, South Africa, Swaziland,United Republic of Tanzania, Zambia and Zimbabwe.
Details of organisationOrganisation's name:_________________________________________Contact details:_____________________________________________Person's name:______________________________________________
Please circle the code of your answer! One response only unlessotherwise stated.
1 Please indicate the type of organisation T T T T Typeypeypeypeype Code Code Code Code Code
Organised labour 1
Organised employer 2
Industry association 3
Other professional association 4
Other civil society organisation 5
Others, please state……. 6
2 How long has your organisation been in operation?less than 2 yearsless than 2 yearsless than 2 yearsless than 2 yearsless than 2 years 2-5 years2-5 years2-5 years2-5 years2-5 years 6-10 years6-10 years6-10 years6-10 years6-10 years mormormormormore than 10 yearse than 10 yearse than 10 yearse than 10 yearse than 10 years
Code 1 2 3 4
3 Are you a member of the SADC National Committee?CodeCodeCodeCodeCode
Yes 1
No 2

218
4 Are you a member of a regional umbrella organisation?CodeCodeCodeCodeCode
Yes 1
No 2
Perceptions on regional integration within SADC
5 How would you rate the following statements? Regional integrationwithin SADC will...
QuestionQuestionQuestionQuestionQuestion AgrAgrAgrAgrAgreeeeeeeeee AgrAgrAgrAgrAgreeeeeeeeee DisagrDisagrDisagrDisagrDisagreeeeeeeeee DisagrDisagrDisagrDisagrDisagreeeeeeeeee Don't knowDon't knowDon't knowDon't knowDon't know
strstrstrstrstronglyonglyonglyonglyongly strstrstrstrstronglyonglyonglyonglyongly
5.1 … increase competitionon the domestic market 1 2 3 4 5
5.2 … reduce prices of inputs 1 2 3 4 5
5.3 … reduce prices ofconsumer goods 1 2 3 4 5
5.4 … result in increasedefficiency of domesticproduction to staycompetitive 1 2 3 4 5
5.5 …have positive impactson domestic companies'turnover 1 2 3 4 5
5.6 …benefit the economyin general
5.7 …provide new exportopportunities 1 2 3 4 5
5.8 …provide new investmentopportunities 1 2 3 4 5
5.9 …reduce unemploymentrate 1 2 3 4 5
5.10 …lower costs of labour 1 2 3 4 5
5.11 …result in influx ofimmigrants 1 2 3 4 5
5.12 …enhance human rightssituation in the country 1 2 3 4 5
5.13 …reduce political sovereigntyof my country 1 2 3 4 5
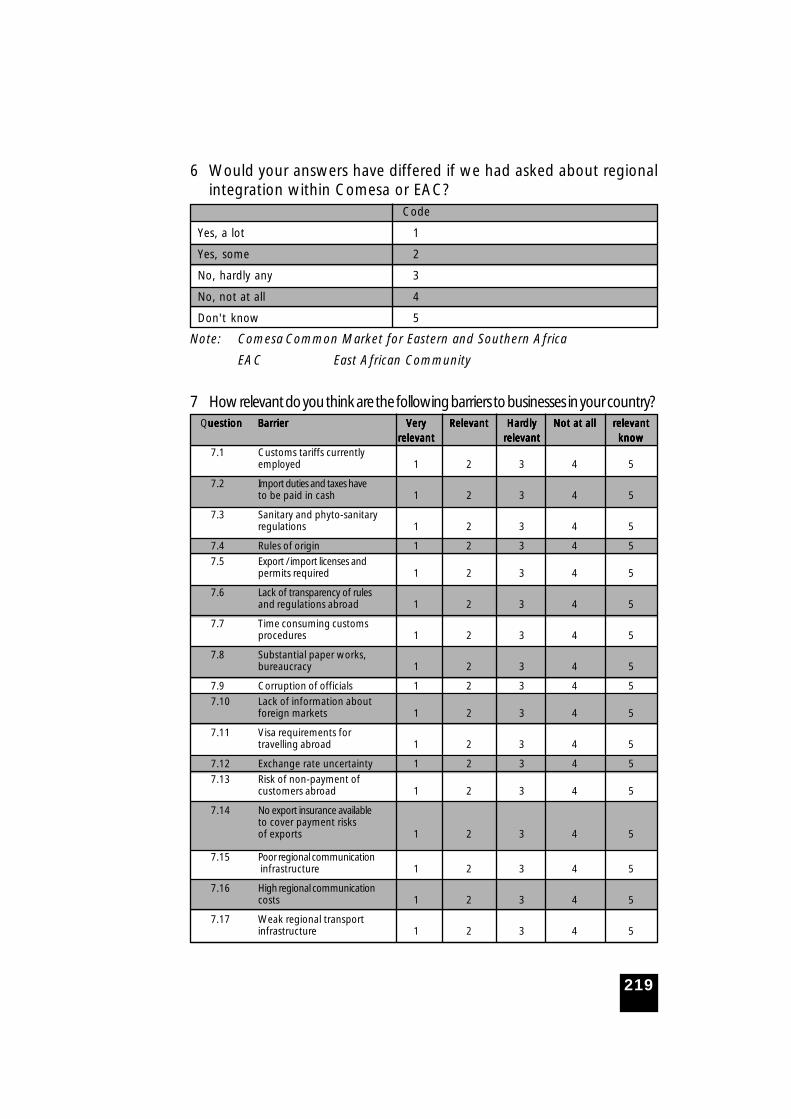
219
6 Would your answers have differed if we had asked about regionalintegration within Comesa or EAC?
Code
Yes, a lot 1
Yes, some 2
No, hardly any 3
No, not at all 4
Don't know 5
Note: Comesa Common Market for Eastern and Southern Africa
EAC East African Community
7 How relevant do you think are the following barriers to businesses in your country? Questionuestionuestionuestionuestion BarrierBarrierBarrierBarrierBarrier VVVVVerererereryyyyy RelevantRelevantRelevantRelevantRelevant HarHarHarHarHardlydlydlydlydly Not at allNot at allNot at allNot at allNot at all rrrrrelevantelevantelevantelevantelevant
rrrrrelevantelevantelevantelevantelevant rrrrrelevantelevantelevantelevantelevant knowknowknowknowknow7.1 Customs tariffs currently
employed 1 2 3 4 5
7.2 Import duties and taxes haveto be paid in cash 1 2 3 4 5
7.3 Sanitary and phyto-sanitaryregulations 1 2 3 4 5
7.4 Rules of origin 1 2 3 4 5
7.5 Export / import licenses andpermits required 1 2 3 4 5
7.6 Lack of transparency of rulesand regulations abroad 1 2 3 4 5
7.7 Time consuming customsprocedures 1 2 3 4 5
7.8 Substantial paper works,bureaucracy 1 2 3 4 5
7.9 Corruption of officials 1 2 3 4 5
7.10 Lack of information aboutforeign markets 1 2 3 4 5
7.11 Visa requirements fortravelling abroad 1 2 3 4 5
7.12 Exchange rate uncertainty 1 2 3 4 5
7.13 Risk of non-payment ofcustomers abroad 1 2 3 4 5
7.14 No export insurance availableto cover payment risksof exports 1 2 3 4 5
7.15 Poor regional communication infrastructure 1 2 3 4 5
7.16 High regional communicationcosts 1 2 3 4 5
7.17 Weak regional transportinfrastructure 1 2 3 4 5
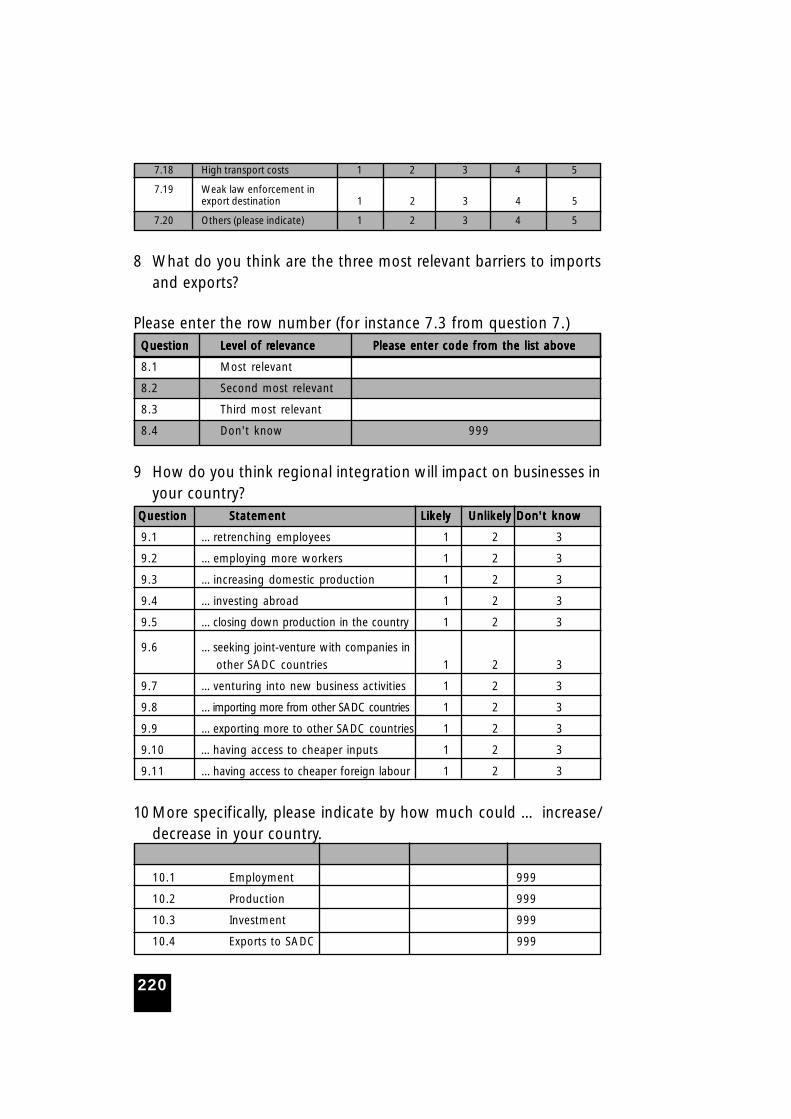
220
7.18 High transport costs 1 2 3 4 5
7.19 Weak law enforcement inexport destination 1 2 3 4 5
7.20 Others (please indicate) 1 2 3 4 5
8 What do you think are the three most relevant barriers to importsand exports?
Please enter the row number (for instance 7.3 from question 7.)QuestionQuestionQuestionQuestionQuestion Level of rLevel of rLevel of rLevel of rLevel of relevanceelevanceelevanceelevanceelevance Please enter code frPlease enter code frPlease enter code frPlease enter code frPlease enter code from the list aboveom the list aboveom the list aboveom the list aboveom the list above
8.1 Most relevant
8.2 Second most relevant
8.3 Third most relevant
8.4 Don't know 999
9 How do you think regional integration will impact on businesses inyour country?
QuestionQuestionQuestionQuestionQuestion StatementStatementStatementStatementStatement LikelyLikelyLikelyLikelyLikely UnlikelyUnlikelyUnlikelyUnlikelyUnlikely Don't knowDon't knowDon't knowDon't knowDon't know
9.1 …retrenching employees 1 2 3
9.2 …employing more workers 1 2 3
9.3 …increasing domestic production 1 2 3
9.4 …investing abroad 1 2 3
9.5 …closing down production in the country 1 2 3
9.6 …seeking joint-venture with companies in
other SADC countries 1 2 3
9.7 …venturing into new business activities 1 2 3
9.8 …importing more from other SADC countries 1 2 3
9.9 …exporting more to other SADC countries 1 2 3
9.10 …having access to cheaper inputs 1 2 3
9.11 …having access to cheaper foreign labour 1 2 3
10 More specifically, please indicate by how much could … increase/decrease in your country.QuestionQuestionQuestionQuestionQuestion IncrIncrIncrIncrIncrease in %ease in %ease in %ease in %ease in % DecrDecrDecrDecrDecrease in %ease in %ease in %ease in %ease in % Don't knowDon't knowDon't knowDon't knowDon't know
10.1 Employment 999
10.2 Production 999
10.3 Investment 999
10.4 Exports to SADC 999
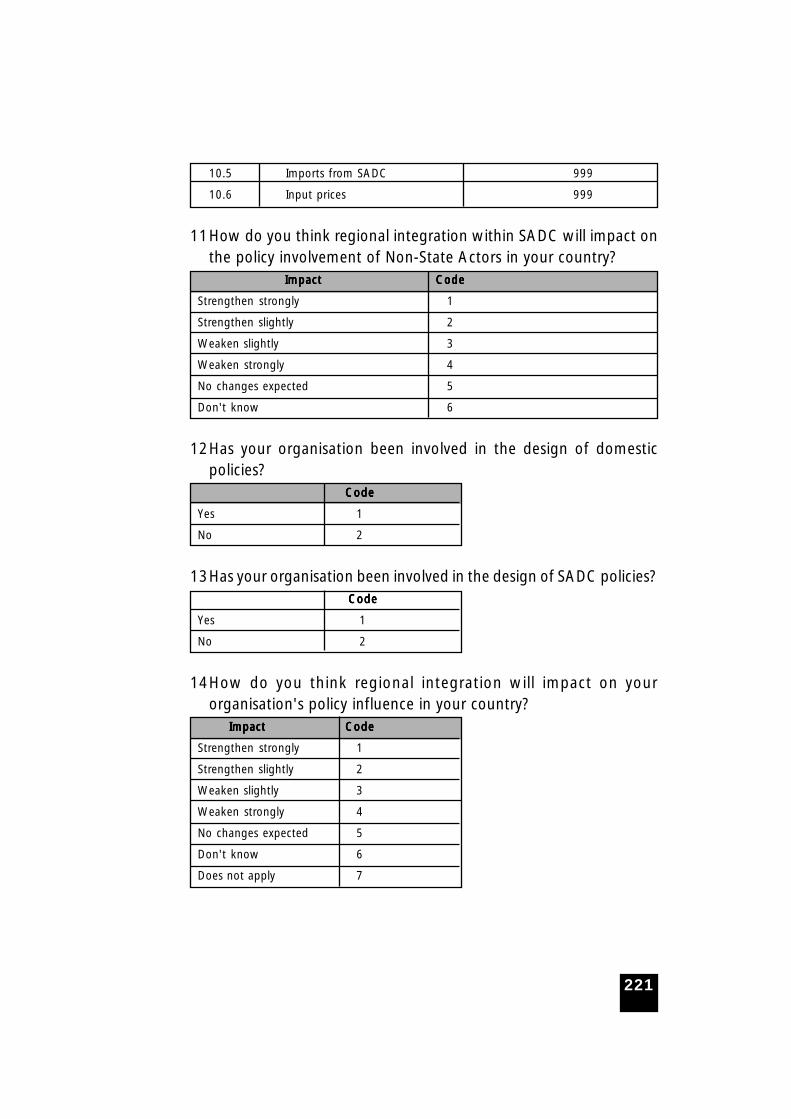
221
10.5 Imports from SADC 999
10.6 Input prices 999
11How do you think regional integration within SADC will impact onthe policy involvement of Non-State Actors in your country?
ImpactImpactImpactImpactImpact CodeCodeCodeCodeCode
Strengthen strongly 1
Strengthen slightly 2
Weaken slightly 3
Weaken strongly 4
No changes expected 5
Don't know 6
12Has your organisation been involved in the design of domesticpolicies?
CodeCodeCodeCodeCode
Yes 1
No 2
13Has your organisation been involved in the design of SADC policies?CodeCodeCodeCodeCode
Yes 1
No 2
14How do you think regional integration will impact on yourorganisation's policy influence in your country?
Impact Impact Impact Impact Impact CodeCodeCodeCodeCode
Strengthen strongly 1
Strengthen slightly 2
Weaken slightly 3
Weaken strongly 4
No changes expected 5
Don't know 6
Does not apply 7
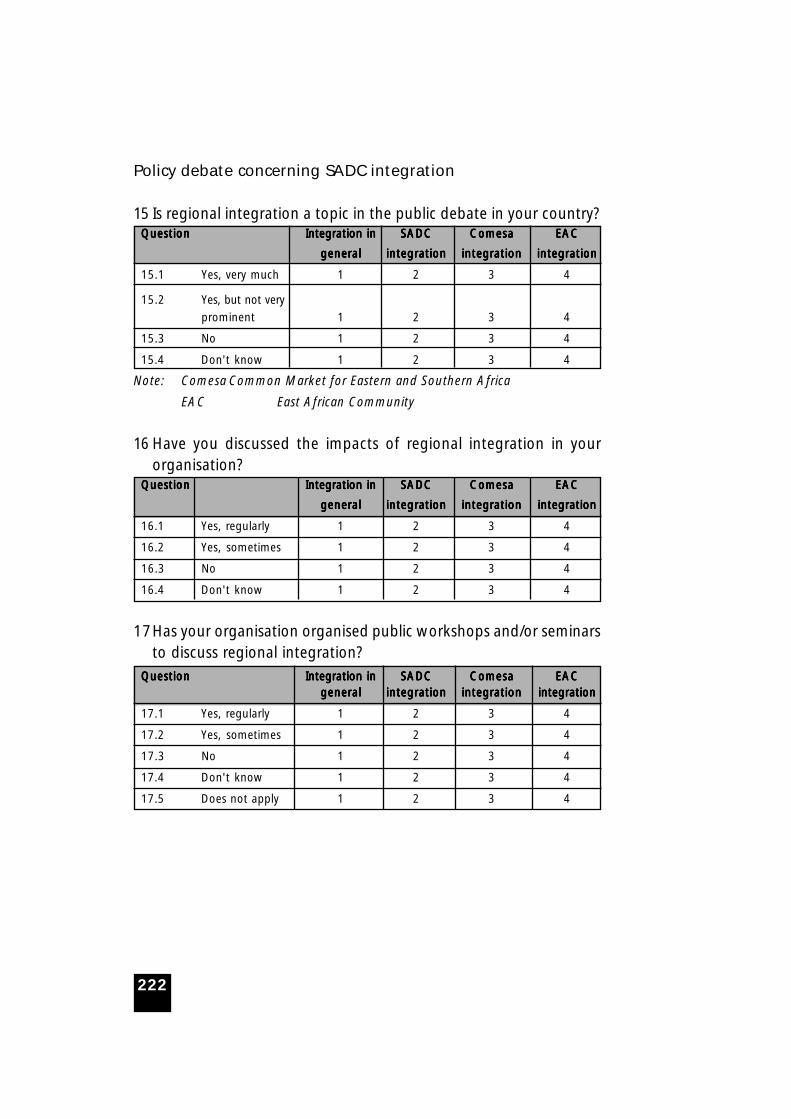
222
Policy debate concerning SADC integration
15 Is regional integration a topic in the public debate in your country?QuestionQuestionQuestionQuestionQuestion Integration inIntegration inIntegration inIntegration inIntegration in SADCSADCSADCSADCSADC ComesaComesaComesaComesaComesa EACEACEACEACEAC
generalgeneralgeneralgeneralgeneral integrationintegrationintegrationintegrationintegration integrationintegrationintegrationintegrationintegration integrationintegrationintegrationintegrationintegration
15.1 Yes, very much 1 2 3 4
15.2 Yes, but not very
prominent 1 2 3 4
15.3 No 1 2 3 4
15.4 Don't know 1 2 3 4
Note: Comesa Common Market for Eastern and Southern Africa
EAC East African Community
16 Have you discussed the impacts of regional integration in yourorganisation?
QuestionQuestionQuestionQuestionQuestion Integration inIntegration inIntegration inIntegration inIntegration in SADCSADCSADCSADCSADC ComesaComesaComesaComesaComesa EACEACEACEACEAC
generalgeneralgeneralgeneralgeneral integrationintegrationintegrationintegrationintegration integrationintegrationintegrationintegrationintegration integrationintegrationintegrationintegrationintegration
16.1 Yes, regularly 1 2 3 4
16.2 Yes, sometimes 1 2 3 4
16.3 No 1 2 3 4
16.4 Don't know 1 2 3 4
17Has your organisation organised public workshops and/or seminarsto discuss regional integration?
QuestionQuestionQuestionQuestionQuestion Integration inIntegration inIntegration inIntegration inIntegration in SADCSADCSADCSADCSADC ComesaComesaComesaComesaComesa EACEACEACEACEACgeneralgeneralgeneralgeneralgeneral integrationintegrationintegrationintegrationintegration integrationintegrationintegrationintegrationintegration integrationintegrationintegrationintegrationintegration
17.1 Yes, regularly 1 2 3 4
17.2 Yes, sometimes 1 2 3 4
17.3 No 1 2 3 4
17.4 Don't know 1 2 3 4
17.5 Does not apply 1 2 3 4
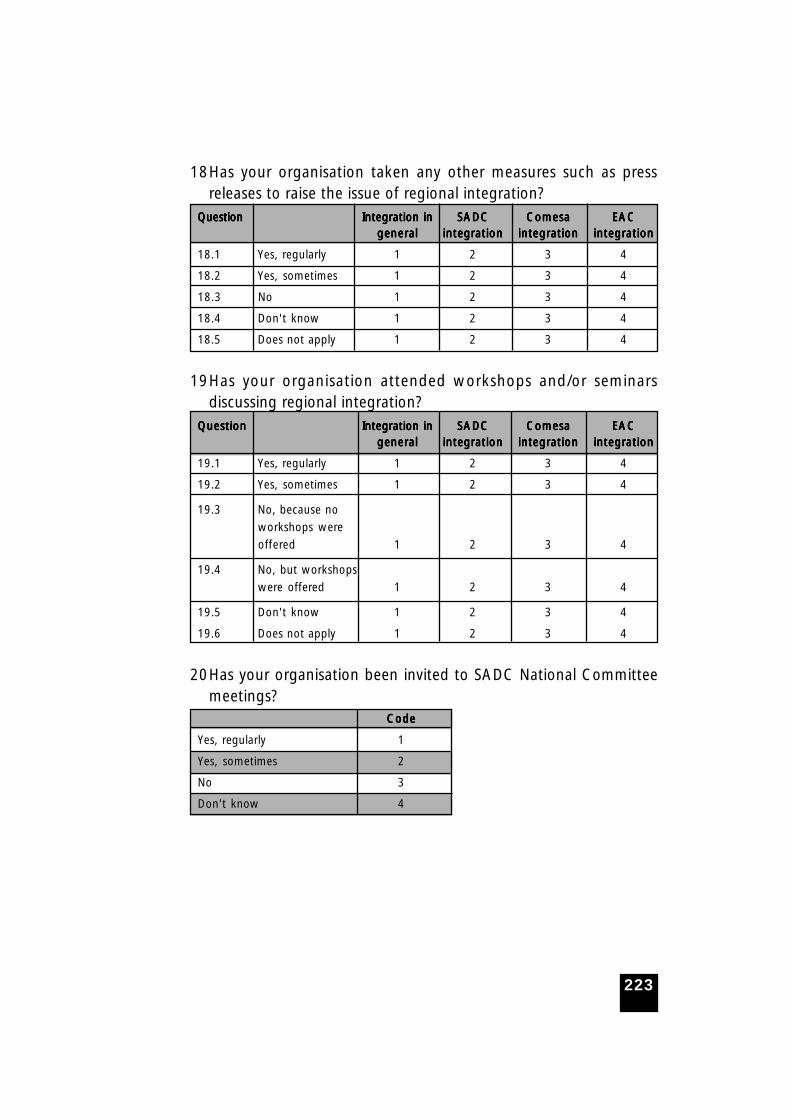
223
18Has your organisation taken any other measures such as pressreleases to raise the issue of regional integration?
QuestionQuestionQuestionQuestionQuestion Integration inIntegration inIntegration inIntegration inIntegration in SADCSADCSADCSADCSADC ComesaComesaComesaComesaComesa EACEACEACEACEACgeneralgeneralgeneralgeneralgeneral integrationintegrationintegrationintegrationintegration integrationintegrationintegrationintegrationintegration integrationintegrationintegrationintegrationintegration
18.1 Yes, regularly 1 2 3 4
18.2 Yes, sometimes 1 2 3 4
18.3 No 1 2 3 4
18.4 Don't know 1 2 3 4
18.5 Does not apply 1 2 3 4
19Has your organisation attended workshops and/or seminarsdiscussing regional integration?
QuestionQuestionQuestionQuestionQuestion Integration inIntegration inIntegration inIntegration inIntegration in SADCSADCSADCSADCSADC ComesaComesaComesaComesaComesa EACEACEACEACEACgeneralgeneralgeneralgeneralgeneral integrationintegrationintegrationintegrationintegration integrationintegrationintegrationintegrationintegration integrationintegrationintegrationintegrationintegration
19.1 Yes, regularly 1 2 3 4
19.2 Yes, sometimes 1 2 3 4
19.3 No, because no
workshops were
offered 1 2 3 4
19.4 No, but workshops
were offered 1 2 3 4
19.5 Don't know 1 2 3 4
19.6 Does not apply 1 2 3 4
20Has your organisation been invited to SADC National Committeemeetings?
CodeCodeCodeCodeCode
Yes, regularly 1
Yes, sometimes 2
No 3
Don't know 4
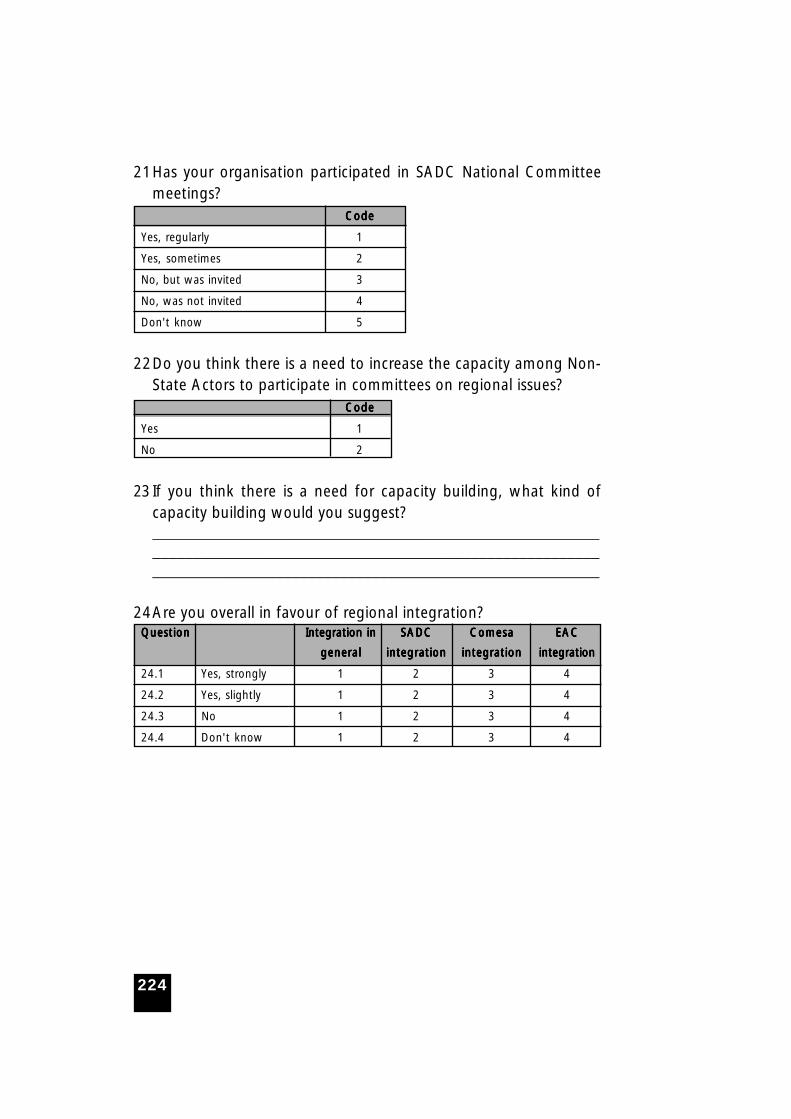
224
21Has your organisation participated in SADC National Committeemeetings?
CodeCodeCodeCodeCode
Yes, regularly 1
Yes, sometimes 2
No, but was invited 3
No, was not invited 4
Don't know 5
22Do you think there is a need to increase the capacity among Non-State Actors to participate in committees on regional issues?
CodeCodeCodeCodeCode
Yes 1
No 2
23 If you think there is a need for capacity building, what kind ofcapacity building would you suggest?________________________________________________________________________________________________________________________________________________________________________
24Are you overall in favour of regional integration?QuestionQuestionQuestionQuestionQuestion Integration inIntegration inIntegration inIntegration inIntegration in SADCSADCSADCSADCSADC ComesaComesaComesaComesaComesa EACEACEACEACEAC
generalgeneralgeneralgeneralgeneral integrationintegrationintegrationintegrationintegration integrationintegrationintegrationintegrationintegration integrationintegrationintegrationintegrationintegration
24.1 Yes, strongly 1 2 3 4
24.2 Yes, slightly 1 2 3 4
24.3 No 1 2 3 4
24.4 Don't know 1 2 3 4
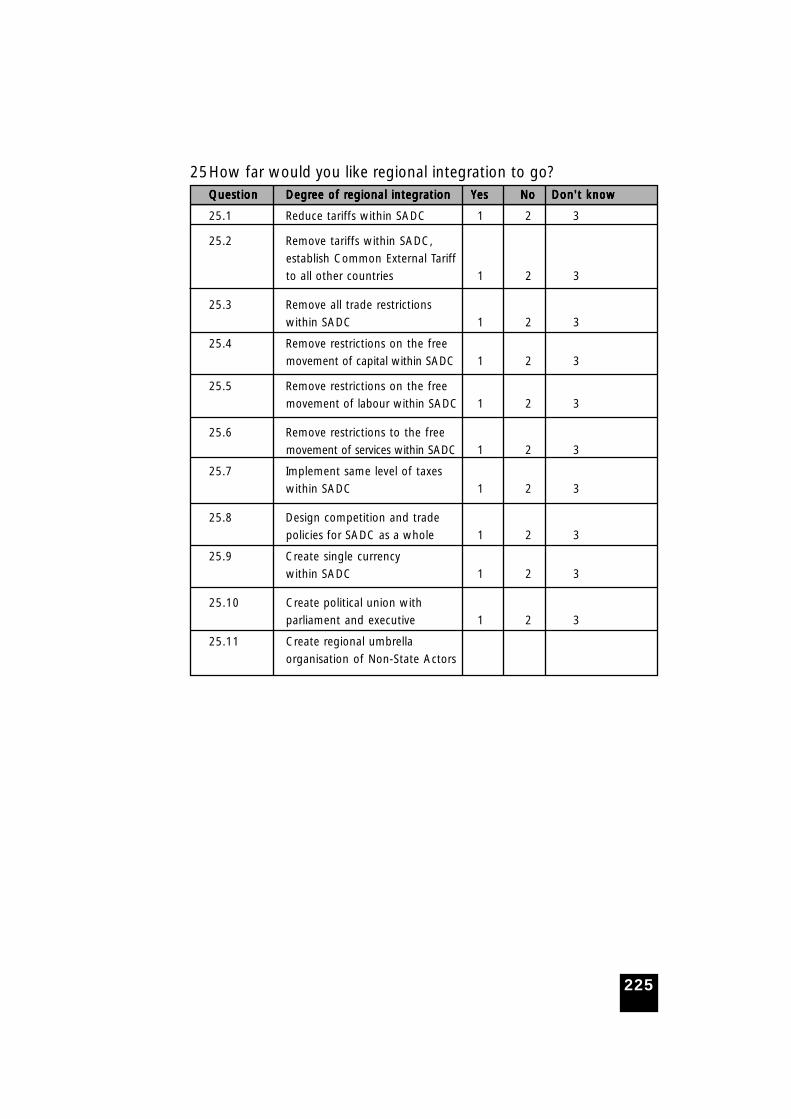
225
25How far would you like regional integration to go?QuestionQuestionQuestionQuestionQuestion DegrDegrDegrDegrDegree of ree of ree of ree of ree of regional integration Yegional integration Yegional integration Yegional integration Yegional integration Yes No Don't knowes No Don't knowes No Don't knowes No Don't knowes No Don't know
25.1 Reduce tariffs within SADC 1 2 3
25.2 Remove tariffs within SADC,
establish Common External Tariff
to all other countries 1 2 3
25.3 Remove all trade restrictions
within SADC 1 2 3
25.4 Remove restrictions on the free
movement of capital within SADC 1 2 3
25.5 Remove restrictions on the free
movement of labour within SADC 1 2 3
25.6 Remove restrictions to the free
movement of services within SADC 1 2 3
25.7 Implement same level of taxes
within SADC 1 2 3
25.8 Design competition and trade
policies for SADC as a whole 1 2 3
25.9 Create single currency
within SADC 1 2 3
25.10 Create political union with
parliament and executive 1 2 3
25.11 Create regional umbrella
organisation of Non-State Actors
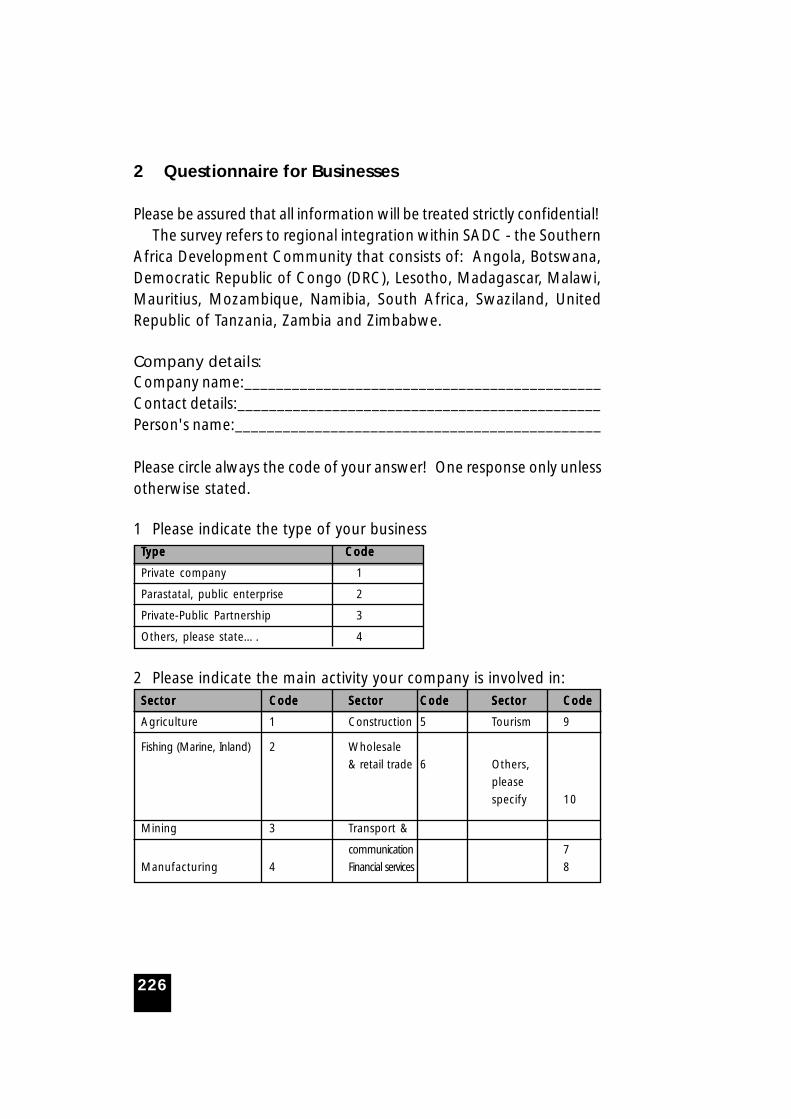
226
2 Questionnaire for Businesses
Please be assured that all information will be treated strictly confidential!The survey refers to regional integration within SADC - the Southern
Africa Development Community that consists of: Angola, Botswana,Democratic Republic of Congo (DRC), Lesotho, Madagascar, Malawi,Mauritius, Mozambique, Namibia, South Africa, Swaziland, UnitedRepublic of Tanzania, Zambia and Zimbabwe.
Company details:Company name:_____________________________________________Contact details:______________________________________________Person's name:______________________________________________
Please circle always the code of your answer! One response only unlessotherwise stated.
1 Please indicate the type of your businessTTTTTypeypeypeypeype CodeCodeCodeCodeCode
Private company 1
Parastatal, public enterprise 2
Private-Public Partnership 3
Others, please state…. 4
2 Please indicate the main activity your company is involved in:SectorSectorSectorSectorSector CodeCodeCodeCodeCode SectorSectorSectorSectorSector CodeCodeCodeCodeCode SectorSectorSectorSectorSector CodeCodeCodeCodeCode
Agriculture 1 Construction 5 Tourism 9
Fishing (Marine, Inland) 2 Wholesale
& retail trade 6 Others,
please
specify 10
Mining 3 Transport &
communication 7
Manufacturing 4 Financial services 8
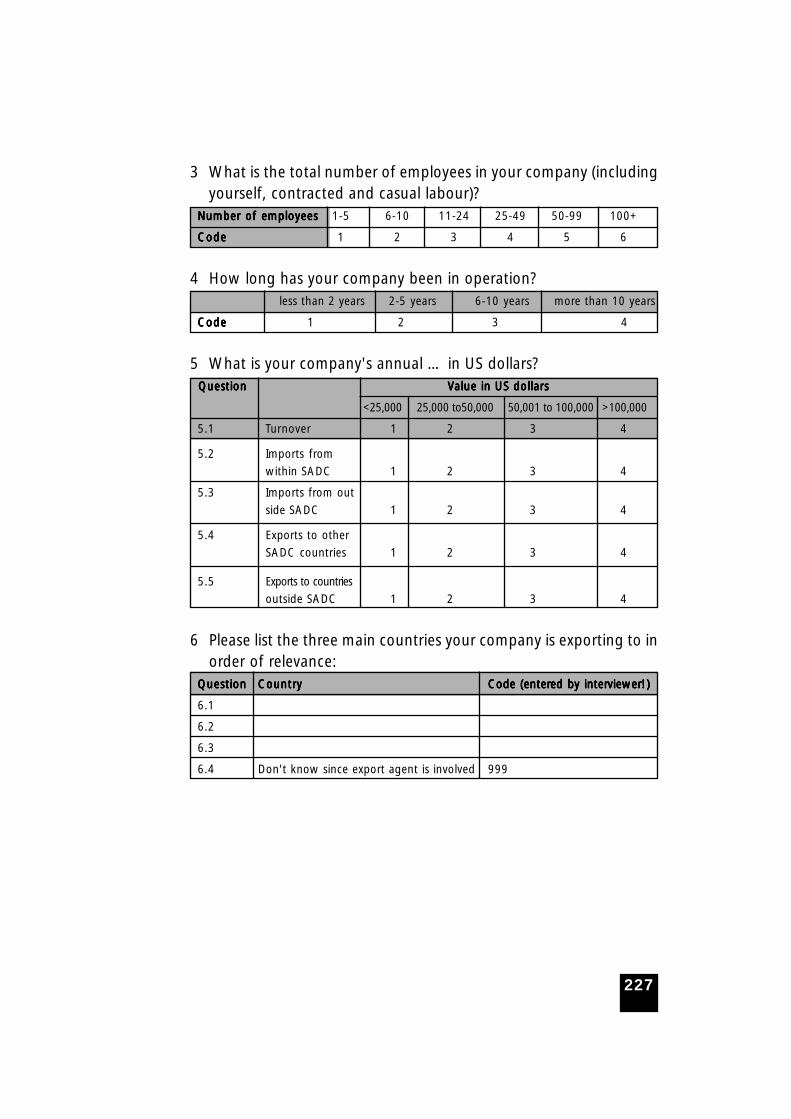
227
3 What is the total number of employees in your company (includingyourself, contracted and casual labour)?
Number of employeesNumber of employeesNumber of employeesNumber of employeesNumber of employees 1-5 6-10 11-24 25-49 50-99 100+
CodeCodeCodeCodeCode 1 2 3 4 5 6
4 How long has your company been in operation?less than 2 years 2-5 years 6-10 years more than 10 years
CodeCodeCodeCodeCode 1 2 3 4
5 What is your company's annual … in US dollars? Question Question Question Question Question V V V V Value in US dollarsalue in US dollarsalue in US dollarsalue in US dollarsalue in US dollars
<25,000 25,000 to50,000 50,001 to 100,000 >100,000
5.1 Turnover 1 2 3 4
5.2 Imports from
within SADC 1 2 3 4
5.3 Imports from out
side SADC 1 2 3 4
5.4 Exports to other
SADC countries 1 2 3 4
5.5 Exports to countries
outside SADC 1 2 3 4
6 Please list the three main countries your company is exporting to inorder of relevance:
QuestionQuestionQuestionQuestionQuestion CountryCountryCountryCountryCountry Code (enterCode (enterCode (enterCode (enterCode (entered by intered by intered by intered by intered by interviewer!)viewer!)viewer!)viewer!)viewer!)
6.1
6.2
6.3
6.4 Don't know since export agent is involved 999
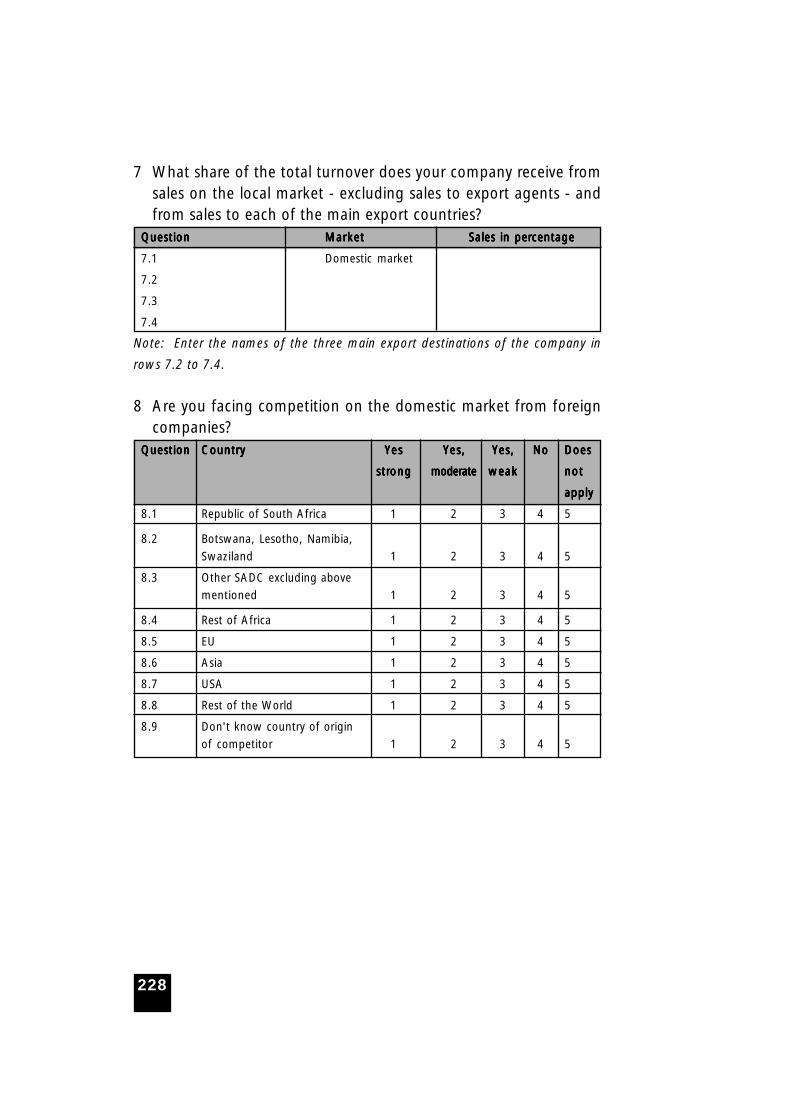
228
7 What share of the total turnover does your company receive fromsales on the local market - excluding sales to export agents - andfrom sales to each of the main export countries?
QuestionQuestionQuestionQuestionQuestion MarketMarketMarketMarketMarket Sales in perSales in perSales in perSales in perSales in percentagecentagecentagecentagecentage
7.1 Domestic market
7.2
7.3
7.4
Note: Enter the names of the three main export destinations of the company in
rows 7.2 to 7.4.
8 Are you facing competition on the domestic market from foreigncompanies?
QuestionQuestionQuestionQuestionQuestion CountryCountryCountryCountryCountry YYYYYeseseseses YYYYYes,es,es,es,es, YYYYYes,es,es,es,es, NoNoNoNoNo DoesDoesDoesDoesDoes
strstrstrstrstrongongongongong moderatemoderatemoderatemoderatemoderate weakweakweakweakweak notnotnotnotnot
applyapplyapplyapplyapply
8.1 Republic of South Africa 1 2 3 4 5
8.2 Botswana, Lesotho, Namibia,
Swaziland 1 2 3 4 5
8.3 Other SADC excluding above
mentioned 1 2 3 4 5
8.4 Rest of Africa 1 2 3 4 5
8.5 EU 1 2 3 4 5
8.6 Asia 1 2 3 4 5
8.7 USA 1 2 3 4 5
8.8 Rest of the World 1 2 3 4 5
8.9 Don't know country of origin
of competitor 1 2 3 4 5
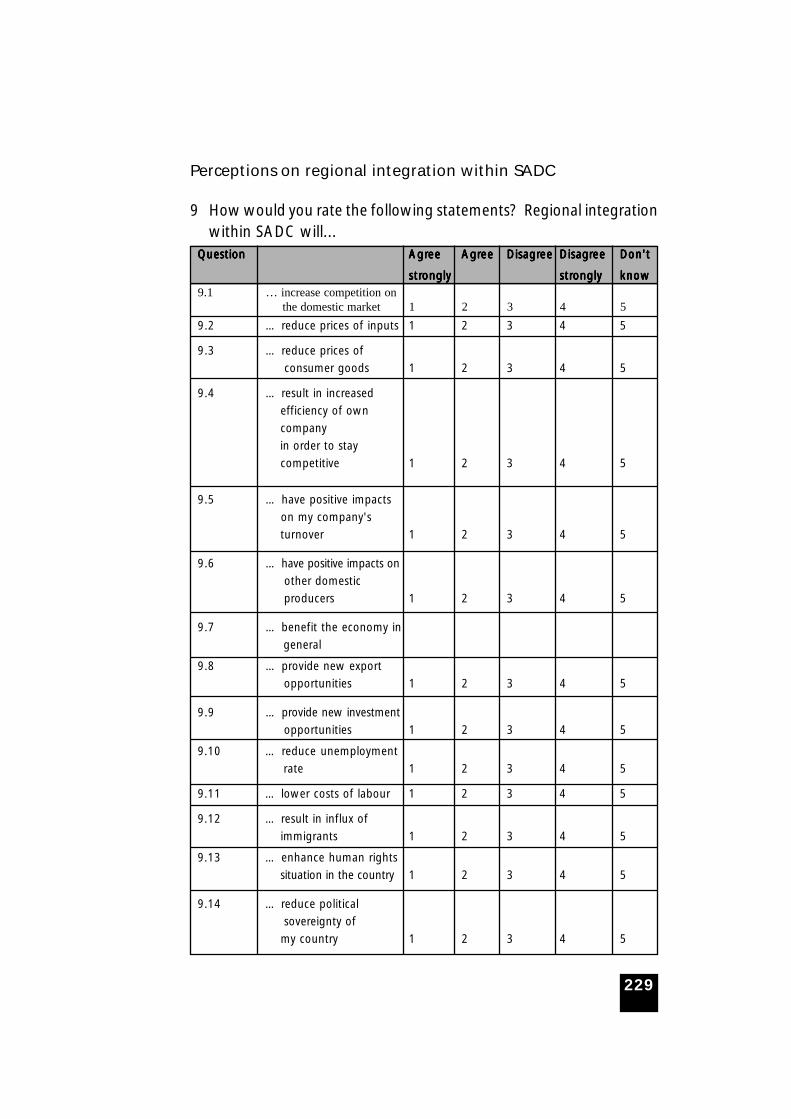
229
Perceptions on regional integration within SADC
9 How would you rate the following statements? Regional integrationwithin SADC will...
QuestionQuestionQuestionQuestionQuestion AgrAgrAgrAgrAgreeeeeeeeee AgrAgrAgrAgrAgreeeeeeeeee DisagrDisagrDisagrDisagrDisagreeeeeeeeee DisagrDisagrDisagrDisagrDisagreeeeeeeeee Don'tDon'tDon'tDon'tDon't
strstrstrstrstronglyonglyonglyonglyongly strstrstrstrstronglyonglyonglyonglyongly knowknowknowknowknow9.1 … increase competition on
the domestic market 1 2 3 4 5
9.2 … reduce prices of inputs 1 2 3 4 5
9.3 … reduce prices of
consumer goods 1 2 3 4 5
9.4 … result in increased
efficiency of own
company
in order to stay
competitive 1 2 3 4 5
9.5 … have positive impacts
on my company's
turnover 1 2 3 4 5
9.6 … have positive impacts on
other domestic
producers 1 2 3 4 5
9.7 … benefit the economy in
general
9.8 … provide new export
opportunities 1 2 3 4 5
9.9 … provide new investment
opportunities 1 2 3 4 5
9.10 … reduce unemployment
rate 1 2 3 4 5
9.11 … lower costs of labour 1 2 3 4 5
9.12 … result in influx of
immigrants 1 2 3 4 5
9.13 … enhance human rights
situation in the country 1 2 3 4 5
9.14 … reduce political
sovereignty of
my country 1 2 3 4 5
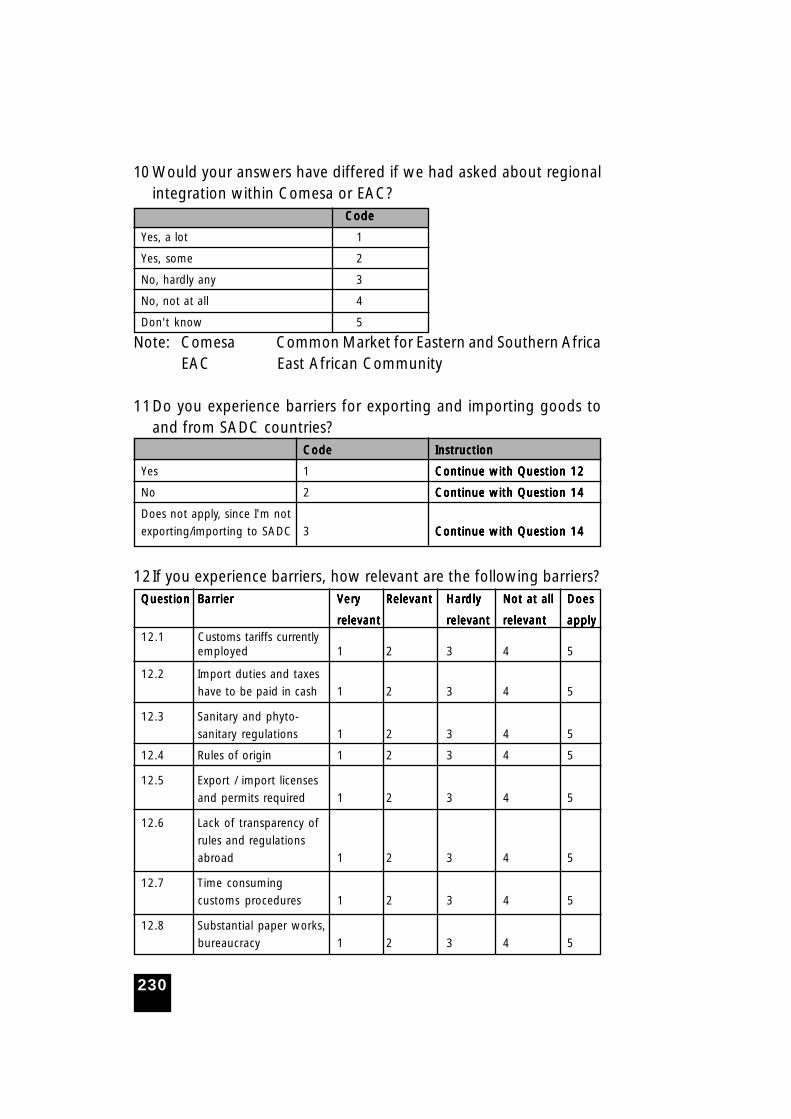
230
10 Would your answers have differed if we had asked about regionalintegration within Comesa or EAC?
CodeCodeCodeCodeCode
Yes, a lot 1
Yes, some 2
No, hardly any 3
No, not at all 4
Don't know 5
Note: Comesa Common Market for Eastern and Southern AfricaEAC East African Community
11Do you experience barriers for exporting and importing goods toand from SADC countries?
CodeCodeCodeCodeCode InstructionInstructionInstructionInstructionInstruction
Yes 1 Continue with Question 12Continue with Question 12Continue with Question 12Continue with Question 12Continue with Question 12
No 2 Continue with Question 14Continue with Question 14Continue with Question 14Continue with Question 14Continue with Question 14
Does not apply, since I'm not
exporting/importing to SADC 3 Continue with Question 14Continue with Question 14Continue with Question 14Continue with Question 14Continue with Question 14
12If you experience barriers, how relevant are the following barriers?QuestionQuestionQuestionQuestionQuestion BarrierBarrierBarrierBarrierBarrier VVVVVerererereryyyyy RelevantRelevantRelevantRelevantRelevant HarHarHarHarHardlydlydlydlydly Not at allNot at allNot at allNot at allNot at all DoesDoesDoesDoesDoes
rrrrrelevantelevantelevantelevantelevant rrrrrelevantelevantelevantelevantelevant rrrrrelevantelevantelevantelevantelevant applyapplyapplyapplyapply12.1 Customs tariffs currently
employed 1 2 3 4 5
12.2 Import duties and taxes
have to be paid in cash 1 2 3 4 5
12.3 Sanitary and phyto-
sanitary regulations 1 2 3 4 5
12.4 Rules of origin 1 2 3 4 5
12.5 Export / import licenses
and permits required 1 2 3 4 5
12.6 Lack of transparency of
rules and regulations
abroad 1 2 3 4 5
12.7 Time consuming
customs procedures 1 2 3 4 5
12.8 Substantial paper works,
bureaucracy 1 2 3 4 5
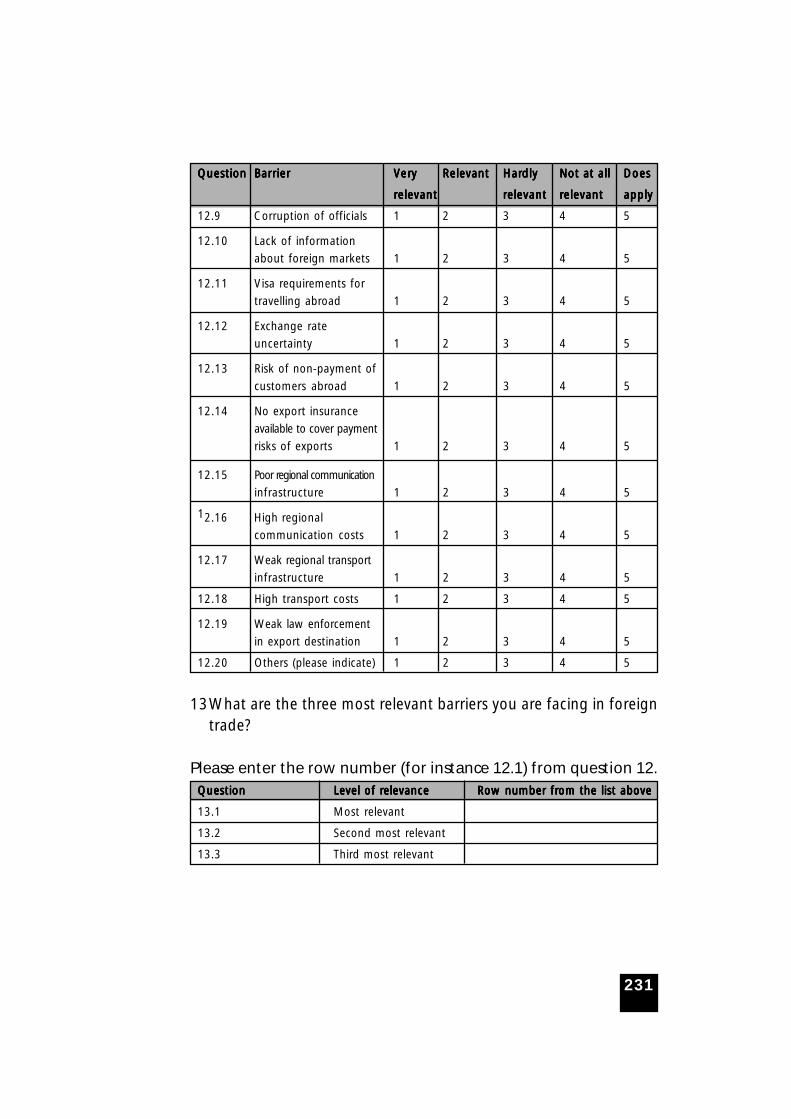
231
QuestionQuestionQuestionQuestionQuestion BarrierBarrierBarrierBarrierBarrier VVVVVerererereryyyyy RelevantRelevantRelevantRelevantRelevant HarHarHarHarHardlydlydlydlydly Not at allNot at allNot at allNot at allNot at all DoesDoesDoesDoesDoes
rrrrrelevantelevantelevantelevantelevant rrrrrelevantelevantelevantelevantelevant rrrrrelevantelevantelevantelevantelevant applyapplyapplyapplyapply
12.9 Corruption of officials 1 2 3 4 5
12.10 Lack of information
about foreign markets 1 2 3 4 5
12.11 Visa requirements for
travelling abroad 1 2 3 4 5
12.12 Exchange rate
uncertainty 1 2 3 4 5
12.13 Risk of non-payment of
customers abroad 1 2 3 4 5
12.14 No export insurance
available to cover payment
risks of exports 1 2 3 4 5
12.15 Poor regional communication
infrastructure 1 2 3 4 5
12.16 High regional
communication costs 1 2 3 4 5
12.17 Weak regional transport
infrastructure 1 2 3 4 5
12.18 High transport costs 1 2 3 4 5
12.19 Weak law enforcement
in export destination 1 2 3 4 5
12.20 Others (please indicate) 1 2 3 4 5
13What are the three most relevant barriers you are facing in foreigntrade?
Please enter the row number (for instance 12.1) from question 12.QuestionQuestionQuestionQuestionQuestion Level of rLevel of rLevel of rLevel of rLevel of relevanceelevanceelevanceelevanceelevance Row number frRow number frRow number frRow number frRow number from the list aboveom the list aboveom the list aboveom the list aboveom the list above
13.1 Most relevant
13.2 Second most relevant
13.3 Third most relevant
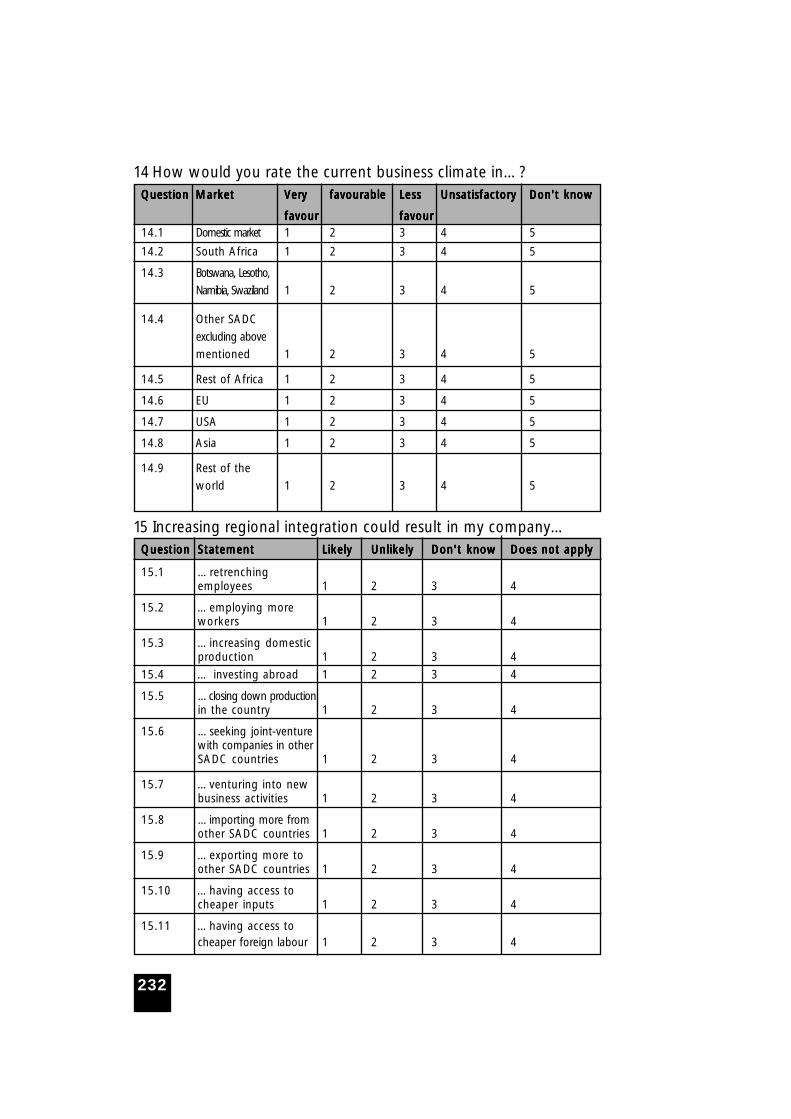
232
14 How would you rate the current business climate in…?QuestionQuestionQuestionQuestionQuestion MarketMarketMarketMarketMarket VVVVVerererereryyyyy favourablefavourablefavourablefavourablefavourable LessLessLessLessLess UnsatisfactoryUnsatisfactoryUnsatisfactoryUnsatisfactoryUnsatisfactory Don't knowDon't knowDon't knowDon't knowDon't know
favourfavourfavourfavourfavour favourfavourfavourfavourfavour14.1 Domestic market 1 2 3 4 5
14.2 South Africa 1 2 3 4 5
14.3 Botswana, Lesotho,
Namibia, Swaziland 1 2 3 4 5
14.4 Other SADC
excluding above
mentioned 1 2 3 4 5
14.5 Rest of Africa 1 2 3 4 5
14.6 EU 1 2 3 4 5
14.7 USA 1 2 3 4 5
14.8 Asia 1 2 3 4 5
14.9 Rest of the
world 1 2 3 4 5
15 Increasing regional integration could result in my company…QuestionQuestionQuestionQuestionQuestion StatementStatementStatementStatementStatement LikelyLikelyLikelyLikelyLikely UnlikelyUnlikelyUnlikelyUnlikelyUnlikely Don't knowDon't knowDon't knowDon't knowDon't know Does not applyDoes not applyDoes not applyDoes not applyDoes not apply
15.1 …retrenchingemployees 1 2 3 4
15.2 …employing moreworkers 1 2 3 4
15.3 …increasing domesticproduction 1 2 3 4
15.4 … investing abroad 1 2 3 4
15.5 …closing down productionin the country 1 2 3 4
15.6 …seeking joint-venturewith companies in otherSADC countries 1 2 3 4
15.7 …venturing into newbusiness activities 1 2 3 4
15.8 …importing more fromother SADC countries 1 2 3 4
15.9 …exporting more toother SADC countries 1 2 3 4
15.10 …having access tocheaper inputs 1 2 3 4
15.11 …having access tocheaper foreign labour 1 2 3 4
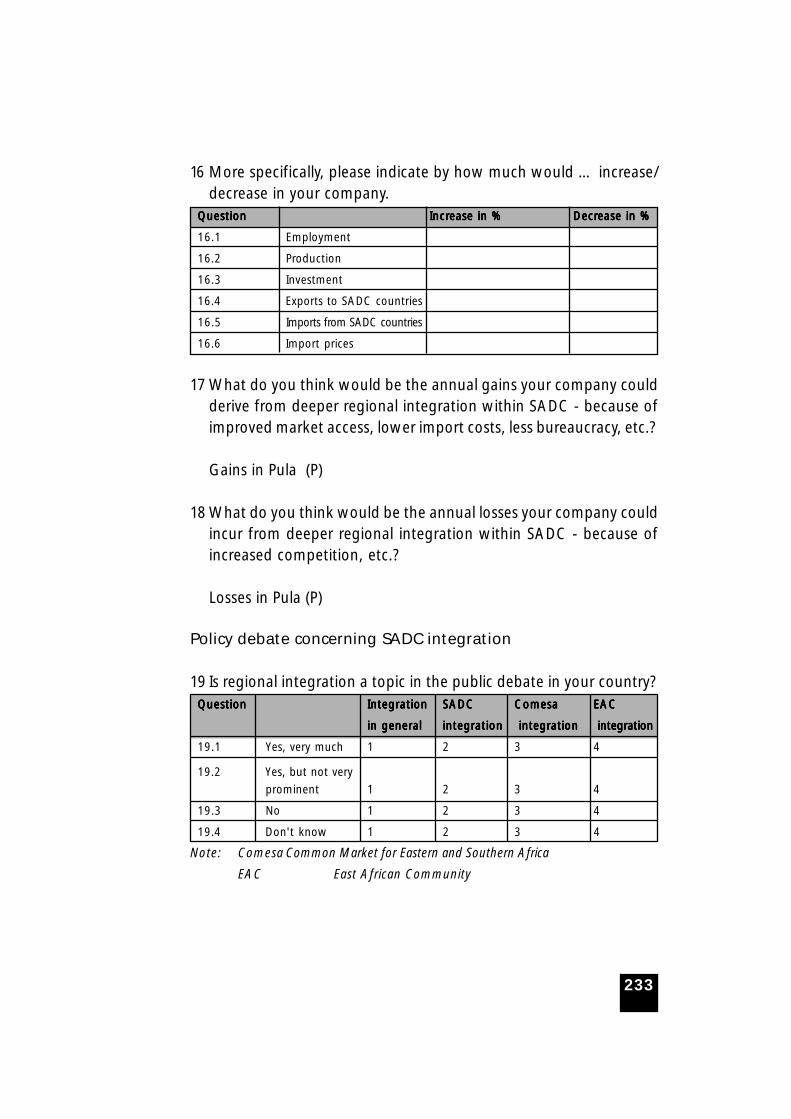
233
16 More specifically, please indicate by how much would … increase/decrease in your company.
QuestionQuestionQuestionQuestionQuestion IncrIncrIncrIncrIncrease in %ease in %ease in %ease in %ease in % DecrDecrDecrDecrDecrease in %ease in %ease in %ease in %ease in %
16.1 Employment
16.2 Production
16.3 Investment
16.4 Exports to SADC countries
16.5 Imports from SADC countries
16.6 Import prices
17 What do you think would be the annual gains your company couldderive from deeper regional integration within SADC - because ofimproved market access, lower import costs, less bureaucracy, etc.?
Gains in Pula (P)
18 What do you think would be the annual losses your company couldincur from deeper regional integration within SADC - because ofincreased competition, etc.?
Losses in Pula (P)
Policy debate concerning SADC integration
19 Is regional integration a topic in the public debate in your country?QuestionQuestionQuestionQuestionQuestion IntegrationIntegrationIntegrationIntegrationIntegration SADCSADCSADCSADCSADC ComesaComesaComesaComesaComesa EACEACEACEACEAC
in generalin generalin generalin generalin general integrationintegrationintegrationintegrationintegration integration integration integration integration integration integration integration integration integration integration
19.1 Yes, very much 1 2 3 4
19.2 Yes, but not very
prominent 1 2 3 4
19.3 No 1 2 3 4
19.4 Don't know 1 2 3 4
Note: Comesa Common Market for Eastern and Southern Africa
EAC East African Community
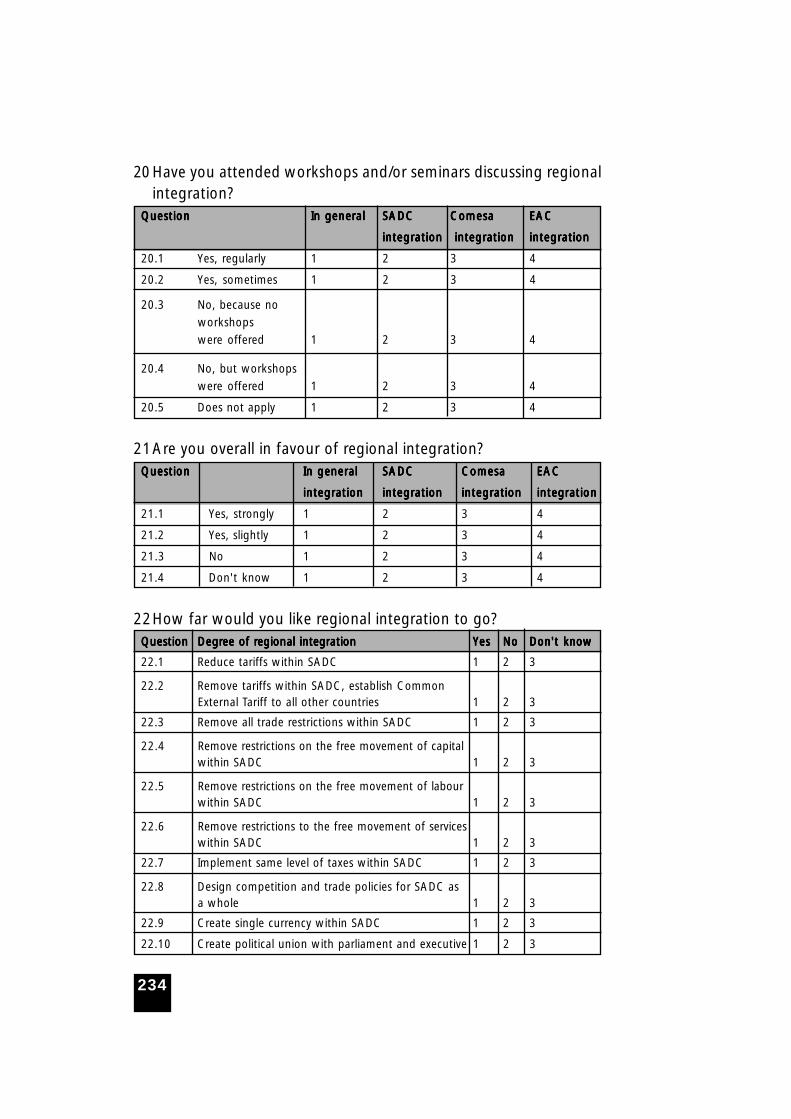
234
20Have you attended workshops and/or seminars discussing regionalintegration?
QuestionQuestionQuestionQuestionQuestion In generalIn generalIn generalIn generalIn general SADCSADCSADCSADCSADC ComesaComesaComesaComesaComesa EACEACEACEACEAC
integrationintegrationintegrationintegrationintegration integration integration integration integration integration integrationintegrationintegrationintegrationintegration
20.1 Yes, regularly 1 2 3 4
20.2 Yes, sometimes 1 2 3 4
20.3 No, because no
workshops
were offered 1 2 3 4
20.4 No, but workshops
were offered 1 2 3 4
20.5 Does not apply 1 2 3 4
21Are you overall in favour of regional integration?QuestionQuestionQuestionQuestionQuestion In generalIn generalIn generalIn generalIn general SADCSADCSADCSADCSADC ComesaComesaComesaComesaComesa EACEACEACEACEAC
integrationintegrationintegrationintegrationintegration integrationintegrationintegrationintegrationintegration integrationintegrationintegrationintegrationintegration integrationintegrationintegrationintegrationintegration
21.1 Yes, strongly 1 2 3 4
21.2 Yes, slightly 1 2 3 4
21.3 No 1 2 3 4
21.4 Don't know 1 2 3 4
22How far would you like regional integration to go?QuestionQuestionQuestionQuestionQuestion DegrDegrDegrDegrDegree of ree of ree of ree of ree of regional integrationegional integrationegional integrationegional integrationegional integration YYYYYeseseseses NoNoNoNoNo Don't knowDon't knowDon't knowDon't knowDon't know
22.1 Reduce tariffs within SADC 1 2 3
22.2 Remove tariffs within SADC, establish CommonExternal Tariff to all other countries 1 2 3
22.3 Remove all trade restrictions within SADC 1 2 3
22.4 Remove restrictions on the free movement of capitalwithin SADC 1 2 3
22.5 Remove restrictions on the free movement of labourwithin SADC 1 2 3
22.6 Remove restrictions to the free movement of serviceswithin SADC 1 2 3
22.7 Implement same level of taxes within SADC 1 2 3
22.8 Design competition and trade policies for SADC asa whole 1 2 3
22.9 Create single currency within SADC 1 2 3
22.10 Create political union with parliament and executive 1 2 3
235
About the Authors
GGGGGrace G. Trace G. Trace G. Trace G. Trace G. Tabengwaabengwaabengwaabengwaabengwa is a Research Fellow with an MSc in Economicsobtained from the University of Warwick, Coventry, in the United
Kingdom in 2001. Since completion of her first degree (BA Economics,University of Botswana in 1998), she has worked for a research institute,the Botswana Institute for Development Policy Analysis (BIDPA), in theInternational Trade Unit and the Macroeconomics, Forecasting andPlanning Unit. Within these areas, main work activities have largelyinvolved conducting and leading research on various policy priorityresearch areas aimed at advising the Government of Botswana andother countries in the Southern African region on policy issues thatshould lead to long term development and conducting policy relevantresearch. She has also contributed to the writing of various publicationsand policy research articles and policy briefs in the BIDPA Briefing whichis a quarterly economic briefing that is publicised at both the local,regional and international level. Ms Tabengwa is currently pursuingher PhD Studies on a scholarship she won from the African EconomicResearch Consortium from July 2006-July 2010, tenable at theUniversities of the Witwatersrand and Cape Town, South Africa.
JJJJJay Salkinay Salkinay Salkinay Salkinay Salkin is currently the Advisor to the Research Department in theBank of Botswana. He obtained his Bachelor of Arts (Economics)
from Franklin and Marshall College in Lancaster, Pennsylvania in theUSA, and his M.A. (Economics) and his Ph.D. (Economics) fromNorthwestern University in Evanston, Illinois. He was a Senior ResearchFellow at the Botswana Institute for Development Policy Analysis (BIDPA)when he worked on the Botswana Country Study on DeepeningIntegration in SADC: Macroeconomic Policies and Their Impactsupported by the Friedrich Ebert Foundation. He developed the Termsof Reference for the Country Studies. His primary responsibilities atBIDPA involved policy analysis relating to macroeconomic policy,employment and manpower policy, human resources development,industrial development policy, and many other fields of research.Previously he held various positions in Botswana, such as Director ofMacroeconomic Planning and Policy in the Ministry of Finance andDevelopment Planning.
236
Copies of this publication can beobtained from:
Friedrich Ebert Foundation – BotswanaP.O. Box 18
Gaborone, Botswana
Tel.: +267-3952441
Fax: +267-3930821
e-Mail: [email protected]
BIDPA – Botswana Institute forDevelopment Policy AnalysisPrivate Bag BR-29
Gaborone, Botswana
Tel.: +267 3971750
Fax: +267 3971748 e-Mail: [email protected]

“Regional Integration in Southern Africa”is edited and published by the Friedrich Ebert FoundationBotswana Officewww.fes.org.bw