deconstruction of the green bubble during covid-19 ... - mdpi
TRANSCRIPT
�����������������
Citation: Ghosh, B.; Papathanasiou,
S.; Dar, V.; Kenourgios, D.
Deconstruction of the Green Bubble
during COVID-19 International
Evidence. Sustainability 2022, 14, 3466.
https://doi.org/10.3390/su14063466
Academic Editors: Panagiotis Petrakis,
Pantelis Kostis and Elias Carayannis
Received: 1 February 2022
Accepted: 8 March 2022
Published: 16 March 2022
Publisher’s Note: MDPI stays neutral
with regard to jurisdictional claims in
published maps and institutional affil-
iations.
Copyright: © 2022 by the authors.
Licensee MDPI, Basel, Switzerland.
This article is an open access article
distributed under the terms and
conditions of the Creative Commons
Attribution (CC BY) license (https://
creativecommons.org/licenses/by/
4.0/).
sustainability
Article
Deconstruction of the Green Bubble during COVID-19International EvidenceBikramaditya Ghosh 1 , Spyros Papathanasiou 2,*, Vandita Dar 1 and Dimitrios Kenourgios 2
1 Symbiosis Institute of Business Management, Symbiosis International (Deemed University) Electronic City,Hosur Road, Bengaluru 560100, Karnataka, India; [email protected] (B.G.);[email protected] (V.D.)
2 Department of Economics, School of Economics and Political Sciences, National and Kapodistrian Universityof Athens, 1 Sofokleous Street, 10559 Athens, Greece; [email protected]
* Correspondence: [email protected]
Abstract: Bubbles are usually chaotic but can be predictable, provided their formation matches thelog periodic power law (LPPL) with unique stylized facts. We investigated Green Bubble behaviourin the stock prices of a selection of stocks during the COVID-19 pandemic, namely, those withthe highest market capitalization from a basket of North American and European green energy orclean tech companies and the S&P Global Clean Energy Index. Moreover, the biggest ExchangeTraded Fund (TAN) by market capitalization was also considered. The examined period is from31 December 2019 to 11 October 2021, during which we detected 35 Green Bubbles. All of thesefollowed the LPPL signature while calibrated through the 2013 reformulated LPPL model. Inaddition, the average drawdown emerged as four times that of the regular S&P-500 stock index(108% vs. 27%) under stressed conditions, such as the COVID-19 pandemic (stylized fact). Finally, theaftermaths of Green Bubbles, unlike regular bubbles, are not destructive, as these bubbles increaseeconomic activity and infrastructure spending and are hence beneficial for holistic growth (describedas Social Bubble Hypothesis). We document that there are benefits in adapting greener and moresustainable business models in energy production. Green and sustainable finance offers benefits andopportunities for stock exchanges, especially for energy stocks. As a result, many businesses arefocusing on sustainability and adopting an eco-friendly business model, which helps the environment,helps sustainability and attracts investors.
Keywords: social bubble hypothesis; sustainable development; log periodic power law; green finance;green energy; COVID-19
1. Introduction
Green and sustainable development and finance offer benefits and opportunities forstock exchanges. Green finance products have already been introduced in many marketsand have seen extraordinary growth. “Green finance” is a broad term which refers tothe flow of financial investments into sustainable development projects and initiatives,environmental products, and policies that encourage the development of a more sustainableeconomy. “Green finance” includes—but is not limited to—climate finance [1].
Subsequently, green stocks and green bonds are outperforming their non-green bench-marks. As a result, many firms are focusing on sustainability and adopting an eco-friendlybusiness model, which helps the environment, helps sustainability and attracts investors.This increase is partly attributed to a growing consensus about the role of stock exchangesin promoting economic development.
Green or renewable energy is the future of our Earth. It reduces carbon emissions andglobal warming by generating electricity or heat from renewable or low-carbon sourcesusing any equipment whose capacity to generate electricity or heat does not exceed thecapacity specified (in relation to the production of electricity, 5 megawatts) [2]. Most
Sustainability 2022, 14, 3466. https://doi.org/10.3390/su14063466 https://www.mdpi.com/journal/sustainability
Sustainability 2022, 14, 3466 2 of 18
corporations in the West have either partially or completely transformed their operationsfollowing these mandates. We indicate two things under the mandates: 1. FollowingSustainable Development Goals (SDGs) and 2. Trading carbon rights through Cap andTrade in order to reduce the carbon footprint.
Prima facie, all agree on the necessity of green finance; however, it requires largestructural changes and thus invites a fair share of financial instability; in fact it is completelydifferent for sunrise industries vis-a-vis sunset industries [3] (Semieniuk et al., 2021).Moreover, the abetment cost of transitioning into a state where fossil-fuel-based energyis completely avoided, due either to technological reasons or a standpoint of behaviouralacceptance, would be rather high. Interestingly, should green energy be more affordablein the future, it would result in an increase in the dynamic cost of the green energyinfrastructure [4] (Gillingham & Stock, 2018).
However, it has been reported that green energy is no longer a niche. Some of thelargest conglomerates on Earth plan to invest in green energy in a big way. Global in-vestment has been shifting away from fossil fuels at a rapid speed during the COVID-19outbreak. Investment funds focusing on the environment have seen a USD 2 trillion shiftglobally in the first quarter of 2021 alone. This is more than a three-fold growth over a fewyears. A little over USD 5 billion worth of bonds are designed to fund green technologycompanies daily [5]. Therefore, it has become imperative to control the plausible formationof bubbles when so much money is drawn to the sector. Moreover, their evaluation rose aswell. Green Energy companies witnessed an astronomical growth in their revenue through-out 2020. In fact, it almost doubled from 6.7× in Q1 to 12.7× in Q4 before stabilizing aroundthe 10× mark [6]. Some of the largest investment bank corporations, such as BlackRock,have commented that the investment market is most probably experiencing a “tectonicshift” towards green alternatives. To add to the same debate, global investment funds arechasing after environmental, social and governance principles (ESG) [7] (Umar, et al., 2020).In 2020 alone, these attracted USD 350 bn, compared to USD 165 bn in 2019 [8].
We need to look intuitively into this matter. With the constant flow of positive feedbackand reaffirmation of the very fact that the future of energy is “green”, it has become evidentthat we are witnesses to a speculative bubble formation. Furthermore, during COVID-19,positive feedback loops have ensured an enormous amplification of capital flight to greenenergy companies in a very short amount of time, with an unlikely boost coming fromnews agencies. Herding and the pandemic have quite a few things in common; in fact,they share a similar logistic curve pattern. Decisions which are perfectly rational at anindividual capacity remain hardly rational in a group situation [9] (Shiller, 2000).
The cardinal idea behind this work is to find out whether the theory of the GreenBubble exists in reality or not. We have taken a pluralistic approach by accommodatingcontradictory literature, basing, however, our conclusion on empirical evidence. Manystudies [10,11] (Dempse & Edwards, 2008; Belle, 2007) have suggested that too much moneyis chasing too few green technology stocks, thus forming an uncanny bubble. Researchershave coined the term for this as a “Green Bubble” [10–20] (Belle, 2007; Bennett, 2010;Dempsey & Edwards, 2008; Koutsokostas & Papathanasiou, 2017; Koutsokostas, et al., 2019;Christopoulos, et al., 2014; Christopoulos, et al., 2019; Koutsokostas, et al., 2018; Wimmer,2016). However, inconsistent observations over a rather short period of time cannot evencreate a “stylized fact”, let alone a “theory”. This study intends to unearth the feasibilitybehind such claims.
Giorgis et al. (2021) [21] coined the term “Clean Tech Bubble” instead of “GreenBubble”, albeit the meaning is the same.
“Cleantech” or “Clean Tech” is generally defined as the products or services based onknowledge that improves operational performance, productivity or efficiency, while at thesame time reducing costs, inputs, energy consumption, waste or pollution [22,23].
Green assets are on a significant rise. The prices of metals for battery production suchas lithium and cobalt have risen by approximately two-thirds and one-third, respectively.
Sustainability 2022, 14, 3466 3 of 18
This sudden increase in prices during the pandemic forms a stretched valuation, which isindicative of a “Green Bubble” [12].
According to Giorgis et al. (2021) [21], despite the fact that all types of speculativebubbles are apparently disruptive in nature, some have lasting positive impacts. It is a well-documented fact that most bubbles germinate from irrational exuberance [9,24] (Shiller,2000; Vasiliou, et al., 2008). Social bubbles accelerate capital spending, infrastructure build-ing and enhance usage of emerging technologies [25,26] (Garber, 2001; Kindelberger &Aliber, 2005). It springs from the innumerable positive interactions in influential social cir-cles (select government agencies, venture capitalists and high-net-worth individuals), thusreinforcing positive feedback with a significant impact. In this way, it reaches widespreadacceptance and extraordinary commitments [27] (Gisler, et al., 2011). Hence, social bubblesare far from the destruction of public wealth in the long run.
This study contributes to the existing literature, as it is the first attempt to search for acommon thread across the financial bubbles of the stock prices of a selection of stocks froma basket of Green Energy or Clean Tech companies (from North America and Europe) andthe S&P Global Clean Energy Index during COVID-19 by using the Filimonov and Sornette(2013) [28] modified LPPL. In addition, we differentiated from previous studies [29–32](Geuder et al., 2019; Ghosh et al., 2021; Ghosh, et al., 2020; Wheatley et al., 2019) by testingthe robustness of the LPPL following the reformulated version of the LPPL calibrationsproposed by Filimonov and Sornette (2013) [28].
“Clean energy” is defined as energy generated from Solar, Hydro, Bio, Geothermal,Wind, Nuclear and Hydrogen sources. It mostly overlaps with the term “Green energy”.
Global stock markets are fractal, as proved by Edger Peters following Mandelbrot’sprinciple [33] (Mandelbrot, 1963). The LPPL is a micro-state investigation of a fractal system,exhibiting macro-state phenomena. Therefore, the LPPL works well for most global assetclasses that are stochastic in nature and follow a log normal distribution, including thestocks of the green energy basket under consideration [21,33–35] (Peters, 1994; Watkins &Franzke, 2017).
Therefore, the paper is composed of five sections. Section 2 briefly presents theliterature review. Section 3 describes the data and the methodology used. In Section 4, theoutcomes and findings of the research are presented. Finally, in Section 5, the conclusionsare reported.
2. Literature Review
The term “Bubble” has essentially been a well-researched topic, unlike the term “GreenBubble”. Literature regarding the “Green Bubble” or the “Clean Tech Bubble” is growingpost-COVID-19, albeit slowly. O’Hara (2008) [36] provided extremely interesting anddiverse perspectives on what the term “bubble” actually meant as interpreted by expertsover a period of time. O’Hara (2008) [36] delved into the explanations offered by Garber(2001) [25] about seven years earlier, who defined the bubble as “a fuzzy word filled withimport but lacking any solid operational definition”, implying that a bubble involved amovement in prices, which could not be adequately explained by fundamentals. WhileGarber (2001) [25] upheld the view that bubbles could be both positive as well as negative,that was generally not the popular opinion. Palgrave’s Dictionary of Political Economy (1926,p. 181), viewed a “bubble” as “any unsound undertaking accompanied by a high degree ofspeculation”. Kindelberger & Aliber, 2005 [26] also seemed to be disparaging of bubbleswhen they stated that “a bubble is an upward price movement over an extended range thatthen implodes”. Towing the same line, Brunnermeier (2009) [37] opined that “bubbles aretypically associated with dramatic asset price increases, followed by a collapse”.
In an earlier work, Garber (1990) [38] emphasized that one should always intensivelylook for reasonable economic explanations before classifying a speculative event as aninexplicable bubble. For instance, probable expectations of high returns could be funda-mental and reasonable explanations stemming from sound economic analysis. Even whenuninitiated market participants act upon price movements caused by insider trading, the
Sustainability 2022, 14, 3466 4 of 18
resultant movement in asset prices should be considered as fundamental and not a bubble,despite the fact that these perceptions could eventually be disproved. Using this reasoning,Garber (2001) [25] concluded that the Dutch Tulip Mania (1634–37), often referred to as aclassic bubble, reflected normal pricing behaviour, especially since the tulip bulbs involvedwere rare, displaying unique patterns created by a mosaic virus. In fact, a more accurateversion of the Tulip Mania unfolded in the beginning of 1637, when there was a steep andrapid price rise, followed by a collapse in the market for common bulbs dominated bythe lower classes [25] (Garber, 2001). However, there was no evidence pointing out to anyeconomic distress arising from this fact.
Some interesting work has been carried out of late, where Quinn and Turner intrigu-ingly speak of a “bubble triangle”, specifically highlighting the positive social impactsof some bubbles [39] (Quinn & Turner, 2020). The positive bubble has the potential toencourage and nurture innovation, leading to many more people becoming entrepreneurs,which may result in a virtuous growth cycle. Bubble companies may even bring in inno-vations and technological breakthroughs, which, going ahead, may be beneficial to manyother industries as well. Bubbles by nature seem to create an environment that apparentlyattracts capital for technologically intensive projects, which can have tremendous positiveeconomic impacts. Gisler et al. (2011) [27] illustrated the social bubble hypothesis in actionin the Human Genome Project (HGP) right from the 1980s well into the 2000s, which ledto the committed involvement of public as well as private entities, much beyond whatwas deemed possible through a standard rational cost–benefit analysis [27] (Gisler et al.,2011). The initiation of the HGP as a high-stakes public project created the necessaryhype and aroused the interest of private players, who then joined the bandwagon. Thesocial interactions of public and private entities created the right mix of collaboration andcompetition, thus creating a positive network of reinforcing feedbacks. The supportinganalysis of the biotech sector in the financial stock markets endorsed the existence of bub-bles; however, tangible outcomes from the hype and the aura surrounding these bubblesmight not be reaped in the short to medium term. Bubbles may take a long time to actuallyyield substantial positive outcomes. Bubbles are repetitive and change phases past thecritical point (crash). The valuation reaches a decent height through this repetitive process.However, events such as COVID-19 (an extreme event) typically increase their pace, thusreducing the chances of fully exploring their context.
Garber (2001) [25] also highlighted the fact that, many times, understanding bubblesbecomes challenging because they lie at the intersection of finance, economics and psy-chology. The inexplicable in bubbles is thus very often attributed to market psychology ormarket sentiment, which is difficult to measure, yet it is a convenient explanation of phe-nomena that cannot be explained through fundamentals [25] (Garber, 2001). Aghion et al.(2009) [40] emphasized that given the enormity of climate change’s challenges, the worldrequired a gigantic push to clean-technology-related innovations and had woefully fallenshort on this front, especially considering the EU-27 countries. This required a green publicintervention along with private initiatives and a public policy that incentivized privategreen innovation. Needless to say, tackling the gargantuan climate adversity probablyrequires the creation of a bubble. While investment in innovative, breakthrough cleantechnology is the need of the hour, Knuth (2018) [41] stressed on the importance of financebeing deployed to the right causes efficiently, the context being the billions of funds commit-ted by Bill Gates and several other billionaires towards the development of breakthroughclean energy technologies. This Breakthrough Energy Coalition created in the run-up to theParis COP21 climate summit in 2015 seemed basically flawed in ignoring the developmentof existing clean energy technology, such as solar and wind energy, while pushing forinnovations in other clean technologies.
The debate, particularly in the United States (US), is about the clean energy transitionstrategy and whether it can largely be accomplished through a higher level of financializa-tion for existing technologies, which would reduce the cost of capital and augment resourceflow to the sector; otherwise a large-scale technological disruption is essential to make this
Sustainability 2022, 14, 3466 5 of 18
possible [41] (Knuth, 2018). The role of venture capital in supporting transformative cleanenergy technologies towards a sustainable future is explored by Marcus and his researchteam. Their evidence showed that venture capitalists were inclined to make bigger betsfor longer periods on high-risk, clean energy technology firms [42] (Marcus et al., 2013).However, a noteworthy observation here was the tendency of venture capitalists to avoidconventional high-risk production, distribution, and installation companies, while focusingon those opportunities that were technologically intensive. These preliminary findingswere also endorsed by Knuth (2018) [41], who highlighted the classic debate betweenconventional clean energy technologies versus highly innovative technologies, capable ofcreating breakthroughs and paradigm shifts.
An in-depth Australian study seemed to assume prophetic undertones when it high-lighted an emerging sixth paradigm in the form of a speculative financial bubble, specificallyin the renewable energy sector [43] (Mathews, 2013). Mathews continued his study, pre-dicting that this specific bubble would lose steam sometime between 2015 and 2020. Thiswould lead to an era of prudent and sustainable development of renewables by productiverather than financial capital. While the fourth paradigm was based on fossil fuels andcentralized power generation, the fifth ushered a wave where Internet technologies wereapplied to the electric power grid.
Despite an increase in scholarly interest in the said subject, most studies [42,44–47](Criscuolo & Menon, 2015; Zhong & Bazilian, 2018; Bürer & Wüstenhagen, 2008; Mrkajic et al.,2019; Marcus, et al., 2013) were found to focus on either venture capitalist funding orthe overall impact of bubbles in various sectors. Neither Green Bubbles nor Clean Techbubbles have been deconstructed to identify their embedded pattern, nor have they beenevaluated through a new perspective (read as “Social Bubble Hypothesis”) [21] (Giorgis,Huber, & Sornette, 2021). Fundamentally, bubbles are born on a spiral of positive feedbacks(sometimes irrational) and enjoy negative connotations with specific exceptions, suchas the “Green Bubble” (through the lens of the Social Bubble Hypothesis). Moreover,bubble prediction relies on the accurate calculation of an optimum number of observations(5 days to 750 days) which need to be taken into consideration as per Filimonov & Sornette(2013) [28]. The explicit identification of past bubbles with greater accuracy would hold thekey to building rational “stylized facts” for future use. We have conducted all these thingsin our following segments.
3. Data and Research Methodology
Past studies [48–54] (Bree & Joseph, 2013; Johansen et al., 2000; Johansen and Sornette,2010; Johansen and Sornette, 2001; Kenourgios et al., 2021; Samitas et al., 2022; Sornette andJohansen, 2001) have confirmed that stock prices globally are fractal.
In fact, their fractal properties exhibit a “fractal tree”, which is nothing but a hierar-chical model (HM) [55] (Sornette & Johansen, 1998). Furthermore, these fractal propertiesusually have sub-trees, with various other scaling properties. Coming to the Log PeriodicPower Law (LPPL), it is a micro-state hierarchical fractal construct. Despite being gener-ated from a micro-state, the LPPL usually offers a detailed macro-state overview. It hasbeen observed that strong positive herding, based on a complex agent-based interaction(positive feedback) propels the asset class to reach extreme levels of valuation in almostno time, simply to face a second-order phase transition (crash) all of a sudden. Hence,both phases (growth and decay) are individually persistent, exhibiting long memory traits.Being fundamentally fractal, both phases of an underlying asset’s bubble are self-similar orself-affine. Research proved that the build-up of the bubble, the critical point and finally thecrash are completely based on a fractal premise. The very first representation of LPPL [49](Johansen et al., 2000) was conceived with the same premise. Johansen et al. (2000) [49] hadassumptions such as positive feedback and trader’s affinity (group behaviour, with onlybuy and sell). It is important to note that, in the short run, traders do not hold onto theirassets. Hence, it is believed that the LPPL takes into consideration positive feedback-basedherding (generating speculative bubbles) following the inevitable crash. Financial mar-
Sustainability 2022, 14, 3466 6 of 18
kets are way too complex to follow such a straightforward rationale. Therefore the LPPLproduces false alarms at times (Johansen, et al., 2000) [49]. For this reason, Johansen et al.(2000) [49] was recalibrated in order to develop a stronger model for future observations.Filimonov and Sornette (2013) [28] furthered the LPPL modelling and recalibrated it withless non-linear parameters, thus making the model robust [28] (Filimonov & Sornette, 2013).
We have investigated 11 stocks with the highest market capitalization (Orsted (DOGEF—Danish Wind Power company), Plug Power (PLUG—Hydrogen Fuel company), Next Era En-ergy (NEE), First Solar (FSLR), Enel (ESOCF), Iberdrola (IBDSF), Innergex (INGXF—CanadianSustainable energy company), Solar Window Technology Inc (WNDW), Boralex (BLX), AzurePower (AZRE) and Canadian Solar (CSIQ)), across North America and the European Union(EU). Furthermore, we investigated the S&P Global Clean energy index, which indicatesthe global participation in this bubble, as it also includes developing nations. Moreover, thebiggest Exchange Traded Fund (Invesco’s solar ETF (TAN)) by market capitalization was alsoconsidered. Thus, we have examined 11 energy stocks, an ETF (Invesco’s solar ETF) and anEnergy Index (S&P Global Clean Energy Index) from the LPPL standpoint.
Our observations ranged from 31 December 2019 to 11 October 2021, where dailyclosing prices were taken into consideration. The especially reformulated LPPL modelby Filimonov and Sornette (2013) [28] is quite efficient in finding bubbles in various assetclasses. We have selected these 11 companies and an ETF based upon their origin (NorthAmerica and the EU) and their listing (NASDAQ). We also selected the S&P Global CleanEnergy Index to check the holistic impact on the entire sector. All data were acquired fromBloomberg and Thomson Reuters Datastream.
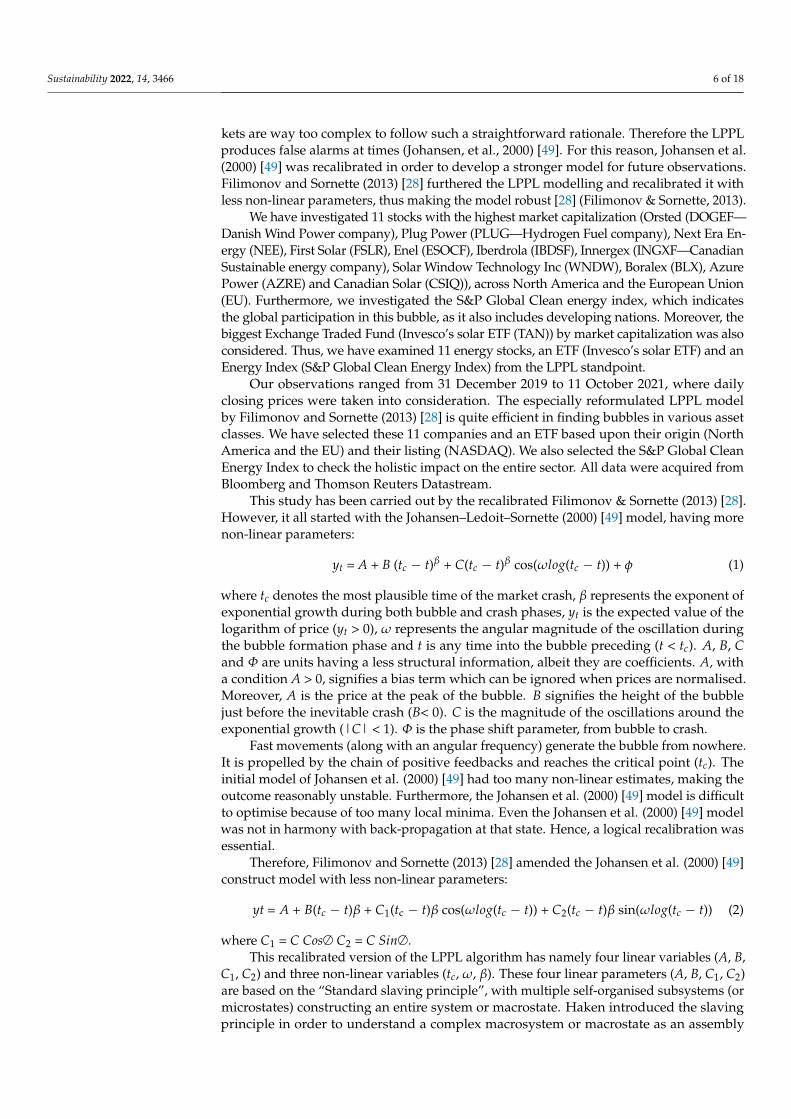
This study has been carried out by the recalibrated Filimonov & Sornette (2013) [28].However, it all started with the Johansen–Ledoit–Sornette (2000) [49] model, having morenon-linear parameters:
yt = A + B (tc − t)β + C(tc − t)β cos(ωlog(tc − t)) + φ (1)
where tc denotes the most plausible time of the market crash, β represents the exponent ofexponential growth during both bubble and crash phases, yt is the expected value of thelogarithm of price (yt > 0), ω represents the angular magnitude of the oscillation duringthe bubble formation phase and t is any time into the bubble preceding (t < tc). A, B, Cand Φ are units having a less structural information, albeit they are coefficients. A, witha condition A > 0, signifies a bias term which can be ignored when prices are normalised.Moreover, A is the price at the peak of the bubble. B signifies the height of the bubblejust before the inevitable crash (B< 0). C is the magnitude of the oscillations around theexponential growth (|C| < 1). Φ is the phase shift parameter, from bubble to crash.
Fast movements (along with an angular frequency) generate the bubble from nowhere.It is propelled by the chain of positive feedbacks and reaches the critical point (tc). Theinitial model of Johansen et al. (2000) [49] had too many non-linear estimates, making theoutcome reasonably unstable. Furthermore, the Johansen et al. (2000) [49] model is difficultto optimise because of too many local minima. Even the Johansen et al. (2000) [49] modelwas not in harmony with back-propagation at that state. Hence, a logical recalibration wasessential.
Therefore, Filimonov and Sornette (2013) [28] amended the Johansen et al. (2000) [49]construct model with less non-linear parameters:
yt = A + B(tc − t)β + C1(tc − t)β cos(ωlog(tc − t)) + C2(tc − t)β sin(ωlog(tc − t)) (2)
where C1 = C Cos∅ C2 = C Sin∅.This recalibrated version of the LPPL algorithm has namely four linear variables (A, B,
C1, C2) and three non-linear variables (tc, ω, β). These four linear parameters (A, B, C1, C2)are based on the “Standard slaving principle”, with multiple self-organised subsystems (ormicrostates) constructing an entire system or macrostate. Haken introduced the slavingprinciple in order to understand a complex macrosystem or macrostate as an assembly
Sustainability 2022, 14, 3466 7 of 18
of many tiny non-linear microstates [56] (Haken, 1975). It has been a stylized fact forquite some time now that asset bubbles are nothing but a combination of self-organised,non-linear microstates with time-varying information. Therefore, the slaving principle suitsperfectly. The subordination procedure has been used to propagate non-linear parameters(ω, β) and to obtain regularity results. The Nelder–Mead simplex model has been used tofind the local minima in a multidimensional space through the Filimonov and Sornette,(2013) [28] model.
Despite recalibration by Filimonov and Sornette, (2013) [28], the model remainedsensitive to the input values. Usually, the bubble indicator is not consistent enough withany length of window. However, windows of observation shall be of optimum length.The range is quite wide, from a minimum of five trading days to a maximum of 750. Thereformulated LPPL works well inside these conditions and, therefore, it will not suit theday traders, unlike the investors.
4. Empirical Results
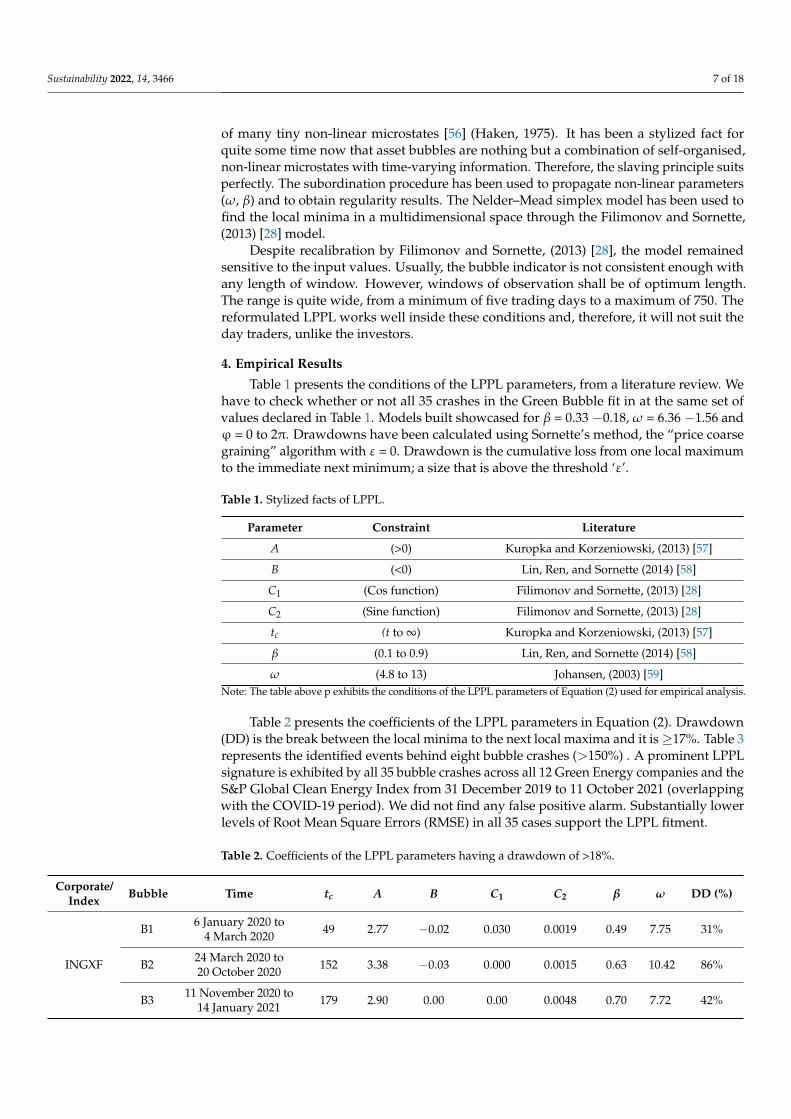
Table 1 presents the conditions of the LPPL parameters, from a literature review. Wehave to check whether or not all 35 crashes in the Green Bubble fit in at the same set ofvalues declared in Table 1. Models built showcased for β = 0.33 −0.18, ω = 6.36 −1.56 andϕ = 0 to 2π. Drawdowns have been calculated using Sornette’s method, the “price coarsegraining” algorithm with ε = 0. Drawdown is the cumulative loss from one local maximumto the immediate next minimum; a size that is above the threshold ‘ε’.
Table 1. Stylized facts of LPPL.
Parameter Constraint Literature
A (>0) Kuropka and Korzeniowski, (2013) [57]
B (<0) Lin, Ren, and Sornette (2014) [58]
C1 (Cos function) Filimonov and Sornette, (2013) [28]
C2 (Sine function) Filimonov and Sornette, (2013) [28]
tc (t to ∞) Kuropka and Korzeniowski, (2013) [57]
β (0.1 to 0.9) Lin, Ren, and Sornette (2014) [58]
ω (4.8 to 13) Johansen, (2003) [59]Note: The table above p exhibits the conditions of the LPPL parameters of Equation (2) used for empirical analysis.
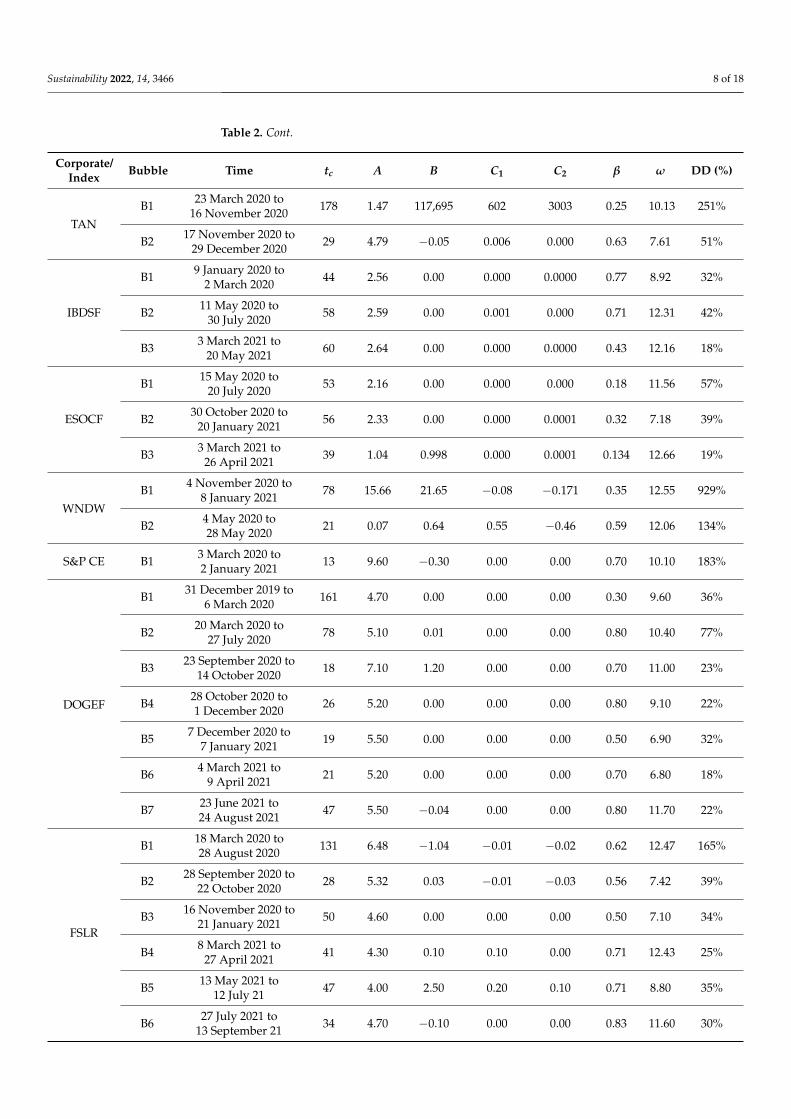
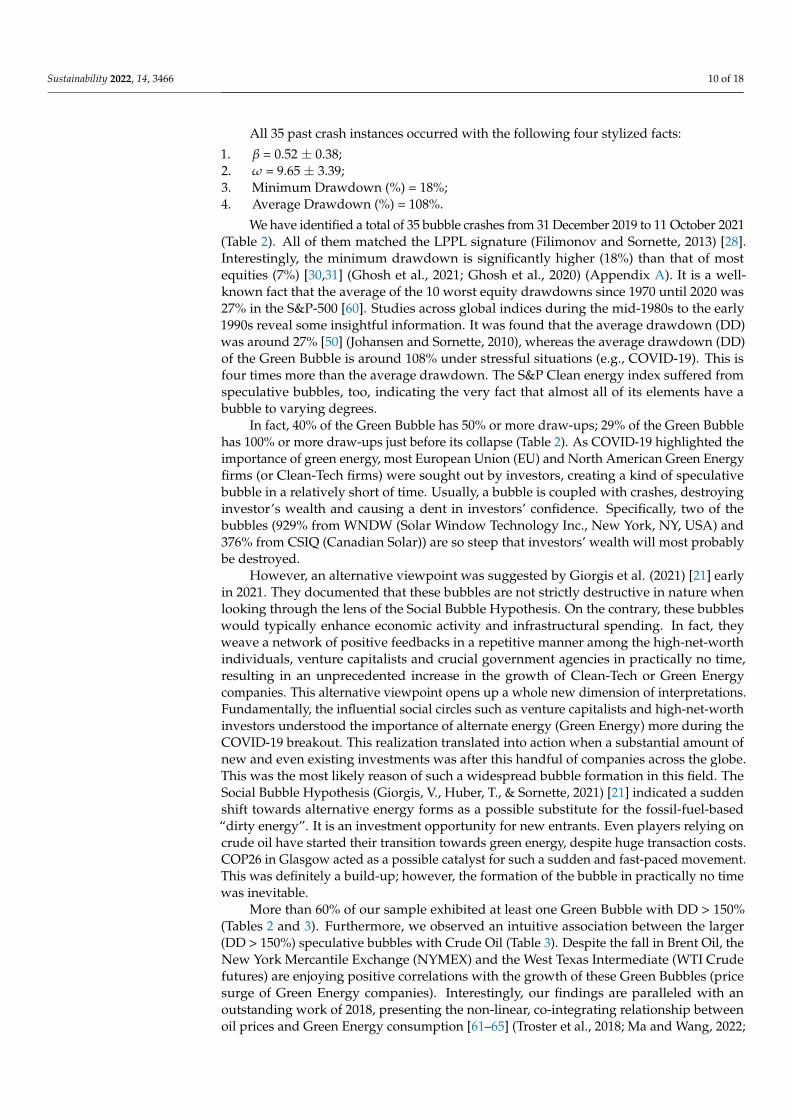
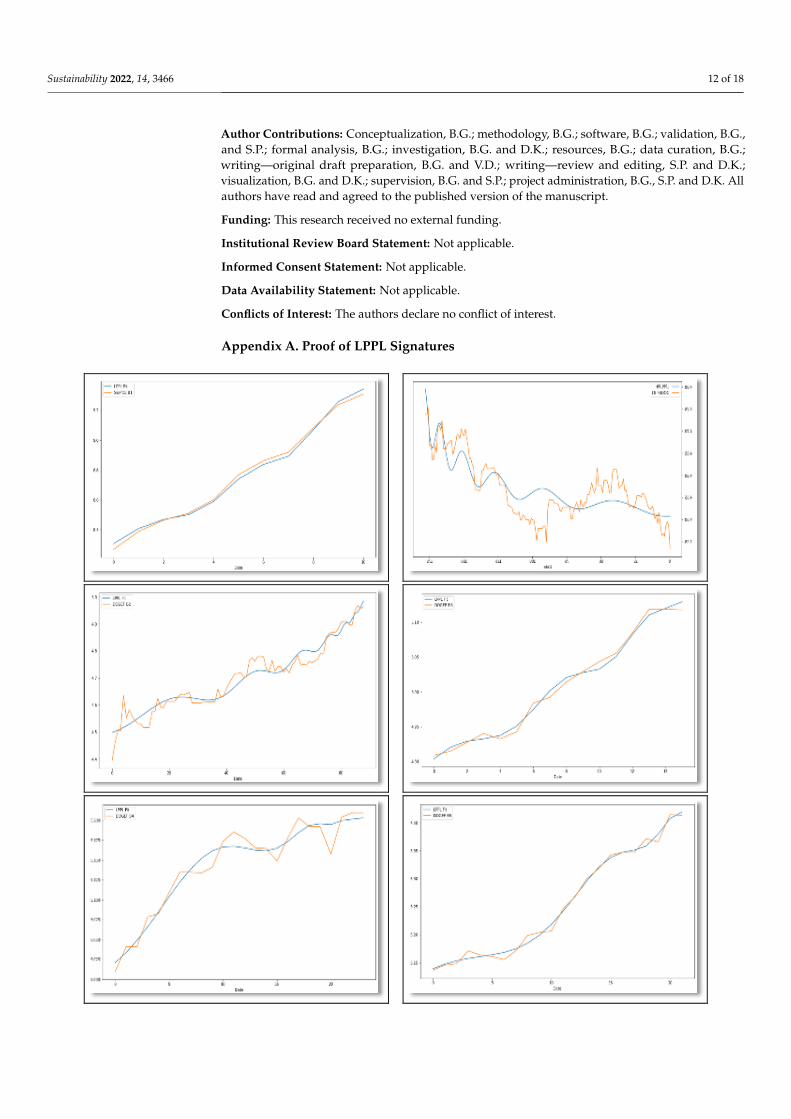
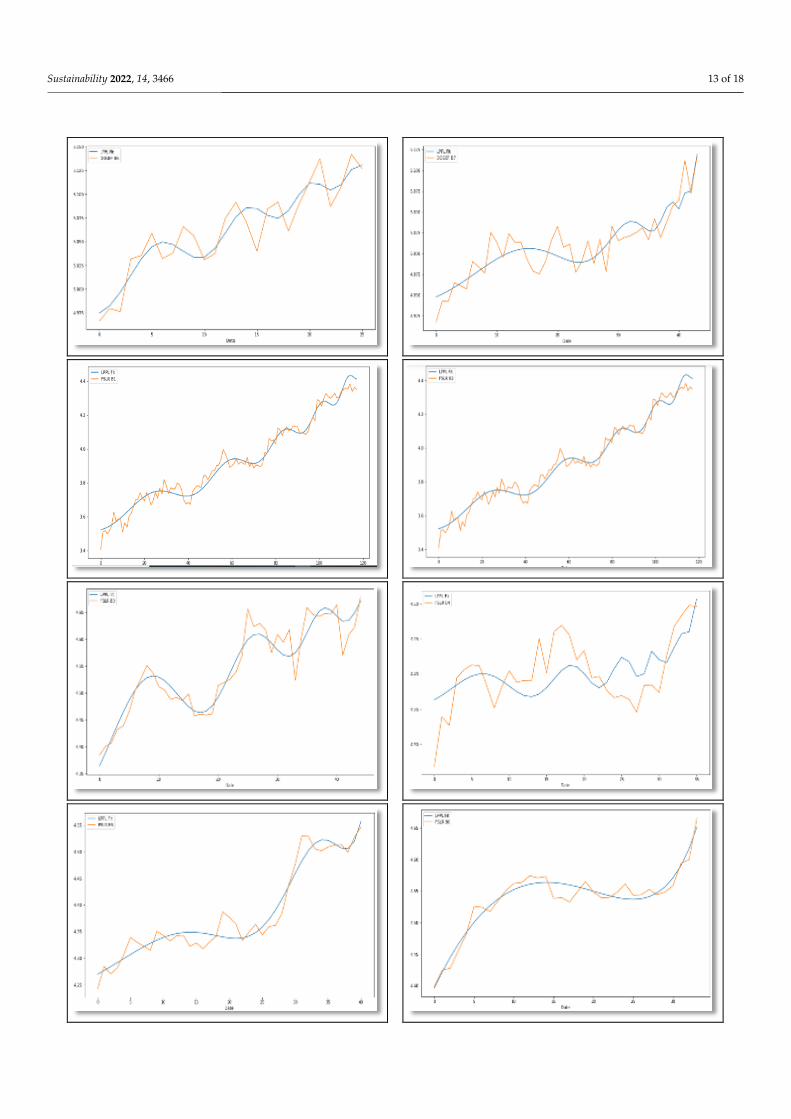
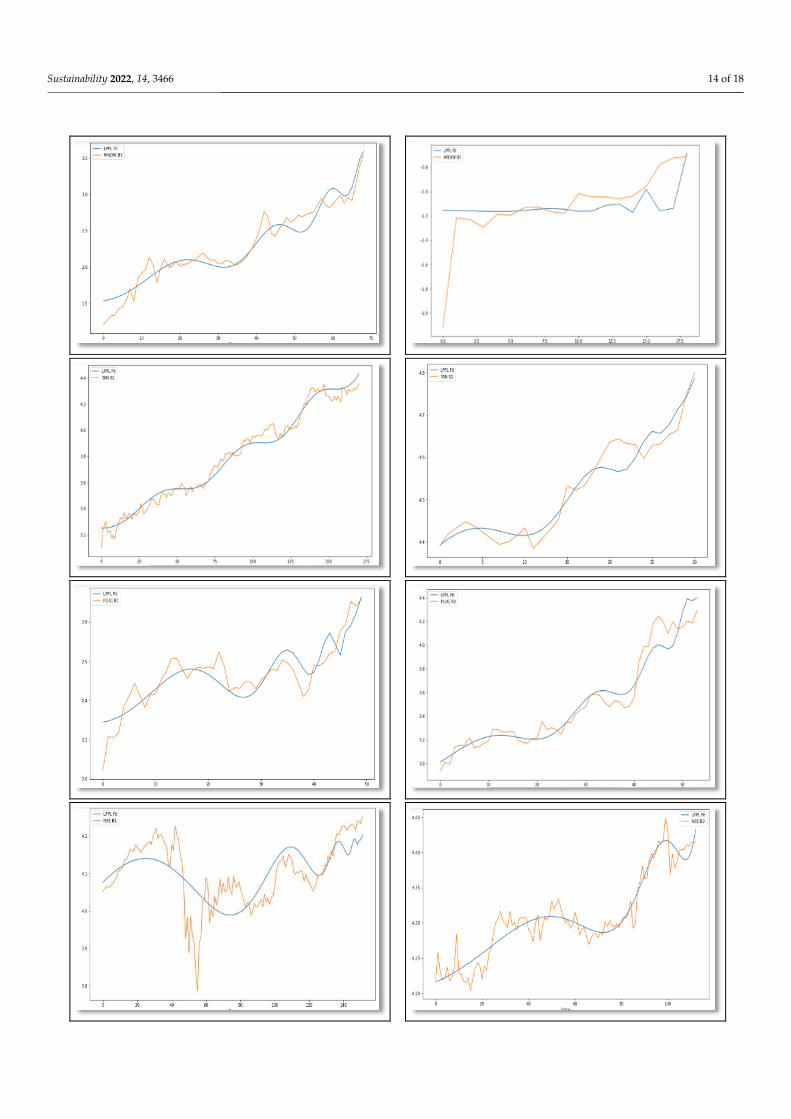
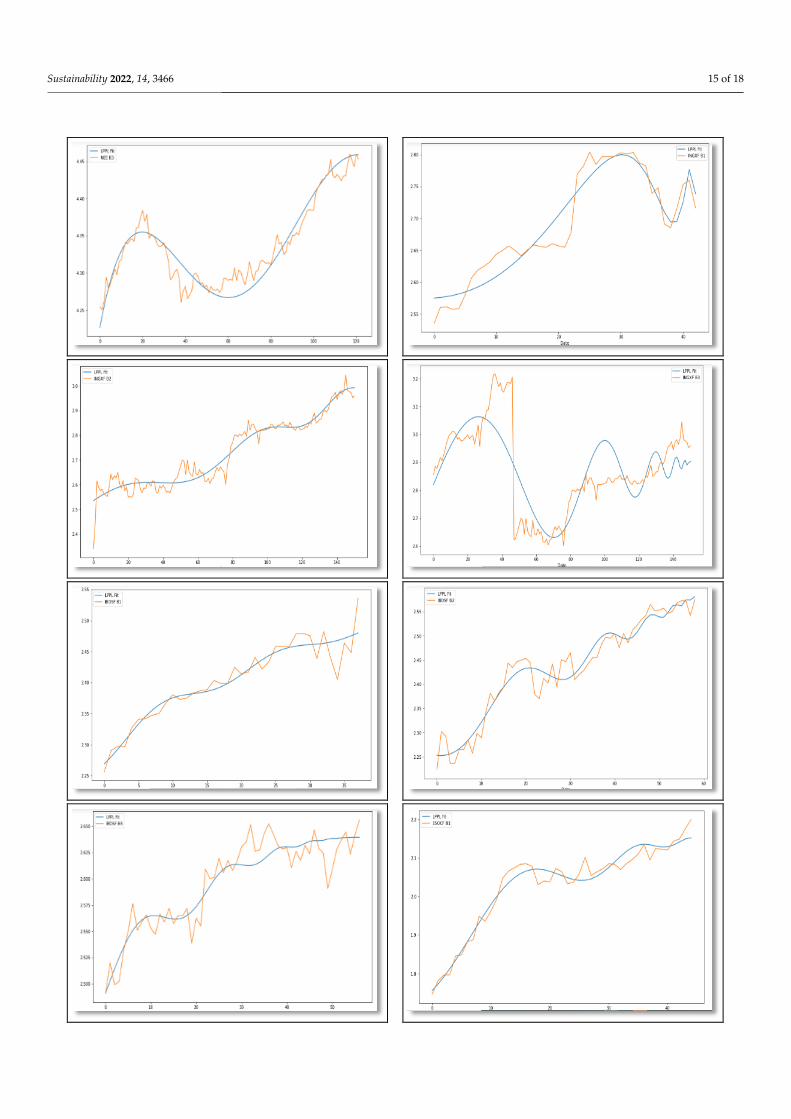
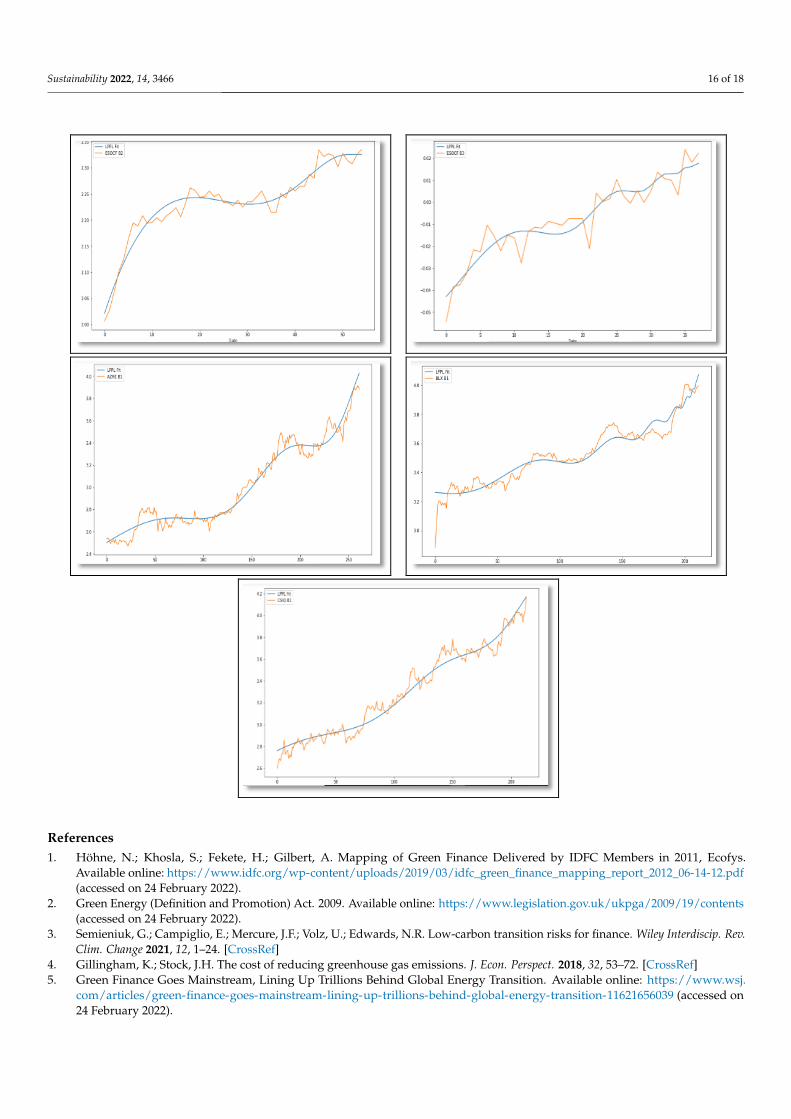
Table 2 presents the coefficients of the LPPL parameters in Equation (2). Drawdown(DD) is the break between the local minima to the next local maxima and it is ≥17%. Table 3represents the identified events behind eight bubble crashes (>150%) . A prominent LPPLsignature is exhibited by all 35 bubble crashes across all 12 Green Energy companies and theS&P Global Clean Energy Index from 31 December 2019 to 11 October 2021 (overlappingwith the COVID-19 period). We did not find any false positive alarm. Substantially lowerlevels of Root Mean Square Errors (RMSE) in all 35 cases support the LPPL fitment.
Table 2. Coefficients of the LPPL parameters having a drawdown of >18%.
Corporate/Index Bubble Time tc A B C1 C2 β ω DD (%)
INGXF
B1 6 January 2020 to4 March 2020 49 2.77 −0.02 0.030 0.0019 0.49 7.75 31%
B2 24 March 2020 to20 October 2020 152 3.38 −0.03 0.000 0.0015 0.63 10.42 86%
B3 11 November 2020 to14 January 2021 179 2.90 0.00 0.00 0.0048 0.70 7.72 42%
Sustainability 2022, 14, 3466 8 of 18
Table 2. Cont.
Corporate/Index Bubble Time tc A B C1 C2 β ω DD (%)
TANB1 23 March 2020 to
16 November 2020 178 1.47 117,695 602 3003 0.25 10.13 251%
B2 17 November 2020 to29 December 2020 29 4.79 −0.05 0.006 0.000 0.63 7.61 51%
IBDSF
B1 9 January 2020 to2 March 2020 44 2.56 0.00 0.000 0.0000 0.77 8.92 32%
B2 11 May 2020 to30 July 2020 58 2.59 0.00 0.001 0.000 0.71 12.31 42%
B3 3 March 2021 to20 May 2021 60 2.64 0.00 0.000 0.0000 0.43 12.16 18%
ESOCF
B1 15 May 2020 to20 July 2020 53 2.16 0.00 0.000 0.000 0.18 11.56 57%
B2 30 October 2020 to20 January 2021 56 2.33 0.00 0.000 0.0001 0.32 7.18 39%
B3 3 March 2021 to26 April 2021 39 1.04 0.998 0.000 0.0001 0.134 12.66 19%
WNDWB1 4 November 2020 to
8 January 2021 78 15.66 21.65 −0.08 −0.171 0.35 12.55 929%
B2 4 May 2020 to28 May 2020 21 0.07 0.64 0.55 −0.46 0.59 12.06 134%
S&P CE B1 3 March 2020 to2 January 2021 13 9.60 −0.30 0.00 0.00 0.70 10.10 183%
DOGEF
B1 31 December 2019 to6 March 2020 161 4.70 0.00 0.00 0.00 0.30 9.60 36%
B2 20 March 2020 to27 July 2020 78 5.10 0.01 0.00 0.00 0.80 10.40 77%
B3 23 September 2020 to14 October 2020 18 7.10 1.20 0.00 0.00 0.70 11.00 23%
B4 28 October 2020 to1 December 2020 26 5.20 0.00 0.00 0.00 0.80 9.10 22%
B5 7 December 2020 to7 January 2021 19 5.50 0.00 0.00 0.00 0.50 6.90 32%
B6 4 March 2021 to9 April 2021 21 5.20 0.00 0.00 0.00 0.70 6.80 18%
B7 23 June 2021 to24 August 2021 47 5.50 −0.04 0.00 0.00 0.80 11.70 22%
FSLR
B1 18 March 2020 to28 August 2020 131 6.48 −1.04 −0.01 −0.02 0.62 12.47 165%
B2 28 September 2020 to22 October 2020 28 5.32 0.03 −0.01 −0.03 0.56 7.42 39%
B3 16 November 2020 to21 January 2021 50 4.60 0.00 0.00 0.00 0.50 7.10 34%
B4 8 March 2021 to27 April 2021 41 4.30 0.10 0.10 0.00 0.71 12.43 25%
B5 13 May 2021 to12 July 21 47 4.00 2.50 0.20 0.10 0.71 8.80 35%
B6 27 July 2021 to13 September 21 34 4.70 −0.10 0.00 0.00 0.83 11.60 30%

Sustainability 2022, 14, 3466 9 of 18
Table 2. Cont.
Corporate/Index Bubble Time tc A B C1 C2 β ω DD (%)
PLUGB1 31 July 2020 to
9 October 2020 57 3.40 −0.55 −0.04 0.05 0.19 7.29 139%
B2 6 November 2020 to26 January 2021 54 14.51 20.19 −0.09 0.05 0.11 7.64 288%
NEE
B1 2 January 2020 to31 July 2020 182 4.20 −0.01 0.00 0.00 0.53 8.15 22%
B2 25 August 2020 to28 January 2021 130 4.29 0.00 0.00 0.00 0.76 12.41 22%
B3 18 March 2021 to3 September 2021 138 4.46 −0.29 0.29 0.00 0.75 9.90 18%
BLX B1 19 March 2020 to8 January 2021 214 4.16 −0.10 −0.01 0.00 0.53 11.40 203%
AZRE B1 2 January2020 to14 January 2021 277 0.76 60.43 2.48 1.87 0.87 6.08 284%
CSIQ B1 18 March 2020 to21 January2021 217 1.20 65.63 −0.63 0.71 0.15 6.67 376%
Note: The table above depicts the coefficients of the speculative bubbles in select Green Energy companies andthe S&P Clean Energy Index from EU and North America, within the COVID-19 pandemic (31 December 2019 to11 October 2021).
Table 3. Event linking with extremely large LPPL Drawdowns (> 150%).
Sr. No. Critical Date Drawdown Company/Index Events
1 8 Feburary 2021 929% Solar WindowTech (WNDW)
500% increase in prototyping andtesting speed; 12-fold increase in
testing capacity and output.
2 21 January 2021 376% Canadian Solar(CSIQ)
U.S. Energy forecasts showedcrude oil production would fallfrom BPD 13.2 million in May
2020 to BPD 12.8 million inDecember 2020.
3 26 January 2021 288% Plug Power(PLUG)
U.S. Energy forecasts showedcrude oil production would fallfrom BPD 13.2 million in May
2020 to BPD 12.8 million inDecember 2020.
4 14 January 2021 284% Azure Power(AZRE)
U.S. Energy forecasts showedcrude oil production would fallfrom BPD 13.2 million in May
2020 to BPD 12.8 million inDecember 2020.
5 16 November 2020 251% Invesco Solar(TAN)
Brent came back to USD 43 abarrel after a long time.
6 8 January 2021 203% Boralex (BLX) WTI Crude futures at USD 52 abarrel for third consecutive week.
7 2 January 2021 183% S&P GlobalClean Energy
WTI Crude futures at USD 52 abarrel for third consecutive week.
8 28 August 2020 165% First Solar(FSLR)
Russia-OPEC Crude Oil Pricewar from March 2020 to July 2020
Note: This Table depicts eight bubble crashes (seven Green Energy companies and one Index) with a Drawdownmore than 150%. Furthermore, it links those crashes with specific events (collected by the first Author fromvarious credible sources).
Sustainability 2022, 14, 3466 10 of 18
All 35 past crash instances occurred with the following four stylized facts:
1. β = 0.52 ± 0.38;2. ω = 9.65 ± 3.39;3. Minimum Drawdown (%) = 18%;4. Average Drawdown (%) = 108%.
We have identified a total of 35 bubble crashes from 31 December 2019 to 11 October 2021(Table 2). All of them matched the LPPL signature (Filimonov and Sornette, 2013) [28].Interestingly, the minimum drawdown is significantly higher (18%) than that of mostequities (7%) [30,31] (Ghosh et al., 2021; Ghosh et al., 2020) (Appendix A). It is a well-known fact that the average of the 10 worst equity drawdowns since 1970 until 2020 was27% in the S&P-500 [60]. Studies across global indices during the mid-1980s to the early1990s reveal some insightful information. It was found that the average drawdown (DD)was around 27% [50] (Johansen and Sornette, 2010), whereas the average drawdown (DD)of the Green Bubble is around 108% under stressful situations (e.g., COVID-19). This isfour times more than the average drawdown. The S&P Clean energy index suffered fromspeculative bubbles, too, indicating the very fact that almost all of its elements have abubble to varying degrees.
In fact, 40% of the Green Bubble has 50% or more draw-ups; 29% of the Green Bubblehas 100% or more draw-ups just before its collapse (Table 2). As COVID-19 highlighted theimportance of green energy, most European Union (EU) and North American Green Energyfirms (or Clean-Tech firms) were sought out by investors, creating a kind of speculativebubble in a relatively short of time. Usually, a bubble is coupled with crashes, destroyinginvestor’s wealth and causing a dent in investors’ confidence. Specifically, two of thebubbles (929% from WNDW (Solar Window Technology Inc., New York, NY, USA) and376% from CSIQ (Canadian Solar)) are so steep that investors’ wealth will most probablybe destroyed.
However, an alternative viewpoint was suggested by Giorgis et al. (2021) [21] earlyin 2021. They documented that these bubbles are not strictly destructive in nature whenlooking through the lens of the Social Bubble Hypothesis. On the contrary, these bubbleswould typically enhance economic activity and infrastructural spending. In fact, theyweave a network of positive feedbacks in a repetitive manner among the high-net-worthindividuals, venture capitalists and crucial government agencies in practically no time,resulting in an unprecedented increase in the growth of Clean-Tech or Green Energycompanies. This alternative viewpoint opens up a whole new dimension of interpretations.Fundamentally, the influential social circles such as venture capitalists and high-net-worthinvestors understood the importance of alternate energy (Green Energy) more during theCOVID-19 breakout. This realization translated into action when a substantial amount ofnew and even existing investments was after this handful of companies across the globe.This was the most likely reason of such a widespread bubble formation in this field. TheSocial Bubble Hypothesis (Giorgis, V., Huber, T., & Sornette, 2021) [21] indicated a suddenshift towards alternative energy forms as a possible substitute for the fossil-fuel-based“dirty energy”. It is an investment opportunity for new entrants. Even players relying oncrude oil have started their transition towards green energy, despite huge transaction costs.COP26 in Glasgow acted as a possible catalyst for such a sudden and fast-paced movement.This was definitely a build-up; however, the formation of the bubble in practically no timewas inevitable.
More than 60% of our sample exhibited at least one Green Bubble with DD > 150%(Tables 2 and 3). Furthermore, we observed an intuitive association between the larger(DD > 150%) speculative bubbles with Crude Oil (Table 3). Despite the fall in Brent Oil, theNew York Mercantile Exchange (NYMEX) and the West Texas Intermediate (WTI Crudefutures) are enjoying positive correlations with the growth of these Green Bubbles (pricesurge of Green Energy companies). Interestingly, our findings are paralleled with anoutstanding work of 2018, presenting the non-linear, co-integrating relationship betweenoil prices and Green Energy consumption [61–65] (Troster et al., 2018; Ma and Wang, 2022;

Sustainability 2022, 14, 3466 11 of 18
Frejowski et al., 2021; Vasylieva et al., 2021; Kaldellis, 2021). Perhaps this remarkablenexus is giving rise to FOMO (Fear Of Missing Out), a behaviour among investors ofclimate-focused companies [66]. Apparently, many traders have joined the Green Bubblebandwagon at its end, resulting in an unwanted position amid the global stock marketrally in mid-2021. It is rather difficult for them to switch at the moment; however, at anygiven opportunity, they would switch. This would, in turn, build a bubble in the regularenergy sector. Typically, there is a phase lag between the Green Bubbles and regular bubbles(formed in fossil-fuel-driven companies).
5. Conclusions
We have investigated Green Bubble behaviour in the stock prices of select stocks from abasket of Green Energy or Clean Tech companies (from North America and Europe), an ETF(Exchange Traded Fund) and the S&P Global Clean Energy Index during the COVID-19pandemic. The covered period is from 31 December 2019 to 11 October 2021, where dailyclosing prices were taken into consideration. In this study, we adopt the log-periodicpower law model (LPPL) methodology. Over the past decade, the LPPL model has beenwidely used for detecting bubbles and crashes in various markets (Brée and Joseph, 2013;Zhou, et al., 2018) [48,67].
Our analysis led us to the following conclusions: First of all, the presence of GreenBubbles in Green Energy companies during the COVID-19 is confirmed. Secondly, theaverage drawdown emerged as four times that of regular S&P-500 stock index understressed conditions, such as COVID-19. Thirdly, it is understood that these bubbles willnot typically destroy public wealth in the long run; on the contrary, they can increase theeconomic activity to a great extent, resulting in the sudden increase in the growth of GreenEnergy companies. Finally, the stylized facts obtained from empirical analysis would assistin predicting Green Bubbles in the future. Therefore, this study would most certainly assistpolicymakers, the industry and academia alike.
Given the growing importance of the role and contribution of stock exchanges to thechallenges of global climate and economic developments, policymakers and the industryshould remain committed to raise the awareness about the importance of green finance insecuring a better tomorrow for future generations.
We can see Green Bubbles as a learning platform that help stock exchanges supportthe transition of green finance and take a leading role in creating more sustainable, cre-ative and inclusive economies. Countries worldwide have to agree on the SustainableDevelopment Goals (SDGs), which include a clear call to action on climate change andeconomic development. We have identified 17 Sustainable Development Goals, set by theUnited Nations in 2015 for Sustainable Development [68]. Meeting these global goals willrequire a transition to green and sustainable, creative financial markets. There is a need forpromotion of green energy products in particular, as well as of the ecological sector and themainstream financial markets in general. For the time being, the Cap and Trade marketis voluntary and the carbon footprint reduction with the purchase of rights is not activelyencouraged. Their promotion would be good for reducing the global carbon footprint.
Green and sustainable finance offers benefits and opportunities for stock exchangesespecially energy stocks. As a result, many businesses are focusing on sustainability andadopting an eco-friendly business model, which helps the environment, sustainabilityand attracts investors. So, there is a growing consensus about the role of stock exchangesand especially of energy stocks in promoting economic development and sustainability.Finally, there is a positive link between well-functioning financial markets—especially ofgreen stocks and an economic and sustainable development. Clean-Tech firms promoteenvironmental signals to future strategic partners, providing them with information on thegreen impact of their eco-innovations [69] (Rivas and Wigger, 2017). These positive signalscreate loops of positive feedback, resulting in the creation of the bubble.
Sustainability 2022, 14, 3466 12 of 18
Author Contributions: Conceptualization, B.G.; methodology, B.G.; software, B.G.; validation, B.G.,and S.P.; formal analysis, B.G.; investigation, B.G. and D.K.; resources, B.G.; data curation, B.G.;writing—original draft preparation, B.G. and V.D.; writing—review and editing, S.P. and D.K.;visualization, B.G. and D.K.; supervision, B.G. and S.P.; project administration, B.G., S.P. and D.K. Allauthors have read and agreed to the published version of the manuscript.
Funding: This research received no external funding.
Institutional Review Board Statement: Not applicable.
Informed Consent Statement: Not applicable.
Data Availability Statement: Not applicable.
Conflicts of Interest: The authors declare no conflict of interest.
Appendix A. Proof of LPPL Signatures
Sustainability 2022, 14, x FOR PEER REVIEW 12 of 18
Funding: This research received no external funding.
Institutional Review Board Statement: Not applicable.
Informed Consent Statement: Not applicable.
Data Availability Statement: Not applicable.
Conflicts of Interest: The authors declare no conflict of interest.
Appendix A. Proof of LPPL Signatures
Sustainability 2022, 14, 3466 13 of 18Sustainability 2022, 14, x FOR PEER REVIEW 13 of 18
Sustainability 2022, 14, 3466 14 of 18Sustainability 2022, 14, x FOR PEER REVIEW 14 of 18
Sustainability 2022, 14, 3466 15 of 18Sustainability 2022, 14, x FOR PEER REVIEW 15 of 18
Sustainability 2022, 14, 3466 16 of 18Sustainability 2022, 14, x FOR PEER REVIEW 16 of 18
References
1. Höhne, N.; Khosla, S.; Fekete, H.; Gilbert, A. Mapping of Green Finance Delivered by IDFC Members in 2011, Ecofys. Available
online: https://www.idfc.org/wp-content/uploads/2019/03/idfc_green_finance_mapping_report_2012_06-14-12.pdf (accessed
on 24 February 2022).
2. Green Energy (Definition and Promotion) Act. 2009. Available online: https://www.legislation.gov.uk/ukpga/2009/19/contents
(accessed on 24 February 2022).
3. Semieniuk, G.; Campiglio, E.; Mercure, J.F.; Volz, U.; Edwards, N.R. Low-carbon transition risks for finance. Wiley Interdiscip.
Rev. Clim. Change 2021, 12, 1–24. https://doi.org/10.1002/wcc.678.
4. Gillingham, K.; Stock, J.H. The cost of reducing greenhouse gas emissions. J. Econ. Perspect. 2018, 32, 53–72.
https://doi.org/10.1257/jep.32.4.53.
5. Green Finance Goes Mainstream, Lining Up Trillions Behind Global Energy Transition. Available online:
https://www.wsj.com/articles/green-finance-goes-mainstream-lining-up-trillions-behind-global-energy-transition-
11621656039 (accessed on 24 February 2022).
6. Green Energy & Renewables: 2021 Valuation Multiples. Available online: https://finerva.com/report/green-energy-renewables-
2021-valuation-multiples (accessed on 24 February 2022).
References1. Höhne, N.; Khosla, S.; Fekete, H.; Gilbert, A. Mapping of Green Finance Delivered by IDFC Members in 2011, Ecofys.
Available online: https://www.idfc.org/wp-content/uploads/2019/03/idfc_green_finance_mapping_report_2012_06-14-12.pdf(accessed on 24 February 2022).
2. Green Energy (Definition and Promotion) Act. 2009. Available online: https://www.legislation.gov.uk/ukpga/2009/19/contents(accessed on 24 February 2022).
3. Semieniuk, G.; Campiglio, E.; Mercure, J.F.; Volz, U.; Edwards, N.R. Low-carbon transition risks for finance. Wiley Interdiscip. Rev.Clim. Change 2021, 12, 1–24. [CrossRef]
4. Gillingham, K.; Stock, J.H. The cost of reducing greenhouse gas emissions. J. Econ. Perspect. 2018, 32, 53–72. [CrossRef]5. Green Finance Goes Mainstream, Lining Up Trillions Behind Global Energy Transition. Available online: https://www.wsj.
com/articles/green-finance-goes-mainstream-lining-up-trillions-behind-global-energy-transition-11621656039 (accessed on24 February 2022).
Sustainability 2022, 14, 3466 17 of 18
6. Green Energy & Renewables: 2021 Valuation Multiples. Available online: https://finerva.com/report/green-energy-renewables-2021-valuation-multiples (accessed on 24 February 2022).
7. Umar, Z.; Kenourgios, D.; Papathanasiou, S. The static and dynamic connectedness of environmental, social, and governanceinvestments: International evidence. Econ. Model. 2020, 93, 112–124. [CrossRef] [PubMed]
8. ‘Green bubble’ Warnings Grow as Money Pours into Renewable Stocks. Available online: https://www.ft.com/content/0a3d0af8-7092-44c3-9c98-a513a22629be (accessed on 24 February 2022).
9. Shiller, R.J. Irrational Exuberance; Princeton University Press: Princeton, NJ, USA, 2000.10. Dempsey, P.; Edwards, C. Analysis: Green bubble? Eng. Technol. 2008, 3, 12–13. [CrossRef]11. Belle, R. The Green Bubble: Waste into Wealth: The New Energy Revolution; International Nuclear Information System; Abbeville Press:
New York, NJ, USA, 2007; ISBN 100789209551.12. A Green Bubble? We Dissect the Investment Boom. Available online: https://www.economist.com/finance-and-economics/2021
/05/17/green-assets-are-on-a-wild-ride (accessed on 24 February 2022).13. The Green Bubble. Available online: https://newrepublic.com/article/62327/the-green-bubble (accessed on 24 February 2022).14. Koutsokostas, D.; Papathanasiou, S.; Eriotis, N. Can mutual fund managers predict security prices to beat the market? The case of
Greece during the debt crisis. J. Predict. Mark. 2018, 12, 40–62. [CrossRef]15. Koutsokostas, D.; Papathanasiou, S. Mutual funds in Greece: Case study of domestic equity mutual funds during financial crisis.
Manag. Financ. 2017, 43, 812–827. [CrossRef]16. Koutsokostas, D.; Papathanasiou, S.; Balios, D. Adjusting for risk factors in mutual fund performance and performance persistence.
J. Risk Financ. 2019, 20, 352–369. [CrossRef]17. Christopoulos, A.; Dokas, I.; Kalantonis, P.; Koukkou, T. Investigation of financial distress with a dynamic logit based on the
linkage between liquidity and profitability status of listed firms. J. Oper. Res. Soc. 2019, 70, 1817–1829. [CrossRef]18. Christopoulos, A.; Papathanasiou, S.; Kalantonis, P.; Chouliaras, A. An Investigation of cointegration and casualty relationships
between the PIIGS’ stock markets. Eur. Res. Stud. 2014, 17, 109–123. [CrossRef]19. Bennett, J. Green bubble? Entrepreneur 2010, 2, 51–54.20. Wimmer, P. The Green Bubble: Our Future Energy Needs and Why Alternative Energy Is Not the Answer; LID Publishing: London, UK, 2016.21. Giorgis, V.; Huber, T.; Sornette, D. Swiss Finance Institute Research Paper Series N ◦ 21-36. In Swiss Finance Institute Research Paper
Series; Swiss Finance Institute: Zürich, Switzerland, 2021.22. Defining an Industry: Cleantech vs. Greentech. Available online: https://seekingalpha.com/article/41150-defining-an-industry-
cleantech-vs-greentech (accessed on 24 February 2022).23. What Is Cleantech? Available online: https://www.cleantech.org/what-is-cleantech (accessed on 24 February 2022).24. Vasiliou, D.; Eriotis, N.; Papathanasiou, S. Incorporating technical analysis into behavioral finance: A field experiment in the
large capitalization firms of the Athens Stock Exchange. Int. Res. J. Financ. Econ. 2008, 9, 100–112.25. Garber, P.M. Famous First Bubbles: The Fundamentals of Early Manias; MIT Press: Cambridge, MA, USA, 2001.26. Kindelberger, C.; Aliber, R. Manias, Panics, and Crashes: A History of Financial Crises; Palgrave Macmillan: London, UK, 2005.
[CrossRef]27. Gisler, M.; Sornette, D.; Woodard, R. Innovation as a social bubble: The example of the Human Genome Project. Res. Policy 2011,
40, 1412–1425. [CrossRef]28. Filimonov, V.; Sornette, D. A stable and robust calibration scheme of the log-periodic power law model. Phys. A Stat. Mech. Appl.
2013, 392, 3698–3707. [CrossRef]29. Geuder, J.; Kinateder, H.; Wagner, N.F. Cryptocurrencies as financial bubbles: The case of Bitcoin. Financ. Res. Lett. 2019, 31,
179–184. [CrossRef]30. Ghosh, B.; Papathanasiou, S.; Ramchandani, N.; Kenourgios, D. Diagnosis and prediction of IIGPS’ countries bubble crashes
during BREXIT. Mathematics 2021, 9, 1003. [CrossRef]31. Ghosh, B.; Kenourgios, D.; Francis, A.; Bhattacharyya, S. How well the log periodic power law works in an emerging stock
market? Appl. Econ. Lett. 2020, 28, 1–7. [CrossRef]32. Wheatley, S.; Sornette, D.; Huber, T.; Reppen, M.; Gantner, R.N. Are Bitcoin bubbles predictable? Combining a generalized
Metcalfe’s law and the log-periodic power law singularity model. R. Soc. Open Sci. 2019, 6, 1–13. [CrossRef]33. Mandelbrot, B. The variation of certain speculative prices. J. Bus. 1963, 36, 394. [CrossRef]34. Peters, E.E. Fractal Market Analysis. Applying Chaos Theory to Investment & Economics; Wiley: Hoboken, NJ, USA, 1994.35. Watkins, N.W.; Franzke, C. A brief history of long memory: Hurst, mandelbrot and the road to ARFIMA, 1951–1980 A brief
history of long memory: Hurst, mandelbrot. Entropy 2017, 19, 437. [CrossRef]36. O’Hara, M. Bubbles: Some perspectives from history. Rev. Financ. Stud. 2008, 21, 11–17. [CrossRef]37. Brunnermeier, M. Bubbles. In New Palgrave Dictionary of Economics; Blume, L., Durlauf, S., Eds.; Palgrave Macmillan: London, UK, 2009.38. Garber, P.M. Famous first bubbles. J. Econ. Perspect. 1990, 4, 35–54. [CrossRef]39. Quinn, W.; Turner, J.D. Boom and Bust: A Global History of Financial Bubbles; Cambridge University Press: Cambridge, UK, 2020.40. Aghion, P.; Veugelers, R.; Serre, C. Cold Start for the Green Innovation Machine (No. 2009/12). Bruegel Policy Contribution. 2009.
Available online: https://www.econstor.eu/handle/10419/45507 (accessed on 7 January 2022).41. Knuth, S. Breakthroughs for a green economy? Financialization and clean energy transition. Energy Res. Soc. Sci. 2018, 41, 220–229.
[CrossRef]
Sustainability 2022, 14, 3466 18 of 18
42. Marcus, A.; Malen, J.; Ellis, S. The promise and pitfalls of venture capital as an asset class for clean energy investment: Researchquestions for organization and natural environment scholars. Organ. Environ. 2013, 26, 31–60. [CrossRef]
43. Mathews, J.A. The renewable energies technology surge: A new techno-economic paradigm in the making? Futures 2013, 46,10–22. [CrossRef]
44. Criscuolo, C.; Menon, C. Environmental policies and risk finance in the green sector: Cross-country evidence. Energy Policy 2015,83, 38–56. [CrossRef]
45. Zhong, M.; Bazilian, M.D. Contours of the energy transition: Investment by international oil and gas companies in renewableenergy. Electr. J. 2018, 31, 82–91. [CrossRef]
46. Bürer, M.J.; Wüstenhagen, R. Cleantech venture investors and energy policy risk: An exploratory analysis of regulatoryrisk management strategies. In Sustainable Innovation and Entrepreneurship; Edward Elgar Publishing: Cheltenham, UK, 2008;pp. 290–309.
47. Mrkajic, B.; Murtinu, S.; Scalera, V.G. Is green the new gold? Venture capital and green entrepreneurship. Small Bus. Econ. 2019,52, 929–950. [CrossRef]
48. Brée, D.; Joseph, N.L. Testing for financial crashes using the log periodic power law model. Int. Rev. Financ. 2013, 30, 287–297.[CrossRef]
49. Johansen, A.; Ledoit, O.; Sornette, D. Crashes as critical points. Int. J. Theor. Appl. Financ. 2000, 3, 219–255. [CrossRef]50. Johansen, A.; Sornette, D. Shocks, crashes and bubbles in financial markets. Bruss. Econ. Rev. 2010, 53, 201–254.51. Johansen, A.; Sornette, D. Bubbles and anti-bubbles in Latin-American, Asian and Western stock markets: An empirical study. Int.
J. Theor. Appl. Financ. 2001, 4, 853–920. [CrossRef]52. Kenourgios, D.; Papathanasiou, S.; Bampili, A.C. On the predictive power of CAPE or Shiller’s PE ratio: The case of the Greek
stock market. Oper. Res. Int. J. 2021. accepted. [CrossRef]53. Samitas, A.; Papathanasiou, S.; Koutsokostas, D.; Kampouris, I. Volatility spillovers between fine wine and major global markets
during COVID -19: A portfolio hedging strategy for investors. Int. Rev. Econ. Financ. 2022. accepted. [CrossRef]54. Sornette, D.; Johansen, A. Significance of log-periodic precursors to financial crashes. Quant. Financ. 2001, 1, 452–471. [CrossRef]55. Sornette, D.; Johansen, A. A hierarchical model of financial crashes. Phys. A Stat. Mech. Appl. 1998, 261, 581–598. [CrossRef]56. Haken, H. Generalized Ginzburg-Landau equations for phase transition-like phenomena in lasers, nonlinear optics, hydrody-
namics and chemical reactions. Z. Phys. B Condens. Matter. 1975, 21, 105–114. [CrossRef]57. Kuropka, I.; Korzeniowski, P. Forecasting the Critical Points of Stock Markets’ Indices Using Log-Periodic Power Law. Ekonometria
2013, 1, 100–110.58. Lin, L.; Ren, R.E.; Sornette, D. The volatility-confined LPPL model: A consistent model of “explosive” financial bubbles with
mean-reverting residuals. Int. Rev. Financ. Anal. 2014, 33, 210–225. [CrossRef]59. Johansen, A. Characterization of large price variations in financial markets. Phys. A Stat. Mech. Appl. 2003, 324, 157–166.
[CrossRef]60. Historical Drawdowns for Global Equity Portfolios. Available online: https://steadyoptions.com/articles/historical-drawdowns-
for-global-equity-portfolios-r595 (accessed on 24 February 2022).61. Troster, V.; Shahbaz, M.; Uddin, G.S. Renewable energy, oil prices, and economic activity: A Granger-causality in quantiles
analysis. Energy Econ. 2018, 70, 440–452. [CrossRef]62. Ma, M.; Wang, Q. Assessment and forecast of green total factor energy efficiency in the yellow river basin—A perspective
distinguishing the upper, middle and lower stream. Sustainability 2022, 14, 2506. [CrossRef]63. Frejowski, A.; Bondaruk, J.; Duda, A. Challenges and opportunities for end-of-life coal mine sites: Black-to-Green energy
approach. Energies 2021, 14, 1385. [CrossRef]64. Vasylieva, T.; Pavlyk, V.; Bilan, Y.; Mentel, G.; Rabe, M. Assessment of energy efficiency gaps: The case for Ukraine. Energies 2021,
14, 1323. [CrossRef]65. Kaldellis, J.K. Supporting the clean electrification for remote islands: The case of the greek tilos island. Energies 2021, 14, 1336.
[CrossRef]66. Energy-Stock Surge Leaves Climate-Focused Investors Behind. Available online: https://www.livemint.com/market/stock-
market-news/energystock-surge-leaves-climate-focused-investors-behind-11635078800095.html (accessed on 24 February 2022).67. Zhou, W.; Huang, Y.; Chen, J. The bubble and anti-bubble risk resistance analysis on the metal futures in China. Phys. A Stat.
Mech. Appl. 2018, 503, 947–957. [CrossRef]68. 17 Sustainable Development Goals. Available online: https://sdgs.un.org/goals (accessed on 24 February 2022).69. Rivas Hermann, R.; Wigger, K. Eco-innovation drivers in value-creating networks: A case study of ship. retrofitting services.
Sustainability 2017, 9, 733. [CrossRef]