decision-making on climate control for energy efficiency and conservation in historic buildings
TRANSCRIPT

Postprints from the Conference
Energy Efficiency in Historic Buildings
Visby, February 9–11, 2011


Gotland University Press 15
Editors: Tor Broström and Lisa Nilsen Publisher: Gotland University Press 2012Address: Gotland University S-62156 Visby
Web: www.hgo.se Phone: +46(0)498-29 99 00 ISSN: 1653-7424 ISBN: 978-91-86343-11-8
Layout: Alice Sunnebäck/JASun KB
Cover pictures: Front: Gripsholm Castle/Tor Broström Back: Burmeisterska huset in Visby/Love Strandell
Postprints from the Conference
Energy Efficiency in Historic Buildings
Visby, February 9–11, 2011


Preface ....................................................................................................... 7
From Historical Climate to Comfortable Climate in Historic Buildings ............ 9Dario Camuffo and Chiara Bertolin
Mould Problems in Swedish Churches as Influenced by Construction and Microclimate ........................................................................................20
Jonny Bjurman and Aime Must
Paint Failure as Potential Indicator of Cool Indoor Temperature ....................30Maria Brunskog
Energy and Power Demand for Intermittent Heating of Churches ................37Poul Klenz Larsen, Tor Broström and Lars Aasbjerg Jensen
Fan Convectors vs. Bench Heaters in Churches – Impact on Air Velocities ..47Magnus Mattsson, Tor Broström, Elisabet Linden, Svante Lindström and Mats Sandberg
Studying Organic Hygroscopic Art Objects Housed in Historic Buildings ....59Charlotta Bylund Melin
Decision-making on Climate Control for Energy Efficiency and Preventive Conservation in Historic Buildings ..............................................70
Gustaf Leijonhufvud and Tor Broström
Simulation of the Energy Performance of Historic Buildings .........................81Torun Widström and Magnus Mattsson
Energy Efficiency in Historic Timber Buildings ..............................................93Eir Grytli
Energy Efficiency and Preservation in our Cultural Heritage – EEPOCH .....105Heidi Norrström and Michael Edén
Sustainable and Careful Renovation and Energy Efficiency in Cultural Historical Buildings – a Pre-study ................................................. 119
Fredrik Ståhl
Methods to Indentify Air Leakages in the Building Envelope of Churches ...129Magnus Mattsson, Svante Lindström, Elisabet Linden and Mats Sandberg
Historic Buildings as Museums .................................................................139Jochen Kaeferhaus
Contents

Solar Collectors in a Roof Landscape ....................................................... 151Annette Henning
Using an Epidemiological Approach as a Supporting Tool for Energy Auditing of Culturally and Historically Valuable Buildings ................164
Patrik Rohdin, Mariusz Dalewski and Bahram Moshfegh
CultureBee – Wireless Data Monitoring and Control System ...................... 175Allan Huynh, Jingcheng Zhang, Qin-Zhong Ye and Shaofang Gong
Reliability and Latency Enhancements in a ZigBee Remote Sensing System ........................................................................................183
Jingcheng Zhang, Qin-Zhong Ye, Allan Huynh and Shaofang Gong
Wind Tunnel Measurements of Pressure Distribution on the Façade of a Church ..............................................................................................199
Mats Sandberg, Magnus Mattsson, David Etheridge and Leif Claesson
Pressure Pulse Technique – a New Method for Measuring the Leakage of the Building Envelope of Churches .......................................................205
Ed Cooper, David Etheridge, Magnus Mattson and Hans Wigö
Sustainable Refurbishment of Museum Buildings ......................................213Michaela Hoppe, Volker Huckemann, Lars Klemm, Anke Schenk, Sven Steinbach and Heiko Werdin
Indoor Climate and Energy Efficiency in Museums ....................................226Jan G. Holmberg
An Analysis of Microclimate Differences Leading to Sporadic Mould Growth in Skokloster Castle, an Unheated Historic Building ............236
Jonny Bjurman and Gustaf Leijonhufvud
On Historical Climate in Swedish Stone Churches .....................................245Mattias Legnér and Mia Geijer
Installations for Heating with Firewood before the Second World War in the Northern Baltic Sea Region .............................................................260
Joakim Hansson

Preface
The heavier demands that society now places on the efficient management of finite resources in general and energy in particular is bound to have consequences for our ability to use and thus preserve historic buildings and their interiors. When rising energy prices coincide with people’s greater insistence on indoor comfort, all the more historically valuable buildings stand the risk of being properly heated and, ultimately, either abandoned or vulnerable to damage. Such a trend runs diametrically counter to the goal of longterm use and preservation of these buildings.
Energy efficiency is an issue that brings the tradeoff between aspects of use and preservation to a head. On the one hand, interventions for energy efficiency facilitates longterm use as it makes it possible for buildings to be heated at a lower running cost; on the other hand, the installations may have both a physical and a visual impact on the cultural heritage value of the building. Conversely, while doing nothing may protect the buildings’ culturalheritage values, in the short term, there is a danger that such a decision will make them less attractive for longterm use and thus limit opportunities for their preservation. Economically and ecologically sustainable heating solutions must therefore be found that make it possible to use the buildings without jeopardizing their cultural heritage value.
A sustainable use and preservation of historic buildings requires broad and long term compromises between social, economic and environmental aspects. This fundamental tenet of the sustainability discourse is not new. A similar philosophy was espoused by John Ruskin in 1849 in his The Seven Lamps of Architecture, in which he describes older buildings thus: “They are not ours. They belong partly to those who built them and partly to all the generations of mankind who are to follow us.”
In order to promote a sustainable use and preservation of historic buildings, The Swedish Energy Agency instituted a National Research Program for Energy Efficiency in Historic Buildings. The first stage of the program ran from 2007 to 2010 with a total budget of around 4 million Euro. Additional funding was provided by the Church of Sweden and the National Heritage Board. There were fifteen projects involving some thirty researchers from different Swedish universities and research institutes. Now, the program continues in another four year period until 2014 with a mixture of continued and new projects.
As scientific coordinator of the research program, Gotland University organized the conference Energy Efficiency in Historic Buildings to mark the end of the first stage of the national research program. The conference was held in Visby in February 2011. Most of the projects were represented at the conference and international

keynote speakers were invited to each session, giving a total of 24 papers. More than one hundred participants, representing ten countries, were registered for the conference.
A most valuable international context to the Swedish projects has been provided by the project CLIMATE FOR CULTURE funded by the European Commission (contract nr 226973). Many of the contributions to the conference are part of or related to this project.
On behalf of the organizers I would like to thank the Swedish Energy Agency for financing the research program as well as the conference. The contributions of Thomas Korsfeldt, former Director of the Energy Agency and now chairman of the program steering group, and Kenneth Asp, coordinator of the research program have been instrumental to success of the program.
Lisa Nilsen has made an invaluable contribution as administrator of the conference and coeditor of the proceedings. Thanks also to Alice Sunnebäck for finishing the layout of the proceedings.
Last but not least, thanks to the speakers and the participants of the conference for making this conference successful both in terms of scientific results and networking.
Tor Broström
Center for Energy Efficiency in Historic Buildings Gotland University

Gotland University Press 15
9
From Historical Climate to Comfortable Climate in Historic Buildings
How Shall Energy Efficiency Cope with this Revolution?
Dario Camuffo and Chiara BertolinNational Research Council (CNR)Institute of Atmospheric Sciences and Climate (ISAC), Padua, Italy* Corresponding email: [email protected]
Summary
The indoor climate of a number of churches, either unheated or heated with various heating systems, has been analyzed to investigate the impact of heating on artworks. In the last decades, indoor climate change had dramatically changed for the actual high request for thermal comfort. However, the various heating systems had a different impact, depending on the heating strategy. A comparison is made between the two basic heating strategies: i.e. central heating, focused to heat the whole building volume, and then allow people entering in a comfortable environment and local heating, aimed to leave the environment cold and to heat just people, when and where needed. Historical buildings are typically not energy efficient, in terms of heat dispersion, fuel consumption and heating installation. Something could and should be done to improve insulation and reduce leakage, but the historical and artistic nature of such buildings provides strong limits to any substantial change. The most efficient energy control can be made through an appropriate choice of the heating system, finalizing it to provide local comfort to people, and limiting the heat dispersion inside the nave and the leakage through the envelope. Thermal comfort is theoretically independent of the specific form of heating, but is energy demanding and might oppose to conservation needs. Local heating is the favourable system for conservation, energy saving and use in historical buildings, which typically have low energy efficiency.
Keywords
Historical climate, historical buildings, indoor climate, local heating.
Introduction
Churches constitute an invaluable jewel-case full of artworks, and at the same time they have been built for liturgical aims. They have been kept unheated for centuries and many artworks survived till this day, most of them preserved in excellent conditions. In this paper we will deliberately limit our discussion to the problem of the objects that suffer from mechanical damage for imbalances or changes in temperature and/or relative humidity (e.g. pipe organs, painting on canvas or panels, wooden furniture, wooden statues, tapestries, books,

Gotland University Press 15
10
antiphonaries) that are considered within the European standard EN 15757 “Conservation of Cultural Property — Specifications for temperature and relative humidity to limit climate-induced mechanical damage in organic hygroscopic materials”.
As a matter of fact, the continual improvement of the social conditions and the related well-being has brought an increasing demand of comfort that has not stopped in front of places of worships. As a consequence, today a number of churches are heated on request of the congregation.
In principle, the use is positive for conservation and is in line with the very aim of churches. However, after the installation and operation of heating systems some new damage appeared. The above raises a number of questions. Is thermal comfort compatible with conservation? Are the various heating systems equally safe in terms of conservation? And how do they cope with energy saving and especially with the poor energy efficiency of the envelopes typical of historical buildings conceived centuries ago? How are thermal comfort, conservation needs, historical building envelope and energy efficiency related with each other? These difficult questions are the aim of this paper.
Historical buildings and historical climate
Any historical building had in the past its own historical climate, determined by the external regional climate, weather, building envelope, use and other factors. Furniture and collections were conditioned by, and adapted to, this particular microclimate. No object can be conceived without memory of its past and present-day living conditions. The temperature (T) and especially the relative humidity (RH) have interacted with the objects determining internal tensions to which they have adapted either with reversible or irreversible shrinkage and swelling, maybe generating permanent yield, or creating expansion joints to respond to the microclimate levels and variability.
The whole of the past T and RH conditions experienced by the objects that have contributed to determine their present-day state of conservation can be expressed in terms of “historical climate”. The European Committee for Standardization (CEN) gives the following definition of “Historical Climate”: “climatic conditions in a microenvironment where a cultural heritage object has always been kept, or has been kept for a long period of time (at least one year) and to which it has become acclimatized.” (EN 15757: 2010).
The same EN standard pinpoints the risk for conservation when objects experience T or RH levels or fluctuations different from those to which they are used within their historical climate because objects may suffer more or less severe damage.
In some negative, specific cases, especially for excessive dampness, some maintenance work have been necessary (e.g. capillary rise, roof, gutter repair) or some conservation actions have been undertaken (e.g. HVAC) to avoid mould and other problems. However, in general, the situation was positive and many

Gotland University Press 15
11
artworks survived to the present day in reasonably “good conditions”. We should consider, however, that despite the nice appearance, the “good conditions” are in unstable equilibrium, strictly related to the historical climate and, in particular, to its variability (especially RH variability).
From safe to risky microclimate change
If a church is heated, it will necessarily depart from the historical climate. The departure will depend both on the heating system and how this is operated. Depending on the use and the availability of resources, the heating system will be operated continually for the whole cold season, or occasionally, when the church is used for liturgical services, e.g. once a week. A continually operated heating is comfortable and expensive; from the point of view of conservation it avoids dangerous T and RH cycles but the level of indoor RH drops too much (Fig. 1).
Fig. 1. Map of Europe, showing the indoor RH level (RHin) in buildings heated at 18 °C in January, when outside the RH level (RHout) is RHout=100%, e.g. fog or persistent rain. If RHout=50%, then RHin is half the mapped values. In the coldest regions (i.e. on the North-Eastern side), the indoor RH drops too much with risk of permanent yield or even fracture of wooden artefacts.

Gotland University Press 15
12
As a consequence, wood will shrink and may encounter permanent yield or cracks. Occasionally operated heating is more commonly found because it requires less fuel consumption; however it generates sharp T peaks and RH drops that are dangerous to artworks. In some cases one applies a combina tion of the two modes, keeping the building at a mild mid-level, and raising T at comfort level only when needed. However, whatever the mode of use, i.e. continual, occasional or mixed-mode, the objects suffer when heating is made for comfort purposes.
Attempts have been made to compensate the drop in RH by adding some moisture to the air. This mitigation strategy is hardly acceptable because, in the presence of cold surfaces, it causes continual condensation and mould growth. The situation is also worse in the case of occasional or mixed-mode heating because painting on canvas, tapestry and wooden surfaces closely follow the air temperature and its variability; on the other hand, marble statues, murals, frescoes and masonry remain at low temperature for their large thermal inertia. The result is that canvas, tapestry, etc will become dry and dehydrate; on the other hand, marble, frescoes, etc risk that their surface temperature remains below the dew point (especially when the moisture content is increased for the presence of churchgoers) with the consequence that they will suffer from conden-sation that will develop on the cold surfaces. Briefly, any form of heating may have negative consequences on objects and the practice of compensating RH drops by adding moisture to the air is not always a positive solution because the excess moisture may condensate on cold surfaces.
We can easily imagine that a threshold exists for T and RH variability, but we don’t know it. Efforts were made to identify the threshold level to operate under safe conditions. Safe fluctuations are they reality or a dream? The US standard ASHRAE 2003 introduced the concept of “proofed fluctuation”, i.e. the largest RH or T fluctuation to which the object has been exposed in the past without having suffered visible damage (Michalski, 2007). It is supposed that the risk of further damage from fluctuations smaller than the proofed value is extremely low.
However, it has been observed that T and RH fluctuations may generate internal tensions and microcracks, that may subsequently grow for repeated stress/strain cycles until they will form macro fractures (Bratasz and Kozlowski, 2004; Camuffo (et al.), 2007). This underlines the need of avoiding, as far as possible, any departure from the historical climate because such departures are potentially dangerous to conservation.
In conclusion, we should return to the fundamental question: are we able to determine any threshold for a tolerable climate change and variability? In practice, acclimatisation may imply some functional fractures to respond to the microclimate variability. Any departure from the historical climate falls within an unexplored area, which might be risky for objects that are exposed to large internal stresses never, or rarely, experienced before.
The CEN standard EN 15757 considers this problem and recommends remaining within the historical climate to avoid any risk of damage to objects. More specifi-cally, the conditions recommended in EN 15757 are summarised as follows.

Gotland University Press 15
13
• When the RH is stable, or fluctuates within 10 %, it is no problem.• If RH is unstable, the lower and upper limits of the target range of
RH fluctuations are determined as the 7th and 93rd percentiles of the fluctuations recorded in the monitoring period, respectively (Fig. 2). If the fluctuations follow a Gaussian distribution, the above limits (i.e. 7th and 93rd percentiles) correspond to –1,5 and +1,5 Standard Deviation (SD), respectively.
In practice, the conclusion of EN 15757 is that heating a historical building is contrary to the principle of keeping the historical climate unchanged.
The two heating strategies
The present-day use of historic buildings requires some heating for the thermal comfort of people. We know that heating is potentially dangerous when it exceeds a certain threshold established as 7th and 93rd percentiles or ±1.5 SD (Fig. 3). However, it may be that some heating strategies are less risky than
Fig. 2. Safe (green) and Risk (red) areas depen-ding on how much RH deviates from the average Historical Climate. The Safe Area lies within the 7th and 93rd percentiles of the fluctuations that corresponds to –1,5 and +1,5 Standard Deviation in the case of a Gaussian Distribution (EN 15757).
Fig. 3. An example of percentile distribution of Daily RH Range in a church in the Italian Alps in which warm-air-heating is occasionally operated. Green Area: the “safe” variability band, lying between the 7th and 93rd percentiles of the RH variability in the absence of heating ope-rations (EN 15757). When heating is operated, the RH levels fall within the risk area; wooden statues and paintings on canvas are suffering damage.

Gotland University Press 15
14
others, and we could concentrate on them, possibly improving them to the conservation aims. The question is now: what heating strategy can be used to provide thermal comfort and, at the same time, to avoid risk to cultural items?
There are two heating strategies possible (Fig. 4), i.e.:
General heating, i.e. to heat the whole building, or a specific room and then allow people entering in a comfortable environment. (Fig. 4). This form of heating is based on the diffusion of heat within the whole building or room volume. Typical systems are: underfloor heating, warm-air, convective radiators, fan-coils. General heating is irrespective of the historical climate and for this reason it is potentially dangerous to conservation. It should be used with care.
Local heating, i.e. to leave the environment cold and heat just people, when and where needed. This form of heating is based on concentrating heat in the manned area and avoiding diffusion of heat outside it. Typical systems are: pew heating, and IR emitters. Local heating perturbs the historical climate only slightly around artworks and is compatible with conservation.
These two types of heating strategy, their impact on artworks and the necessarily limited comfort we can expect from them are the object of the European standard prEN15759 (2011) “Conservation of Cultural Property – Indoor Climate – Part 1: Heating Churches, Chapels and other Places of Worship”.
Type of heating and building efficiency
Historical buildings, and in particular churches, have envelopes made with a technology not compatible with energy saving. They are typically non-energy-efficient buildings and the possibility of improvement is limited. The heat loss that derives from the heat supplied to the envelope, depends, inter alia, on the tempe-rature difference between indoor air and masonry. The heat loss through window panes, roof, etc depends, inter alia, on the difference between both indoor and outdoor air temperatures. The consequences of the above facts are relevant, i.e.:
Fig. 4. The two heating strategies: central and local heating. The smaller the temperature difference between internal air, the envelope and the external air, the smaller the heat loss.

Gotland University Press 15
15
General heating favours homogeneous heat distribution within the building, and supplies heat to the envelope. Much energy is required and wasted trough thermal bridges, leakage and accumulation into the envelope (Fig. 5). Being based on the dispersion of heat, it is hardly sustainable for non energy efficient historical buildings. With General Heating people benefit from a small portion of the total power supply, i.e. the system has low efficiency.
Local heating disperses a small amount of heat, leaving the envelope cold. Reducing any dispersion of heat, it is more convenient for non energy efficient historical buildings thanks to the smaller loss of heat. Less energy is required. With local heating people benefit from a large portion of the total power supply, i.e. the system has high efficiency.
The EU funded Friendly-Heating Project has carefully studied the characte-ristics of all heating systems in order to evaluate pros and cons, and especially their potential impact on the various kinds of artworks and to devise the best heating strategy, if possible (Camuffo (et al.), 2007). The project was aimed to investigate if it is possible to preserve artworks in their natural microclimate and, at the same time, to warm people at the highest thermal comfort compatible with conservation.
Local heating resulted to be the most convenient strategy, but it was necessary to further study how to reduce heat dispersion and how to improve comfort because in general local heating provides limited comfort. The best results were obtained with gentle IR radiation emitted from low-temperature sources, e.g. low-tempe-rature heating foils, heating glass panes and heating carpets.
The heating foils are made of an electrically heated layer of graphite microgra-nules deposited on fibreglass and sealed between two plastic foils. For their electrical resistance, the graphite granules are heated up when electric power is supplied. A positive fact is that the electrical resistance increases with granule temperature and reduces the current intensity. Consequently, the maximum temperature of the foil is self-regulated at levels specifically selected for various
Fig. 5. Heat is lost especially through vaults and windows, which appear to be the coldest areas in the thermal image.

Gotland University Press 15
16
parts of the body – in our case between 40 ° and 70 °C. This self-regulation provides a natural cut-out for the system and eliminates the risk of ignition or burning skin. A thermostat is added for further fine regulation and safety. Thermal comfort was improved with an ergonomic combination of heat sources distributed in the manned area below the kneeling pad to heat feet from the top, the seats to heat legs and calf, and the back of seats to heat hands and/or back (Fig. 6).
The heating glass panes are made of a very resistant tempered glass, with a transparent submicrometric layer of sputtered metal oxides inside. For the electrical resistance of the metal oxides, they are heated up when electric power is supplied. A thermostat maintains T at the desired level (e.g. 40 °C and a second thermostat guarantees safety even in the case of failure of the first thermostat. The glass panes provide thermal comfort by means of IR radiation or direct contact with the back or the hands.
The heating carpet is made of a heating foil or a heating wire placed between an insulating layer on the bottom to avoid heat dispersion to the floor and a carpet-like layer on the top. The top layer should protect the heating foil against mecha-nical damage by sharp objects, fire, water, etc. The surface temperature should be low (e.g. 20 °C) and provides comfort to feet but not the rest of the body, which should be heated with other sources, e.g. remote IR remitters.
Further details about the project and its results are reported elsewhere (Camuffo (et al.), 2010).
Fig. 6. Location and temperature of the heaters in the EU Friendly-Heating Project studied to preserve artwork in its natural microclimate and, at the same time, to warm people at a ther-mal comfort level compatible with conservation. On the right side, temperature profiles in the pew area, and a picture of the heating foils used to produce IR radiation.

Gotland University Press 15
17
Local heating is convenient for several reasons; however, a misuse of it removes all advantages. Some examples will be useful to elucidate the problem.
Somebody makes an improper use of heaters typical of local heating to perform general heating. This happens when the room air is heated for a long time (e.g. a day), or with many local heaters (e.g. pew heaters) until the air temperature in the whole church reaches a comfortable level. In practice, many pew heaters are used instead of a few advective radiators to warm the indoor air.
Similarly, the use of warm air opposes to the concept of local heating, because warm air, for its buoyancy, escapes immediately from its source, and rises. The air movements and the internal heat unbalances (especially the contrast between mild air and cold walls) generally cause unpleasant downdraughts that reduce comfort. Anyone wanting heating based on the emission of warm air can hardly be considering local heating.
The most efficient way of producing local heating is connected with the use of IR radiation (i.e. thermal radiation). Thermal radiation is generated with high- or low-temperature emitters. High temperature emitters are electrical wires brought to below brightness temperature (e.g. 600 °–800 °C) oriented with reflectors but with the incandescent sources located far from churchgoers to avoid burning. Low temperature emitters are hot water pipes or heating foils (at 50 °–60 °C) located close to the people in order to reduce heat dispersion as far as possible, especially because IR from low temperature sources cannot be oriented. Especially in the case of high temperature emitters, IR should be evenly, or at least symmetrically distributed over the body to be comfortable, and it should never exceed the equivalent of 8 °–10 °C warming. In practice however, emitters are generally located aloft, e.g. chandeliers. Consequently, the head is overheated and feet remain cold. Alternatively, wall heaters are placed on both sides of the nave but, for the large distances, churchgoers sitting in the right half of the nave are heated only from their right side, which is facing the closest wall emitter, and vice-versa.
Thermal comfort and conservation
Churchgoers require some heating to reach thermal comfort. Depending on the heating strategy (general/local), ergonomic distribution of the emitters and efficiency, more or less heat is dispersed inside the room. As opposed, the requi-rement of keeping the historical climate unchanged is contrary to the release of heat.
Only a small heat dispersion is sustainable and may be acceptable for conser-vation, i.e. in the case that the indoor climate does not depart from the historical one (EN 15757, 2010). The conservation need constitutes an upper limit to heat supply and, consequently, to thermal comfort.
Both the Friendly-Heating project and the European standard prEN15759 (2011) advise that churchgoer thermal comfort and conservation have divergent aims and they may be in conflict. For this reason there is a need for a compromise

Gotland University Press 15
18
between the two requirements. In the case of risk for vulnerable objects, however, conservation should have priority.
Heating for thermal comfort should be necessarily limited and people should reach comfort with different strategies, e.g. heavy clothing, and thorough choice of local heating systems.
Conclusions
In principle, keeping the historical climate unchanged is contrary to any form of heating. General heating heats both people and artworks (in some cases artworks are heated more than people), and is responsible for dangerous drops in RH. Air humidification is not advisable because condensation may occur in the coldest surfaces, especially in the case of intermittent heating. It strongly departs from the historical climate and is hardly compatible with conservation. The only possibility is to make a very gentle, careful use of it. In principle, heat loss through the envelope is larger with general heating and smaller with local heating, and this is particularly relevant with low energy efficient buildings.
Local heating is aimed to control heat dispersion, to warm people while leaving the environment unchanged. For this reason, this system is the most convenient for conservation, energy saving and use in historical buildings, which typically have low energy efficiency.
Thermal comfort is theoretically independent of the specific form of heating, but is energy demanding and might oppose to conservation needs (Fig. 7). Integration of emitters may be helpful to comfort, e.g. in the case of pew heating more than one low temperature source, or a combination of IR lamps with pew heating
Fig. 7. The system has a number of variables. From one side Historical Climate and Conser-vation, Sustainability and Energy Saving, and Non-Energy Efficient Historical Buildings are pointing to the same direction; Thermal Comfort to the opposite one.

Gotland University Press 15
19
or heating carpets. However, conservation and sustainability impose a rigid threshold to the reachable comfort level. The final realistic goal should not be not to reach comfort, but to help to reduce discomfort. Local heating remains the best candidate to satisfy all the above counteracting aims but it should be conveniently realized and operated.
Acknowledgements
Many thanks to Prof Tor Broström, Gotland University, Lisa Nilsen, Conference Administrator, and the research programme Energy Efficiency in Historic Buildings, co-sponsored by Gotland University, the Church of Sweden, and the Swedish National Heritage Board for the kind invitation. This paper reports findings of three EU funded research projects, i.e. Friendly-Heating (EVK4-CT-2001-00067), Sensorgan (Contr 022965) and Climate for Culture (Grant 226973) and disseminates the results of the activity of CEN/TC346 WG4 concerning the European standardization.
References
ASHRAE. 2007. Museums, Galleries, Archives and Libraries, Chapter 21. In: ASHRAE Handbook – HVAC applications, ASHRAE – American Society of Heating, Refrigerating, and Air-Conditioning Engineers Inc.
Bratasz, L. & Kozlowski, R. 2005. Laser sensors for continuous in-situ monitoring of the dimensional response of wooden objects. In: Studies in Conservation, 50, 307–315.
Camuffo, D., Pagan, E., Schellen, H. (et al.). 2007. Church heating and preservation of the cultural heritage: a practical guide to the pros and cons of various heating systems. Electa Mondadori, Milano.
Camuffo, D., Pagan, E., Rissanen, S., Bratasz, L., Kozlowski, R., Camuffo, M. & della Valle, A. 2010. An advanced church heating system favourable to artworks: a contribution to European standardisation. In: Journal of Cultural Heritage 11, 205–219 Doi: 10.1016/j.culturher.2009.02.008.
EN 15757. 2010. Conservation of Cultural Property — Specifications for temperature and relative humidity to limit climate-induced mechanical damage in organic hygroscopic materials. European Committee for Standardization, Brussels.
Michalski, S. 2007. The ideal climate, risk management, the ASHRAE chapter, proofed fluctuations, and towards a full risk analysis model. In: Contribution to the Experts’ Roundtable on Sustainable Climate Management Strategies, held in April 2007, in Tenerife, Spain. The Getty Conservation Institute. 19 pp.
prEN15759. 2011. Conservation of Cultural Property – Indoor Climate – Part 1: Heating Churches, Chapels and other Places of Worship. European Committee for Standardisation, Brussels.

Gotland University Press 15
20
Mould Problems in Swedish Churches as Influenced by Construction and Microclimate
Jonny Bjurman1 and Aime Must2
1 University of Gothenburg, Gothenburg, Sweden2 IVL, Swedish Environmental Research Institute, Stockholm, Sweden* Corresponding email: [email protected]
Summary
Although energy saving measures are necessary in churches today, unsuitable methods may lead to critical moisture levels causing mould growth. According to interviews, written documentation and surveys performed by the authors, mould growth develops in crawlspaces, on walls, ceilings, other colder parts of the church and in closed spaces. High RH, a suitable temperature and available nutrients are essential factors for mould growth. Dirt is also a possible nutrient permitting mould growth on almost any material. Suitable microclimates for mould growth develop as a result of added moisture from visitors and high absolute humidity in outside air which cools down when entering the church during spring and early summer. During late summer the humidity is often also at critical levels. Dehumidification or ventilation are suggested methods to decrease the humidity. Energy might also be saved by not using some churches during winter.
Keywords
Mould growth, churches, microclimate, climate control, dehumidification.
Introduction
A decrease in the number of active members in Swedish congregations has led to less frequent use of many churches. Rising energy costs have necessitated the introduction of energy-saving measures. This has often led to critical moisture levels resulting in increased mould problems in many churches, and unaccep-table costs for repairing the damage. One example with increased incidence of mould growth is the diocese of Växjö, where for several years surveys of climate and mould problems have been undertaken in a number of their churches (Thörnblad and Wisbrandt, 2010).
In order to save energy without causing preservation problems, such as those related to dimensional changes dependent on moisture variations or growth of mould fungi during periods of high humidity, it is essential to develop well-founded climate criteria as a base for climate control in churches.
The present paper briefly summarises some of the findings of a pilot study regarding the nature and extent of mould problems in Swedish Churches (Bjurman and Must, 2010). One additional important reason for the study was to gather experience on attempted preventive and remedial measures presently

Gotland University Press 15
21
used in churches. Mould growth has often developed even when current climate recommendations have been applied. We have attempted to analyse the causes of the problems by using available current national and international knowledge in moisture physics and building mycology. Our hope is that we have thereby been able to illuminate the problems with mould and establish a foundation for future research on the prevention of mould problems in churches and for development of energy conservation measures that do not aggravate those problems.
Essential factors for the development of mould problems
The most essential factors that determine the colonization of materials by mould fungi are RH and temperature. However, the amount of mould growth on a material is also dependent on the character of the substrate, including the suitability and concentration of nutrients available. Mould growth-supporting conditions may develop due to a number of factors such as type of construction, material, heating regime, ventilation or the use of a building.
Viitanen and Ritschkoff (1991) showed that the lowest humidity limit for mould growth on wood is around 80 % at constant humidity conditions. A conclusion to be drawn is that higher RH is needed for growth at lower temperatures. High RH during winter should thereby lead to lower risk for mould growth than the same RH in summer. At very low temperatures growth may be totally halted. A similar critical humidity level for mould growth had earlier been shown also for mould growth on more rich media (Smith and Hill, 1982). Grant (et al.) (1989) reported on the necessary RH levels for growth of a large number of mould fungi isolated from buildings.
A simplified notion is that there is an uncomplicated and direct relation between RH and mould growth on a material. However, mould growth does not always develop even if RH during periods is higher than 80 %. In reality both humidity and temperature vary both diurnally and between seasons, which leads to a complicated relation between climate and mould growth. Growth of mould fungi on wood have been shown to be highly dependent on different types of cyclic variations in humidity above and below critical levels (Viitanen and Bjurman. 1995). Pasanen (et al.) (1991) have shown that when more regular condensation occurs, mould fungi could grow at lower RH levels above the material surface.
The amounts of suitable nutrients in a material determine the amount of mould growth that can develop, and how visible the mould growth becomes. In buildings, nutrients could be, for example, soluble substances in wood, certain paint binders, pollen and dirt. The fact that dirt can support mould growth also means that mould growth could develop on almost any building material. However, materials that contain potential nutrients may not support mould growth if they also contain toxic substances. Further, the production of mould odour or MVOC, often a dominating problem when buildings are affected by mould, is not simply correlated with the amount of mould growth. Specific compounds could be formed when mould fungi grow, e.g. on nutrient- poor materials or on impreg-nated wood (Bjurman and Kristensson, 1993, Bjurman, 1999).

Gotland University Press 15
22
RH levels above 80 % often occur outside in winter and during late summer. During winter in buildings with central heating, RH often decreases to levels below 30 % and could even decrease to below 10 % in churches in the northern part of Sweden. Mathematical models have been developed that could partly predict the development of mould growth in relation to humidity and temperature. A popular model today was developed by Sedlbauer (2001). He introduced the term isopleths for growth curves for similar mould growth; these are dependent on a combination of temperature and humidity. A complementary approach based on the results of micro-calorimetric measurements was suggested by Li (et al.) (2005). These measurements also clearly show that survival is possible at much lower RH levels than those supporting growth.
Methods
A starting point for the work in the pilot project was the characterization of mould growth and climate that had been done in churches in the Växjö diocese. In order to gain an overview of the nature and extent of the problems with mould growth in Swedish churches, interviews were made with responsible persons in different dioceses and parishes and with companies and consultants who had carried out climate measurements, proposed measures or implemented modifications of heating systems, ventilation or dehumidification. Unpublished and published written reports, describing climate investigations or characterization of microbial growth in mould-affected Swedish churches or describing mitigating activities, have been studied. Characterization of the presence and location of mould growth, as well as climate characterization in several churches in the Skara diocese, was also done by the authors as a complement. An extensive survey of international literature dealing with relevant aspects of the problem was also made.
Results
Common localization of mould growth in Swedish churches
Crawlspaces below wooden floor construction have been reported to be the typical location of mould problems in churches in the Växjö diocese. This has also been shown to be a common location of severe mould growth in many churches in other dioceses, particularly in one very common, often spacious, type of church in Sweden, mostly built during the 19th century and named after the Swedish 19th century bishop and author Tegnér. Other locations of mould growth in those churches have more seldom been noticed according to available documentation.
Mould growth often appears on ceilings or in vaults. One example is the Allhelgona church in Lund. Parts of external walls or spaces with lower tempe-rature in direct air contact with the nave, aisle and other public areas, are also often affected. Mould growth is found also on walls close to stairs to the organ gallery with no heating source, and other locations with lower temperature, as behind altarpieces or behind paintings.

Gotland University Press 15
23
Closed spaces containing textiles such as cabinets or chests of drawers are often affected by mould growth (Broström (et al.), 2010). Those cabinets are often placed closed to walls.
Mould growth is also found on wooden parts of church organs. Organs are often supplied with outside air which leads to cold wooden parts and organ pipes that increase the risk of condensation.
A more general spreading of mould growth in a church is more of an exception. The Brahe church on the island Visingsö in Lake Vättern is such an exception, where mould growth was found both on immovable and moveable objects and on walls and ceilings (Rosenquist, 2000). Churches near lakes are more often prone to mould problems.
Discussion
It is obvious that many cases of mould growth are dependent on the way the churches are heated.
Heating regimes in churches
Old churches have historically used several methods of heating: from unheated to partly heated, to constant heating, to comfort temperature. As a way of saving energy, intermittent heating with or without constant heating to a lower-than-comfort temperature, or conservation heating, has become a very common heating regime. Because of damage that developed on valuable hygroscopic objects as a result of RH variations generated when churches were heated intermittently, local heating has been suggested as an alternative way to generate comfort temperatures for the church visitors. This solution was a result of the EU- financed project “Friendly Heating (Camuffo (et al.), 2009)
Continuous heating to a lower-than-comfort temperature is used because a temperature increase from low winter temperatures to comfort temperature would take a very long time during winter without very efficient heating systems. Conservation heating is used to avoid possible damage by low temperature and is also used to decrease RH. Sometimes the two roles for heating are not discri-minated. Many researchers have been engaged in climate studies in churches, notably Tassou (et al.), (1986); Bordass and Bembrose(1996); Broström(1996) Olstad (et al.), (2001); Schellen(2002); Camuffo and Sturaro (2002); Camuffo and Della Valle (2007).
Humidity sources in churches that may contribute to critical microclimates
Holmström was a pioneer in the field of climate characterization in churches in Sweden. He showed (1972) that the absolute humidity outside varied to a high extent and was strongly correlated to the outside temperature. Normally at low outside temperatures the absolute humidity is low and at higher outside tempe-ratures the absolute humidity is high. RH is on average higher during the winter. That is a pattern that has been repeatedly confirmed by others. Holmström (1972) also showed that in a studied Stockholm church, the indoor temperature even during July and August was lower than the outside temperature.

Gotland University Press 15
24
Crawlspaces are often critical constructions. Mould growth in crawlspaces may be related to inadequate drainage or infiltration of water from the roof with or without drain-pipes, or being dependent on increased RH due to the infiltration of outside air with high absolute humidity particularly during summers. During late spring and early summer, the temperature is usually much lower in crawlspaces than in the outside air, which has already started to accumulate moisture. Flow of heat through a leaky floor may contribute to a somewhat higher temperature in the crawlspace. On the other hand, moisture from the public areas in the church may be transferred to the crawlspace. With decreased heating in the main part of the church, which is a general trend during recent decades, the crawlspace gets colder and thereby higher RH may occur. However, fungal growth in crawlspaces is not a new problem. Floors in churches have had to be replaced regularly according to available documentation. An additional indication for that is the frequent use of impregnated wood in church floors. Inadequate drainage and infil-tration of water coming from the roof are humidity sources that have to be taken care of before other preventive measures can be recommended.
Constant heating to comfort temperature during the winter is largely a functioning preventive measure against mould growth in the comfort zone in churches. However, this leads to a vertical temperature gradient in the church, with a higher temperature in parts of the church where high temperature is not desired. Intermitting heating on the other hand may lead to higher absolute humidity at the ceiling with risk of condensation and mould growth on a cold ceiling.
In churches that are not permanently heated, mould growth may develop on the walls where low temperatures prevail, which leads to microclimates with high RH during the winter but also during early summer due to the slow increase of tempe-rature in solidly-built structures.
People contribute to an increase of the absolute humidity by exhalation, transpi-ration and by wet clothes and shoes on a rainy or snowy day. When many people attend service for a couple of hours, the absolute humidity increases significantly above outside absolute humidity. The frequent use of candlelight in Swedish churches also contributes humidity to the indoor air. 1 kg candles can produce approximately 1 kg of water.
Churches that have been unheated, or heated to a limited extent, during winter have cold walls for a considerable time period during late spring and early summer. In this case the whole church may in reality function as a crawlspace with increased RH due to penetration of outside air with high absolute humidity that is then cooled down. The absolute humidity is higher near lakes, and the risk of condensation is therefore higher. In the Växjö project, a higher incidence of problems in churches near lakes was noted.
There is a conflict between the use of the church and different preservation issues. Both the development of damage related to humidity variations and mould growth may increase as a consequence of the use of the church. In the public area of the church objects are damaged by drying when the church is heated. On those occasions moisture transport to parts of the church with a colder micro-

Gotland University Press 15
25
climate may occur. This is aggravated when there is a moisture addition to the absolute humidity during services. See Fig. 1. for a schematic representation of the relationship between moisture and temperature in some of the mentioned cases.
Intermittent heating may lead to movement of moisture to colder parts of the church. A clear difference in comparison to churches with constant comfort temperature is that walls and ceilings get colder between the services leading to higher risk of condensation.
Dirt is also often preferentially deposited on cold surfaces.
The use of local comfort zones, as has been suggested as a solution for damage dependent on dry conditions generated as a result of increased temperature, may cause still lower wall and ceiling temperatures. The risk that moisture added during services results in condensation on cold surfaces thereby increases. Conservation heating could decrease the RH to levels lower than the critical RH levels for mould growth. However, for the method to be efficient, one has to be sure that there are no parts of the church where the temperature is too low, to avoid RH around 80 %. Even if the RH in the public areas is regulated to 60 % there are parts of the church where RH exceed 80 %, due to lower temperatures.
Conservation heating may be a risky method to decrease RH. It is in reality used predominantly to avoid high RH, and thereby used for keeping the water in the
Fig. 1. A schematic illustration of the effect of a decreased temperature in the summer, e.g. on a colder wall, when the absolute humidity is high (arrow a), in the winter when the absolute humidity is low and there is no moisture addition indoors, e.g. in an unused church (arrow b) and the effect of moisture addition during services leading to higher RH and lower tolerance to temperature decrease (arrow c).

Gotland University Press 15
26
air. At the same time, parts of a church may have temperatures which are close to or below the dew point. Increased temperature may also increase the absolute humidity due to water leaving hygroscopic objects and this could increase RH in the colder parts of the church (Bordass and Bembrose, 1996).
However, constant heating to lower than comfort temperatures should also increase wall and ceiling temperatures and decrease the humidity ranges over time. If such heating is necessary, heat pumps could be used to decrease the energy costs at the same level of energy consumption (Broström 2010).
Dehumidification could also be an efficient way to decrease RH below critical levels. An advantage is the lower energy consumption for the same amount of RH reduction. However, during winter the absolute humidity should not be permitted to be lower than the outside absolute humidity, at least not just before the heating period starts, otherwise the RH will be very low when the church is heated to comfort temperature. During summer dehumidification could be used to avoid reaching critical RH values. The efficiency of dehumidifiers is also higher when the temperature is higher. In crawlspaces dehumidification should be a very useful way of decreasing RH, providing the crawlspace is tight enough. In winter, forced ventilation should be used after services to minimize the difference in absolute humidity between indoors and outdoors. If the dew point tempe-rature is higher at the wall or the ceiling than outside, the risk of condensation is increased. Ventilation should preferably take place in the upper part of the church where the absolute humidity is often higher.
During spring or early summer dehumidification could be used if the dew point is approaching too high levels at the wall. This is probably easier to gain acceptance for than to use heating to increase the wall temperature at that time of the year.
Automatic climate control systems will probably be necessary in order to regulate the climate to avoid different types of damage, including mould growth, in churches as well as requests for temperature comfort during short periods. However, Thörnblad and Wisbrandt (2010) stated that automatic control systems are used to a very limited extent. Automatic control systems are used only in churches that have been extensively renovated quite recently. The new control system in the Brahe church on Visingsö in the lake Vättern is such an example. A pilot project on climate control has been started also in Glömminge church on the island of Öland.
Dahlberg and Schwanberg (2006) stated that the use of a church is an important prerequisite for preservation of its cultural value. They also claim that it is reasonable to have the ambition to keep all churches, and that all churches are needed. Their suggestion is that more sensitive churches are used with restric-tions. An alternative would be to use sensitive churches only during summer.
Avoiding use of a church in winter could be a way to decrease damage related both to high humidity locally and damage related to humidity variations. It could also be a way by which preservation and energy-saving could be combined, at least within a parish with many available churches. This would not be an

Gotland University Press 15
27
unreasonable suggestion today given that in many parishes churches are used very seldom and by few people.
Buildings without internal humidity sources, with limited moisture penetration and no human activity during winter, can be supposed to avoid mould problems using only minor measures and with low energy consumption, provided that the church is automatically supervised regarding the climate.
Modification of their construction has been suggested as a way to solve mould problems in churches. However, such modification would most likely decrease their cultural value.
Conclusions
The problem of moisture in crawlspaces in churches is not a new one. However, mould growth in churches may have increased as a result of altered heating regimes. Thermal comfort during services potentially creates problems both with dimensional changes in heated parts and mould growth in parts of the church with lower temperature. Due to moisture accumulation during services ventilation should be used to decrease the absolute humidity difference between the indoor air and outdoor air. To decrease RH in parts of the church approaching critical RH levels dehumidification is recommended. Increased temperature is a more energy demanding measure and may also lead to moisture transfer to parts of the church with temperatures approaching the dew point temperature. In order to reach both preservation and energy efficiency in churches, an increased use of automatic climate control-and alarm systems is indispensable.
Acknowledgements
The financial support from The Swedish Energy Board is gratefully acknow-ledged. Great thanks are also due to all those who generously gave of their experiences in interviews and took the trouble to provide us with unpublished reports from documentation of affected churches.
References
Bjurman, J. 1999. Production of MVOC by microorganisms Chp. 3.7 In: Salthammer, T. (ed.): Organic Indoor Air Pollutants, Wiley VCH, Weinheim.
Bjurman, J. & Kristensson, J. 1993. Soft rot fungi as possible sources of odor in impregnated wood I buildings. The International Research group on wood preservation. Doc. No IRG/WP 3200013.
Bjurman, J. & Must, A. 2010. Mögelangrepp i kyrkobyggnader – en förstudie. Report to the Swedish Energy Board.
Bordass, W. & Bemrose, C. 1996. Heating your church. Church house publishing. ISBN 071517570.
Broström, T. 1996. Uppvärmning i kyrkor. Fukt och värmetekniska beräk-ningar för dimensionering och klimatstyrning. Royal institute of Technology, Stockholm.

Gotland University Press 15
28
Broström, T., Borgö, L. & Thulin, C. 2010. Textilskåp med fuktstyrning. Projektrapport, Högskolan på Gotland.
Broström, T. 2010. Luft-luftvärmepumpar för skyddsvärme i kyrkor. Centrum för energieffektivisering i kulturhistoriskt värdefulla byggnader, Högskolan på Gotland Rapport 2010:01.
Camuffo, D. & della Valle, A. 2007. Church heating: A balance between conservation and Thermal Comfort. In: The Experts Roundtable on sustainable Climate Management Strategies, April 2007 Tenerife, Spain. The Getty Conservation Institute.
Camuffo, D., Pagan, E., Bernardi, A. & Becherini, F. 2004. The impact of heating, lighting and people in re-using historical buildings: a case study. In: Journal of Cultural Heritage 5 (2004) 409–416.
Camuffo, D. & Sturaro, G. 2002. Church heating: a challenge looking for solutions. Pages 128- 136. In: Brandt-Grau, A. (ed), Research for Protection, Conservation and Enhancement of Cultural Heritage. Opportunities for European Enterprises, Luxembourg: European Comission.
Camuffo, D., Pagan. E., Rissanen, S., Bratasz, L., Kozlowski, R., Camuffo, M. & della Valle, A. 2009. An advanced church heating system favourable to artworks: A contribution to european standar-disation. In: Journal of Cultural Heritage, Vol. 11(2), 205–219.
Dahlberg, M. & Schwanborg, I. 2006. Långsiktigt hållbar förvaltning och differentierad användning av kyrkor. Dokumentation från RAÄ:s seminarieserie våren 2006. PM 2006-10-10 från Kulturmiljöavdelningen, Riksantikvarieämbetet.
Grant, C., Hunter, C.A., Flannigan, B. & Bravery, A.F. 1989. The moisture requirements of moulds isolated from domestic dwellings. In: International Biodeterioration 25, 259–284.
Holmström, I. 1972. Klimatförhållanden i Stockholms kyrkor. Statens Institut för Byggnadsforskning. Projektet Renoveringsteknik.
Li, Y., Wadsö, L. & Bjurman, J. 2005. Using measurements of fungal activity by isothermal microcalorimetry as a base for modelling fungal growth in buildings In: Proceedings, 10th International Conference on Indoor Air Ouality and Climate: Indoor Air 2005. ISBN/ISSN: 7-89494-830-6.
Olstad, T., Haugen, A. & Nilsen, T.N. 2001. Polychrome Wooden Ecclesiastical Art – Climate and Dimensional Changes. In: NIKU publikasjoner, Oslo, 2001, pp. 24.
Pasanen, A.L., Kalliokoski, P., Pasanen, P., Jantunen, M,J. & Nevalainen, A. 1991. Laboratory studies on the relationship between fungal growth and atmospheric temperature and humidity. In: Enviroment International vol 17, 225–228.
Rosenqvist, G. 2000. Inventeringsprotokoll: 2000:027 för Brahekyrkan.

Gotland University Press 15
29
Schellen, H.L. 2002. Heating Monumental Churches – Indoor Climate and Preservation of Cultural Heritage. Technical University Eindhoven, The Netherlands, 2002, pp. 228.
Sedlbauer, K. 2001. Prediction of mould fungus formation on the surface of and inside building components. PhD thesis. University of Stuttgart.
Smith, S.L. & Hill, S.T. 1982. Influence of temperature and water activity on germination and growth of Aspergillus restrictus and Aspergillus versicolor. In: Transactions of the British Mycological Society, 79(3): 558–560.
Tassou, S., Xiang, W. & Kolotroni, M. 1986. Evaluation of heating systems in churches. English heritage report.
Thörnblad, C. & Wisbrandt, C. 2010. Utredningar och inventeringar. Bäckseda Korsberga pastorat. Rapport från Svenska Kyrkan och Arkitekt och Miljö AB, Kalmar.
Viitanen, H. & Ritschkoff, A.C. 1991. Mould growth in pine and spruce sapwood in relation to air humidity and temperature. Swedish University of Agricultural Sciences, Department of Forest Products Report No. 221. Uppsala.
Viitanen, H. & Bjurman, J. 1995. Mould growth on wood under fluctuating humidity conditions. In: Material und Organismen 29, 28–46.

Gotland University Press 15
30
Paint Failure as Potential Indicator of Cool Indoor Temperature
Maria BrunskogGotland University, SwedenCorresponding email: [email protected]
Summary
Paint films exposed to too high or too relative humidity are known to swell, loose adhesion, flake, crumble or crack. Less studied is paint films exposed to low temperature, during long periods of time, such as in unheated historic buildings or buildings heated only intermittently. Observations have been made of the present condition and signs of change from an assumed pristine or previous condition of painted wood exposed to an indoor climate that deviates from standard recom-mendations for preservation.
The survey in question was initiated with the aim to provide advice to keepers, custodians, and church administrators in cases where the energy consumption is considered high, or where the heating system is about to be renovated. Some preliminary results from the survey are presented and discussed. The interpre-tation of the observed surfaces indicates that climate induced changes are small, but noticeable, in relation to e.g. inherent vice.
Keywords
Paint, failure, cool, temperature, screening.
Introduction
One of the overall objectives is to use a larger population of objects (i.e. selected surface areas of painted wood) than customary, located in different churches, and to survey their visible condition.1 The kind of objects to be surveyed should therefore be present in all churches, susceptible to variations in indoor climate, and at the same time being relevant for conservation. The visible signs of change or the lack thereof in a specific location are to be related with climate data from the same church building and to the population of objects as a whole, to produce some indications of the risk for deterioration, or the chance for conservation. Another objective is to test a methodology of screening that has the merit of being coarse meshed, simple and rather quick to perform, yet that can provide enough detailed information to serve in decision making, or at least to guide further investigation. The survey is part of a larger study aiming at reducing the amount of energy for heating of church buildings in Luleå episcopate, without putting the interiors and the artefacts at an instant risk.
1 Deterioration studies are more often using single or a limited number of objects, which are studied in more detail.

Gotland University Press 15
31
Paint films on different substrates such as polychrome wooden objects are assumed to demonstrate more or less visible symptoms of changes in dimension and plasticity depending on variations in the relative humidity and the tempe-rature of the ambient air (Erhardt and Mecklenburg, 1994). How and to which rate cool environments may slow down, or on the contrary enhance, deterioration is less studied but the topic has gained current interest (Mecklenburg, 2011), not the least in the light of global climate change.2 The deterioration pathway or change pattern is assumed to be linked with the technical character of the object as such, since different components swell and shrink unsymmetrically and to different rates in different axes.3 The degree to which change takes place is assumed to be linked with factors to which the object is exposed, i.e. the ambient air, and that such changes are developed more or less, depending on how these factors vary (Bucklow, 2000, Brunskog 2004). Too high or too low relative humidity induces stress that is released by swelling or cracking, and repeated cycles may cause fatigue and failure of the exposed material (Bratasz 2010).
From the conservation literature on polychrome paint films would be expected to get stiffer and stronger with age, become more brittle at temperatures below their glass transition temperature (i.e. Tg below 11–12 °C in most cases), and on the other hand more flexible at high relative humidity. Wood would be expected to respond more than paint films to variations in relative humidity, and moisture diffusion is assumed to be slowed down at low temperatures (Lukomski, 2010 and 2011).
Swedish churches hold many cultural-historically interesting or otherwise valued objects, such as altar pieces, sculptures, pulpits, benches, and chandeliers etc., typically made from painted wood. Hence polychrome objects of wood are used as the material in this screening survey. This category of objects has also the advantage of a rather large bulk of references in the conservation literature.
From each church in question climate data is available in the form of annual records. The building structure is technically described and some information on maintenance, refurbishment, and restoration is accessible, even though it is not very detailed.
Questions to be answered are:
• is it feasible to observe and register visible surface structures by means of a digital camera?
• is it possible to use these images to quantify cracking and paint loss, and to use this information for sampling and data collecting?
• is it possible to observe and register an ongoing or even increase in cracking and of paint loss during a limited period of time;
2 Of which also the European 7th FW project Climate for Culture is a sign.3 Polychromy is here defined as the sum of a) wood substrate, b) grounding i.e. binder
and filler, c) paint film i.e. binder, pigment and additive, d) varnish, and e) application method..

Gotland University Press 15
32
• if low temperatures, as in unheated buildings, generates less deterioration than buildings that are heated for longer periods or to higher temperatures?
• if periods of high relative humidity can be related to an increase in cracking and paint loss?
Methods
A selection of painted surfaces are observed and their present condition regis-tered by digital photography, at first in the beginning of the survey, and then again at the end of the period, between two and a half and three years later. Photos are taken in daylight and artificial light as appropriate. In some cases also raking light is used. Each observed area, in spite of its position represents one unit, some are smaller and some are larger than others. In total 394 individual surfaces are registered, representing all the 53 churches. In each church between three and nineteen surface areas are sampled, selected in a way that they cover three to four movable or immovable objects.
At the time of the second observation the same surface areas are sampled and their recent condition registered once again. The arrangement and the exposure of the images are done in a way to duplicate the first photo of the same area as far as possible, in order to be able to compare the images from the first and the second opportunity respectively. Both changes and the lack thereof are noted.
During the period between the first and the second sampling opportunity measu-rements of the indoor climate, i.e. the relative humidity and the temperature, at each location is collected by data loggers. From software processing of the annual records minimum, maximum, mean value, and standard deviation are calculated.
The annual climate records from each church are compared with the condition of the painted surfaces as they appear from the images, aiming to find any corre-lation between change in condition of the painted surface areas and the indoor climate in order to substantiate a cause effect relation, or the lack thereof.
Results
Results in general
Based on this survey it is not evident that there is a direct correlation between large fluctuations in relative humidity and paint loss, at the time of the first obser-vation. If the last annual records are representative for all the years prior to that date a direct correlation cannot be supported. There is no indication that large fluctuations always give rise to more extensive losses, but on the other hand, the opposite cannot be substantiated either. The hypothesis is that there is such correlation, but that it is a more complex course of events than what is reflected at the beginning of this study.
Results for buildings with low temperatures
From the bulk of samples the areas representing the churches that experience temperatures below the Tg of most paint are extracted. These eight buildings

Gotland University Press 15
33
are shown in Table 1. Also the mean values for these same churches are below the mean values for most of the churches in question, whereas the maximum values are similar to the others, reflecting the summer period when the indoor temperature is more likely to be determined by the outdoor temperature, or during periods when the building is heated to meet comfort demands.
In order to assess the influence of cool temperatures the extracted areas are compared with areas extracted from a range of buildings that constantly are kept at higher temperatures. The eight churches that demonstrate the highest minimum temperatures are shown in Table 2. From the table it can also be concluded that the amplitude in temperature is smaller (c. 2–8 °C) compared with the amplitude in the group of the cooler churches (c. 15–28 °C).
Preliminary results indicate that only a few areas exposed to cool temperature show an increase in registered changes, as shown in Table 3. From the first observation of 55 areas only ten have developed new cracks, which were not registered from the beginning, whereas 23 areas seem to demonstrate no change in cracking (see columns to the left). At the time of the first observation paint losses were already rather frequent, and around three times more areas showed lacunae after paint losses, compared with the number showing no losses to begin with. After three years only a few show an increase of the lacunae without any paint, and only one area has developed such a lacuna during the project period. A little less than half of the areas have remained the same (see columns to the right).
Church TEMPERATURE °Cmean max min
Gråträsk 6,29 20,56 –6,93 Österjörn 11,36 24,55 –0,7 Kvikkjokk 13,54 24,33 5,78 Jukkasjärvi 16,2 23,44 6,41Vännas 14,3 23,13 6,78Malå 17,45 25,77 7,08Jokkmokk 18,38 24,75 9,66Gällivare 18,03 25,29 9,72
Church TEMPERATURE °Cmean max min
Överluleå 19,58 23,38 18,11Skellefteå 19,13 23,11 18,12Piteå 20,04 27,38 18,24Kiruna 20,01 25,05 18,29Hortlax 20,64 24,85 18,66Råneå 20,76 25,63 19,18Öjeby 21,39 27,43 19,53Umeå 21,12 22,91 20,55
Table 2. Eight churches that show the highest minimum temperatures
Table 1. Eight churches show a minimum temperature below the Tg of most paint films.

Gotland University Press 15
34
In environments with higher temperatures the tendency is almost the same. The figures in both Table 3 and Table 4 seem to be very similar, except for areas that showed cracks already from the start. Surfaces exposed to higher temperature have developed new cracks more than twice as frequently compared with those exposed to cooler environments.
1st observ. 2nd observ. 1st observ. 2nd observ.
cracks new cracks no new cracks
paint loss new paint loss
no new paint loss
48 6 20 44 4 19
no cracks new cracks no new cracks
no paint loss
new paint loss
no new paint loss
7 4 3 14 1 6
1st observ. 2nd observ. 1st observ. 2nd observ.
cracks new cracks no new cracks
paint loss new paint loss
no new paint loss
44 16 6 44 1 13
no cracks new cracks no new cracks
no paint loss
new paint loss
no new paint loss
11 ? 6 13 2 9
Table 4. The number of areas without signs of further deterioration, as well as areas that have developed cracks and losses at higher temperatures:
Discussion
Slow, small and stepwise changes are difficult to observe and register, and cracks are even more difficult than paint losses. The lighting condition during photo-graphy is crucial to whether any crack and any change in number or density can be assessed at all from an image. The resolution of the method to quantify paint losses is much higher than that of cracks, due to the simple fact that these are easier to observe and register.
A number of newly developed cracks have been observed as well as cracks that have grown in length since the first observation opportunity. Paint films exposed to cool temperatures – that are supposed to become more brittle below their Tg
– have not cracked more frequently, as might have been anticipated. As a matter of fact it is the paint on the other surface areas, exposed to higher tempera-tures, that shows a small increase in cracking. Whether this result supports the
Table 3. The number of areas without signs of further deterioration, as well as areas that have developed cracks and losses at low temperatures:

Gotland University Press 15
35
hypothesis of 30–100 times reduction in moisture diffusion at cool temperature, and as a consequence little induced stress, remains to be determined. The statis-tical analysis of the data will be continued.
Paint loss is almost always in combination with cracks perpendicular to the pictorial plane, and may be regarded as an alarm signal, even though it is the cracks parallel to the pictorial plane that actually causes the paint to become detached. Cracks are regarded as less aesthetically disturbing compared with losses of paint.
Conclusions
The methodology for observation and registration of empiric data appears to be feasible, in spite the fact that it is based on photography and very simplified compared with how such investigations commonly are performed. Noticeable changes have occurred and have been possible to register in spite of the short interval between observations and the inhomogeneous material. The cause effect relation needs to be further and more sophistically studied to be more completely understood.
Acknowledgement
The project has been financially supported by generous funding from the Swedish Energy Agency. Field work, photos, climatic measurements, and infor-mation concerning the technical aspects of the building structures have been compiled by Annika Lindberg and Anders Nordström, both at Historiska Hus AB. The processing of climatic data into annual records has been supplied by Tor Broström and Magnus Wessberg, both at Gotland University.
References
Bratasz, L. 2010. Acceptable and non-acceptable microclimate varia-bility: the case of wood. In: Basic Environmental Mechanisms Affecting Cultural Heritage. Understanding deterioration mechanism for conservation purposes. Camuffo D. et al (eds.), pp. 49–58.
Bratasz, L. 2010. Computer modelling of dimensional response and stress fields in wooden artworks. Lecture at the international workshop, 18–19 February, Allowable microclimatic variations for polychrome wood, Norwegian Institute for Cultural Heritage Research – NIKU, Oslo, unpubl.
Brunskog, M. 2004. Japanning in Sweden 1680s–1790s. PhD thesis, Göteborg University, Göteborg.
Bucklow, S. 2000. Consensus in the classification of craquelure. In: Bulletin, No. 3, Hamilton Kerr Institute, University of Cambridge, pp. 61–73.

Gotland University Press 15
36
Erhardt, D. & Mecklenburg, M.F. 1994. Relative humidity re-examined. In: Preventive conservation: practice, theory and research : preprints of the contributions to the Ottawa Congress, 12–16 September 1994, pp. 32–38.
Lukomski, M. 2010. Fatigue fracture of paint layers from repeated cycles of humidity fluctuations. Lecture at the international workshop, 18–19 February, Allowable microclimatic variations for polychrome wood, Norwegian Institute for Cultural Heritage Research – NIKU, Oslo, unpubl.
Lukomski, M. 2011. Researcher at the Institute of Catalysis and Surface Chemistry, Polish Academy of Sciences, Krakow, Poland, personal correspondence with Mecklenburg, unpubl. 2011-02-26.
Mecklenburg, M.F. 2011. Commentary on the Effects of the Environment and Condition of Collections at Four Locations. Part 1. Locations and Climates, unpubl.

Gotland University Press 15
37
Energy and Power Demand for Intermittent Heating of Churches
Poul Klenz Larsen1,2*, Tor Broström1 and Lars Aasbjerg Jensen2
1 Gotland University, Visby, Sweden2 The National Museum of Denmark, Copenhagen, Denmark* Corresponding email: [email protected]
Summary
The energy consumption for a typical Danish medieval church was calculated with a computer program developed for indoor climate simulations in modern buildings. Kippinge church located on the island Falster close to the Baltic Sea was used as model for the simulations of intermittent heating. The influence of various parameters on the annual energy demand was investigated. A heating power of more than twice the normal is needed to allow a fast rise in temperature for service. A heating period of 4–6 hours is most efficient, whereas shorter heating periods gives little reduction in energy loss. If short heating episodes are used, the energy consumption mainly depends on the basic temperature between services, and the service temperature is of minor importance. Heat loss by natural ventilation may account for up to 40 % of the energy demand.
Keywords
Intermittent church heating, energy demand, basic temperature, service temperature.
Introduction
The first permanent heating installations in Danish churches were stoves of cast iron. It must have been a huge improvement in comfort although the heat was very unevenly distributed. The heating power was often low and much energy went up the chimney. It could take days to obtain even a moderate temperature. Central heating systems were introduced from the beginning of the 20th century, but warm air systems were preferred for village churches with intermittent heating practise. The advantage was a fast rise of temperature, but they were less suited for tall rooms. Most of the heat concentrated below the ceiling, and left the humans cold at floor level. Lund Madsen (1986) investigated the thermal comfort in churches, and used a thermal mannequin to measure the influence of different heating systems on the thermal experience. Electrical radiant heating panels mounted under the bench seats provided the best thermal comfort at a moderate air temperature.
Camuffo (2006) introduced the Friendly heating concept, which involved a novel pew design with radiant heating elements mounted under the seat, at the back and below the kneeling. The aim was to reduce the influence of heating on the relative humidity, but radiant heating also has a potential for energy savings,

Gotland University Press 15
38
because comfort is obtained at reduced air temperature. A detailed study was conducted by Limpens-Neilen (2006) with focus on the convective air movements in the pew and the consequence for the thermal comfort. It is possible to heat the person without heating the building, but there is a limit to how much radiant heat a person can endure. The main drawback for radiant heating in the pews is that it only heats up the congregation. The chancel and other adjacent spaces must be heated to comfort temperature.
Korsgaard (1993) established the heating regulation for Danish churches and defined two climatic categories for churches; the permanently heated and the intermittent heated. The larger urban churches with frequent services belong to the first category, for which the basic temperature should be no more than 15 °C in winter. The small village churches with only a Sunday service make up the last category, where 8 °C is the set point for the basic temperature. The threshold values are chosen as a compromise between the urge to save energy and the need for human comfort. In both categories the maximum temperature for services is 18 °C. For intermittent heating, a temperature rise of 12 ° should be reached within 6 hours starting from the basic temperature. The demand for rapid heating was a precaution to protect wooden objects. If the rise and fall in temperature were fast, the objects would not feel the change in RH before the service was over. But the short heating episodes were also a way to save energy. With only a few hours of comfort temperature, the heavy walls and floor without thermal insulation would not have time to heat up, and less energy would be lost.
Korsgaard also proposed a guideline for the heating power needed for inter-mittent heating. This was based on empirical data from churches with warm air heating systems, which are known to give uneven heat distribution in tall spaces. In order to design new heating systems based on radiant heating elements with low surface temperature, there is need for a guideline to determine the optimal heating power. Broström (1996) developed a mathematical model for the hygrothermal behaviour of a stone church. The model would enable calculation of the heating power and the heating time required, when designing a new heating installation. Studies by Schellen (2002) have demonstrated good agreement between computer simulations and measurements in Dutch churches. The question is if computer programs designed for modelling indoor climate in modern buildings can be relied upon to predict the energy and power demand in medieval churches.
Methods
The computer program B-sim was used to calculate energy and power demand. The Danish Design Reference Year (DRY) was used for the outdoor climate conditions. It is a series of natural climate sequences, combined to a typical year with commonly occurring variations in temperature, humidity, precipitation, wind and radiation. The soil temperature was defined as a sinusoidal fluctuation between 5 °C in winter and 15 °C in summer. The church is also heated by solar radiation through the windows and roof, particularly in the summer. Because of

Gotland University Press 15
39
solar radiation the annual total energy balance is around 15 % higher than the calculated heating demand.
The energy consumption was calculated for different heating regimes as specified in Table 1. The basic temperature was between 4 and 22 °C and the service temperature, between 10 and 22 °C. The church was heated to basic temperature between 1 October to 31 May and to service temperature once a week during the same period. Heating time was fixed to 6 hours for all heating episodes, although this is not necessary in all situations. In spring and autumn the service temperature could be reached by shorter heating periods, but the program does not allow for varying this parameter within the same simulation. Different heating periods ranging from 3 to 48 hours were used for the 8/18 °C temperature regime. The heating power was 50 kW for all temperatures, but lower levels of heating power was tested for the 8/18 °C temperature regime. The influence of air infil-tration was calculated with permanent heating to 18 °C and intermittent heating to 8/18 °C.
Parameter Value TemperatureHeating power (kW) 20, 25, 30, 35, 40, 45, 50 8/18 °CBasic temperature (°C) 4, 6, 8, 10, 12, 14, 16, 18, 20, 22 Service temperature (°C) 10, 12, 14, 16, 18, 20, 22Heating time (hours) 3, 4, 6, 8, 12, 24, 48 8/18 °CInfiltration (h-1) 0.1 / 0.2 / 0.4 / 0.8 8/18 °C & 18 °C
Table 1. Parameters used for the computer calculations:
The calculations used Kipping Church on Falster as a model (Figure 1). The church has 1 m thick outer walls of solid masonry in red brick with lime mortar joints. The roof is covered with tiles. The chancel is vaulted, while the nave has wooden ceiling. The nave and chancel has partial wooden floors, partial stone floor, but the model used only wood on the entire surface. This modification compensated for not including the church’s wooden furniture. The nave and chancel has 4 windows facing south and 3 windows facing north with single glazing in wooden frames and extra glazing to the inside. Physical properties of the building elements are shown in Table 2. The model is shown as a line drawing in Figure 2. Floor plan for the nave and chancel is 16 m x 10 m and 5 m x 10 m and outer walls are 8 meters high. The west facing church tower and porch to the south were not included in the model. The chancel and nave formed one climate zone, and the attic was also one climate zone. The volume of the nave and chancel is approximately 1500 m3. Since the program cannot use curved surfaces, the chancel vault was simplified to plane triangles, and the curved ceiling in the nave was altered to rectangular surfaces.

Gotland University Press 15
40
The church had a new heating system installed in 2007 with low temperature radiant heating elements below the seats of the pews. The heat radiates downwards to the floor, which gives an even heat distribution in the pews. The chancel has low temperature radiant heating elements mounted on the walls. The total heating power is 39 kW. The electronic control unit was programmed to keep a constant basic temperature at 8 °C and a service temperature at 18 °C.
Table 2. Properties of the building elements used for the model:
Element Material Thickness (mm)
Density (kg/m3)
Insulation (W/mK)
Heat capacity (kJ/kg)
Moisture (m3/m3)
Roof Tile 20 1600 0.5 800 0,01Ceiling Wood 25+50+25 500 0.12 1000 0,2Insulation Min.wool 50 32 0.039 800 0,0Vault Brick 150 1840 0.68 800 0,01Wall Brick 1000 1840 0.68 800 0,01Floor Wood 25 500 0.12 1000 0,2Window Double 4+12+4/200 0 / 700 1.8 700 0,0
Door Oakwood 30 800 1,4 1000 0,01
Fig. 2. Virtual model of Kippinge Church used for the computer modelling. The curved shapes of the vaults in the chancel and nave were replaced by rectangular elements.
Fig. 1. Exterior view of Kippinge church from the southeast. The tower and porch were not included in the model.

Gotland University Press 15
41
The power is adjusted to give the most energy efficient heating period. The indoor temperature was monitored to test the new heating system. The sensor was located 3 m above floor level in the chancel arch well away from any heat source. The annual energy consumption was also recorded.
Results and discussion
The results of the simulation with an 8 ºC basic temperature and 18 ºC service temperature is displayed in Figure 3. In winter the inside temperature is higher than outside due to the basic heating. There are 34 heating episodes during the autumn, winter and spring with heating to 18 °C for 6 hours. In summer the inside temperature follows the outside average with some delay. In periods with falling outside temperature, the inside temperature is always above the outside average. This is due to the large thermal inertia of the walls and floor. The solar heating through windows and roof keeps the inside a little warmer though the summer. In spring and autumn there is a contribution from the service heating, which raises the inside average temperature a few degrees above the outside. The heat gain from the sun is not included in the annual heating energy.
The temperature record for 2008 is shown in figure 4. The annual variation is 8–22 °C, which is similar to the calculated temperature. The heating episodes occur more irregularly than the calculated, but the total number of services is almost the same. The service temperature does not always reach 18 °C, so the heating power is possibly too low. The annual heat consumption was 18 MWh. Figure 6 shows a heating episode in the first week of February. The heating started at four o’clock in the morning and continued until noon the same day. It took 8 hours to raise the temperature from 8 °C to 17.5 °C. After the heating was switched off, the temperature gradually decreased, but it took almost two days to
Fig. 3. The calculated air temperature inside the church (red trace) compared to the outside air temperature (grey trace) from the Danish Design Reference Year. The black trace shows the outside temperature as a moving average over seven days.

Gotland University Press 15
42
get back to 8 °C. A calculation of a similar event is shown in figure 5, where it took only 3 hours to reach the service temperature, and only 6 hours to cool down the church again. It clearly shows the effect of reducing the heating time: Less energy is absorbed by the walls and floor. The heating power was 50 kW, which made the fast rise in temperature possible.
The results of the energy calculations are shown in Figure 7. For a constant temperature at 8 ºC the annual heating energy is 17.5 MWh and for a constant temperature at 18 ºC the heating energy is 49 MWh or 3 times higher. When heated to a constant temperature of 22 °C, the energy demand rises to 72 MWh. The energy use for the weekly service heating is shown by the blue curves. Heating to service from 8 °C to 18 °C once every week takes up an additional 1 MWh, giving a total of 18,5 MWh for this heating regime. In this case, the service heating uses 5 % of the total energy consumption. If the basic tempe-rature is at 4 °C, the service heating to 18 °C uses 3 MWh or approximately 40 % of the total heating energy. The service heating takes up a larger part of the total heat demand with a low basic temperature. For most combinations, the total heating energy depends mainly on the basic temperature, while the service temperature has little significance.
All calculations had a fixed 6 hour heating period. The influence of the heating time is given in table 3 for a combination of basic heating to 8 °C and service heating to 18 °C. Extending the heating time 2 hours gives a 4 % increase in energy consumption, and 6 hours extra heating uses 11 % more energy. A heating period of 48 hours uses 60 % extra energy, which is wasted if the church is not used for activities. This is relevant if the heating system does not have a control switch with a timer. The church warden will start the heating Friday
Fig. 4. The measured air temperature inside the church (red trace) compared to the outside air temperature (grey trace) for 2008.

Gotland University Press 15
43
Fig. 5. The calculated air temperature inside the church (red line) compared to the out-side air temperature (grey line) from the Danish Design Refe-rence Year in the first week of February.
Fig. 6. The measu-red air temperature inside the church (red line) compared to the outside air temperature (grey line) for the first week of February 2008.
afternoon to have the church ready for service on Sunday morning. A timer would allow the heating to be started early Sunday morning at 4 o’clock, and still let the warden sleep late. A simple and reliable control system will save much energy just by reducing the heating period.
Heating time (h) 6 h 8 h 12 h 24 h 48 hHeating energy (kWh) 17,5 18,2 19,4 22,2 27,8Relative factor 1,00 1,04 1,11 1,27 1,60
Table 3. The influence of the heating time on the annual energy consumption for basic heating to 8 °C and one weekly heating episode to 18 °C:

Gotland University Press 15
44
The duration curves for the power load when heating to 18 °C from basic tempe-ratures between 4 and 18 °C are shown in Figure 8. The installed power is 50 kW in all calculations and the heating time is fixed to 6 hours. The total heating time is approximately 200 hours in a year. In this relatively short period, the maximum power demand is between 20 kW and 50 kW. The vast majority of the time, less than 15 kW is needed for any basic temperature. Requirement for a short heating period results in heating system dimensioned with an excess capacity that can only be exploited in a very small part of the year.
The question is what impact it will have on energy consumption to reduce the installed power. Table 4 shows the total annual energy consumption for different levels of heating power. In all cases the basic temperature is 8 °C and the service temperature is 18 °C. At a heating power of 40 kW, the energy consumption is
Fig. 8. The duration curves for power load when heating to 18 °C from different basic temperatures as indica-ted. There were 34 heating episodes in one year and the heating period was fixed at 6 hours.
Fig. 7. Annual energy con-sumption for heating to any combination of basic and service temperature. The combinations indicated by markers were calculated. The combinations shown by the blue lines were estimated.

Gotland University Press 15
45
almost the same as at 50 kW. A reduction to 30 kW increases consumption by 2 MWh. By further reducing heating power, the consumption increases signifi-cantly. The heating period is indicated for each power level. It was chosen to use the longest period necessary for all heating episodes, although it is possible to heat for a shorter period of time in spring and autumn. The heating time should be between 4 and 6 hours to minimize the energy consumption. The optimal heating power is therefore 35–40 kW. The heating system installed in the church has 39 kW, which seems to be exactly right. The guideline proposed by Korsgaard recommends 65 kW, which is too much.
Power (kW) 20 25 30 35 40 50Energy (MWh) 26,4 20,3 18,4 17,2 16,5 16,2Time (hours) 46 18 10 6 4 3
The energy loss due to infiltration is studied both in case of intermittent heating to 8/18 °C and permanent heating to 18 °C (Table 5). At an air exchange rate of 0.2 h-1 the increased heat loss by infiltration is around 5 % of the total heating demand for both continuous and intermittent heating. If the air exchange is 0.8 h-1 the heat loss is around 45 % higher for both heating situations. In a normal church where the air exchange is not more than 0.2 h-1, the ventilation accounts for a modest share of the total consumption. But higher ventilation rates can lead to significantly increased energy consumption. If windows or air ducts are kept open in order to reduce the relative humidity, major heat loss may be the consequence.
Annual heating energy (MWh)AER 0.1 h–1 0.2 h–1 0.4 h–1 0.8 h–1
8/18 °C 17.4 18.6 20.8 25.118 °C 49.1 52.4 58.9 72.0
Conclusions
Intermittent heating of churches is common practice in Denmark and many other countries with a moderate natural climate. Empirical data confirm that intermittent heating uses less energy than permanent heating, but it is difficult to predict the potential for energy conservation. The computer program B-Sim developed for indoor climate simulations in modern buildings seems to give reliable results. The influence of various parameters on the annual energy demand was investigated by computer modelling of thermal performance in Kippinge church. A heating period of 4–6 hours is most energy efficient, whereas shorter heating periods gives little reduction in energy loss. A longer heating period can lead to an unnecessary loss of energy, hence the heating system must have a timer to turn the heat on at the right time. If short heating episodes are used, the energy
Table 5. The influence of Air Exchange Rate (AER) on the annual energy consumption:
Table 4. The influence of heating power on the annual energy consumption and the heating time for intermittent heating to 8/18 °C once every week:

Gotland University Press 15
46
consumption mainly depends on the basic temperature between services, and the service temperature is of minor importance.
It is common practice to keep the doors and windows open for a while after service to let in fresh air. If this procedure is repeated too often, or the windows are open for many hours, it will affect energy conservation. If windows or air ducts are kept open permanently to reduce the humidity inside, heat loss by natural ventilation may account for up to 40 % of the energy demand. The energy aspects of humidity control in medieval churches should be further investigated.
When designing a new heating system for intermittent heating, there is usually a limitation to how many heating elements can be incorporated in the interior of medieval church. From an architectural point of view it is desirable to reduce the visible impact of the heating system as much as possible. An under sized heating system will give too long heating periods and too much heat will be lost. Radiant heating elements mounted below the pew seats are a good compromise for human comfort and energy efficiency. But the recommendation given by the heating regulation for Danish churches leads to an over sized radiant heating system. This is possibly because the guideline is based on empirical data from churches with warm air heating. Further research is needed to set up new guide-lines for designing radiant heating systems.
Acknowledgement
The work was sponsored by the Swedish Energy Agency as a part of the project ‘Spara och Bevara’.
References
Brostrøm, T. 1996. Uppvärmning i kyrker. Fugt- och värmtekniska beräk-ninger för dimensionering och klimatstyrning. Doktorsavhandling, Kungliga Tekniska Högskolan
Camuffo, D. (et. al.) 2006. A practical guide to the pro and cons of various heating systems with a view to the conservation of the cultural heritage in churches. Results of the European project Friendly Heating (EVK4-CT-2001-00067).
Korsgård, V. 1993. Cirkulæreskrivelse om vejledning vedrørende udførelse og brug af kirkevarmeanlæg m.v. Kirkeministeriet (Danish ministry of church affaires).
Limpens-Neilen, D. 2006. Bench heating in monumental churches. Ph.D.-thesis, Technische Universiteit Eindhoven.
Madsen, T.L. & Nørgaard, J. 1986. Kirkevarmeanlæg. Varmeforbrug og indeklima ved diskontinuert opvarmning af store rum. I: LfV, meddelelse nr. 181. Danmarks Tekniske Højskole (summary in English).
Schellen, H.L. 2002. Heating monumental churches, indoor climate and preservation of cultural heritage. Ph.D. thesis. Eindhoven University of Technology. ISBN: 90-386–1556-6.

Gotland University Press 15
47
Fan Convectors vs. Bench Heaters in Churches – Impact on Air Velocities
Magnus Mattsson1*, Tor Broström2, Elisabet Linden1, Svante Lindström1 and Mats Sandberg1
1 University of Gävle, Academy of Technology and Environment, Sweden2 Gotland University, Department of Culture, Energy and Environment, Visby, Sweden* Corresponding email: [email protected]
Summary
Air movements in churches affect the deposition rate of airborne particles on surfaces, and hence influence soiling of valuable artifacts of different kinds. Sooting from candles and the thermal comfort of people is also affected by indoor air velocities. In an experimental field study, two different heating systems were compared regarding their effect on room air velocities in a church: air-to-air heat pumps with indoor fan convectors vs. a combination of bench heaters and radiators. Hot-sphere and 3-D sonic anemometers were used to record air velocities in the church. Strong buoyant air flows were found both in the supply air flow path of the heat pumps and above the bench heaters, but the air velocities were rather low outside of these air currents. A ~25 cm thick downdraught air flow was found along walls and windows, with a magnitude that was similar at both heating systems and much larger than the outdoor air infiltration rate.
Keywords
Churches, air velocities, heating system, heat pump, surface soiling.
Introduction
European churches and other historic buildings are often heated by direct electric heating, and there is a great interest in finding more economical and environ-mentally friendly solutions. Attractive alternatives include heat pumps and district heating. A delicate problem – from both economical and preservation points of view – is then how to distribute the heat inside these buildings. Fan convectors constitute a relatively cheap alternative, needing comparatively little installation work. However, these convective heaters may increase air velocities and turbu-lence in the room air, which in turn might accelerate soiling of walls and artifacts. The complicated set of particle deposition mechanisms includes Brownian and turbulent diffusion, inertial impaction, interception, thermophoresis and gravita-tional settling (see e.g. Camuffo, 1998; Thacher et al, 2002, Lai & Nazaroff 2005, Lai 2005). Increased air movements in a church might also cause enhanced sooting from candles, and the thermal comfort of people might be affected.
The objective of this study was to compare the effect on room air velocities between air-to-air heat pumps with indoor fan convectors and a conventional combination of bench heaters and radiators inside a Swedish medieval stone church. A previous similar study in the same church (Broström et al, 2009)

Gotland University Press 15
48
revealed high air velocities in the supply air jet of the heat pumps, whereas the velocities were rather low (about 12–13 cm/s) near (≈10 cm) a wall-mounted precious painting, both when heat pumps and bench heaters were used as heat sources. Smoke visualizations also indicated low air velocities in general in the indoor church space. Further, it was also observed that the air temperature gradients were quite small in the church, both horizontally and vertically, at both heating modes. The present study adds information, particularly on the detailed air flow at walls and windows, where valuable surfaces (e.g. mural and stained glass paintings) and artifacts often are situated.
Method
The measurements were carried out in Ludgo church, Fig. 1, located 100 km south of Stockholm. The oldest parts of the church are from the 12th century and the church was completed in the 17th century. The church houses a number of valuable and sensitive art objects. The building envelope consists of 1.2 m thick stone walls (plastered on the inside) and has double glazing (10 cm between the glasses). The size of the main assembly hall is 17.2×10.1 m, and the vaulted ceiling is 9.4 m high in the middle. The total volume of the church is estimated at 1960 m3. The present measurements took place in 2010, March 9–11. After a long cold winter, and still around 0 ºC outdoors, the temperature of the building structure was rather low and a significant amount of heating was needed to reach the indoor temperature set value of about 10–12 ºC. Except for a funeral four days before, no services (involving raised indoor temperature) had taken place for several weeks before the measurements.
The heating units in the church consisted of (1) direct electric bench heaters (BH) of model ELO 4705 3, Duvnäs AB, 39×300 W = 11700 W, (2) direct electric radiators (Rad) under windows, 9×500 W + 4×1200 W = 9300 W and (3) two air-to-air heat pumps (HP) of model Mitsubishi MFZ-KA35VAH, max 6200 W each. The HPs were installed diagonally in the room, as depicted in Fig. 2. The warm air from the HPs issued out from two slots (visible in Fig. 3), one directing the air along the floor and the other slightly upwards. The installation of the HPs was done in 2006, granted by the County Board Conservation Authority on the
Fig. 1. Exterior and interior of the medieval church in Ludgo.

Gotland University Press 15
49
Fig. 2. Drawing of the church, with heat pumps and measuring points marked.
Fig. 3. Three photos showing heat pumps HP1 and HP2 and bench heaters.

Gotland University Press 15
50
condition that it would be evaluated from a preservation point of view. The HPs, being more energy efficient, are given highest priority in the heat regulating system, but on cold days all heating units are used. In order to separate the influence of the HPs on the measured variables from the influence of BH+Rad, these two heating modes were tested separately in this study. In the case BH+Rad, however, the radiators under the windows in the large church hall – where the air velocity measurements were performed – were always switched off (as the parish used to have it, to avoid surface soiling in their vicinity).
Ten omnidirectional hot sphere anemometers of model CTA-88 (University of Gävle, Lundström et al, 1990) were mounted along a movable measuring pole in order to measure the vertical air velocity profile in the room air of the church. The anemometers were of constant temperature kind, with 1.2 mm thermistors and a time constant of about 0.2 s for air velocities. Measurements were performed in front of the fan convector unit of one of the heat pumps, HP1 in Fig. 2 and 3. Here the anemometers were placed in the supply air jet at the three distances 1.40, 2.80 and 4.45 m from the front of the heat pump (positions 1–3). They were also placed in two positions in the main aisle of the church (positions 5 and 6), where position 6 was at 1.8 m from position 3.
Two 3-D sonic anemometers (SA) of model TR92T/DA650, Kaijo Sonic Inc., were used to make detailed air velocity measurements at the inside of an outer wall (SA_wall) and at the inside of a window (SA_window); se Fig. 2 and Fig. 4. These anemometers sampled the air velocity in x-, y-, and z-direction at 20 Hz frequency. The distance between the sensors that constituted the measuring volume of a SA was about 30 mm, and in the direction perpendicular to the surfaces the length of the measuring volume was 12 mm. Its centre was about 18 mm from the surfaces when the SAs were in their closest position. By means
Fig. 4. Anemometer set-up: Hot-sphere (left) and Sonic (right).

Gotland University Press 15
51
of automated transversing units, the SAs were programmed to take successive 4-min samples at 15 different distances perpendicularly out from the surfaces, up to a maximum distance of 600 mm. The anemometers were mounted in such a way that no prongs “shadowed” the measuring volume from the expected downwards directed main air flow. The measurement position at the wall was 1.74 m over the floor, 1.78 m from the right wall, and the height of the large wall niche was 6.34 m at the measuring point. Initial IR-thermography was employed to ascertain that the temperature of this wall surface area was representative of the church walls in general. Large stones behind the plaster of the wall made its surface undulate slightly; roughly with 10 mm “valley-to-peak” distance and 0.5 m “wavelength”. The measurement position at the window (4.12 m high and 1.90 m wide) was 1.06 m over the bottom and 0.60 m from the right hand side of the 0.55 m deep niche, which in turn was 1.70 m over the floor.
Thermocouples were used to measure the wall and window surface temperatures close the measuring position of the sonic anemometers, and also for measuring the room air temperature close to this position (1.4 m from the Northern wall, 1.5 m over the floor). The hot sphere anemometers also measured air tempera-tures, thus yielding the vertical temperature gradient.
Results
The heat pumps proved not quite capable of keeping the set value 11 ºC of the indoor temperature during nighttime, when there was no sun and most of the measurements were performed; consequently the thermal conditions differed somewhat between the two heating modes. The average temperature differences between room air and wall surface (at the time and place of the SA measure-ments) was 1.6 ºC with the heat pump (HP) and 2.1 ºC with bench heaters + radiators (BH+Rad), and between room air and window surface it was 4.4 ºC with HP and 5.0 ºC with BH+Rad. The hot sphere anemometer temperatures indicated a quite homogeneous room air temperature vertically outside air convection zones, thus confirming previous findings (Broström et al, 2009).
Figure 5 shows vertical mean air velocity profiles in front of heat pump 1, and also in two positions in the aisle, for the case with only the heat pumps active. Apparently there were high air velocities at floor level near the HP (maximum 150 cm/s at 10 cm above the floor in position 1). The graphs for positions 1–3 then indicate a rising buoyant supply air jet from the HP. In the aisle the velocities were low, d”10 cm/s, except for some draught along the floor. At smoke visua-lization it seemed as if the supply air jets continued upwards at a rather high air velocity, and reached all the way to the ceiling. Similarly, the bench heaters were seen to cause buoyant plumes, which also seemed to attain rather high air velocities and eventually reach the ceiling.
Figure 6 shows a typical example of how the air velocity varied with time at the wall surface during a 3 min period, as measured with sonic anemometer (SA). The case is from a period with the HPs on, but similar velocity patterns appeared also with BH+Rad. The figure shows both the vertical component

Gotland University Press 15
52
Fig. 5. Vertical air velocity profiles in room air when the heat pumps were active.
Fig. 6. Air velocity variations at the wall surface during a typical 3-min period.

Gotland University Press 15
53
of the air velocity (defined positive downwards) and the horizontal component (defined positive from the wall surface perpendicularly towards the room space). Apparently the variation in the air velocities were large and involved relatively long time scales, necessitating rather long measurement periods to attain averages of reasonable accuracy. The positive values for the vertical direction confirm the existence of downdraught at the surface. Some negative values indicate however occurrences with upwards directed air movements. The horizontal air movements are obviously of a much lower magnitude than the vertical, with negative values dominating, suggesting a net air entrainment into the air current near the wall.
Figures 7–10 show the horizontal air velocity profiles at the wall and window surface, with the two heating modes separated. The data shown are averages and standard deviations from 4–6 hours measuring during night time. The graphs verify the findings in Fig. 6 in that the vertical down-draught dominates the air movement close to the surface, and that the velocity component perpendicular to the surface is rather small. At the wall there seems to be a horizontal component parallel to the surface that dominates at distances greater than about 25–30 cm. The air velocities close to the surface is somewhat higher at the window than at the wall, presumably due to the greater surface/air temperature difference at the window. The layer of falling air is rather thick at both wall and window – around 25 cm. In that layer the vertical air velocity increases more or less monotonously towards the surfaces. Apparently the SAs cannot get close enough to cover the sublayer of decreasing velocity towards the surfaces. Similar measurements
Fig. 7. Horizontal air velocity profiles at wall surface. Only Heat pumps active. Error bars for the components = standard deviation.

Gotland University Press 15
54
in another church, including also hot-wire measurements (not yet published), indicated that the velocity maximum is at approximately the distance of the closest SA measurements, i.e. around 18 mm from the surface. Thus we do not expect the maximum air velocities to be much higher than the values in the diagrams. The velocity fluctuations were apparently substantial in all measuring positions.
Figures 7–10 indicate a tendency towards slightly higher air velocities with the heat pumps, especially at the window. Overall, however, the difference in surface air velocities appears to be small between the two heating modes.
Figure 11 shows an example of the frequency distribution of the horizontal air velocity component close to the wall surface. As noted above, the direction was mainly towards the wall, but the magnitude stays low. There is thus no indication of turbulence involving strong air “bursts” towards the surface, which otherwise possibly could enhance particle deposition through inertial impaction.
Simultaneously with the air velocity measurements, the air change rate in the church was measured by using the tracer gas decay technique (further described by Mattsson et al, 2011), with SF6 as tracer gas. It was found to vary between 0.068–0.083 h–1, for an average around 0.075 h–1; i.e. a rather low air change rate. By multiplying with the room volume of the church, we arrive at a total venti-lation rate of 0.075×1960 = 147 m3/h.
Fig. 8. Horizontal air velocity profiles at wall surface. Bench heaters & Radiators active. Error bars for the components = standard deviation.

Gotland University Press 15
55
Fig. 9. Horizontal air velocity profiles at window surface. Only Heat pumps active.Error bars for the components = standard deviation.
Fig. 10. Horizontal air velocity profiles at window surface. Bench heaters & Radiators active. Error bars for the components = standard deviation.

Gotland University Press 15
56
A crude estimation of the total downdraught flow rate at walls and windows is done as follows: From figures 7–10 we estimate an approximate integrated vertical “2-dimensional” flow rate of H”0.02 m2/s (slightly smaller along walls but larger at the windows). Further, the total downdraught-attributed wall length along the inside perimeter of the church (incl. windows) is estimated at about 50 m. This gives a total downdraught flow rate of 0.02×50= 1 m3/s, or 3600 m3/h. When comparing with the in- and exfiltrated air flow rate of about 147 m3/h we find that the downdraught flow rate is around 25 times larger.
Discussion
The sonic anemometer measurements showed a tendency towards slightly stronger downdraught at the wall and window with the heat pumps than with the bench heaters & radiators. As mentioned, these results were obtained when the temperature difference between surfaces and room air was somewhat lower with the HPs; if that temperature difference had been the same in both heating modes it is likely that the air velocities had been yet a bit higher with the HPs. We find no simple explanation for why this would occur since the HPs appeared to have a significant effect on air movements only in the near-zone and in a rather narrow supply air jet path towards the ceiling. One possibility could be that strong entrainment of room air into these air jets at lower levels in the church room cause a general enhancement of downflow of air outside of the jets; the room air entrained into the jets must be replaced with other air, and most of that needs to be supplied from higher levels. Thus the entrainment effect might enhance downdraughts at outer walls and windows. However, a similar effect can be expected also with bench heaters and radiators, which create
Fig. 11. Frequency distribution of horizontal air velocity component at wall surface.

Gotland University Press 15
57
strong natural convective air currents that entrain the surrounding room air. It might be worthwhile to further study these entrainment effects, in particular the entrainment rate at different heights with different kinds of heating units.
Overall, however, in this study the difference in air velocities at wall and window surfaces were small between the two heating systems. Hence, irrespective of which particle deposition mechanisms that are most important, also the particle deposition rate at these surfaces can be expected to be similar. The air velocity component perpendicular to the wall and window surface proved small, giving no indication of that large scale particle impaction onto the surfaces should be a considerable problem. From a preservation point of view, this study shows that convective heating, when applied properly, does not necessarily increase the risk for soiling of walls and artifacts.
Figures 7 & 8 indicate a downdraught layer extending ~25 cm out from the wall. It is thus a relatively thick layer that is affected by the downdraught, making it necessary to place sensitive artifacts etc. at quite some distance from walls and windows if this layer is to be avoided. The indication of that the total downdraught flow rate at walls and windows was substantially larger – by a factor around 25 – than the infiltration ventilation rate, suggests that the indoor air movements are governed mainly by convection air currents created by warm and cold surfaces, and to less extent by in- and exfiltration air currents. The windows also appeared to be fairly airtight in the studied church, so any in- and exfiltration at these was probably moderate. Significant infiltration here might otherwise affect the air velocity measurements, especially at the window. Both heat pumps and bench heaters were noted to cause strong buoyant air flows that reached the ceiling, suggesting that this area might need more attention in future studies.
Acknowledgements
The study was funded by the Swedish Energy Agency.
References
Broström, T., Linden E., Lindström, S., Mattsson, M. & Sandberg, S. 2009. Convective heating in historic buildings – Effects of incorpo-rating heat pumps in the air distribution system. Proc. Roomvent 2009 conference, Busan, South Korea.
Camuffo, D. 1998. Microclimate for cultural heritage. European commission – Environment and climate research programme. ISBN 0-444-82925-3. Elsevier science B.V. Amsterdam, The Netherlands.
Lai, A.C.K. & Nazaroff, W.W. 2005. Supermicron particle deposition from turbulent flow onto smooth and rough vertical chamber surfaces. In: Atmospheric Environment. Vol. 39. pp 4893–4900.
Lai, A.C.K. 2005. Modeling indoor coarse particle deposition onto smooth and rough vertical surfaces. In: Atmospheric Environment. Vol. 39. pp 3823–3830.

Gotland University Press 15
58
Lundström, H., Blomquist, C., Jonsson, P.O. & Pettersson, I. 1990. A microprocessor-based anemometer for low air velocities. In: Roomvent 90, Proceedings, 2nd international conference of engineering aero- and thermodynamics of ventilated rooms, Oslo, Norway, June 13–15, B1–27.
Mattsson, M., Lindström, S., Linden, E. & Sandberg, S. 2001. Tracer gas techniques for quantifying the air change rate in churches – field investigation experiences. In: Proc. Roomvent 2011 conference, Trondheim, Norway. (Submitted).
Mosley, R.B., Greenwell, D.J., Sparks, L.E. (et al.) 2001. Penetration of ambient fine particles into the indoor environment. In: Aerosol science and technology; Vol. 34; pp 127–136.
Thatcher, T.L., Lai, A.C.K., Moreno-Jackson, R. (et al.) 2002. Effects of room furnishings and air speed on particle deposition rate indoors. In: Atmospheric environment; Vol. 36; pp 1811–1819.

Gotland University Press 15
59
Studying Organic Hygroscopic Art Objects Housed in Historic Buildings
– A Valuable Source for Re-evaluating Climate Criteria and Saving Energy?
Charlotta Bylund MelinDepartment of Conservation, University of Gothenburg, Sweden Email: [email protected]
Summary
This paper describes the author’s current PhD study projects within the Swedish research project Energy Efficiency in Historic Buildings (Spara och bevara). It is focused on the mechanical behaviour of some organic materials in relation to relative humidity and temperature. The studies consist of three parts which cover in situ monitoring of indoor climate and deformation of wooden wall panels, laboratory studies of the kinetics of moisture content in wood, and damage assessment of objects in historical buildings with different indoor climates. No final conclusions can be made at present but related questions are brought forward for discussion. The overall results will contribute to a re-evaluation of the present very strict and energy-demanding climate criteria, and thus promote energy efficiency in the historic buildings in question, and by extension in many other buildings.
Keywords
Historic buildings, relative humidity, temperature, climate criteria, energy saving.
Introduction
Organic hygroscopic materials
Organic materials, like wood, textile, paper, paint, leather, ivory, etc., respond differently to ambient environments. Relative humidity (RH), temperature (T), light and air pollution contribute to the overall deterioration of organic, hygroscopic materials. The impacts on such materials are chemical (hydrolysis and oxidation), mechano-physical (stress) and biological (mould) (Brokerhof, 2007). This paper describes a current PhD project mainly focused on the mechanical behaviour of some organic materials in relation to RH and T. The materials studied are paintings on canvas, uncoated or painted wood as they exist in large numbers in historic buildings.
Organic, hygroscopic materials will adsorb and desorb moisture from and to the air to reach the equilibrium moisture content (EMC) of the relative humidity of the air. The kinetics of these reactions varies between different materials, surface

Gotland University Press 15
60
treatments, etc. The adsorption of moisture will cause swelling and shrinkage of the materials. If they are locked in a position or restraint in any way the deformation stress can become so intense that permanent deformation (warping, splitting of wood for example) occurs. Objects of mixed materials, such as painting on canvas or wood, are more vulnerable to fluctuations in relative humidity as each individual material responds differently to RH fluctuations and hence some materials can act as a restraint on others (Mecklenburg (et al.) 1998).
Climate criteria
Many museums have introduced narrow climate ranges in order to prevent damage to objects of organic, hygroscopic materials. A recommended range has an annual set point of 50 % RH and allowable short term (daily) fluctuations of ± 2–5 % and temperature set point of 20 p C ± 2–5 p C. The specifications were determined by considering thermal comfort for museum staff and visitors and the capacity of HVAC plants. This has been described in more detail by Michalski (1993) and Erhardt (et al.) (2007).
The physical impacts of RH and T on organic materials have been, and still are, studied by several scientists. Some results show that for these types of objects there is no “ideal” climate range for museums (Erhardt and Mecklenburg, 1994) and from the physical point of view it can safely be widened to 30–60 percent RH for general collections. Investigations have also been performed on authentic objects such as polychrome sculptures in historic buildings. These studies give important information on the physical behaviour of single objects in their “own” environment (Bratasz (et al.) 2007). Additional studies like these need to be done before more general conclusions applicable to collections can be reached. Studying objects in historic buildings in an environment often far from the recom-mended one of the museum have given new questions such as: are there any safe climate ranges for organic materials? What is the influence of temperature, especially low temperatures? What is the kinetics of moisture transport in organic materials that will result in deformation? (Leijonhufvud and Bylund Melin, 2009.)
Energy costs are influenced by the climate ranges. The more stable and narrow the climate ranges, both on long and short term basis, the larger the energy consumption and hence the cost. It also depends on the type of building itself. Purpose-designed modern buildings may work well but many museums are also located in historic buildings and the demands of climate regulations have increased on these buildings due to the collections inside. Historic buildings seldom have a tightly-sealed envelope and hence a high air infiltration rate makes it hard to keep a stable indoor climate. (Oreszczyn (et al.) 1994).
During the last few years the debate on acceptable climate ranges for museum collections has grown, along with increased awareness of the threat of global climate change. The results of climate change have also caused direct impact on historic buildings and collections, for example in England as reported by Cassar at the Roundtable discussion Climate change and museum collections (2008) or pointed out in Staniforth’s speech at the International Symposium on the future of Museum Climate seen in the context of Global Climate Change (2010).

Gotland University Press 15
61
The professional group that is perhaps the most sceptical about widening the climate ranges are the conservators-restorers, as evidenced by the transcript of the round table discussion The Plus/Minus Dilemma: The way Forward in Environmental Guidelines (2010). The question is, are research studies made on individual materials during controlled climate conditions applicable to actual, often composite, objects? In reality the objects have been used for different purposes and have different backgrounds, which might result in different states of preser-vation today. They have also been subjected not only to variations in RH and T but to other factors like light and air pollution, possibly in a synergetic way. To include all these factors in the same experiment is difficult. Therefore the conser-vators’ questions are legitimate and the challenge is to overcome this dilemma.
Hypotheses and objectives
The present climate criteria for museum objects are probably too narrow, leading to excessive energy consumption, but by how much is unclear and more research is therefore needed. One method is to perform controlled experiments in the laboratory, monitoring RH/T, and simultaneously monitoring deformation of objects in historic buildings. Another is to perform damage assessment of objects in situ in historic buildings, and if possible relate the types of damage to the indoor climate. The influence of indoor climate conditions in historic buildings on changes in organic materials is a valuable source of information. Using both approaches is likely to lead to synergistic effects on reaching a more certain knowledge base for development of climate criteria.
The objective of this paper is to describe current research approaches in this field within the program Energy Efficiency in Historic Buildings (Spara och bevara). Although no final conclusions can yet be presented, related questions are brought forward for discussion, such as: How can, not only RH, but also T directly or indirectly influence moisture diffusion in hygroscopic materials? What is the influence of the amplitude of their fluctuation on both short and long term basis? Which range, dry or humid, is most detrimental? What is the effect of the kinetics of change of temperature or humidity?
Methods
To cover the complexity of real life the research includes three parts; laboratory studies, in situ monitoring and damage assessment of objects in historic buildings, as shown in Fig. 1. Not until the same damage patterns correspond in situ and in the laboratory will it be possible to more clearly link the indoor climate to damage in the studied organic materials.
The laboratory studies use wood as it is a common material and there is much reference data available both in the field of conservation science as well as wood drying. For monitoring deformation, painted wooden panels at Läckö Castle are used. For the damage survey, oil paintings on canvas from the 17th and 18th centuries will be used. The reason is that these types of paintings are common in the historic buildings that will be studied and hence it will give a large statistical material.

Gotland University Press 15
62
Laboratory testing of kinetics of moisture adsorption and emission of wood
Like all hygroscopic materials, wood will adsorb and desorb moisture from the air to reach the equilibrium moisture content (EMC) the point where the wood is in equilibrium with the relative humidity of the ambient air. This process takes a long time, days or weeks depending on the thickness of the wood. In an environment with short time RH fluctuations the wood never reaches equilibrium and a moisture gradient in the wood develops from the surface inwards, tending to develop stress in the material. (Jakieła (et al.) 2008) But what happens in an environment with constantly fluctuating RH? Can a wooden core that contains more moisture or is drier than the ambient air work as a humidity buffer and relax the interior stress? Diffusion rates in objects are much slower at low temperatures and dimensional changes may therefore be different at high or low temperature.
In order to study these processes, MC will be monitored while the wood is subjected to RH and T fluctuations in a climate chamber. The method is to monitor the moisture content in wood at different depths from the surface when all other sides of the wooden samples are moisture-sealed. However, the methods for monitoring moisture content in wood are not very accurate and the available methods need to be developed further for this specific purpose. In order to verify the results, parallel tests monitoring RH and T at a different range of depths in the same wood samples will be performed.
Fig. 1. Ongoing and planned research projects that are linked and will possibly verify each other.

Gotland University Press 15
63
In situ microclimate and deformation monitoring of painted wooden panels at Läckö Castle
Läckö Castle in southern Sweden is a large stone and brick building, whose present appearance dates from the 17th century (Fig. 2). At the end of the 1990s a comprehensive climate survey was launched, which resulted in the installation of a dehumidifier and secondary glazing of the windows at the Castle. The aim was to keep the RH below 70 %. Although the RH was lowered, during parts of the year it is still above this value. The plant is now almost ten years old and needs to be replaced. The question has arisen whether it is possible to dehumidify such a large building and at what price? Most important, have the building, the immovable decorative interiors and movable artworks benefitted from reduction of humid indoor air as intended?
The first interventions in evaluating the indoor climate and comparing it with the state of preservation of painted wooden wall panels (Fig. 3) in all four principal directions, have been described elsewhere (Bylund Melin (et al.) 2010). It is a known phenomenon, for example reported by Camuffo (1983), that artworks located in contact with outer walls can suffer from T gradients on each side and consequently also RH gradients which can cause condensation
Fig. 2.Läckö Castle. Photo by the author.
Fig. 3. One example of the 35 examined painted wall panels at Läckö Castle. They are located on the same floor below the windows in all principal directions. Photo by the author.
problems and deformation of the objects. The first results from Läckö Castle suggested that the damage to the panels was due to the microclimate in their vicinity and not to the general indoor climate. Therefore, the continuation of this research includes microclimate monitoring of RH and T of the painted panels in all four principal directions as well as in rooms with and without dehumidification. At present a full year’s monitoring is taking place. In order to further study the response of the fluctuating RH and T, linear potentiometers have been attached to some of the wooden panels and these will record in-plane as well as out-of-plane deformation. The method is developed at the University of Florence and the results will be subsequently published.

Gotland University Press 15
64
Condition surveys of paintings in historic buildings as climate indicators
Damage conditions generally estimate the overall condition of collections in museums, churches, etc. This project will rather study if certain patterns of damage are occurring on paintings in certain environments. If such damage indicators can be found and described, their presence or absence will indicate the influence of specific indoor climates. The survey will be performed in two buildings with different indoor climate but housing similar types of paintings.
In this study the aim is to describe the damage to a large number of objects that have been housed in two different environments. The assessment will be made only by visual examination, using a low magnifier and UV-light. To reduce systematical errors a homogeneous group of paintings are sampled. It can be paintings of the same painter or areas of paintings where the same pigments frequently occur. These pigments can be earth colours, sensitive to high humidity levels (Mecklenburg, 2007). The risk is that there will be occasional misjudgments but it is hoped that these will disappear in the statistical evaluation. The method is rough but assumed to complement the other investigations.
Another important issue that needs to be paid attention is how to define the indoor climate in historic buildings. This is important both in order to make records from different buildings comparable but also to be able to relate the damage to objects occurring in one building to the indoor climate. (Fig. 4a and 4b) On an annual basis the indoor climate in an unheated building in Sweden can be quite varied, from 20–95 % RH and temperature range between –10 to +25 p C. This means that for parts of the year the indoor climate is within the so called “safe range” and for other parts of the year it is not. During parts of the year it is either cold and very humid, or warm and humid. (In heated buildings or in other climate zones other combinations of RH and T will of course occur.) Which of these combina-tions are the most harmful/safe on a seasonal basis and concerning short term fluctuations? How can short term variations be quantified? Is it the number of fluctuations of certain amplitudes above or below a suggested safe range? If T is indirectly contributing or reducing damages of hygroscopic materials it is also essential that T is presented in the same graphs as RH at all times. Hopefully the damage assessment will clarify some of these questions.
Results
Only a few preliminary results can be presented in this paper as the methods first need to be more developed. However, by using three different methods to study the impact of indoor climate on organic, hygroscopic materials it is likely that new data can be added to the complex questions raised.
The preliminary results of RH and T monitoring behind and in front of wooden panels at Läckö Castle show that there is a RH and T gradient between the front and back of the panels and this is more pronounced in a dehumidified room (Fig. 5a and 4b). In Fig. 4a the panel is facing south and it clear that the short term fluctuations in temperature are more distinct in spring when the wall gets warmer during the days. The method appears to be useful in evaluating microclimate

Gotland University Press 15
65
Fig. 4b. Room 2A in Skokloster Castle.The two figures show climate data from two different rooms in Skokloster Castle in Sweden during one year. Both curves are well outside the considered safe ranges but there are also obvious differences between them. For example, in Fig. 4a RH is higher during winter and the short term fluctuations are much larger during the rest of the year compared to Fig. 4b. During the winter periods RH is higher and T lower in Fig. 4a compared to 4b. Which periods are more harmful? How will the two records be defined and be able to be compared? Will the two examples of indoor climate give different types or rates of damage? Which is the most detrimental period to objects in Fig. 4a? April–October with large short term fluctuations approx. 40–90 % and T 10–25 p C or November–March with RH 80–100 %RH and T below the freezing point?
Fig. 4a. Room 3N in Skokloster Castle.

Gotland University Press 15
66
Fig. 4b. Climate records from Läckö Castle room 205; the wall panel is facing East. The room is not dehumidified.Result of monitoring RH and T in front of (red and orange lines) and behind (dark and light blue lines) during the period December 2009 – May 2010. The two upper curves show RH and the lower show T.
Fig. 4a. Climate records from Läckö Castle room 225; the wall panel is facing South. The room is dehumidified.

Gotland University Press 15
67
variations in historic buildings, both in relation to principal directions but also to evaluate climate heating methods in historic buildings.
Discussion and conclusion
Can study of organic hygroscopic art objects housed in historic buildings be useful for re-evaluating climate criteria? –Yes, I believe so. The overall results will contribute to a re-evaluation of the present very strict and energy-consuming climate criteria, and thus promote energy efficiency in the historic buildings in question, and by extension also in many other buildings. The research done by many scientists will increase the understanding of how these materials respond to relative humidity and temperature and thereby also contribute to the preventive conservation of objects.
It is of course of utmost importance that neither the buildings nor the objects must suffer from altered climate criteria but should, on the contrary, benefit from such a change. Therefore, different methods such as computer modelling, in situ monitoring of indoor climate and objects as well as laboratory studies examining the influence of RH and T on organic hygroscopic materials, can together complement and support each other.
It is important to keep the indoor climate discussion alive among conservators, museum staff and scientists. What would a realistic future of less strict climate ranges at the museums be? Each museum is as unique as the museums’ objects and different solutions must be applied for each building and collection. To go green is not something that can be introduced instantly. Planning and logistics are needed in order not to put fragile objects at risk. The National Gallery in Denmark has actively worked to decrease their energy consumption by, among other measures, widening the climate range in certain parts of the museum (Hansen, 2010). To discuss and compare possible solutions can be one way forward to save energy.
Acknowledgment
I thank the Swedish Energy Agency for financing my PhD studies, The Swedish National Heritage Board (SFV) and Syskonen Bothén stiftelse for contributing for funding of research equipments and COST Action IE0601 (Wood Science for Conservation of Cultural Heritage,) and Dr. Ottaviano Allegretti at CNR-IVALSA – Timber and Trees Institute, Trento for support and cooperation in the research at Läckö Castle.
References
Bratasz, L., Koslowski, R., Camuffo, D. & Pagan, E. 2007. Impact on indoor heating on painted wood: Monitoring the altarpiece in the church of Santa Maria Maddalena in Rocca Pietore, Italy. In: Studies in conservation, 52 pp. 199–210.

Gotland University Press 15
68
Brokerhof, A.W. 2007. Applying the outcome of climate research in collection risk management. In: Padfield, T. & Borchersen, K. (eds.) Museum Microclimates. Contributions to the Copenhagen confe-rence 19–23 November 2007. The National Museum of Denmark, Copenhagen, pp. 115–121.
Bylund Melin, C., Bjurman, J., Brunskog, M. & von Hofsten, A. 2010. Painted wood as a climate indicator? Experiences from a condition survey of painted wooden panels and environmental monitoring in Läckö Castle, a dehumidified historic building. In: Multidisciplinary Conservation: a Holistic View for Historic Interiors. Joint Interim-Meeting of five ICCOM-CC Working Groups, Rome.
Camuffo, D. 1983. Indoor Dynamic climatology: Investigation on the interactions between walls and the indoor environment. In: Atmospheric Environment, Vol. 17, No. 9, pp.1803–1809.
Climate change and museum collections. 2008. Roundtable discussions on the conservation of cultural heritage in a changing world. IIC. http://www.iiconservation.org/dialogues/IIC_climate_change_ transcript.pdf
Erhardt, D., Tumosa, C. S. & Mecklenburg, M.F. 2007. Applying science to the question of museum climate. In: Padfield, T. & Borchersen, K. (eds.), Museum Microclimates, Contributions to the Copenhagen conference 19–23 November 2007, National Museum of Denmark, pp. 11–18.
Erhardt, D. & Mecklenburg, M. 1994. Relative humidity re-examined. In: IIC Preventive Conservation Practice, Theory and Research. Preprints of the Contribution to the Ottawa congress, 12–16 Sept. 1994, p. 32–37.
Hansen, M.K. 2010. Going green – challenges and possibilities. Speech at the International symposium on the future of museum climate seen in the context of global climate change: http://www.smk.dk/museumclimate
Jakieła, S., Bratasz, L. & Koslowski, R. 2008. Numerical modelling of moisture movement and related stress field in lime wood subjected to changing climate conditions. In: Wood Science Technology, 42:21–37.
Leijonhufvud, G. & Bylund Melin, C. 2009. Bevarandeklimat i historiska byggnader – några kunskapsluckor. In: Meddelelser om konser-vering 1, IIC Nordic Group, pp. 22–30.
Mecklenburg, M. F., Tumosa, C.S. & Erhardt, D. 1998. Structural response of painted wood surfaces to changes in ambient relative humidity. In: Dorges, V. & Howlett, F.C. (eds.), Painted wood: History and conservation. The Getty Conservation Institute, Los Angeles, pp. 464–483.

Gotland University Press 15
69
Mecklenburg, M. 2007. Micro climates and moisture induced damage to paintings. In: Museum Microclimates, In: Padfield, T. & Borchersen, K. (eds.), Museum Microclimates, Contributions to the Copenhagen conference 19–23 November 2007, National Museum of Denmark, pp. 19–25.
Michalski, S. 1993. Relative Humidity: A discussion of Correct/Incorrect Values. In: IIC Preventive Conservation Practice, Theory and Research. Preprints to the ICOM –CC, 10th Triennial Meeting, Washington, DC, USA, 22–27 August 1993, pp. 624–628.
Oreszczyn, T., Cassar, M. & Fernandez, K. 1994. Comparative study of air-conditioned and non air-conditioned museums. In: IIC Preventive Conservation Practice, Theory and Research. Preprints of the Contribution to the Ottawa congress, 12–16 Sept. 1994, pp. 144–148.
Staniforth, S. 2010. Climate change and museum practice. Speech at the International symposium on the future of museum climate seen in the context of global climate change: http://www.smk.dk/museumclimate.
The Plus/Minus Dilemma: The Way Forward in Environmental Guidelines. 2010. Roundtable held on 13 May, 2010 Milwaukee Wisconsin, USA by IIC and AIC. IIC edited transcript with additional comments. http://www.iiconservation.org/dialogues/Plus_Minus_trans.pdf

Gotland University Press 15
70
Decision-making on Climate Control for Energy Efficiency and Preventive Conservation in Historic Buildings
Gustaf Leijonhufvud1,2* and Tor Broström1
1 Gotland University, Sweden2 University of Gothenburg, Sweden* Corresponding email: [email protected]
Summary
A conceptual framework for decision-making about indoor climate control in historic buildings is suggested and discussed. Ideas developed in environmental decision making are discussed, and it is argued that the two fields share a set of fundamental characteristics that make the transfer of ideas legitimate. It is also suggested that an improved decision process is a necessary, although not suffi-cient, step towards sustainable management.
Keywords
Decision-making, standards, environmental conservation, preventive conser-vation, energy efficiency.
Background
Energy efficiency is a cornerstone for sustainable management of most historic buildings, and its importance is increasing. Society is facing an enormous global challenge with a shift away from energy systems based on fossil fuels. Heritage institutions and their management organisations are in need of sound methods to balance use, energy efficiency and preservation. The scientific basis for indoor climate control in historic buildings has over the last decades seen improvement in research areas such as human comfort, materials science and building physics. This knowledge base has to be incorporated in decision-making to meet the challenges of climate change, increasing energy cost and changed expectations of comfort. The aim of this paper is to initiate a discussion of how the decision making process in this context can be improved. Problematic issues with the situation today are identified, and their origins are discussed. It is argued that theories and methods that have been developed in other decision-making contexts have a potential to be transferred to this particular area of cultural heritage management.
This paper focuses on indoor climate control in historic buildings housing sensitive artifacts, where the specification for the indoor climate is decided with respect to the user, the building and the collection. The focal point for this topic has often been universal indoor climate specifications expressed as acceptable intervals for various parameters (e.g. 55% ± 5%). This has in many ways been a

Gotland University Press 15
71
successful way to reduce the complexity of the problem. Universal specifications may, however, be misguiding in the individual case and lead to climate control practices that are unsustainable. All aspects of the problem should be considered together and in a long enough time perspective; to achieve this there is a need to improve the decision process as a whole.
The indoor climate compromise
A fundamental purpose of all buildings is to provide shelter from the outdoor environment. Accordingly, for all buildings, there is a two step procedure of 1) deciding the target indoor climate and 2) choosing technical solutions to achieve it. For most of the building stock, the first step is straight-forward, governed by requirements for human comfort and health. With some exceptions, this step results in a target indoor climate that is more or less uniform in both time and space. For historic buildings housing sensitive collections the situation is more complex and highly negotiable. The target indoor climate should in this case be a compromise between preservation of the artefacts and the building on one hand, and human comfort on the other hand (e.g. Michalski, 1993; Bordass, 1997; Camuffo, 1998). Several more factors can be added, most notably energy use, environmental impact and running and installation costs. The boundary conditions are given by the construction of the building and the outdoor climate. The properties of the building envelope determine the potential for passive control: air tightness, insulation and inertia will reduce outdoor variations in a way that is specific for each building. The target indoor climate is often charac-terized with a desired level of temperature and relative humidity, and a tolerable pattern of fluctuations. The temperature difference between outside and inside is directly proportional to energy use, and the target level for relative humidity is also important for energy use (Broström and Leijonhufvud, 2008; 2009). A stable indoor climate in museums is often related to a high use of energy (Ascione et al. 2008), but this is not universal. A deliberate use of a building’s hygrothermal inertia can be effective in maintaining a stable climate with low energy use (Padfield and Larsen, 2004). For historic buildings housing sensitive collections, the target indoor climate should be more or less individual for each building. This implies that target levels should be adjusted as context or priorities are changed.
Strict Specifications and Ad-Hoc Decision Making
A common problem is that the decision process needed to establish the target indoor climate is substituted by the use of simple and rigid specifications. Instead of making an individual decision based on the local conditions, a universal standard is adopted. The evolution of environmental guidelines for museums and their scientific basis have been explored and discussed elsewhere (e.g. Brown and Rose, 1996; Erhardt (et al.) 2007). A major problem is that the original recom-mendations have been transformed to strict specifications. Weintraub (2006) argues that there are four driving forces behind this transformation: 1) Exact demand specifications are preferred by engineers and architects in the planning process when a museum is renovated or newly built. 2) Travelling exhibitions

Gotland University Press 15
72
require agreements across institutions all over the world, which narrow down the range of possible local solutions. 3) Expansion of the conservation and collection management profession has brought environmental control on the agenda. 4) Growth of awareness about the importance of environmental control by museum professionals, but not necessarily an understanding of the environ-mental needs of collections, have increased the demand for fixed numbers and simple rules to solve complex problems. An addition to these explanations is that standards in themselves form our expectations. Shove and Moezzi (2002) argue that “the very existence of definable standards is instrumental in carving out terri-tories of convention and expectation” and ask, rhetorically, if “energy efficiency standards have the perverse effect of reducing socio-technical diversity and thereby fostering a global monoculture of consumption?”. Although the scientific evidence for the strict specifications widely used today in museums have been questioned on the basis of materials science (Erhardt (et al.) 2007), a perhaps more far-reaching critique has been given to universal indoor climate specifica-tions in general (Waller and Michalski, 2005; Weintraub, 2006; Michalski, 2008). Relative humidity (RH) has been the most discussed parameter of the indoor climate. The opening paragraph of the section on RH from the draft for a new British Standard summarizes the recent critique of the idea of a universal, “ideal” target RH range:
Relative humidity influences the rate of many deterioration mecha-nisms: chemical, biological and physical. Variations in RH can also cause deterioration. Given the different dependencies on RH of these mechanisms, and their variation between collection items, a universally safe RH range and permissible variation for collections cannot be specified. In the past, attempts to extrapolate a universal safe zone by providing conditions required by sensitive objects for all collection items have often resulted in unsafe conditions for atypical collections, as well as leading to an unsustainable use of energy. (PAS 198:2011 draft 2.0)
The quote above recognizes the difficulties in finding a universal safe zone of RH for mixed collections, because of the different deterioration mechanisms at hand. Given that this is only taking into account one factor out of many, namely what is a “safe” zone for the objects, it is clear that universal, strict specifications are of limited value in the individual case. But what are the alternatives? When universal specifications are not applicable or lead to unsustainable practices, there is a risk that they will be substituted by the result of a decision process that is arbitrary, unstructured, uninformed and lacks a holistic perspective.
A sustainable use and preservation of historic buildings requires broad and long-term compromises between social, economic and environmental aspects. The decision context is multi-disciplinary and decisions are elaborated on the basis of both qualitative and quantitative data. There is a need for a structured and transparent approach to the decision-making which minimizes the risk for arbitrary decisions which will have negative long-term impact on energy use, preservation or, in the worst case, both. Decisions about indoor climate control in

Gotland University Press 15
73
historic buildings are often complex, involve a high level of uncertainty and require expertise from diverse fields. Behavioral decision research has shown that individuals perform poorly when faced with complex and multifaceted problems (Simon, 1990), and that outcomes of decisions under uncertainty are systemati-cally biased (Kahneman (et al.) 1982). When confronted with complex problems we try to make them more manageable by reducing complexity. If this is done in an intuitive, ad hoc way, there is a risk that the decisions we make are in conflict with our objectives. “Ad hoc decision-making” in environmental conservation and risk assessment has been characterized in contrast to an ideal decision process (Linkov (et al.) 2006).
Elements of decision process
Ad hoc decision-making
Define problems Stakeholder input limited or non-existent.Generate alternatives Alternatives are chosen by decision-maker usually from
pre-existing choices withsome expert input.Formulate criteria by which to judge alternatives
Criteria by which to judge alternatives are often not explicitly considered and defined.
Gather value judgments on relative importance of criteria
Non-quantitative criteria valuation weighted by decision-maker.
Rank/select final alternatives
Alternative often chosen based on implicit weights in an opaque manner.
Ad hoc decision-making is the norm when it comes to everyday decisions, which we tend to handle in informal and unstructured ways. This is not neces-sarily a problem, as there always is a cost associated with decision-making in terms of time and resources. However, we are convinced that ad hoc decision-making should be avoided when it comes to decisions that are complex and have long-term consequences for sustainability. In order to achieve decisions that are balancing all aspects of sustainability, there is a need for a more structured decision process that fills the gap between strict, universal standards and ad-hoc decision-making. The rest of this article suggests some possible ways to improve this situation.
Strategies for an improved decision process
How can the decision process be improved? Other decision domains deal with similar problems and have advanced further in the development of both theory and application. As suggested by Mason (2002), there are good reasons to transfer some experiences from the field of environmental conservation. Environmental conservation and heritage conservation have similarities both at a fundamental level and in the decision-making and planning processes. At the fundamental, ontological level both fields have to consider the values of heritage and nature, respectively, and how these values can be elicited, incorporated and traded in planning and management processes. Economic frameworks are used in both fields, but it is debated how well they capture both use- and non-use
Table 1. Ad hoc decision-making. Adapted from Linkov (et al.) (2006).

Gotland University Press 15
74
values (de La Torre, 2002; Kalof and Satterfield, 2005). The preferences of future generations play an important role. When it comes to decision-making, the task is to balance risk and reward as resources are almost always scarce. The complexity of decisions is often high, and there is a limitation to quantitative approaches. Involvement of stakeholders in decision-making and the multifaceted relationship between public and private interests are other parallels.
Pollard (et al.) (2008) identified recent progress in the following areas of environ-mental decision-making:
1. incorporation of individual and societal values in risk management,2. comparison and ranking of risks,3. involvement of stakeholders in risk management,4. evaluation of the quality of scientific evidence,5. management of risk knowledge within organizations.
We suggest that these areas correspond well to challenges found in decision-making for cultural heritage management, and that experiences from the field of environmental decision-making should be transferrable. Comparison and ranking of risks is at the core of preventive conservation. This implies that a challenging and important obligation for conservators and conservation scientists has to be prediction of loss of value. Waller (2003) introduced a framework for risk analysis in preventive conservation. The methodology proposed by Waller provides deci-sion-makers with a systematic basis for making risk-based decisions. However, risk analysis has to be integrated in decision-making to be effective. Furthermore, risk analysis in this field will often be both subjective and uncertain, and require both time and resources. With a risk management perspective, the idea of an “ideal” target indoor climate is substituted by deliberate trade-offs between diffe-rent climate-induced risks (Michalski, 2007).
The recently accepted international standard for Risk Management ISO 31000:2009 offers an appealing framework for the management of risks in orga nizations. To comply with the standard, risk management has to be integrated in other organizational processes; it cannot be a separate process. Waller and Michalski (2005) observed a paradigm shift in preventive conser-vation: from a process model to a risk model. These two models co-exists in the new ISO-standard, where the forecasting risk model is used as a framework for decision making and the process model, based on feedback and continuous evaluation and improvement, is used as a foundation for long-term management. We suggest that this standard could be a point of departure for a management framework for indoor environmental control.
The interplay between scientific conservation and negotiation
Is a structured process, as advocated in the previous section, enough to produce good decisions? Given the complex nature of the problem, it is a necessary but not sufficient step.

Gotland University Press 15
75
Indoor climate control is typically viewed as a matter of engineering and conser-vation science; a problem solved with materials science and building physics. But as already mentioned, a multitude of factors which are not mere physics are involved. It is first and foremost the use of the cultural heritage object, be it a collection or a building, which has the primary influence on the outcome of decisions. Guy and Shove (2000) have argued that within the techno-economic paradigm that underpin the majority of economic and technical analyses of energy efficiency there is a clear separation between technical issues and the “human dimension”. Organizations are viewed as entities that actively search for investment opportunities, such as energy efficient technology. The fluctuations of the demand for energy services as well as the fluctuating popularity of different energy efficiency measures are difficult to explain within the techno-economic paradigm, as demand is perceived as something more or less constant, and the popularity of energy efficiency measures are explained with their technical and economic attributes only. The uses of cultural heritage and the consequent demand for energy services are clearly not constant, but highly dependent on conventions and expectations that are constantly changing within society.
Socio-economic analyses have challenged the techno-economic perspective on energy efficiency adoption. Ramesohl (2000) observed that there was a notable inertia in the adoption energy efficient technology in small- to medium-sized firms, due to a lack of an active search for cost-minimizing opportunities. To overcome this inertia and to bring energy issues back on the agenda, four types of triggering impulses where observed: internal problems, e.g. machine break-down; external pressure, e.g. efficiency standards; internal opportunities, e.g. move to a new location; and external incentives, such as awards or programmes. These insights show that there is a wide range of policy initiatives needed to speed up the adoption of energy efficient technology, and that a good decision process is pointless if the energy issues are not on the managerial agenda. Although one should be careful when applying these kinds of results from the private sector to the often highly institutionalized organizations that are caretakers of cultural heritage, it seems to be the case that economic incentives are not enough to improve energy efficiency to sustainable levels.
Muñoz Viñas (2005) criticizes what he labels “scientific conservation”, i.e. the belief that
Conservation techniques should be developed, approved, selected, performed and monitored in accordance with scientific principles and methods, and particularly in accordance with those emanated from the hard, material sciences. Subjective impres-sions, tastes or preferences should be avoided; instead, decisions should be based upon objective facts and hard data.”(Muñoz Viñas, 2005)
The core of Muñoz Viñas’ critique is that there is no universal guiding principle for such a scientific enquiry. A planning process that involves a discussion of values (meaning, significance etc) is necessary to underpin the scientific pursuit and to

Gotland University Press 15
76
make use of its results. This is not unique for cultural heritage management, on the contrary there are problems associated with an overemphasis on science for other applications of risk management. Science informs, but cannot, in a funda-mental way, decide. (Gregory (et al.) 2006). Mason (2006) argues that cultural heritage management should go from the prevailing “problem solving” to more demanding but also more rewarding “decision making”, implying a more holistic and value-driven approach to management. Energy efficiency and indoor climate control should be an apt example of an area of cultural heritage management that would benefit from such a change. It should not mean that “problem solving” will become obsolete, but rather that problems and solutions will be defined and elaborated within a broader context.
Muñoz Viñas (2005) goes further and states that negotiation is the basis of contemporary conservation. Other authors have stressed the need for and benefits of a “trading zone” in cultural heritage management (Sörlin, 2001; Gustafsson, 2007). The trading zone is like a marketplace where the different traditions, languages, values, etc of actors can be handled with a common language of communication. Weintraub (2006) describes how guidelines for the museum environment have transformed into rigid specifications due to the lack of mutual understanding between conservators, architects and mechanical engineers, and highlights the need for good communication skills for all partners involved in the planning processes concerning the museum environment. To succeed in collaboration presupposes an understanding of the decision-making cultures that might be present in the decision process. Guy and Shove (2000) uncovered some perceptions of decision-making within the techno-economic paradigm, where the demand for energy services is perceived as constant, and the role of the decision-maker is to find the optimal technology to meet demand in the most cost-effective way. Criteria and outcomes are quantitative and measu-rable. This paradigm can be contrasted with the culture of decision-making pertinent to cultural heritage management, which in many ways is contrasting. In cultural heritage management the key question is to preserve what, why and for whom? This means that the demand for energy services is far from constant, but a matter of convention bounded in time and place. The mindset is that every object is unique, and that technology has to be adapted to the specific conditions at hand. The criteria for evaluating outcomes are largely qualitative and highly subjective by nature. We have dichotomized the two paradigms in table 2.
Discussion
This article started with a critique of universal specifications for indoor climate control and continued with a discussion of how the decision process could be improved. It was suggested that methods from environmental decision-making could be adopted, based on the argument that the two fields share a set of characteristics that forms the decision-making challenges for both fields. Furthermore, it was suggested that the problems involved are not tractable with a strictly technical agenda – the decision process has to be values-centered and take into account the different discourses, values and cultures of involved experts

Gotland University Press 15
77
and stakeholders. One consequence of this is that more resources should be given to the planning process. Good decision-making requires knowledge, time and money. However, the ubiquitous lack of these resources tells us that the decision-making approach has to be matched with the purpose (cf. Waller, 2010). With higher stakes and more complexity, more resources should be given to the planning process. But tailored solutions are not possible in all cases, and there will always be some need for general recommendations and simple rules of thumb.
Another implication is that a decision process based on negotiation demands a higher degree of transparency and trust between involved parties. It might also change the role of the engineer and conservation scientist to take a more active role in planning by predicting consequences of different alternatives and contribute to the process in an early stage.
Conclusions
In this article, we have tried to open up the black box of decision making in the context of indoor climate control in historic buildings. By disentangling different perspectives of this decision context, we have argued the following:
1. A good decision-making process is essential to fill the gap between universal specifications and ad hoc decision-making. Standards should be directed towards this process, and not give universal answers to specific problems. Standards should accept the complex nature of the problem involved, and guide decision-making accordingly.
2. There is a potential to transfer methods and tools for decision making from other fields, particularly environmental decision-making.
3. Science should not, and cannot, guide decisions alone. Cultural heritage management should be values-centered, and there is a need for a trading zone where the values, norms and perspectives of different stakeholder groups can be negotiated.
Keyword Techno-economic paradigm
CHM paradigm
Mindset Toolbox with standard solutions
Every object is unique
Approach Systematic, linear Dynamic, intuitive, traditionalKey question Best solution to meet
demand?Preserve what, why and for whom?
Rationality Optimization problem Bounded in place and timeObjectives Save energy & money Changes with viewpoint, subjective
Criteria Quantitative, measurable, probabilistic
Incommensurable, qualitative,difficult to measure, uncertain
Table 2. Two cultures of decision-making. A characterization of how professionals can per-ceive and approach the same problem with different perspectives:

Gotland University Press 15
78
Acknowledgement
The present study has been carried out with the support of the Swedish Energy Agency and the Swedish National Heritage Board.
References
Ascione, F., Bellia, L., Capozzoli, A. & Minichiello, F. 2008. Energy saving strategies in air-conditioning for museums. In: Applied Thermal Engineering, 29(4), pp. 676–686.
Bordass, W. 1994. Museum environments and energy efficiency : are our current priorities right? In: Museums, environment, energy. Cassar, M. (ed.). London: HMSO.
Broström, T. & Leijonhufvud, G. 2010. The Indoor Climate in Skokloster Castle. In: Davide Del Curto (ed.). In: Historical buildings as museums. Systems for climate control and heritage preservation. Firenze: Nardini Editore, pp. 84–93.
Broström, T. & Leijonhufvud, G. 2008. Heat pumps for conservation heating. In: Proceedings of the 8th Symposium on Building Physics in the Nordic Countries. Dept. of Civil Engineering, Technical University of Denmark, pp. 1143–1150.
Brown, J. & Rose, W. 1996. Humidity and moisture in historic buildings: the origins of building and object conservation. In: APT Bulletin, 27(3), pp. 12–23.
Camuffo, D. 1998. Microclimate for cultural heritage. New York: Elsevier.de La Torre, M. 2002. Assessing the values of cultural heritage:Research
report. Los Angeles: Getty Conservation Institute.Erhardt, D., Tumosa, C.S. & Mecklenburg, M.F. 2007. Applying science
to the question of museum climate. In: Museum Microclimates. Padfield T. & Borchersen K. (eds.). Denmark: National Museum of Denmark.
Gregory, R., Failing, L., Ohlson, D. & Mcdaniels, T.L. 2006. Some Pitfalls of an Overemphasis on Science in Environmental Risk Management Decisions. In: Journal of Risk Research 9(7), pp. 717–735.
Gustafsson, C. 2009. The Halland model: a trading zone for building conservation in consert with labour market policy and the construction industry, aiming at regional sustainable development. Diss. Göteborg : Chalmers tekniska högskola.
Guy, S. & Shove, E. 2000. A sociology of energy, buildings, and the environment: constructing knowledge, designing practice. London: Routledge.
ISO 31000:2009. Risk management – principles and guidelines. 1. ed. Stockholm: SIS.
Kahneman, D., Slovic, P. & Tversky, A. (eds.). 1982. Judgement under uncertainty: heuristics and biases. Cambridge: Cambridge U.P.

Gotland University Press 15
79
Kalof, L. & Satterfield, T. 2005. The Earthscan reader in environmental values. Sterling, Va: Earthscan.
Linkov, I., Satterstrom, F. K., Kiker, G., Batchelor C., Bridges, T. & Ferguson E. 2006. From comparative risk assessment to multi criteria decision analysis and adaptive management: Recent developments and applications. In: Environment International, 32, 1072–1093.
Mason, R. 2002. Assessing values in conservation planning: methodo-logical issues and choices. In: De la Torre, M. (ed.), Assessing the values of cultural heritage : research report. Los Angeles: Getty Conservation Institute.
Mason, R. 2006. Theoretical and Practical Arguments for values-centered preservation. In: CRM-WASHINGTON, 3(2), pp.21.
Michalski, S. 2008. Social discount rate: Modeling collection value to future generations, and understanding the difference between short-term and long-term preservation actions. In: International Council of Museums. Committee for Conservation. 15th triennial conference New Delhi, 22–26 September 2008: preprints. Vol. 1. New Delhi: Allied Publishers PVT, pp.751–758.
Michalski, S. 2007. The Ideal Climate, Risk Management, the ASHRAE Chapter, Proofed Fluctuations and Toward a Full Risk Analysis Model. Contribution to the Experts’ Roundtable on Sustainable Climate Management Strategies, April 2007, Tenerife Spain.
Michalski, S. 1993. Relative humidity: a discussion of correct/incorrect values. In: International council of museums. Committee for conservation. Triennial Meeting (1993). In: 10th Triennial Meeting, Washington D.C., USA, 22–27 August 1993: preprints. Los Angeles: Allen Press.
Muñoz Viñas, S. 2005. Contemporary theory of conservation. Oxford: Elsevier Butterworth-Heinemann.
Padfield, T. & Larsen, P.K. 2004. Designing museums with a naturally stable climate. In: Studies in Conservation, 49, pp 131–137.
PAS 198:2011. Specification for environmental conditions for cultural collections. Draft 2.0 for public comment. British Standard Institute.
Pollard, S.J.T., Davies, G.J., Coley, F. & Lemon, M. Better environmental decision making: recent progress and future trends. In: Science of the Total Environment, 400(1–3), pp. 20–31.
Ramesohl, S. 2000. Social interactions and conditions for change in energy-related decision-making in SMCs – an empirical socio-economic analysis. In: Jochem E., Sathaye J.A. & Bouille D. (eds.), Society, behaviour, and climate change mitigation. Dordrecht: Kluwer Academic Publishers.
Simon, H.A. 1990. Invariants of human behavior. In: Annual review of psychology, 41(1), pp. 1–19.

Gotland University Press 15
80
Shove, E. & Moezzi, M. 2002. What do standards standardise? In: Teaming for efficiency proceedings, 2002 ACEEE Summer Study on Energy Efficiency in Buildings, Aug. 18–23, 2002, Asilomar Conference Center, Pacific Grove, California. American Council for an Energy-Efficient Economy, Washington DC.
Sörlin, S. 2001. The Trading Zone between Articulation and Preservation: Production of Meaning in Landscape History and the Problems of Heritage-Decisions-making. In: Baer, N.S. & Snickars, F. (eds.), Rational Decision-making in the Preservation of Cultural Property. Berlin: Dalhem University Press.
Waller, R. 2008. Cultural property risk assessment: matching approach with purpose. In: International Council of Museums. Committee for Conservation (2008). 15th triennial conference New Delhi, 22–26 September 2008: preprints. Vol. 1. New Delhi: Allied Publishers PVT.
Waller, R., 2003. Cultural property risk analysis model: development and application to preventive conservation at the Canadian Museum of Nature. Diss. Göteborg : Univ.
Waller, R. & Michalski, S. 2005. A paradigm shift for preventive conservation – and a software tool to facilitate the transition. In: International Council of Museums. Committee for Conservation. Triennial Meeting (2005). 14th Triennial Meeting, The Hague, 12–16 September 2005: preprints. Vol. 2. London: James & James.
Weintraub, S. 2006. The Museum Environment: Transforming the Solution into a Problem. Collections: In: A Journal for Museum and Archives Professionals, 2(3), pp. 195–218.

Gotland University Press 15
81
Simulation of the Energy Performance of Historic Buildings
Torun Widström1* and Magnus Mattsson2
1 KTH, the Royal Institute of Technology, Sweden2 University of Gävle, Sweden* Corresponding email: [email protected]
Summary
In historical buildings, to an even greater extent than in modern buildings, the energy performance is connected to other aspects, such as moisture perfor-mance and damage risks. Here building simulation is of value, but it also faces some challenges in the form of complexity, flexibility and stability that need to be overcome in order to render useful results. This paper suggests a new, serial approach to the simulation process and presents a new simulation tool that makes it possible.
Keywords
Whole building simulation, energy/moisture performance, damage risk assessment.
Introduction
When enhancement of energy performance in historical buildings is considered, it is valuable to be able to analyse the consequences of different retrofitting strategies. A most powerful mean to acquire such analyses is the use of building simulation, but in the case of historical buildings we have several aspects to take into consideration, determining the choice of simulation tool and method.
First of all, we need to recognize that the energy performance of the building is intimately related to several other domains, most prominently moisture perfor-mance and use of the building. This is the case in modern buildings as well, but in the historical buildings it becomes both more emphasised due to often much larger moisture exchange as well as more differentiated use, and at the same time the sensitivity of the buildings and their inventories make the stakes higher, should a less suitable retrofitting strategy be chosen. This means that some simplifications that are made in most available simulation programs, where the moisture performance is assumed to be rather unproblematic and the use of the building standardized, make them unsuited for this kind of simulations.
We can also see that we have at least three different realms to deal with, the building, the users and the artefacts kept within the building, and that these different realms have different sets of criteria that define their most favourable conditions. When we simulate, we thus have to simulate several different aspects

Gotland University Press 15
82
as well as take multiple sets of criteria into account, something fairly few commer-cially available simulation tools are able to accomplish.
Having these different sets of criteria to handle, it is easy to see the situation as conflicting interests pulling in different directions, and that a solution always will be a compromise, not fulfilling any of the preferred conditions of either the building, the users or the inventory, being the least damaging rather than the optimal solution. This conflict of interest is maintained if several simulations, displaying the different aspects separately, are performed, leaving the conclu-sions to be drawn based on a multitude of sometimes contradictory results, having to weigh them against each other manually. In a multi-criteria issue like this, simulations balancing and taking the interdependence of the different aspects into account would therefore be of use, as well as a multi criteria decision analysis.
This can be achieved with some of the tools for scientific use, but the purpose of the use of these tools is the acquiring of new knowledge, not the analysis of any historical building that stand before a decision-making as to how to be retrofitted for enhancement of energy performance or the prevention of damage. Thus the issue is not only finding the tools that can perform the task, but also to find such tools that are available and useful to people active in the field, practitioners that get in direct contact with the historical objects where this kind of decision-making is relevant. This adds to the demands that can be made on the tool, since it also has to comply with the conditions of users subjected to time lines and profitability concerns.
Within the research program Energy Efficiency in Historic Buildings this issue has been observed, and assigned as objective of the subtask related to in this paper: Finding tools and methods for optimal use of building simulation in the process of energy enhancement in historical buildings.
Method
Demands
The first thing we have to do is to determine the demands that can be made on such tools and methods. From the context described above we can conclude that we need the simulations to be as integrated as possible, including as many of the relevant aspects and domains as needed simultaneously. As the buildings often consist of several interacting zones we also need to be able to simulate the entire building in a multi-zonal whole building simulation. In addition to that we need to handle the complexity arising from the diversity of domains and zones as well as that from a larger need of flexibility than usual. The historical buildings, often deviating both in geometry, use and possibilities as far as retrofitting strategies go, require a flexibility in the structure of the computer model in general but also more specifically in the simulation of the proposed strategies, locations, control and types of installations etc, where their modern counterparts can be managed with more standardized conditions. This complexity then has to be balanced against the desired simplicity of use of the model.

Gotland University Press 15
83
More specifically we can define the demands according to category, see table 1. There we can also see the demand of simple calibration, which may be one of the most important points. Given the uncertainties we build into our computer models due to simplifications of geometries and processes, unknown or only partially known characteristics of materials and/or compositions of materials, natural ventilation, existing installations and control-strategies that sometimes are multiple and interact with each other and with the original climatization strategies of the building, the credibility of the simulation is dependent on calibration against measured values. As we know that we do not know every data we make use of to be the one and undisputable truth, we have to turn to reality to adjust the model, and this adjustment require series of measurements that can point us in the right direction in our endeavour to make the model respond to changes in outer and inner conditions in the same way as the building would do. Thus available measuring data is a prerequisite for useful simulations, and preferably long time series and multiple measure points, which might be one of the more difficult points practically in applying a more wide spread use of building simulation as a tool in the process of energy enhancement in historical buildings.
Categories Demands Sub-demands
a. Domain-related EnergyExergyCosts:
Environmental impactComfort and IAQMoistureDamage risks:
Use of resourcesInvestments and maintenanceCultural values
Fluctuations of temperature and RHMould growth riskSalt activityPollution and chemical reactionsLight
b. Scope-related Dynamic/long simulation periodsAssessing alternative strategiesMulti-zonalDisplay overview as well as specifics on behaviour in critical points
c. User-related AccessibleLimited demands on time/computerReliableFlexibleSimple to calibrate
d. Decision-related Clear and unambiguousGathering, balancingQuantifying, facilitating comparisonMCDA
Table 1. Demands on the simulation tools, according to category:

Gotland University Press 15
84
Finding suitable tools
If we look at available tools and methods we find that most commercial software is stand-alone single-domain programs, while within the HAM-simulation field there are tools that comes closer to what we are after. They include the heat and moisture aspect, as mentioned one of the most important ones in historical buildings, and these are integrated, as required by the demands we have determined above. Also, a lot of them are flexible and use state of the art calculations, including the possibility to adjust or choose individually what mathematical description would fit best in a certain case. They are what Grunewald et al (2003) define as research models, as opposed to the simplified models. Grunewald et al also identifies the dilemma of the division in simplified models being available and user-friendly but limited in validity, while the research models deliver more reliable results but are limited in their practical applicability, which is then exactly the issue of the demand for practical usability stated in our demands. However, here we add to that contrast, on top of the usability/validity aspect, as we also require the addition of even more functionality – available only in the research models – and request the flexibility of the research models but in a simplified, user-suited setting.
The suggestion of Grunewald et al (2003) is the creation of an intermediate kind of simulation software, what they call an engineering model, a compromise between the academic models and the simplified commercially available ones, thus also concluding that tools that fulfil that purpose do not yet exist or are at least very scarce. So, in our search for a tool that fulfils the demands formulated, we find that we might have to accept the use of several tools in combination, yet avoiding the drawbacks of multiple simulations rendering multiple answers. We thus have both the search of the tools and the search for a way of combining them to deal with. Again we have to start with our list of what we want the simulation process to achieve.
As whole building simulation is on the wish-list, one of the tools chosen should be a whole building simulation program. However, whole building simulation programs usually, for practical reasons, are one-dimensional. In our case, wanting to be able to study the most critical points as well as the average values, purely one-dimensional calculations are not going to fulfil the functionality demands of our method. Thus we also need a 3D or at least 2D-tool as well, to study the thermal bridges, other specific points or the effects of geometrical simplifications made to make more irregular geometries fit the one-dimensionality of the whole building simulation tool. The results of the 2- or 3-dimensional tool can be used to adjust the whole building simulation model, so that software would have to be included in a first, preparatory step of the simulation process.
The question was then if that would be enough, if the rest of our demands could be added to a component-based simulation tool. It was found that, while several aspects already were included by default in the functionality of the component-based tool IDA-ICE 4.0 and the relatively simple calculations of the exergy consumption easily could be included in that environment, making it a suitable choice as tool number two, the moisture calculations were not as simple to

Gotland University Press 15
85
integrate. The complexity of the software due to its flexibility, a desired feature and one that is not easily added later in the process and thus important to integrate as early as possible in the simulation procedure, make the integration of the more extensive humidity calculations jeopardize the stability of the simula-tions. On the other hand, while the flexibility is desired in the building of the model, as well as in the possibilities to mimic different installations and control strategies, it is not as necessary or even desirable when we come to the humidity calculations. Thus the idea of a serial process was starting to take form.
We may now turn to the reasoning around integration of several domains in building physics simulation as described by Citherlet et al (2001). In their article, they also conclude the need for multi-functionality in software simulating building performance, and identify several different methods to achieve this, as well as the pros and cons of these methods. The models they find fulfil the multi-domain functionality are the coupled and the integrated programs, where the integration is concluded to avoid the disadvantages of multiple models of the coupled software and thereby the potential for errors occurring in the information exchange between those differentiated models. An integrated application, as defined by Citherlet et al, thus contains only one single computer model, handled by an application that can perform the calculations of all included aspects simultaneously.
This would then be the tool we are looking for. However, as we have seen, this tool is not easily found, and if found, not easily handled and/or further extended as our wish-list is to be covered. And as previously stated, possibly it might even be an advantage not to perform all calculations at once, in order to reduce an already large complexity and to increase stability of the calculations. Another advantage of a stepwise calculation may be that an intermediate result could be obtained and calibrated, thus facilitating the calibration and the finding of potential errors before the complexity increases further by the addition of the moisture calculations. So the disadvantage of multiple models may be compensated by the advantage of easier error search and calibration, while a higher stability is achieved. Thus we end up with an approach that fits neither of the models of the Citherlet et al article, as it is not coupled as defined by that article, with parallel and simultaneous calculation and information exchange on every time step, but instead a simpler, serial process, as far as the humidity calculations go – though integrated in parts as the energy, exergy, IAQ and basic comfort calculations all are included in the primary, multi-zonal component based whole building simulation software, in this case IDA ICE.
Let us return to the issue of choice of tools. As mentioned, IDA ICE was in this case chosen as primary whole building simulation tool, due to its component based structure, the flexibility it allows, its ability to simulate different installa-tions and control strategies, the fact that basic comfort, in the form of Fanger’s indexes, and IAQ already is integrated and that exergy easily could be added, plus the ease with which the variables to be used in the next step can be logged and exported. The intention of the approach is that any whole building simulation program fulfilling on these conditions can be used, though, allowing a certain
Gotland University Press 15
86
freedom of choice of tool for the practitioner. Likewise the 2- or 3-dimensional simulation tool, to be used in the preparatory phase, could be any tool that the practitioner has access to and/or feels comfortable to work with. In this case COMSOL Multiphysics was chosen for that purpose. That leaves us with finding a third tool, the one re-simulating the project with the moisture aspect added and summing the results up, including risk damage assessments and indexes. This tool did not exist, and thus MOIRA, (MOIsture Recalculation Application), had to be created.
The new tool, MOIRA
Though the sequential structure of the simulation process is fairly allowing and flexible as a method, there are still simplifications that have been done, also in the new tool MOIRA. The moisture transfer, capillary and diffusive, is dealt with according to the principles of Nevander and Elmarsson (1994). The formula of the moisture content of a node i can basically be summarized as:
where gS, where applicable, is the addition of humidity due to suction of ground moisture, and the diffusive and capillary flows are modified according to saturation of the material.
A further simplification that at times can affect the validity of the results is that though capillary and diffusive transfer through the material is included, convective transfer is not dealt with on the building material level. All convective transfer is gathered in the calculations of the humidity transfer through ventilation, thus air movements through the components is treated as leaks. The validity of this part of the calculations has been checked by turning all moisture transfer through the building components off and comparing the result to IDA, which does calculate moisture transfer trough ventilation. The results were found to be matching. However, by thus separating the convective transfer from the building compo-nents, potential condensation and/or evaporation due to air flow through the materials is not accounted for.
Another potential error source that will have to be addressed in further development of the tool is that the effect of precipitation being sucked into the materials of the building envelope is not included in the calculations, this is due to the fact that the data on local precipitation was missing and it thus did not seem possible to include it at this point. This may however account for some devia-tions especially in the crawl space in the case study carried out, where surplus amounts of moisture is being noted in the measured RH values compared to calculated values on days that have been known to be rainy.

Gotland University Press 15
87
Combining 1D-simulations and study of critical points
As previously concluded, whole building simulation programs are generally one dimensional and deliver only average values for the zones as well as the component surfaces. But we want to know of the conditions at the most critical points, where problems are most likely to occur, and we want to be able to study this over time so that the fluctuation and duration patterns are revealed. MOIRA and its simulation process make use of something we call the very small wall part method, which divides the calculations of additional heat flow due to thermal bridges from the study of the conditions at the critical points. IDA ICE contains a possibility to numerically enter data for the calculation of additional heat flow due to thermal bridges and also offers rudimentary approximated values if one should choose to use them. The use of a multi-dimensional tool like COMSOL Multiphysics allow us to find more correct Y -values to enter into that form in IDA, which solves the heat flow part of the issue, but we are still not able to register the conditions at the points that are the most vulnerable, to achieve that we must turn to the second part of the very small wall part method – the very small wall parts. In IDA there is a possibility to separate a part of a wall and give it other properties than the surrounding structure. This can be used to make the model mimic the behaviour at the critical points, by creating very small wall parts that are given such properties – according to the COMSOL Multiphysics simulation – that their performance correspond to what happens at the most extreme points. In IDA, these wall parts must be made very small in order to not affect the heat balance, while when they are subsequently imported into MOIRA they are treated as exposed to the conditions of the ambient climate as well as the zonal but not contributing to the indoor conditions. By this division of the treatment of thermal bridges and the use of the very small wall part method, we can get a picture of the behaviour of the most vulnerable points as well as other points of our choice, although we operate within a one-dimensional simulation environment.
Summary of the phases of the simulation process
We can thus define three distinct phases of the serial simulation process as suggested in this paper: preparatory phase, primary simulation phase and secondary simulation phase. The nature of these phases is summarized in table 2.
Phase Delivers
a. Preparatory Measure series, ambient and zonal, existing installations and control strategies, uses, routines, schedules, material data, component measures and build up, geometry, behaviour of thermal bridges, inventory of problem and/or especially sensitive areas
b. Primary Energy and exergy usage, results on temperatures, averages as well as specific for critical points, air flows, IAQ, Fanger’s comfort indexes
c. Secondary Additional energy and exergy usage, moisture contents of materials and RH of zones as well as at critical points, mould risk curves and indexes, fluctuation patterns Possible future extensions: Salt activity, cost analysis/MCDA
Table 2. The phases of the serial simulation process:

Gotland University Press 15
88
The case study: Hamrånge church
The method was tested in a case study and validated against the measured values of that study. The object was Hamrånge church, a stone church from the 1850’s, with a church room of about 8750 m3, a moisture troubled crawlspace and a wooden floor separating it from the church hall, a wooden barrel-vaulted ceiling, relatively large windows and large wooden pillars. It is heated by electrical radiators under the pews and windows, and the present heating strategy is a minimum of 12 °C during the week and a service heating Friday – Sunday where a minimum of 18 °C is kept. The church hall itself has not displayed any signs of mould issues, but the crawl space has and that as well as the relatively large energy usage has caused concerns. Today there is one passive strategy being tested, and that is to close the crawl space vents, a strategy that the simulations then has included as one of several potential scenarios. The scenarios that have been simulated in this study are:
• Sc 0: Status quo, as it was before the closing of the vents• Sc 1: Crawl space vents closed• Sc 2: Vents closed first half of the year, open the latter part• Sc 3: An absorption dehumidifier installed in the crawl space
Results
The energy usage as calculated in the different scenarios can be seen in table 3.
Table 3. The phases of the serial simulation process:
Scenario Sc 0 Sc 1 Sc 2 Sc 3Energy usage, kWh 132 420 128 590 129 760 141 170Difference, % - –2,9 –2,0 +6,6
The first result to study is the validation of the performance of the new tool, MOIRA, seen in figure 1 and 2. We can conclude that the scenarios 1, 2 and 3 all lower the humidity of the church hall during the first half of the year with about 3 – 5 %, although the humidity of that room never did reach any risk levels, mainly staying under 50 % RH – thus this reduction was not necessary. The crawl space tells another story, however. There the humidity levels are dangerously high with respect to the risk of microbiological infestation, especially compared to the temperatures, a fact that scenario 1 is not able to amend.
Scenario 1 slows down the raise of the RH during spring but ends up in June at the same level as the status quo scenario, only at times with much higher RH at the thermal bridges and this at higher temperatures, seen in figure 3, making the risk of mould growth worse than it was before. Also, while scenario 2, where the vents are opened at midsummer to ventilate away the moisture captured in the crawl space, adjusts its levels to fairly equivalent to that of the status quo scenario, scenario 1 continues to increase, generating even higher RH during the otherwise less dangerous late fall period, which can be seen in figure 4.

Gotland University Press 15
89
Fig. 2. RH in crawl space as calculated by IDA, MOIRA and compared to measured values during one week in November.
Fig. 1. RH in church hall as calculated by IDA, MOIRA and compared to measured values during one week in November.

Gotland University Press 15
90
Fig. 3. RH in crawl space for scenarios 0, 1 and 3 (2 is identical to one here) for June.
Fig. 4. RH in crawl space for all scenarios for a week in November.

Gotland University Press 15
91
The results of the risk curve analyses will unfortunately not be included here due to space limitations.
Discussion and conclusions
The case study
There are a couple of levels of conclusions to be drawn in this case: conclusions on the method and conclusions about the different scenarios in the case study. Starting with the latter, we can see that scenario 0 shows that the church hall as such is not affected by any moisture issues, but that the crawl space – as expected – is, however, as far as mould growth goes it is most of the time kept out of harm’s way due to low temperatures.
Scenario 1 does reduce the humidity of the church hall, but not by reducing the humidity of the crawl space but rather by the reduced air flow from the crawl space to the church space. On the contrary, during much of the year it increases the humidity in the crawl space, partly by the entrapment of moisture from the ground and partly because of the lack of possibility to get rid of moisture that does enter through the outer walls, but it is doing so while the temperature is kept slightly higher than in the status quo scenario, thus considerably increasing the mould growth risk. Thus this scenario, while enhancing the energy performance slightly, worsens the moisture issue of the crawl space instead of amending it.
Scenario 2 is in that case better. It does not reduce the energy usage particularly much, yet considering the lack of investment cost it must still be said to be a cost-effective measure. It does reduce the RH of the church hall in spring, like scenario 1 through reduced air flow from the crawl space to the church space, not really from a reduction of moisture in the crawl space, but as scenario 1 it slows the increase in RH down and avoids the peaks of condensation that can take place at sudden raises of the ambient temperature, when warm moist air meets the still cold crawl space surfaces. Hence peaks are kept down and the RH increase during spring is more slow and steady than in the status quo scenario, but apart from that it does not reduce the humidity noticeably, but, as in scenario 1, keeps it at a slightly higher temperature, thus again increasing mould growth risk – though not to the extent that scenario 1 does, as it only does so during part of the year.
Scenario 3, featuring an absorption dehumidifier, set at 60 % RH, keeps the mould growth risk down all the year and reduces the heating demand in the church hall slightly, due to the modest increase in temperature in the crawl space that it – and of course also here the closed vents – causes. Unfortunately, only fairly little of the heat generated by the dehumidifier is of use in this respect since most of it is generated outside the heating season. And the gain that is achieved is of course only a small portion of the energy usage of the dehumi-difier, wherefore this scenario, though effective on the moisture issue, requires an increase of the energy usage instead of a reduction. And even that increase is fairly modest.

Gotland University Press 15
92
We can conclude that none of the simulated scenarios had the intended result – enhanced energy performance as well as reduced moisture issues – and neither did any of them offer any substantial enhancement possibilities for the energy performance. The dehumidifier could be considered a potentially valuable investment to eliminate the mould growth in the crawl space, but enhancement of the energy performance must be sought elsewhere, potentially though friendly heating, heat pump technology of other alternative strategies that were not part of this study.
The simulation process
The process can be said to have been functional and displaying good agreement with measured values in this case. It is fast and the stability is good, provided that the time steps are kept within limits. It is possible to log variables according to preference and more functions can reasonably easily be added.
However, more validation is needed, the issue of the choice of moisture transfer potential should be resolved and hysteresis implemented. The tool does not yet fulfil the demand on accessibility and simple handling as user interface is still missing and the version handling, essential for the comparison between different scenarios, must be improved.
As a conclusion it can be said that the method as well as the new tool, MOIRA, are working and fulfilling their purposes but that it is still a process at an experi-mental stage that requires more work before it can be tested on “real” users.
Acknowledgements
We thank Professor Tor Broström, Gotland University, coordinator of the research program Spara & Bevara, which this study is a part of, and its financers the Swedish Energy Agency and The Church of Sweden. We also thank Professor Folke Björk, Assistant Professor Kjartan Gudmundsson, PhD student Marco Molinari, Senior researcher Per O Isaksson, and Professor Emeritus Ove Söderström, all at KTH, for their valuable contributions as sounding board for this work. We are also very indebted to programmers Carl-Johan Wägner and Torbjörn Lindh, for their generous assistance.
References
Citherlet, S., Clarke, J.A. & Hand, J. 2001. Integration in Building Physics Simulation. In: Energy and Buildings, Vol. 33 No. 5, pp. 451–461.
Grunewald, J., Häupl, P. & Bomberg, M. 2003. Towards an Engineering Model of Material Characteristics for Input to Ham Transport Simulations – Part 1: An Approach. In: Journal of Thermal Envelope and Building Science, Vol. 26 No. 4, pp. 343–366
Nevander, L.E. & Elmarsson, B. 1994. Fukthandbok, Praktik och teori. 2nd ed. Stockholm, AB Svensk Byggtjänst (Sweden), 538 pages.

Gotland University Press 15
93
Energy Efficiency in Historic Timber Buildings
Eir GrytliNorwegian University of Science and TechnologyCorresponding email: [email protected]
Summary
Faculty of Architecture, NTNU, has a long tradition in training architect students in building conservation. During the last decade, the environmental impact from buildings has become an increasingly important focus at the faculty. When it comes to existing buildings, sometimes the ideal environmental solutions are not compatible with conservation interests, especially concerning energy saving measures for heating. The faculty now tries to combine these two concerns by looking into the interface between heritage and energy conservation. One approach is documentation of the environmental performance of existing buildings compared to demolishment and rebuilding. Another is strategies and methods for reducing energy loss from historic building without interfering with their historic integrity. In this paper, which has focus on timber buildings, some results from research and master projects in building conservation with an environmental focus are presented.
Keywords
Energy efficiency, timber buildings, historic buildings, architecture, life cycle analysis, historic windows.
Introduction
Reducing energy consumption from the building sector is one of the major aims for reducing the human-induced impact on the environment. In order to respond to the UN Climate Panel requirements, Norway is aiming at reducing the GHG emissions by between 15 and 17 mill tonnes by 2020. The building sector roughly accounts for 14 % of the total Norwegian CO2 emissions. A considerable amount of national research is carried out on reducing the environmental impact from buildings. At the ZEB (Zero Emission Buildings) Centre at NTNU, Trondheim, research is carried out for development of buildings that can compensate for CO2 emissions from the production of materials and construction by producing more energy than the building uses for operation. (ZEB, 2009)
So far, most research has been focusing on new buildings, and often on high-tech solutions, and new building materials and components. However, a big amount of the buildings of the future are already built. In Norway, about 70 % of the total building stock floor area in 2050 already exists today. The existing building stock will also have to relate to the stricter demands on energy consumption. EU Energy Performance certificates were launched in Norway in 2010. Requirement for documentation of energy performance will most likely influence the value of

Gotland University Press 15
94
buildings and properties. Buildings with a low score might be more difficult to sell and to rent. Thus, energy improvement of existing buildings is a major task both for the sake of environment and for keeping up their value and attractiveness.
“Climate Cure 2020 – Measures and Instruments for Achieving Norwegian Climate Goals by 2020” (Norwegian Government) recommends that passive house levels for energy use should be required for major upgrading projects within 2015. “Passive House” is a German concept requiring air-tight building envelope, super insulation, low U-value windows and balanced mechanical ventilation system with heat recovery. The heating demand should not exceed 15 kWh/m²/year. Upgrading aiming at passive house levels is a big challenge for historic buildings, because uncritical energy improvement actions can affect their aesthetical and heritage values severely.
Fig. 1. Myhrerenga cooperative housing, Skedsmo, constructed 1967–68. Norwegian pilot project for passive house refurbishment (2009–2011). What if this will be the standard for treatment of all existing buildings?
Improvement of Energy Efficiency – a Case Study
In 2004, SINTEF carried out a study on energy efficiency in existing domestic buildings.
The aim of the project was to study methods for reducing energy need that are not conflicting with conservation interests. The study focused on energy for heating, as this represents the far largest energy consumption in domestic buildings. The study resulted in a practical user manual for owners of existing

Gotland University Press 15
95
buildings on methods for saving energy without destroying or interfering with the historic integrity of the building. (SINTEF, 2004)
The project was carried out as a model study on six representative Norwegian domestic building types. Initially, the buildings were documented regarding construction, materials, floor plans and use of space, energy systems, and how the residents/owners experienced the indoor climate conditions and energy consumption. Energy calculations were made “as-found” for the model buildings.
The next step was a discussion on acceptable improvements on the building envelope with regard to preserving the historic integrity of the building. The most adequate measures were selected for each building and new energy calculations were made based on the implementation of these measures. Results proved that one may achieve an energy reduction of more than 60 % by using simple, non-destructive measures with very limited influence on the character of the building.
However, still the operative energy demand for the model studies was higher than the demands of the present buildings regulations for comparable new buildings. In fact the building regulations do not demand that historic or older buildings have a similarly low energy use as new buildings other than when a major upgrading of the building is made. But, in order not to treat older buildings as special cases, we chose to let the demands for new buildings be the benchmark for the models studies.
In the last part of the model study we therefore looked at the possibilities of imple-menting local production of renewable energy as a supplement for the lacking energy efficiency compared to new buildings: Heat pumps from different energy sources, and active and passive solar energy systems.
Fig. 2. In this log building in Trondheim from the 1830s, the study indicates that it is possible to obtain an energy reduction of 61 % by implementing only the four lowest steps in the pyramid.

Gotland University Press 15
96
In the conclusion we recommended that planning energy efficiency improvement for existing buildings should be made according to a list of priority, where the simplest means with the lowest consequences should be implemented first – sealing of draughts, insulation of roof and floor, improvement of windows, tempe-rature management – before more costly and complicated measures like installing new heating/ventilation systems and change to more environmental friendly energy sources. Regarding installing local energy production systems, these may also make demands on the surroundings or demand intrusions, dependent of the properties of each individual building. This must be discussed as a case by case measure. (Grytli and Nypan, 2008, p. 243)
Energy improvement of windows in historic buildings
Changing windows to new, low-energy window types is often one of the first advices that are given for reducing energy loss from existing buildings. This may conflict with conservation interest, as original windows are important architectural elements for a historic building. It has been maintained that heat loss through the windows counts for about 40 % of the total from a building. This number, however, does only include the heat loss from transmission, not from infiltration and ventilation. In practice, this number will vary a lot. Other estimates indicate that windows may count for 10 % of heat loss.
Windows produced for optimal U-value requirements, with triple glass layers and insulated frames, are heavy and must have formats and dimensions which differ a lot from the slender dimensions in original, coupled windows. Change of windows will have a substantial visual effect on exteriors and interiors.
In 2009, English Heritage conducted a study on traditional sash- and case-windows where measurement were made of heat flows through a timber-framed, single-glazed sash and case windows with an as-found U-value of 4,3 W/m²K (glass and frame). The study showed possible results of simple, non-invasive measures:
• Use of traditional curtains, blinds and shutters alone may reduce the energy loss by 50 to 60 %;
• Simple draught proofing by repairing cracks and eliminate gaps can significantly reduce the air infiltration. In a sash window in good condition, it can be reduced as much as 86 %;
• Adding secondary glazing can give a U-value of 1,7 by using an efficient system incorporating low-emissive glazing with aluminum frames. By using insulating frames (for example timber) further savings could have been made. (English Heritage, 2009.)
Master projects on conservation and energy saving at NTNU
Building conservation is one of several specializing fields within the Faculty of Architecture and Fine Art at NTNU. Environmental impact from the built environment is another, increasingly important field within the Faculty, which has since long been a leading research environment on solar energy in buildings.

Gotland University Press 15
97
In 2010 an international Master program in sustainable architecture was established, which also includes studies of existing buildings. This offers new possibilities within the Faculty for addressing the possible contradictions between energy saving and conservation, and focus on common goals.
In 2010, two master projects made cross-disciplinary studies on urgent issues regarding conservation and sustainability: “The Eyes of the Building” – Energy improvement of historic windows. (Hopen, 2010)
Following up the English (and other) studies in a Norwegian context, a 2010 master student at NTNU made a case study on original windows in historic buildings aiming at studying non-invasive actions for reducing the heat loss through the windows. The study concentrated on various use of secondary glazing/double glazing. Four buildings, all with original windows and formally protected (listed or in a conservation area) were selected and calculations were made for several alternatives for one sample window from each case.
In addition to the energy calculations, the study discussed effects of the different measures on other vital parameters regarding historic windows: Degree of non-reversibility, aesthetics, functionality, and effects on indoor daylight and visual experience from the inside out.
Fig. 3. Original windows are significant architectural elements, often with high-quality materials and excellent detailing. Secondary glazing systems are often part of the original window.

Gotland University Press 15
98
The study concluded by recommending solutions for each case that turned out to be most successful regarding all the different parameters assessed. Regarding energy use, the calculations proved that significant reductions could be obtained. In one example, a double glazing system with a frameless extra
Fig. 4. Energy calculations showed that the energy per-formance could be improved significantly, for example by mounting double glazing with low-emittive panes. The illustration shows use of Opto-Glas, a Danish frameless system. Photo: Ingun Hopen.

Gotland University Press 15
99
pane with low-emittive glazing, a U-value of 1,9 W/m²K could be obtained – a reduction from 4,6 W/m²K for the original single glass window. This solution is also assessed the most favorable for most of the other parameters.
“Thingvalla teller” (Thingvalla counts) – A study of environmental and heritage consequences of upgrading of historic buildings (Kværness (et al.), 2010)
Fig. 5. The huge amounts of waste from demolishment of timber buildings in Trondheim in the 1970s.
Norwegian statistics on waste from the construc-tion sector. Left: New constructions. Middle: Refur-bishment of existing buil-dings. Right: Demolish-ment. Source: Riksantikva-ren.
Is reuse of existing buildings wise resource management? What are the effects from different energy improvement measures on existing buildings– regarding technical, aesthe-tical and historical properties? These questions were addressed in a Master thesis made by three students at Faculty of Architecture and Fine Art, NTNU, October 2010. The students were rewarded a price for outstanding and innovative Master projects in architecture from the Directorate of Public Construction and Property (Statsbygg).
The starting point for the study was a recognition that a building represents an impact on the environment; not only in the service life period and not only due to energy consumption, but through its entire life cycle, from the construction phase including transport

Gotland University Press 15
100
and production of components, to the demolishment phase including transport and processing of waste. By using a life cycle analysis approach, they wanted to learn more about the total environmental performance of a historic building than only from the negative reputation caused by the high energy use in the service phase.
The case for the study was an 1890 timber frame apartment building in Trondheim, owned by the University, presently uninhabited due to poor and illegal technical condition. The University is planning to upgrade the building and use it as apartments for guest researchers.
The building was measured and digital plans were produced, and inventories for materials, components and surfaces for each single room, structure and exterior were produced, enabling quantification of all materials used in the building for calculating environmental impact.
Fig. 6. Work plan.

Gotland University Press 15
101
Fig. 7. The case for the study was an uninhabited 1890 timber frame apartment building in Trondheim, owned by the University. The University is planning to upgrade the building and use it as apartments for guest researchers.

Gotland University Press 15
102
Then different energy reduction measures were discussed, both single measures and in upgrading “packages” – one package being a combination of measures for basement, wall, windows, roof et cetera; which could constitute a comprehensive upgrading project. The “packages” corresponded to the following energy perfor-mance levels,• minimum intervention according to current building regulations,• TEK10 (the revised building regulations), and• Passive House levels.
Fig. 8. The pictograms indicate all the different energy saving measures that was assessed in the study. In the right row, the “packages” of combinations of measures are indicated. NyP and NyT in the bottom indicates the new constructions with TEK10 and Passive House levels.

Gotland University Press 15
103
In addition, to compare the results with demolishment and rebuilding, two projects for a new building were made with the same footprint and volume
• with TEK10 levels and• Passive House levels, using a Norwegian pilot project as reference.
For each alternative, three different analyses were carried out:
Energy calculations, using SIMIEN 4.505, a Norwegian calculation tool developed for the Norwegian Standards for energy performance.
Life cycle analysis, using SimaPro 7.1.8 Multiuser, a Dutch calculation tool not developed for buildings especially, but frequently used in industrial ecology. SimaPro is linked to the database Ecoinvent 2.0, with environmental data for energy, transport, building materials, waste processing and other environmental parameters.
Assessment of the consequences for heritage values for the different energy saving actions. This was based on a heritage valuation of the building using an
Fig. 9. All analyses combined. The longer the bars, the more negative impact.

Gotland University Press 15
104
evaluation system from the Directorate for Cultural Heritage (Riksantikvaren). Criteria used in the assessment were: – Is the action reversible? – Is the action visible? – Does it affect the interior or the exterior? – For interiors: What is the use of the room? – For exteriors: Towards the public or the backyard?
Finally, all analyses were put together in order to study the relationship between energy improvement, total environmental impact and protecting heritage value. This synthesis indicates that it is difficult to obtain the most ambitious goals for energy loss reduction without damaging the buildings visually and as cultural heritage. The life cycle analysis confirms that it is the energy use in the opera-tional phase that also represents the heaviest burden on the environment through production of energy. On the other hand, it is necessary to look more closely into the parameters used; as some of them might not be relevant, for buildings or for Norway (e.g. land use for producing firewood is an environmental parameter which might be relevant in the Netherlands, but not in Norway).
Conclusions
• Energy use in the operational phase is important and for making a historic building environmentally sound, measures should be taken to reduce the energy need
• It is possible to reduce the energy loss considerably with invisible and reversible measures
• For heritage buildings, “almost good” energy saving solutions taking historic values into account should be accepted instead of forcing passive house ambitions on them, in order to protect “intangible” environmental values embedded in them.
References
English Heritage 2009: http://www.climatechangeandyourhome.org.uk/live/content_pdfs/579.pdf
Grytli and Nypan 2008: http://www.uni-muenster.de/Forum-Bestandserhaltung/downloads/CHRESP_2008_LJUBLJANA.pdf p.243.
Hopen, I. 2010. Husets øyne. Energiforbedring av verneverdige vinduer. Master thesis in Architecture, Faculty of Architecture and Fine Art, NTNU 2010. Not published.
Kværness, L.N., Rokseth, L.S. & Ygre, K.F. 2010: Thingvalla teller. Master thesis in Architecture, Faculty of Architecture and Fine Art, NTNU 2010. Not published.
SINTEF 2004: http://www.sintef.no/static/bm/fiin_gammel_aargang.pdfZEB 2009: http://www.sintef.no/projectweb/zeb/

Gotland University Press 15
105
Energy Efficiency and Preservation in our Cultural Heritage – EEPOCH
Heidi Norrström and Michael EdénDepartment of Architecture, Chalmers University of Technology, Gothenburg, Swedenemails: [email protected]; [email protected]
Summary
EEPOCH concerns the complex set of problems that hold between energy efficiency and preservation perspectives in our built heritage. With new legisla-tions and demands on energy performance, issues have arisen on how to meet them. A potential for energy efficiency actions has been stated but can this be carried out without endangering the historic values? What is possible from technical and historical views? Can laws and regulations guide us? This will be looked into by means of a multiple case study with a transdisciplinary approach.
Objects for case studies are chosen within the regional co-operation project, the Halland Model. It started in the 1990s recession. The aim was regional growth, and strengthening competitiveness, sustainability and development of building conservation. The restored and preserved buildings, though, have so far not been evaluated regarding their energy performance. Two of them will be presented in this paper.
Keywords
Case study research, energy efficiency, built heritage, building regulations.
Introduction
Summary of the Halland Model
The County of Halland is situated in the south of Sweden. In EEPOCH objects for studies are chosen within the concept Halland Model, a regional joint venture, initially created for preservation of historic buildings and started in the 1990s recession. Over 1100 construction workers and apprentices were trained in tradi-tional building techniques operating in about 100 historic buildings at risk, under supervision of skilled craftsmen and conservation officers. “Save the jobs, save the craftsmanship, save the buildings” was the very first motto of the scheme. It soon developed into a regional cross-sector joint-action network aiming at sustainable growth including strengthening competitiveness, use of renewables, recycling of materials and development of building conservation.
In Christer Gustafsson’s dissertation (2009) on the Halland Model an application-oriented theoretical platform and a new model, providing adequate approaches to solving boundary-spanning challenges is presented. A generic and entrepre-neurial model is developed where the “trading zone” is defined as an active arena

Gotland University Press 15
106
for negotiations and exchange of services or a field of force corresponding to the actors’ policies, values, facts and resources.
After the completion of conservation work the improved premises made new functions available. They were seen by entrepreneurs as resources to be taken advantage of and develop. This is one of many added values which have come out of the concept.
Both preservation and energy efficiency have been taken into account in the conservation work. The Halland Model holds examples on managing of energy performance without diminishing the cultural value and social history in our built heritage. Thus the Halland Model is appropriate for further research.
Background to EEPOCH
When starting the”million programme” in Sweden 1965 one million flats were built in one decade. This was a parting point where the epoch of craftsmanship altered into the industrial era with prefabricated parts mounted on the construction-sites. Simultaneously a great part of our built heritage was demolished. Hence Sweden has a young building stock. Habitations constructed before 1945 only amounts to about 33 %. (Boverket 2004). It is the built environment constructed before 1945 that is studied in this research project.
During the 1960s and later in the 1970s oil crisis, when refurbishment were subsidised, many mistakes were made. Our Swedish stock of insulated and plate covered buildings emanates from these years and on. There is a need of guidance on efficiency in the sector. According to the Swedish governments Environmental Objectives Council (2009) the cultural, historical and architec-tural heritage as buildings and built environments with special values should be protected, developed and identified latest in 2010. In Halland the inventory points out over 10 000 objects, to be compared with the earlier 3 000. Similar results will most likely appear in the other regions.
About 36 % of Sweden’s total energy use, and connected environmental impact, lies in the residential and service sector (Energimyndigheten 2009). On European basis the sector is consuming 40 % of the total energy use and in an EU-perspective the need of imported fossil fuels is a problem. The 50 % of today will have increased to 70 % in 2030 if actions are not taken (EC 2007). Many directives have been formed due to this fact. The potential is pointed out in the existing building stock. On EU and national level energy efficiency is considered a key action.
In this context two questions emerged. Will cultural and intangible values in our built heritage be lost in advantage to measurable and tangible energy efficiency actions? Is there a risk that emphasis on cautiousness in our built heritage, makes actual energy efficiency potential not being realised?
• Through generic research in EEPOCH, the case studies will form a foundation for a theoretical model directed on application for integrated balancing of energy and preservation demands, without diminishing tangible and intangible values in our built heritage.

Gotland University Press 15
107
• Through qualitative research in EEPOCH, the methods used within and between connected professions and academics, will be illumi-nated and especially their transdisciplinary and interdisciplinary approaches.
Methods
The chosen methodological framework is a multiple-case design with embedded multiple units of analysis according to R. Yin (2009). The theoretical model for balancing of demands will emerge from the cases of which some will show predicted similar results (a literal replication) and some predicted contrasting results for anticipatable reasons (a theoretical replication). Units of analysis are the restored objects, their energy performance and their historic values and the people, organi-sation and methods in use during the conservation work. The latter part includes interviews and will be carried out this spring. In brief it is about using pattern matching and analytical means to generalize sets of results to broader theories.
Preserved historic values: Data for analysis are collected from archive files, reports, documents and photos, from the evaluation of physical artefact in situ and from people engaged in the conservation work. The Swedish National Heritage Board’s handbook, Unnerbäck 2002 is used for assessment in situ. Basic and enhanced motives for preservation have been registered by the investigator and a conservation officer and compared with earlier inventories to enhance the construct validity by using multiple sources of evidence.
Energy performance: The evaluation is carried out in four ways: With IR camera in situ, with computerised (BV2) and manual calculations on their energy balances, and by measuring actual energy consumption. Differences in these figures can show good maintenance but could also detect problems indicating actions to be taken and show what can be improved. When preparing for the manual calculations eight different books and guides have been used: Adalberth (2008), Adamson (et al.) (1986), Anderlind (et al.) (2006), Boverket (2009a), Boverket (2009b), Elmroth (2009), Petersson (2009) and Wärme (1991). No calculation model is without flaws but the strength is in using the exact same procedure in every object for an accurate comparison between them, ensuring the reliability of the case study.
For further input and to root the case in approved practice and theory, a reference group, an expert group, and local companies are connected to the project participating in workshops, providing facts, expertise, experience and advice. Findings from the 1st workshop is part of this paper, and the question of what is possible due to laws and regulations occurred when practice and problems were discussed, hence the embedded unit of analysis presented in this paper.
Results
Review of legislation concerning extensions and other alterations in buildings
Our officially protected monuments with high historical and cultural values are quite well managed and protected by the Heritage Conservation Act

Gotland University Press 15
108
which includes buildings, ancient remains, archaeological finds, ecclesiastical monuments and specified artefacts (RAÄ 1988).
However all buildings are important for the overall experience of a neighbourhood or a region. They may not be ancient or distinctly characterised still they serve as documents of the history and as cultural layers of development. Are these documents protected? Here follows a review regarding practice of building permits and the demands on energy efficiency and historic values.
Fig. 1. Hierarchical scheme on legislation to respect in actions regarding historic values and energy efficiency in buildings.
Boverket mentioned in this paper is the Swedish National Board of Housing, Building and Planning. Steering documents for managing the historic values in built environment are found in PBL, Ch. 3 and 5, the BVL and BVF, and in BÄR. Corresponding for energy issues are PBL, BVL, BVF and BBR in Ch. 9. The regulation on energy declarations and parts of the Environmental Code, MB, do also have an impact on both aspects but will not be discussed here.
The new PBL coming into force May 2nd 2011 still have the demand on cautiously made alterations in historic buildings but now in Ch. 8, Sec.17 and the prohibition of distortion of historic built environment is now in Sec.13 and on maintenance in Sec.14. The new PBL includes almost all of the content in BVL which repeals May 2nd 2011.
PBL, BVL and BVF concerns all types of construction work. BBR concerns buildings, new ones and extensions (i.e. when the buildings volume increases). BÄR is on other alterations than extensions. This collection of general recommen-dations is connected to laws and regulations. BÄR is not mandatory but advices on how to act according to the legislation. If the general recommendation is not followed there is still an obligation to show that the demands in the legislation are fulfilled. (BBR p. 18)

Gotland University Press 15
109
The table 1 above (table 9:3a from BBR) is showing the demands for new premises not heated with electricity. Premises with electric heating, in climate zone III, south of Sweden, should manage on 55 kWh per m2 Atemp and year. The attached general recommendation declares that more electricity and higher need for power can be accepted if special circumstances can be proved e.g. “…-if the demand on specific energy use isn’t possible to fulfill due to cultural and histori-cally motivated limitations. In this condition the values may not be exceeded with more than 20 %.” which in this case means 66 kWh per m2 Atemp and year.
For dwellings the corresponding demands are 110 and 55 kWh per m2 Atemp and year, with the same possibility of addition. An alternative demand on a buildings energy use in Sec.9:4, based on U-values, concerns buildings with less than 100 m2 Atemp.
To ascertain how the legislation is applied a national civil servant and five municipal officials in Halland have been contacted. The same questionnaire-like queries have been put forward to all at meetings (3 conversations) and on the phone (3 calls). Some of the answers are summarized here.
Question: How do you interpret and judge permits by the mandatory provisions and general recommendations in BBR and BÄR? Especially Ch. 9 on energy efficiency, Sec. 9:2 Dwellings, 9:3 Premises and the general recommendation about 20 % deviations at special circumstances? And the general recommen-dation in section 4, 4.6 on energy efficiency and insulation in BÄR?
One of the answers: “Even if it’s an extension, considerations are taken to histori-cally valuable buildings. It isn’t always right or easy to insulate properly to achieve the 110 kWh/m2, year + 20 % prescribed in BBR.”
All answered similarly. They rather consider cultural values than making unreaso-nable demands on energy efficiency which are impossible to fulfill. Usually they enlist the help of Heritage Halland and their conservation officers in individual cases to assess the historic values. Sometimes though, they don’t agree and the Building committee must e.g. decide on demolition. At extensions less than 50 m2 there is no energy demands. Between 50 and 100 m2 the U-values in BBR Sec. 9:4 can be used instead of measured figures. But the energy demands are hard
Climate zone I II IIIThe buildings specific energy use [kWh per m2 Atemp and year]+ addition when the flow of hygienic reasons needs to be more than 0,35 l/s per m2 in conditioned spaces. qaverage is the average specific supply flow during heating season and may only count for up to 1,00 [l/s per m2].
140 110 (qaverage –0,35)
120 90 (qaverage –0,35)
100 70 (qaverage –0,35)
Average heat transfer coefficient, [W/m2 K] 0,70 0,70 0,70
Table 1 is the same as table 9:3a Premises with other heating than electric heaters in BBR. (BFS 2008:20).

Gotland University Press 15
110
to interpret and follow because of all different parameters. In the municipalities there is a wish for more clear and simple legislation.
Extensions in existing built environment
In many old buildings electric heaters are installed to avoid water-pipes and space consuming boilers which affect the interior. According to BBR the demands when using electric heating in extensions is 55 kWh/m2 Atemp and year and 66 kWh/m2 Atemp and year with the 20 % addition.
It can be hard though, to design the appropriate character for a new extension following the energy demands. What does this imply for our existing built environment? Statistic on available key figures shows considerable higher figures for existing constructions built with old techniques.
Fattighuset, Drottning Kristina 2, Halmstad 204 kWh/m2, yearLaholms Teater, Laxen 5 167 kWh/ m2, yearEnergy calculation, type code 826, statistic interval* 144–200 kWh/m2, yearOther figures in offices** 140–240 kWh/m2, yearThe National Energy Agency’s STIL-study, average figure*** 202 kWh/m2, year
*Boverket 2010. ** http://www.byggabodialogen.se/ ***Energimyndigheten 2007.
Question: The mandatory provisions in BBR should determine the permit for extensions but can it also result in demands on the already existing parts?
According to BVF, a superior regulation, demands can be asked for in existing parts in other alterations but not in existing parts to extensions. The municipal officials were aware of this.
Alterations in existing built environment
In PBL, Ch. 8, Sec. 1, building permit is demanded for new buildings, extensions, adjusting buildings for new purpose and substantial transformation. With Sec. 3 demands are stated on permit for altering facades, install signs etc.
Question: Substantial interior transformations for new activities, altered ventilation system and amendment to the supporting structure are planned for Fattighuset in Halmstad. The alterations will significantly extend the buildings operational life-span. How do you make the assessment on demand for building permits in existing buildings?
Answers: In Halmstad they want a notification for interior alterations if it’s not big alterations requiring changes in the comprehensive plan. They demand applying for a permit to install exterior signs or other changes on the facade. If it had been an extension or alterations in the facade they would have demanded applying for permit and it would have been processed according to BBR.
In this case BVF Sec. 3–8 and Sec. 10–15 apply. These Sections include demands on low energy consumption and particularly good energy efficiency
Table 2 is showing key figures which illustrate the problem:

Gotland University Press 15
111
with electricity in heating, cooling and ventilation. This shall apply also for those parts “…which, without being subject to the alteration, indirectly is affected by it.” Regulation (1995:598).”
BÄR has a connecting general recommendation: “The thermal indoor climate and power demanded for heat stated for new constructions (…) in BBR should be pursued in extensive alterations. If this cannot be obtained, the risk for draught due to insufficient insulation in walls, windows etc. should be met so that no room has higher average U-value than 1 W/m2, K and no construction part in the envelope a U-value exceeding 2.5 W/m2, K.” (BÄR p. 31) The subsequent text states “The basis for which climate to maintain is to be found in general recom-mendation on indoor temperature stated by the National Board of Health and Welfare SOSFS 2005:15 (M).”
Answers: This regulation and general recommendation has according to the responding officials’ knowledge not been used. An observation in the municipa-lities is that BÄR is not in use. One explanation expressed: “It isn´t mandatory and hence in practice less meaningful to refer to.”
The assessment is that some requirements should be demanded in existing constructions at other alterations than extensions but what requirements are demanded in practice?
Question: When evaluating Fattighuset as an example according to PBL, PBF, BVL and BVF; is it then the general recommendation (cited above) together with SOSFS 2005:15 that should be guiding? Or how should the text, in BVF Sec 8 and 10, be interpreted?
All of them answered that the basis must be the existing building. Lost historic values must be carefully considered and weighed against the energy efficiency gained. One cannot use general rules in old built environments and an assessment must always be done, and there is PBL to attend. BVL and BVF were not mentioned.
Boverket’s submission for comments on demands for alterations in buildings
Boverket has paid attention to the problems with other alterations in older buildings by proposing a new revision on BÄR. The present general recommen-dations have not been in use mainly because they are not mandatory. There would be no point in referring to them in case of legal disputes. The reality shows the need for Boverket’s decision on mandatory provisions.
The new proposal includes all buildings, the oldest as well as those built yesterday. That is why it isn’t possible to specify level of demand for every single situation. The objective is to clarify that both requirements for cautiously made alterations and technical requirements must be taken under consideration at alterations. The aim is to ease the applying of the legislation.
The intention is to integrate the general recommendations from BÄR into BBR for higher status in legal context. By using table 9:4 from BBR a new suggestion is made. The following is from Boverket’s draft/proposal on alterations – mandatory provisions and general recommendations.

Gotland University Press 15
112
For understanding how high the demands are, the two case studies have been added for a comparison in the table 3 above. The cases show different U-values for different parts and the highest and lowest U-values are shown here as Fattighuset 1 and Fattighuset 2 etc.
Both Fattighuset and the Teatern are solid brick constructions. The facades may not be altered and can’t be refurbished with insulation. To add insulation on the interior is always a risk. The construction gets cooler and physically can’t cope with moist permeation (Åhström 2005) and the interior holds great historic values. If these U-values cannot be reached to decrease the energy use, a heat pump could be installed but these are using electricity and then again it is the higher energy demand on 55–66 kWh per m2 Atemp that should be met. Boverket’s investigation on consequences (p. 16) also mentions cautiousness when carrying out interior alterations.
“The mandatory provisions clarifies that the demands on cautiousness and the prohibition of distortion also are valid for interior alterations. This will presu-mably lead to better procurement of historic values. The technical requirements are also clarified. If this leads to sided attention to other requirements without corresponding attention to historic values it could lead to negative consequences for the cultural and historic values.”
Discussion and conclusions
So what is possible to do on local level, is very much up to the municipal officials in charge. Or is it the laws and regulations lacking clarity? The latter must be the case according to the answers given by the officials. This is also indicated in Boverket’s investigation on consequences of the new proposal where findings like the ones described above appear in their text.
In the following a comparison of two cases, and some conclusions, are made.
The first case: Fattighuset, Drottning Kristina 2 in Halmstad
Fattighuset (the poor-house) or the old fire-station is in the municipality of Halmstad. The real estate’s name is Drottning Kristina 2 in the parish of S:t Nicolai and has two buildings. The municipal real estate company
Table 3 (same as table 9:92 Envelope in BBR): If the building after alteration does not meet the demands in sections 9:2 or 9:3 it should after alteration have pursued the following U-values. Figures for two cases are added.
Construction part U-values BBR Fattighuset 1 Fattighuset 2 Teatern 1 Teatern 2
U roof 0,13 0,15 0,29 0,12 0,14
U wall 0,18 1,80 1,80 1,02 1,43
U floor 0,15 0,26 0,42 0,18 0,18
U windows 1,2 1,4 4,5 1,9 4,5
U entrance door 1,2 2,7 4,5 2,29 4,5

Gotland University Press 15
113
Industristaden AB is the owner. Fattighuset is a corner house at Lilla Torg, in the old town. The buildings have two stories, an attic and a solid red 1 ½-stone brick construction. Partitions and floors are wooden. Regular placed four-bayed wooden windows have glazing bars and plate covered window-sills. Fattighuset has a red-painted plated span-roof and at the conservation work 175 mm of insulation was added. Mechanical ventilation and a lift were installed. The buildings have district heating.
The main plans for Fattighuset in Halmstad are by head architect in the city of Gothenburg, Hans Strömberg, in 1859 and 1879. It served as a poor house for 42 years. The fire brigade moved in 1903. A hose-tower and coach-house was built up with Sven Gratz plans. The buildings were vacant for some years until the conservation work started in 1996. After the completion Fattighuset was let out to shopkeepers and offices.
The buildings are made of local materials, worked by skilled craftsmen and have well preserved original forms, expressive exterior and preserved furnishing. The almost intact floor plans are of the general character which can hold different activities within, and by this possesses a high architectural quality. Fattighuset has classification 1 in the city’s preservation plan: Building of great cultural and historical values with exterior that cannot be altered.
The second case: Teatern, Laxen 5–8 in Laholm
Teatern (the theatre) is a real estate named Laxen 5–8 in the parish and munici-pality of Laholm. Teatern at Hästtorget is part of Gamleby, the old medieval town. The building is an extension of the hotel, has two stories with an attic and a solid 2 ½-stone brick construction with plastered facade in light greyish and white corners. Partitions and floors are wooden except the auditoriums roof construction which is of steel. At the conservation work 300 mm insulation was added to the inner roof over the auditorium and ventilation with heat recovery installed. The roof is black-painted plate. The wooden windows are of various sizes depending on function but all have glazing bars. The building is heated by a gas boiler.
In 1911 the drawings were delivered from the head architect in Kristianstad, Per Lennart Håkansson. The building was raised in 1913. A liquor store on the ground floor helped financing the work. In the 1950s the auditorium was recon-structed. All golden decorations were covered by plaster slabs and the ceiling lowered. The city council used it for meetings. Teatern had several owners but in 2010 the municipality once again became the owner.
During the conservation work in Teatern in 1995 the 1950s alterations were removed. The original interior was restored with lime plaster and gold to its former state. The original chairs were restored. The big arched windows in the auditorium were reproduced and partly mounted with three window panes. The plastered facade was altered in the 1950s but the question of restoring it has not yet been raised. Still Teatern is one of the most dominant buildings at Hästtorget and has classification 1 in the city´s preservation plan: Building of great cultural and historical values.

Gotland University Press 15
114
Teatern has lower energy demand than Fattighuset. This can partly be explained by heavier construction with thicker walls and that it hasn’t been occupied as much due to its property as an official auditorium. The bigger surplus heat for equipment in Fattighuset depends on the renting offices’. The bigger difference/infiltration in Teatern will likely change when the actual measured figures comes, see comment attached to the table above. On comparison Teatern, although its lack of patina because of the restoration in the 1990s, has almost as much cultural and historical values as Fattighuset, and yet better energy performance. Both technical solutions and historic values have been in focus. This partly supports the theory that energy and preservation demands can be balanced. The main actions in Teatern were added insulation and ventilation with both exhaust/supply air and a heat exchanger for heat recovery.
Fattighuset has a number of good and some less good qualities depending on perspective. Balancing becomes very difficult when same properties can be understood as very good and very bad simultaneously. Here is one example. The preserved and to a great extent untouched interior (+), causes bad indoor climate for the renters because of cold walls and draught (–). They move out thereby causing the real estate company trouble (–). But during the discussion at the workshop in June 8th 2010 it appeared that some measures counteract and some interact for better holistic in total. As a very short summary the preservation issues in Fattighuset have been prioritized foremost on behalf of the comfort, but also on behalf of the energy issues.
Table 4. Comparison of energy use.
Fattighuset, Halmstad Teatern, LaholmA) Transmission, envelope 136 MWh/year 119 MWh/yearB) Heat loss ventilation 47 MWh/year 30.4 MWh/yearC) Hot tap water loss 12 MWh/year 3.5 MWh/yearD) Surplus heat, people 3.6 MWh/year 4.1 MWh/yearE) Surplus heat, equipment 18.0 MWh/year 9.2 MWh/yearF) Calculated total need 173.4 MWh/year 140.1 MWh/yearG) Bought heat 186 MWh/year *100.4 MWh/yearH) Difference / infiltration 12.6 MWh/year 40.2 MWh/yearI) Electricity for running 29.7 MWh/year *6.9 MWh/yearK) m2 Atemp 1062 m2 884 m2
L) Calculated key figure, heat 176 kWh per m2 Atemp 159 kWh per m2 Atemp
M) Calculated key figure, electricity 28 kWh per m2 Atemp 8 kWh per m2 Atemp
N) Calculated key figure, total 204 kWh per m2 Atemp 167 kWh per m2 Atemp
*These are the figures available. In Laholm the hotel and Teatern had the same meter for many years. Figures from an energy declaration made by Anders Salberg at HEM in Halmstad have been used. His estimation for m2 Atemp in % on the different parts has been used as base for modification when dividing the total heat and electricity use. Separate and individual measuring in Teatern started in Nov/Dec 2010 and the actual figures will soon be available.

Gotland University Press 15
115
Table 5. Suggested measures seen from four aspects, showing pros (+) and cons (–):
MEASURES FOUR ASPECTSFattighuset Preservation Energy/
environmentComfort Manag./
economyInterior 3:rd window pane(the exterior may not be altered)
(–) Original appearance/view changed(+) addition of one extra pane will preserve the original windows untouched
(+) less heat loss(+) less energy use and hence less emissions
(+) better air tightness/less draught(+) no cool convection, bigger floor area along the walls can be used
(–) new investment(+) lower running costs
Original walls restored and preservation of some floors
(+) a very high quality
(–) bigger heat loss(–) more energy use and hence more emissions
(–) lower surface temperature on interior walls gives feeling of draught
(–) new investment (restorer)(–) higher running costs
Interior insulation very thin layers of nanogel / aerogel.(the exterior may not be altered)
(–) painted original walls hide behind a tight layer (as present)(+) painted original walls are preserved behind a tight layer
(+) less heat loss(+) less energy use and hence less emissions
(+) higher surface temperature on interior walls gives less feeling of draught(–) risk for moisture problem in the construction
(–) new investment(+) lowered running costs
Air Star fresh air vents with electric heating/recovery
(+) no bigger exterior change(–) very bad appea-rance in interior with a “box” at every fresh air ventbut(+) leaves the solid construction untouched
(–) more electricity use gives more emissions*(–) more electricity use is wrong system-thinking when renewable district heating is installed *(–) counteracts existing depres-surized ventilation
(+) higher tempe-rature on supply air(+) higher temperature on interior walls give less feeling of draught
(–) new investment(–) / (+) higher/lower running costs
Exhaust/supply/heat recovery-ventilation system installed (comple-mentary) and plugging of fresh air vents
(+) no bigger exterior change(–) new holes in the construction for ducts(–) visible ducts alters the interior
(–) more electricity use, see above*(+) higher energy efficiency in existing system(+) use of waste heat
(+) higher tempe-rature on supply air(+) higher temperature on interior walls give less feeling of draught
(–) new investment(–) / (+) higher/lower running costs
Higher flow temperature in the supplied heating system
(+) no material/visible changes
(–) higher energy use gives more emissions(+) district heating gives low emissions
(+) More heat causes less cold convection at windows and increases the comfort
(+)no investment(–) higher running costs
Better lighting, new demand in official sites
(–) more and stronger lighting spots alters the interior
(–) more electricity use gives more emissions
(+) better visuality(+) greater security, safety
(–) new investment(–) / (+) higher/lower running costs

Gotland University Press 15
116
Alterations are planned for Fattighuset as described earlier. This was among other things discussed at the workshop with 18 participants in June 2010 in Halmstad. One of the results thereof was a number of measures for Fattighuset. The measures also apply for other objects.
The table below shows the pros (+) and cons (–). The measures are looked upon from different aspects. The property of being lettable is connected to what the renter want and is prepared to pay for. Some prefer low costs and care less for comfort, some care more for good indoor climate and others care for appearance and ambience etc. The possibility of being let out is dependent on all aspects and has not received a column.
An order for priority can be made from the list. The summary shows that most suggested measures aim at better indoor climate and comfort, by counting the pros (+) and cons (–) in the columns. The energy use and comfort can be under-stood as synonymous, in a building where the envelope hasn’t been altered. Low energy use – low comfort and high energy use – high comfort. One conclusion is that optimization of results includes measures in the envelope. How good energy performance should one demand? The greater the freedom of action for imple-menting energy measures, the more decreased energy use can be demanded. How much freedom was allowed at the conservation work? Was the state of knowledge different from today? The answers must be that there wasn’t much freedom and the state of knowledge is wider today.
An open way to look at a building is in its context with all interacting systems where human activities are included. The emphasis for technical orientation must find its’ way towards the building as a system where total performance is considered. And we must find another way to assess historic values, with their complexity, in a proper value system. This can lead to the model by faster defining of problems, balancing against regulations and, energy and preservation demands.
Acknowledgements
Participants at Workshop I contributed to this work. Especially Anders Salberg, HEM, and Maja Lindman, Heritage Halland. The Swedish National Energy Agency is financing.
The expert group represents: GMV Center for Environment and Sustainability, Politecnico di Milano, BEST, Anneling Tobin Consult AB, Gotland University, Heritage Halland, Swedish Energy Agency, Region of Halland and Energirådet Halland of which some are co-financing.
Participating real estate and energy companies in Halland: Södra Hallands Kraft, Laholms kommun, Laholmshem, HEM – Halmstads Energi och Miljö, Falkenbergs Bostads AB, Varberg Energi AB, Eksta Bostads AB and Industristaden AB who are all co-financing.
Gotland University Press 15
117
References
Adalberth, K. & Wahlström, Å. 2008. Energibesiktning av byggnader – flerbostadshus och lokaler. Stockholm: SIS Förlag AB.
Adamson, B. & Hidemark, B. 1986. Sol energi form. Utformning av lågenergihus. T2:1986. Stockholm: Byggforskningsrådet – Statens råd för byggnadsforskning.
Anderlind, G. & Stadler, C-G. 2006. Isolerguiden Bygg 06. Väring: Swedisol.
Boverket 1987. PBA, The Planning and Building Act Law 1987:10 including amendments up to 1 July 2003. Karlskrona.
Boverket 2004. Housing Statistics in the European Union 2004.Boverket 2006. Boverkets Ändringsråd. 1996:4 med ändringar t.o.m.
2006:1.Boverket 2007. Lag om tekniska egenskapskrav på byggnadsverk mm.
1994:847 t.o.m. 2007:457.Boverket 2008a. Boverkets Byggregler. BFS 1993:57 med ändringar
t o m BFS 2008:6.Boverket 2008b. Förordning om tekniska egenskapskrav på
byggnadsverk mm. 1994:1215 med ändringar t.o.m. 2008:51.Boverket 2009a. Energihushållning enligt Boverkets byggregler 2009.Boverket 2009b. BBR 2008. Supplement februari 2009. Regelsamling
för byggande, 9 Energihushållning.Boverket 2010. Online-calculation for Energy Performance.Caldenby, C. (ed.) 1998. Att bygga ett land. 1900-talets svenska
arkitektur. T9:1998. Stockholm: Byggforskningsrådet & Arkitekturmuseet.
Elmroth, A. 2009. Energihushållning och värmeisolering, Byggvägledning 8. Stockholm: Svensk Byggtjänst.
Energimyndigheten 2007. Förbättrad energistatistik för lokaler – Stegvis STIL Rapport. Inventeringar av kontor och förvaltningsbyggnader ER 2007:34. Eskilstuna.
Energimyndigheten 2009. Energiläget 2009 ET 2009:28. Eskilstuna.Environmental Objectives Council 2009. Sweden’s Environmental
Objectives in Brief. Stockholm.European Commission 2007. En energipolitik för Europa 11 SEK(2007)
12}, KOM (2007) 1. Bruxelles.Gustafsson, C. 2009. The Halland Model: A Trading Zone for Building
Conservation with Labour Market Policy and the Construction Industry, Aiming at Regional Sustainable Development. Doctoral Thesis. Göteborg: Chalmers University of Technology & Göteborg University.

Gotland University Press 15
118
Landsantikvarien 1995. Fattighuset. Byggnadsvårdsåtgärder – Arbetsbeskrivning och materialspecifikation. Halmstad: Landsantikvarien & Hallands Länsmuseer & Länsstyrelsen.
Petersson, B-Å. 2009. Byggnaders klimatskärm. Fuktsäkerhet Energieffektivitet Beständighet. Lund: Studentlitteratur AB.
Riksantikvarieämbetet 1988. Heritage Conservation Act (Law 1988:950). Stockholm: RAÄ.
Robertsson, S. 2002. Fem pelare – en vägledning för god byggnadsvård. Stockholm: RAÄ.
Unnerbäck, A. 2002. Kulturhistorisk värdering av bebyggelse. Stockholm: RAÄ.
Yin, R.K. 2009. Case Study Research, Design and Methods – Fourth edition. Thousand Oaks: Sage Publications Inc.
Wärme, P. (et al.) 1991. Energisparboken. Halvera elräkningen – men behåll din standard! Solna.
Åhström, M. el al. 2005. Rätt murat och putsat. Stockholm: Svensk Byggtjänst, pp. 71–81.

Gotland University Press 15
119
Sustainable and Careful Renovation and Energy Efficiency in Cultural Historical Buildings – a Pre-study
Fredrik StåhlSP Technical Research Institute of Sweden, SwedenCorresponding email: [email protected]
Summary
Many owners of historic buildings are today facing tougher requirements to reduce their energy use. It is important to consider the building and its instal-lations as a whole when planning and implementing energy efficient measures, so that the indoor environment, durability and cultural and historical values of the building are not adversely affected.
The aim of the project is to compile existing knowledge regarding sustainable and careful renovation and energy efficiency of cultural historical buildings, focusing on buildings used as residences, offices, schools and commercial buildings. The target is to reduce energy consumption by 20–40 %.
Knowledge of energy efficiency measures are gathered through studies of past energy efficiency projects in Sweden and Europe and through interviews with property managers of historic buildings. Various energy conservation measures are valued according to their energy savings potential, the impact on cultural historical values and hygrothermal risks.
Keywords
Energy efficiency, historic buildings, renovation.
Introduction
There is an urgent need to reduce our energy consumption and the environ-mental impact of the energy use. Buildings account for 40 percent of total energy consumption in Europe (Energy Performance of Buildings Directive (EPBD2) 2010/31/EU). The energy saving potential in buildings is large and legislative measures are taken by the European Commission to adapt the building stock to new energy requirements. Officially protected buildings (i.e. historic buildings) can be exempted from the minimum requirements when refurbishing existing buildings but many historic buildings are not listed and may be subject to the requirements. Approximately 10 % of the residential building stock in Europe is considered to have historic value. Rising energy prices may also motivate property managers of historic buildings to take measures to decrease the energy use of their building stock.

Gotland University Press 15
120
Several projects regarding energy efficiency in historic buildings have been started the last few years to meet the energy requirements for instance 3encult and Spara och bevara. Their goal is to promote energy saving measures in historic buildings that will preserve heritage values and at the same time decrease the environmental load of historic buildings.
The main purpose of this work is to compile existing knowledge regarding careful energy efficiency and sustainable renovation of historical buildings and thereby identify possible gaps in knowledge in this area. The purpose is also to assess what measures are applicable in Swedish conditions. Our vision is to be able to decrease the energy use in historical buildings by 20 to 40 percent without compromising the heritage values, the indoor environment and the durability of the buildings. Hopefully that is sufficient to meet the European energy saving directive considering the historic values of these buildings. This work is focusing on historic buildings in daily use that is residences, offices, schools and commercial buildings. Most historic buildings cannot be turned into monuments and have to be used to be economically justified to preserve.
Methods
Currently a literature survey of energy efficient measures used in Sweden and Europe is in progress to compile the existing knowledge of careful energy efficiency and sustainable renovation of historical buildings. Several property managers of historic buildings have been interviewed to identify difficulties they face and how they solve problems regarding energy efficiency in their building stock. In one historic building, the energy use and potential for energy savings are examined. Various energy conservation measures are valued according to their energy savings potential, the impact on cultural historical values and hygrothermal risks.
Energy Saving Potential in Historic Buildings
Many of the property managers interviewed regard user behaviour as the most influential aspect energy use in a building and in some cases they work together with the tenants to reduce energy use. The second most influential aspect regarding energy use is the efficiency of the building’s technical installations. Improvement of the heating, cooling or ventilation system is the most common measures undertaken by most managers of historic buildings. Some property managers claim that the energy use of a building can be reduced by up to 20 percent only by optimising the existing heating system due to the facility conditions. The third alternative is to improve the building envelope, for instance by air sealing or additional insulation. Often measures of the building envelope have long payback time and in some cases these measures are inconsistent with preserving heritage values. The use of renewable energy sources is one way to decrease the environmental impact of the building but as one manager pointed out: this will not decrease the energy use.

Gotland University Press 15
121
Slots- og Ejendomsstyrelsen (Palaces and Properties Agency) (2009) in Denmark examined the energy saving potential of its building stock, see Table 1.
Table 1. Energy saving potential of Slots- og Ejendomsstyrelsen building stock:
Heating (%) Electricity (%)Residences 26 25Offices 11 34Museums 20 2
The energy use can be reduced by up to 50 percent when all energy savings measures possible are used in a building. In a total renovation the profitable energy saving measures will finance less profitable measures. Electricity efficiency has good saving potential and minimal impact on heritage values in a building. In many office buildings the electricity use is often higher than the heat consumption.
Suggested work order for energy saving measures
Grytli et.al. (2004) suggested the following work order when choosing energy efficient measures for historic buildings
• Air tight measures (sealing of air leakage)• Additional insulation of floors and ceilings• Window improvement/repair• Indoor temperature control• Change to more energy efficient equipment• Change to environmental friendly energy sources
The suggested work order is more or less reversed compared to the work order used by some of the interviewed property managers. The reason for the discre-pancies is not investigated but possible explanations are the property managers concern for high investment cost for measures done on the building envelope and the necessary permits for these actions.
Energy saving measures in historic buildings
A number of energy saving measures is mentioned when interviewing property managers of historic buildings. As mentioned before the measures most favoured by managers concerns improving the heating and ventilation systems. The measures includes optimising the existing heating system, time control of ventilation, presence detection for lighting and heating and other measures for electricity and operating efficiency and replacing the heating and ventilation system. The heat losses from a building can be reduced by improving the building envelope. This can be done by replacing or renovating the windows, air sealing of the building envelope and windows, adding insulation to the envelope for instance the attic floor and use solar shading. The heat losses might not decrease by the

Gotland University Press 15
122
use of renewable energy sources but the environmental impact of the energy used will in most cases decrease. Examples of renewable energy sources are district heating and heat pumps.
Some of these measures have little impact on the heritage values of the building others have a profound impact on the exterior or interior of the building which have to be considered before implementation in historic buildings.
Air sealing of building envelope
Air sealing of windows and doors is a relatively simple and cheap method to reduce heat loss from a building. The heat loss is reduced by approximately 100 kWh/year when a window is air sealed (Grytli 2009). Often, this measure has little impact on heritage values of a building. It is important to remember that the ventilation in the older buildings will supply air through leaks in the building shell. One way to accomplish this is to remove the seal between the upper part of the window frame and sash. Another way is to install new supply air vents but usually that conflicts with preserving heritage values.
The benefits when air sealing the building envelope, are reduced involuntary ventilation, improved thermal comfort due to less draft and warmer interior surfaces, improved air quality, less risk of moisture damage, and better sound insulation. If the building is equipped with a supply and exhaust air heat exchanger the efficiency will improve. The possible drawbacks when air sealing the building envelope is lower ventilation rate when the supply air openings are sealed as mentioned before and increased draft due to increased air-flow through supply air diffusers.
Air permeability is an important aspect of energy efficiency of historical buildings. Air leakage means heat losses and that heat exchange with the outlet air will be less efficient. There is an increased risk of moisture damage due to condensation when interior air moving through the construction. Poor air quality and thermal comfort may also be caused by air leakage through the building envelope. It is hard to achieve the air-tightness of a new building when air sealing a historic building but by relatively simple means, i.e. sealing of windows and doors, can significantly reduce air leakage rates.
Properly executed, there are few disadvantages of an airtight construction. The pressure conditions may change when air sealing a building. Normally the under pressure in the building will increase and the risk of moisture damages in the building envelope will decrease. As mentioned before, air sealing of the building envelope may cause an increase in air flow through remaining openings in the building envelope which might cause drafts. The air quality of the indoor air might be poorer due to lower air exchange rate. Moisture damages might occur when the ventilation rate is not sufficient to remove moisture from the indoor air.
Energy saving measures for windows
Heat loss through windows is one of the major parts of the total heat loss from both new and old buildings. In historic buildings the heat loss through windows is caused by both low thermal resistance (high U-value) and air leakage.

Gotland University Press 15
123
Air sealing of windows is a relatively simple and cheap method to reduce heat loss from a building with little impact on heritage values. The thermal resis-tance of a window can improve by adding an extra window pane or a window frame. One of the existing panes can be replaced by a secondary pane with low-emission coating or a sealed insulating glass. In some cases the sash might not be able to hold the increase weight of the replacement pane. The window design have a great impact on both the exterior and interior look of a building and in many cases it is not possible to replace an entire window due to heritage values but in some cases a replica might have its merits. Night time insulation i.e. window shutters and curtains may in some cases have the same effect as an extra window pane (Baker 2008). The disadvantage is that they will only be used during parts of the day.
Apart from lower heat losses, the benefits of energy saving measures of windows are improved thermal comfort close to the windows, less draft, improved noise insulation and less risk of condensation and moisture damage in the window construction. By adding an extra window pane the daylight illumination will decrease by approximately 10 percent per added pane.
Additional insulation of the attic floor
I many cases it is possible to add insulation to the attic floor of a historic building without negative influence on heritage values. Heat losses decrease but the attic is more susceptible to moisture damage if there is air leakage from the interior of the building through the attic floor. The insulation of the attic floor will make the temperature of the attic space lower and the relative humidity will be high in winter due to moisture transported by air from the interior of the building. There is a risk of condensation on the interior side of the roof and risk of mould growth in autumn and spring. There is often plenty of room for adding insulation to the attic floor but a greater insulation thickness will decrease the attic temperature and increase the risk of mould growth.
It is possible to counteract these problems by creating a negative pressure inside and thereby preventing air leakage through the attic floor, sealing the ceiling penetrations and attic hatch, avoid tight layer unless it can be added directly to the slab bottom and ventilate the entire attic space. Normally it is sufficient with vents in both gables of the building. It is further advised to check the attic space for any signs of moisture damage once every year.
Additional insulation of the roof
It is possible to keep the attic space warmer and less sensitive to moisture damage by adding insulation to the exterior of the roof, beneath the tiles. The roof construction under the insulation and attic space is warmer and there is less risk for condensation on the interior surface of the roof structure. The negative aspect of this solution is that it can change the building appearance.
Additional exterior insulation of walls
Adding insulation to the exterior of a wall is favourable from an energy saving point of view with low hygrothermal risks, low risk of moisture damage, reduced

Gotland University Press 15
124
thermal bridging and improved thermal comfort. In most cases the building envelope will be more airtight and new supply air vents have to be installed if the ventilation system is dependent on supply air by air leakage through the exterior wall. The major drawback of this measure is the change of building exterior and in most cases this conceals the heritage values of the building. In some cases it is possible to use this solution on one less visible façade of the building.
Additional interior insulation of walls
Another way to decrease the heat losses through a building wall is to add interior insulation. This will reduce floor space and increase the risk of moisture damage in the exterior wall when the temperature of the exterior structure outside of the insulation is lower. The thermal bridges at the inner wall and floor will be enhanced and frost might damage the brick façade. A vapour-tight layer has to be applied to inner side of the exterior wall to prevent moisture from the indoor air to condense in the building structure. In many cases this will prove to be very difficult to do in an already existing building.
Capillary active insulating (calcium silicate) is used in some historic buildings to transport condensed moisture from inside the building structure. Even though the condensed vapour is transported away the structure has to be able to withstand high relative humidity.
In some historic building interior insulation is a possible alternative that might not damage historic values but will in some cases impair the durability of the building. A careful risk assessment is needed when using interior insulation.
Additional insulation on floor over crawl space
Adding interior insulation on the floor over a crawl space is rarely used in histo-rical buildings because of heritage values and hygrothermal risks. But in many cases, external insulation, i.e. on the underside of the base floor, is acceptable when preserving historical values. The crawl space air gets colder and the risk of high relative humidity and microbial growth increases. One way to decrease the moisture content of the crawl space air is by enough ventilation. However, during the summer warm exterior air is brought into the crawl space where the air temperature drops and the relative humidity can reach levels that will benefit mould growth, despite adequate ventilation. Yet again, the risk regarding the durability of the construction must be assessed against the benefits of the insulation. Apart from saving energy the floor over the crawl space will be warmer which will increase the thermal comfort and lessen the hygrothermal risk for the floor construction.
A number of measures can be taken to improve the moisture conditions of a crawl space. The relative humidity of the crawl space air could be reduced by a vapour-tight barrier preventing evaporation from the ground or a dehumidifier. The tempe-rature of the crawl space can be raised by thermal insulation on the ground and crawl space walls or by an additional heat source.

Gotland University Press 15
125
Changing heating system
Usually the original heating system was well fitted to the building and it is well advised to consider the original function of the building when installing a new heating system in an old building. The boiler provided the heating system with heat and the exhaust airflow through the chimney as well as heating the basement. The pressure conditions and the ventilation flow rate in the building may change when the boiler is replaced by district heating or a heat pump. In some cases the original high temperature heat distribution system will have to be adapted to the lower distribution temperature of the new heat source.
Change of ventilation system
Many historic buildings were originally designed with natural ventilation or rather an integrated heating and ventilation system. The chimney connected to the boiler or furnace worked as an exhaust fan apart from heating the building and providing the necessary thermal driving forces. The benefits of natural ventilation are low noise, low investment cost and low operating and maintenance cost. The disadvantages are risk of moisture related problems in bathrooms due to low air exchange rate in summer and too low relative humidity and possible cracks in wooden materials due to high air exchange in winter. In a historic building, the first step should be to investigate if the original ventilation system is working properly before installing a new ventilation system.
In historic buildings a change of ventilation system is often needed to meet modern comfort and air quality requirements. Enhanced or demand controlled ventilation can be used in bathrooms and kitchens, or an exhaust or a supply and exhaust ventilation system can be installed. Often this is combined with heat recovery. In most cases this requires extensive ducting. It is important to remember that the life span of a building is often more than ten times longer than the service life of a ventilation system when making irreversible changes to a building. An exhaust air heat pump reduces energy use but can increase electricity consumption whereas a supply and exhaust ventilation system with heat recovery is more energy efficient but is a more extensive and space consuming installation.
Photovoltaics and solar heat in historic buildings
One way not to decrease the energy use but to decrease the emissions of carbon dioxide in historic buildings is the use of renewable energy sources. Photovoltaics convert the sunlight to electricity and a solar heat collector provides hot water and heat. Some solar collectors can be used to produce cool.
The ideal placement of a solar collector (for heat or electricity) in Sweden is facing south with a 40–45 ° tilt. It is also important to avoid any shading of the collector from trees or buildings. The solar collectors can be mounted vertical on a wall to get a better performance during winter but that will decrease the summer performance.
It is possible to produce approximately 1000 kWh/year with a 10 m2 photovoltaic system. A solar heat collector system can produce 10–50% of the total annual

Gotland University Press 15
126
heating need for heating and hot water if the heating and hot water systems are combined.
It is important to consider the weight of the solar collector and its frame when mounting this system on a historic building. Apart from the attachment of the collectors holes have to be made in the building envelope for cables or pipes from the collector which will also affect heritage values of the building. A solar collector system will affect the look of the building but sometimes it is possible to mount the collectors on roofs or façades out of view or on the ground.
Interviews with property managers of historic buildings
A limited number of property managers of historic buildings have been inter-viewed to get a better picture of the difficulties they face when trying to decrease the energy use in their buildings. Some managers have a long-term task of managing listed historic buildings. Others renovate and resell their buildings which affect the measures carried out. Most of the interviewed property managers aim to convert their buildings into offices or residences that meet today’s demands for user comfort and flexible use of the premises. This is done cost-effectively and with as little impact on the building’s heritage values as possible. One of the interviewed managers, when buying such properties, tries to restore the old buildings to their original state and the tenants have to adapt their activities to the building’s conditions.
The interviewed property managers consider themselves having enough knowledge within their own organisation regarding energy efficiency in historic buildings or access to enough knowledge through external consultants. It would be possible to decrease the energy use in historic buildings more but questio-nable profitability and preserving the historic values hinders that. All interviewed managers account for historic values. In some buildings only the exterior is protected, in others the interior and construction is also protected.
The most common reasons for energy efficiency in historic buildings are the environmental policy or energy saving goals of the organisation/company. Many energy saving measures are done to meet the requests from tenants and usually in connection with planned renovations. Another goal is to decrease the energy use and thereby the operation costs. Usually, economic factors determine the measures to be used. The building legislation demands energy saving measures when performing major renovation of a building. Sometimes, the desire to try new technology motivates improvements on the building installation system.
Usually the energy saving measures is directed towards the heating and venti-lation systems, for instance optimising the operating efficiency of the existing system or changing to new, more efficient equipment. Fine-tuning of the existing heating and ventilation system can be done without affecting the heritage values of the building whereas measures done on the building envelope in most cases will affect heritage values and has to be approved by the Swedish Heritage board or the County Board. Sometimes solar protection film is use to prevent excessive surplus of heat and decrease the energy used to cool the building. Awnings are

Gotland University Press 15
127
more effective in blocking the sunlight but will affect the exterior of the building and are seldom allowed due to historic values. Air sealing of windows is another common energy saving measure. To put additional insulation on for instance the attic floor is an expensive energy saving measure which needs thorough economic calculations and investigations concerning historic values.
One of the major difficulties property managers come across is when installing ventilation ducts in historic buildings. The ventilation ducts have to have a rather large dimension to be able to transport air without too much losses and noise production. At the same time heritage values might be destroyed when installing these ducts and cutting through walls and floors. One manager pointed out that heat recovery from the outlet air as the most troublesome measure to undertake concerning the heritage values.
Other difficulties property managers of historic buildings face are to find staff capable to optimise the heating and ventilation systems and to find electric and HVAC consultants that are experienced and able to find innovative solutions for historic buildings. It is usually hard to adapt a historic building to the indoor comfort demands of today and the need to use the entire floor space of a building. The thermal comfort close to a historic window is often substandard.
Conclusions
At this stage of the project the conclusion is that there are many skills needed to implement a successful energy efficient renovation of a historic building. These skills have been frequently used in most projects, where the results have been published. But most projects regarding energy efficient renovation of historic buildings are never documented and published. There is a concern that many projects have been or will be implemented without regard to cultural historical values or hygrothermal risks.
It is often difficult to provide general answers to which measures are appropriate for the renovations of a historic building. Most often, the measures must be adapted to the individual building. By spreading awareness about various more or less successful measures it will increase the possibility that future renovations will be successful.
Acknowledgements
This project is part of the Energy Efficiency in Historic Buildings research program (Spara och bevara in Swedish) and financed by the Swedish Energy Agency. In this project SP is collaborating with the Swedish National Heritage Board.
References
Baker, P. 2008. Improving the thermal performance of traditional windows. Prepared for Historic Scotland by Paul Baker. Glasgow Caledonian University.

Gotland University Press 15
128
English Heritage, Small scale solar electric (photovoltaics) energy and traditional buildings. 2008. www.helm.org.uk
Grytli, E., Andresen, I., Hermstad, K. & Kundsten, W. 2004. Fiin gammel aargang, Energisparing i verneverdige hus. Project Report.
Slots- og Ejendomsstyrelsen. 2009. Energioptimering af fredede kultur-ejendomme i Slots- og Ejendomsstyrelsen – Introduktion til de centrale problemstillinger.
Spara och bevara. www.sparaochbevara.se/english.phpZanetti, I. 2010. Sustainable renovation of historical buildings: Concepts
for solar integration, Proceedings of ENERGY FORUM on Solar Building Skins, Bressanone, Italien, 2–3 december 2010. 3encult. www.3encult.eu/en/project/welcome/default.html

Gotland University Press 15
129
Methods to Indentify Air Leakages in the Building Envelope of Churches
Magnus Mattsson*, Svante Lindström, Elisabet Linden and Mats SandbergUniversity of Gävle, Academy of Technology and Environment, Sweden* Corresponding email: [email protected]
Summary
Frequently there is a wish to reduce the natural ventilation rate in churches in order to save energy and/or improve the thermal comfort. It is then often difficult to ascertain exactly which the dominating leaks in the building envelope are, and where tightening measures would be most effective. A number of different methods to identify these leakages are discussed here. It appears that valuable help can be attained by a combination of several measuring techniques, including IR-thermography, tracer gas and pressure measurements. These techniques can also be useful in verifying the effect of tightening measures.
Keywords
Churches, natural ventilation, air leakage, air infiltration, building tightness.
Introduction
The vast majority of Swedish churches are naturally ventilated, with air inlets and outlets usually consisting of a variety of adventitious leakage interstices in the building envelope. There is often a wish to reduce the natural ventilation rate in order to save energy. Much air infiltration also brings in significant amounts of airborne particles that accelerate soiling of indoor building surfaces and artefacts, and the air movements can affect candle flickering (sooting) and the thermal comfort of visitors. Although some leakage spots often can be easily located, it is usually difficult to ascertain exactly which the dominating leaks are, and where tightening measures would be most effective. A number of different methods to identify building envelope leakages are discussed here while referring to experiences from field tests in a particular church. It is shown how the methods also can be useful in verifying the effect of tightening measures. The paper focuses on churches, but the results are applicable also the other similar historical, monumental buildings that are large, naturally ventilated and leaky regarding air infiltration and heat loss. Typically they are subject to restrictions as to insulation and tightening methods due to historical and aesthetical values of the building envelope.
Methods and results
For clarity, since several different methods are dealt with, the results are here presented in connection with the method descriptions. Examples of the leak identification methods are taken from field studies in a stone church from the

Gotland University Press 15
130
1860s: the Hamrånge church (Fig. 1), located 35 km North of the town Gävle in Sweden. This church is heated by both radiators and bench heaters, and the parish is concerned about high energy costs. In winter the church is heated intermittently, with a base temperature of about 11 ºC. The church is naturally ventilated and has no intentional vents for supply or extract air. The volume of the inside space is about 7 800 m3 and the ceiling height varies between 10–14 m. It has double glazing and a ~70 cm high crawlspace underneath the wooden floor. A void space under the floor is common in elderly Swedish churches, although it often is smaller than an actually “crawlable” space.
Fig. 1. Hamrånge church. Photo: Magnus Mattsson.

Gotland University Press 15
131
IR Thermography:
Infrared (IR) thermography is a fairly established technique both for cold-bridge and air leakage tracking in building envelopes. Thermography pictures detect the cool surfaces around a leak of infiltrated cooler air. Figure 2 shows an example of this in the Hamrånge church. The dark areas around the joints of the wooden floor boards indicate infiltration of cooler air from the crawlspace. It is however only infiltration leaks that can be detected this way. Exfiltration leaks can sometimes be detected by outdoor thermography, but this is practically much trickier. See more about these aspects under “Pressure measurements” below.
Tracer gas measurements
Tracer gas can be used both to measure the air change rate in a church and to track local leaks. Figure 3 shows an example of a tracer gas decay measu-rement in the Hamrånge church. The principle of the decay method is to mix an initial dose of tracer gas with the air of the ventilated space into a homogeneous concentration, and then determine the rate at which the air+tracer gas mixture is replaced with fresh air (ISO 12569:2000). In this study SF6 was used as tracer gas, and a gas monitor (Brüel & Kjaer 1302) was employed to measure the time variation in tracer gas concentration in six measuring points distributed both horizontally and vertically in the church space. The method has been tested in several churches (Mattsson et al, 2011) and typically the gas concentration response looks like in Fig. 3 when there is some heating in the church. After around 1 hour the tracer gas is fairly well mixed into a homogeneous concen-tration in the church volume. The figure shows however how the concentration tends to be a bit lower in one location close (0.1 m) to the floor. This supports the thermography indications of air leaking in through the floor. Hence, since tracer
Fig. 2. IR thermography picture revealing leaks in a wooden floor. Radiators appear bright.

Gotland University Press 15
132
gas tend to be well mixed in heated churches, a gas monitor can be used to track local leaks of infiltrating air. Leaks with exfiltration can however not be tracked; see below under Pressure measurements.
The well mixed room air tends to make gas concentration decay curves like in Fig. 3 smooth enough to attain time variations in the air change rate, by calculating the decay rate of consecutive fractions of the decay data (Mattsson et al, 2011). This procedure is behind the air change rate curve in Fig. 4. That figure also includes curves of the driving forces for natural ventilation: indoor-
Fig. 3. Example of tracer gas decay measurement.
Fig. 4. Variation in air change rate and driving forces for air infiltration during 52 hours.

Gotland University Press 15
133
outdoor temperature difference and wind speed (attained from a local weather station). Three breaks in the air change rate curve are due to too low tracer gas concentrations and subsequent refilling and air mixing time. The magnitude of the air change rate, around 0.25 h–1, is to our knowledge relatively high for being an old stone church, thus indicating a fairly leaky church. Further, the air change rate correlates well with the indoor-outdoor temperature difference (stack effect), whereas it seems to take a rather high wind speed for it to be influential on the air change rate. This circumstance suggests that the main leaks are not on the façade of the church – especially not at mid height (window) level – since air infiltration then would be more dependent on wind. Instead the suspicion of major leaks at the floor is strengthened. However, substantial leaks might also be present at ceiling level. Additional information on at what height the dominating leaks are situated can be attained by pressure measurements, as follows.
Pressure measurements
Figure 5 shows an example of pressure recordings on the long façades and in the crawlspace of the Hamrånge church. The pressures are given relative to the indoor pressure. The façade measuring points are in the keyholes of porches situated in the middle of long side façades, facing East and West respec-tively. These measuring points are thus at a fairly low position. The crawlspace measuring point is on the floor of the southern part of the crawlspace. The figure shows relatively stable and equal façade pressures, except for some curious fluctuations around 03:10–03:25. Data from a local weather station confirmed a “burst” of wind at that time, but otherwise calm weather during the depicted period.
In Fig. 5 the pressure appears to be about 1.5 Pa at keyhole level of the facades, relative to indoors, at calm conditions. Air temperature measurements at the
Fig. 5. Façade (porch) and crawl space pressure relative to indoors during 1.5 night hours.

Gotland University Press 15
134
same time showed about 20 ºC indoors (with small vertical variation) and 6 ºC outdoors. With this information we can calculate the vertical stack effect pressure variation, ∆ps, from:
where ρ is the air density, g is the gravitational acceleration (9.81 m/s2), h is the indoor ceiling height, ∆T is the indoor-outdoor temperature difference and T is the mean temperature in Kelvin. For the present case we get ∆ps≈ 7.1 Pa. Since we have measured about 1.5 Pa in the lower part of the church, the rest, ≈5.6 Pa remains for the upper part, and we will attain an approximate façade pressure distribution as sketched in Fig. 6. The figure suggests a relatively small lower section of overpressure on the building envelope. At any leakages in this section there will consequently be infiltration of air. In the much larger upper section the pressure difference is opposite and we will have exfiltration of air. The infil-tration flow rate must equal that of exfiltration, and since a much lower pressure is needed over a smaller area to achieve that flow rate in the lower section, the leakage area must be substantially larger there than in the upper section. Thus, from the pressure distribution in Fig. 6 we can conclude that the major leaks in the building envelope are situated at low level in the building.
This adds to the previous signs of the floor being the major leaking place in the church. Any tightening measures on the building envelope would hence be most efficient here. The floor is however not easy to tighten. The wooden floor boards could be covered by a dense mat, but this is no attractive solution due to esthe-tical and historical values of the wooden floor itself. The air infiltrated through the floor comes however from the crawlspace, which in turn is provided with 16 vents distributed close to the ground around the church. In an experiment these vents were tightened from the outside by blocking them with wooden plates and hard foam plastic. It appeared that the air change rate in the church – measured with tracer gas as above – was reduced by 35–50% by this tightening measure, thus showing that it was an effectual action. Another sign of this is shown in the
Fig. 6. Approximate pressure distribution on the façade.
(1)∆ps = ρ g h T∆T

Gotland University Press 15
135
Fig. 7. Façade (porch) and crawl space pressure relative to indoors, including the time of crawlspace vent blocking.
Fig. 8. Approximate pressure distribution on the façade after blocking crawlspace vents.

Gotland University Press 15
136
pressure diagram in Fig 7, which is of the same kind as Fig. 5, but includes the time of the blocking of the crawl space vents. It appears that this blocking resulted in significantly reduced crawlspace pressure, relative to indoors. This suggests that also the air flow through the floor was significantly reduced. Enhanced heating started in the church at 18:40 to attain comfort temperature during a ceremony the next day. The rising indoor temperature together with decreasing outdoor temperature then strengthened the stack effect, which is the reason for the slowly increasing pressures from about this time in the diagram.
In Fig. 7 we can also read a façade pressure of about 4 Pa at around 19:00, when the small fluctuations indicate calm weather. In line with the procedure above, a façade pressure profile can again be calculated, but now for the situation with blocked crawlspace vents. The result is shown in Fig. 8. The vertical stack effect pressure variation, ∆ps, now becomes about 7.8 Pa, and the point of neutral pressure difference gets significantly raised as compared to the situation before the blocking the vents, shown in Fig. 6. This occurrence is another confirmation of that the tightening measure was effective.
Candles
Candles can be used in the old classical way to detect air leaks: A burning flame placed in moving air will bend in the direction of the air flow. But candles can also be used to perform similar tracking of air infiltration locations as with tracer gas. When candles burn they emit substantial amounts of ultrafine particles. An example of this is given in Fig. 9, showing the time history of the number concen-tration of particles of size 0.02–0.3 µm during an ordinary Sunday service. The particles were measured with a condensation particle counter (P-Trak, TSI Inc.) in a position 0.3 m over the balcony fence in a 7000 m3 stone church, where around 25 wax candles were lit during the service. It appears in the figure that there is an approximate 400-fold increase in particle concentration during the time of candle burning. The simultaneous outdoor particle concentration was similar to that of
Fig. 9. Increase in particle concentration during an ordinary mass.

Gotland University Press 15
137
the indoor air, before the candles were lit. The fairly smooth shape of the curve in the figure suggests that the particle concentration was rather homogeneous in the church volume, which also was confirmed when measuring in some additional positions after the service. Ultrafine particles can be expected to be mixed with the room air to about the extent as tracer gases, which, as stated above, tend to be well mixed in heated churches. The particle counter used here was of a portable model which easily can be carried around to track air leaks during the times of high indoor particle concentration. Locations with infiltrated outdoor air will then be detected through relatively low particle concentrations.
Exfiltration crack blackening
Cracks where air exfiltration exists tend to be blackened on the edges on the inside surface of the building envelope. Thus exfiltration leaks can be visible, especially on plastered surfaces. This blackening of cracks might be caused by inertial impaction of airborne indoor particles onto the crack edges, or simply occur due to a substantial supply of particle laden air.
Discussion
Only air infiltration is detected by some of the methods accounted for above, such as leak tracking with tracer gas monitor or particle counter, or IR-thermography inside the church. As shown for instance in Fig. 6, a large upper part of the building envelope may however be subject to pressure conditions resulting in exfiltration. In this part these methods would not work. IR thermography can be used from outdoors, but is then usually much more difficult to apply. Hence, when using these methods we should preferably have some knowledge about the current pressure distribution on the building envelope, for instance through pressure and temperature measurements as described above. At steady wind (~moderate breeze or stronger) one can however be pretty sure to have overpressure – and thus infiltration conditions – over the whole windward façade, and then take the opportunity to track leakages on the inside of that façade.
Theoretically it could also be possible to lower the indoor pressure by common “blower door” technique, where a mock-up door with an integrated fan is placed in a door opening of the building, and the fan is set to blow out indoor air. Infiltration will then occur over a larger area of the building envelope. It is however likely to take a lot of fan power to get a significant effect in churches, which constitute large and often leaky volumes, and it can be practically difficult to install the fans in suitable openings. This is something we intend to test in churches in a near future. If a significant indoor-outdoor pressure difference indeed can be attained with the blower-door technique, it might also be used to quantify the leakage of the building envelope according to standardized procedures. Recently a new leak testing method has been developed – the “pressure pulse technique” (Cooper et al, 2011) – which also quantifies the building leakage, but at a fairly low (realistic) pressure difference. This technique appears to be particularly useful in churches and similar large and leaky buildings, and we are about to test and evaluate it in our future work in this area.

Gotland University Press 15
138
In the discussions above it is implicitly assumed that there is a desire to reduce the air infiltration in churches. Surely this is not always the case. A certain substantial ventilation rate might be needed to remove some troublesome indoor generated contaminants, like unhealthy emissions from mould, or airborne particles from candles or incense. In these cases temporary manual airing might often be sufficient, before (mould case) or after (candle & incense case) services in the church. Opening a porch for an hour or two results in a substantial air exchange, at least if there are some degrees of indoor-outdoor temperature diffe-rence. Several opened porches, especially if yielding wind driven cross ventilation in the church space, will greatly enhance the air exchange.
It was shown above that tightening of the crawlspace vents resulted in signi-ficantly reduced air infiltration into the church. This tightening measure can however be risky and result in e.g. dampness and mould problems in the crawlspace region. Regular inspections and humidity measurements here are advisable if this kind of tightening is practiced.
Acknowledgements
This study was funded by the Swedish Energy Agency.
References
Cooper, E.W., Etheridge, D.W., Mattsson, M., & Wigö, H. 2011. Measurement of the adventitious leakage of churches with a novel pulse technique. In: Proc. Roomvent 2011 conference, Trondheim, Norway. (Submitted).
ISO standard. 2000. Thermal performance of buildings – Determination of air change in buildings – Tracer gas dilution method. ISO 12569:2000.
Mattsson, M., Lindström, S., Linden, E,, & Sandberg, S. 2001. Tracer gas techniques for quantifying the air change rate in churches – field investigation experiences. In: Proc. Roomvent 2011 conference, Trondheim, Norway. (Submitted).

Gotland University Press 15
139
Historic Buildings as Museums
Sustainability and Energy Saving in Museums, Depots, Churches and Historic Buildings
Jochen KaeferhausMag. Dr./Technisches Büro Käferhaus GmbH, ViennaE-mail: [email protected] photos by the author.
Summary
The mostly too strong limits of recommendations or museum and archival standards (for example British Standard BS 5454:2000) often provoke too much machinery in museums and depots with the result of contradictory output. Huge air conditioning systems, big energy bills and measuring results with short term peaks endanger the artefacts.
Consequences may be that in the future we cannot any longer afford our museums or depots, especially when energy is getting more and more expensive, not mentioning the totally unsolved situation of what might happen in those strongly air conditioned museums when there is a failure in energy supply, for example when no gas is delivered.
There are many museums however, with none or a minimum of building services, which house very delicate artefacts as the “Stift Klosterneuburg” with its “altar of Verdun” of the year 1180. Climate control was never installed, but the altar has no damages at all.
Keywords
Energy saving, micro climate, sustainability in historic buildings, comfort, stability in climate, humidity, radiation heat, tempering.
Introduction
The upcoming discussion of sustainability is more than a fashion. It is a severe necessity – especially in historic buildings. That means it is very simple to build on the “green meadow” a passive house, but it needs a lot of thinking to transform an ancient building into a sustainable, energy saving building. This is the problem with our museums and depots, often hosted in historic buildings, to refurbish these historic buildings with a bunch of necessary activities – building services included.
Discussion about standards of micro climate values
The discussion about “right and wrong” micro climate and the limits is endless. The quoted articles in the annex are exemplary. Fortunately critical voices, as

Gotland University Press 15
140
from Tim Padfield and the “Fraunhofer Institute”, Holzkirchen, Germany, stress again and again the bigger importance of slow movement of the micro climate according to seasonal outdoor changes, buffered through big building masses, instead of narrow limits for the micro climate with peaks.
The “classic” demand for 50 % relative humidity and ± 5 % limit and room tempe-rature of 20 °C ± 2 °K never was proven or is a result of thorough research, but is a phantom figure; one scientist copies from the other.
These limits – depending of the kind of artefacts – are far too narrow and often have the consequence of too big machinery with centralized humidifier and complex control units, which cost a lot of money to buy, run and maintain. Often those air conditionings and control units are far too complicated and difficult to run. Often they are a source of mistakes and create peaks which damage the artefacts. The leading value for the micro climate always is the relative humidity and not the temperature, which should oscillate very, very slowly from 40 % to 60 %, depending on the artefacts.
How to reach best climate stability
• Integrated planning;• Intelligent use of big masses of the building to reach thermal stability;• Improvement of the thermal quality of the building, if possible;• Ensure air tightness and create buffer rooms;• Using best possible, intelligent shading systems to minimize external
loads;• Reducing internal loads (light, machinery) to 15 W/m² maximum;• Heating exclusively by radiation with warm walls to avoid mould;
convective heat transports dust;• Simple controlled ventilation with minimum air exchange rate to 0,5, if
possible;• Humidification, if possible, decentralized;• Simple technologies for building services and control systems.
Examples
Art Gallery in the Academy of Fine Arts, Vienna
Fig. 1. Academy of Fine Arts, Vienna.
The Art Gallery in the Academy of Fine Arts, Vienna, is a building by Theophil Hansen of 1877 and is primarily a University of Fine Arts.
The existing gallery was refurbished in the late 80’s and consists of about 800 + 400 m² of very famous paintings as “Das jüngste Gericht” of Hyronimus Bosch and others like Lukas Cranach the younger and elder.

Gotland University Press 15
141
In addition to the existing paintings gallery, a new gallery for contem-porary art, “xhibit” was created and integrated in the same part of the building with new entrance, shop and cashier’s desk.
Fig. 2 shows the situation before the refurbishment with old radiators and bad shading systems and isolating glass of bad thermal quality.
Principally the values of the indoor climate were rather stable, in winter too dry and in summer sometimes
Fig. 2. Existing situation with radiators.
too hot. Due to the lack of closed entrance as a buffer zone, the indoor climate was often influenced by bad climate in the stair case. For that reason a new buffer room to house shop and cashier’s desk was planned, as well as ventilation with cooling system with possibilities of dehumidifying.
The following measures as an integrated planning were taken (thermal improvement or insulation was not necessary due to the fact, that this floor of the art gallery is situated in the middle of the building with heated rooms below and above):
• Air tightness of the rooms and especially of the windows were planned as well as the improvement of the thermal quality of the windows, which are historic metal case or box windows and not allowed to be changed in any form. An improvement of the window was only possible by changing the glass and sealing the joints of the inner layer of the windows. The inner window got an insulating glass with an u-value of 1.1 W/m²K with a coating against heat losses from the inside. The outer glass is a single pane also with a coating against sun rays but with no change in colour so the outer appearance of the historic building was guaranteed. To get the best thermal results, several glass and coating qualities were dynamically simulated.
• As shading system a new screen was chosen after long discussions and dynamic simulations, since the conservators asked for a maximum light intensity of about 220 lux and the dean of the academy asked for a shading system with view to the outside neighbourhood of the academy. Furthermore the outer layer of the window got two small Swedish slit ventilation openings, which are closed in winter and opened in summer in order to ventilate the inner case of the window in summer. Measurements of the inner glass tem-perature in summer have proven about 10 °K less temperature of the surface of the window, compared to a window, which was not ventilated. That means with such a sophisticated shading and ventilating system the external loads are remarkably less despite the huge size of the windows (3,5 x 2,5 m).

Gotland University Press 15
142
• The internal loads of the gallery were remarkably reduced due to LED light, which was partly chosen for the gallery. The general room light towards the ceiling is also automatically dimmed upon intensity of the daylight.
• A very important item of the refurbish-ment is the creation of a vestibule with compartments where the shop and the cashier’s desk are situated, in order to control the air exchange from the stair case into the two galleries, which is no longer possible as it was before the refurbishment.
• The installed building services are very simple as for the heating. The existing radiators were dismounted and a pure radiation heat as a tempering system was mounted instead – which meant that two copper tubes were put into the plaster of the outer wall, not as a register but only two lines parallel to the bottom.
• Warm outer walls with simple thermo-stat valves help to have a constant room temperature in winter of about 18–19 °C. Hence there is absolutely no danger of mould growth since there is never condensation; we do not reach dew point with humidity on the walls, which is necessary for the mould spores to grow, because the walls are all warm. The “comfort” of warm walls for the paintings and artefacts is very important, as it is also important for the guards. With the warm walls it is easily possible and comfortable to reduce room temperature below 20 °C, which helps to avoid winter dryness without humidifying. As known, 1 °K more room temperature not only means about 6–10 % more energy consump-tion, but also about 3 % less relative humidity.
Fig. 4. View into the Gallery during works.
Fig. 5. View into the buffer room.
Fig. 3. Summer ventilation system of the shading in the box window.
Fig. 6. Copper tubes for radiation heat in the walls (tempering).

Gotland University Press 15
143
• For cooling and ventilation, a cooling unit of 27 kW was placed as a single unit on top of the lift shaft on the roof. Inside the building on top of the lift shaft, under the cooling unit, in a very small plant room the ventilation unit of 6.000 m³/h, which means an air exchange rate of 0,5–2, was installed. A heat recovery system of a rotating wheel was also built to reach best possible heat recovery (90 %) and also humidity recovery (enthalpy wheel).
Fig. 7. New convectors under the historic windows.
• In the part of the modern gallery, the “xhibit”, an air handling unit (ahu) was installed with a capacity of 2 000 m³/h, also with the best possible heat recovery system, but without a cooling system, since this gallery is headed north and is in summer not really hot, due to the big building masses. An existing chimney was used to have a clandestine air intake and exhaust opening, which is not seen from outside. The Austrian monument authorities asked for these details, in order not to destroy the historic ambiance of the building through building services. The air of the 6 000 m³/h ahu is taken through a historic tunnel in the ground, surrounding the building to keep the foundation dry. The size of this tunnel is about 1.70 m high and about 1 m large and is made of bricks. This air intake through the tunnel cuts extreme temperature and humidity peaks in summer and in winter.
• The existing historic vertical chimneys were used for the distribution of the air in the building, and far distance jet nozzles bring the air in the gallery, totally without any visible ducts.
• The ventilation is activated when the air quality sensor exceeds a CO2 concentration of more than 1 200 ppm, which very rarely occurs, due to the great air volume of the rooms. Generally the ahu is activated, as a first priority, when the air quality is bad. Further, the ahu will be activated, when there are favourite conditions for the micro climate in the gallery, by comparison of absolute humidity and temperature inside and outside. When ventilating, it is very important to start ventilation very, very slow until the necessary rpm, to avoid peaks in the microclimate. Cooling will be activated in summer, when room temperature exceeds 26 °C, which was not necessary last summer (2010). Therefore the energy needs for cooling and ventilation were almost zero. Only for heating in winter a specific amount of approximately 50 kWh/m² was necessary.
• The rest of the housing services are standard and known. Good and cold light and best possible security.

Gotland University Press 15
144
• The last item is interesting: indoor air quality and pollution. A subject, often forgotten, especially during refurbishment, since lots of paint and chemistry is used during work. Therefore the walls on which the paintings are mounted, were filled with lamb’s-wool and small, silent and very slow working ventila-tors circulate room air through the keratin fibres, which have purifying effect, above all against formaldehyde.
• Finally, the question of centralized or decentralized humidification was really thoroughly discussed. Fortunately the existing decentralized humidifiers were accepted and no centralized system with the ahu was asked for, since these systems mostly create problems and they are always a source of germs and mould. In addition, they are energy consuming because they make the venti-lation work all the time.
Depot in the ground floor of the Academy
The next example is a very sustainable depot with high climate stability in the ground floor of the same building, which had to host all the precious paintings during refurbishment. It was a very unsuitable and humid room of approximately 300 m², which was improved in a very short period.
With little time and money, with new concrete floor and new storage racks, new simple light and new doors, this depot was ready within three months. In the beginning there was even more humidity due to the new concrete floor.
For heating, drying of the walls, and stability of micro climate, a wall heating system (tempering) was installed. This helped to reduce the humidity in the room.
For ventilation in the depot, a 400 m³/h air handling unit, normally used in passive houses, with 90 % heat recovery was installed.
The control of the ventilation follows the same rules as in the “Art Gallery” three floors above.
Fig. 8. Simple wall heating in the depot against humidity and for climate stability.
Fig. 9. Depot ventilation.

Gotland University Press 15
145
The results were astonishing: The stability of the micro climate in the depot was unique, only sometimes in the summer did the limits of relative humidity exceed 65 %. Hence a dehumidifier was installed.
The investment costs as well as the running costs of the depot are minimal.
The “Ciesa San Colombano”, Bologna
Next example of an integrated, sustainable refurbishment was the transformation of the Church St. Colombano in Bologna with Roman roots into a museum of harp chords of the world famous collection of Maestro Tagliavini.
The principles for climate stability are the same:
Air tight shell, (heavy) insulation of the roof, shading, buffer room at the entrance, wall heating and controlled ventilation.
In the first floor, the installation of the heating was most difficult, due to the wooden covers of walls, seats and even floor and paintings on the wall. Therefore the radiation heating system was installed invisible beneath the wooden benches.
Despite the ambitious planning, the last corrections of the heating control were not possible, since in some rooms it was far too warm, which means also far too dry, less than 40 % relative humidity, which is unacceptable for wooden
Fig. 10. View into the “Chiesa San Colombano”.
Fig. 11. View into a room on the 1st floor with heating under the wooden bench.

Gotland University Press 15
146
instruments. Instead reducing the heating from 24 °C to 16 °C, humidifiers should be bought, which makes no sense.
Another obstacle was that the control unit for the ahu was not set right, the cooling effect of night cooling in summer could not be achieved. This is unfortunately a situation that often happens when control units are not installed correctly.
Fig. 12. View to the “Sala Terrena” of Stift Klosterneuburg.
Fig. 13. View to the “altar of Verdun”.
Fig. 14. View to the wooden wings of the “altar of Verdun”.
The Stift Klosterneuburg
Stift Klosterneuburg is unique for its rich early medieval art as the “altar of Verdun” (a very rich enamel work) and the painted wooden wings from the same altar.
During the refurbishment in 2008, pure radiating heat as wall heating was installed, where possible with little ventilation.
Since absolutely no dust was allowed near the altar, for more comfort one wall was covered with clean, dry plasterboard with integrated tubes for heating, which served as source of radiation heat. A little ventilator in the wall with filter brings fresh air, when favourable, through comparison of absolute humidity and temperature, inside and outside.
The medieval room got a wall heating and controlled ventilation from the ground floor.

Gotland University Press 15
147
The underground book depot in the Monastery of Einsiedeln, CH
For the numerous and precious books of the monastery of Einsiedeln an under-ground depot (500 m²) is built and the existing historic building will be trans-formed into a library.
Various dynamic simulations have proved that cooling of such an under-ground depot with continuous ground temperature of approximately10–13 °C is not necessary.
Fig. 15. View to the Monastery of Einsiedeln.
Fig. 17. View to the depot in the ground and the future library.
Different insulation keeps the balance of heat losses and gains in the depot and tempering in the walls, which got a clay plaster for humidity exchange, avoid mould and keep a minimal temperature between 18 and 22 °C.
Ventilation of 0,5 to 2 air exchange rate is planned. For heating the depot waste heat from the IT trough a heat pump is used.
Fig. 16. Principle of the book depot in Einsiedeln.

Gotland University Press 15
148
The Museum of Fine Arts, Vienna
The museum of Fine Arts, Vienna, hosts very famous paintings. Due to insuf-ficient thermal quality of an outer wall towards the court yard in combination with a wrong convective heating system, mould was found at the back of the paintings and on the drapery of the wall.
As known, mould spores are everywhere. The moment they find humidity like in our case because of condensation, they begin to live and grow.
In the middle of all show rooms seats with integrated convectors and steam humidifiers circulate room air, dust and humidity towards the ceiling as shown below. Near the cold outer walls the chilled room air falls down, leaves humidity and damages the paintings with mould. This situation occurs very often.
To solve this critical situation, only heat to the wall brings a solution, which was done by a tempering system on the wall, under the drapery, where the paintings hung.
To avoid causing any harm to the precious paintings, numerous sensors were installed and the energy consumption was counted, after the convectors in the middle of the room were put off, as well as the humidifiers. Both became redundant.
Fig. 18. View to the Museum of Fine Arts, Vienna.
Fig. 19. View to the cold outer walls to the court yard.
Fig. 20. View to the wall, affected with mould.

Gotland University Press 15
149
The most fascinating result was the reduction of the specific energy consumption of this room, which was about 140 kWh/m² before and 70 kWh after the refurbishment.
There was no more need neither for the convectors in the middle of the room nor for the humidifiers.
Fig. 21. Mould on the back of the paintings.
Fig. 22. Wrong convective heating system.
Fig. 23. Wall heating on the cold outer wall.

Gotland University Press 15
150
Results
• We cannot any longer afford costs and bad micro climate in museums due to complex machinery;
• History has shown that stability of indoor climate is not a question of big housing services;
• Passive methods of climate control are sustainable, more affordable and sure;
• We have to discuss the reasonable limits of micro climate especially of relative humidity;
• The slow change of relative humidity is more important than the discussion about figures.
Conclusions
Sustainability, energy saving and stability of climate is not a question of machinery or building services. It is the result of integrated, intelligent planning including using the masses of the building.
Shading, air tightness, buffer rooms, minimal internal and external loads, small ventilation, radiation heat, decentralized humidification are the colons on which sustainable planning are based on.
References
Kaeferhaus, J. 2010. Nachhaltige Renovierung museum aktuel, München, (2010), Seite 25–28.
Kaeferhaus, J. 2005. Quo vadis Austria museum aktuel, München, (2005), Seite 62–66.

Gotland University Press 15
151
Solar Collectors in a Roof Landscape
Balancing Change and Preservation in a World Heritage Site
Annette HenningSolar Energy Research Center (SERC), Dalarna University, SwedenCorresponding email: [email protected]
Summary
Social anthropological theories and methods have been used to study varying views on the appropriateness of placing solar collectors on historic buildings. A basic purpose is to contribute to increased knowledge on how the two national interests, preservation of historic buildings and promotion of energy efficiency, could both be met. The research involved a case study with observations and qualitative interviews in Visby, Sweden. Varying ways of balancing change and preservation depend on professional training, on the history and construction of each specific house, and on perceptions of aesthetics and a convenient home. They also depend on a buildings’ educational and illustrative power as well as to its function as a dwelling. The discussion links the differing opinions on solar collectors and buildings to vague or overlapping boundaries between private and public space, in terms of geography as well as ownership, responsibility and statutory power.
Keywords
Solar collectors, heritage dwellings, change and preservation, private and public, social anthropology.
Introduction
Solar thermal systems may reduce the consumption of purchased energy for heating buildings. However, solar collectors are also prominent artefacts, usually situated on the roof or the façade of a building. Such attributes can be perceived as particularly problematic when the appearance of the building is of major importance, as is the case with houses deemed worthy of preservation for coming generations.
The paper is based on a case study carried out in Visby, a walled Hanseatic town and World Heritage Site on the island of Gotland, Sweden. The basic purpose of this research is to contribute to increased knowledge on how two Swedish national interests could both be met; the one being preservation of historic buildings, the other a shift towards more energy efficient heating systems and renewable energies. Social anthropological methods are used for the more specific aim of investigating varying ways of perceiving historic buildings used as homes, and solar energy as a possible heating solution for such homes. Theories on material culture, landscape, house and home, and space and place are important for the discussion.

Gotland University Press 15
152
Methods
In October 2010, a social anthropological fieldwork with emphasis on ethno-graphic interviewing (Bernard, 2002:204f) was carried out in the town of Visby. Interviews were made with twelve individuals, five of whom in their professional roles as employees of the local energy company, energy adviser, architect and antiquarian. Seven men and women were interviewed in their role as house-owners. Each of these households had shown an interest in having a solar thermal system installed in the house. A majority of all interviewees had been born in Visby and/or had lived in the walled town for the greater parts of their lives. Several house-owners ran businesses of their own.
One man was interviewed over the telephone on two occasions. The others were visited in their homes or at their places of work. The ambition was to meet both the man and the woman in each of the resident households, although this was achieved in only two cases. After interviews of between one and two hours, a tour was made around the house. Photography was used as a help for my informants to tell their stories of how they had made their house a convenient and aesthetic home (Henning, 2007; Pink, 2004). Photography was also used as a way of becoming more observant conserning buildings, ’street views’, ’roof landscapes’, and intended sites for solar collectors.
Background
Islanders in a walled town
Of a population of 57,000 on the entire island of Gotland, 23,000 live in the Visby area. Of these, almost 3,000 live within the walls. On one side of the wall, there is the sea. The other side of the town climbs a hill, allowing for good views over house roofs and church ruins. During ten summer weeks, Gotland is invaded by several hundred thousand tourists and summer residents. Farming and tourism are important sources of income for the population. Despite a big public sector and high degree of enterprising spirit, job opportunities are few. The young tend to leave for the mainland to find work or further education, sometimes only to return on their retirement. When the intramural city of Visby was added to the World Heritage List in 1995, UNESCO stated that ’Visby is an outstanding example of a north European medieval walled trading town which preserves with remarkable completeness a townscape and assemblage of high-quality ancient buildings that illustrate graphically the form and function of this type of significant human settlement’.
Solar thermal systems in Sweden
A solar thermal system for the single-family house in Sweden consists of a solar collector, a heat store in the form of an insulated tank filled with water, and connecting pipes, a pump and a heat exchanger. In Sweden, small systems produce domestic hot water from May to September. More common, however, are the larger combi-systems, which also provide hot water to the house heating system from early spring to late autumn. In order to produce up to fifty percent

Gotland University Press 15
153
of the total annual heating, the size of the collector and its angle of inclination are vital, as is the size and construction of hot water stores (Lorenz, 2010). The annual insolation is about ten percent more in Visby than in the rest of Southern Sweden (Broman, 2007)
Preserving historic buildings
The population on the island of Gotland is not very large, and even fewer live in Visby. Many of them know one another, or know of one another:
’On Gotland, everybody appears in every context. A client is a deliverer next time we meet, so to speak. And a client may sit on the municipal executive board in another context. You have two or three relations with every client. (...). Authority clients and company clients and local government and politicians. They are everything ..., they are clients and deliverers and stand for decisions and the like. The whole way. So, all this often becomes a circle, so to speak. Because of this, it is quite important that you have some kind of common view on what you do. In a place like Visby, and Gotland as a whole’ (man from the energy company).
Considering the fact that the population in intramural Visby amounts to merely three thousand people, and that many of these have lived and worked there for decades, sometimes since childhood, social networks are sure to be tight and cross-cutting. Still, the interviewees repeatedly explained to me that there are two camps in Visby with the ’Preservers’ on one side and the ’Renewers’ on the other.
Two camps?
Most of the householders who were interviewed saw the population this way, as clearly split into two kinds of people with diametrically opposing views. One side was said to demand complete conservation of the town, while the other would demand change, or ’development’, as some would put it. At first sight, this certainly seemed to be true. Those who were set on preserving old Visby expressed their regret that owners of historic homes tended to tear out everything to make the interior bigger and more modern, often leaving only a shell of original outer walls. At the same time, house-owners would angrily tell me how they were not allowed to do anything, that every single thing was forbidden!
The interview material strongly indicates that those who are placed closest to the idea of ’preserver’ are the most likely to become the target for criticism. According to the informants, these people are either inconsistent or say no to everything because it is the easiest way out. They could be depicted as being bureau-cratic and having a certain mentality, a limited view of things. They would even be described as the work of the devil and, according to some politicians, highly dangerous in their prevention of ’development’.
Ideas of who these preservers are differ somewhat. Some would say that they work for the local authority, while others would point out the museum or the county administrative board. Someone would mention politicians or decision-

Gotland University Press 15
154
makers more generally. Preservers could be described as mainlanders (’fastlän-ningar’), and assumed to live outside the walls themselves. Someone perceived the split as standing between the local authority, who want change, and the county administrative board, who want to preserve. Almost in line with this statement are the descriptions of disagreements between local politicians and larger companies, on the one hand, and civil servants with responsibilities regarding the World Heritage, on the other. By placing these varying opinions of so called ’preservers’ together, we do not produce a clear category of real people. What we do get is a general idea of an ongoing discourse.
Balancing change and preservation in a town of strong historic value, where people still live and work, is obviously a most difficult task. The many angry or frustrated comments clearly point at strong disagreements between individuals or groups with varying views on how such acts of balance should be performed. The differences seem a lot more intricate and complex than some would claim, however. Titles like ’preservers’ or ’renewers’ were practically always applied to others or to the others’ perception of themselves. Not one of the interviewees considered themselves to be solely pro change or solely pro preservation. They belonged to a more balanced ’third kind’, as someone put it: ’Because there are people like me and my wife as well. And we are on both sides’.
Balancing change and preservation
Everyone, regardless of profession and background, seems to have an interest in the history of the town and its houses, as well as in how this built environment may be altered. They definitely differ in the degree to which they accept change, however. Another obvious difference lies in the kind of alteration they are promoting or willing to accept. The wide variations of how change and preser-vation are balanced are certainly linked to professional training and practice. But they may also be linked to the history and construction of each specific house, as well as to current ideas of an aesthetic and convenient home.
I was told how something new had begun when the biggest employer in Visby had started to use media as an additional way to put pressure on politicians and the local building committee. Some of the interviewees told me how the management were not only using the image that Visby lent their company, but that they actually had a genuine interest in the town and its old houses. Still, this is a big expansive company with needs of its own. Gardens have been turned into parking lots, new houses have been erected, radical interior changes have been made, and houses of varying ages have been connected by a footbridge or a two-storey underground space. I was told that there were leading politicians who saw such changes as something very positive and entirely necessary. One of them had even declared explicitly that he would not allow the world heritage status to prevent ‘development’.
Another difference, which seems to have occurred during the last decade, was the way house-owners had began to treat their houses.
‘When you buy a house, you want to remake it. A lot! It is not enough to buy a house to live in, but you buy a house as a

Gotland University Press 15
155
starting-point for an idea you have of how you want to live. Which means that... First of all, it has become much more expensive in Visby. So, those who buy houses often have a lot of money. And, after the investment they realise their dream. And then, they put in a lot of money to remake the interior. So, most of the time they tear out everything! And sort of start anew, from the inside, leaving only an empty shell. (Researcher: And it was not like this before?) No, it was not like that before. This is something new’ (Building antiquarian).
Still, these changes were understandable, I was told. The houses had to be adap-ted for the life people live today. Furthermore, the special wooden houses from the eighteenth century are very small, the antiquarian told me, and so one could understand that someone who has paid a lot of money wants to do something with such a house. Still, the radical changes were also considered somewhat unfortunate. Together with the torn out material, knowledge about how people used to organise their homes would disappear. ‘It is a difficult balance’, he said. ‘It really is’.
According to the energy adviser, many of those who decide to make their houses bigger, as well as to replace their old heating system, have been summer guests or islanders who have been working on the mainland and who now had decided to move back for good. Even though most of the households who were interviewed in this study are not fully representative of these descriptions, they showed similar tendencies. These house-owners were kind enough to show me their homes, or parts of their homes. The interior of these houses were not altered altogether. Still, there were always changes, some more radical than others. Walls could have been moved or taken down, a hallway could have been constructed between two houses, or new windows could have been put in to create more light or better view, etc.
Such changes do not contradict the fact that these house-owners very obviously care about their houses. They seemed knowledgeable concerning the history of the house, and also used differing ways of illustrating its age. Some would have drawings on the wall, depicting their house or previously empty site at an earlier time. Others had, for instance, removed the wallpaper and insulation to reveal a characteristic old wooden wall, or decorated one of the rooms in nineteenth-century style. One person had lovingly saved a worn threshold leading into the previous kitchen. Furthermore, some of them had put in quite a lot of effort to restore and maintain their property. One house had even been rescued in a situation when it was in a really bad shape, parts of it having settled nearly half a metre.
‘I believe’, one man said, ‘that when you grow up in a place like this, and have always lived here..., particularly when you have been to the mainland and seen these awful medium sized towns. How disgusting it can be. So, I care very much about this town! At the same time, my opinion is that each generation should be allowed to make its imprint. And put its signature, so to speak, on the work of art’.

Gotland University Press 15
156
Heating historic buildings
The heating of the walled town seems to follow a pattern which is remarkably similar to any other densely populated site in Sweden. The district heating is mainly based on bio-fuel, and the pipe-lines are extended where it is considered profitable enough. In any case of hesitation or delay in this, people who live in the area (or street in this case) will have started to drill for ground heat pumps or to install pellet boilers or air-to-air heat pumps, thereby withdrawing the clientele base for district heating (Henning & Lorenz, 2005).
There are two aspects which differ somewhat, though. One is an increased difficulty in being connected to district heating, in some parts of the town more than others. According to the energy company, it is three times as expensive to lay district-heating within the walls, as compared to outside. This is mainly due to the manual work with putting the paving-stones back in place when the street has been dug up (for the pipe-lines) and refilled. Since large house-owners, institu-tions and business premises have been prioritised, it has been easier for others who live close-by to connect to district heating. A couple of the town-dwellers I spoke to were of the opinion that an important reason why the energy company had decided not to extend the pipe-lines to their street was because it was ‘one-sided’. There is one of these huge church ruins on one side and also a park, leaving only a small line of little houses on one side of the street; too few and too small for district heating to be considered profitable.
The other aspect which is characteristic for intramural Visby is the difficulty of being granted a building permit for solar heating. This difficulty, or even a belief that solar collectors were forbidden within the walls, seemed to be spread among the population. At the same time, rumours reached me that several ‘illegal’ solar collectors were hidden in the town (although few seemed to know where). And on several occasions, my interviewees would assure me that there have been quite a few applications for building permits. When I questioned this (I had only found three documented cases in the last ten years) they would become more vague and uncertain. According to the energy adviser, most of those who get in contact to learn about their options regarding solar heating choose not to take the risk of paying an expensive fee for a building permit application.
Motives for installing solar heating (and experiences from having used it)
In one of the five interviewed households, the man had sent in a letter about his wish to use solar heating and had received a written reply signed by the town architect. A second household had had a solar thermal system for almost seventeen years without ever asking for a building permit. The remaining three households had all asked for building permits for installing a solar thermal system in their houses. Of these, one had been granted a building permit. A second household had withdrawn the application after a while. And the third household had had the application turned down. They had appealed against this decision, first to the county administrative board, and then again to the Swedish adminis-trative court of appeal, where the case still lies.

Gotland University Press 15
157
The two women who took part in the interviews were both motivated for a solar thermal system because of its non-polluting character. The five men varied somewhat in their motives. One man told me that he wanted to save energy by being able to switch off the electricity and air-to-air heat pump during summer and parts of spring and autumn. Another man wished to use solar heating as the main house heating, adding bio-pellet only as an auxiliary heat source. His primary motive for this was convenience. With solar heating, he would not have to attend to the pellet boiler every week of the year. A third man was primarily motivated by having such a perfect space available for a solar thermal system. There was an extension to his house, originally built as a garage. Inside this previous garage there would be plenty of room for sizable hot water stores. And the roof, which had a slight tilt towards the south, would be a perfect site for a collector. Furthermore, he told me, it would be impossible for passers-by to see the solar collector. An additional motive for three of the men was the fact that they saw solar energy as a very inexpensive form of energy:
‘A form of energy which is free of charge must be better in the long run. In principle, you have at least thirty years of free energy. The only costs are for a pump which goes on and off. So, in that way, it certainly makes sense’ (first man).
‘I think it is quite obvious. It is the least expensive fuel you can get. God the Father has created it – if you believe in such things. Moreover, there are so many hours of sunshine here on Gotland’ (second man).
‘Well, the price for oil increased. And if you can get hot water for free during summer, at least, rather than burning oil, that is of course very much better’ (third man).
Two of the households had actually had the opportunity to install a solar thermal system. One of them was the only household who had been granted a building permit. When this solar heating system was installed in 2008, the male househol-der had had a high ambition to hide the solar collector really well. A drawback with this ambition, as it turned out, was that the collector had to be kept really small in order to fit the only south-facing slope of the roof which overlooked the yard and was difficult to detect from outside. He had also used a previous hot water store in order to keep the costs down. As a consequence, he was now rather dissatisfied with the performance of the system.
The other house-owner was a lot more pleased with his solar thermal system. It had worked well since he installed it seventeen years earlier, heating from the middle of February, almost through to December. He regretted the fact that he could not make better use of all the hot water it produced during summer, though. In 1993, he never got to apply for that building permit. This solar collector is ten to twelve square metres, as compared to four and a half in the previous case. Still, placed on a south facing roof in a yard surrounded by buildings, it is equally hard to detect (or even harder).

Gotland University Press 15
158
Motives for acceptance or rejection
A solar thermal system differs from other heating systems in that one of its components – the collector – is preferably mounted on the roof of a building, or integrated into it. It is only this component, and the fact that it is attached to the outside of the building, that is the reason for the building permit requirements. Thus, despite the fact that solar thermal systems may have sizable hot water stores, the way this part of the heating system may affect interior spaces in the building is never evaluated. In formal as well as informal discussions, the visibility of the solar collector is the primary basis for evaluation. Preferably, it should not affect your impression of the town when you walk along the streets or look down upon it when standing on the hill. The siting of the building is evaluated in relation to this ‘street view’ and ‘roof landscape’, but judgements are also made of the way the collector blends into the building without changing characteristic roof materials or the form of the roof.
House-owners’ choice of heating system is normally considered a private affair. Even though there are special recommendations for the walled town in the municipal energy plan (Gotlands kommun 2010), householders’ decisions to heat their houses in one way or another are not usually questioned by the local authorities. There is one exception to this though. Solar thermal systems are the only kind of heating systems where a person in authority would go in and ascribe economic values to a house-owners’ choice of heating system; values which the house-owner does not necessarily share. Thus, a presumed low economic profit for the household is often an important motive for municipal architects and the local building committee to reject or advise against the installation of solar heating.
Discussion – changes of private and public space
A surprising result from the case study in Visby Town is the fact that the two national interests I had set out to study; the preservation of cultural heritage and the shift towards more renewable and energy-efficient use of energy, rarely seem to meet. We saw how not even solar collectors were handled as a clash between these two national interests, but as a matter of weighing the common good of preservation against an assumed private gain.
The way people act and discuss their conflicts, disagreements and expressions of emotion mainly concern one of these national interests – The preservation of Visby as a World Heritage Site! Opinions on the kind of changes, as well as the degree to which changes should or should not be allowed within the walls, differ widely. House-owners got frustrated when they had to ask for permission each time they wanted to make a small alteration to their house. At the same time they saw that politicians themselves could move out several hundred of their employees, thereby heavily reducing the number of customers for restaurants and shops. Politicians, for their part, would get frustrated when pressed to choose between preservation and the employment the big company promised in return for change.

Gotland University Press 15
159
Interestingly enough, there is, at the same time, a high degree of consensus regarding which space could be altered and which space could not. There is, in this, also a clear priority of the ‘experience value’ over ‘documentary value’ (Robertsson, 2002). Thus, everyone agrees that street-facing façades are not to be adjusted or modernised. Regarding the interior of the house and the enclosed gardens, there is an almost equally strong silent agreement that the authorities should not interfere with changes that are made (exceptions are buildings with very strong protection). These radical differences in how street-facing façades and interior space are perceived and handled are strongly backed up by their differing support in law. While changes in street-facing façades cannot be carried out without a building permit, radical indoor changes preferably should be, although rarely are, reported (‘bygganmälan’). There seems to be less agreement on whether roofs and yard-facing façades are to be considered a public or private concern. It is also within this context that we should understand a discussion on solar collectors.
Street-facing façades
As the exterior of a house can be observed by every person who passes by, it is always the most public part of a home. The possibilities of controlling the ways in which others perceive the house and (thereby) its inhabitants, is primarily restricted by economic resources when choosing a house or by the ability to work upon the façade. Consequently, people may use their houses, either to draw attention to them or to avoid such attention (Waterson, 1996). The latter is usually the case in Scandinavia (Henning, 2000).
The project results indicate almost total consensus concerning street-facing house façades in intramural Visby. It is taken for granted that a permit is required for the alteration of a street-facing façade. The colour, material and general appearance of this part of the house is rarely called into question. This space seems to be accepted and respected by all actors as a public space which is to be preserved. Street-facing façades tend to be restored with great care and in keeping with past tradition, and it is only occasionally that someone sighs over the costly special materials which have to be used. Along the alleys and cobbled streets, many well-kept houses, often adorned with roses, can be seen. Such houses convey an impression, not merely of passive acceptance of the strict rules, but of active engagement by many inhabitants in enhancing this most public space of their home.
No one would even dream of putting up a solar collector on a street-facing façade. The air-to-air heat pump is an interesting case here though. Rather than hanging the external parts of the heat pumps on the house wall, they are generally placed on the ground about ten centimeters from the wall. When attached to the house in this more indirect way, they are no longer perceived as being part of the house, and no building permit is required. Air-to-air heat pumps give a good illustration to the importance given to the building, as compared to the street and other surroundings.

Gotland University Press 15
160
The air-to-air heat pump also illustrates a certain lack of coordination when it comes to planning and regulating the energy supply in intramural Visby. The local energy plan advised against air-to-air heat pumps due to risks for noise distur-bance in this densely populated town (Gotlands kommun, 2010:14). However, since the choice of a heating system is considered a private affair, it has still become a popular heating alternative. I was told that, now and then, neighbours complain about noise to the local board for health and environment, just as the energy plan predicted. Another problem which may occur with heat pumps is that they stick out too much into the street. In this case, it is a matter for a third instance; this time the local technical board.
The interior and enclosed gardens
As never before, people in Scandinavia take an interest in making their houses into homes. Although most people no longer spend time on making clothes or jam, they spend more and more time, money and energy on decorating their homes. They do not just renovate their homes or rearrange their furniture when they move or when things get worn out; they do it for the sake of renewal in itself (Garvey, 2001; Gullestad, 1992). Or rather, they do it in order to express values, lifestyle, identity and social standing (Junkala, 1998; Miller, 1992). And they do it to prove to themselves, their friends and their relatives that they are a ‘real’ family (Gullestad, 1992).
My previous research has taken me to families in existing twentieth century homes as well as to those with a pre-fabricated house under construction. When starting the present research, I was curious to learn how people manage to create a personal home out of an eighteenth or nineteenth century house. I imagined that such an old house would severely limit their freedom of action. However, it turned out that there was not so much difference as I had expected between the treatment of the interiors of these houses and those of modern houses.
Although we live in a time with an extreme interest for the refurbishing and redecorating of homes, and despite the fact that Visby has been appointed a World Heritage, few seem to see this contradiction as a problem. One of the (minor) consequences of this is that indoor heating components, such as hot water stores, are not an issue.
The small enclosed gardens, of which there are quite a few in Visby, seem to be perceived as direct extensions of the private interior of the house. In the Mediterranean area, windows, doors, balconies or open yards are often used as adjustable links between the outside and the inside, the public and the private (Birdwell-Pheasant and Lawrence-Zúniga, 1999; James and Kalisperis 1999). However, unlike the Mediterranean region, in Scandinavia there is often a sharp boundary between outdoor and indoor activities (Gullestad, 1992; Sjögren 1993). We also seem to be careful not to trespass on the private sphere of a garden. Björklund (1983) and Sjögren (1993) argue that, despite the fact that Swedish gardens can have invisible borders, seemingly just continuing out into a forest or meadow, Swedish children tend to be trained from an early age to judge where private property ends.

Gotland University Press 15
161
Discussions during the interviews, as well as previous discussions concerning one of the building permit applications, indicate that a solar collector placed on the ground in one of these enclosed gardens would not be considered a problem. Since the solar collector would not be attached to the house, no building permits would be required. Furthermore, it would be standing in a private space, hardly visible to the general public.
Roofs and yard-facing façades
The results indicate that the private space of the garden spills over to that side of the house which faces the garden. There seem to be a more general under-standing that it is possible to alter this part of the outside of the house. Should this be the case, it would open up for another possible site for solar collectors. A more common location, however, is the roof.
‘From down there it would be possible to see it, from a distance of twenty metres at that house there. And then on this street, it would be possible to see it from a distance of five metres. And that was not acceptable, they said. Then I thought, I do not give a damn any more!’ (house-owner who with-drew his building permit application)
One way of interpreting the varying ideas of the degree to which the solar col-lectors should be visible or invisible, is to see the roof as two things. First, for the house-owner, the roof is first and foremost a part of his or her house. It is prima-rily private property. From a building antiquarian perspective, however, all roofs are primarily public. From this perspective, each roof is a piece in a bigger pic-ture; in a ‘street view’ or a ‘roof landscape’, and as such it is a very visible illustra-tion of our heritage. Recent landscape theories can be one way of understanding the in-built conflict in this. Thomas (2001) says, for instance, that the reason why certain conflicts will not easily be resolved through mutual understanding is that different worlds are occupying, or at least overlapping, the same physical space. The roof in the quotation above is both private and public space. A solar collector could easily have been fitted into the first, although with a lot more difficulty into the second.
Suggestions
A general conclusion from this study is that neither the value of preserving the walled town of Visby, nor the value of being able to heat this town in a renewable and energy-efficient way, is fully taken seriously. Suggestions to remedy this would be to find ways to finance an extension of the district heating pipe-lines, to coordinate responsibilities for different heating systems, and to stop using assumptions of private gain as a ground for rejecting building permits for solar heating installations. With a more conscious and overall estimation of the changes that should be allowed on this World Heritage Site, well designed and placed solar collectors may even be considered suitable imprints of our time.

Gotland University Press 15
162
Acknowledgement
The research was financed by the Swedish Energy Agency. I want to thank my informants for sharing their experiences with me.
References
Bernard, H.R. 2002. Research methods in anthropology. Qualitative and quantitative approaches. New York, Oxford: AltaMira Press.
Birdwell-Pheasant, D. & Lawrence-Zúniga, D. 1999. Introduction: Houses and Families in Europe’ In: House Life. Space, Place and Family in Europe. D. Birdwell and D. Lawrence-Zúniga (eds). Oxford, New York: Berg.
Björklund, U. 1983. Fritidsdrömmen. Ideal och verklighet i östsvensk skärgårdsbygd. In: Hjort, A. (ed), Svenska livsstilar. Om naturen som resurs och symbol. Stockholm: Liber Förlag.
Broman, L. 2007. Solar Engineering – a Condensed Course. Edition January 2007. Compendium, Dalarna University.
Garvey, P. 2001. Organized Disorder: Moving Furniture in Norwegian Homes. In: Miller, D. (ed), Home Possessions: Material Culture Behind Closed Doors, Oxford and New York: Berg.
Gullestad, M. 1992. The Art of Social Relations: Essays on Culture, Social Action and Everyday Life in Modern Norway. Kristiansand, Norway: Scandinavian University Press.
Gotlands kommun. 2010. Energi 2010. Förslag till energiplan för Gotland.Henning, A. 2000. Ambiguous Artefacts: Solar Collectors in Swedish
Contexts. On Processes of Cultural Modification. Stockholm Studies in Social Anthropology 44, Stockholm: Almqvist & Wiksell International.
Henning, A. 2007. Värmesystem i vardagen. Några småhusägares erfarenhet av att byta värmesystem. Falun: SERC, Dalarna University. ISSN 1653-6908, ISBN 91-8667-603-2.
Henning, A. & Lorenz, K. 2005. Flexibla lösningar som strategi för ökad anslutningsgrad. Svensk Fjärrvärme. Värmegles 2005:17.
James, A.V. & Kalisperis, L. 1999. Use of House and Space: Public and Private Family Interaction on Chios, Greece. In: Birdwell-Pheasant, D. and Lawrence-Zúniga, D. (eds), House Life. Space, Place and Family in Europe. Oxford, New York: Berg.
Junkala, P. 1998. Man and Home. In: Ethnologia Scandinavica 28: 108–16.
Lorenz, K. 2010. Solvärme i nybyggda hus. In: Henning, A. (ed.), Klimatsmart villavärme? Solvärme, nya byggregler och möjligheten att förändra. Skriftserien Flexibla värmesystem, del 4. Centrum för solenergiforskning SERC, Högskolan Dalarna.

Gotland University Press 15
163
Miller, D. 1992. Material Culture and Mass Consumption. Oxford: Blackwell.
Pink, S. 2004. Home Truths. Gender, domestic objects and everyday life. Oxford, New York: Berg Publishers.
Robertsson, S. 2002. Fem pelare – en vägledning för god byggnadsvård. Uppsala: Riksantikvarieämbetet.
Sjögren, A. 1993. Här går gränsen. Om integritet och kulturella mönster i Sverige och Medelhavsområdet. Värnamo: Bokförlaget Arena.
Thomas, J. 2001. Comments on part I: intersecting landscapes. In: Bender, B. & Winer, M. (eds.), Contested landscapes. Movement, Exile and Place. Oxford and New York: Berg Publishers, pp. 181–188.
Waterson, R. 1996. Houses and Hierarchies in Island Southeast Asia. In: Carsten, J. and Hugh-Jones, S. (eds.), About the House: Lévi-Strauss and Beyond. Cambridge: Cambridge University Press.

Gotland University Press 15
164
Using an Epidemiological Approach as a Supporting Tool for Energy Auditing of Culturally and Historically Valuable Buildings
Patrik Rohdin*, Mariusz Dalewski and Bahram MoshfeghDivision of Energy Systems, Department of Management and Engineering,Linköping University, Sweden* Corresponding email: [email protected]
Summary
This paper presents an attempt to combine traditional energy auditing with an epidemiological approach. The town hall in Norrköping, Sweden, has been used as a case study. From an energy auditing perspective the studied building repre-sents a heavy stone structure with high infiltration rate and poor insulation. From an indoor environment perspective the studied building was represented by high levels of draught, too low temperature, varying temperature and stuffy bad air. Draught, temperature problems and high levels of infiltration were also found by physical measurements. These effects could to a large degree be connected to the windows. The combination of methods presented in this paper is one way to get a wider perspective on the indoor environment and also let the people in the building voice their comments on the indoor environment, which is always of great interest, but even more so in buildings with heritage value.
Keywords
Energy audit, heritage building, IAQ, thermal comfort.
Introduction
During the past 20 years, the world demand for primary energy has doubled while during the same period the demand for electrical energy has tripled. In Sweden, energy demand in the built environment is a growing issue and the building sector accounts for nearly 40 % of total energy use. The EU Commission has recently declared that one of the most important tasks for the commission is to counteract and break the mechanisms of global warming with special focus on the reduction of greenhouse gases. However, at the present time buildings officially protected because of their historical merit or special architectural value are not subject to the energy performance requirements if such changes would unacceptably alter their character or appearance (EU 2010/31, pp.153/19).
The built heritage is also an important part of both the society and the community’s well being. The preservation of heritage not only contributes to the state of the built environment but also plays an important role in cultural identity and helps to define the character of a place (Tweed and Sutherland, 2007). In this way heritage can be seen as a major part in defining quality of life, while the

Gotland University Press 15
165
built environment also carries important meaning from generation to generation (Tweed and Sutherland, 2007).
Even though buildings are never purely functional, in cases with conventional use e.g. office or residential they still need to meet current requirements in terms of indoor climate, air quality and economy and the changes in those requirements to be considered functional buildings.
Heritage buildings require individual approaches due to their heterogeneity as this class of buildings can vary greatly, and there is no one universal solution on how to make them more energy efficient while at the same time preserving their value. The ASHRAE application handbook (2007, chapter 21) provides useful infor-mation for protection of museums, galleries, archives and non-public libraries, but heritage buildings with conventional use are not treated. Through their long existence heritage buildings may have often been modified, sometimes damaged and subsequently renovated, or adapted for new objectives. For this reason combining the conventional energy audits and questionnaire work among the building occupants seems to be promising and may provide a wider perspective while looking for the most efficient retrofit solution. An epidemiological method will be useful for describing the occupants’ perceptions and experiences of the indoor environment and can be an effective way to evaluate the results of measures (Andersson, 1998).
This paper presents an attempt to capture a wider perspective on issues that arise when combining traditional energy auditing with an epidemiological approach. This is done to integrate the occupants’ perceptions and experiences of the indoor environment in an energy efficiency context. For this study, the town hall in Norrköping, Sweden, built in 1910, was selected as a case study.
Building description
In Norrköping, the town hall has been given a building status which qualifies it to be considered a listed building. The climate of central Sweden, where the building is located, is characterized by relatively cold winters. The building floor plan and a picture of the buildings are presented in Figure 1. It was built in 1910 and on its four floors provides space for offices, as well as city archives. The usable floor area is 10,040 m2 and presently about 140 (142) people are working in the building. The main façade faces north, and two wings facing east and west give the building a U-letter shape. The centrally located 75-meter-high tower presently has no occupied zones. The walls of the building are made of brick and sandstone, with a thickness ranging from 0.65 m at the top to 1.40 m at ground level. The massive structure is characterized by large thermal mass and high thermal capacity. The thermal transmittance of the external walls ranges from 0.46 to 0.92 W/(m2K), with the average value of 0.78 W/(m2K). The top floor and roof were severely damaged by fire in 1942 and were subsequently rebuilt. The total glazing area is 13 % of the total wall area. The windows have frames made of wood and double glazing. The majority (90 %) of the 140 employees work in single offices, while the rest have their workplaces located in open space offices (8 %) or represent technical staff (2 %).

Gotland University Press 15
166
Fig. 1. The town hall in Norrköping.

Gotland University Press 15
167
The building has been renovated over the years and natural ventilation has been changed to the present mechanical ventilation system. This new system has a total of 14 air handling units (AHUs) for indoor climate control and ventilation. Ten of these AHUs supply fresh air for occupant comfort and air quality purposes. The operation schedules are adjusted to follow working hours in the offices. The other four AHUs serve the city archives with 24-hour operation, and control both temperature and humidity. Mixing ventilation with constant air volume (CAV) system is used to distribute air in most spaces.
Methods
There are two main methods used in this study, energy auditing and an epidemio-logical approach using a standardized questionnaire. An epidemiological method is useful for describing the occupants’ perceptions and experiences of the indoor environment and can be an effective way to evaluate the results of measures (Andersson,1998), an important aspect when auditing buildings with unique and unknown properties. The basic prerequisite for an epidemiological approach, as for other methods, is that it is a valid and reliable instrument to obtain infor-mation from the occupants. For this type of study some kind of questionnaire is usually used. In literature several different standardized methods are used more frequently, e.g., the RSH questionnaire issued by the Building Research Establishment in the United Kingdom, focusing on office environments, and the MM questionnaire, which was used in this study and is often used in the Nordic countries (Andersson, 1998). In this study the MM questionnaire has been used.
MM Questionnaire
Technical measurements in the buildings often show physical parameters within acceptable limits, yet occupants complain about the indoor environment. The problems reported may be: general draught, deteriorated condition of the building and its systems, neglected or insufficient maintenance of ventilation and heating systems, excessive number of people and technical equipment in relation to what the ventilation systems were designed for, etc.
The first version of the MM Questionnaire was developed in 1986 at the Department of Occupational and Environmental Medicine, Örebro University Hospital (Andersson (et al.), 1993). It has been validated and is considered to be a reliable tool when investigating indoor environment problems (Andersson and Stridh, 1992; Sundell (et al.), 1993). It has been used in a large number of studies, which enables benchmarking. The questionnaire, depending on its version, has several subsections regarding background factors, disturbing environ-mental factors, psychosocial factors at the workplace, prevalence of symptoms among occupants, perception of indoor environment (air temperature, noise, perceived air quality, etc.), and medical history of allergic diseases. The compa-rison between the pattern of disturbing environmental factors and the pattern of symptoms which occur among occupants can be made, and the results from one building can be weighed against the reference data covering working environ-ments with or without known indoor climate problems.

Gotland University Press 15
168
In the present study, the Swedish version of the MM Questionnaire for offices (MM 040 NA Kontor) was used, and the results were compared with two reference data sets (Anderson (et al.), 1990). Reference 1 (n=319) represents the prevalence of disturbing environmental factors and symptoms occuring among people staying in buildings considered to be well functioning and “healthy”. The reference material was collected in 1989 in seven office buildings and two schools in which there were no problems with the indoor environment. Reference 2 (n=5,123) represents an “average” office environment in Sweden. The responses were collected in 91 offices located in Sweden, and indoor climate problems were found in some buildings. Significant differences in answers between the study group and reference groups were checked by using the Chi-2 analysis for differences between proportions.
Questionnaire work was done in January and February 2010. One week in advance, all employees were informed by email about the approaching indoor environmental study, its purpose, and people involved. A paper copy of the MM Questionnaire with a cover letter and a prepaid return envelope was distributed to the personal mailboxes, and employees had three weeks to send their responses back by post or leave them at reception. One reminder was sent two weeks after the start date. In total, 92 questionnaires were collected before the deadline, making the response rate 65 %.
Energy auditing
Energy audits are a key feature in successful management of the energy issue, as it represents a starting point for implementing energy issues in management procedures. An energy audit aims at assessing the present energy situation at a plant. In the presented case all the major components of a building’s heat balance have been studied and measured. This includes internal gains in terms of electricity and occupants, infiltration, transmission, ventilation, time-constant, energy used for space heating and domestic hot water.
Result
Energy audit
Norrköping was among the first cities in Sweden to introduce combined heat and power generation in 1951. The studied building has a total heating demand of 1.24 GWh for 2008 (about 120 kWh/m2), which is supplied by the district heating network and distributed in the building using a hydronic heating system.
The electricity use pattern follows the self-reported working hours as occupancy-related processes are the main component for electricity consumption. The annual electricity use was 495 MWh (2008) or 49.3 kWh/m2. However, it is important to note that some spaces are unoccupied and do not contribute to the electricity use. The electricity use can be divided into four main processes: occupancy-related processes (43 %), base load (40 %), comfort ventilation (16 %), and other use (1 %). The base load for electricity is 30 kW and the following contributing processes have been identified: ventilation in archives (18 %), offices (48 %), and other loads e.g. pumps, cafeteria, etc. (34 %).

Gotland University Press 15
169
The auditing process for this type of heritage building has been different from a more conventional audit, mainly due to the lack of information about the building construction, infiltration, internal gains and ventilation system. The lack of construction plans and properties for the building materials has led to a series of measurements, archive studies, etc. to obtain the physical properties of walls, floor and ceiling. A typical blueprint is presented in figure 2.
The building infiltration rate has been measured using a decay method for CO2 in a selected number of offices. The ACH varied between 0.2 and 0.4 1/h, which exceeds values observed in modern, airtight buildings. This high infiltration rate is mainly related to the window frames in the office environments.
The internal gains (electric) have been measured using clamp meters to distribute the electricity use to different parts of the building and to make a breakdown into different processes. In addition to this the use of key cards in the building has been logged and used to distribute internal gains from occupants. By monitoring the use of the staff’s key cards it has been possible to measure the activity in the building. This activity level has been cross-connected with the survey question about individual working hours for people working in the building. The corre-lation between working hours and non-working hours is linear for electricity use as a function of occupancy during working hours and a stable base load for non-working hours.
Fig. 2. Typical construction detail blueprint from the town hall. Note the absence of construc-tion materials and properties normally found on modern plans. Photo: Marius Dalewski.

Gotland University Press 15
170
During the audit of the ventilation system air flows, temperatures, relative humidity and electricity use to power fans were logged. The temperature measurements were used to measure heat exchanger efficiencies as well as to monitor supply temperatures to the zones in the building. An example of measured temperature efficiency for two HVAC units is presented in figure 3.
Fig. 3. Measured temperature effi-ciency for two typical HVAC units. The heat recovery efficiency is plotted as a function of outdoor temperature for one hydronic exchanger (left) with 35 % efficiency and a rotary heat exchanger with 75 % efficiency (right).
MM questionnaire
Buildings should not have a negative impact on health or performance. The increasing focus on energy efficiency and conservation forces building owners to implement energy efficiency measures, which has the potential to change the indoor environment in an undesirable way. The conventional way to include these aspects in the auditing procedure is to include predictions of consequences on physical parameters. But in some cases this is not enough, especially for buildings where the construction and other relevant parameters are to a large degree unknown. In this study a questionnaire survey was used, which revealed several disturbing factors in the studied building. Figure 4 illustrates the preva-lence of disturbing environmental factors and symptoms among employees (presented as red areas), compared with the reference 1 (buildings without known indoor environment problems) marked in green. Analysis showed that four physical environmental factors: draught, varying room temperature, room tempe-rature too low and stuffy “bad” air were reported significantly more frequently in

Gotland University Press 15
171
the town hall compared to the reference population of buildings. This is summa-rized by one of the respondents as:
“summer too hot, winter too cold”
The results also show that complaints due to fatigue were more common in the town hall than in the other reference population of buildings representing healthy buildings (Reference 1).
The collected results were also compared with the second reference data set as it interesting to see how this heritage building performs compared to a normal population of offices. Therefore a comparison was made with Reference 2, representing normal quality of indoor climate in Swedish buildings. As can be seen in figure 4, draught and room temperature being too low are still two factors
Fig. 4. Disturbing environmental factors (1) and symptoms (2) reported by employees for the whole building compared with the Reference 1. Disturbing environmental factors (3) and symptoms (4) reported by employees for the whole building compared with the Reference 2.

Gotland University Press 15
172
reported significantly more often in the town hall than in the typical Swedish office environment. When a similar analysis is made separately for different parts of the building it is shown that that complaints and symptoms were not always the same on different floors.
Two physical environmental factors, draught and too low room temperature, were most frequently reported by employees having their offices on floors 1 4. In parti-cular, on the 4th floor almost 40 % of office workers complained about draught, and over 50 % reported too low room temperature (in winter).
When analyzing data regarding prevalence of symptoms/diseases among employees it is seen that hay fever and eczema occur less frequently among employees in the town hall than reported in both reference data sets. However, this difference is not significant. The prevalence of asthmatic problems is not significantly different than in the reference buildings. An excessive work load has not been reported, and work in general was assessed as being interesting and stimulating. This implies that this office environment represent a well-functioning work place.
Both physical measurements and responses from employees identified excessive infiltration as the most likely source of complains. IR thermography was used to identify unsealed windows as one major problem. Figure 5 shows a typical window in the town hall photographed from indoors during a winter day (–1.3 °C). As can be seen, the temperature of the wall decreased significantly as it is cooled by the outdoor air coming in through the leaks. The employees with work stations located close to the windows will be negatively affected by this cold air flow causing thermal discomfort. This is represented by the results from the questionnaire showing draught and too low temperature in winter. Furthermore, they are exposed to unpleasant odors, reported during the interviews, from a restaurant in the building, as well as noise and exhaust fumes generated be the city traffic.
Excessive infiltration also affects the energy use. Any additional amount of incoming outdoor air must be heated to keep the indoor air temperature within a comfortable range. Infiltration losses together with transmission losses through the building envelope must be covered by the HVAC systems. Some of the old
Fig. 5. IR camera image of window on third floor, indicating problems with drafty windows during the cold season. Photo: Marius Dalewski.

Gotland University Press 15
173
natural ventilation shafts are also still open even though they should be closed and cold air enters the room through these shafts.
The respondents also answered two additional questions of interest which were: (1) to what extent they felt they could control their indoor environment and (2) how satisfied they were with their possibilities to control the temperature at their work station. 60 % of the respondents reported no or low control of their indoor environment and 50 % that they were displeased or very displeased with the ability to control their temperature at their work station.
Concluding discussion
The built heritage is an important part of both the society and the community’s well being, and needs to be preserved for future generations to enjoy. However, new directives relating to indoor environmental requirements and increasing energy prices force owners of heritage buildings with conventional use to adapt. The approach in this paper attempts to capture a wider perspective of issues when combining traditional energy auditing with an indoor climate questionnaire. This is done to integrate the occupant’s perceptions and experiences of the indoor environment in an energy efficiency context.
From an energy auditing perspective the studied building represents a heavy stone structure with high infiltration rate and poor insulation. The presently used ventilation has been added to the building, while at the same time the old natural ventilation shafts are not properly sealed, resulting in increasing losses from the building. One other main difference from normal energy auditing is the lack of information about building construction parts and material. Another main diffe-rence is that the heritage designation means special consideration needs to be taken when suggesting efficiency measures.
From an indoor environment perspective the studied building was represented by high levels of draught, too low temperature, varying temperature and stuffy air. Draught and temperature problems were connected to physical measurements of excessive infiltration and cold surface temperatures. These effects could be reduced by decreasing the infiltration rates related to the windows. Other impro-vements include closing old natural ventilation shafts and tuning of ventilation air flows and operating times.
The combination of methods gives a wider perspective on the indoor environment and also lets the people in the building voice their comments on the indoor environment, which is always of great interest but even more so in buildings with heritage value. One respondent expressed it like this:
“Work environment is also aesthetic environment — I think this aspect should be included. I greatly appreciate the atmosphere created by the building’s stunning architecture and charm.”
Effects like this are often overlooked during conventional auditing, but need to be included when dealing with built heritage. The correlation between the question-naire results and physical measurements was also found to be strong and the

Gotland University Press 15
174
approach offered several advantages over conventional energy auditing. Therefore, it is recommended to combine objective measurements covering air temperature, CO2 concentration, relative humidity, ventilation flow, etc. with sub-jective evaluation using e.g. an epidemiological approach.
References
Andersson, K., Fagerlund, I. & Larsson, B. 1990. Reference data to the questionnaire MM 040 NA – Indoor Climate (work environment). Report M5/90. Department of Occupational and Environmental Medicine. Örebro University Hospital. (http://www.inomhusklimat-problem.se/publikations/publikationer/Referens2ny.pdf)
Anderson, K. & Stridh, G. 1992. The use of standardized questionnaires in building related illness (BRI) and sick building syndrome (SBS) surveys. In: Levy, F. & Maroni, M. (eds.), NATO/CCMS pilot study on Indoor Air Quality. Oslo, National Institute of Occupational Health, pp. 47–64.
Anderson, K., Stridh, G., Fagerlund, I. & Larsson, B. 1993. The MM-questionnaire – a Tool when Solving Indoor Climate Problems. Örebro, Sweden, Department of Occupational and Environmental Medicine.
Andersson, K. 1998. Epidemiological Approach to Indoor Air Problems. In: Indoor Air, 4, 32–39.
ASHRAE. 2007. Museums, Galleries, Archives, and Libraries. In: ASHRAE Handbook Applications 2007.
EU 2010/31 (2010), Directive 2010/31/EU of the European Parliament and the Council of 19th May 2010 on the energy performance of buildings (recast). In: Official Journal of the European Union.
Sundell, J., Anderson, B., Andersson, K. & Lindvall, T. 1993. Volatile organic compounds in ventilating air in buildings at different sampling points in the buildings and their relationship with the prevalence of occupant symptoms. In: Indoor Air, 3, 82–93.
Tweed, C. & Sutherland, M. 2007. Built cultural heritage and sustainable urban development. In: Landscape and Urban Planning, 83(1) pp. 62–69.

Gotland University Press 15
175
CultureBee – Wireless Data Monitoring and Control System
Allan Huynh, Jingcheng Zhang, Qin-Zhong Ye and Shaofang GongLinköping University Campus Norrköping, Department of Science and Technologyemails: [email protected]; [email protected]; [email protected]; [email protected]
Summary
The purpose of this project is to implement a wireless sensor system for remote climate monitoring and control purpose. The system allows users to use web service to monitor and control the indoor climate in different buildings. The system is composed of three parts as shown in Fig. 1, the wireless sensor network, a local server and a main server. The wireless sensor networks are deployed in different buildings or areas of interest. They report the climate infor-mation and receive the climate control commands. A local server is connected to each sensor network as the gateway between the sensor network and the remote main server. The main server communicates with all local servers via the Internet. It also provides web services to the end users via the homepage: www.culturebee.se.
The following operations can be performed via the homepage:
• Monitor the temperature and relative humidity at each individual building;
• Monitor the temperature and relative humidity from each individual sensor;
• Download the historically collected data from each sensor;• Set the level of each individual radiator;• Schedule the room temperature in each building
Introduction
The Communication electronics research group at Linköping University has developed a remote monitoring system of wireless sensor network based on ZigBee technology [1]-[2]. The system is built on the newly own developed ZigBee module for monitoring of indoor climate in cultural heritage buildings as churches and castles [3]-[4]. The aim of the study is measuring the temperature and relative humidity for remote monitoring. Thereby, the wireless sensor network is also connected to the Internet through a broadband or GPRS/3G connection, making remote monitoring of buildings possible. The data synchronization between the local servers and the main server is done seamlessly so that the users do not need to think about the technology behind the system.

Gotland University Press 15
176
Network Topology of Local Wireless Sensor Network
A wireless sensor network typically consist of low-cost, low-power and multi-functional sensor nodes that are deployed in a region of interest. These sensor nodes are small in size, but are equipped with sensors, embedded micropro-cessors, and radio transceivers, and therefore have not only sensing capability, but also data processing and communicating capabilities. They communicate over a short distance via a wireless medium and collaborate to accomplish a common task, for example, environment monitoring.
Compared with other wireless networks, e.g., Wi-Fi and cellular networks, the sensor network has the following benefits [5]:
• Dense node deployment: The number of sensor nodes that can be deployed to the region of interest can be really high, up-to 65 thousand units in a ZigBee network.
• Battery-powered sensor nodes: Sensor nodes are usually battery powered to increase the flexibility of deploying the sensor point.
• Long-battery lifetime: Access to the sensor nodes is not always easy and to minimize the sensor maintenance, up-to 10 years battery lifetime is not uncommon.
• Self-configurable: Sensor nodes are deployed more or less randomly and the nodes need to automatically configure themselves to join the available wireless network. Furthermore, with mesh network topology the network can re-configure itself to find an alternative data path when the communication fails, with the so-called self-healing mechanism.
Fig. 1. Illustration of the system overview.

Gotland University Press 15
177
• Application specific: A sensor network is design for a specific appli-cation and according to the requirements.
• Frequent topology change: The network may change due to hardware failure, adding new nodes, movement of the nodes or over air communication failure.
The wireless sensor network used in our own developed system is based on the ZigBee network, which supports star, tree and mesh network topologies, as illus-trated in Fig. 2. Depending on the environment, different network topologies can be used with the cost of network complexity, reliability and signal latency. The star network is the simplest topology with point-to-point connection and has the lowest signal latency. Since the end devices communicate directly with the coordinator, the risk for network failure is kept to a minimum. The network fails only when the coordinator fails, but the wireless network coverage is limited by the radio range between the coordinator and the end device. The wireless network coverage can be extended with a so-called tree or mesh topology, by adding routers between the end devices and the coordinator. The tree topology still uses point-to-point communication between the devices, which makes the connection predictable and the complexity of the network is moderate. The drawback is that if one of the routers fails, all the devices which have a signal path to the coordinator via that router will also be disconnected from the network. A mesh network can be used to avoid this problem by self-repair of the network, i.e., by reconnecting the disconnected devices to another in-range neighbouring router and rejoining them to the network. This self-healing function provided by the mesh topology provi-des robustness to the network, but at the cost of increased complexity and data latency time [6].
Network application
Various parameters can be monitored with different kind of sensors in a sensor network, e.g., temperature, humidity, light and pressure. A wireless sensor network has the advantage over the wired network due to the flexibility and low installation cost. The wireless sensor network can also be easily expanded
Fig. 2. Illustration of different network topologies.

Gotland University Press 15
178
on an existing network at a low cost. Application areas can be environmental monitoring, military applications, health care applications, industrial process control, security or home automation [7].
Energy consideration
Energy consumption is one important design parameter for a sensor network and sensor devices, since physical access to the sensor devices is not always easy. Sometimes the sensor device needs to be in place at one spot and operate for years. Energy efficiency in the sensor devices can be enhanced by careful design of the system and node software. The power management can be done at the core of the operating system with a task scheduler, which is responsible for scheduling a given set of tasks in the system under certain timing constraints. System lifetime can be considerably prolonged if energy awareness is incorpo-rated into the task scheduling process [8]-[10].
Hardware
Fig. 3 shows a block diagram and photograph of our own-developed ZigBee sensor module. The RF part utilizes the Texas Instruments (TI) CC2430 system-on-chip solution for IEEE 802.15.4 and ZigBee applications. The TI CC2430 RF transceiver includes an industrial-standard 8051 microcontroller unit for signal processing [ti.com]. The sensor used is a temperature and relative humidity sensor SHT15 provided by Sensirion [12]. The sensor device is powered by a 3.6 V lithium battery.
Fig. 4 shows a block diagram and a photograph of the ZigBee module with a power amplifier (PA) and a low noise amplifier (LNA). The PA implementation in Atmel T7024 is a three stage amplifier with an analog input control (ramp) for control of the signal output power. The same control signal can also be used to
Fig. 3. ZigBee sensor module as end device powered with a 3.6 V lithium battery.
a) block diagram b) photo of the module

Gotland University Press 15
179
switch the PA to power-down (standby) mode when the module is not in trans-mitting mode. The PA can deliver up to 23 dBm (200 mW) output power. Typical NF of the LNA is 2.1 dB at the frequency range between 2.4 and 2.5 GHz. Two extra switches are added to switch the PA and LNA between transmit and receive modes [13]. This module can be used as a coordinator or a router, where extra range to the sensor device is needed.
Local server
A local server can be implemented as an embedded computer or a personal computer. The Communication electronic research group has selected to implement the local server on a Netbook to shorten the development time. To that a battery backup system is given and no data will get lost incase of power cut to the building. The following components are included in the local database:
• Own developed software to serve the local wireless sensor network;• Local database to store all the sensed data.
Fig. 4. ZigBee module with external power amplifier and low-noise amplifier.
a) block diagram b) photo of the module
Fig. 5. Local server user interface.

Gotland University Press 15
180
Fig. 5 shows a screenshot of the user interface at the local server. From the user interface, the local user can monitor any sensor deployed in the local wireless sensor network. There are navigation buttons to navigate through time to see previous collected data. A warning button is implemented to alarm the local user if there is anything that needs extra attention in the system.
Under the surface, the local server software has the following additional tasks:
• Serve the local wireless sensor network and store the collected data in a local database;
• Issue a warning when the battery indicator from one sensor end device is low;• Issue a warning if the sensed data is outside of a predefined normal value
frame;• Synchronize the local database with the remote main database.
Main server
CultureBee is the name of our self-developed system for sensing and monitoring of historical buildings, in order to monitoring them via a website. The website is for the moment only for remotely monitoring the networks which are connected to the main server, but in the near future will be updated for controlling as well. From the CultureBee homepage, the users can study the temperature and relative humidity development in different buildings. One can also select a specific time frame to display the collected climate data, and download the data in text format for further analysis. The possibility to compare measured data by different sensor is also possible.
Fig. 6 shows two screenshots of the temperature and relative humidity measu-rement from the wireless local sensor network deployed at Skokloster Castle in Sweden. The graph shows a comparison of two sensed data curves collected from two different sensors, one located at an indoor exhibition room and the other one is located at an outdoor environment. From the graph user panel, the user can also select the data for interested time frame and building.
Since the main server is synchronized with all the remote wireless sensor networks, the online user can always be sure that the available data is the latest synchronized data.
Results
Today, there are five wireless sensor networks deployed at five different buildings. The sensor network has proven to work continuously running for more than one year now at Linköping Cathedral. A demonstration board with control functions has been built to show the proof of concept. The demonstration board contains two dimmable low energy lights and one wireless light sensor to emulate two radiators and one wireless temperature sensor, respectively. Via the homepage, a remote client can set the light intensity. The dimmable lights will automatically tune themselves into the set value with the feedback information from the light sensor about the ambient light condition.

Gotland University Press 15
181
The great advantage of installing a wireless sensor network in a cultural building is that it does not require any direct operation on the building. Sensor units are simply placed at places that are of interest to collect data. From the users’ perspective, they need minimal knowledge about the technology itself. The following steps are needed to deploy a wireless sensor network:
1. Start the local PC and the local server software;2. Power-On the sensor device – connections will self-establish automatically;3. Put one or multiple routers between the sensor device and local
server if the sensor device is out of radio range; – new link will be re-established automatically so the user does not
need to think about it.
Fig. 6. Temperature and relative humidity monitoring at Skokloster Castle.

Gotland University Press 15
182
As mentioned in the deployment steps, the sensor devices automatically con-nect themselves to an available network, to begin the data collection and forward it to the main server. The collected data can be used for analysis to get a better understanding of the indoor environment for preserving cultural heritage. The remote control function can be used to turn on or off the radiator in a specific building even if the building is localized far away from the location where the ope-rations engineer is stationed. Meanwhile, the power consumption is also reduced due to the live feedback from the sensor device to the control device.
Acknowledgements
Energimyndigheten (the Swedish Energy Agency) is acknowledged for financial support of this work. Dr. Tor Broström and Jan Holmberg at Gotland University are acknowledged for valuable input to the project.
References
[1] ZigBee Alliance (http://www.zigbee.org). [2] IEEE 802.15.4-3003 Standard, IEEE Computer Society.[3] J. Zhang, A. Huynh, Q. Ye and S. Gong, Remote Sensing System for
Cultural Buildings Utilizing ZigBee Technology, Accepted for publication in the ‘Proceedings of the 8th International Conference on Computing’, Communications and Control Technologies (CCCT 2010), Orlando, USA, on April 6th–9th, 2010.
[4] H. Ramazanali, J. Olsson, J. Lönn, A. Huynh, Q. Ye and S. Gong, Evaluation of ZigBee Networking in a Campus Enviroment, ‘ISAST Transactions on Communications and Networking’, pp. 30–35, 2008.
[5] J. Zheng, A. Jamalipour, ‘Wireless Sensor Network: A Networking Perspective’, Wiley, 28th Sep 2008.
[6] Y. Chengbo, L. Yanfei and L. Li, ‘Research and Application on the Coverage Range of the ZigBee Protocol’, Proceeding of IEEE Youth Conference on Information, Computing and Telecommunication, Beijing, China, September 2009.
[7] William Stallings, Wireless communications and networks, Prectice Hall, USA, 2002, pp. 110–113.
[8] Behzad Razavi, RF Microelectronics, Prentice Hall, USA, 1998, pp. 37–49.[9] David M. Pozar, Microwave and RF Design of Wireless Systems, John
Wiley & sons, inc., USA, 2000, pp. 87–93.[10] M. Loy, Understanding and Enhancing Sensitivity in Receivers for Wireless
Applications, Application note ‘Texas Instrument Inc’, 1999-05.[11] Texas Instrument Inc. (http://www.ti.com)[12] Sensirion. (http://www.sensirion.com) [13] Atmel Corporation, T7024 Datasheet(http://www.atmel.com/dyn/products/
product_card.asp?part_id=2861).

Gotland University Press 15
183
Reliability and Latency Enhancements in a ZigBee Remote Sensing System
Jingcheng Zhang, Qin-Zhong Ye, Allan Huynh and Shaofang GongDepartment of Science and Technology, Linköping UniversityNorrköping, Swedenemails: [email protected]; [email protected]; [email protected]; [email protected]
Abstract
Methods to improve the reliability and optimize the system latency of our own-developed ZigBee remote sensing system are introduced in this paper. The concept of this system utilizes the ZigBee network to transmit sensor information and process them at both local and remote databases. The enhan-cement has been done in different parts in this system. In the ZigBee network part, the network topology is configured and controlled. The latency for message transmitting is also optimized. In the data processing part, the network status check function and data buffer function are introduced to improve the system reliability. Additionally, the system latency is measured to compare with the Ad-hoc On Demand Distance Vector algorithm used in the ZigBee standard.
Keywords
System reliability, system latency, ZigBee network topology configuration, data buffering.
Introduction
Our ZigBee remote sensing network has been developed for generic data monitoring purpose [1]. Figure 1 shows an overview of this system.
The system can be divided into three parts, wireless sensor network, local server and main server. The wireless sensor network utilizes the ZigBee protocol to transmit sensor information from sensor modules to the coordinator (the root of the network). The coordinator is connected to the local server (a computer) via a USB port. When the local server receives messages from the coordinator, it parses and stores them into its local database. The messages are also duplicated to the main server via the Internet. The main server receives messages from multiple local servers and stores the received messages into the main server database. It also provides web service for data monitoring according to clients’ commands. (The web service can be accessed at www.culturebee.se)
Although this system is developed for generic purpose usage, it is firstly deployed in Linköping Cathedral [2], the biggest church in Linköping, Sweden. After investi-gation, following problems need to be solved before the system is ready to be deployed:

Gotland University Press 15
184
• Sometimes, it is really crowded in the church. Since ZigBee utilizes 2.4 GHz microwave in data transmitting, the signal is easily absorbed by human body. In this case, a good link quality and short latency between nodes should be guaranteed. The network dynamic operation (self-healing) should be minimized, especially for a large network;
• Power reset could happen from time to time. This will cause the reconnection of all mains-powered routers at the same time. The sensor the network may crash due to this;
• Internet connection is not always stable. Since the local server relies on the Internet to synchronize data to the main server, data could be lost due to Internet connection failure;
• The ZigBee network status monitoring function in the local server is necessary for the system administrator. It should send out a warning message if there is any problem in the sensor network.
To overcome these identified problems, enhancement has been done in both the ZigBee network part and the local server part of the system. In the wireless sensor network part, the topology configuration and control function is added to maintain a good link quality between nodes. In order to optimize the system latency, “follow the topology” routing method is utilized in the system instead of using Ad-hoc On Demand Vector (AODV) routing algorithm used in the ZigBee
Fig. 1. Remote sensing system overview.

Gotland University Press 15
185
standard. Moreover, the routing information is backed-up in flash memory (non-volatile) for each router. When power is reset, routers can restore the network information from its local flash memory. For the local server part, a warning function is implemented to report the possible failure in the ZigBee network. Meanwhile, a buffer mechanism is implemented to temporally store the sensor information when the Internet is not available.
System Enhancement Software Design in ZigBee Network
In the ZigBee network part, the system performance is optimized in the following aspects:
• Control and configure the network topology• Optimize the ZigBee network latency• Router restores network information from flash after power reset
Control and configure the network topology
Usually, it is not necessary to configure the topology for a small ZigBee network. The network layer [3] of ZigBee software stack establishes the Ad-hoc [4] network automatically. However, for a device automatically joining the network, the “hop number” to the coordinator is always optimized instead of the link quality [5]. Once the link between two nodes is broken, a “rejoin” operation is issued to repair the link. This “rejoin” operation is expensive due to the fact that the routing information in other nodes could be invalid and the AODV routing algorithm needs to find the new routing path. Therefore, a good link quality is necessary to minimize the “dynamic operation” in the ZigBee network. A good link quality could be guaranteed by the network configuration of the system deployer. The ZigBee network topology can be configured and controlled by defining the network shape and allow/disallow the MAC [5] association.
Define the ZigBee network shape
A ZigBee network is composed by the coordinator, routers and end devices. The maximum number of routers and end devices that one router can associate defines the shape of the network. These values are configured by the parameters nwkMaxDepth(Lm), nwkMaxRouters(Rm) and nwkMaxChildren(Cm) in CSkip(d) [3] function. CSkip(d) is a function that calculates the network address of each associated device, but the three parameters describe what the network “looks like”. As shown in Figure 2, Lm describes the maximum depth of the network. The values of Cm and Rm are only applicable for routes and the coordi-nator which defines the maximum children one router can associate with and how many among them can be routers.
The maximum device number in the whole ZigBee network changes according to the value of Rm, Cm and Lm. As defined in ZigBee, the total number of devices in the network should be smaller than 56634. The equations (1) and (2) calculate the possible maximum number of devices in one ZigBee network.

Gotland University Press 15
186
Control the ZigBee network topology by allowing /disallowing MAC association
When establishing a ZigBee network, the MAC layer association is the most common way of adding new devices into the network. The standard ZigBee command Mgmt_Permit_Joining_req(PermitDuration) is utilized to disallow the association of local device when PermitDuration value is set to “0”.
During the network deployment, this function can be used to determine the network topology. As shown in Figure 3, R1 is the “parent” of R2 and R3. When R4 wants to join the network, R1 still has place for an extra router, but the distance between R1 and R4 is too long to have a stable link. In this case, network deployer can disallow the association of R1. Then R4 will choose either R2 or R3 as its “parent” to guarantee a good quality.
Fig. 2. Network topology definition.
Fig. 3. Configure ZigBee network topology

Gotland University Press 15
187
Optimize the ZigBee network latency
The AODV algorithm is the routing algorithm in the ZigBee network. This routing protocol can find the shortest routing path for any two nodes in the network. However, this protocol is too “heavy” for our monitoring system. As described, all the sensor messages are sent from end devices to the coordinator via routers. Besides using the AODV algorithm, messages can also be routed to the coordi-nator by looking up the parents address iteratively from the MAC layer record of each device [5]. As shown in Figure 4, when sensor information is initiated by end device E1, the message will be forwarded to its parent R1. When the router receives the message, it looks up its parent address in its local address record. The router fills the “parent address” as the message destination address and sends the message. Since the coordinator is the parent to all the routers in the network, the message will arrive at the coordinator eventually. Since the message forwarding from end devices to the coordinator always follows the network topology, this routing method is also called “follow the topology” routing method.
Fig. 4. Message transmitting using optimized method.
Routers restores network information from flash memory after power reset
In a ZigBee network, the coordinator and routers are mains-powered since the radio part is always on. Usually, after the power reset, the router will rejoin the network just like a “new” device. If many routers re-start at the same time, it will result in thousands of over-the-air messages which could crash the network, for instance when the power of the building was restarted.
To overcome this problem, the non-volatile flash memory of the microprocessor is utilized to save the network information. During the normal operation, the network records in the flash memory of each router are updated once there is any network status change. When the power is restarted, instead of reconnect to the network, the router restores the information from its flash memory. No over-the-air message is sent out by the routers. The network status can be recovered just like the status before the power cut.
From the software point of view, only the corresponding entry of the network status is updated in flash. When power is reset, the router or the coordinator will first try to restore the network information from flash. If there is no record or

Gotland University Press 15
188
the record is damaged, the router will restart as a “newly joined” device. In the software implementation, the following tables are saved into the flash memory when the function is enabled:
• Network Information Base (NIB) [6] – The table where stores the network status for local device;
• Device list – The list that contains addresses of the local device associates with;
• Binding table [7] – the address of devices that are currently “bind” with a local device;
• Address Manager – Utility database for routing table, neighbor table and network address management.
System Enhancement Design in Local Server
The local server is implemented to collect all the sensor information from the ZigBee network. In the local server, the sensor information is processed and stored. It also synchronizes messages to the remote main server via the Internet. The ZigBee network failure warning function and the Internet failure buffer function are implemented to enhance the system reliability.
ZigBee network failure warning function
The network warning function monitors the operating status of the ZigBee network periodically. When possible network failure is detected, it sends out the warning by indicating the ID of the sensor node. The system maintainer can solve the problem according to the sensor node ID.
As shown in Figure 5, a table is created in the local server with entry (NodeID, UpdateTime). The table size depends on the number of end devices in the network. The NodeID is unique for each end device. When a new message arrives in the local server, the SerialPortManager updates the UpdateTime field in the table with the current time according to NodeID. The UpdateTime can be changed by invoking the SetUpdateTime(NodeID) function provided by the table. Meanwhile, another CheckStatus thread monitors the table with predefined interval – CheckStatusInterval. During the check, the UpdateTime is compared with the current time. If the time difference is larger than the prede-fined WarningThreshold, the local server sends out a warning message. The value of CheckStatusInterval and WarningThreshold can be configured by the SetInterval() function.
Software data buffer for Internet fault tolerance
The synchronization between the local server and the main server relies on the Internet. However, Internet connection is not always stable in places like churches. In order to keep the data integrity, a software buffer is implemented in the local server. It temporally stores the data in the local server when the Internet connection is not available. After the Internet is recovered, it synchronizes the data to the main server.

Gotland University Press 15
189
Fig. 5. Local server warning system.
Fig. 6. Data Buffer Implementation in Local Server.

Gotland University Press 15
190
Figure 6 shows the state machine that controls the synchronization between the local server and the main server. When the local server receives a message from the USB port, the state machine jumps to the MessageCome state. In this state, the Internet status and the main server accessibility are checked, i.e. to check if both the Internet connection and web service are available. The state transition in MessageCome depends on the check result. If the Internet is available and there is no message buffered in the MessageBufferTable [8][9][10], the state machine jumps to the SendToMainServer state and the local server sends the currently received message to the main server. If the Internet is available but there are messages buffered in the MessageBufferTable, the state machine jumps to the MessageBufferNotEmpty state and the local server synchronizes the buffered message one by one until the MessageBufferTable is empty. Then the state machine jumps to the SendToMainServer state to synchronize the current received message to the main server. If the Internet is not available, the state machine jumps to the BufferTheCurrentMSG state. In this state, the currently received message is buffered into MessageBufferTable and a flag IsMessageBuffered is set to “1” indicating that there is message buffered in the table.
Latency Test Set-up
Latency test for wireless network is different from the wired network (i.e. Ethernet), since the message routing does not always follow the network topology. As defined in ZigBee, the neighbor table records all the devices within the propagation range which could be the candidate of the “next hop” for message transmitting. However, devices recorded in the neighbor table are not necessarily to be the devices being associated with the local device.
The system latency test is done to compare the AODV routing method and the “follow the topology” routing method. Figure 7 shows the general latency test set-up. The latency tests are set up by connecting the coordinator and an end device with two different channels in one oscilloscope. Different latency tests could be performed by adding different number of routers in between. Test message is sent from the end device to the coordinator. After sending the message, the end device sets one of its pins to “1” and the coordinator will set its pin to “1” when it receives the test message. The message latency between
Fig. 7. Latency test setup.

Gotland University Press 15
191
the end device and the coordinator can be read out from the display of the oscilloscope.
AODV routing discovery minimum latency mesurament
The coordinator and routers used in the test restore the network information from their flash memory when power restarted. The ZigBee network is established as the following steps to test the minimum system latency of AODV routing algorithm:
1. Open the coordinator to create the network.2. Open the 1st router to join the network.3. Switch off the coordinator and open the 2nd router to join the
network.4. Switch off the 1st router and open an end device to join the
network.5. Switch on the coordinator and the 1st router. The end device sends
the message with coordinator’s destination address.Figure 8 shows the network topology after the set-up from step 1 to 5. Especially, when the 2nd router joins the network, the coordinator is switched off. When the coordinator is switched on in step 5, the network information is restored from its flash memory. Thus the 2nd router does not have the coordinator address record.
Fig. 8. Minimum AODV routing discovery latency test network topology.
As shown in Figure 9, the message with destination of the coordinator is initiated from the end device E1. After receiving the message, the “2nd router” looks up its local address record. Since there is no coordinator address record in the 2nd router, the “Route Request” frame is sent from AODV algorithm of then the 2nd router. The “Route Request” is a broadcast message to establish the route path from 2nd router to the coordinator. On receiving the “route request”, the coordi-nator responses the “2nd router” with “route response”. Since the coordinator and “2nd router” are within the propagation range of each other, the test measures the minimum AODV route discovery latency.

Gotland University Press 15
192
“Follow the topology” routing method latency mesurament
The latency measurement of routing the method used in our monitoring system is set up as following steps:
1. Open the coordinator to establish the network;2. Open the 1st router to join the network;3. Disallow the association of the coordinator;4. Open another router to join the network;5. Disallow the association of its parent;6. Repeat step 4 and 5 for other routers until the
desired network is established;7. Open the end device to join the network;8. End device sends message to its “parent”.
As described in the steps above, a “line” topology is established. During the test, the AODV routing discovery is replaced by the “follow the topology” routing met-hod. As shown in Figure 10, the message is issued from the end device E1. The message transmitting from E1 to the coordinator C1 is composed by (N+1) uni-casts. Since the message forwarding is separated by many “single hop” unicasts,
Fig. 9. Over-the-air frame of minimum AODV routing discovery.

Gotland University Press 15
193
the system latency is proportional to the depth of the end device. The message latencies are measured according to different number of routers between the end device and the coordinator.
Network Test Result
The latency test result includes the latency of both the AODV algorithm and the “follow the topology” routing method. Moreover, the test result also includes the monitoring system test result of Linköping Cathedral.
Network latency test result summay
The minimum AODV latency measurement result is present in Table I, the test is done with 3 different tests and the average values are present in the last row of the table.
Fig. 10. Latency test of the routing method used in our monitoring system.
Record Latency (ms)1st 274.402nd 252.003rd 250.85Average 259.08
Table 1. AODV minimum latency test result summary:
The network latency of the “follow the topology” routing method is present in Table II. Three set of tests are done to measure the latency according to different number of routers between the end device and the coordinator. The results presented in the table are the average latency of three tests for each case. And the data are also summarized in Figure 11.
Number of Routers (hops)
Latency (ms)
0 7.351 15.952 26.703 35.82
Table 2. Latency test of monitoring system routing method:

Gotland University Press 15
194
However, it is not fair to directly compare the data in Table I with Table II. Data in Table I presents the time for creating the route path from the source to the desti-nation. Once the route path established, it will also take roughly 7.5 ms for each hop when transmitting data.
Temperature and humidity mearsument results using our monitoring system
Our monitoring system is running and testing in Linköping Cathedral, the biggest church in Linköping, Sweden. As shown in Figure 12, the end devices are battery powered. They are hanged at the back of the speaker in different locations of the church. Routers are located near the power outlet. A netbook is configured as the local server in order to save the space. As shown in Figure 13, the local server is installed at the reception desk in the cathedral, so the system maintainer can see the local data and warning from it.
Fig. 11. Latency test result of routing method used in monitoring system.
Fig. 12. End device and router set-up in Linköping cathedral.
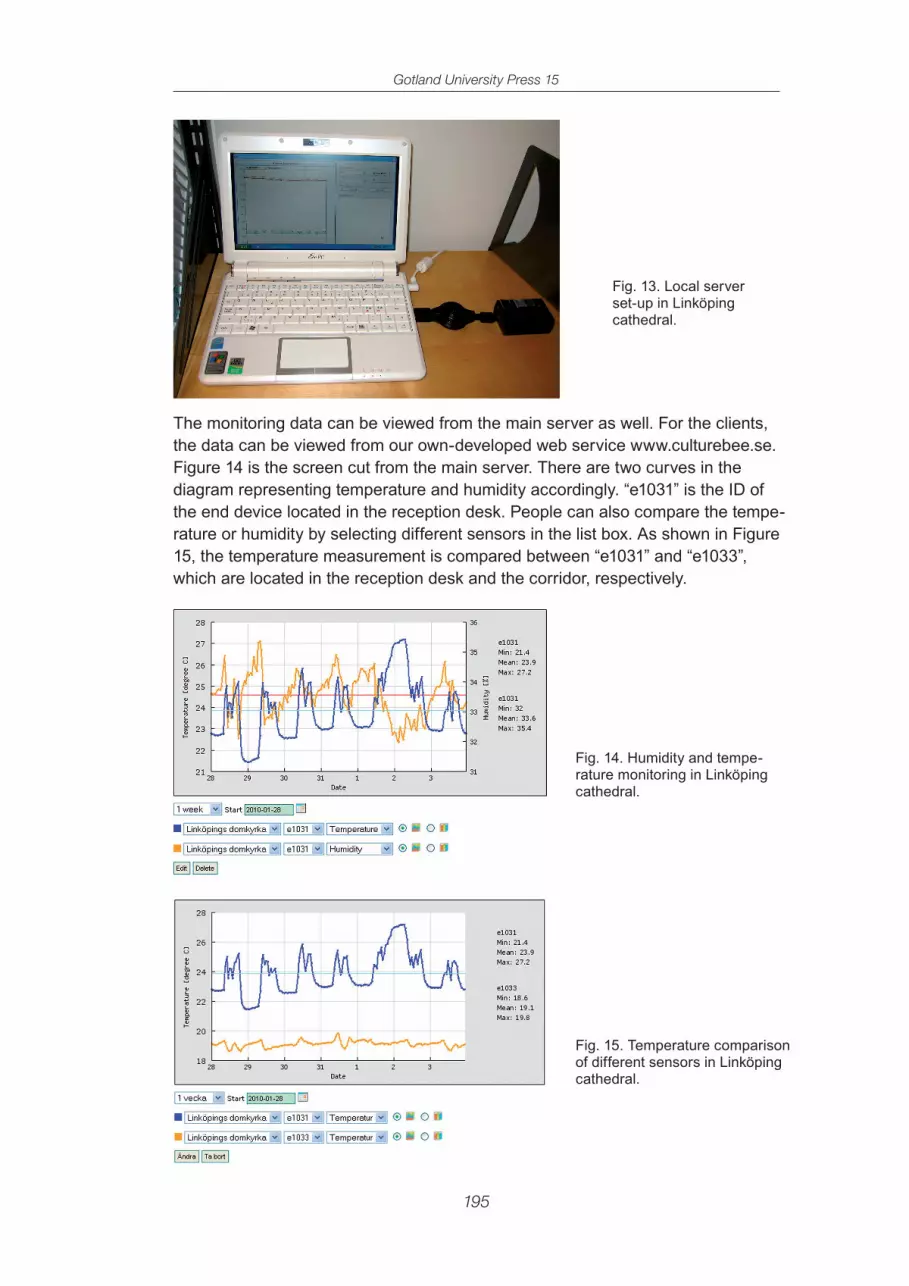
Gotland University Press 15
195
The monitoring data can be viewed from the main server as well. For the clients, the data can be viewed from our own-developed web service www.culturebee.se. Figure 14 is the screen cut from the main server. There are two curves in the diagram representing temperature and humidity accordingly. “e1031” is the ID of the end device located in the reception desk. People can also compare the tempe-rature or humidity by selecting different sensors in the list box. As shown in Figure 15, the temperature measurement is compared between “e1031” and “e1033”, which are located in the reception desk and the corridor, respectively.
Fig. 13. Local server set-up in Linköping cathedral.
Fig. 14. Humidity and tempe-rature monitoring in Linköping cathedral.
Fig. 15. Temperature comparison of different sensors in Linköping cathedral.

Gotland University Press 15
196
Discussion
A reliability and latency enhancement method for a remote monitoring network is introduced to both ZigBee network and the local server of the remote sensing system.
In the ZigBee network part, the topology control function provides flexibility to apply a ZigBee network in different monitoring scenarios. Meanwhile, it also gives a deployer the possibility to establish a network with optimized link quality between nodes. The “disallow association” function can enhance the system security by rejection of any new malicious device to join the network. Nevertheless, the “self healing” [11][12] function is still functional even the association in the network is disallowed. This is due to the fact that the router can accept a device when a “rejoin” frame is received even the association is disallowed. This indicates also how a ZigBee network identifies the “new” or “old” joining device.
Regarding the message transmitting in a ZigBee network, the “follow the topology” routing method used in our system has the following advantages compared with the AODV routing algorithm:
• The latency is easy to predict since it is proportional to the number of the routers between the end device and the coordinator.
• Link quality between different “hops” is guaranteed. It minimizes the failure possibility when sending messages.
• Usually, there are two kinds of message transmitting acknowled-gement method used in ZigBee, which are “Peer to Peer” and “End to End”. As shown in Figure 16, “E2E” method sends message acknowledgement from the destination back to the source. While P2P only acknowledges the transmitting status of the “next hop”. In most applications, the “P2P” method is used which results in that the source cannot know if the message is arrived at the destination or not. As shown in Figure 4, “follow the topology” routing method separates one “multi-hop” unicat into many “single-hop” unicat. Each unicat is managed by the application layer of routers between the end device and the coordinator. It is more flexible for the routers to handle the data transmitting failure.
Fig. 16. “Peer – Peer” and “End – End” acknowledgement message forwarding.

Gotland University Press 15
197
• This routing method can co-exist with the AODV algorithm. When the message is failed to delivered to the coordinator, the application layer can use the AODV algorithm to find the destination at any time.
However, for general purpose message transmitting, the AODV algorithm is ir-replaceable. The advantage mentioned above only exists in the scenario where all the sensor messages are forwarded to the coordinator. Additionally, the rou-ting method used in our system will have the best performance with a predefined ZigBee network topology which guarantees a good link quality between nodes. Furthermore, as a trade-off of not using the AODV routing discovery algorithm, the message latency could be longer than the route path established by AODV. The AODV algorithm always tries to optimize the “hops number” between the source and the destination. When sending information from the end device to the coordinator, the number of hops could be smaller than the hop number by follo-wing the network topology.
From the local server side, a ZigBee network failure warning function and an Internet failure buffer function are implemented to enhance the system reliability. Instead of using normal “heart beat” mechanism, the warning function does not introduce extra message transmitting in the sensor network. As a trade-off, the warning could also occur when there is nothing to report. In this case, it is the system administrator’s response to set a reasonable threshold for sending out the warning.
Conclusion
System reliability and latency enhancement methods are introduced in this paper. With these enhancements, a good link quality between sensor nodes is guaranteed by the network topology configuration. The network information is preserved in the flash memory. When power is re-set, the network information can be restored from its local flash memory. The system latency is also optimized by utilizing another routing method. A warning function and a data buffer function are also implemented to increase the system reliability. The enhanced system is suitable for monitoring purpose like churches and cultural buildings.
Acknowledgement
Dr. Tor Broström at Gotland University is acknowledged for valuable input to the project. The Swedish Energy Authority (Energimyndigheten) is acknowledged for financial support of the project.
This paper is submitted and accepted by “The Fourth International Conference on Sensor Technologies and Applications” July 18–25, 2010 – Venice/Mestre, Italy.

Gotland University Press 15
198
References
[1] J. Zhang, A. Huynh, Q. Ye, S. Gong, “Remote sensing system for cultural buildings utilizing ZigBee Technology,” The 8th International Conference on Computing, Communications and Control Technologies, 2010.
[2] Linköping Cathedral, http://en.wikipedia.org/wiki/Link%C3% B6ping_Cathedral
[3] ZigBee Alliance, “ZigBee specification,” ZigBee Alliance Board of Directors, 2008, pp.45–287.
[4] C. Perkins, “Ad hoc On-Demand Distance Vector (AODV) Routing”, RFC3561, 2003.
[5] IEEE Computer Sociaty, “Part 15.4: Wireless Medium Access Control (MAC) and Physical Layer (PHY) Specifications for Low-Rate Wireless Personal Area Networks (WPANs)”, LAN/MAN Standards Committee, 2006.
[6] ZigBee Alliance, “ZigBee Network Layer Technical Overview,” www.zigbee.org
[7] D. Gislason. “ZigBee wireless networking,” Newnes, pp.331–350.
[8] Microsoft, “Open Database Connectivity (ODBC),” 2006.
[9] David White, Kenn Scribner and Eugene Olafsen. MFC Programming with Visual C++ 6 Unleashed, 1999.
[10] MySQL, MySQL 5.1 Reference Manual, 2009.
[11] T. Angskun, G.E. Fagg, G. Bosilca, “Self-healing network for scalable fault tolerant environment” Dept. of Computer Science, The University of Tennessee, Knoxville, USA, 2006.
[12] C.K. Toh, “Ad Hoc Mobile Wireless Networks”, Prentice Hall.

Gotland University Press 15
199
Wind Tunnel Measurements of Pressure Distribution on the Façade of a Church
Mats Sandberg1*, Magnus Mattsson1, David Etheridge2 and Leif Claesson1
1 University of Gävle, Sweden2 The University of Nottingham, UK* Corresponding email: [email protected]
Summary
Elderly churches have a unique shape with their high towers and long naves. There seems to be few if any reported measurement of pressure distribution on churches. Churches are naturally ventilated buildings and therefore when the wind speed is high the wind becomes an important driving force for ventilation. A model in scale 1: 200 was built of a 19th century Swedish church provided with a crawl space. The pressure on the façade of the model was recorded in 42 points. With the aim of studying the ventilation of the church, dedicated measuring points were located on windows, doors and in the positions corresponding to the location of the openings in the crawl space. Some field trials were undertaken with the scope of measuring the time history of the static pressure on the façade in some positions corresponding to measuring points on the wind tunnel model. Examples of these measurements are reported in the paper. With the aim of measuring the “region of influence” on the ground caused by the church, also the static pressure on the ground was recorded in the wind tunnel tests. The static pressure on ground was recorded with a pressure plate provided with 400 pressure taps arranged in a quadratic pattern.
Keywords
Wind tunnel, church, static pressure, crawl space.
Introduction
Figure 1 shows the church which is built of stone and has a volume of 7 800 m3. The church is located on a hill and is therefore wind exposed. The internal dimen-
Fig. 1. Hamrånge church.
sions of the church are length 40.2 m and width 16.6 m, see the plan in Figure 2. The church is provided with a crawl space ventilated by small openings (30x30 cm), see Figure 3.

Gotland University Press 15
200
The nave of the church has a vaulted ceiling with a maximum height of H = 13.7 m. The size of the church in relation to the height, H, of the nave is shown in Figure 2.
Figure 3 shows a plan of the church, a photo of a 30x30 cm opening to the crawl space. The photo from the interior of the crawl space shows a lot of debris. Among the debris there is organic material which means that there may be a risk of mould growth.
Fig. 2. Size of the church in relation to the height, H, of the nave.
Fig. 3. Top: Plan of church. Bottom: Ventilation opening (30x30 cm) to the crawl space and inside crawl space.

Gotland University Press 15
201
Stack effect versus wind driven ventilation
Infiltration is caused by the stack effect and the wind, see Figure 4. Physically they are different mechanisms. The “engine” causing the stack effect is the potential energy density gH ∆ρ [J/m3] of an air column with height H and density difference ∆ρ with respect to the ambient. Due to the stack effect outdoor air is sucked into the lower part of a building and leaves the building at its upper parts.
The velocity induced by the stack effect due to a building with height H is of the order
Fig. 4. Left: Stack effect dominates. Outdoor air is sucked into the building. Right: Wind dominates. Outdoor air is blown through the building.
When wind dominates the outdoor air is blown through the building envelope. The kinetic energy density in the wind with velocity UW is ½ρUW
2 [J/m3] and close to the building envelope generates a static pressure given by ½ρUW
2.Cp where Cp denotes the pressure coefficient. That is why we want to know the pressure distribution on the external part of the building envelope. Roughly speaking, for the wind driven ventilation to be important the wind speed should exceed UB, depending on the Cp distribution.
Setting H=13 m and ∆T = (10, 20 and 30 ºC) gives the velocities UB = (2.1, 3 and 3.6) m/s.
A sample of pressure measurement on site
A sample of the pressure measurements is depicted in Figure 5 below, showing the variation (at 1 s intervals) in outdoor-indoor pressure difference at the middle of the long side of the Eastern and Western façade respectively (the church is North-South oriented). The measuring position is at key-hole level, and stack effect has added a few Pascals to the curves. There is a weak wind from the east.

Gotland University Press 15
202
The strong variations in wind are reflected in the recorded pressure. The pressure in the crawl space exhibits less variations. The magnitude of the pressure in the crawlspace is close to the pressure on the leeward side. Therefore the majority of the pressure drop occurs across the openings on the wind ward side. This is typical for large openings, see Kobayashi et al (2010). If there had been no purpose provided openings but only cracks the pressure within the crawl space would have been close to a mean value of the pressure on the façades.
Windtunnel measurements
The measurements were conducted in the closed circuit wind tunnel at the University of Gävle. It has a measuring section of length 10 m, width 3 m and height 1.5 m. Figure 6 shows the wind tunnel with the church model placed on a plate provided with 400 pressure taps arranged in a quadratic pattern with
Fig. 5. Recorded pressure on wind- and leeward side and in the crawl space.
Fig. 6. Wind tunnel with church model on pressure plate.

Gotland University Press 15
203
a distance of 37 mm between the pressure taps. This arrangement makes it possible to measure the pressure on ground
Figure 7 shows the recorded pressure difference between windows 122 and 128 and the corresponding window on the opposite side. The pressure diffe-rence between the windows is shown in the upper row. The pressure difference between the openings 129 and 134 to the crawl space and the corresponding openings on the other side are also shown. The pressure difference between the corresponding openings to the crawl space is shown in the lower row. The pair of points between which pressure difference has been measured is indicated as .
Fig. 7. Pressure difference between points on the façade and points on the opposite side. Top: Window 122 and corresponding point. Window 128 and corresponding point. Bottom: Opening 129 and corresponding point. Opening 134 and corresponding point.

Gotland University Press 15
204
The pressure difference has been recorded with an interval 15 º in wind direction. The 0 º wind is a wind blowing perpendicular to the tower. This is a wind from the north.
The graphs located to the left show the recorded pressure difference in points located close to the tower, while the graphs located to the right show the pressure difference for points located close to the chancel.
By comparing the recorded pressure as shown on the left hand side and the right hand side one sees that the maximum pressure is higher in the graphs on the left hand side. The points on the left hand side are the points located close to the tower. One can therefore attribute this difference to the effect of the tower. Another interesting observation is that maximum pressure is not attained when the wind is perpendicular to the façade. This is caused by the fact that the points where the pressure is recorded are located far from the stagnation point.
Conclusions
Detailed measurement of the pressure distribution on a church model has been obtained with an interval of 15 º in wind direction. There is clear effect of the tower on the pressure distribution on the façade. The highest recorded pressure on the façade does not occur when the wind direction is perpendicular to the façade. This is due to that the measuring points are located far from the stagnation point.
Acknowledgements
This work was funded by the Swedish Energy Agency.

Gotland University Press 15
205
Pressure Pulse Technique – a New Method for Measuring the Leakage of the Building Envelope of Churches
Ed Cooper1, David Etheridge1*, Magnus Mattson2 and Hans Wigö2
1 University of Nottingham, UK.2 University of Gävle, Sweden* Corresponding email: [email protected]
Summary
The University of Gavle is currently involved in a project on saving energy in historic buildings (churches). An important factor in the determination of the natural ventilation rate is the adventitious leakage of the envelope. Measurement of leakage is therefore a key feature of the investigations. It was decided to adopt a new technique developed at the University of Nottingham (UNott). It is a pulse technique compared to the conventional steady technique.
The conventional technique consists of generating a steady and high pressure difference (50 Pa) across the envelope by means of a fan. Such pressures are rarely encountered in ventilation and this leads to errors in the low-pressure leakage. Furthermore the use of the conventional blower door technique in churches is difficult due to their large volume and the need to replace the doors.
The underlying principle of the UNott technique is described and examples of results are given. The most important advantage of the Unott technique is that the leakage is determined at the low pressure differences that are encountered with ventilation e.g. 4 Pa. This is made possible primarily by the fact that the effects of wind and buoyancy at the time of the test are eliminated by taking account of the pressure variation before and after the pulse.
For measurements in large buildings, a number of identical piston/cylinder units have to be operated simultaneously. The University of Gavle has developed a system whereby up to seven units can be used. Such a number is required for a leaky church and this is the first time this has been done.
Keywords
Building leakage, pulse pressurisation, infiltration, historic buildings.
Introduction
Excessive leakage of a building envelope is undesirable, because it leads to excessive energy consumption. Standards now exist in many countries for the maximum allowable adventitious leakage of an envelope. Current standards use high-pressure data (typically 50 Pa) as a measure of the infiltration potential of an envelope. The leakage at 50 Pa, Q50, is measured by means of a steady pressurisation test in which the fan flow rate required to generate a steady

Gotland University Press 15
206
pressure difference ∆p is measured. In reality infiltration occurs at much lower pressures (typically 4 Pa) and a more accurate measure of infiltration potential is the leakage at 4 Pa, Q4. Unfortunately, determination of Q4 by the conventional steady technique is subject to considerable uncertainty due to wind pressures. The two main sources of uncertainty arise from the extrapolation of high-pressure data to low pressures and from wind effects when measuring at low pressures. Quantification of the uncertainties in Q4 has been carried out by Cooper and Etheridge (2006a).
The underlying principle of the UNott technique is to subject the building envelope to a known volume change in a short period of time (typically 1.5 seconds). The resulting pressure pulse is recorded from which the leakage characteristic at low pressure is determined. The pulse is generated by means of a cylinder and piston, powered by compressed air.
The most important advantage of the Unott technique is that the leakage is measured at the low pressure differences that are encountered with ventilation e.g. 4 Pa. This is made possible by the fact that the effects of wind and buoyancy at the time of the test are eliminated by taking account of the pressure variation before and after the pulse.
For measurements in large buildings, a number of identical piston/cylinder units are operated simultaneously. The University of Gavle is currently involved in a project on saving energy in historic buildings (churches). As noted below, up to seven units are required for a leaky church and this is the first time this has been attempted.
Basic principle of UNott technique
The basic principle and the development of the technique are fully described in Cooper et al (2006). In the following a brief explanation of the equipment, the procedure and the analysis of data is given. However, there are several key features of the technique that are first worth emphasising.
The effects of wind and buoyancy at the time of the test are eliminated by taking account of the pressure records before and after the pulse. This is perhaps the most innovative aspect of the technique.
The pressure pulse is of sufficient duration for the flow to reach steady state over the latter part of the pulse. This fact, combined with the low pressures generated, means that any effects of envelope flexing are negligible.
There is in principle no limit to the size of building that can be tested. Large buildings can be tested by simultaneous operation of several units.
Finally, the measurements are very repeatable which lends support to their accuracy.
Equipment and procedure
The underlying principle of the UNott technique is to subject the building envelope to a known volume change in a short period of time (typically 1.5 seconds). The

Gotland University Press 15
207
change in volume ∆V is generated by means of a cylinder and piston, powered by compressed air, as shown schematically in Figure 1. The response to the change in room volume is a pressure pulse from which the leakage characteristic at low pressure is determined.
The piston is displaced by injecting air into the cylinder from the tank of a small compressor. The tank has a volume of 50 litres and is typically
Fig. 2. Actual pulse unit.
Fig. 1. Schematic of pulse unit.
charged to a pressure lying between 5 and 10 bar. The tank is connected to the cylinder by a fast-acting solenoid valve. The valve is opened for a pre-set period of 1 or 2 seconds. The instantaneous displacement, s, of the piston is measured using a displacement transducer. A fast-response differential pressure transducer (not shown) is connected to internal and external tapings to record the instanta-neous pressure difference across the envelope, ∆p. Measurements of s and ∆p are taken at a frequency of 200 Hz.
For reasons described below, the measurements are commenced at a time (typically 2 seconds) before the solenoid valve is opened and are stopped at a similar time after the valve is closed. The actual measurement period lasts only a few seconds, but the overall time for a test is a few minutes, which is largely due to the time required to re-charge the tank. As a general rule, several repeat measurements are made, since this provides a check on the reliability of the results.
Figure 3 (from Cooper et al, 2006) shows a set of raw data consisting of five repeat measurements. The effect of wind pressures before and after the pulse due to the piston can be clearly seen.

Gotland University Press 15
208
Analysis of data
The first step in the analysis is to remove the effects of wind from the ∆p records. This is done by fitting a curve to the ∆p variation before and after the pulse. The curve fit during the pulse measurement period is then simply subtracted from the measured values during that period. Figure 4 shows the results obtained. It can be seen that the procedure works very well and the corrected results are very repeatable. The results shown in Figure 4 were obtained with moderate wind speeds, but the procedure also works well at high wind speeds, where the wind pressure fluctuations exceed the imposed pulse pressure (Cooper et al, 2006).
The next stage is to evaluate the volume flow rate of the piston, Qp. This is obtained by evaluating the rate of change of piston position with time (ds/dt) and multiplying by the piston area.
Thus the instantaneous values of the piston flow rate Qp and ∆p are known. The leakage characteristic is then obtained by plotting Qp against ∆p over the period of time where the flow is quasi-steady. For the results shown in Figure 4, the quasi-steady period extends from about 0.6 s to 1.0 s, during which time ∆p varies from 5.8 Pa to 4.8 Pa. Identifying the period of quasi-steady flow was initially done using a theoretical model of unsteady envelope flow (Etheridge, 2000). However, with experience, it can be identified by inspection.
Finally a small correction is made to the flow rate to take account of the fact that the internal pressure varies. The volume of air is large, so compressibility should be taken into account. This is easily done, since the volume is known.
Figure 5 shows the low-pressure leakage determined in a test house, where it is compared with the leakage measured using a conventional steady technique.
Multiple units
The pulse unit shown in Figure 2 has the capacity to determine the leakage of typical UK dwellings. Larger and leakier buildings can be tested by increasing the number of units and operating them simultaneously. The concept of using multiple units relies on the pressure pulse being uniform throughout the test space at all instants of time. This partly relies on the piston motion being identical
Fig. 3. Raw data for ∆p. Fig. 4. ∆p corrected for wind effects.

Gotland University Press 15
209
for all piston units at each instant, which is relatively easy to achieve by ensuring all units are identical and the pistons are started at the same time and with the same driving pressure. It also relies on the distance between pistons being within certain limits and on negligible flow restrictions between the spaces that make up the total space (this should not be a problem in the open layout of a church). Several pressure transducers can be used to check that the pressure pulse is uniform throughout the space at all times.
During the development of the UNott technique, two units were successfully tested in a room with volume of 565 m3 and a permeability of 6.6 m3/h.m2 at 50 Pa. One pulse unit and one pressure tapping was placed in each half and it can be seen from Figure 6 that the difference in pressure response between the two halves was negligible.
Fig. 5. Low-pres-sure leakage results obtained with the pulse technique and the conventional steady technique.
Fig. 6. Pressure pulses recorded in adjacent halves of a large and leaky room with a pulse unit and pressure transducer in each half.

Gotland University Press 15
210
A typical Swedish church has a large volume (7800 m3) and it can certainly be expected to have a larger leakage than a UK dwelling. The required number of units is determined by the leakage of the building, rather than its volume, and it was necessary to estimate the number of units that would be required. Fortunately, tracer gas and pressure measurements had already been made in some of the churches. From the ventilation rate and the associated pressure difference across the envelope, it is possible to obtain a reasonable estimate of the low-pressure leakage. (Since the interest lies in the low-pressure leakage, rather than the leakage at 50 Pa, there is no need to extrapolate the data to high pressures). In this way it was concluded that seven units of the kind described above would be needed. With this capacity it should be possible to treat almost all churches of the kind found in Sweden.
The use of such a large number of units is breaking new ground, both in terms of the system and in the actual measurements.
The University of Gävle system
Equipment
The system developed at the University of Gävle is shown in Figure 7. Each of the seven units is connected to an interface, which simultaneously operates the solenoid valves on the compressors on receipt of a digital output from the laptop. The interface includes an A/D convertor which receives the analogue signals from the pressure transducers (up to 7) and the displacement transducers (up to 7).
Figure 8 shows the specially designed trailer, which accommodates the seven units with their compressors. The cylinder/piston units are themselves fitted with wheels and are manufactured in aluminium for ease of movement.
Fig. 7. General layout of the Gävle system, with seven pulse units for a “church”.

Gotland University Press 15
211
Data analysis
The data acquisition system typically operates at a sampling frequency of 200 Hz. A test comprises the following sequence. The monitoring of the transducers is commenced at time zero. At a pre-set time later (e.g. 5 seconds), the valves to the units are operated simultaneously. Data recording continues for a pre-set time (e.g. 5 seconds) after the piston has stopped moving.
The data analysis software is then used on the raw data. The first step
Fig. 8. Trailer with all seven units and their compressors.
Fig. 9. Outdoor-indoor pressure difference at church during 3 min (1 s sampling interval).
is to carry out the curve-fit to the pressure differences recorded when the piston is not moving. The raw data is then corrected in the manner described in Section 2.2. The total instantaneous flow rate due to the pistons is obtained by summing the flow rates for each unit. A correction for the pressure change is made and the results are plotted in the form of the leakage graph shown in Figure 5.
Preliminary measurements
A sample of the pressure measurements obtained on a church is depicted in Figure 9. It shows the variation (at 1 second intervals) in outdoor-indoor pressure difference at the middle of the long side of the Eastern and Western façade respectively (the church is North-South oriented). The measuring position is at key-hole level, and stack effect has added a few Pascals to the curves. The diagram illustrates the difficulty in attaining a representative outdoor-indoor

Gotland University Press 15
212
pressure difference, which would be needed with the blower-door technique. With the UNott technique this problem is avoided. Here it is the relative magnitude of the pressure pulse that is important; the reference measuring point for outdoor pressure need not yield a correct neutral (atmospheric) pressure. The figure also indicates that the pressure change during one second in general is small, and thus that a rather small change in the reference outdoor pressure can be expected during the UNott pulses. The figure indicates however that occasional quick pressure changes can occur, thus motivating repeated pulses with the UNott technique, until a several similar results have been obtained, as in Figures 3 and 4.
Conclusion
The unsteady pulse pressurisation technique developed at the University of Nottingham has been shown to be capable of determining the adventitious leakage of building envelopes at the low pressures encountered with natural ventilation. This offers greater accuracy than the conventional steady high-pressure technique and has not been possible before. To use the technique in large buildings relies on the simultaneous operation of multiple units. A system comprising seven units has been developed for the measurement of the leakage of large churches in Sweden by the University of Gävle. Development tests at Nottingham indicated that two units could be operated successfully, but the extension to seven units operating in buildings with large volumes represents a major step forward in the technique. If successful, the future application of the technique will be considerably enhanced.
Acknowledgements
The work at Nottingham was partly funded by the Engineering and Physical Sciences Research Council in the UK. The work at Gävle is funded by The Swedish Energy Agency. These contributions are gratefully acknowledged.
References
Cooper, E.W. & Etheridge, D.W. 2006a. Determining the Adventitious Leakage of Buildings at Low Pressure. In: Part 1: Uncertainties. Build. Serv. Eng. Res. & Techn. 28(1), 71–80.
Cooper, E.W., Etheridge, D.W. & Smith, S.J. 2006b. Determining the Adventitious Leakage of Buildings at Low Pressure. In: Part 2: Pulse Technique. Build. Serv. Eng. Res. & Tech., 28(1), 81–96.
Etheridge, D.W. 2000. Unsteady flow effects due to fluctuating wind pressures in natural ventilation design – instantaneous flow rates. In: Building and Environment Vol 35(4), 321–37.
Etheridge, D.W. & Sandberg, M. 1996. Building ventilation – theory and measurement. Wiley, Chichester, UK.

Gotland University Press 15
213
Sustainable Refurbishment of Museum Buildings
Michaela Hoppe1*, Volker Huckemann2*, Lars Klemm3, Anke Schenk4, Sven Steinbach4 and Heiko Werdin5
1 Technische Universität München, Germany2 Technische Universität Braunschweig (project management), Germany3 Universität Stuttgart, Germany4 Bauhausuniversität Weimar, Germany5 Institut für Technische Gebäudeausrüstung Dresden, Germany* Corresponding emails: [email protected], [email protected]
Summary
A group of researchers from five German universities, along with several German museums, work on the development of retrofitting strategies for museum buildings. The overall aim is to provide the necessary indoor climate, as required for preventive conservation, with a minimum energy demand. With the help of two case studies, one technical museum and one art collection, the general procedure will be explained. A pilot scheme shows the project’s overall perspective.
Keywords
Museums, preventive conservation, retrofitting, energy efficiency.
Introduction
According to the International Council of Museums (ICOM) “a museum is a[n] […] institution in the service of society […], open to the public, which acquires, conserves, researches, communicates and exhibits the […] heritage of humanity […]”. But it is not only the exhibits that reflect social development, often the buildings themselves are as well architectural monuments of high cultural value.
Background
In Germany a multitude of museum buildings need to be refurbished within the next years. The complexity of these refurbishment projects lies within the necessity of meeting the requirements of various disciplines: How to provide a steady indoor climate, necessary for preventive conservation reasons, against the background of fluctuating numbers of visitors and the aim of lowering the energy demand, in order to cut both, costs and carbon emissions, in an, almost certainly, listed building?
To answer questions like this, engineers from the institute of building services and energy design at the Technical University of Braunschweig and four other major German universities formed a research group, funded by the Federal Ministry of Economics and Technology [BMWi], [EnOB]. The group’s overall intension is to escort museums through the difficult process of refurbishment. Each project partner is in charge of three museums, among them the here prescribed Ducal Museum in Gotha and Deutsches Museum in Munich, by developing and imple-

Gotland University Press 15
214
menting new refurbishment strategies. These will be validated by measurements, the results published in order to enable planners and museums to apply them on other projects.
Figure 1 shows the projects principle time line. During the first 4 years (study and concept phase) the status quo of the buildings is analysed and refurbishment strategies are developed. After a monitoring phase of 2–3 years the results will be published. In addition several pilot schemes are going to be realised.
General procedure
Present Situation of Museum Buildings
Initial investigations of building structures, plant service facilities and energy consumption of the participating museums showed U-values typical for their respective construction periods. Figure 2 shows the resulting energy consumption values (heating and electricity) per square meter net-ground area. The electricity consumption complies perfectly with the German Energy Saving Ordinance (Energieeinsparverordnung – EnEV) [BMVBS 2007], the heating demand of the museums however is in most cases above the reference value.
Fig. 1. Project Scheme showing the project basis and pilot schemes.
Fig. 2. Energy consumption (heating, electricity) of selected German Museums compared to the requirements according to the German Energy Saving Ordinance [EnEV 2007]

Gotland University Press 15
215
Some recently refurbished museums on the other hand, e.g. the Deutsches Technikmuseum (Museum of Technology, Figure 2, Museum 8) in Berlin, fall under the legal limits. These investigations are expanded by measurements of room air temperatures, surface temperatures, heat flow rates, relative humidity, illumination level and CO2 concentration.
Thermal Building Simulation and Assessment of Retrofitting Strategies
Calculations of the buildings’ energy demand based on DIN V 18599 – Energy efficiency of buildings [Deutsches Institut für Normung 2007], are confirmed by the above mentioned measurements and used as a basis for the evaluation of retrofitting measures.
Retrofitting measures providing the required indoor climate by minimizing the overall energy demand are merged in retrofitting strategies that will be put into practice. The resulting indoor climate as well as the energy consumption will be monitored in order to assess the refurbishment strategies implemented.
Daylight Usage vs. Artificial Lighting
In this context daylight usage in museums plays an important role. Against the usual conflict of conservation requirements, exhibition concept and resulting operation costs there is a need for finding individually optimized solutions.
Fig. 3. Skylight roof with 100 % artificial lighting – uniform light source distribution and light colour. Photo: Henrik Meisel.
Fig. 4. Skylight roof with a combination of natural and artificial light – Non-uniform light source distribution and light colour. Photo: Anke Schenk.
Amongst the cooperating museums are many 19th century buildings, which were designed as daylight museums. Apart from the side cabinets, these buildings have exhibition rooms with skylights. In many cases these were covered up with the intention of protecting the exhibits from harmful infrared and ultra-violet radiation (figures 3 and 4). Today many museums are considering the re-use of natural light, the reactivation of existing skylights therefore offers a huge energy saving potential. On the other hand careful planning is required to avoid heat losses.
In selected locations, existing window constructions including shading elements are investigated, including measurement of global, UVA, and UVB radiation as well as light intensity at different distances from objects or glazing. As the most important conser-vational aspect when using daylight is UV-protection, the UV-exposure on the objects themselves is measured.

Gotland University Press 15
216
Regarding artificial lighting innovative LED-Systems that have low energy consumption and produce little heat are studied.
Case Study 1: Deutsches Museum München
Situation
The Deutsches Museum was founded in Munich in 1903 and covers an area of 73 000 square metres consisting of some 50 exhibition areas dealing with science and technology today. The main building located on an island in the river Isar, dates back to 1925 and is one of the first ferroconcrete structures worldwide.
To ensure that it remains a top international address in the field of science and technology the Deutsches Museum launched a ‘future initiative’ in 2008, including refurbishment and updating to the latest technical standards of the museums premises [Deutsches Museum 2010]. In addition the necessary thermal impro-vement of the building will be funded by the second federal business activity support programme.
Due to the building’s size investigations focused on the south east wing of the building where climate conditions are quite critical, in order to achieve knowledge that could be transferred to the rest of the building. A Master thesis at the Technische Universität München [Dieterich 2009] identifies thermal comfort problems within the examined building parts. Possible solutions are developed and assessed by thermal simulation using IDA ICE, a dynamic multizone simulation application [IDA 2010].
The buildings south-eastern wall consisting of 49 cm reinforced concrete with an exterior layer of 2 cm limestone render, dates back to the buildings construction phase. All other elements where installed during an attic extension in the 1980s (Table 1).
Table 1. U-values of building components:
Building element Additional information U-value[W/m²K]
south-eastern wall (1925)
reinforced concrete, 49 cm; exterior layer of limestone render, 2 cm window to wall ratio ~33 %; glazing to wall ratio ~22 %
U = 2.3
north-western wall (1986/87)
reinforced concrete frame; insulated brick infill U = 0.43
roof (1986/87) plasterboard; ventilated air space, 43 cm; mineral wool, 6 cm; concrete slab; copper
U = 0.45
windows (1986/87) no internal or external sunscreens Uf = 1.6 / Ug = 1.5
top lights (1986/87) Uf = 2.0 / Ug = 2.8

Gotland University Press 15
217
The climatic situation in the building’s south east wing is characterized by high indoor air temperatures in summer, especially in the departments of informatics and microelectronic, due to its situation underneath the not insulated roof as well as high internal loads originating from illumination and solar radiation.
In winter the interior climate is conditioned by radiators underneath the windows along the south-eastern facade. To ensure the indoor air quality and to reduce the heat load in summer the windows and two of the top lights can be opened. There is no HVAC system installed.
Measurements
Measurements of room air temperatures, surface temperatures, heat flow rates, relative humidity, illumination level and CO2 concentration (Figure 5) give detailed information on the indoor climate quality. These are compared to weather data,
Fig. 5. Measurement of surface temperatures and heat flow rates (top fig.) and room air temperatures relative humidity, illumination level and CO2 concentration (bottom fig.).

Gotland University Press 15
218
collected by the Deutsches Museum’s meteorological station on top of the museum tower (Figure 6).
Thermal Simulation Model
In order to assess retrofitting strategies a model was developed, using IDA Ice as simulation tool. It is based on a reference model comprising authentic weather data. The measuring results were used to validate the thermal simulation calculations.
Assessment of Retrofitting Strategies
The suggested retrofitting measures vary from:
• exchanging the existing illumination system by LED technology (Table 2, column 1),
• replacing the existing top lights by triple or quadruple glazing elements (Table 2, column 2),
• replacing the existing windows with modern anti heat glazing (Table 2, column 3),
• enhancing night ventilation (Table 2, column 4), • add thermal mass to the roof (Table 2, column 5) to the integration of a
cooling system into floor and roof plates (Table 2, column 6).
Fig. 6. Room Air Temperature, relative humidity and CO2 Concentration in the microelectronic department of the Deutsches Museum in Munich in summer (left) and winter (right) compared at the basis of Ambient Temperature.

Gotland University Press 15
219
The individual measures were combined to 8 retrofitting strategies (Table 2) that were assessed using the thermal simulation model.
Results
All retrofitting strategies are assessed by comparison of the resulting overheating degree hours [Hauser 1999]. Table 2 shows clearly, that replacing the existing illumination system by LED technology would lead to a significant reduction of overheating degree hours and thus improve thermal comfort in summer. But only in combination with night ventilation and the replacement of existing top lights and glazing by triple- and anti heat glazing an acceptable climatic situation can
Table 2. Combinations of retrofitting strategies as assessed by thermal simulation and resul-ting overheating degree hours [Dieterich 2009].Retrofitting measure combinations and resulting overheating degree hours [Kh/a] for micro-electronics department (above, bold) and informatics department (below)
be achieved also for the upper level, where the microelectronics department is situated, even without installing an HVAC system.
The measurement equipment will remain in the museum until end 2012, so the impact of the building activities as planned by the museum’s building department can be validated.
Case Study 2: Ducal Museum Gotha, Castle Friedenstein Foundation
Situation
The Ducal Museum of Gotha, a neo-reneaissance building dating back to 1879 (figures 7 and 8), originally designed as an art gallery, houses a natural history museum today. It will be re-transferred into an art museum, due to the Schloß Friedenstein Foundationss director Dr. Martin Eberles efforts. The museum’s exhibition rooms and systems engineering will be extensively refurbished from

Gotland University Press 15
220
summer 2011 until presumably December 2012, in cooperation with the profes-sorship Bauklimatik at Bauhaus Universität Weimar, as prescribed in Table 3.
Exemplary investigations in room R 318 (Figure 9), a skylight room with no direct connection to the exterior, show what room climate can be achieved without installing systems engineering. With a volume of approx. 780 m3 and a ceiling height of about 9 m the room serves as a typical example of an exhibition space in a 19th century museum. It was designed as a daylight museum, but the existing skylights are covered with wooden boards, which today hold the artificial lighting equipment. From April to October, this part of the building was used for special exhibits. Tempering in winter was done indirectly through heat pipes, which run inside the historic floor ducts.
Fig. 7. Urban context.
Fig. 8. Ducal Museum Gotha – north façade Photo: Prof. Dr.-Ing. Kurt Kießl.
Table 3. Main characteristics of the Building:
Building Museum in neo-renaissance styleConstruction time 1864–1879Intended Use Art museum with approx. 2000 m² exhibition space over
three floors Ground floor Cafe (185 m²)
Intended refurbishment Rehabilitation of the sandstone facade New windows New systems engineering, incl. air conditioning for special exhibition Barrier free access

Gotland University Press 15
221
The temperature/humidity sensor was located at 3.30 m height and at 3 m distance from the enclosing walls. Measurements were taken from July 2009 until December 2010. Data is collected in a 5 minute cycle and transmitted to Weimar (Table 4). Climate requirements in the Ducal Museum Gotha include an annual temperature of 14–24 °C and an annual relative humidity of 40–60 %.
Results
Figures 10 and 11 show, that exterior climate fluctuations are very well buffered by the massive exterior walls. Relative humidity lies between 30 and 55 %. During the winter months humidification of room air will be necessary. Room temperature lies between 12 °C and 30 °C. During the summer months provisions must be made to reduce heat gains.
Fig. 9. Floor plan of 2nd floor – Ducal Museum Gotha.
Data Max. cyclesExterior temperature 15 min
(suggested 5 min)Exterior radiationExterior humidity Room temperature (disperasal in room)Humidity (disperasal in room)Surface temperature (wall and exhibited objects)Radiation gains through transparent building elements (particularly skylight)CO2 – Content in room 5 minPhotoelectric light barrier for counting visitors (direction specific)Door sensor to measure openings during measurement cycles and position at the moment of measuringHeat flow on select construction elements
Table 4. Measurement data overview and cycles:
However, due to the new exhibition concept and for conservational reasons the current refurbishment doesn’t consider the use of natural light. Nevertheless a future reactivation of the existing skylights shall remain possible.

Gotland University Press 15
222
Pilot Scheme: Energy Refurbishment of the German Maritime Museum in Bremerhaven
The German Maritime Museum in Bremerhaven plays a major role within the project as it is going to be the first pilot scheme to be realised. Its energy optimi-zation is going to be an outstanding example for energy optimized museum buildings in Germany, with a high influencing potential.
Situation
On 8500 m² the history of German nautical history is presented. The museum itself dates back to 1975 (Figure 12) and is the last major oeuvre of the German architect Hans Scharoun. In 2000 the museum was extended for the first time by Berlin based architect Dietrich Bangert. Now a second extension is necessary, which will be carried out by the same architect.
Energy concept and retrofitting strategy
The integrated energy concept, focusing on retrofitting measures, power supply, conservation and exhibition concept, merges the existing parts with the extension.
Fig. 11. Temperature development – Ducal Museum Gotha, room R318.
Fig. 10. Relative humidity development – Ducal Museum Gotha, room R318.

Gotland University Press 15
223
Building specific retrofitting measures
In order to achieve low primary energy consumption, energy losses caused by transmission (Table 5) and ventilation have to be minimized. Relatively easy to achieve for the museums newly built parts, this is quite challenging for the histo-rical part by Hans Scharoun.
Due to monument preservation requirements, the necessary thermal insulation will be achieved by applying vacuum isolation panels underneath the existing clinker façade, which had already been substituted once. Thus the original appea-rance of the building can be preserved, along with an optimised interior climate and minimised energy losses.
Fig. 12. German Maritime Museum in 1975 (left), Size of roof lights, reduced over the years (right).
Building Component Existing Building Retrofitted BuildingW/(m²K) W/(m²K)
Roof 0,57 0,1Exterior Wall 1,16 0,2Floor Plate 2,50 0,2Windows 1,40 0,9Roof Lights 2,70 1,1
Table 5. U-values of existing building part, built by Hans Scharoun, before and after retrofitting:
Power supply and plant service facilities
The planned extension of the museum by nearly 50 % of the existing area requires a new energy supply concept for the whole building.
The basic component will be district heating, supplied by the local waste-to-energy facility, with a certified primary energy factor of 0. It will cover the heating demand and operate the absorption refrigeration machine. Peak loads will be met by a compression refrigeration machine. In addition to the local electricity supply, roof integrated PV elements will produce electrical energy.
An air change rate of 2 h-1 will be provided by an air conditioning plant with a heat and humidity recovery efficiency factor of 75 %. In combination with low tempe-

Gotland University Press 15
224
rature heating and high temperature cooling systems, integrated into the refur-bished floor construction, the reduced air change rate offers a high energy saving potential.
Exhibition concept
The new exhibition concept combines preventive conservation requirements in accordance with international standards, comfortable indoor climate conditions and a reduced energy demand for heating, ventilation and lighting.
Fig. 13. Power supply and plant services.
One important aspect is the increase of illumination by natural daylight. The use of daylight was reduced over the years by partially closing the original roof lights (Figure 4). By their intended reactivation the solar gains, required by the energy concept, can be provided. However the protection of materials like paper, textiles, photographs and paintings is essential. So a triple-glazed window with a U-value of 0,6 W/(m²K) and a g-value of 0,25 is projected. The band-pass filter of 405 nm promises high protection, especially for sensitive materials like lignin and cellulose.
Outlook
Going to be realized until 2013, the German Maritime Museum will have an overall end energy demand of approximately 80 kWh/(m²a) for heating and 40 kWh/(m²a) for lighting and cooling.
Conclusions
At this state of the project it is still difficult to draw conclusions. What becomes apparent, however, is that museums definitely need strategies for their future. According to Friedrich Waidacher [Waidacher 1993] the number of museums

Gotland University Press 15
225
increases by 10 % every 5 years. This means that a museum, once established, hardly ever is going to be closed again. Due to their, by definition, continual lifetime museums need to establish a sustainable basis for their operating phase as part of their social responsibility.
Acknowledgements
Our acknowledgements go to the German Federal Ministry of Economics and Technology who fund this project as part of their EnOB-programme, and to all our museum partners without whom this project could never be realised.
References
BMVBS 2007. Bundesministerium für Verkehr, Bau und Stadtentwicklung (Federal Ministry of Transport, Building and Urban Affairs). 2007, Energieeinsparverordnung 2007 – EnEV 2007 (Energy Conservation Regulations 2007).
Bühler, D. 2009. Building a Masterpiece of Concrete-Technology: The Deutsches Museum in Munich (1906–1911), Proceedings of the Third International Congress on Construction History, Brandenburg University of Technology Cottbus, Germany, Cottbus 2009.
Deutsches Institut für Normung (German Institute for Standardization). 2007. DIN V 18599. Energetische Bewertung von Gebäuden (Energy efficiency of buildings). Beuth. Berlin 2007.
Deutsches Museum München 2010. 29.10.2010, http://www.deutsches-museum.de
Dieterich, S. 2009. Energetische Sanierung des Deutschen Museums München, Masterthesis Climadesign, Technische Universität München, 2009.
DSM 2010. Deutsches Schiffahrtsmuseum Bremen, 6.3.2010, http://www.dsm.museum/Homepage DSM.
EnOB 2011. Forschungsinitiative EnOB, 21.3.2011, http://www.enob.info/de/forschungsfelder
Hilbert, G.S. (et al.). Sammlungsgut in Sicherheit. – 3. Auflage – Gerbr. Mann Verlag Berlin: 2002.
IDA 2010. IDA Indoor Climate and Energy 4.0, http://www.equa.se/eng.ice.html, 3.11.2010.
Waidacher, F. 1993. Handbuch der allgemeinen Museologie. Böhlau. Wien 1993.

Gotland University Press 15
226
Indoor Climate and Energy Efficiency in Museums
Jan G. HolmbergGotland University, 62167 Visby, SwedenCorresponding email: [email protected]
Summary
The easy way to save energy in museums is to turn off the ventilation and in some cases even the humidification. The ongoing international discussion about indoor climate recommendations for museums opens up for a more relaxed and realistic view of the need for air conditioning. The first step to increase energy efficiency in museums must be to critically study the performance of the HVAC plant as well as the running hours. The second step may be to identify the real ventilation need – are there for example 50 or 500 visitors before lunch in the museum? And do we really need to follow the World Health Organisation (WHO) recommendation of maximum 1000 ppm CO2? The third step may be to turn off the HVAC plant for periods during night and day and at the same time keep track of the indoor climate. This paper is about intermittent running of plants, and as an example is the operation of the 30 years old HVAC plant at the Museum of Ethnography in Stockholm discussed.
Keywords
Museum, energy efficiency, energy saving, museum environment, carbon foot print.
Introduction
The overwhelming number of museums in Sweden are already built and in operation since many years. That means that they have air conditioning or venti-lation plants of age. One of the younger museums is the Museum of Ethnography in Stockholm. The museum was inaugurated 1980. The museum was designed and constructed according to the latest trends in those days.
The HVAC plants are well maintained over the years, but they are plants of the time when energy was inexpensive. The caretakers and the conservators concen-trated their efforts on keeping a stable indoor climate to the standards and recom-mendations of the time. The influence of the information in Garry Thomson´s classical “The Museum Environment” cannot be underestimated. As the Museum of Ethnography has a large collection of organic materials it is understandable that the conservators wanted very stable RH values over the day and over the season to obtain stable moisture contents. Since 1980 the cost in Sweden for a KWh has increased five times according to Figure 1. This is a very good reason to work hard with energy efficiency in museums and the carbon footprint of the museum building.

Gotland University Press 15
227
The aim of this paper is to give a concentrated overview of the joint efforts by the conservators and the property managers over the last years to keep an accep-table indoor environment for a large ethnographical collection and at the same time increase the energy efficiency of the HVAC plants.
All museums in Sweden are now under pressure to improve the energy efficiency and decrease the energy bill. Actions taken by the property manager and the conservators at the museum are described and discussed. Further measures are proposed. The impact on energy conservation by the WHO recommendation of maximum 1000 ppm CO2 in indoor air is under critical examination.
One major action has been to adjust the running time of the HVAC plant, not as a trial and error effort, but as an energy saving action under strict scientific control by the museum’s conservators.
Fig. 1. Cost for energy in Sweden 1980–2010. Source: Statistics Sweden.
Fig. 2. The Museum of Ethnography in Stockholm. Photo: The National Property Board.

Gotland University Press 15
228
Methods
The Museum of Etnography in Stockholm
The museum is built of concrete with a wood panel façade. The museum staff wanted a heavy building, being able to buffer climate variations. The design outdoor temperature is –20 °C. Thick walls and heavy floor slabs were requested. The emission of calcium, silicon and magnesium particles during the drying out period of the concrete construction was carefully measured by the conservators. It took 18 months to reach acceptable and recommended values. As concrete surfaces emit dust, indoor walls and roofs were painted with water based paint. The floors were laid with a high quality linoleum carpet. The building is presented in Figure 2.
The HVAC plants
The museum has in all 17 HVAC systems of different types. Four of them are larger systems which supply the main exhibition areas and the main storage areas. In this paper we will concentrate the discussion on one of the systems serving the exhibition area, as it is the main consumer of energy in the museum. A smaller HVAC system for one textile storage room is studied as well.
HVAC plants serving exhibition areas
Two similar systems control the indoor climate in exhibition areas, system LB1401 controls the 3rd floor and LB1402 controls the 2nd floor. The systems are almost identical. A flow chart for system LB1401 is shown in Figure 3. The design supply airflow is 12 000 m3/h, corresponding to approx. 1 ACH. The system is typical for the time of its design. It has no heat-exchangers; the heat recovery is obtained by circulation of air. The amount of return air is limited by a CO2 sensor in the exhaust air duct. The return air is today limited to 25 % when the CO2 concen-tration excides 800 ppm. The system was originally designed for maximum air flow only and for 24 hour/day operation.
Fig. 3. Ventilation system LB1401. Source: The National Property Board.

Gotland University Press 15
229
During the last years the property manager has installed frequency modulation systems for the supply and the exhaust air fan motors, thus establishing half and full air flow possibilities. But today’s full air flow is only 80% of the design airflow. The half airflow is 50 % of today’s full airflow. The property manager then started intermittent running of the ventilation system with its electric steam humidifiers. This experiment has been done in full cooperation with the conservators who are monitoring the indoor climate carefully.
Today the plants for the exhibition areas are operated on half airflow from 08.30 to 12.00 and at full airflow from 12.00 to 17.30 for all days of the week.
The set point for RH is 42% and for exhaust air 18 °C (H” room air temperature). The set point for supply air temperature is maximised to 19 °C and minimized to 15 °C. It is compensated to outdoor temperature as shown on the flow chart.
HVAC plant for textile storage (magazine 141)
The system LB1304 controls the indoor climate in the south textile storage. The flow chart is shown in Figure 4. The nominal air flow in the system is approx-imately 1 500 m3/h. As can be seen, the system is designed in the same fashion as the systems for the exhibition areas. The maximum supply air flow is 1500 m3/h corresponding to 1.25 ACH. As the textile storage room is open only to staff and not to visitors, system LB1304 is operated with full airflow the whole day, i.e. from 07.30 to 17.30 and turned off during night. The set point for temperature is 15 °C and for RH 42 %.
The conservators were very concerned about the stand still of the climate control system night-time. Careful and extensive measurements of the preservation climate in the storage room have been performed.
Fig. 4. Ventilation system LB1304. Source the National property Board.

Gotland University Press 15
230
Monitoring the indoor climate
The climate in the exhibitions and the textile storage (as well as many other rooms in the museum) is monitored by mechanical thermo-hygrographs type Lambrecht 252 with for example no 442171 in the textile storage. Thermo-hygrographs are adjusted by a Testo 625 with No. 1394651 or ST termo 5100 No. 25554. All mechanical and electronic instruments are calibrated by an Assmanpsychrometer of English brand, a Casella from London with No. 5472 and thermometers No 81793 and 81865 calibrated according to BS 5246. Figure 5 gives the result for January 2011 in the exhibitions and Figure 6 gives the result for January 2011 in the textile storage room. As can be seen, there is a daily variation of approximately 4 % RH in the textile storage and 6 % in the exhibitions. The temperature is 19 °C in the textile storage room and 19 °C in the exhibition area. Why the temperature in the textile storage is not according to the set point requirement is unknown. According to the flow chart, the set point is temporarily raised to 18 °C; some work might be ongoing in the room during the monitoring.
Fig. 5. Monitored climate in the exhibition hall during January 2011.
Fig. 6. Monitored climate in the textile store room during January 2011. Source: The Museum of Ethnography, Stockholm.

Gotland University Press 15
231
International climate discussions
The present international discussion about relaxed conservation climate recom-mendations has not been any driving force for the energy conservation scheme at the museum. But the recommendations from Smithsonian Institute of 70 ± 4 °F and 50 ± 8 %RH and from the Bizot-group of 16–25 °C and 40–60 %RH for mainly objects of organic materials will of course help when further energy saving actions will be discussed. For the time being, the climate requirement for the Museum of Ethnography is 19 °C and 42 %RH in exhibitions and 15 °C and 42 %RH in the textile store room.
Energy savings
The National Property Board has a system for registration of district heating use and electricity use per month. Figure 7 shows the decrease of district heating used for the period 2006 to 2010 in MWh per month. The numbers are degree-day adjusted.
Fig. 8. Use of energy for the period 2006–2010. Source: The National Property Board.
Fig. 7. Use of district heating 2006–2010 per month. Source: The National Property Board.

Gotland University Press 15
232
Discussion
The CO2 problem
The WHO recommendation of maximum 1000 ppm CO2 in the indoor air for human comfort and health creates problems. The recommendation may be based on von Pettenkofer (1858) who was a leading expert on human hygiene and health, (Stålbom 2010). Pettenkofer’s concern was the use of gas lights in every room in larger down-town flats in Vienna at the middle of the 19th century. The extensive use of gas gave high CO2 concentrations indoors.
The Swedish situation is complicated. Three different government organisations are giving vague statements about the CO2 concentrations, the Swedish National Board of Housing, Building and Planning, the National Board of Health and Welfare and the Work Environment Authority.
District Surveyors in communities all over the country are nowadays around, measuring CO2 in schools, children day care, nursing homes, work places, etc. They reject ventilation plants and systems with the argument that the CO2 concentration in the indoor air is above 1000 ppm at the time for the measurement.
This situation is the reason why the Property Board is using 800 ppm as upper limit in the Museum of Ethnography, even though the large room volumes and room height do not make this necessary. Abel and Elmroth (2007) give convincing arguments and Stålbom (2009), (2010) asks, with good arguments, the Swedish government organisations involved to rethink. He calls the official vague state-ments “an intellectual disaster”. A main obstacle to improve the energy efficiency in museums is the present belief in 1000 ppm CO2 as a figure based on scientific facts.
Carbon dioxide itself does not cause any problems until very high concentra-tions are reached. The hygienic limit is 5000 ppm, a level that is never reached in a museum exhibition area. The exhaust air from one person has around
Fig. 9. Relation between CO2 concentration, ventilation and room height; the effect of the height of an exhibition room, in which the majority of the airborne pollutants come from the museum visitors. The question is, how long will the general museum visitor stay in the exhibi-tion room? One hour? Two? Source: Abel and Elmroth (2007).

Gotland University Press 15
233
50 000 ppm. Carbon dioxide is used as a criterion for air quality only because it is easy to measure. The CO2 concentration is only an indication of poor air quality in a room, not a measurement.
The humidifying problem
The Museum of Ethnography had from the beginning humidifiers with evapo-rative pads built in to the HVAC plants. After several years of operation, the duct system was contaminated with mould and dirt, partly caused by the pads. Today there are electric steam humidifiers installed in the ventilation plants. From an energy saving point of view, the evaporative system is to be preferred because the energy for evaporation of water is from the ventilation air, heated via district heating water. In Sweden many district heating plants are based on the burning of garbage. The energy unit produced in a district heating plant (as hot water) is cheaper than the energy unit produced in a nuclear power plant (as electricity). As the HVAC plants at the museum has no heat exchangers, all heat recovery is by means of circulating return air. The amount of return air is, as already mentioned, limited by the preset set points of the CO2. A major part of the exhaust air leaving the building is warmed to human comfort and humidified to stabilise the moisture content in organic materials.
Fig. 10. Comparison in an hx diagram of humidifying with water and steam. Source: Abel and Elmroth (2007).

Gotland University Press 15
234
The running hours for the HVAC plants have been cut down as mentioned. Another effort to save energy is master control all humidifiers. If a HVAC plant is set in automatic mode (as they normally are) the humidifier will be overrun and stopped when the outdoor RH is over 30 % five consecutive days, and started again in reverse order.
The BMS problem
The Building Management System used for operation and control of all the HVAC plants at the museum is considered to be an effective system. The BMS system is absolutely necessary for the operation of all HVAC plants. But the number of input data is considerable, and there are unintentional adjustments of set points or time-values for on/off control of ventilation.
The final result of the use of energy for year 2010, se Figure 8, was unexpected by the property manager. Year 2010 was certainly 15 % colder than the standard year (1971–1990) which means that the electric steam humidifiers have been in operation more than usual, but the increase of the electric consumption is too large to be explained only by that fact. When writing this paper, and during discus-sions with the property manager, it was observed that the time set for half speed of the ventilation plants from 08.30 to noon was not in operation, by mistake. The HVAC plant LB1401 has probably been in operation with full air flow the whole day for some period during 2010. How long this has been ongoing will be analysed. The problem with some BMS systems is that it is possible to change set points in the system without leaving a footprint of the engineer having done so.
Further possible savings of energy
The main HVAC plants in the museum need hygroscopic heat exchangers (regenerative systems) to recover both heat and humidity. The present limits for CO2 concentration may very well be doubled, to 1600 ppm and 800 ppm respec-tively. Running time for HVAC plants may be further investigated. The important thing to remember is that the conservators have to monitor temperature and RH continuously to keep track of possible change of moisture contents in organic materials.
Conclusions
The Museum of Ethnography in Stockholm has, according to the interpretation of Directive 2002/91/EC by the Swedish National Board of Housing, Building and Planning (Boverket), a total consumption of 145 kWh/m2 per year of which 50 kWh/m2 per year is electricity. During the years 2006–2009 the museum has decreased the electric energy consumption by approximately 30 %. The district heating consumption has during the years 2007–2010 decreased by app roximately 13 % when degree-day correlated. During the periods mentioned the property manager and the conservators have maintained an acceptable preventive conservation environment. There is some room for further energy savings.

Gotland University Press 15
235
Acknowledgements
The author acknowledges the support by Lars-Erik Barkman, Chief Conservator at the Museum of Ethnography in Stockholm and of Peter Ullman, Service Engineer at the National Property Board in Stockholm.
This investigation has partly been supported by the Swedish Energy Agency.
References
Pettenkofer, M. von. 1858. Ûber den Luftwechsel in Wohngebäuden, München.
Abel, E. & Elmroth, A. 2007. Buildings and Energy-a systematic approach, Formas The Swedish Research Council for Environment, Agricultural Services and Spatial Planning.
Stålbom, G. 2010. Varmt och Vädrat – VVS-teknik i äldre byggnader, Sveriges VVS-museum- SBUF-VVS Företagen.
Stålbom, G. 2005. Regler om ventilation och innemiljö-på fyra nivåer, VVS Teknik & Installation, Stockholm.
Stålbom, G. 2009. Koldioxidens riktvärde bör utvärderas. Energi & Miljö Nr 9, Stockholm.
Statistics Sweden. 2011. www.scb.se

Gotland University Press 15
236
An Analysis of Microclimate Differences Leading to Sporadic Mould Growth in Skokloster Castle, an Unheated Historic Building
Jonny Bjurman1* and Gustaf Leijonhufvud1,2
1 Department of Conservation, University of Gothenburg, Gothenburg, Sweden2 Gotland University, Visby, Sweden* Corresponding email: [email protected]
Summary
Mould growth has repeatedly occurred in Skokloster Castle over the years. Visible mould was also found during a survey in September 2010. Mould has been found sporadically on walls, books and tapestries and behind paintings and within furniture in parts of the castle. Work is presented on the attempted corre-lation of incidence of mould growth and indoor climate recorded mainly during one year, from July 2008 to August 2009. The indoor climate is influenced to a high extent by the outdoor climate but is clearly improved by the influence of the building envelope. The absolute humidity is almost the same in the whole castle. Temperature differences between rooms are therefore decisive for the recorded differences in RH. Recorded RH differences could partly explain the location of mould growth. The results are discussed in relation to current models describing the critical levels of RH, temperature and substrates supporting mould growth.
Keywords
RH, temperature, absolute humidity, mould growth requirements, minimal energy consumption.
Introduction
Skokloster Castle (See Fig. 1) was built in the 17th Century near Lake Mälaren in central Sweden. The Castle has for a long time been used as a museum open to the public mainly during the warmer part of the year, keeping the original furnish ings, oil paintings, books, tapestries and other objects more or less in their original positions.
Although the castle has been without any active climate control and thereby influenced to a high extent by the outside climate most of the objects are in a surprisingly good condition. However, localised mould growth has occurred sporadically and was also found during a systematic survey made in September 2010. During several years, and particularly during the two years 2008–2010, an extensive RH- and temperature measurement program has been executed with the aim to understand the passive properties of the building envelope. A first presentation and analysis of the relation of the indoor climate in Skokloster Castle to outdoor climate as well as climate differences between rooms was published

Gotland University Press 15
237
Fig. 1. Skokloster Castle seen from the north. Photo: J.Bjurman.
by Broström and Leijonhuvud (2010). The climate data used were from July 2008 to August 2009. Mould growth was considered a very important threat to the castle and its valuable objects. In the work presented in this paper a correlation of mould growth and microclimates in this unheated historic building has been attempted. According to conservators/restorers at the Castle mould growth was known to have occurred sporadically over the years.
The main purpose of the present paper was to gather information of mould growth and using the climate data to try to explain the difference in occurrence and location of mould growth in the rooms included in this study. An analysis of these relations may be used as a base for recommendations regarding minimal interventions for prevention of mould growth in large historic buildings in a
Fig. 2. Mould growth in a cupboard. Photo: J. Bjurman.

Gotland University Press 15
238
temperate climate and thereby promote a sustainable management with energy-efficient climate control.
Methods
Most of the rooms in the castle were visually surveyed for the presence of mould growth in September 2010. To get an assessment of earlier incidences and location of mould growth in the castle conservators responsible for the care of the castle were interviewed. Climate data recorded from July 2008 to August 2009 were used for a first approximation of differences in climate in the different rooms in the castle. Some of the climate data from the recording period August 2009 to 2010 were used for validation of some of the conclusions. For this work climate data for a selection of rooms, with or without confirmed visible mould growth, were compared and analysed. The temperature and RH sensors were normally placed in the middle of each room. Temperature and RH-gradients within rooms were generally small, as indicated by Broström and Leijonhufvud (2010) but are to be further investigated. For a general plan of the castle with room numbers and principal directions see Fig. 3. The plan is approximately the same for all four floors.
Analysis of influence of the climate on mould growth in Skokloster Castle
For a first analysis of the relation of climate data and verified mould growth the incidence of measurement points above a line approximately describing the current notion of critical RH limits for mould growth on building materials at different temperatures were used. One can compare the isopleths proposed by Sedlbauer (2001) which are based on some literature data for moisture and temperature requirements of mould fungi available at that time.
Results
Incidence and location of mould growth
During the 2010 survey of almost every room visible mould growth was found in the following rooms: 2 V (north), 3 A (east), 3 B (east), 3 V (north), 3 Y(north east tower), 4 A (east) and 4 V (north). In room 2 R (north) mould was not found during the survey but mould had been found earlier on a bed.
For the intended analysis in this paper the following rooms were selected as representatives for rooms without verified mould growth: 2 A (east), 3 N (west), 3 R (north), 4 C (south-east), and 4 R (north).
Fig. 3. A plan of Skokloster Castle. The rooms are numbered in the same way on all 4 floors.

Gotland University Press 15
239
In room 2 V (north) mould was found within a cupboard (Fig. 2), beside this cupboard on the wall, and on tapestries. This room was mechanically cleaned from mould 1997 and 2007. Mould growth in this room is thus a recurrent problem. Mould was found in room 3 A (east) under a cupboard. In room 3 B (east) mould was also found under a cupboard. In room 3 V (north) mould was found in a cupboard and on the mantelpiece. In room 3 Y (north-east facing tower) mould was found below a table. Mould had been found earlier in room 4 V (north) and in room 4 A (east) where mould had been found on book bindings.
During a survey of the state of furnishes 1995 mould was found on several items preferentially furnishings in north facing rooms.
Mould had earlier also been found on canvas paintings, mainly at the backside, and preferentially paintings that had been lined using animal glue or starch. Over several years the original lining adhesives have largely been removed and exchanged with synthetic adhesives by a former paint conservator at the Castle. This mould growth was popularly referred to as the “Skokloster Syndrome” at that time.
Climate differences between rooms
An analysis may be made by using a comparison of climate in rooms in different principal directions and different floor levels at different seasons and at different temperature cut offs.
Fig. 4. Comparison of outdoor climate year 1 (upper left), indoor climate in room 2 V from July 2008 to July 2009 (upper right) and indoor climate in room 2 V from September 2009 – September 2010.

Gotland University Press 15
240
Fig. 5. Comparison of climate recordings for rooms 4 A (upper left), 4 C (upper right) and 4 V. Facing east, south-east and north respectively.
Fig. 6 (see below). Difference in incidence of measure points (scatter) at different RH for room 3 R year 1 (upper left), 2 V year 1 (upper right), 2 R year 1 (lower left), 2 V year 2 (lower right). The line describes a suggested lower limit for mould growth at different temperatures.

Gotland University Press 15
241
From July to December it is warmer and lower RH indoors than outdoors. From February it is colder indoors than outdoors and RH is higher indoors than outdoors. Se Fig. 4 for a comparison of outdoor climate and the climate in a representative room. It is also warmer in room 3R than in room 2 R during early summer. During the spring the temperature is somewhat lower indoors than outdoors especially in rooms on the northern side of the castle. This results in a higher RH inside than the average outside.
Room 2 V which has had mould growth several times over the years has RH values over 80 % at temperatures above 10 °C more often than room 2 R, both rooms to the north. In room 2 V RH is higher than 80 % also when the tempe-rature is above 20 °C. There are periods during spring when temperature is several degrees higher on floor 4 than on floor 2.
During early summer on floor 4 it is warmer in room 4 A (east) than in room 4 R (north).
It is also warmer in room 3 R than in room 2 R during early summer. In spring the temperature is somewhat lower indoors than outdoors especially in rooms on the northern side of the castle. This results in a higher RH inside than the average outside. From July to December the temperature is higher indoors than outdoors.
Discussion
The repeated occurrence of mould growth incidences in several rooms in the Castle over the years is a confirmation of climate conditions that often are too humid. However, there is often a clear beneficial effect solely by the influence of the building envelope and the influence of the presently normal yearly climate variation in the surrounding outdoor climate. A general trend is that RH is very high indoors in most rooms when temperature is low, during the winter. However, the low temperature is thereby expected to balance the high RH in relation to mould growth. There are only minor differences in the absolute humidity between the rooms during most of the year. That is anticipated since little apparent internal humidity sources are present.
During sunny days in summer, rooms are differentially heated in the different principal directions which lead to lower RH indoors in rooms facing south and west and periodically lower temperatures in rooms facing north and, to some extent, to the east. The somewhat higher temperature in room 3 R than in room 2 R during early summer and a somewhat lower temperature in room 3 R during late autumn is probably dependent on the solar angle in this part of Sweden and the gradually thinner walls in higher parts of the castle. The periods during spring when temperature is several degrees higher on floor 4 than on floor 2 are probably caused by the solar heating on the black roof of the Castle.
Differences in amounts and type of hygroscopic objects in the different rooms would be expected to moderate the RH in the rooms to different degrees. Such an effect should cause a difference in absolute humidity at least during some period. This is not proven by the recorded climate data. Walls may have a greater

Gotland University Press 15
242
moisture buffering effect. However, it is likely that moisture accumulated in books in the library on floor 4 during winter may be one reason for the occasional mould growth incidence on book bindings. Such effects have to be studied further.
The relative importance of the climate control effect of the building envelope and air exchange rate on the indoor climate has to be clarified. In the climate records from 2008–2009 all fluepipes were continuously open.
The clear difference in mould growth on paintings with lining and without is a clear demonstration of the moderating effect also of the available nutrients in different objects. Animal glue in linings are known to be a good nutrient for mould growth (Bira Jr., 1986) and a reason to chose other adhesives for that purpose. Other substances that may be nutrients for mould growth in the castle is dirt or dust (Pasanen (et al.), 1997) and settled pollen. The cleaning of the rooms is therefore very essential as has also been pointed out by presently active conser-vators responsible for the maintenance of the objects (Hallström et al, 2010).
Room 2 V which has had mould growth several times over the years has RH values over 80 % at temperatures above 10 °C more often than room 2 R, both rooms to the north. In room
2 V RH is higher than 80 % during periods also when the temperature is above 20 °C. There are periods during spring when temperature is several degrees higher on floor 4 than on floor 2 probably caused by solar radiation on the black roof.
There is still not a clear consensus regarding the critical climate require-ments for mould growth in buildings. There is also a popular notion that mould growth is very directly related only to RH above the surface attacked by mould. However, the foundation for determination of minimal moisture requirements for mould growth is gradually growing (Smith and Hill, 1982; Grant et al, 1989; Viitanen and Ritchkoff, 1991, Pasanen et al, 1991; Li et al, 2005. There has also been a gradual increase in the awareness of the complex influence of RH and temperature.
The importance of the critical effects of the duration of necessary levels of RH and temperature for growth of mould fungi under humidity variations usually encountered in a building was shown by Viitanen and Bjurman (1995). In this work, describing growth of mould fungi on wood, it was clearly shown that there was a growth retarding effect of periods at RH levels below levels that had previously been shown to be necessary for growth at constant climate conditions (Viitanen and Ritschkoff, 1991), even when compared with just the cumulative time at the higher RH. There also often seems, when discussing climate require-ments for mould growth, to be an unawareness of the difference between requi-rements for survival and growth as well as the difference between the lag phase, the kinetics of growth and the maximum growth on a material. Often when prescribing RH for buildings no distinction between the climate in the main body of a room and possible microclimates in parts of the room are made.

Gotland University Press 15
243
Conclusions
Not unexpectedly there is higher temperature in rooms on the southern side than on the northern side of the castle. The northern side therefore have higher RH since the absolute humidity is very similar in all rooms in the castle.
The rooms on floor 4 have lower RH during the summer due to the influence of solar radiation on the black roof. Room 2 V in which mould growth recurrently has occurred has more occasions with critical RH levels due to a comparatively lower temperature during the summer. The risk for renewed mould growth is probably increased in room 2 V because of the likely presence of living but inactive mould hyphae in the tapestries. Heating a few degrees with the aid of a humidistat or preferably the use of dehumidification could create an indoor climate with less risk for mould growth in room 2 V.
Further studies on the relation of mould growth and varying climate conditions in unheated historical buildings may generate new ideas for an energy-efficient prevention of mould growth
Acknowledgements
The financial support from The Swedish Energy Board is gratefully acknow-ledged. We are also grateful for the help from all members of the staff during our visits at the Castle. We are especially thankful for the information regarding earlier mould growth incidences over the years given by conservators working at the castle.
References
Bria, C.F. 1986. The History of the use of synthetic consolidants and lining adhesives. WAAC Newsletter 8 (1) 7–11. ISSN 1052-0066.
Broström, T. & Leijonhufvud, G. 2010. The indoor climate in Skokloster Castle. In: Del Curto, D. (ed.), Historical buildings as museums. Systems for climate control and heritage preservation, Nardini Editore, Firenze 2010, ISBN 978-88-404-4286-3.
Hallström, A., Hedhammar, E. & Tamm. L. 2010. Cleaning, Condition Surveying and Maintenance: House keeping Swedish Style. Presented at the Conference Multidisciplinary Conservation: a holistic View for Historic Interiors at a Joint Interim Meeting of five ICOM-CC Working Groups, Rome.
Grant, C., Hunter, C.A., Flannigan, B. & Bravery, A.F. (1989). The moisture requirements of moulds isolated from domestic dwellings. In: International Biodeterioration 25, 259–284.
Li, Y., Wadsö, L. & Bjurman, J. 2005. Using measurements of fungal activity by isothermal microcalorimetry as a base for modelling fungal growth in buildings. In: Proceedings, 10th International Conference on Indoor Air Ouality and Climate: Indoor Air 2005. ISBN/ISSN: 7-89494-830-6.

Gotland University Press 15
244
Pasanen, A.L., Kalliokoski, P., Pasanen, P., Jantunen, M,J. & Nevalainen, A. 1991. Laboratory studies on the relationship between fungal growth and atmospheric temperature and humidity. In: Environment International vol 17, 225–228.
Pasanen, P., Korpi, A., Kalliokoski, P. & Pasanen, A-L. 1997. Growth and volatile metabolite production of Aspergillus versicolor in house dust. In: Environment International, 23(4), 425–432.
Sedlbauer, K. 2001. Prediction of mould fungus formation on the surface of and inside building components. PhD thesis. University of Stuttgart.
Smith, S.L. & Hill, S.T. 1982. Influence of temperature and water activity on germination and growth of Aspergillus restrictus and Aspergillus versicolor. In: Transactions of the British Mycological Society, 79(3): 558–560.
Viitanen, H. & Ritschkoff, A.C. 1991. Mould growth in pine and spruce sapwood in relation to air humidity and temperature. Swedish University of Agricultural Sciences, Department of Forest Products Report No. 221. Uppsala.
Viitanen, H. & Bjurman, J. 1995. Mould growth on wood under fluctuat ing humidity conditions. In: Material und Organismen 29, 28–46.

Gotland University Press 15
245
On Historical Climate in Swedish Stone Churches
Mattias Legnér* and Mia GeijerGotland University, Visby, Sweden* Corresponding email: [email protected]
Summary
Archival sources and historical methods have so far been underutilized in the research on past indoor climates in historic buildings. Before we can build a base of empirical knowledge, we need to discuss and develop the methodology. The purpose of this paper is to demonstrate the importance of archival sources when attempting to reconstruct the heating and climate history of an historic building. Knowledge of the long term indoor climate of a church may support strategic decisions for a more sustainable use of resources. In order to show the feasibility of this, the paper will examine the climate and heating history of two medieval stone churches: Levide parish church on Gotland and Strängnäs cathedral west of Stockholm.
Keywords
Indoor climate, conservation, churches, Levide, Strängnäs.
Introduction
It is the purpose of this paper to demonstrate the usefulness of historical sources in trying to reconstruct the climate history of a church building and how techno-logical methods for regulating the climate have been introduced in the past. References to past indoor climate have been used either to defend status quo or to motivate more or less radical changes in climate control. With the help of archives an empirically based knowledge of the history of indoor climate may develop. What is possible to say about indoor climate using archival sources? What grounds have decisions on heating and climate control rested upon? These questions will be applied to two medieval stone churches in Sweden: Levide parish church on Gotland and Strängnäs cathedral west of Stockholm.
Method
Church heating and conservation ideology
In some cases the written documents describing technical installations can be verified by traces in the buildings, photos or other illustrations. But when it comes to the factual effect of these or the thermal situation experienced, we are often left with interpretations. This poses a methodological problem, namely that if we wish to use archives to research climate issues we will become dependent of the knowledge and worldviews of those who once produced the documents. Acknowledging this bias among actors in charge of supervising the care of the churches is one way to cope with this lack of complete and objective information

Gotland University Press 15
246
that has been used by historians (Edman 1999; Geijer 2007; Legnér 2010a, 2011).
As of yet very little has been published about the functioning and repairing of churches in the past. Instead, the focus has been on the erection of new churches or major restorations (Gustafsson 2010; Lindblad 2009; Elmén Berg 1997; Fernlund 1982). We know relatively little about care, maintenance or the use of conservation technology. Stone churches are a peculiar group of historic buildings in the sense that they are built with thick walls which have a great capacity of storing moisture and heat, they contain sensitive objects and interiors and they were never constructed to be heated (Broström 1996:9; Holmström 1967a:12). In fact heating devices were normally not installed in the churches until the second part of the 19th century, and many churches remained unheated well into the 20th century (Lindblad 2009:47).
There have been periods of discontinuity and hesitance in the official views on the suitability of permanent heating of churches, depending on the perspective of the actor. In the late 19th century when heating devices were a novelty in churches, the Board of Public Works and Buildings was rather cold-hearted towards this kind of technology since it was aesthetically displeasing (Zettervall 1887:89). During the early decades of the 20th century a more positive view on introduction of central heating in stone churches prevailed at the National Board of Building and Planning, leading to a rapid increase of installation of heating devices in churches all over Sweden. Later, beginning in the 1950s, knowledge about the conservation effects of permanent heating grew as a lot of medieval churches seemed to suffer from overheating. Problems identified were the black-ening of walls and ceilings and a climate that was too dry for the wooden interiors and objects (Holmström 1967b:51).
This particular piece of advice is evidence of a change in the ideologies of resto-ration (Geijer 2004:135 ff). By the late 20th century the National Heritage Board had taken the stand that permanent heating to some degree was necessary for conservation purposes. To keep a church unheated would be “a technically risky solution” (Antell and Karlström 1998:7). The Board did not advice against turning the heat off completely, but wanted a decision to be well grounded. One reason was that the use of rural churches in Sweden was changing at this time, with costs for heating growing and with many buildings being used more seldom. Whereas scientific knowledge on the effects of climate on buildings and different materials had increased much since the early part of the century, management of church buildings and interiors had not improved in the same rate.
Archival records for researching climate in churches
According to Church Law the parish priest was to keep the records safely and in good order. The parish coffin should contain not only the money of the church but also gold, silver, clothing, tin, copper, accounts and other inventories with valuable information. There was also a prohibition of selling moveable goods belonging to the church, such as gold, silver, books, letters, antiquities etc. Documents were to be protected from moisture and fire hazards. They were

Gotland University Press 15
247
to be kept inside the church and could not be moved to the rectory without the authorization of the diocese (Sundberg 1948:350ff). Parish accounts or parish meeting protocols may be preserved from older times and in that case they can show expenses made for maintaining the church building. These are normally kept in the Regional Archives. Drawings may be found in a number of archives, most importantly in the National Archive (RA), where drawings and plans submitted to the Board of Public Works and Buildings and later the National Board of Building and Planning are kept. Matters concerning conservation of churches and valuable objects are also found in the Archive of the National Heritage Board (ATA).
Bishop’s visitation protocols are without doubt one of the most useful records when attempting to shed light on the older climate history of churches. Documentation of the churches in Skåne in the 19th century gives some evidence that churches, especially the new ones (Fernlund 1982:39f, 62f), were damp and smelly, with wooden floors sometimes attacked by rot and walls and ceilings covered with patches of mould. The tradition of burying the dead inside the church was still alive despite that bishops spoke against it with increasing fervor (Schönbäck 2008:211ff). When floors collapsed or sunk the reason was an unfilled grave beneath the floor. These graves could give off a foul smell, making it necessary to constantly air the church in the summers. In Skåne the wide spread use of flower arrangements on the walls and fir twigs covering the floors should have contributed to mould growth. The fresh smell of fir twigs was used to combat foul air coming from corpses, mould, sweating and dirty bodies (Legnér 2010b:273). Textiles in the churches, such as the altar cloth, suffered from the humidity and were often in poor condition. Insect pests attacked all wooden objects. The choirs were often dusty and dirty, as were the windows.
Until 1918 it was the Board of Public Works and Buildings that was surveying the alterations and other major works concerning the churches in Sweden (Geijer 2004; Mellander 2008). Throughout the 19th century it was easy for congregations to avoid reporting alterations of their church, or even its demolition (Wetterberg 1992:29). Regulations on the protection of churches in use (as opposed to ruins) continued to be vague and non-binding throughout the 19th century. The ordnance of 1867 prescribed that all changes to older churches should be reported to the state before they were carried out (Fernlund 1982:25). This meant that it was up to the parish priest to decide whether the church was “peculiar” or not, and of course it was more convenient to think it was not. Most medieval churches were not seen as peculiar enough to be worthy of attention, but this view was about to change. In 1908 a specialist department for the care of buildings of cultural value was organized within the Board of Public Works and Buildings and from the beginning of the 20th century The Board of Antiquities was gradually upgrading its view of the church as a historical document representing a common cultural heritage which was not exclusively the concern of the congregation (Geijer 2004:60; Elmén Berg 1997:69ff). By the 1920s the Board was taking a more active part in supervising and approving restoration work, and the number of issues concerning churches also rapidly increased at the National Board of Building and Planning, from 1918 responsible for the surveillance of these matters.

Gotland University Press 15
248
Results
Levide church
Levide church, built in Roman style c. 1200–1260 with few later additions – among them a vestry from c. 1780 – has a recorded history of damage and repairs caused at least partially by climate factors. Major repairs in modern time have been carried out in 1827, 1835–38, 1902–03, 1956–57, 1973 and finally in 2007. Central heating has never been installed here. Intermittent heating was introduced in 1903. In the 1950s electrical heating replaced a stove, and in 2007 the heaters were finally replaced by new ones.
In the bishop’s visitation of 1803 the church was described as being in good condition, but it was suggested that a fireplace should be built in the vestry in order to preserve the reverend and give the school children some comfort.1 At this time the parish could not afford this improvement. In 1833 the bishop added that heating would also be good for the conservation of the textiles and the money.2 At this time the interiors of the church had been repaired, but repla-cement of the roof remained to be made.3 A few years later it was noted that books, bonds and bills could not be completely protected from damp and mould without a fireplace (Lagerlöf and Stolt 1996:38).
Fig. 1. Levide church.
In 1816 the roof was in poor condition (but was not repaired), and in 1825 the wooden floor was said to be in need of immediate repair. Most of the wooden constructions inside the church, including the floor, floor beams and benches, were completely replaced in 1827.4 Under the floorboard there was a 10 cm thick layer of mortar, except for the choir where most of the flooring consisted of a great number of horizontal tombstones.
In 1837 the wooden roof was replaced in its entirety, which means that it probably had been leaking for quite some time.5 Evidently, the roof was leaking already in 1813 (Lagerlöf and Stolt 1996:39), so for at least 24 years an unknown amount of water from rain and snow leaked into the building. The priest had
1 ViLa, Levide kyrkoarkiv, vol N:2, Documents regarding visitation, inventory and archives 1802–1876, June 5, 1803.
2 ViLa, Levide kyrkoarkiv, vol N:2, Documents regarding visitation, inventory and archives 1802–1876, August 4, 1833.
3 ViLa, Levide kyrkoarkiv, vol N:2, Documents regarding visitation, inventory and archives 1802–1876, May 4, 1833.
4 ViLa, Levide kyrkoarkiv, vol KI:1, Parish meeting protocol Juni 10, 1827, pp. 149–150.5 ViLa, Levide kyrkoarkiv, vol. KI:2, Parish meeting protocol September 13, 1835, p. 41, Februari 12, 1837,
p. 65.

Gotland University Press 15
249
wanted the new roof to be tiled since that was both cheaper and more lasting than a wooden roof, but the peasants had been of the conviction that wood would be much easier, if more expensive, to deliver to the church. So the parish settled for a new wooden roof that would be more expensive, less lasting and require to be tarred regularly.6
In accounts from the later part of the century there are some, although scarce, evidence of how much money was put into the maintenance of the church building. Parishes sometimes used the cash balance for maintenance of the church (such as the purchase of materials) (Fernlund 1982:18). In the financial plan for Levide in 1865 there was no entry for maintenance, except for a small payment to the ringer for washing and cleaning inside.7 In the budget for the fiscal year 1874, 15 Kronor was suggested to be enough for this task, and that was as much as was spent on fire insurance or about one sixth of the expenses.8 In 1886 fire insurance together with maintenance were supposed to cost 50 Kronor, which in relative terms was about the same as for 1874. There was also another mainte-nance related expense, namely the purchase (30 Kronor) of a cabinet to keep the church records in, which until then had been stored directly on the floor under the benches of the vestry.9 There was a cabinet in the vestry before,10 but apparently the records did not fit in it, or perhaps the old cabinet was broken.
In 1897 the bishop expressed the wish that a stove be installed in the church, and shortly thereafter the architect N. Pettersson who worked with restoring and making modifications on Gotland churches drew a proposal.11 The accounts of the church give some indication of when a stove first was installed. It was a stove purchased in the winter of 1902.12 At that time it was discovered that the wooden floors were rotten, that new doors had to be fitted and the windows insulated. The decision to install a stove actually justified a major restoration that would be carried out in 1902–03. After the restoration a loan had to be taken in order to pay for the stove and for putting in new floors (Lagerlöf and Stolt 1996:41f).
In August 1922 the recently reorganized Board of Antiquities deemed that the church was in immediate need of restoration. The painting and the plaster on the inside of the walls were heavily damaged. Plaster fell to the ground upon touch. Professor H. Kreüger reporting on the damages was of the conviction that damages had arisen from condensation caused by poor ventilation, rather than by the walls and floor sucking moisture from the ground. The northern and the southern walls had been clad in wooden panels that were now rotting and further damaging the plaster immediately behind the panels. Kreüger suggested improved ventilation and banned the use of wooden panels placed directly on the walls.13 What made these damages even more alarming was that the wall
6 ViLa, Levide kyrkoarkiv, vol. KI:1, Parish meeting protocol March 8, 1818, p. 103.7 ViLa, Levide kyrkoarkiv, vol. LIc:1, “Utgiftsförslag och inkomstförslag för Levide kyrka till år 1865” (2 Kronor).8 ViLa, Levide kyrkoarkiv, vol. LIc:1, “Förslag till inkomst och utgiftsstat för Levide kyrka för år 1874 …”.9 ViLa, Levide kyrkoarkiv, vol. LIc:1, “Förslag till inkomster och utgifter för Levide kyrka för år 1886”.10 ViLa, Levide kyrkoarkiv, vol KI:1, Parish meeting protocol August 30, 1829, pp. 166–167.11 ViLa, Levide kyrkoarkiv, vol. LIc:2, p. 245 (April 23, 1897, 47 Kronor 20 Öre for drawings made by
N. Pettersson); ViLa, ritningssamlingen, A25 nr 163.12 ViLa, Levide kyrkoarkiv, vol. LIc:2, p. 248 (February 28, 1903, purchase of a stove for 260 Kronor).13 RAÄ, ATA, Levide kyrka, letter from H. Kreüger August 8, 1922 (copy).

Gotland University Press 15
250
paintings had been heavily restored less than two decades earlier. The Board of Antiquities urged the parish to immediately take action in order to avoid further damage.14
What happened? Three years later the walls had been repaired, but mould was evidently still growing on the northern wall, despite attempts to increase venti-lation. Airing through opening the doors in summer time was practiced around this time. An investigation into the causes of the mould lead to the conclusion that condensing water was running from the single pane windows down on the wall. The architect suggested improved insulation of the windows, and if that did not work, the installation of a steam pipe running along the walls. The heat from the pipe would dry the walls and also keep the church warm, thereby lessening the risk of condensation.15 In this case, central heating was suggested for the conservation of the church and its interiors.
In the winter of 1926, the reverend replied that his parish thought that a second pane of glass in the windows would diminish the light in the church conside-rably, and was for aesthetic reasons not willing to make this change. Instead, the reverend would install a new stove since the old one was not doing much good. He hoped that a new stove would increase heat in the church (at least during mass), but also that airing in summer time would make condensation a lesser problem.16 The Board of Antiquities considered that this could be an appropriate measure. None the less, the problem with humidity in the lower parts of the northern and southern walls persisted throughout the decades.
In 1953 architect N.A. Rosén came to quite a somewhat different conclusion than the one drawn in the early 1920s. He meant that the problem arose not just from condensation but also from the walls sucking water from below. In 1922 suction had been considered but counted out as a cause because of the alleged natural drainage of the ground. An earthen mound located just outside one of the damaged walls seemed to make water from rain and snow move towards the wall. In 1922 there was also a window that made condensed water run on the outside base of the wall. In the early 1950s the church was still heated with a stove, making the architect suggest the option of electrical heating by way of installing radiators on the walls and beneath the benches. This also meant that the church would be electrified for the first time. There had been some drainage dug along the southern wall, argued the architect, and by also providing constant heating in winter time the walls would dry out.17 The church continued to be heated intermittently even after the installation of heaters.
When the architect G. Jonsson inspected the church twenty years later (1973), several kinds of humidity problems were detected. In spring time water rose up into parts of the floor. The plaster was damp all over the lower parts of the walls with the wooden panels of the benches placed right at the walls without any air gap. Furthermore, rain water leaked through the doors and condensed water ran
14 RAÄ, ATA, Levide kyrka, letter to the parish from C. Möller August 16, 1922 (copy).15 RAÄ, ATA, Levide kyrka, A Roland’s pro memoria December 2, 1925.16 RAÄ, ATA, Levide kyrka, letter from the reverend February 23, 1926.17 RAÄ, ATA, Levide kyrka, N.A. Rosén’s suggestion for restoration December 14, 1953.

Gotland University Press 15
251
from the windows down on the inside of the walls.18 At this point in time the walls had become quite damaged by dampness, and there was also blackening of the walls above the radiators. The chimney, not in use anymore, was discoloring the wall inside the building and it was suggested that it should be taken down.
The case study suggests that the indoor environment has been damp for a long time, regardless of whether the church has been heated or not. The earliest recorded sign of a problem with rotting wood is from 1827 when the floor was replaced. The floor and lower parts of the walls were reported to be wet in 1922, 1953 and 1973, when the church was inspected by architects. In 2008 when the altarpiece was conserved, the conservator noted that it was damaged by a fluctuating climate causing cracks and flaking, and also by mould.19 Instead, the electrical heaters have mostly been used for the purpose of providing thermal comfort during service.
Strängnäs Cathedral
Strängnäs is a cathedral of gothic origin and a burial church for some of the members of the royal Vasa family. Being a building of national interest, the question of comfort for the churchgoers has only been a part of a larger discus sion about the condition of the building. The aesthetical appearance of this historically interesting monument has been essential. During the second half of the 19th century many of the Swedish cathedrals were restored. These projects were surveyed by the Board of Public Works and Buildings for two reasons. The churches were public buildings, but the restorations were also in part financed by governmental grants.
The church had been severely damaged in a fire in 1723. The roof was immediately repaired and gradually improvements were made to other features of the church. White washing was done several times during the 18th and 19th centuries. A new layer of plaster was added as late as 1878. The windows were damaged by fire in 1723 and they were repaired by the end of the century (Bohr 1968:396ff).
A first proposal for an exhaustive restoration of the outside features of Strängnäs cathedral was made by the architect Helgo Zettervall in 1875. The plans were issued to the government in demand for a national grant but were put on hold and were not approved until 1888. By then Zettervall had been appointed head of the Board of Public Works and Buildings. As the first plans were made up the matter of the climate of the church was discussed. In 1876 six Gurney stoves were installed to heat the church. The stoves were placed in order to minimize their visibility.20 Iron funnels led the smoke from each stove up through the vaults. In the attic the iron funnels were led into three brick funnels which ended in low chimneys placed on the rooftop of the cathedral. Remains of these funnels are still preserved in the attic.
18 Gotlands museum, Levide kyrka, G. Jonsson’s report January 10, 1973.19 Gotlands museum, Levide kyrka, conservation report by Nadine Huth, December 5, 2008.20 RA, ÖIÄ, FIIaab:15, Letter from the diocese to the Board of Public Works and Buildings July 26, 1876.

Gotland University Press 15
252
Fredrik Lilljekvist took over the charge of restoration from the early 1890s. At that time the methods of restorations were under debate in Sweden as well as in Europe at large. He based his proposal on the plan of Zettervall, but the focus was turned to the inside of the cathedral and on the restoration of the murals. In the first financial estimation from the turn of the century the costs of a hot
Fig. 2. Six Gurney stoves were installed in the cathedral in 1876. In order to make them less visible they were hidden behind the thick brick pillars. Source: A Thunquist 1906, ATA.

Gotland University Press 15
253
air heating system was mentioned.21 Two suggestions for central heating were submitted by two experts on heating devices, Wilhelm Dahlgren offering a hot air solution with warm chambers. Hugo Theorell suggesting an automatically regulated low pressure steam system. The steam would deliver its heat through radiators where the steam would condensate and the water return to the boilers in a closed system. The overall architectonic values would not be disturbed as the size and the placement of the elements was adjustable.22 Both the diocese and the Board of Public Works and Buildings preferred the plans developed by Theorell.23
Addressing the restoration committee, the architect initiated a discussion concerning how the demands for a modern use of the church, and the call for a heating system would risk the patina and the historic and architectural values of the church. Lilljekvist feared that it would be impossible to install the piping needed for the steam system under the floor and the radiators in the church without damaging archaeological and aesthetical values. He was concerned that only the cost of the installation seemed to have guided the decision on which system that was to be installed.24 On the other hand, Theorell had stated that it would be impossible to install a hot air system, as the heating chambers would be space consuming. Furthermore, it would be hard to achieve sufficient and even heating in the central parts of the large church. As a result of the debate it was decided to further investigate what method would be the most suitable.25
Three alternative plans for the heating system and an evaluation of the costs and the consequences for the building were presented to the committee at a following meeting. The first was an altered version of Theorell’s hot steam system, the second an altered version of Dahlgren’s hot air system and the third a hot water system, also planned by Dahlgren. Dahlgren’s hot air system was now judged impossible as it required the demolition of vaults of the silver chamber. The hot water system was the more affordable of the two remaining plans and also judged by the Board of Antiquities as the one that was favourable from an archaeological point of view. Lilljekvist suggested that the two remaining plans should be sent to the Board of Public Works and Buildings with a demand that the Board should reconsider whether the decision on Theorell’s system should be withheld.26 But as Theorell changed his plan for a hot air system so that the pluming mainly where placed in the attic to minimize the impact on archaeolo-gical values, the hot air solution was accepted by all parts.27
The heating system was ready to use in 1910. Three boilers and storage room for coke were fitted into the basements of the vestry. The radiators in the church
21 RA, ÖIÄ, FIIab:1, Fr. Lilljekvist, Estimation of costs, October 1900.22 RA, ÖIÄ, FIIab:1, Description of heating system by H. Theorell, undated and Description of heating system by
H. Theorell, January 22, 1902.23 RA, ÖIÄ, FIIaab:15, Royal letter October 27, 1905, in copy.24 RA, ÖIÄ, FIIab:1, Letter from Fr. Lilljekvist to the diocese, December 1906, in copy.25ULA, A1:3, The restoration committee of Strängnäs Cathedral, protocol December 13, 1906.26 RA, ÖIÄ, FIIab:1, Letter from Fr. Lilljekvist to the restoration committee, December 15, 1907. ULA, A1:3, The
restoration committee, protocol, December 23, 1907.27 RA, ÖIÄ, FIIab:1, Letter from Fr. Lilljekvist to The Board of Public Works and Building, May 5, 1908. Fr. Lillje
kvist, Plan for the restoration of Strängnäs Cathedral, June 6, 1908.

Gotland University Press 15
254
were covered with a simple but decorative metal surface for aesthetic reasons.28 A brick wall had been built behind the main altar piece in order to protect the sensitive wooden object from radiating heat from a large element behind it.29 The wall was integrated in the overall decorative solution for the new altar arrange ment. No larger remarks were made by the control committee of the installations, but the elements were considered to have been placed too close to the walls. The committee warned that this might lead to black stains of the walls above the radiators.30
The first records of damages of wooden objects related to the changed climate in the church appear already in 1915 when the main altar piece was reported to be in need of repair. In 1918 several of the medieval altarpieces were in need of conservation. To supervise the climate hygrometers were installed and suction filters were placed on the elements in the chancel.31 The high altar was restored in 1924 (Bohr 1968:473). In 1932 the National Heritage Board approached the Board of Public Building and Planning, having observed that some of the valuable objects in the church were placed just above or close to radiators and now were in need of conservation.32 The high altar was in need of restoration once more in 1937 (Bohr 1968:475).
The price of coke was rapidly increasing during the early decades of the 20th century. Subsequently the costs for heating the church soon proved to be a burden for the congregation, who complained that they had not had the possibility to influence the choice of heating system. The breakout of the Second World War led to a shortage of coke. The boilers were of an old fashioned construction and the funnels were not suitable for wood as fuel. The congregation was forced to continue with coke as fuel.33
By the later part of the 1940s the old heating system was judged to be irreparable. It was hard to keep the temperature above the desired minimum of 5 degrees during the cold season, especially on windy days. The window panes were single, and the window frames were leaking.34 The question of arranging double glazing had been under debate already when the central heating was installed.35 Wilhelm Dahlgren had pointed out that the double windows would be advantageous for the comfort of the congregation as they would limit the draft. They would also lessen the variation of temperature which would be preferable for the organ and become beneficial for the overall climate. But the economical effects were hard to calculate as the heating system was to be used intermit-tently.36 However the window frames were caulked a few years later to reduce some of the draft.37
28 ULA, A1:3, The restoration committee, protocol, April 15 and May 26, 1910. ATA, Personal Archive, Fr. Lilljekvist, C. J. Nyqvist & C:o to Fr. Lilljekvist May 17, 1910.
29 ULA, A1:3, The restoration committee, protocol, August 17, 1909.30 RA, ÖIÄ FIIab:1, Protocol from the Control committee of the heating system, January 22, 1910.31 ATA, Kbyrån, S 312, FIaa:2, The Department of Churches and Education to the Diocese January 1, 1919.32 After a reorganization in 1918 the Board of Public Works and Buildings had been renamed the Board of
Public Buildings and Planning.33 ATA, Kbyrån, S 312, FIaa:2, Pro Memoria August 21, 1940.34 ATA, Kbyrån, S 312, FIaa:3, Pro Memoria, February 11, 1946.35 ULA, A1:3, The restoration committee, protocol, Mars 11, 1910.36 ATA, Personal Archive, Fr. Lilljekvist, Letter from W. Dahlgren, Marsh 3, 1910.37 Strängnäs tidning May 4, 1917 and “Domkyrkans uppvärmning” och Strängnäs tidning, August 10, 1917.

Gotland University Press 15
255
The National Board of Building and Planning declared that it was urgent to install a new heating system as valuable objects in the cathedral were at risk to be severely damaged.38 The Board pointed out the importance that all arrangements that required aesthetic considerations should be handled by an experienced architect and the National Heritage Board should be able to consider all works that affected the walls, the substructures, tombs or floors.39 The potential damage to medieval murals by staining and the risk of causing cracks at valuable wooden objects due to unsuitable placement of some of the radiators were also pointed out.40
An investigation of the most suitable heating system, including electric heating and replacing the coke boilers with oil boilers, preceded the decision of the new system. The new heating system, still based on coke boilers, was installed in 1951. It was still not for permanent use.41 The intention was to keep the tempe-rature at an average level of 5–10 ºC. To avoid the inconvenience of drafts from the entrances new hot air aggregates were installed in the wind catchers.42 In addition to the new heating system, double glazing and isolation of the vaults was carried out.43
To hide the new elements in the chancel, benches of stones were designed by Ragnar Hjorth. The same manner of hiding the low elements elsewhere in the church was applied. In other parts of the cathedral the disturbing effect of the elements were modified by shelves and other arrangements such as bent metal sheets. These would also lessen the tendency of black stains above the elements. In the chancel of S:t Annae framed wooden lattices were placed in front of the new elements.44 During the archaeological investigations, following the installation works, an ancient brick floor was found in the vestry, beneath the existing wooden floor. The brick surface was restored. This decision made it necessary to alter the placement of the elements and thus the entire installation for aesthetical reasons.45 A few years later the question of an oil boiler was raised once more. This would allow for constant and even heating, but also temperature regulation through thermostats. The oil boiler was installed in 1954.46
It soon became obvious that the improved heating system had damaging effects on wooden objects in the church. A medieval sculpture and some other objects
38 ATA, Kbyrån, S 312, FIaa:3, Pro Memoria, February 5, 1949 and the Board of Public Buildings and Planning, Letter addressed to the King, March 3, 1949.
39 ATA, Kbyrån, S 312, FIaa, the diocese, letter addressed to the King, December 8, 1948.40 ATA, Kbyrån, S 312, FIaa:3, the National Heritage Board to the Board of Public Building and Planning, Fe
bruary 25, 1946 and July 7, 1947.41 ATA, Kbyrån, S 312, FIaa:3, the Board of Public Building and Planning, Pro Memoria, April 3, 1948.42 ATA, KByrån, S312, FIaa:3, R. Hjorth, Pro Memoria, August 24, 19510824, R. Hjorth to the Board of Public
Building and Planning, November 15, 1951, and the Board of Public Building and Planning to the diocese November 20, 1951.
43 ATA, Kbyrån, S 312, FIaa:3, Royal letter to the County Administrative Board, May 24, 1949 and letter from R. Hjorth to S Lüders, February 16, 1950.
44 ATA, Kbyrån, S 312, FIaa:3, the diocese to the Board of Public Building and Planning, August 2, 1952, R. Hjorth July 24, 1952, Description of stone benches for Strängnäs Cathedral and R. Hjorth, July 24, 1952 Description of the new designs for S:t Annae chancel and Pro Memoria, August 24, 1951.
45 ATA, Kbyrån, S 312, FIaa:3, The National Heritage Board to the Diocese September 9, 1951.46 ATAKbyrån, S 312, FIaa:3. The congregation congress, protocol October 10, 1954, KBS, Pro Memoria,
November 12, 1954.

Gotland University Press 15
256
had to be restored in 1957.47 A year later desiccation-cracks were noted in the substructure of the organ and on several altar pieces. The damages were linked to the variations of humidity during the winter as the heat was raised from the base level several times each week. To improve the dry climate an air humidifier system was installed in 1959. One device was placed inside the organ. The suggested device in the chancel was replaced by suction filters placed on the elements as a mechanic humidifier was considered to risk causing uneven air humidity due to the variation of air streams in the church.48 In the 1980s and 1990s major restoration was carried out involving murals as well as the altar pieces. The stains on the murals were said to be caused by the air streams form the heating while the damages to the wooden objects was linked to the dry climate in the church.49
Today the heating system basically remains the same. The oil boiler is replaced by district heating, but the radiators are still in use. A computerized system for climate surveillance was installed in 2004. The results have not been thoroughly analyzed, but the average temperature in 2005 was 17–19 ºC, while the humidity varied between the different parts of the church and over the year. Presently discussions are held concerning the use of the church, and the debates also includes questions related to the indoor climate. The historic records can be a valuable source in this discussion, adding a historical depth to the resent measurement.
Discussion
The values and views of conservators and restorers have been the dominating sources of research on the building history of churches. Traditionally, archi-tectural historians have not shown much interest in the introduction of modern technology in archaic buildings. Previous research on the restoration history of Swedish churches has mostly utilized the “ATA” archive of the National Heritage Board and the National Archive. The paper has shown that there is a wide range of archival sources available that may shed light on historical views of the indoor climate of older churches. There are important sources to be found in the church archives, such as protocols from parish meetings and church council meetings, church accounts, and bishop’s visitation protocols.
Church archives represent the views of parishioners and clerics. In the case of Levide church, it becomes evident that parishioners for a very long time – up until the 1950s – were skeptical towards heating their church. In 1803 the bishop urged the parish to heat the vestry of the church. This demand was repeated in 1833, when the parishioners also said it would be done, but the stove was never built. The restoration of 1902–03 was carried out because the bishop wished the church to be heated. In order to fund a stove, the church had to take a loan
47 ATA, Kbyrån, S 312, FIaa:3, The department of churches and education to the diocese January 1, 1958.48 ATA, Kbyrån, S312, FIaa:3, RAÄ, Pro Memoria May 31, 1958, Letter from Ventilationsarbeten AB to the
National Board of Building and planning, September 3, 1958, the National Board of Building and Planning to the diocese November 11, 1958.
49 Länsstyrelsen i Södermanland, Ove Hidemark arkitektkontor AB, Maintenance plan, June 1, 2006.

Gotland University Press 15
257
since the parishioners were not interested in raising the means necessary. In the early 1920s, after the Board of Antiquity’s discovery that the interiors of the church were rotting, the Board suggested that the parish insulated the windows and installed steam heat. Again, nothing happened. Not until the restoration of 1956–57 was electrical heat installed for the improvement of the churchgoers’ comfort. Levide is a small parish and all expenses for maintaining the church buildings were felt by the parishioners. During the 19th century there were repeated arguments between the priest and the parish of when, and how, repairs were to be carried out on the buildings. The wooden roof, but also the floor, of the church seems to have been in poor condition for most of the first four decades of the century. In 1837 it was completely replaced (with wood again), and after that the church is reported in visitation protocols to be in good condition for the rest of the century. Heat in a parish church was probably seen by most people as an unnecessary luxury, even as late as in the 1920s. The views of the Board of Antiquities were perhaps shared by the diocese and local priests, but not neces-sarily by the parishioners.
As has been shown, the views of the state authorities shifted first from being skeptical to the aesthetics of heating technology in the 1880s, to being positive to the introduction of conservation heating from the 1920s, and from the 1970s beginning to re-evaluate the needs for and consequences of permanent heating.
In Strängnäs six Gurney stoves were installed in 1876. As a cathedral, the Strängnäs case differs from Levide because the cathedral was viewed by the state as a national monument already in the 19th century. Thus the archival situation is different, as the national authorities were engaged at an early stage also in the debates on climate in the cathedral, while the parish did not have the opportunity to influence the decision on which heating system was to be intro-duced. In 1906 a central heating system based on steam was installed, which shows that the Gurneys stoves were outdated in a cathedral at this time. Central heating was considered cleaner and could offer more evenly spread heat. In Gotland churches stoves would still be common for quite some time. The heating system soon proved to have a negative effect on the painted wooden artifacts, but there was no question of altering the overall climate of the church. In 1956 coke was replaced by oil, and it seems as if the indoor temperature increased at this time, dehydrating and damaging the wooden interiors even more than before.
The two cases studied here raise questions of the long term consequences of heating and how the implementation of heating technology relates to other conservation measures taken in old stone churches. Permanent heating was introduced in the early 20th century without a firm knowledge of what would happen to the building and its objects. The major concern of restorers of the time was not preservation, nor the functionality of heating, but rather how to give piping and radiators a pleasing design. The objective of engineers was to raise the comfort of humans visiting the building. After World War II it became increa-singly evident that permanent heating had damaging effects by the blackening of walls and dehydration of wooden objects, but this insight did not result in any major changes in the ways churches were heated. Thermal comfort by way

Gotland University Press 15
258
of permanent heating had become a norm that was hard to adjust once it had been established by engineers, architects and conservators. Further studies will examine how this change of norms came about, and why it spread so quickly despite the costs for installing, heating and repairing the damages caused by heating.
Conclusions
The paper has shown that archival sources not only can supply data on climate history and the condition of a building, but that these sources also can tell us something interesting about how indoor climate and its management have been viewed by engineers, architects, conservators, priests and churchgoers. We hear the voices of different stakeholders depending on what sources are used. Church archives are more likely to support the views of the parish and the diocese, whereas the Board of Antiquities and later the National Heritage Board represent the view of architectural historians and conservators. Building engineers and architects are represented by The Board of Public Works and Buildings, in 1918 followed by the National Board of Building and Planning.
Both in Levide and in Strängnäs, heat was introduced and used to achieve a higher level of thermal comfort for people staying in the church. Heat was not introduced for, nor adapted to, conservation purposes. The positions of radiators and piping were determined on aesthetic grounds and not on functional ones. Issues under debate today – such as mould growth, air pollution, dehydration of wood, the flaking of paint layers – were recognized already a century ago, but in the two case studies presented here damages caused by indoor climate were not allowed to affect the choice of heating solutions.
References
Antell, O. & Karlström, J., (eds.). 1998. Att sluta värma en kyrka. Stockholm: Riksantikvarieämbetet.
Bohr, E. 1968. Sveriges kyrkor, Södermanland, Strängnäs domkyrka, I:2. Stockholm: Riksantikvarieämbetet.
Broström, T. 1996. Uppvärmning i kyrkor. Fukt- och värmetekniska beräkningar för dimensionering och klimatstyrning. Doctoral dissertation. Stockholm: KTH.
Edman, V. 1999. En svensk restaureringstradition. Tre arkitekter gestaltar 1900-talets historiesyn. Stockholm: Byggförlaget.
Elmén Berg, A. 1997. Fem ödekyrkor i Norrland. Kyrklig förnyelse, kulturminnesvård och kyrkorestaureringar vid 1900-talets början. Umeå: Umeå University.
Fernlund, S. 1982. “Ett Herranom värdigt Tempel”. Kyrkorivningar och kyrkobyggen i Skåne 1812–1912. Doctoral dissertation. Lund.
Geijer, M. 2004. Ett nationellt kulturarv. Utveckling av en professionell vård och förvaltning av statliga byggnadminnen. Stockholm: KTH.

Gotland University Press 15
259
Geijer, M. 2007. Makten över monumenten – restaurering av vasaslott 1850–2000. Doctoral dissertation. Stockholm: Nordiska Museet.
Gustafsson, L. 2010. Medeltidskyrkan i Uppland : restaurering och rumslig förnyelse under 1900-talet. Doctoral dissertation. Stockholm: KTH.
Holmström, I. 1967a. Tekniska restaureringsproblem. In: Restaurering av gamla byggnader ur främst teknisk och antikvarisk synvinkel, Stockholm 1967.
Holmström, I. 1967b. Skador vid uppvärmning av gamla stenkyrkor. In: Restaurering av gamla byggnader ur främst teknisk och antikvarisk synvinkel, Stockholm 1967.
Lagerlöf, E. & Stolt, B. 1996. Sveriges kyrkor. Gotland: Levide kyrka. Stockholm: Riksantikvarieämbetet.
Legnér, M. 2010. För människans väl, eller föremålens? Komfort, bevarande och innemiljö i 1920- och 30-talens museer. In: De Ridder, A. & Sandström, Å. (eds.), Gotlandsakademiker tycker om… 2010. Visby: Gotland University Press, pp. 45–58.
Legnér, M. 2010b. Perceptions of the built environment in Stockholm, c. 1750–1800. In: Legnér, M. & Lilja, S. (eds.), Living cities – an anthology in urban environmental history. Stockholm: Formas, pp. 258–279.
Legnér, M. 2011. On the early history of museum environment control: Nationalmuseum and Gripsholm Castle in Sweden, 1866–1932. Studies in conservation (forthcoming).
Lindblad, J. 2009. 470 nya kyrkor. Bidrag till Sveriges arkitektur-historia 1850–1890. Doctoral dissertation. Stockholm: Riksantikvarieämbetet.
Mellander, C. 2008. Arkitektoniska visioner under statligt förmynderskap. En studie av Överintendentsämbetets verksamhet och organsiation 1818–1917. Doctoral dissertaion, Stockholm: Nordiska museet.
Schönbäck, H. 2008. De svenska städernas begravningsplatser 1770–1830. Arkitektur, sanitet och det sociala rummet. Doctoral dissertation. Stockholm: Stockholmia Förlag.
Sundberg, H.G.F. 1948. Kyrkorätt. Helsingfors.Wetterberg, O. 1992. Monument och miljö – perspektiv på det tidiga
1900-talets byggnadsvård i Sverige. Doctoral dissertation. Göteborg: Göteborg University.
Zettervall, H. 1887. Allmänna anvisningar rörande kyrkobyggnader. Stockholm 1887.

Gotland University Press 15
260
Installations for Heating with Firewood before the Second World War in the Northern Baltic Sea Region
Joakim HanssonAssociate Professor, Gotland University, SwedenCorresponding email: [email protected]
Summary
This paper is just a small part of a publication about installations in buildings before the Second World War that will be published in 2012.
Since ancient times, fire has been the most important source not only for heating but also for lighting and cooking. Hearths without chimneys were common even in towns as late as in the 17th century. Chimneys of different forms were invented in the medieval houses but were spread more commonly to the countryside in the 17th century.
The first pottery stoves were invented already in the medieval time. To get more energy out of the firewood, innovations concerning inner flues in stoves and also the shape of the exterior developed in parity with the fashion of styles during the 17th and 18th centuries. The best known invention is the so called Swedish tiled stove by C.J. Cronstedt and Fabian Wrede. The origin of this invention is unclear, there are clues leading to Germany and Russia. The tiled stove with vertical flues dominated with small differences the northern part of the Baltic Sea region. Central heating systems finally dominated the market after the First World War and tiled stoves lost their popularity.
In Norway, Denmark and south of Sweden there was also a tradition of cast iron fireplaces, a tradition that appeared in the late 16th century. There were many forms of these stoves during the time, but in the middle of the 19th century the popularity of the cast iron kitchen ranges and iron stoves became very common even among workers and peasants. This was a revolution for better food for people in all levels of society.
The use of central heating systems and installation of gas and electricity finally led to a decrease in wood heating systems during the inter war period. Today, wood heating installations are again popular.
Keywords
Porcelain tile stove, heating, open fireplace, cast iron stove, cast iron kitchen ranges.

Gotland University Press 15
261
Introduction
To make fire for heating, for preparing food and for light has always been important. Heating of the dwelling was one of the most important conditions for settling down around the Baltic Sea. The heating with firewood was the most important heating source untill the Second World Wa.
There are different types of stoves during the time as hearths, open fireplaces, tile stoves including porcelain tile stoves and cast iron stoves and ranges.
In this article I will shortly refer to the history of different historical heating systems. The main point will concern the development of the construction of the porcelain tile stove. The so called Swedish porcelain tile stove was invented 1767 by the architect count Carl Johan Cronstedt and baron Fabian Wrede.
The prototype for the Swedish porcelain stove is usually said to have been taken from Germany, but there are circumstances that would point to Russia.
The history of the tiled stove
Since the Stone Age about 8000 BC ceramics were invented around the Baltic Sea. Burning the clay people must have reflected over the fact that ceramics store warmth. In some locations, for example in Karelia, there is soapstone that also has this quality. Soapstone has been used in stoves for a long time and still is.
The first ceramic stoves in the late medieval time, so called pottery stoves, were made of pots put together with the openings outside. The clay mortar protected the pots from the fire. The stoves were quite effective but broke easily by the heat from the fire. The pots became in the late 15th century quadratic or rectangular, mostly glazed in green or black. The icing gave the ceramics strength and added aesthetic qualities. The warm smoke went through a straight flue out to the chimney.
From about 1500 we have more stoves with ceramic plates with complicated relief structures. These stoves developed to so called terrace stoves used during the 16th, 17th and early 18th centuries. The plates were locally made but the greatest producers were in Germany. The stoves had a frame of bricks that protected the ceramic tiles from the fire. The ceramic tiles were glazed and often richly decorated, the models were imported from the German area. Also in these stoves the warm smoke was lead trough the flue straight into the chimney. To heat these stoves a lot of firewood was needed. The heat that was produced by these stoves was mostly radiant heat, however a part of the heat was stored in the ceramic tiles. Already in late medieval time there were also some experi-ments and innovations made.
The dampers were invented and are firstly mentioned in Sweden in the 15th century. During the 18th century the damper was in common use but there were still stoves without. Different systems for use of dampers were invented. The main point was to keep the stove warm as long as possible. By closing and regulating the openings of the flues by the dampers this could be realized.

Gotland University Press 15
262
In Germany several detailed publications were published around 1700. Johann Jacob Schübern publishes one of these, printed 1728 in Nürnberg. He mentions in this pamphlet the Swedish scientist Urban Hjärne´s print 1696 about saving firewood.
The new idea in these publications was to have horizontal flues to lead out the smoke in a zigzag pattern to benefit more from the warm smoke. The stoves were quite effective but there were also problems with the terrace shaped flues that broke, and to sweep the stoves was difficult. In modified form these principles were in use in Germany to the 20th century.
In the mid 18th century the government of Sweden became aware of the big amount of firewood that was consumed not only in the cities but especially by the iron mills. In 1767 architect, cont Carl Johan Cronstedt and general, baron Fabian Wrede were appointed by the government to make a study how to save firewood. The same year they published their results and innovation. The main point was to let the warm smoke pass through symmetrical vertical flues several times before it was let out of the chimney. This invention was a success and was used in Sweden and Finland after that.
Where did Cronstedt and Wrede get the idea? It is usually said that Cronstedt picked up the idea during a study tour to Dresden in Germany. However, German porcelain stoves usually had horizontal flues, so this seems uncertain. Both Cronstedt and Wrede had interests in Finland that during this time was a part of Sweden. Especially Wrede, who came from a family in the eastern Finland and had a diplomatic career, had connections in St Petersburg. During the middle 18th century St Petersburg was a very dynamic and coming international city where a lot of new knowledge was invented. The fact is that the Russian porcelain stoves have about a similar construction as the Swedish, but these were during the 18th century much bigger than the Scandinavian stoves. In these wide stoves it seems impossible to only use horizontal flues. In Finland the porcelain stoves, during the 19th century when Finland was a Grand Dutchy under Russia, developed to a mixed form between the Swedish and Russian constructions.
During the mid 19th century the industrialization of porcelain stove production grew rapidly. The Swedish and Finnish factories often used German models. This was partly a way to get modern designs, but also a lack of proper designers during the 1860s and 1870s. However, the factory Rörstrand in Sweden founded a new factory in Helsinki 1874 to get in to the Russian market. The kaolin pit in Kunda in Estonia just opposite Helsinki at the Finnish Gulf was also of great importance for the company. But the fact is that the Finnish factory Åbo kakelfabrik in Turku (Åbo), founded 1874, became the biggest porcelain stove company of the Baltic Sea. It was represented in all bigger towns in Finland, St Petersburg, Moscow, Tallinn and Riga, and articles were delivered to all countries around the Baltic Sea.
The fact is that in some cases the same models were used all round the Baltic Sea. There was no discussion about the copyright to the aesthetic design of the porcelain tile stoves before the early years of the 20th century. Several patents were registered in all countries from the mid 19th century on for innovations
Gotland University Press 15
263
concerning the inner construction of the stoves. Very few of them were taken in larger use.
The success of the porcelain stove ended when central heating by coal was commonly installed in block of flats in the cities during the decades after the First World War. Many stoves were torn down, but in many cases we can still find them in old houses. When central heating was installed the space consuming firewood storage ended. Today the popularity of the porcelain stove has grown and new more energy effective models have been introduced.
The porcelain tile stoves were very effective and had a great efficiency on saving firewood. The heat was stored for a long time. With a well heated stove the room could keep warm to the next morning. The stoves were also an important part of the ventilation of the dwellings.
The porcelain tile stoves were during the medieval time only used in the big cities. In the small cities and in the countryside there were hearths used. The oldest type of these hearths was a fundament built of stones without a chimney built in the middle of the room. The smoke passed true a hole in the ceiling. This kind of hearths was still very common even in the cities during the 17th century in the whole of Sweden. From an economic point of view it was not effective at all. It gave only radiant heating.
The open fireplaces
The hearth became not only an open fireplace, it developed in many places to complicated combination constructions with baker´s ovens, cooking graves, etc. However, in peripheral areas the most primitive hearths still existed around 1900.
The hearth developed, however. Firstly it got a chimney and was moved to a corner of the room. Then the baker´s oven was invented. The hearths grew bigger and different types developed locally. The biggest and most complicated hearths were built in manors, where also the first open fire places were installed, a tradition that came from Central Europe.
The hearths were not very effective to store the heat, but the walls of the fireplace held some of it. Most of the heat disappeared out of the chimney, but the hearth was important not only for the heating but also for the light and for food preparation.
The open fireplaces came to the manors in Denmark and Sweden as an innovation already in the medieval time from Central Europe. In the royal castles, these fireplaces were erected already in the 15th and 16th centuries. In the manor Glimmingehus from about 1500 in Scania (Skåne) there are several open fireplaces but there was also a flue system for warm air heating. This is a kind of hypocaust system that was usual in the medieval cities as Stockholm and Visby but also in Tallinn (Reval) where several of them still today are well preserved.
The open fireplace was actually a sort of hearth, where also food was prepared in many cases. In royal castles and rich manors the fireplaces developed into

Gotland University Press 15
264
richly decorated pieces during the 16th and 17th centuries. These gave mostly radiant heating and were very ineffective to heat the rooms. In Skokloster castle, decorated covers of wood around the stoves isolated the heating from coming into the rooms. In this case the heating was completed by porcelain shelf stoves already under the construction period.
The open fireplaces became again popular during the end of the 19th century when there were buildings erected with central heating. a part of the main heating system, the fireplaces now had a more aesthetic value than as source for heating.
Cast iron fireplaces and ranges
Cast iron fireplaces were used in Denmark, south of Sweden and Norway already in the 16th century. These fireplaces were extremely expensive, but became cheaper and more common in the same areas during the 17th century. The cast iron fireplaces were easily and fast warmed, but cooled quite soon after the fire had gone out. By keeping brick and stone constructions in the fireplaces these could keep warm longer.
In 1742 Benjamin Franklin introduced the first iron range for kitchens. It was developed and in the 1810’s produced in England. In the world fair 1851 in London the cast iron stove for kitchen was presented with several models. In the 1820´s the production of these stoves started up in Sweden and became popular during the 1840´s. The production in Denmark and Norway started about the same time and a little bit later in Finland. The cast iron kitchen stove became largely popular among all levels in society. It reformed cooking and could also be used for baking, warming water, frying etc. From the beginning these stoves were thought to be moveable but they were usually built into the hearth. The comfort and hygienic circumstances became radically better.
In the middle of the 19th century cast iron stoves were industrially produced not only for dwellings but also for institutions and churches. These became popular also in combination with porcelain stoves. In Sweden and Finland economical or spare stoves with kitchen ranges were commonly used in small apartments for workers. The heat storing quality of the porcelain stoves was still very important, but the additions of ranges and cast iron stoves enlarged the use of the stoves.
Conclusions
I can establish the fact that firewood has been and still is an important source for heating. The problem to keep and store the heat has lead to different solutions. The most well known is the porcelain tile stove. The Swedish-Russian-German porcelain stoves were a success and the most used heating solution in the cities until the First World War.
The hearths in combination with cast iron kitchen ranges were a good and effective combination for heating, food preparing and improvement of hygiene. The mentioned heating sources all raised the comfort in the dwellings and institutions. The stoves have always been a part of the ventilation systems in buildings.

Gotland University Press 15
265
The above described fireplaces were the main types for heating dwellings before 1900. Many of the inventions made during historical time can still teach us a great deal. The fact that many of these solutions are still in use shows that historical technical solutions are an interesting part of the research on energy efficiency.
References
Cramér, M. 1991. Den verkliga kakelugnen. Fabrikstillverkade kakel-ugnar i Stockholm 1846–1926. Stockholmsmonografier utgivna av Stockholms stad 88. Borås.
Cronstedt, C.J. [u.å.] 1767. Beskrifning På Ny Inrättning af Kakelugnar Til Veds Besparing (med utökningar å nyo utgifven 1775). Stockholm.
Gudmundsson, G. 2001. Värmen i gamla hus. Byggnadsvård i praktiken II. Stockholm.
Lepistö, V. 1994. Joko Teillä on primuskeitin? Kotitalousteknologian saatavuus ja tarjonta Helsingissä 1800-luvun puolivälistä 1910-luvun lopulle. Historiallisia Tutkimuksia 181. Helsinki.
Kolehmainen, A. & Laine, V.A. 1981. Suomalaiset uunit. Keuruu.Mårtensson, H. 2001. Husets hjärta. Spisar i gamla hus. Kalmar.Nordenberg, J. 1739. Rön om kakelugnar och deras omlagning.
Stockholm.Selling, G. 1967. Den svenska kakelugnens 200-årsjubileum. I: Saga och
sed. Kungl. Gustav Adolfs Akademiens årsbok. Uppsala.Soiri-Snellman, H. 2003. Turun Kaakelin Kakluunit. Turun kaakelitehtaan
uunimallit vuosina 1874–1954. Turun maakuntamuseo. Saarijärvi.Tunander, B. & Tunander, I. 1973. Kakelugnar. Västerås.Tunander, B., Tunander, I. & Tunander, P. 1999. Svenska kakelugnar.
Värnamo.