date – 30.10.2020 - uttar pradesh national health mission
TRANSCRIPT
National Health Mission District Health Society, Pilibhit
Date – 30.10.2020
2
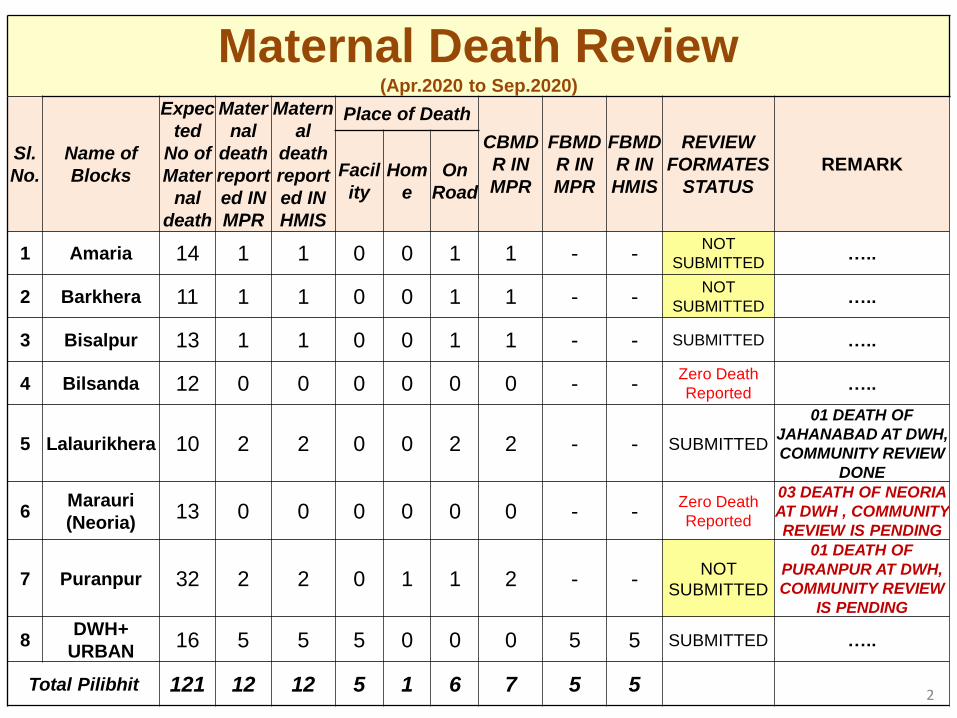
Maternal Death Review (Apr.2020 to Sep.2020)
Sl.
No.
Name of
Blocks
Expec
ted
No of
Mater
nal
death
Mater
nal
death
report
ed IN
MPR
Matern
al
death
report
ed IN
HMIS
Place of Death
CBMD
R IN
MPR
FBMD
R IN
MPR
FBMD
R IN
HMIS
REVIEW
FORMATES
STATUS
REMARK Facil
ity
Hom
e
On
Road
1 Amaria 14 1 1 0 0 1 1 - - NOT
SUBMITTED …..
2 Barkhera 11 1 1 0 0 1 1 - - NOT
SUBMITTED …..
3 Bisalpur 13 1 1 0 0 1 1 - - SUBMITTED …..
4 Bilsanda 12 0 0 0 0 0 0 - - Zero Death
Reported …..
5 Lalaurikhera 10 2 2 0 0 2 2 - - SUBMITTED
01 DEATH OF
JAHANABAD AT DWH,
COMMUNITY REVIEW
DONE
6 Marauri
(Neoria) 13 0 0 0 0 0 0 - -
Zero Death
Reported
03 DEATH OF NEORIA
AT DWH , COMMUNITY
REVIEW IS PENDING
7 Puranpur 32 2 2 0 1 1 2 - - NOT
SUBMITTED
01 DEATH OF
PURANPUR AT DWH,
COMMUNITY REVIEW
IS PENDING
8 DWH+
URBAN 16 5 5 5 0 0 0 5 5 SUBMITTED …..
Total Pilibhit 121 12 12 5 1 6 7 5 5
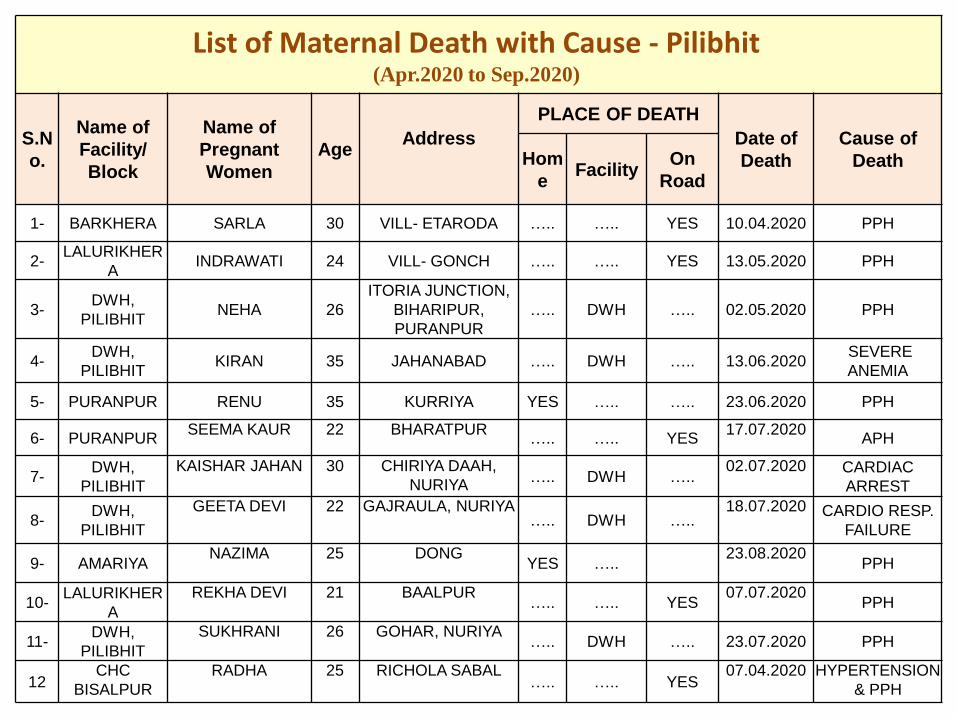
List of Maternal Death with Cause - Pilibhit (Apr.2020 to Sep.2020)
S.N
o.
Name of
Facility/
Block
Name of
Pregnant
Women
Age Address
PLACE OF DEATH
Date of
Death
Cause of
Death Hom
e Facility
On
Road
1- BARKHERA SARLA 30 VILL- ETARODA ….. ….. YES 10.04.2020 PPH
2- LALURIKHER
A INDRAWATI 24 VILL- GONCH ….. ….. YES 13.05.2020 PPH
3- DWH,
PILIBHIT NEHA 26
ITORIA JUNCTION,
BIHARIPUR,
PURANPUR
….. DWH ….. 02.05.2020 PPH
4- DWH,
PILIBHIT KIRAN 35 JAHANABAD ….. DWH ….. 13.06.2020
SEVERE
ANEMIA
5- PURANPUR RENU 35 KURRIYA YES ….. ….. 23.06.2020 PPH
6- PURANPUR SEEMA KAUR 22 BHARATPUR
….. ….. YES 17.07.2020
APH
7- DWH,
PILIBHIT
KAISHAR JAHAN 30 CHIRIYA DAAH,
NURIYA ….. DWH …..
02.07.2020 CARDIAC
ARREST
8- DWH,
PILIBHIT
GEETA DEVI 22 GAJRAULA, NURIYA ….. DWH …..
18.07.2020 CARDIO RESP.
FAILURE
9- AMARIYA NAZIMA 25 DONG
YES ….. 23.08.2020
PPH
10- LALURIKHER
A
REKHA DEVI 21 BAALPUR ….. ….. YES
07.07.2020 PPH
11- DWH,
PILIBHIT
SUKHRANI 26 GOHAR, NURIYA ….. DWH ….. 23.07.2020 PPH
12 CHC
BISALPUR
RADHA 25 RICHOLA SABAL ….. ….. YES
07.04.2020 HYPERTENSION
& PPH
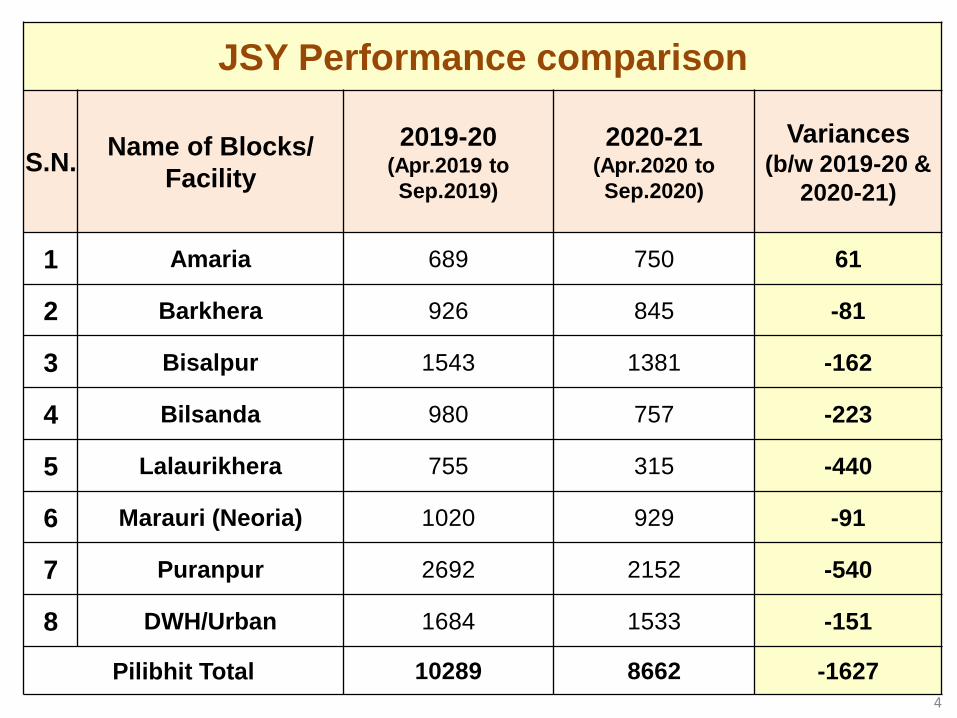
JSY Performance comparison
S.N. Name of Blocks/
Facility
2019-20 (Apr.2019 to
Sep.2019)
2020-21 (Apr.2020 to
Sep.2020)
Variances (b/w 2019-20 &
2020-21)
1 Amaria 689 750 61
2 Barkhera 926 845 -81
3 Bisalpur 1543 1381 -162
4 Bilsanda 980 757 -223
5 Lalaurikhera 755 315 -440
6 Marauri (Neoria) 1020 929 -91
7 Puranpur 2692 2152 -540
8 DWH/Urban 1684 1533 -151
Pilibhit Total 10289 8662 -1627
4
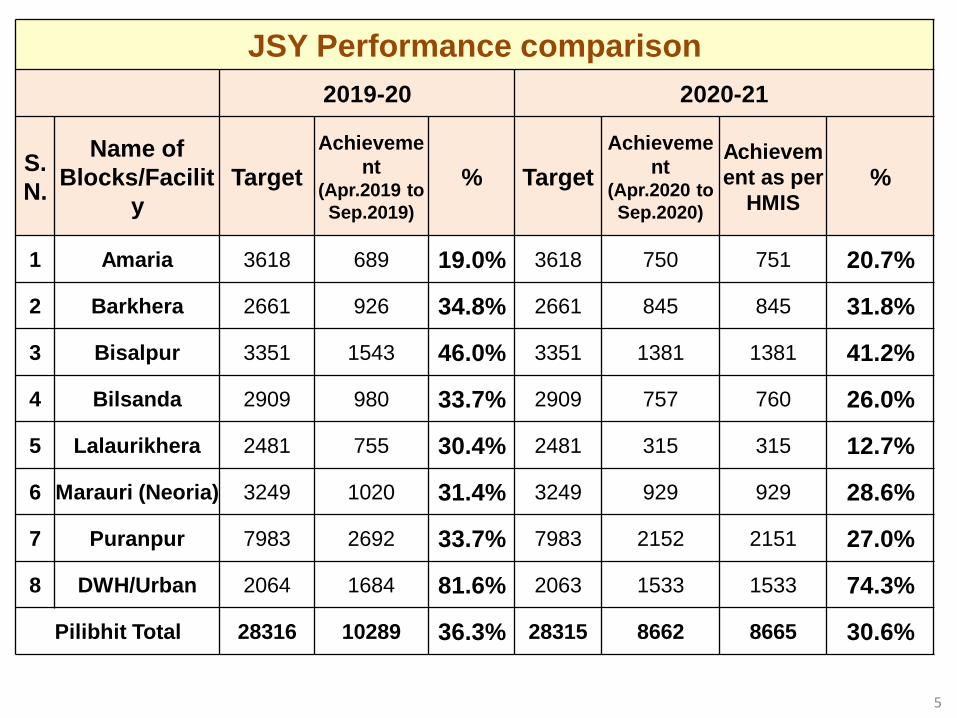
JSY Performance comparison
2019-20 2020-21
S.
N.
Name of
Blocks/Facilit
y
Target
Achieveme
nt (Apr.2019 to
Sep.2019)
% Target
Achieveme
nt (Apr.2020 to
Sep.2020)
Achievem
ent as per
HMIS %
1 Amaria 3618 689 19.0% 3618 750 751 20.7%
2 Barkhera 2661 926 34.8% 2661 845 845 31.8%
3 Bisalpur 3351 1543 46.0% 3351 1381 1381 41.2%
4 Bilsanda 2909 980 33.7% 2909 757 760 26.0%
5 Lalaurikhera 2481 755 30.4% 2481 315 315 12.7%
6 Marauri (Neoria) 3249 1020 31.4% 3249 929 929 28.6%
7 Puranpur 7983 2692 33.7% 7983 2152 2151 27.0%
8 DWH/Urban 2064 1684 81.6% 2063 1533 1533 74.3%
Pilibhit Total 28316 10289 36.3% 28315 8662 8665 30.6%
5
6
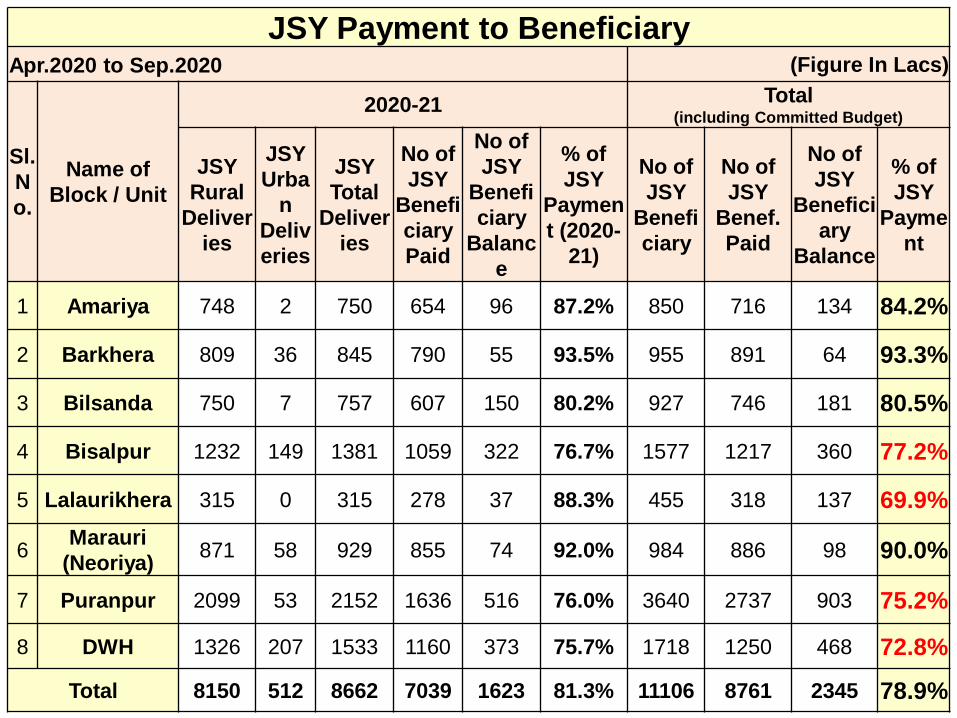
JSY Payment to Beneficiary Apr.2020 to Sep.2020 (Figure In Lacs)
Sl.
N
o.
Name of
Block / Unit
2020-21 Total (including Committed Budget)
JSY
Rural
Deliver
ies
JSY
Urba
n
Deliv
eries
JSY
Total
Deliver
ies
No of
JSY
Benefi
ciary
Paid
No of
JSY
Benefi
ciary
Balanc
e
% of
JSY
Paymen
t (2020-
21)
No of
JSY
Benefi
ciary
No of
JSY
Benef.
Paid
No of
JSY
Benefici
ary
Balance
% of
JSY
Payme
nt
1 Amariya 748 2 750 654 96 87.2% 850 716 134 84.2%
2 Barkhera 809 36 845 790 55 93.5% 955 891 64 93.3%
3 Bilsanda 750 7 757 607 150 80.2% 927 746 181 80.5%
4 Bisalpur 1232 149 1381 1059 322 76.7% 1577 1217 360 77.2%
5 Lalaurikhera 315 0 315 278 37 88.3% 455 318 137 69.9%
6 Marauri
(Neoriya) 871 58 929 855 74 92.0% 984 886 98 90.0%
7 Puranpur 2099 53 2152 1636 516 76.0% 3640 2737 903 75.2%
8 DWH 1326 207 1533 1160 373 75.7% 1718 1250 468 72.8%
Total 8150 512 8662 7039 1623 81.3% 11106 8761 2345 78.9%
7
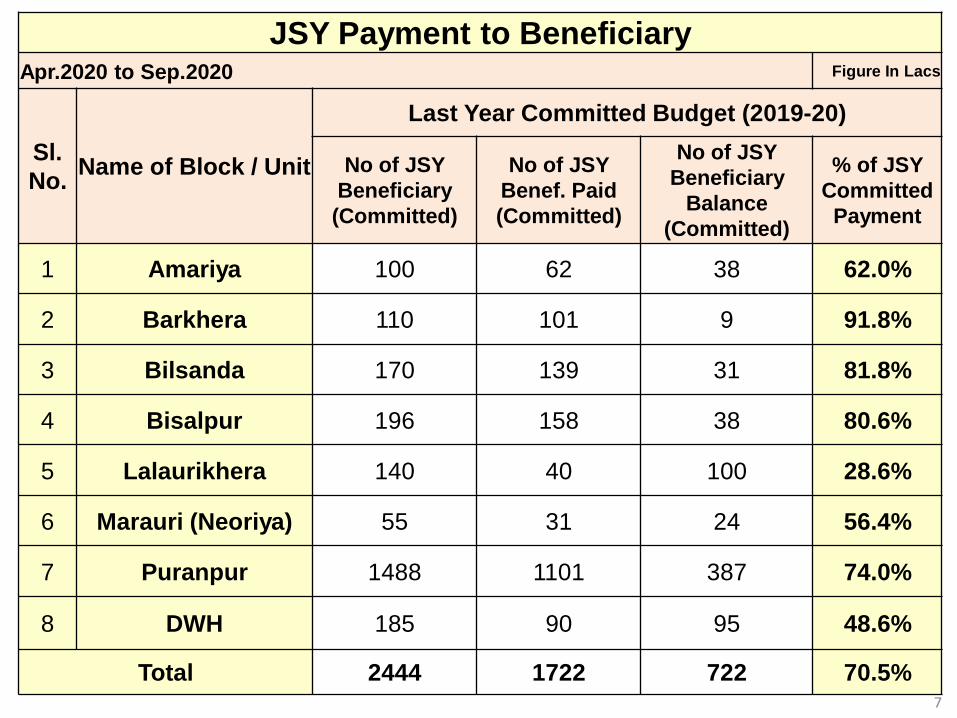
JSY Payment to Beneficiary Apr.2020 to Sep.2020 Figure In Lacs
Sl.
No. Name of Block / Unit
Last Year Committed Budget (2019-20)
No of JSY
Beneficiary
(Committed)
No of JSY
Benef. Paid
(Committed)
No of JSY
Beneficiary
Balance
(Committed)
% of JSY
Committed
Payment
1 Amariya 100 62 38 62.0%
2 Barkhera 110 101 9 91.8%
3 Bilsanda 170 139 31 81.8%
4 Bisalpur 196 158 38 80.6%
5 Lalaurikhera 140 40 100 28.6%
6 Marauri (Neoriya) 55 31 24 56.4%
7 Puranpur 1488 1101 387 74.0%
8 DWH 185 90 95 48.6%
Total 2444 1722 722 70.5%
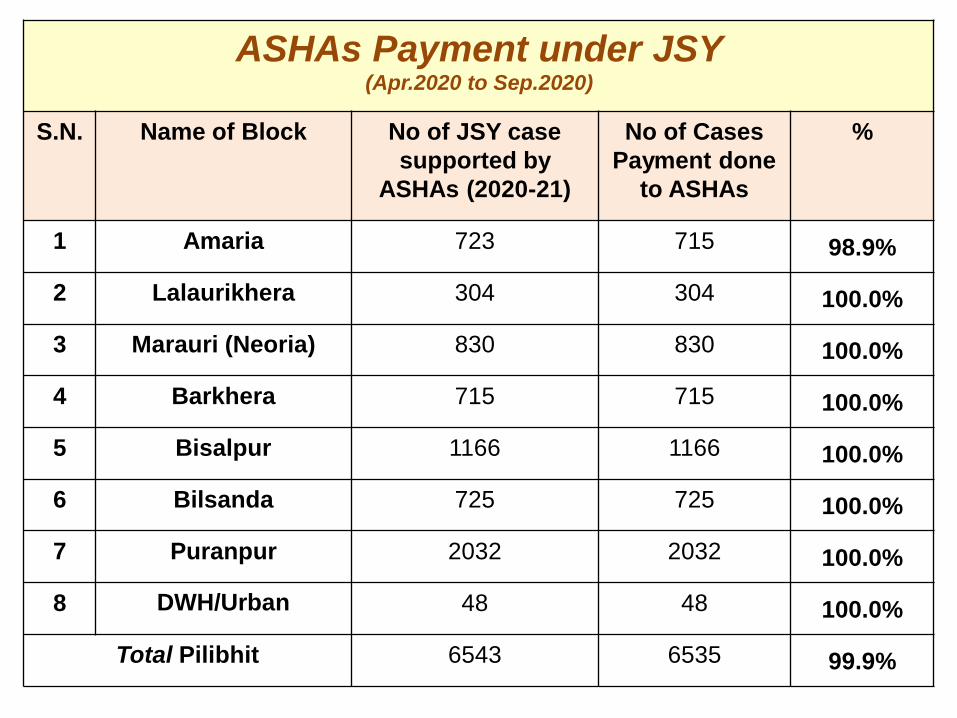
ASHAs Payment under JSY (Apr.2020 to Sep.2020)
S.N. Name of Block No of JSY case
supported by
ASHAs (2020-21)
No of Cases
Payment done
to ASHAs
%
1 Amaria 723 715 98.9%
2 Lalaurikhera 304 304 100.0%
3 Marauri (Neoria) 830 830 100.0%
4 Barkhera 715 715 100.0%
5 Bisalpur 1166 1166 100.0%
6 Bilsanda 725 725 100.0%
7 Puranpur 2032 2032 100.0%
8 DWH/Urban 48 48 100.0%
Total Pilibhit 6543 6535 99.9%
9
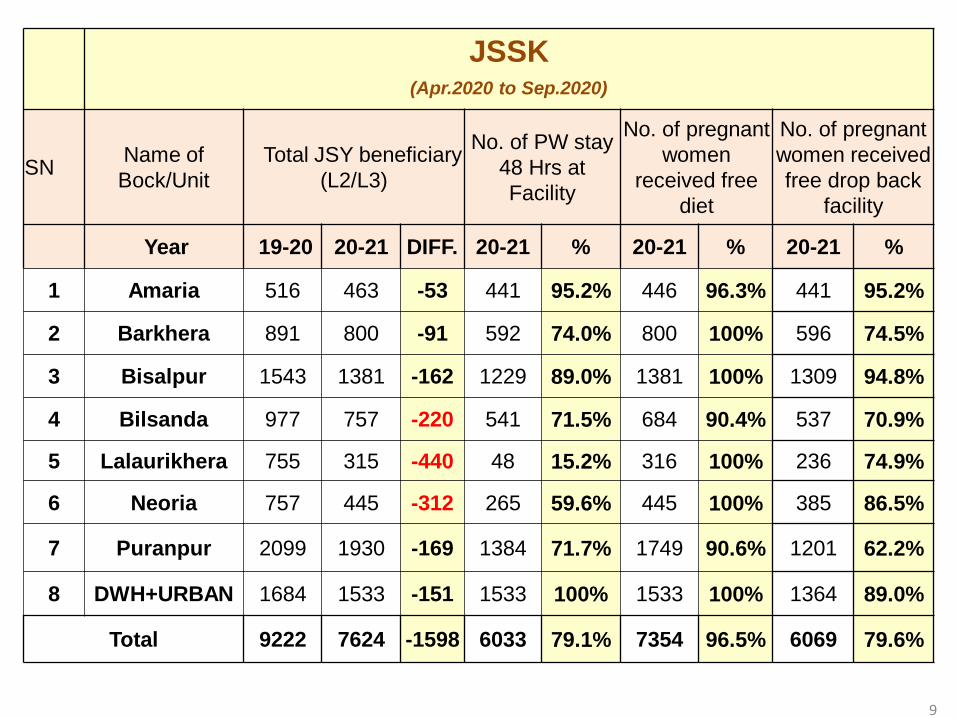
JSSK (Apr.2020 to Sep.2020)
SN Name of
Bock/Unit
Total JSY beneficiary
(L2/L3)
No. of PW stay
48 Hrs at
Facility
No. of pregnant
women
received free
diet
No. of pregnant
women received
free drop back
facility
Year 19-20 20-21 DIFF. 20-21 % 20-21 % 20-21 %
1 Amaria 516 463 -53 441 95.2% 446 96.3% 441 95.2%
2 Barkhera 891 800 -91 592 74.0% 800 100% 596 74.5%
3 Bisalpur 1543 1381 -162 1229 89.0% 1381 100% 1309 94.8%
4 Bilsanda 977 757 -220 541 71.5% 684 90.4% 537 70.9%
5 Lalaurikhera 755 315 -440 48 15.2% 316 100% 236 74.9%
6 Neoria 757 445 -312 265 59.6% 445 100% 385 86.5%
7 Puranpur 2099 1930 -169 1384 71.7% 1749 90.6% 1201 62.2%
8 DWH+URBAN 1684 1533 -151 1533 100% 1533 100% 1364 89.0%
Total 9222 7624 -1598 6033 79.1% 7354 96.5% 6069 79.6%
10
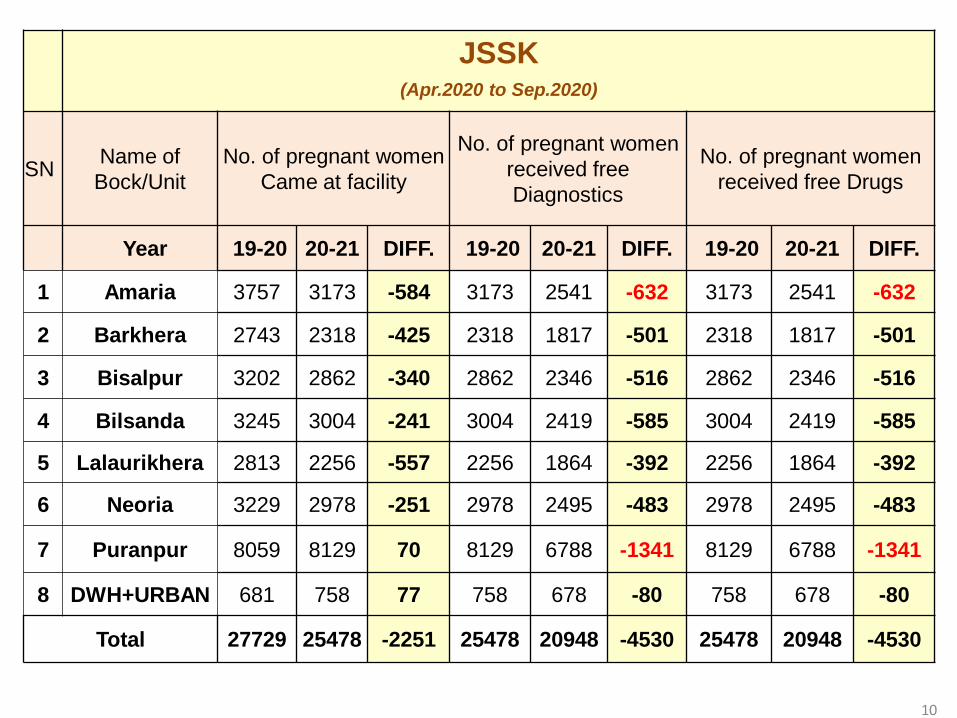
JSSK (Apr.2020 to Sep.2020)
SN Name of
Bock/Unit
No. of pregnant women
Came at facility
No. of pregnant women
received free
Diagnostics
No. of pregnant women
received free Drugs
Year 19-20 20-21 DIFF. 19-20 20-21 DIFF. 19-20 20-21 DIFF.
1 Amaria 3757 3173 -584 3173 2541 -632 3173 2541 -632
2 Barkhera 2743 2318 -425 2318 1817 -501 2318 1817 -501
3 Bisalpur 3202 2862 -340 2862 2346 -516 2862 2346 -516
4 Bilsanda 3245 3004 -241 3004 2419 -585 3004 2419 -585
5 Lalaurikhera 2813 2256 -557 2256 1864 -392 2256 1864 -392
6 Neoria 3229 2978 -251 2978 2495 -483 2978 2495 -483
7 Puranpur 8059 8129 70 8129 6788 -1341 8129 6788 -1341
8 DWH+URBAN 681 758 77 758 678 -80 758 678 -80
Total 27729 25478 -2251 25478 20948 -4530 25478 20948 -4530
11
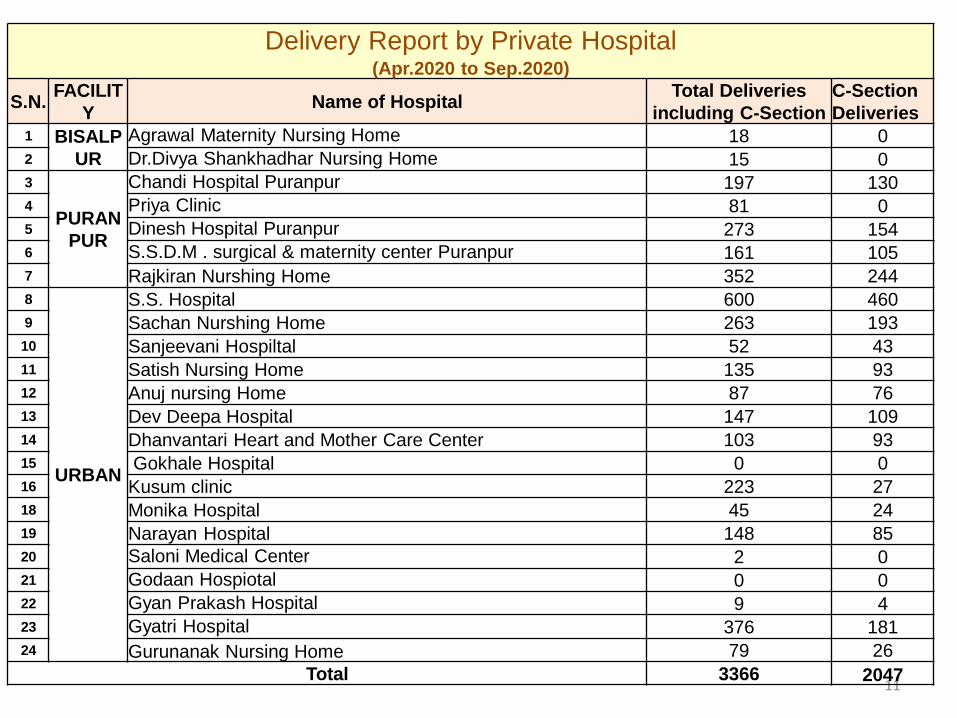
Delivery Report by Private Hospital (Apr.2020 to Sep.2020)
S.N. FACILIT
Y Name of Hospital
Total Deliveries
including C-Section
C-Section
Deliveries 1 BISALP
UR
Agrawal Maternity Nursing Home 18 0 2 Dr.Divya Shankhadhar Nursing Home 15 0 3
PURAN
PUR
Chandi Hospital Puranpur 197 130 4 Priya Clinic 81 0 5 Dinesh Hospital Puranpur 273 154 6 S.S.D.M . surgical & maternity center Puranpur 161 105 7 Rajkiran Nurshing Home 352 244 8
URBAN
S.S. Hospital 600 460 9 Sachan Nurshing Home 263 193
10 Sanjeevani Hospiltal 52 43
11 Satish Nursing Home 135 93
12 Anuj nursing Home 87 76 13 Dev Deepa Hospital 147 109
14 Dhanvantari Heart and Mother Care Center 103 93
15 Gokhale Hospital 0 0
16 Kusum clinic 223 27
18 Monika Hospital 45 24
19 Narayan Hospital 148 85
20 Saloni Medical Center 2 0
21 Godaan Hospiotal 0 0 22 Gyan Prakash Hospital 9 4 23 Gyatri Hospital 376 181 24 Gurunanak Nursing Home 79 26
Total 3366 2047
12
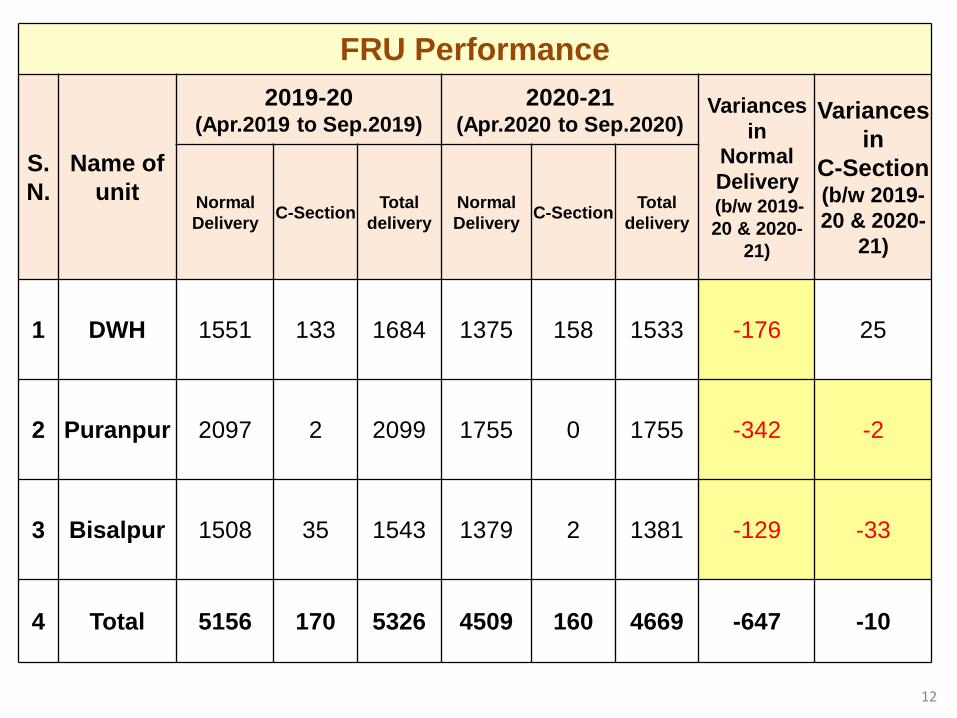
FRU Performance
S.
N.
Name of
unit
2019-20 (Apr.2019 to Sep.2019)
2020-21 (Apr.2020 to Sep.2020)
Variances
in Normal
Delivery (b/w 2019-
20 & 2020-
21)
Variances
in
C-Section (b/w 2019-
20 & 2020-
21)
Normal
Delivery C-Section
Total
delivery
Normal
Delivery C-Section
Total
delivery
1 DWH 1551 133 1684 1375 158 1533 -176 25
2 Puranpur 2097 2 2099 1755 0 1755 -342 -2
3 Bisalpur 1508 35 1543 1379 2 1381 -129 -33
4 Total 5156 170 5326 4509 160 4669 -647 -10
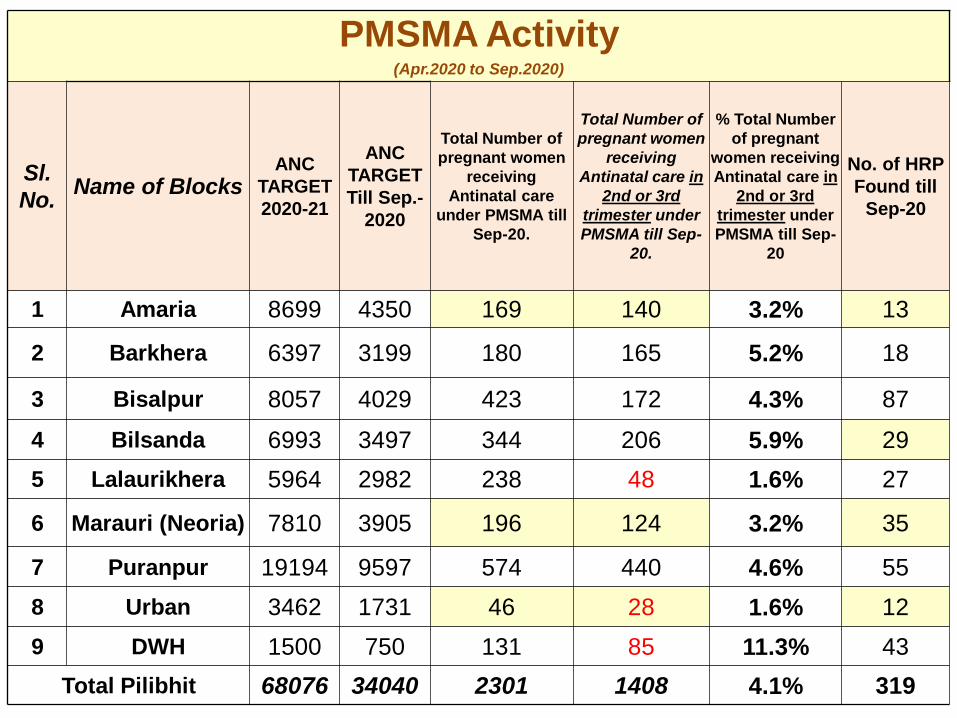
PMSMA Activity (Apr.2020 to Sep.2020)
Sl.
No. Name of Blocks
ANC
TARGET
2020-21
ANC
TARGET
Till Sep.-
2020
Total Number of
pregnant women
receiving
Antinatal care
under PMSMA till
Sep-20.
Total Number of
pregnant women
receiving
Antinatal care in
2nd or 3rd
trimester under
PMSMA till Sep-
20.
% Total Number
of pregnant
women receiving
Antinatal care in
2nd or 3rd
trimester under
PMSMA till Sep-
20
No. of HRP
Found till
Sep-20
1 Amaria 8699 4350 169 140 3.2% 13
2 Barkhera 6397 3199 180 165 5.2% 18
3 Bisalpur 8057 4029 423 172 4.3% 87
4 Bilsanda 6993 3497 344 206 5.9% 29
5 Lalaurikhera 5964 2982 238 48 1.6% 27
6 Marauri (Neoria) 7810 3905 196 124 3.2% 35
7 Puranpur 19194 9597 574 440 4.6% 55
8 Urban 3462 1731 46 28 1.6% 12
9 DWH 1500 750 131 85 11.3% 43
Total Pilibhit 68076 34040 2301 1408 4.1% 319
14
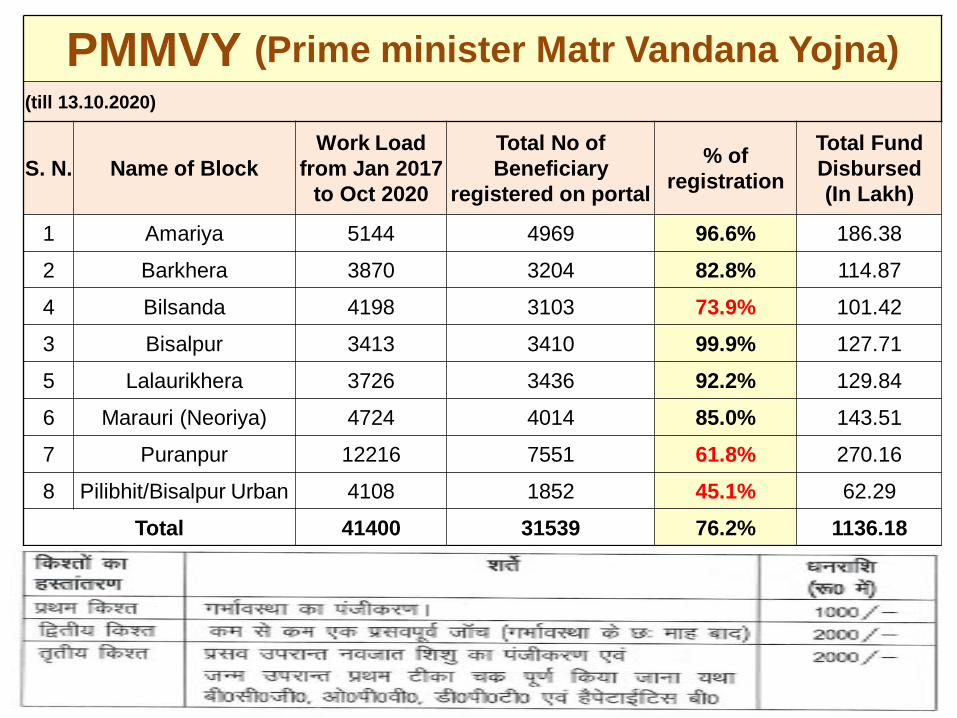
PMMVY (Prime minister Matr Vandana Yojna)
(till 13.10.2020)
S. N. Name of Block
Work Load
from Jan 2017
to Oct 2020
Total No of
Beneficiary
registered on portal
% of
registration
Total Fund
Disbursed
(In Lakh)
1 Amariya 5144 4969 96.6% 186.38
2 Barkhera 3870 3204 82.8% 114.87
4 Bilsanda 4198 3103 73.9% 101.42
3 Bisalpur 3413 3410 99.9% 127.71
5 Lalaurikhera 3726 3436 92.2% 129.84
6 Marauri (Neoriya) 4724 4014 85.0% 143.51
7 Puranpur 12216 7551 61.8% 270.16
8 Pilibhit/Bisalpur Urban 4108 1852 45.1% 62.29
Total 41400 31539 76.2% 1136.18
15
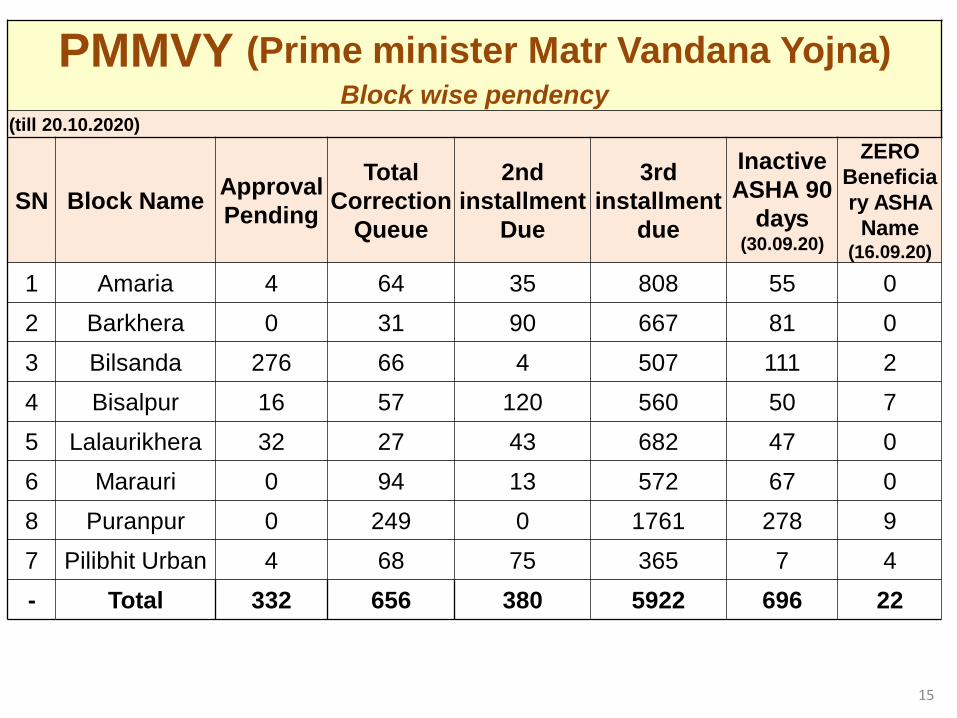
PMMVY (Prime minister Matr Vandana Yojna) Block wise pendency
(till 20.10.2020)
SN Block Name Approval
Pending
Total
Correction
Queue
2nd
installment
Due
3rd
installment
due
Inactive
ASHA 90
days (30.09.20)
ZERO
Beneficia
ry ASHA
Name (16.09.20)
1 Amaria 4 64 35 808 55 0
2 Barkhera 0 31 90 667 81 0
3 Bilsanda 276 66 4 507 111 2
4 Bisalpur 16 57 120 560 50 7
5 Lalaurikhera 32 27 43 682 47 0
6 Marauri 0 94 13 572 67 0
8 Puranpur 0 249 0 1761 278 9
7 Pilibhit Urban 4 68 75 365 7 4
- Total 332 656 380 5922 696 22
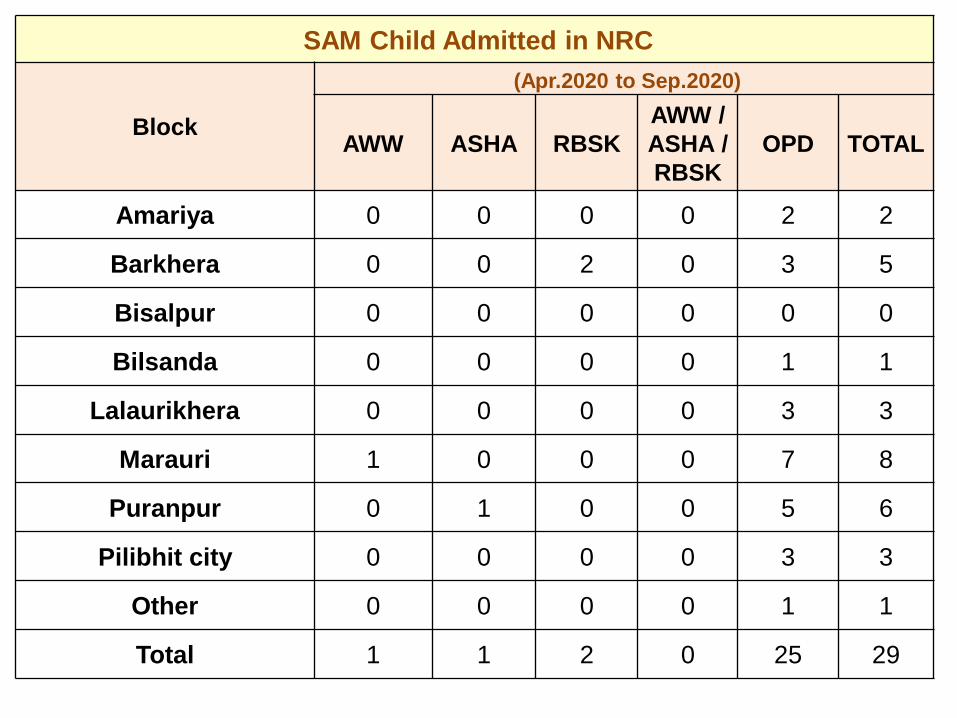
SAM Child Admitted in NRC
Block
(Apr.2020 to Sep.2020)
AWW ASHA RBSK
AWW /
ASHA /
RBSK
OPD TOTAL
Amariya 0 0 0 0 2 2
Barkhera 0 0 2 0 3 5
Bisalpur 0 0 0 0 0 0
Bilsanda 0 0 0 0 1 1
Lalaurikhera 0 0 0 0 3 3
Marauri 1 0 0 0 7 8
Puranpur 0 1 0 0 5 6
Pilibhit city 0 0 0 0 3 3
Other 0 0 0 0 1 1
Total 1 1 2 0 25 29
17
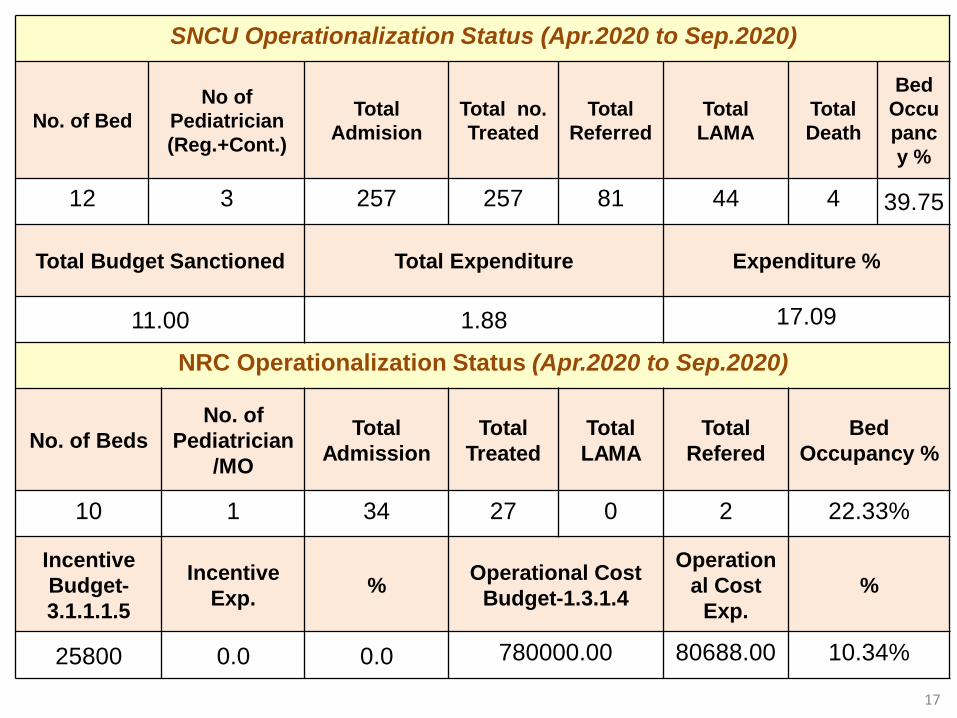
SNCU Operationalization Status (Apr.2020 to Sep.2020)
No. of Bed
No of
Pediatrician
(Reg.+Cont.)
Total
Admision
Total no.
Treated
Total
Referred
Total
LAMA
Total
Death
Bed
Occu
panc
y %
12 3 257 257 81 44 4 39.75
Total Budget Sanctioned Total Expenditure Expenditure %
11.00 1.88 17.09
NRC Operationalization Status (Apr.2020 to Sep.2020)
No. of Beds
No. of
Pediatrician
/MO
Total
Admission
Total
Treated
Total
LAMA
Total
Refered
Bed
Occupancy %
10 1 34 27 0 2 22.33%
Incentive
Budget-
3.1.1.1.5
Incentive
Exp. %
Operational Cost
Budget-1.3.1.4
Operation
al Cost
Exp.
%
25800 0.0 0.0 780000.00 80688.00 10.34%
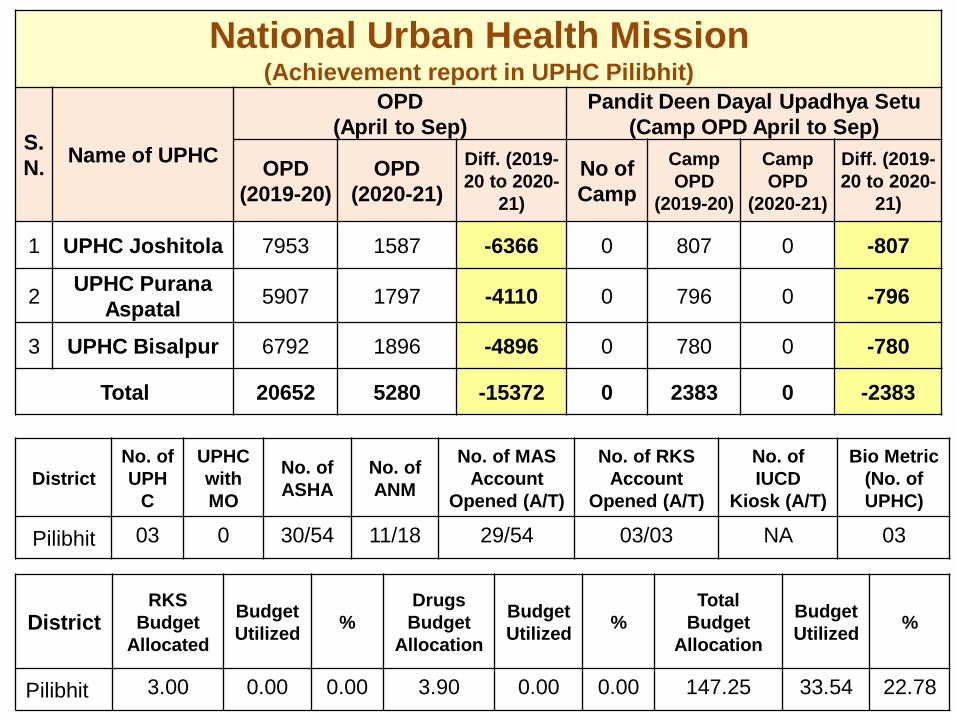
National Urban Health Mission (Achievement report in UPHC Pilibhit)
S.
N. Name of UPHC
OPD
(April to Sep)
Pandit Deen Dayal Upadhya Setu
(Camp OPD April to Sep)
OPD
(2019-20)
OPD
(2020-21)
Diff. (2019-
20 to 2020-
21)
No of
Camp
Camp
OPD
(2019-20)
Camp
OPD
(2020-21)
Diff. (2019-
20 to 2020-
21)
1 UPHC Joshitola 7953 1587 -6366 0 807 0 -807
2 UPHC Purana
Aspatal 5907 1797 -4110 0 796 0 -796
3 UPHC Bisalpur 6792 1896 -4896 0 780 0 -780
Total 20652 5280 -15372 0 2383 0 -2383
18
District
No. of
UPH
C
UPHC
with
MO
No. of
ASHA
No. of
ANM
No. of MAS
Account
Opened (A/T)
No. of RKS
Account
Opened (A/T)
No. of
IUCD
Kiosk (A/T)
Bio Metric
(No. of
UPHC)
Pilibhit 03 0 30/54 11/18 29/54 03/03 NA 03
District RKS
Budget
Allocated
Budget
Utilized %
Drugs
Budget
Allocation
Budget
Utilized %
Total
Budget
Allocation
Budget
Utilized %
Pilibhit 3.00 0.00 0.00 3.90 0.00 0.00 147.25 33.54 22.78
19
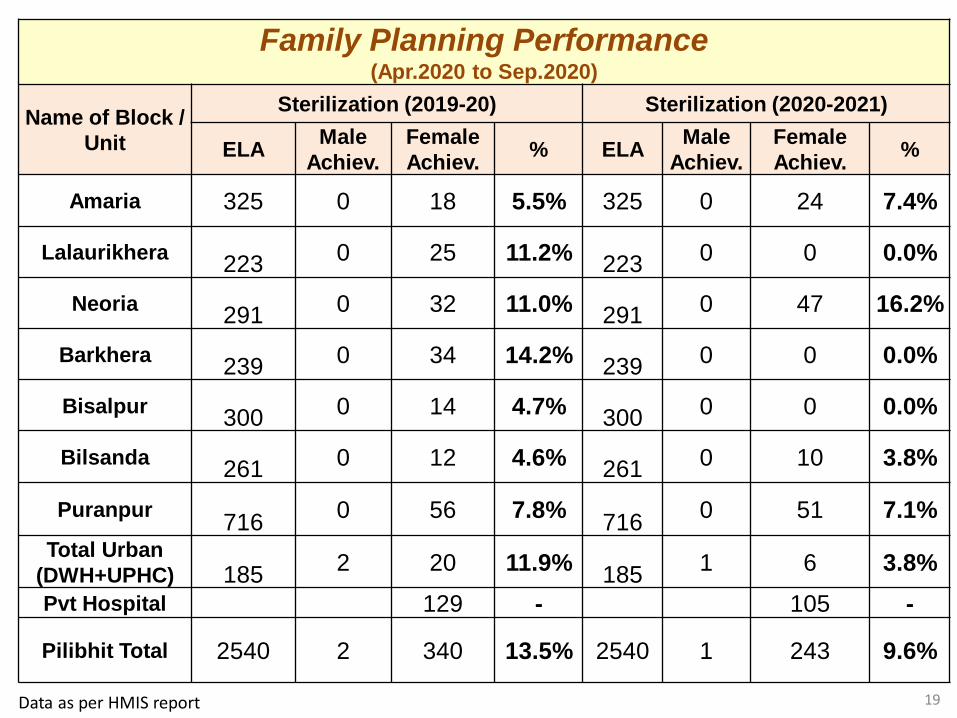
Family Planning Performance (Apr.2020 to Sep.2020)
Name of Block /
Unit
Sterilization (2019-20) Sterilization (2020-2021)
ELA Male
Achiev.
Female
Achiev. % ELA
Male
Achiev.
Female
Achiev. %
Amaria 325 0 18 5.5% 325 0 24 7.4%
Lalaurikhera 223
0 25 11.2% 223
0 0 0.0%
Neoria 291
0 32 11.0% 291
0 47 16.2%
Barkhera 239
0 34 14.2% 239
0 0 0.0%
Bisalpur 300
0 14 4.7% 300
0 0 0.0%
Bilsanda 261
0 12 4.6% 261
0 10 3.8%
Puranpur 716
0 56 7.8% 716
0 51 7.1%
Total Urban
(DWH+UPHC) 185 2 20 11.9%
185 1 6 3.8%
Pvt Hospital 129 - 105 -
Pilibhit Total 2540 2 340 13.5% 2540 1 243 9.6%
Data as per HMIS report
20
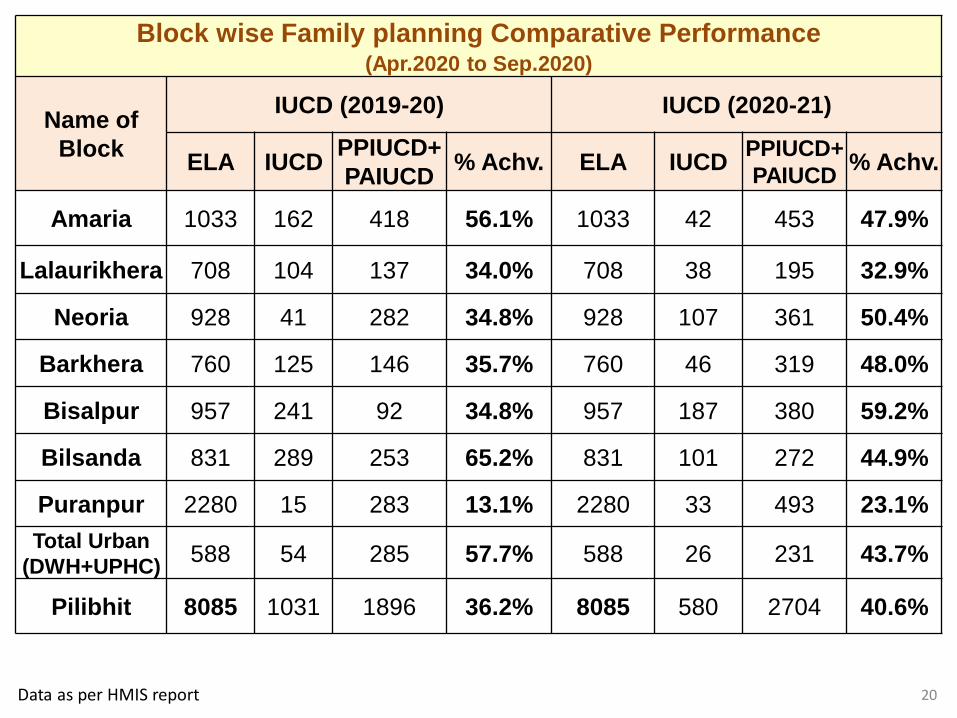
Block wise Family planning Comparative Performance (Apr.2020 to Sep.2020)
Name of
Block
IUCD (2019-20) IUCD (2020-21)
ELA IUCD PPIUCD+
PAIUCD % Achv. ELA IUCD
PPIUCD+
PAIUCD % Achv.
Amaria 1033 162 418 56.1% 1033 42 453 47.9%
Lalaurikhera 708 104 137 34.0% 708 38 195 32.9%
Neoria 928 41 282 34.8% 928 107 361 50.4%
Barkhera 760 125 146 35.7% 760 46 319 48.0%
Bisalpur 957 241 92 34.8% 957 187 380 59.2%
Bilsanda 831 289 253 65.2% 831 101 272 44.9%
Puranpur 2280 15 283 13.1% 2280 33 493 23.1%
Total Urban
(DWH+UPHC) 588 54 285 57.7% 588 26 231 43.7%
Pilibhit 8085 1031 1896 36.2% 8085 580 2704 40.6%
Data as per HMIS report
21 Data as per HMIS report
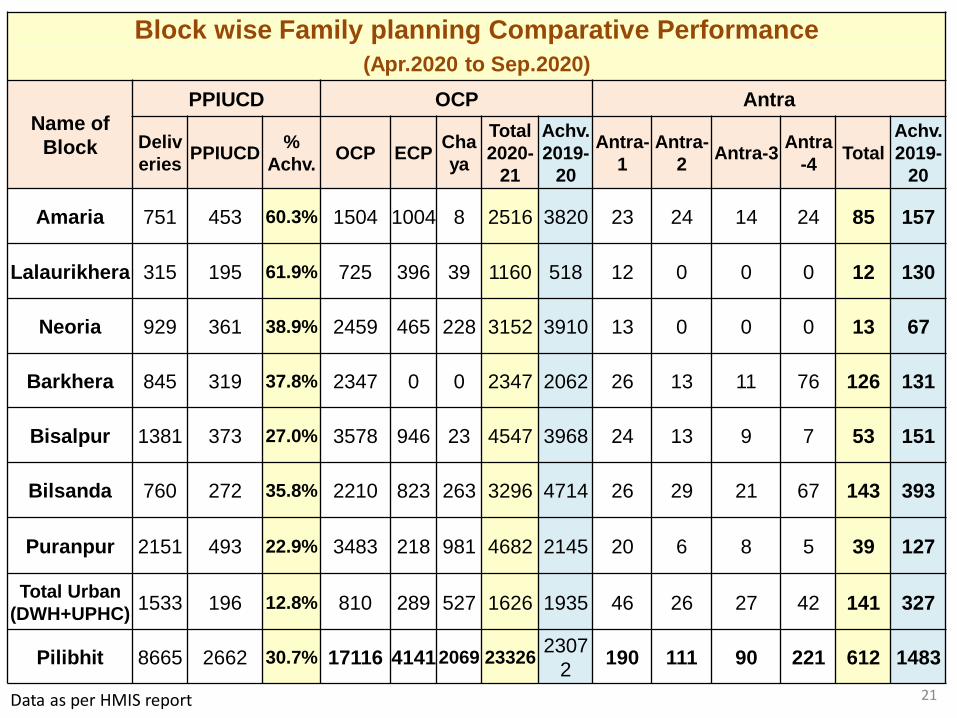
Block wise Family planning Comparative Performance
(Apr.2020 to Sep.2020)
Name of
Block
PPIUCD OCP Antra
Deliv
eries PPIUCD
%
Achv. OCP ECP
Cha
ya
Total
2020-
21
Achv.
2019-
20
Antra-
1
Antra-
2 Antra-3
Antra
-4 Total
Achv.
2019-
20
Amaria 751 453 60.3% 1504 1004 8 2516 3820 23 24 14 24 85 157
Lalaurikhera 315 195 61.9% 725 396 39 1160 518 12 0 0 0 12 130
Neoria 929 361 38.9% 2459 465 228 3152 3910 13 0 0 0 13 67
Barkhera 845 319 37.8% 2347 0 0 2347 2062 26 13 11 76 126 131
Bisalpur 1381 373 27.0% 3578 946 23 4547 3968 24 13 9 7 53 151
Bilsanda 760 272 35.8% 2210 823 263 3296 4714 26 29 21 67 143 393
Puranpur 2151 493 22.9% 3483 218 981 4682 2145 20 6 8 5 39 127
Total Urban
(DWH+UPHC) 1533 196 12.8% 810 289 527 1626 1935 46 26 27 42 141 327
Pilibhit 8665 2662 30.7% 17116 4141 2069 23326 2307
2 190 111 90 221 612 1483
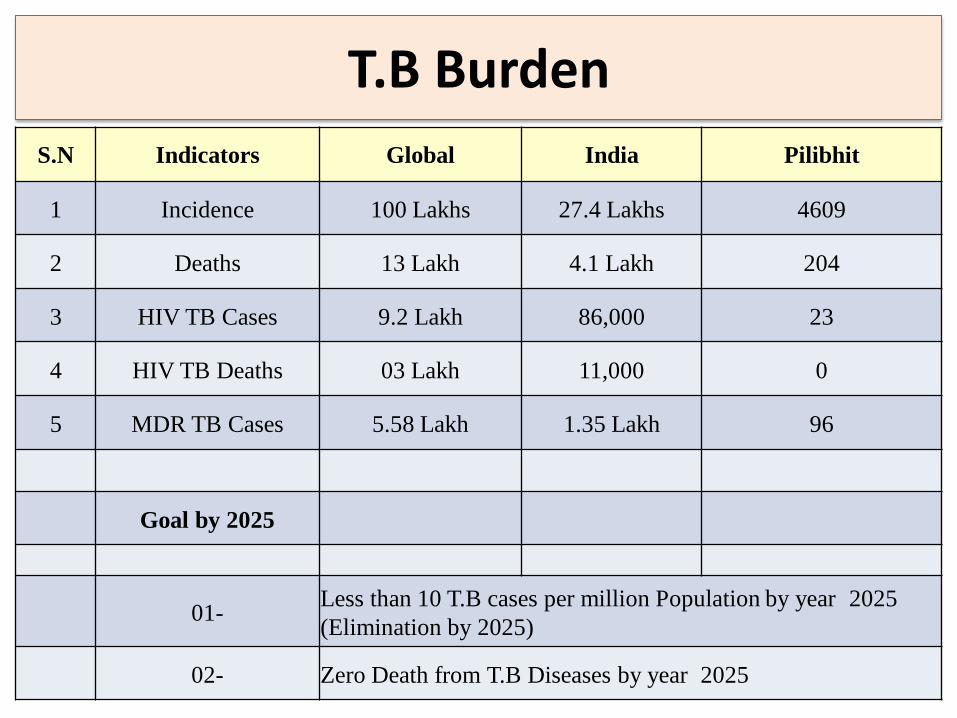
T.B Burden
S.N Indicators Global India Pilibhit
1 Incidence 100 Lakhs 27.4 Lakhs 4609
2 Deaths 13 Lakh 4.1 Lakh 204
3 HIV TB Cases 9.2 Lakh 86,000 23
4 HIV TB Deaths 03 Lakh 11,000 0
5 MDR TB Cases 5.58 Lakh 1.35 Lakh 96
Goal by 2025
01- Less than 10 T.B cases per million Population by year 2025
(Elimination by 2025)
02- Zero Death from T.B Diseases by year 2025
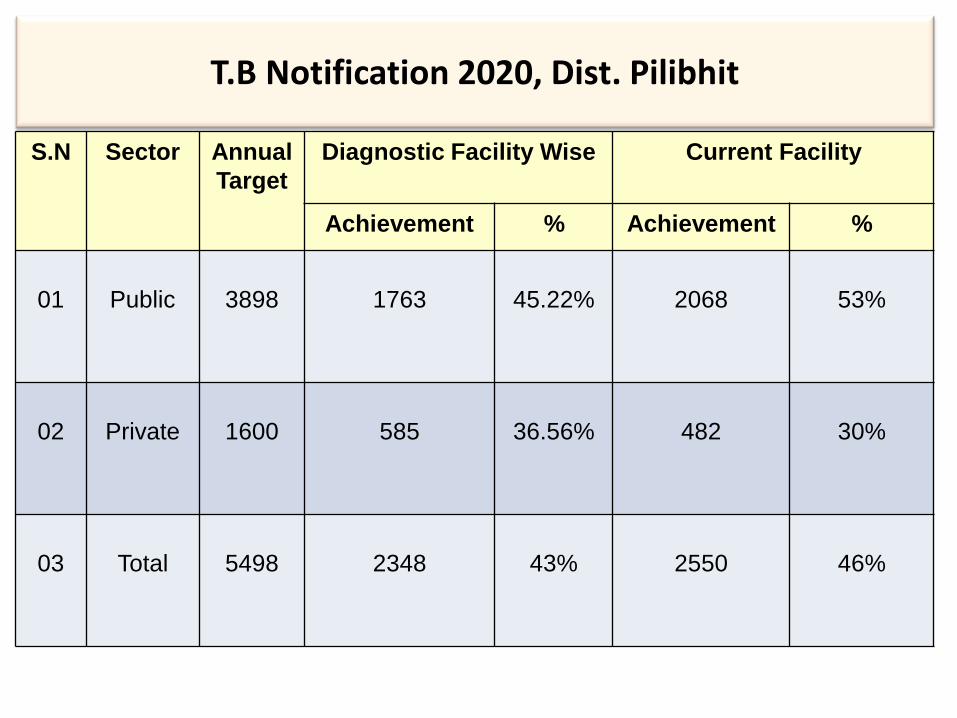
T.B Notification 2020, Dist. Pilibhit
S.N Sector Annual
Target
Diagnostic Facility Wise Current Facility
Achievement % Achievement %
01
Public
3898
1763
45.22%
2068
53%
02
Private
1600
585
36.56%
482
30%
03
Total
5498
2348
43%
2550
46%
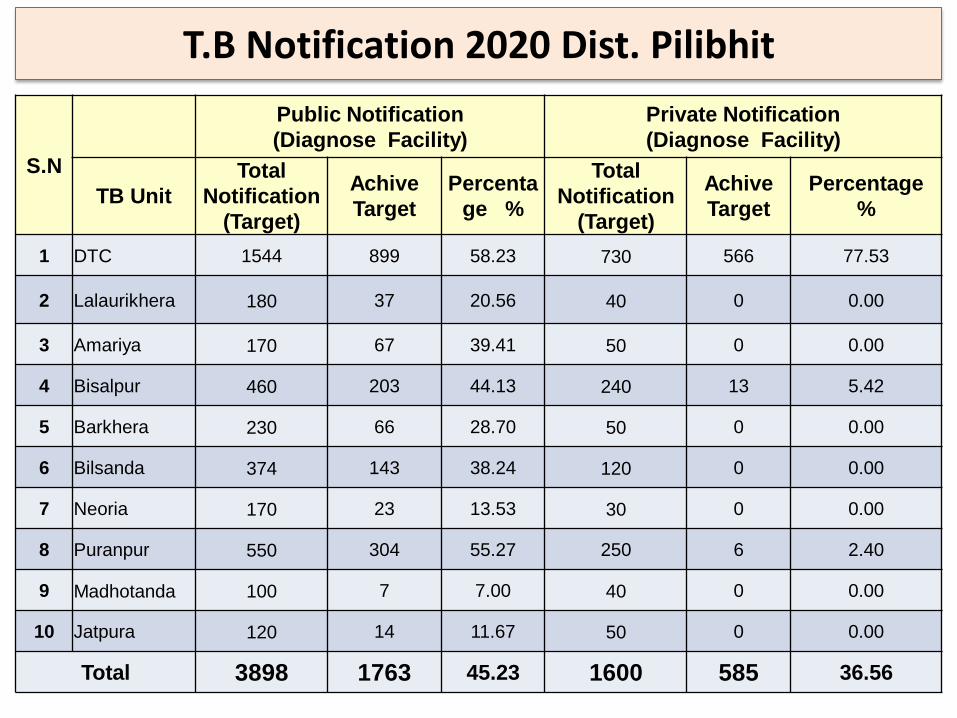
T.B Notification 2020 Dist. Pilibhit
S.N
Public Notification
(Diagnose Facility)
Private Notification
(Diagnose Facility)
TB Unit
Total
Notification
(Target)
Achive
Target
Percenta
ge %
Total
Notification
(Target)
Achive
Target
Percentage
%
1 DTC 1544 899 58.23 730 566 77.53
2 Lalaurikhera 180 37 20.56 40 0 0.00
3 Amariya 170 67 39.41 50 0 0.00
4 Bisalpur 460 203 44.13 240 13 5.42
5 Barkhera 230 66 28.70 50 0 0.00
6 Bilsanda 374 143 38.24 120 0 0.00
7 Neoria 170 23 13.53 30 0 0.00
8 Puranpur 550 304 55.27 250 6 2.40
9 Madhotanda 100 7 7.00 40 0 0.00
10 Jatpura 120 14 11.67 50 0 0.00
Total 3898 1763 45.23 1600 585 36.56
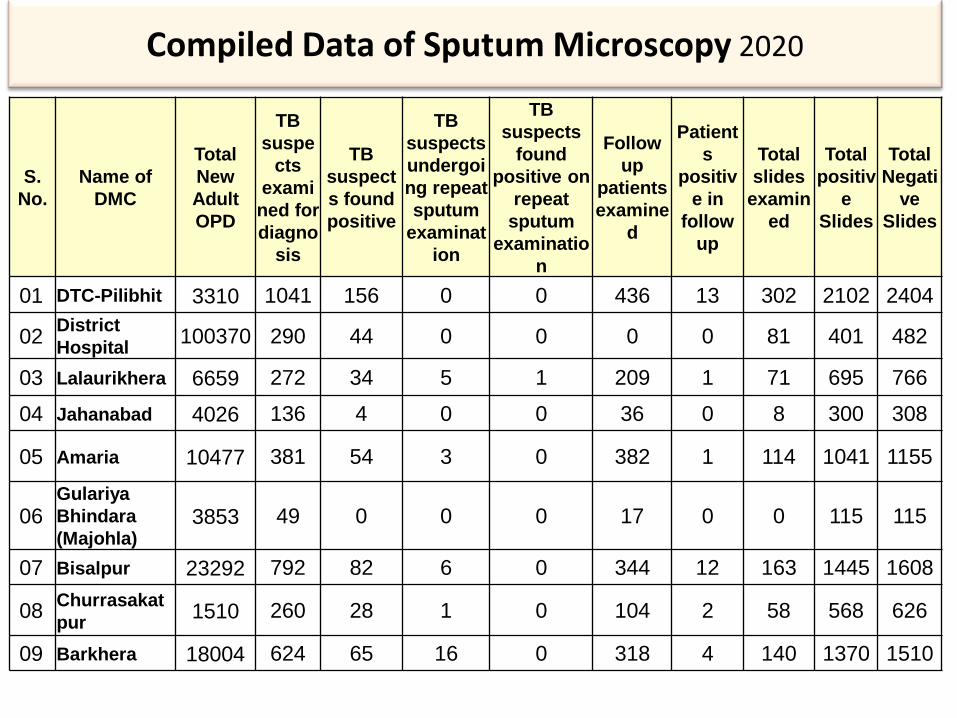
Compiled Data of Sputum Microscopy 2020
S.
No.
Name of
DMC
Total
New
Adult
OPD
TB
suspe
cts
exami
ned for
diagno
sis
TB
suspect
s found
positive
TB
suspects
undergoi
ng repeat
sputum
examinat
ion
TB
suspects
found
positive on
repeat
sputum
examinatio
n
Follow
up
patients
examine
d
Patient
s
positiv
e in
follow
up
Total
slides
examin
ed
Total
positiv
e
Slides
Total
Negati
ve
Slides
01 DTC-Pilibhit 3310 1041 156 0 0 436 13 302 2102 2404
02 District
Hospital 100370 290 44 0 0 0 0 81 401 482
03 Lalaurikhera 6659 272 34 5 1 209 1 71 695 766
04 Jahanabad 4026 136 4 0 0 36 0 8 300 308
05 Amaria 10477 381 54 3 0 382 1 114 1041 1155
06 Gulariya
Bhindara
(Majohla) 3853 49 0 0 0 17 0 0 115 115
07 Bisalpur 23292 792 82 6 0 344 12 163 1445 1608
08 Churrasakat
pur 1510 260 28 1 0 104 2 58 568 626
09 Barkhera 18004 624 65 16 0 318 4 140 1370 1510
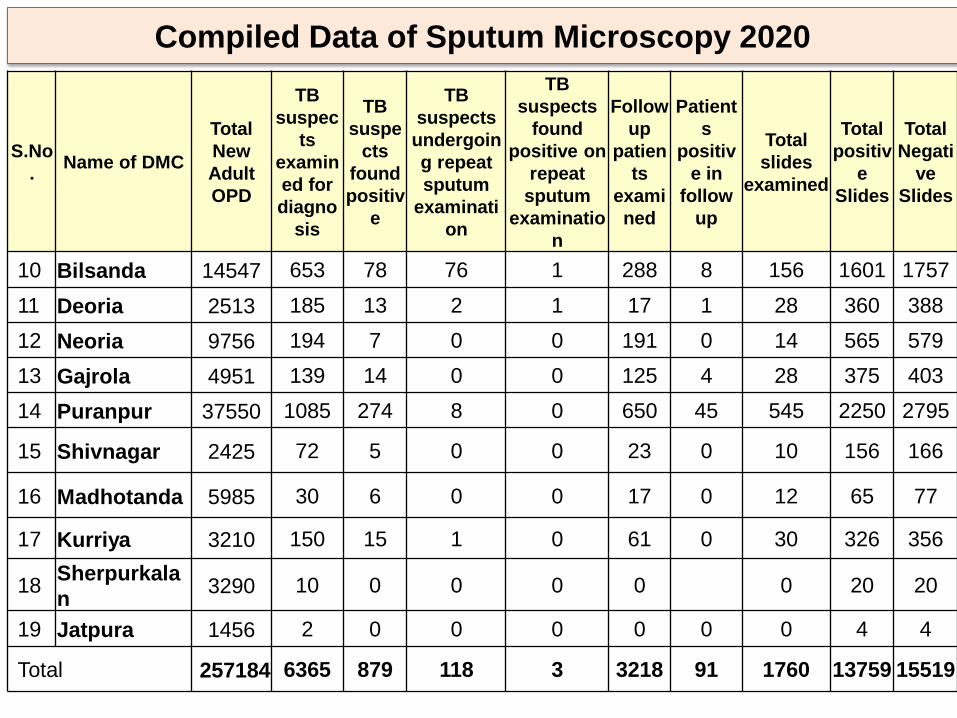
Compiled Data of Sputum Microscopy 2020
S.No
. Name of DMC
Total
New
Adult
OPD
TB
suspec
ts
examin
ed for
diagno
sis
TB
suspe
cts
found
positiv
e
TB
suspects
undergoin
g repeat
sputum
examinati
on
TB
suspects
found
positive on
repeat
sputum
examinatio
n
Follow
up
patien
ts
exami
ned
Patient
s
positiv
e in
follow
up
Total
slides
examined
Total
positiv
e
Slides
Total
Negati
ve
Slides
10 Bilsanda 14547 653 78 76 1 288 8 156 1601 1757
11 Deoria 2513 185 13 2 1 17 1 28 360 388
12 Neoria 9756 194 7 0 0 191 0 14 565 579
13 Gajrola 4951 139 14 0 0 125 4 28 375 403
14 Puranpur 37550 1085 274 8 0 650 45 545 2250 2795
15 Shivnagar 2425 72 5 0 0 23 0 10 156 166
16 Madhotanda 5985 30 6 0 0 17 0 12 65 77
17 Kurriya 3210 150 15 1 0 61 0 30 326 356
18 Sherpurkala
n 3290 10 0 0 0 0 0 20 20
19 Jatpura 1456 2 0 0 0 0 0 0 4 4
Total 257184 6365 879 118 3 3218 91 1760 13759 15519
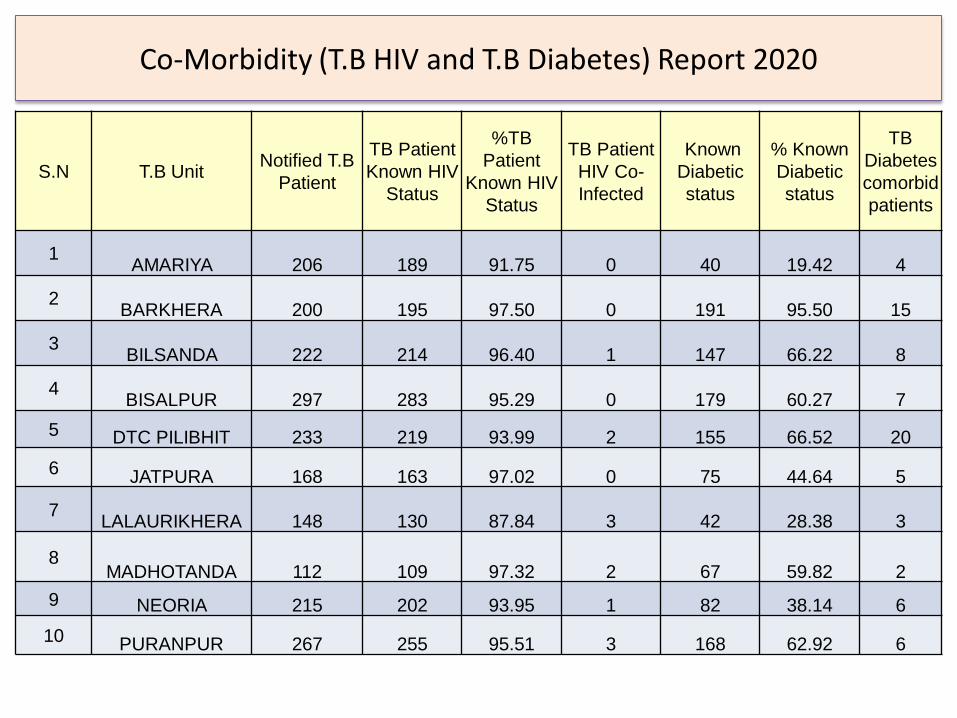
Co-Morbidity (T.B HIV and T.B Diabetes) Report 2020
S.N T.B Unit Notified T.B
Patient
TB Patient
Known HIV
Status
%TB
Patient
Known HIV
Status
TB Patient
HIV Co-
Infected
Known
Diabetic
status
% Known
Diabetic
status
TB
Diabetes
comorbid
patients
1 AMARIYA 206 189 91.75 0 40 19.42 4
2 BARKHERA 200 195 97.50 0 191 95.50 15
3 BILSANDA 222 214 96.40 1 147 66.22 8
4 BISALPUR 297 283 95.29 0 179 60.27 7
5 DTC PILIBHIT 233 219 93.99 2 155 66.52 20
6 JATPURA 168 163 97.02 0 75 44.64 5
7 LALAURIKHERA 148 130 87.84 3 42 28.38 3
8 MADHOTANDA 112 109 97.32 2 67 59.82 2
9 NEORIA 215 202 93.95 1 82 38.14 6
10 PURANPUR 267 255 95.51 3 168 62.92 6
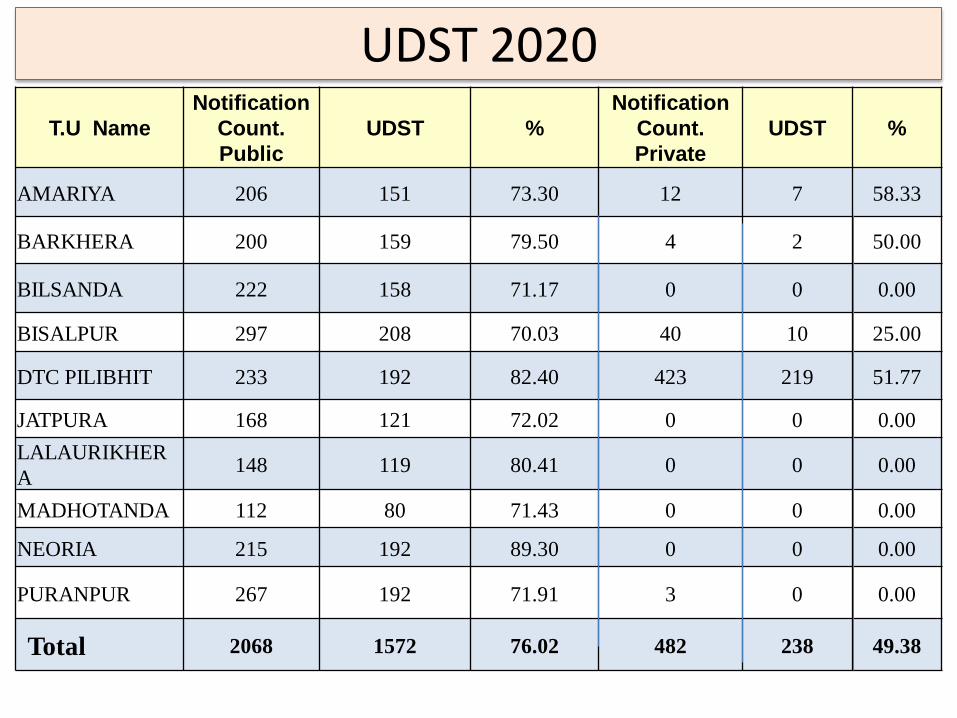
UDST 2020
T.U Name
Notification
Count.
Public
UDST %
Notification
Count.
Private
UDST %
AMARIYA 206 151 73.30 12 7 58.33
BARKHERA 200 159 79.50 4 2 50.00
BILSANDA 222 158 71.17 0 0 0.00
BISALPUR 297 208 70.03 40 10 25.00
DTC PILIBHIT 233 192 82.40 423 219 51.77
JATPURA 168 121 72.02 0 0 0.00
LALAURIKHER
A 148 119 80.41 0 0 0.00
MADHOTANDA 112 80 71.43 0 0 0.00
NEORIA 215 192 89.30 0 0 0.00
PURANPUR 267 192 71.91 3 0 0.00
Total 2068 1572 76.02 482 238 49.38
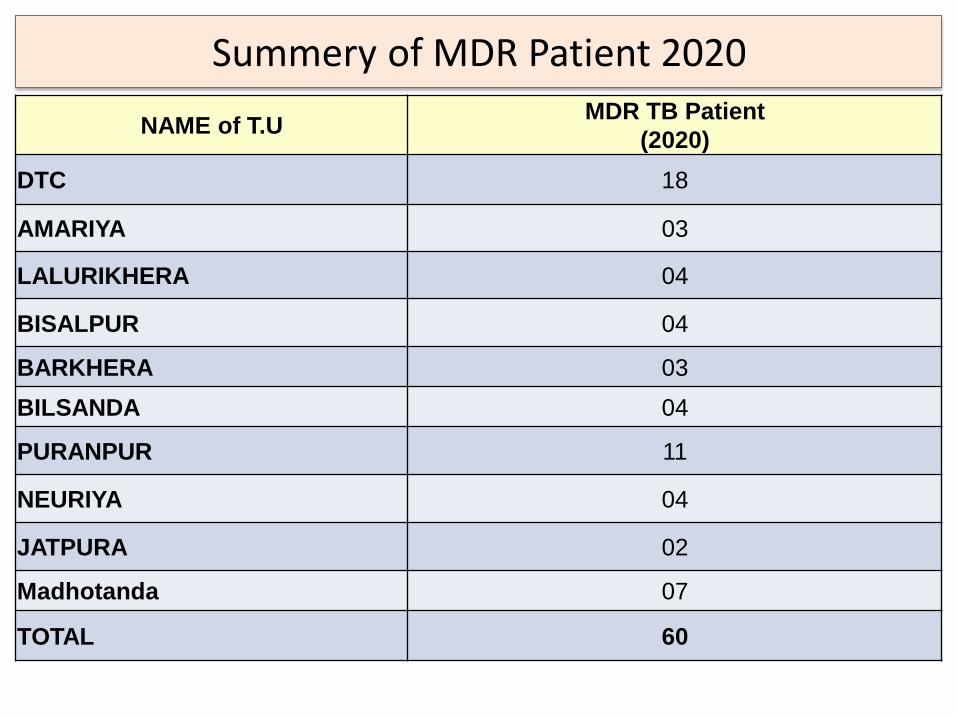
Summery of MDR Patient 2020
NAME of T.U MDR TB Patient
(2020)
DTC 18
AMARIYA 03
LALURIKHERA 04
BISALPUR 04
BARKHERA 03
BILSANDA 04
PURANPUR 11
NEURIYA 04
JATPURA 02
Madhotanda 07
TOTAL 60
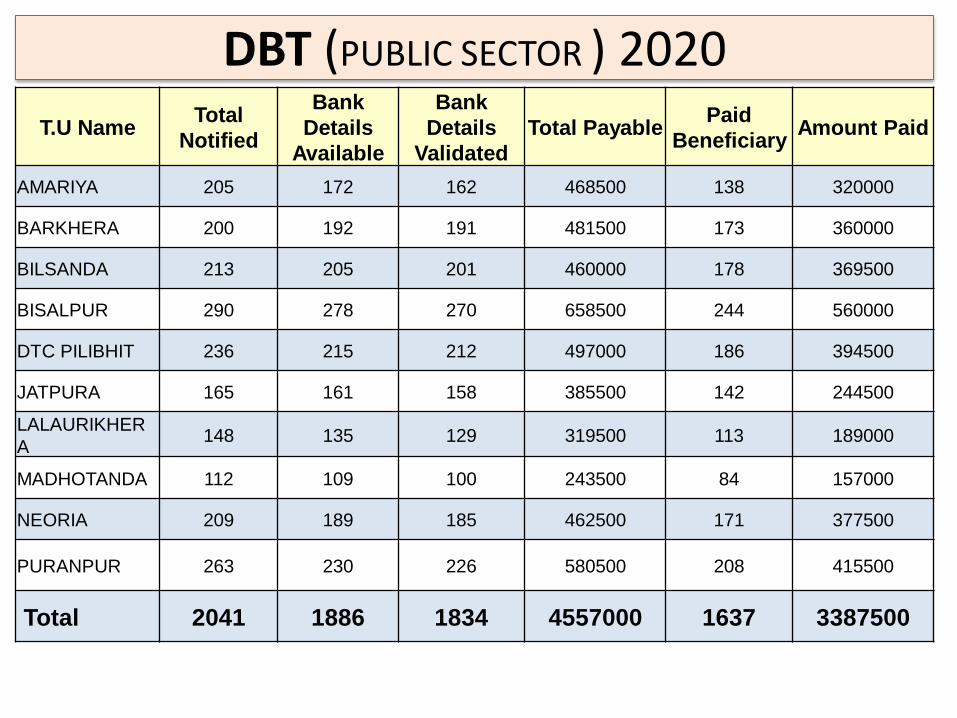
DBT (PUBLIC SECTOR ) 2020
T.U Name Total
Notified
Bank
Details
Available
Bank
Details
Validated
Total Payable Paid
Beneficiary Amount Paid
AMARIYA 205 172 162 468500 138 320000
BARKHERA 200 192 191 481500 173 360000
BILSANDA 213 205 201 460000 178 369500
BISALPUR 290 278 270 658500 244 560000
DTC PILIBHIT 236 215 212 497000 186 394500
JATPURA 165 161 158 385500 142 244500
LALAURIKHER
A 148 135 129 319500 113 189000
MADHOTANDA 112 109 100 243500 84 157000
NEORIA 209 189 185 462500 171 377500
PURANPUR 263 230 226 580500 208 415500
Total 2041 1886 1834 4557000 1637 3387500
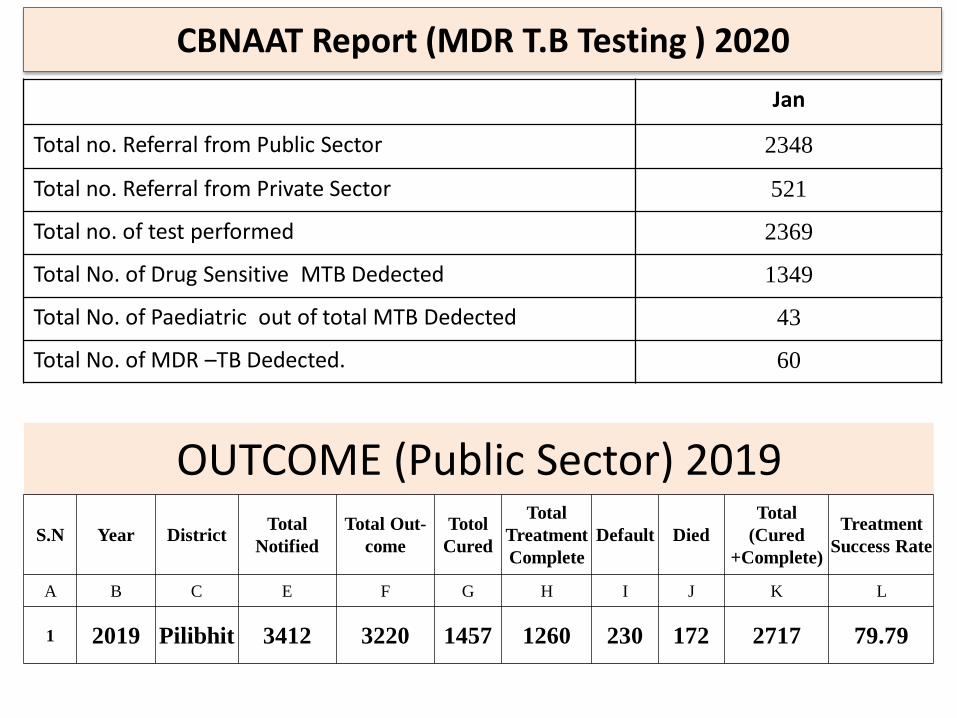
CBNAAT Report (MDR T.B Testing ) 2020
Jan
Total no. Referral from Public Sector 2348
Total no. Referral from Private Sector 521
Total no. of test performed 2369
Total No. of Drug Sensitive MTB Dedected 1349
Total No. of Paediatric out of total MTB Dedected 43
Total No. of MDR –TB Dedected. 60
OUTCOME (Public Sector) 2019
S.N Year District Total
Notified
Total Out-
come
Totol
Cured
Total
Treatment
Complete
Default Died
Total
(Cured
+Complete)
Treatment
Success Rate
A B C E F G H I J K L
1 2019 Pilibhit 3412 3220 1457 1260 230 172 2717 79.79
32
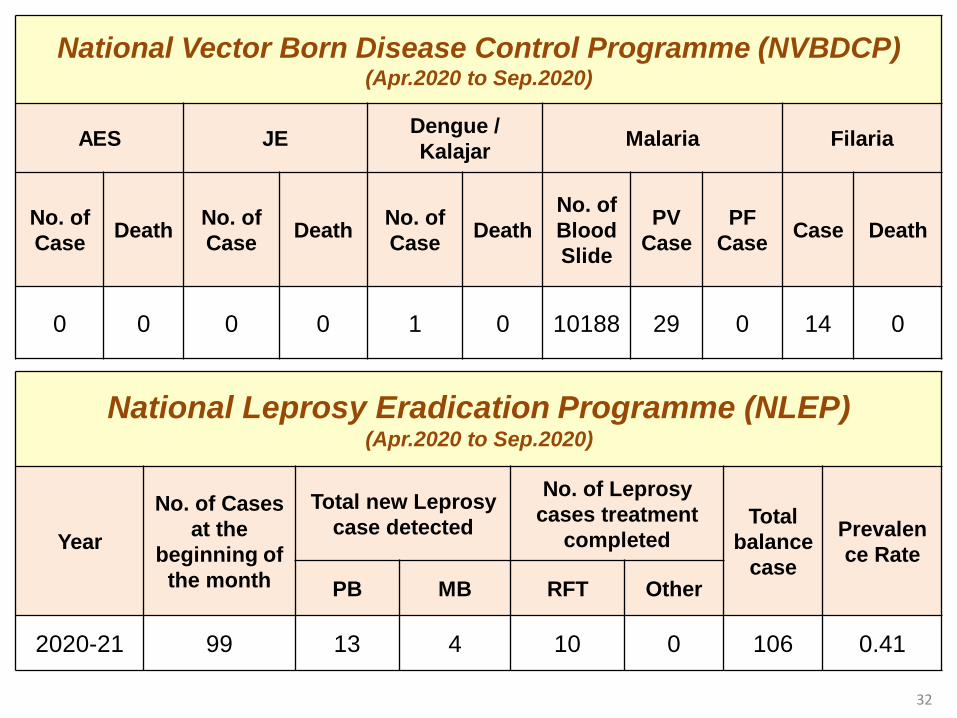
National Vector Born Disease Control Programme (NVBDCP) (Apr.2020 to Sep.2020)
AES JE Dengue /
Kalajar Malaria Filaria
No. of
Case Death
No. of
Case Death
No. of
Case Death
No. of
Blood
Slide
PV
Case
PF
Case Case Death
0 0 0 0 1 0 10188 29 0 14 0
National Leprosy Eradication Programme (NLEP) (Apr.2020 to Sep.2020)
Year
No. of Cases
at the
beginning of
the month
Total new Leprosy
case detected
No. of Leprosy
cases treatment
completed Total
balance
case
Prevalen
ce Rate
PB MB RFT Other
2020-21 99 13 4 10 0 106 0.41
Note – Achievement against target count till date
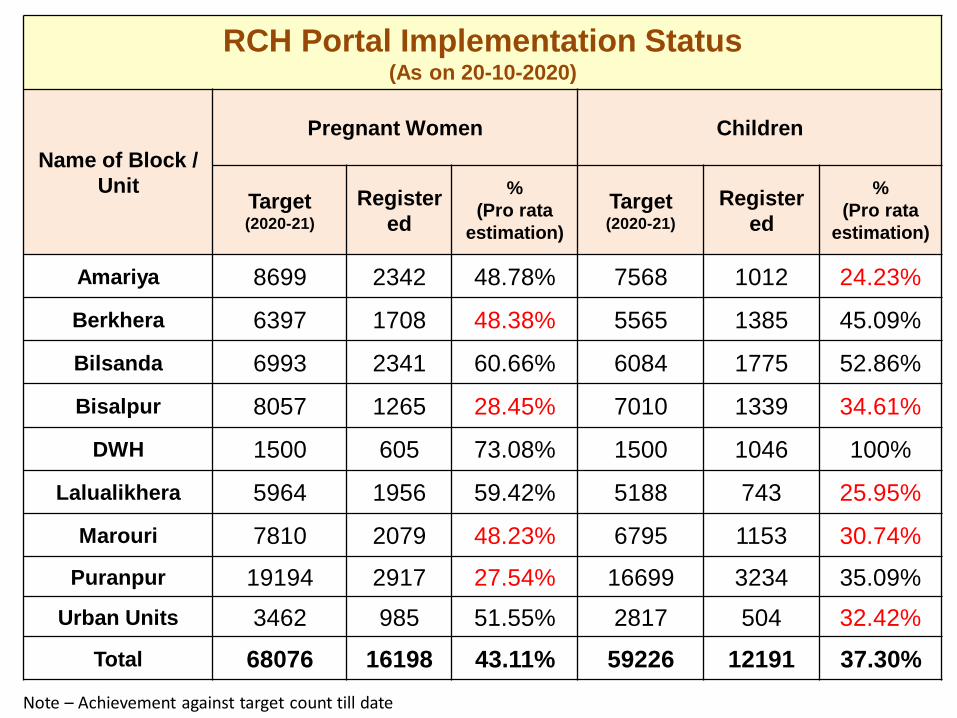
RCH Portal Implementation Status (As on 20-10-2020)
Name of Block /
Unit
Pregnant Women Children
Target (2020-21)
Register
ed
%
(Pro rata
estimation)
Target (2020-21)
Register
ed
%
(Pro rata
estimation)
Amariya 8699 2342 48.78% 7568 1012 24.23%
Berkhera 6397 1708 48.38% 5565 1385 45.09%
Bilsanda 6993 2341 60.66% 6084 1775 52.86%
Bisalpur 8057 1265 28.45% 7010 1339 34.61%
DWH 1500 605 73.08% 1500 1046 100%
Lalualikhera 5964 1956 59.42% 5188 743 25.95%
Marouri 7810 2079 48.23% 6795 1153 30.74%
Puranpur 19194 2917 27.54% 16699 3234 35.09%
Urban Units 3462 985 51.55% 2817 504 32.42%
Total 68076 16198 43.11% 59226 12191 37.30%
34
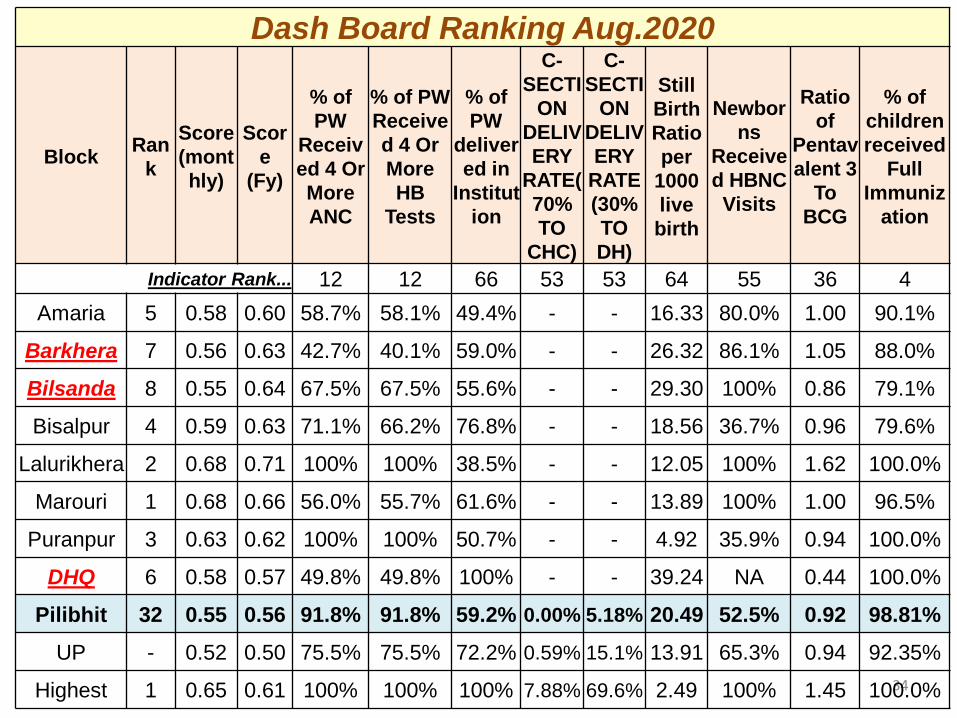
Dash Board Ranking Aug.2020
Block Ran
k
Score
(mont
hly)
Scor
e
(Fy)
% of
PW
Receiv
ed 4 Or
More
ANC
% of PW
Receive
d 4 Or
More
HB
Tests
% of
PW
deliver
ed in
Institut
ion
C-
SECTI
ON
DELIV
ERY
RATE(
70%
TO
CHC)
C-
SECTI
ON
DELIV
ERY
RATE
(30%
TO
DH)
Still
Birth
Ratio
per
1000
live
birth
Newbor
ns
Receive
d HBNC
Visits
Ratio
of
Pentav
alent 3
To
BCG
% of
children
received
Full
Immuniz
ation
Indicator Rank... 12 12 66 53 53 64 55 36 4
Amaria 5 0.58 0.60 58.7% 58.1% 49.4% - - 16.33 80.0% 1.00 90.1%
Barkhera 7 0.56 0.63 42.7% 40.1% 59.0% - - 26.32 86.1% 1.05 88.0%
Bilsanda 8 0.55 0.64 67.5% 67.5% 55.6% - - 29.30 100% 0.86 79.1%
Bisalpur 4 0.59 0.63 71.1% 66.2% 76.8% - - 18.56 36.7% 0.96 79.6%
Lalurikhera 2 0.68 0.71 100% 100% 38.5% - - 12.05 100% 1.62 100.0%
Marouri 1 0.68 0.66 56.0% 55.7% 61.6% - - 13.89 100% 1.00 96.5%
Puranpur 3 0.63 0.62 100% 100% 50.7% - - 4.92 35.9% 0.94 100.0%
DHQ 6 0.58 0.57 49.8% 49.8% 100% - - 39.24 NA 0.44 100.0%
Pilibhit 32 0.55 0.56 91.8% 91.8% 59.2% 0.00% 5.18% 20.49 52.5% 0.92 98.81%
UP - 0.52 0.50 75.5% 75.5% 72.2% 0.59% 15.1% 13.91 65.3% 0.94 92.35%
Highest 1 0.65 0.61 100% 100% 100% 7.88% 69.6% 2.49 100% 1.45 100.0%
35
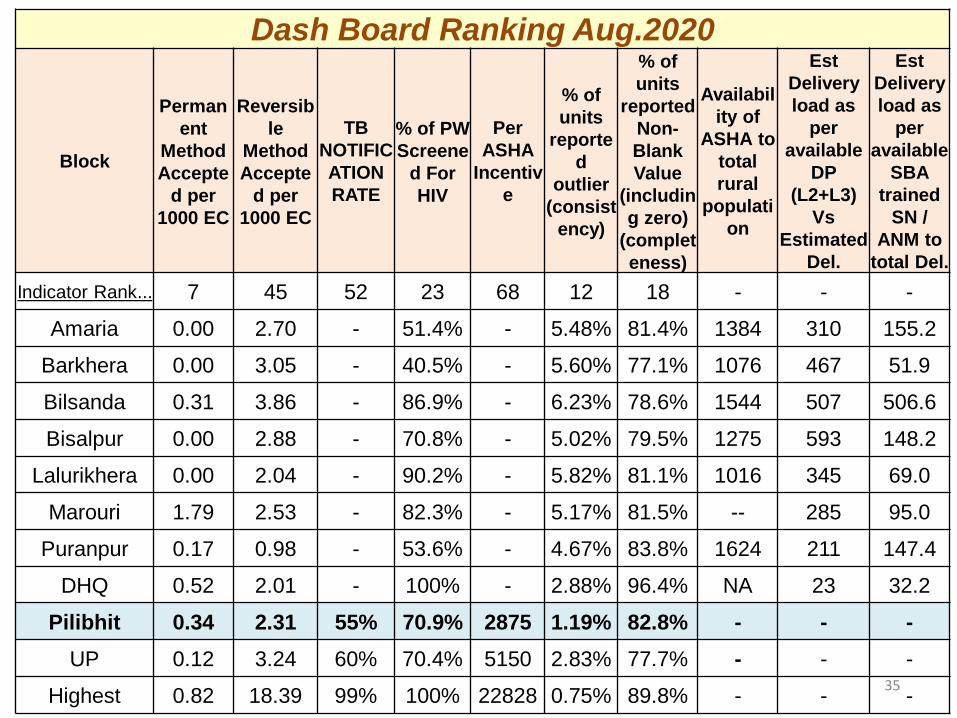
Dash Board Ranking Aug.2020
Block
Perman
ent
Method
Accepte
d per
1000 EC
Reversib
le
Method
Accepte
d per
1000 EC
TB
NOTIFIC
ATION
RATE
% of PW
Screene
d For
HIV
Per
ASHA
Incentiv
e
% of
units
reporte
d
outlier
(consist
ency)
% of
units
reported
Non-
Blank
Value
(includin
g zero)
(complet
eness)
Availabil
ity of
ASHA to
total
rural
populati
on
Est
Delivery
load as
per
available
DP
(L2+L3)
Vs
Estimated
Del.
Est
Delivery
load as
per
available
SBA
trained
SN /
ANM to
total Del.
Indicator Rank... 7 45 52 23 68 12 18 - - -
Amaria 0.00 2.70 - 51.4% - 5.48% 81.4% 1384 310 155.2
Barkhera 0.00 3.05 - 40.5% - 5.60% 77.1% 1076 467 51.9
Bilsanda 0.31 3.86 - 86.9% - 6.23% 78.6% 1544 507 506.6
Bisalpur 0.00 2.88 - 70.8% - 5.02% 79.5% 1275 593 148.2
Lalurikhera 0.00 2.04 - 90.2% - 5.82% 81.1% 1016 345 69.0
Marouri 1.79 2.53 - 82.3% - 5.17% 81.5% -- 285 95.0
Puranpur 0.17 0.98 - 53.6% - 4.67% 83.8% 1624 211 147.4
DHQ 0.52 2.01 - 100% - 2.88% 96.4% NA 23 32.2
Pilibhit 0.34 2.31 55% 70.9% 2875 1.19% 82.8% - - -
UP 0.12 3.24 60% 70.4% 5150 2.83% 77.7% - - -
Highest 0.82 18.39 99% 100% 22828 0.75% 89.8% - - -
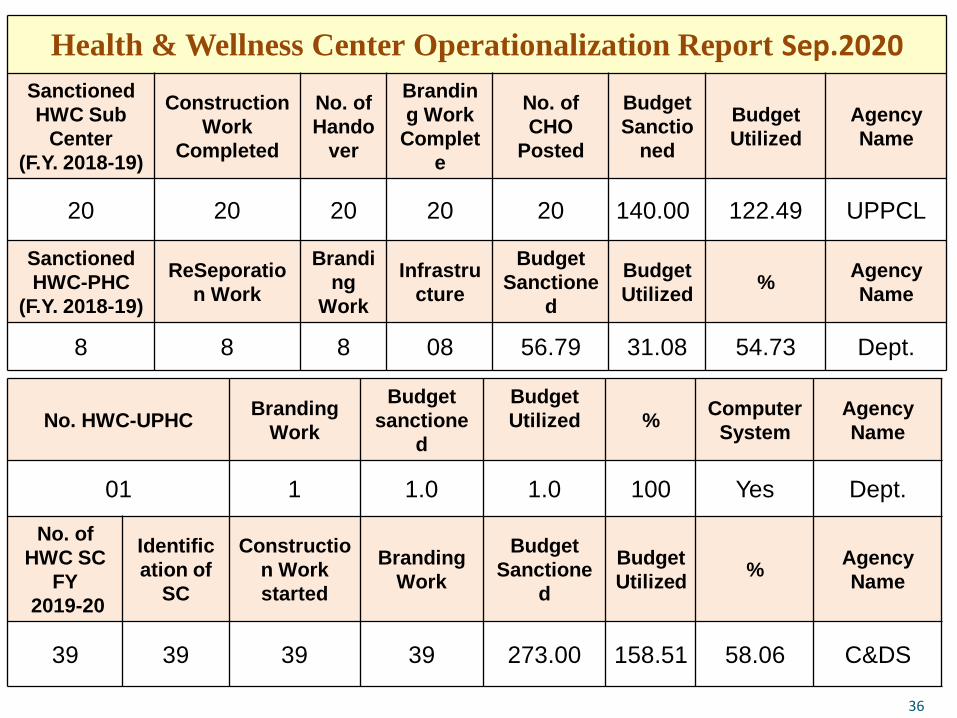
Health & Wellness Center Operationalization Report Sep.2020
Sanctioned
HWC Sub
Center
(F.Y. 2018-19)
Construction
Work
Completed
No. of
Hando
ver
Brandin
g Work
Complet
e
No. of
CHO
Posted
Budget
Sanctio
ned
Budget
Utilized
Agency
Name
20 20 20 20 20 140.00 122.49 UPPCL
Sanctioned
HWC-PHC
(F.Y. 2018-19)
ReSeporatio
n Work
Brandi
ng
Work
Infrastru
cture
Budget
Sanctione
d
Budget
Utilized %
Agency
Name
8 8 8 08 56.79 31.08 54.73 Dept.
36
No. HWC-UPHC Branding
Work
Budget
sanctione
d
Budget
Utilized
% Computer
System
Agency
Name
01 1 1.0 1.0 100 Yes Dept.
No. of
HWC SC
FY
2019-20
Identific
ation of
SC
Constructio
n Work
started
Branding
Work
Budget
Sanctione
d
Budget
Utilized %
Agency
Name
39 39 39 39 273.00 158.51 58.06 C&DS
37
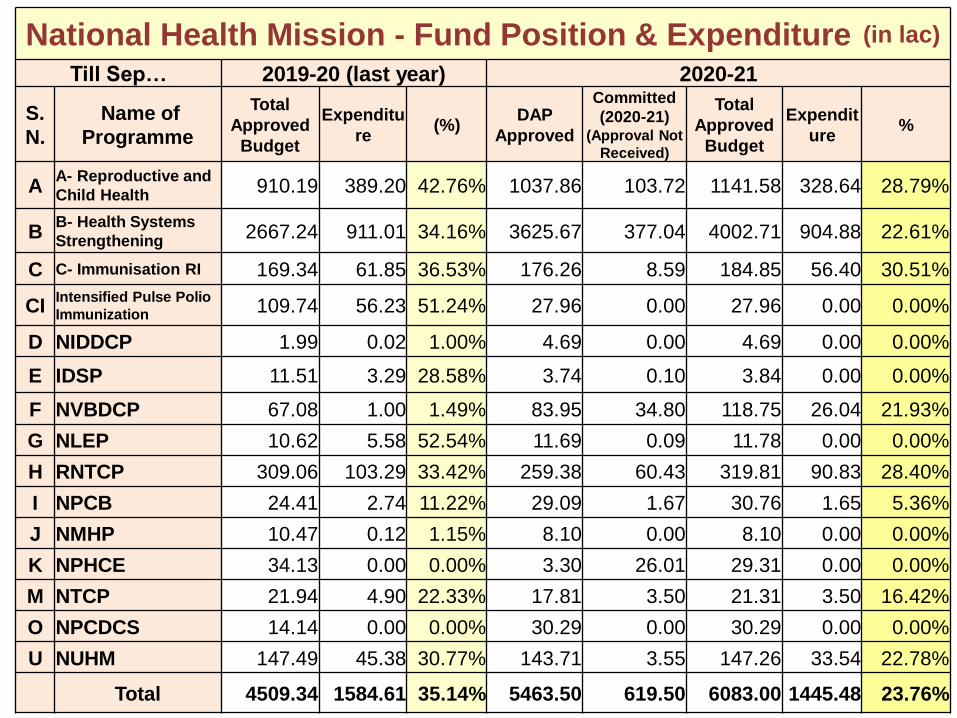
National Health Mission - Fund Position & Expenditure (in lac)
Till Sep… 2019-20 (last year) 2020-21
S.
N.
Name of
Programme
Total
Approved
Budget
Expenditu
re (%)
DAP
Approved
Committed
(2020-21) (Approval Not
Received)
Total
Approved
Budget
Expendit
ure %
A A- Reproductive and
Child Health 910.19 389.20 42.76% 1037.86 103.72 1141.58 328.64 28.79%
B B- Health Systems
Strengthening 2667.24 911.01 34.16% 3625.67 377.04 4002.71 904.88 22.61%
C C- Immunisation RI 169.34 61.85 36.53% 176.26 8.59 184.85 56.40 30.51%
CI Intensified Pulse Polio
Immunization 109.74 56.23 51.24% 27.96 0.00 27.96 0.00 0.00%
D NIDDCP 1.99 0.02 1.00% 4.69 0.00 4.69 0.00 0.00%
E IDSP 11.51 3.29 28.58% 3.74 0.10 3.84 0.00 0.00%
F NVBDCP 67.08 1.00 1.49% 83.95 34.80 118.75 26.04 21.93%
G NLEP 10.62 5.58 52.54% 11.69 0.09 11.78 0.00 0.00%
H RNTCP 309.06 103.29 33.42% 259.38 60.43 319.81 90.83 28.40%
I NPCB 24.41 2.74 11.22% 29.09 1.67 30.76 1.65 5.36%
J NMHP 10.47 0.12 1.15% 8.10 0.00 8.10 0.00 0.00%
K NPHCE 34.13 0.00 0.00% 3.30 26.01 29.31 0.00 0.00%
M NTCP 21.94 4.90 22.33% 17.81 3.50 21.31 3.50 16.42%
O NPCDCS 14.14 0.00 0.00% 30.29 0.00 30.29 0.00 0.00%
U NUHM 147.49 45.38 30.77% 143.71 3.55 147.26 33.54 22.78%
Total 4509.34 1584.61 35.14% 5463.50 619.50 6083.00 1445.48 23.76%
38
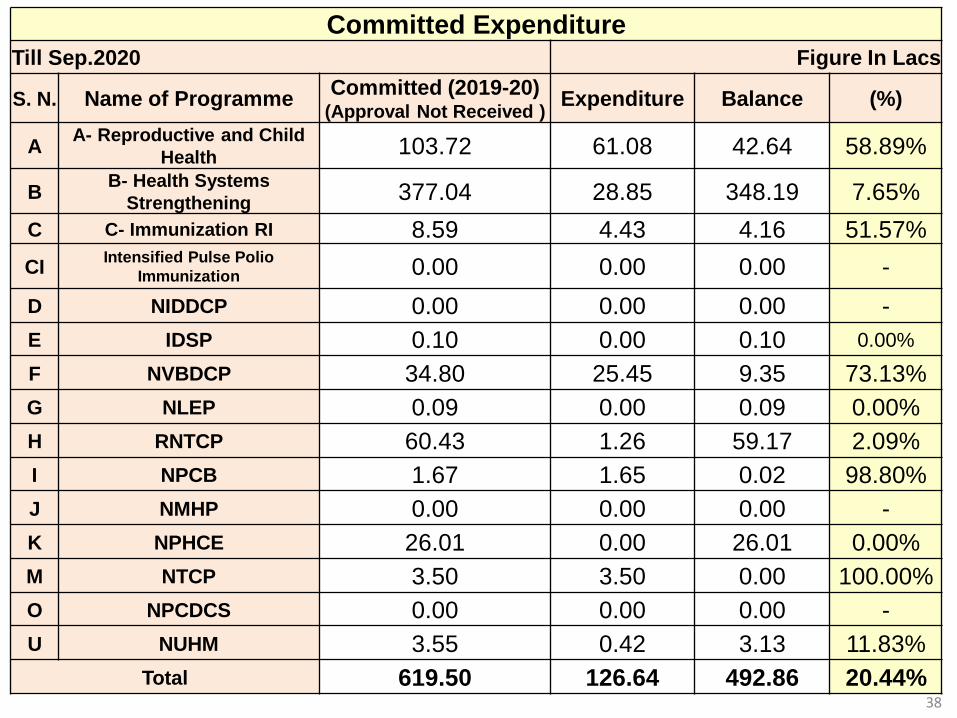
Committed Expenditure
Till Sep.2020 Figure In Lacs
S. N. Name of Programme Committed (2019-20)
(Approval Not Received ) Expenditure Balance (%)
A A- Reproductive and Child
Health 103.72 61.08 42.64 58.89%
B B- Health Systems
Strengthening 377.04 28.85 348.19 7.65%
C C- Immunization RI 8.59 4.43 4.16 51.57%
CI Intensified Pulse Polio
Immunization 0.00 0.00 0.00 -
D NIDDCP 0.00 0.00 0.00 -
E IDSP 0.10 0.00 0.10 0.00%
F NVBDCP 34.80 25.45 9.35 73.13%
G NLEP 0.09 0.00 0.09 0.00%
H RNTCP 60.43 1.26 59.17 2.09%
I NPCB 1.67 1.65 0.02 98.80%
J NMHP 0.00 0.00 0.00 -
K NPHCE 26.01 0.00 26.01 0.00%
M NTCP 3.50 3.50 0.00 100.00%
O NPCDCS 0.00 0.00 0.00 -
U NUHM 3.55 0.42 3.13 11.83%
Total 619.50 126.64 492.86 20.44%
39
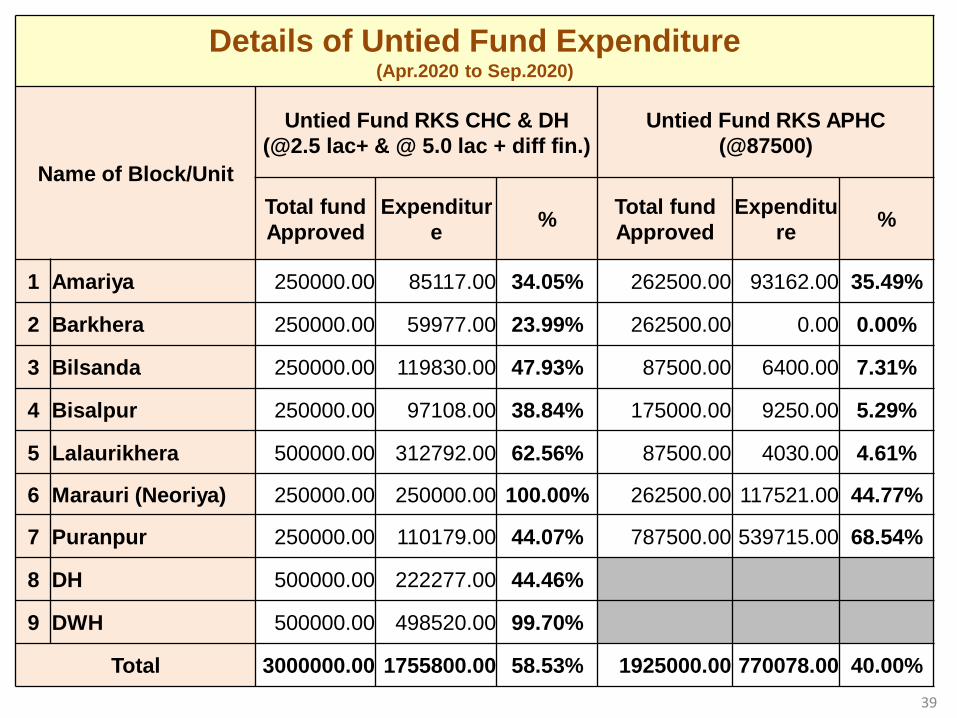
Details of Untied Fund Expenditure
(Apr.2020 to Sep.2020)
Name of Block/Unit
Untied Fund RKS CHC & DH
(@2.5 lac+ & @ 5.0 lac + diff fin.)
Untied Fund RKS APHC
(@87500)
Total fund
Approved
Expenditur
e %
Total fund
Approved
Expenditu
re %
1 Amariya 250000.00 85117.00 34.05% 262500.00 93162.00 35.49%
2 Barkhera 250000.00 59977.00 23.99% 262500.00 0.00 0.00%
3 Bilsanda 250000.00 119830.00 47.93% 87500.00 6400.00 7.31%
4 Bisalpur 250000.00 97108.00 38.84% 175000.00 9250.00 5.29%
5 Lalaurikhera 500000.00 312792.00 62.56% 87500.00 4030.00 4.61%
6 Marauri (Neoriya) 250000.00 250000.00 100.00% 262500.00 117521.00 44.77%
7 Puranpur 250000.00 110179.00 44.07% 787500.00 539715.00 68.54%
8 DH 500000.00 222277.00 44.46%
9 DWH 500000.00 498520.00 99.70%
Total 3000000.00 1755800.00 58.53% 1925000.00 770078.00 40.00%
40
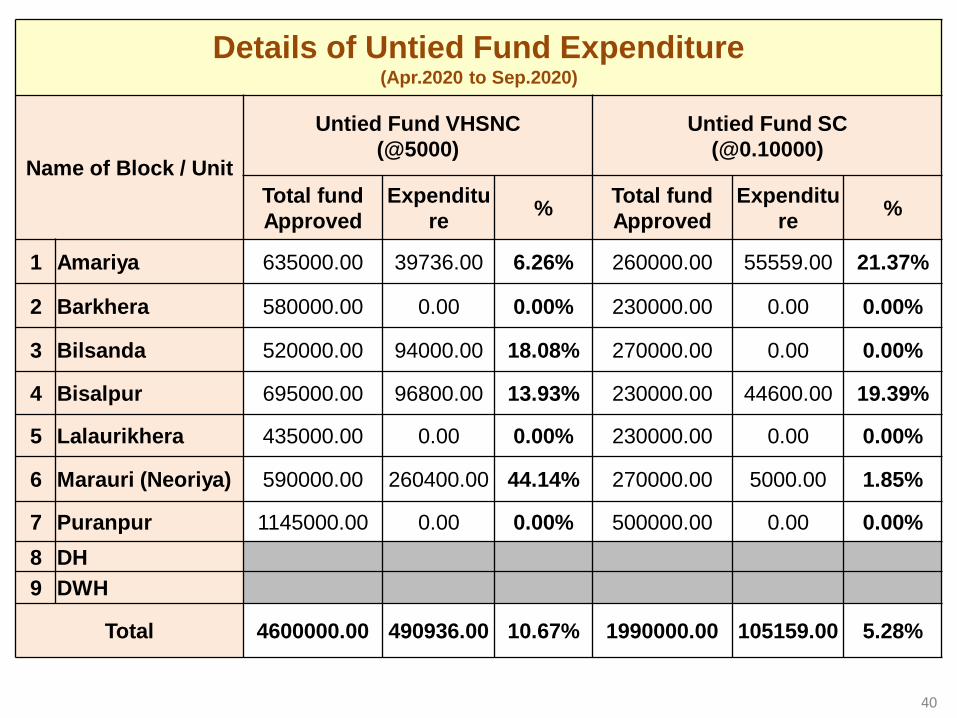
Details of Untied Fund Expenditure
(Apr.2020 to Sep.2020)
Name of Block / Unit
Untied Fund VHSNC
(@5000)
Untied Fund SC
(@0.10000)
Total fund
Approved
Expenditu
re %
Total fund
Approved
Expenditu
re %
1 Amariya 635000.00 39736.00 6.26% 260000.00 55559.00 21.37%
2 Barkhera 580000.00 0.00 0.00% 230000.00 0.00 0.00%
3 Bilsanda 520000.00 94000.00 18.08% 270000.00 0.00 0.00%
4 Bisalpur 695000.00 96800.00 13.93% 230000.00 44600.00 19.39%
5 Lalaurikhera 435000.00 0.00 0.00% 230000.00 0.00 0.00%
6 Marauri (Neoriya) 590000.00 260400.00 44.14% 270000.00 5000.00 1.85%
7 Puranpur 1145000.00 0.00 0.00% 500000.00 0.00 0.00%
8 DH
9 DWH
Total 4600000.00 490936.00 10.67% 1990000.00 105159.00 5.28%
41
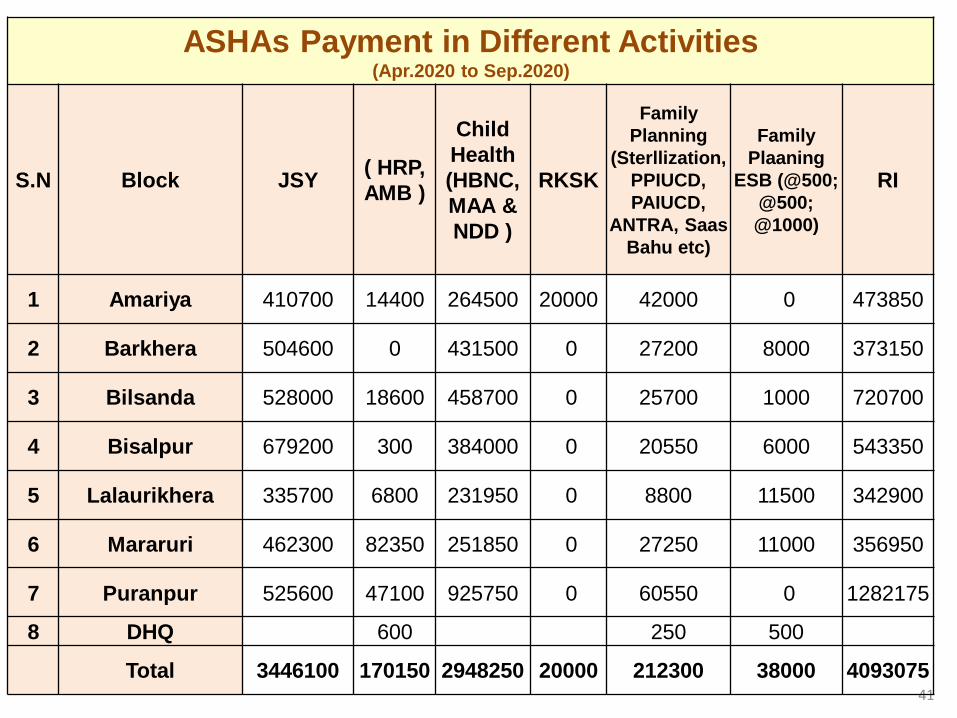
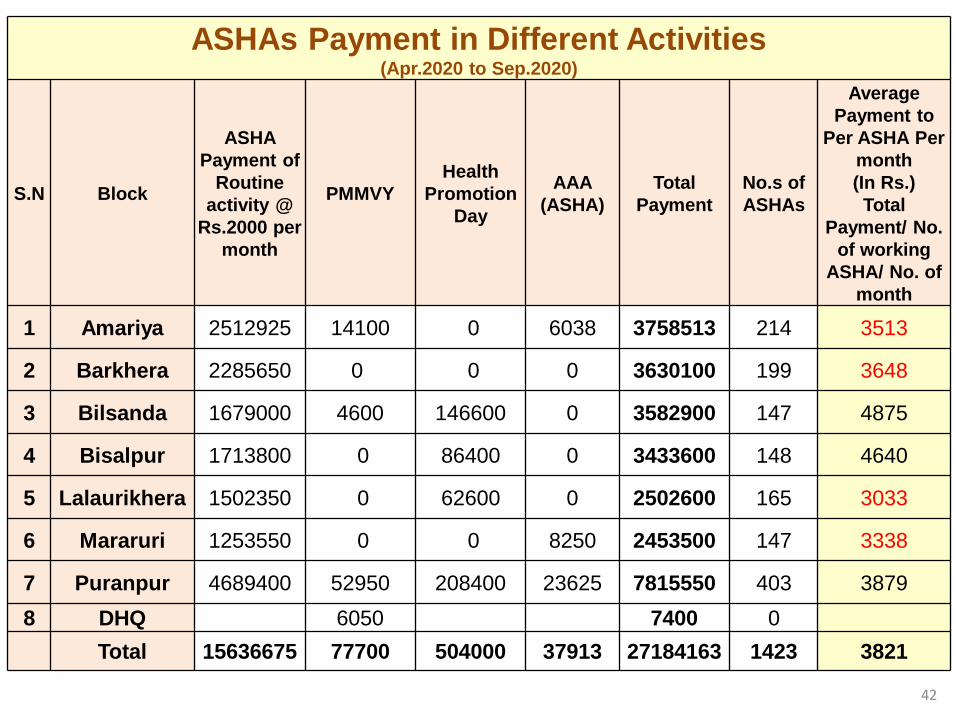
ASHAs Payment in Different Activities (Apr.2020 to Sep.2020)
S.N Block JSY ( HRP,
AMB )
Child
Health
(HBNC,
MAA &
NDD )
RKSK
Family
Planning
(Sterllization,
PPIUCD,
PAIUCD,
ANTRA, Saas
Bahu etc)
Family
Plaaning
ESB (@500;
@500;
@1000)
RI
1 Amariya 410700 14400 264500 20000 42000 0 473850
2 Barkhera 504600 0 431500 0 27200 8000 373150
3 Bilsanda 528000 18600 458700 0 25700 1000 720700
4 Bisalpur 679200 300 384000 0 20550 6000 543350
5 Lalaurikhera 335700 6800 231950 0 8800 11500 342900
6 Mararuri 462300 82350 251850 0 27250 11000 356950
7 Puranpur 525600 47100 925750 0 60550 0 1282175
8 DHQ 600 250 500
Total 3446100 170150 2948250 20000 212300 38000 4093075
42
ASHAs Payment in Different Activities (Apr.2020 to Sep.2020)
S.N Block
ASHA
Payment of
Routine
activity @
Rs.2000 per
month
PMMVY
Health
Promotion
Day
AAA
(ASHA)
Total
Payment
No.s of
ASHAs
Average
Payment to
Per ASHA Per
month
(In Rs.)
Total
Payment/ No.
of working
ASHA/ No. of
month
1 Amariya 2512925 14100 0 6038 3758513 214 3513
2 Barkhera 2285650 0 0 0 3630100 199 3648
3 Bilsanda 1679000 4600 146600 0 3582900 147 4875
4 Bisalpur 1713800 0 86400 0 3433600 148 4640
5 Lalaurikhera 1502350 0 62600 0 2502600 165 3033
6 Mararuri 1253550 0 0 8250 2453500 147 3338
7 Puranpur 4689400 52950 208400 23625 7815550 403 3879
8 DHQ 6050 7400 0
Total 15636675 77700 504000 37913 27184163 1423 3821
43
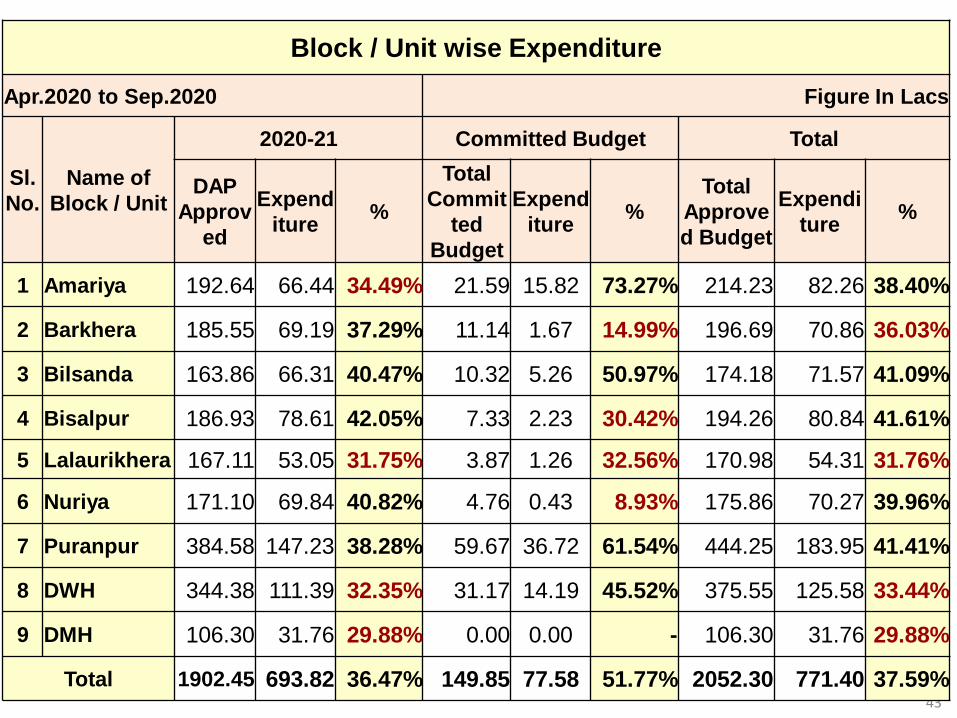
Block / Unit wise Expenditure
Apr.2020 to Sep.2020 Figure In Lacs
Sl.
No.
Name of
Block / Unit
2020-21 Committed Budget Total
DAP
Approv
ed
Expend
iture %
Total
Commit
ted
Budget
Expend
iture %
Total
Approve
d Budget
Expendi
ture %
1 Amariya 192.64 66.44 34.49% 21.59 15.82 73.27% 214.23 82.26 38.40%
2 Barkhera 185.55 69.19 37.29% 11.14 1.67 14.99% 196.69 70.86 36.03%
3 Bilsanda 163.86 66.31 40.47% 10.32 5.26 50.97% 174.18 71.57 41.09%
4 Bisalpur 186.93 78.61 42.05% 7.33 2.23 30.42% 194.26 80.84 41.61%
5 Lalaurikhera 167.11 53.05 31.75% 3.87 1.26 32.56% 170.98 54.31 31.76%
6 Nuriya 171.10 69.84 40.82% 4.76 0.43 8.93% 175.86 70.27 39.96%
7 Puranpur 384.58 147.23 38.28% 59.67 36.72 61.54% 444.25 183.95 41.41%
8 DWH 344.38 111.39 32.35% 31.17 14.19 45.52% 375.55 125.58 33.44%
9 DMH 106.30 31.76 29.88% 0.00 0.00 - 106.30 31.76 29.88%
Total 1902.45 693.82 36.47% 149.85 77.58 51.77% 2052.30 771.40 37.59%

Thank You
44