datashield – new directions and dimensions
TRANSCRIPT

Newcastle University ePrints | eprint.ncl.ac.uk
Wilson RC, Butters OW, Avraam D, Baker J, Tedds JA, Turner A, Murtagh M,
Burton PR. DataSHIELD – New Directions and Dimensions. Data Science
Journal 2017, 16: 21.
DOI link
http://doi.org/10.5334/dsj-2017-021
ePrints link
http://eprint.ncl.ac.uk/pub_details2.aspx?pub_id=238542
Date deposited
01/02/2018
Copyright
© 2017 The Author(s). This is an open-access article distributed under the terms of the
Creative Commons Attribution 4.0 International License (CC-BY 4.0), which permits
unrestricted use, distribution, and reproduction in any medium, provided the original
author and source are credited. See http://creativecommons.org/licenses/by/4.0/.
Licence
This work is licensed under a Creative Commons Attribution 4.0 International License

CODATACODATAIISSUU
Wilson, R C et al 2017 DataSHIELD – New Directions and Dimensions. Data Science Journal, 16: 21, pp. 1–21, DOI: https://doi.org/10.5334/dsj-2017-021
RESEARCH PAPER
DataSHIELD – New Directions and DimensionsRebecca C. Wilson1, Oliver W. Butters1,2, Demetris Avraam1, James Baker3, Jonathan A. Tedds4, Andrew Turner5, Madeleine Murtagh6 and Paul R. Burton1
1 Data To Knowledge research group, Institute of Health and Society, Newcastle University, The Baddiley-Clark Building, Richardson Road, Newcastle upon Tyne, NE2 4AX, UK
2 ALSPAC, School of Social and Community Medicine, University of Bristol, Oakfield House, Oakfield Grove, Bristol BS8 2BN, UK
3 School of History, Art History and Philosophy, University of Sussex, Brighton, BN1 9QN, UK4 Department of Health Sciences, University of Leicester, Centre for Medicine, University Road, Leicester, LE1 7RH, UK5 Data To Knowledge research group, School of Social and Community Medicine, University of Bristol, Oakfield House, Oakfield Grove, Bristol BS8 2BN, UK
6 Data To Knowledge research group, Policy, Ethics and Life Sciences, School of Geography, Politics and Sociology, Newcastle University, 4th Floor Claremont Tower, Newcastle upon Tyne, NE1 7RU, UK
Corresponding author: Rebecca C. Wilson ([email protected])
In disciplines such as biomedicine and social sciences, sharing and combining sensitive individual-level data is often prohibited by ethical-legal or governance constraints and other barriers such as the control of intellectual property or the huge sample sizes. DataSHIELD (Data Aggregation Through Anonymous Summary-statistics from Harmonised Individual-levEL Databases) is a distributed approach that allows the analysis of sensitive individual-level data from one study, and the co-analysis of such data from several studies simultaneously without physically pooling them or disclosing any data.
Following initial proof of principle, a stable DataSHIELD platform has now been implemented in a number of epidemiological consortia. This paper reports three new applications of DataSHIELD including application to post-publication sensitive data analysis, text data analysis and privacy protected data visualisation. Expansion of DataSHIELD analytic functionality and application to additional data types demonstrate the broad applications of the software beyond biomedical sciences.
Keywords: data privacy; sensitive data; distributed data
IntroductionData access and analysis barriers within biomedical and social sciences research can arise for a variety of reasons including: i) ethical-legal restrictions surrounding confidentiality and the sharing of, or access to, disclosive data; ii) intellectual property or licensing issues surrounding research access to raw data; iii) the physical size of the data.
There are three processes by which individual level data (microdata) in biomedical research is typically shared or accessed (Table 1). Under a repository release model data is released to researchers via e.g. (encrypted) hard drives; email; direct download; secure ftp; or utilising cloud sharing and storage systems e.g. Google Drive. However, these release methods may not satisfy privacy, ethical and legal restrictions nor data security concerns associated with these data. In such examples, these risks are mitigated by applying statistical disclosure limitation (Karr and Reiter, 2014, Shlomo et al. 2015) or anonymisation/pseudonymisa-tion methods (Sweeney, 2002; Elliot et al. 2016) to the data prior to repository release.
Under direct access-analysis models, users can analyse data within a closed virtual or physical environment (e.g. a secure analysis platform, data safe haven, virtual machine distributed analysis platform), but may face restrictions on analytic functionality or movement of data and/or outputs outside the environment to prevent disclosure.
Wilson et al: DataSHIELD – New Directions and DimensionsArt. 21, page 2 of 21
DataSHIELD3 has been created to address the additional requirement in the biomedical and social sciences to co-analyse microdata that may be sensitive from different sources, without physically sharing the data (Wolfson et al. 2010; Gaye et al. 2014). It is an infrastructure for distributed analysis that facilitates the direct access-analysis of repository data from multiple studies simultaneously.
The DataSHIELD infrastructure DataSHIELD overviewArchitecturally, DataSHIELD is built as a client-server model, the server contains the individual level data and sits with the data owner. This means it can sit behind the data owner’s firewall, with the data owner maintaining complete control of who is allowed to access the data, and what commands are allowed to operate on the data.
A researcher uses the client to issue requests for DataSHIELD commands to be run on the server. Only if the researcher has been granted permission to run that particular command on that particular data set, will it run. All of the outputs from the server back to the researcher are summary statistics and have to adhere to the disclosure settings set by the data owner (or consortium) and are discussed in depth below (see: DataSHIELD non-disclosure mechanisms). It is this client-server pairing of functions and the built in disclosure controls that sit at the heart of DataSHIELD.
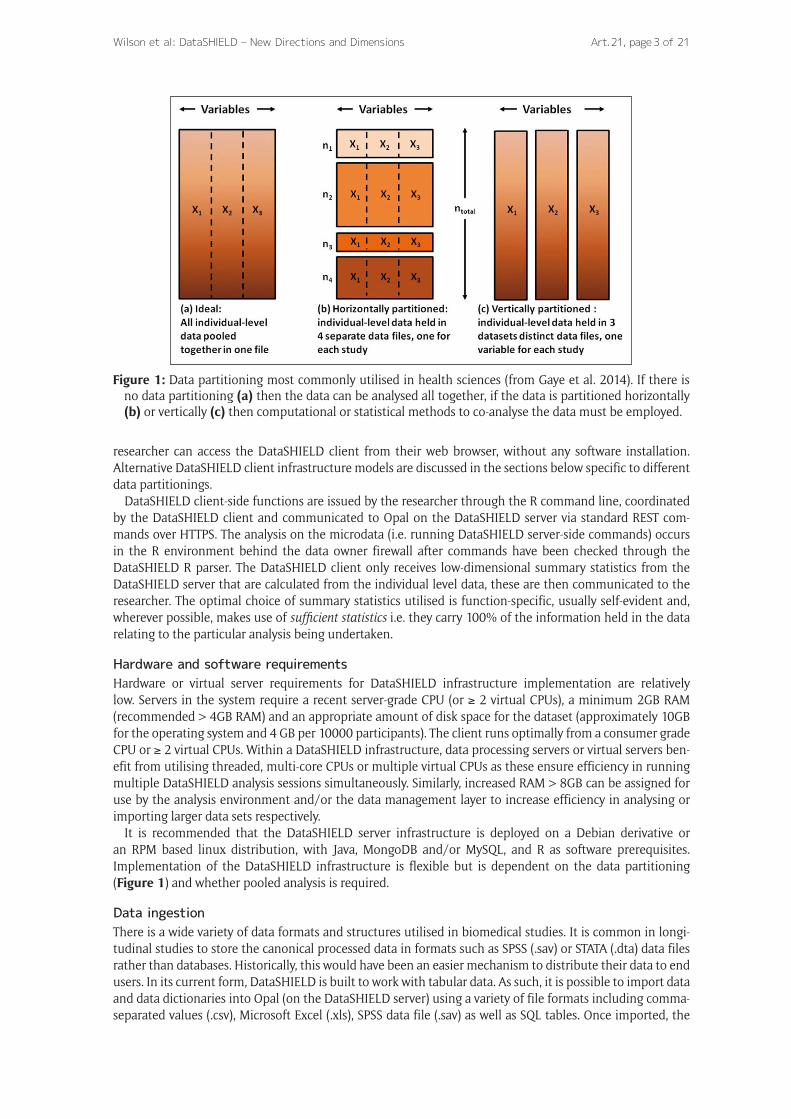
Based on this core modus operandi, DataSHIELD can be run in a variety of different data partition scenar-ios: no data partitioning (single-site DataSHIELD), horizontally partitioned data (multi-site DataSHIELD), and vertically partitioned data. In each case it is important to reiterate that all of the disclosure control works in the same way, regardless of the partitioning structure of the data. Each of these data scenarios is represented in Figure 1, and discussed further in the relevant sections below.
Core DataSHIELD architectureDataSHIELD is built on two pieces of modular and open-source software: the Ranalytic environment (R Core Team, 2015) and the data warehouse Opal.4 For clarity, we refer to the server located behind the data owner’s firewall containing the data as the DataSHIELD server, and the client issuing analysis requests as the DataSHIELD client.
The DataSHIELD server comprises: Opal; a standard R environment preconfigured with the DataSHIELD server-side R packages; and an R parser that only allows DataSHIELD functions and their dependencies to be run. The DataSHIELD client is most commonly deployed as R Studio Server5 with the DataSHIELD client-side R packages (responsible for initiating DataSHIELD server-side functions) also installed. An approved
1 The UK Data Archive – http://www.data-archive.ac.uk. 2 UK Data Service Secure Lab – http://ukdataservice.ac.uk/use-data/secure-lab.aspx. 3 DataSHIELD project – http://www.datashield.ac.uk. 4 The Opal data warehouse software – http://www.obiba.org/pages/products/opal/. 5 R Studio – http://www.rstudio.com.
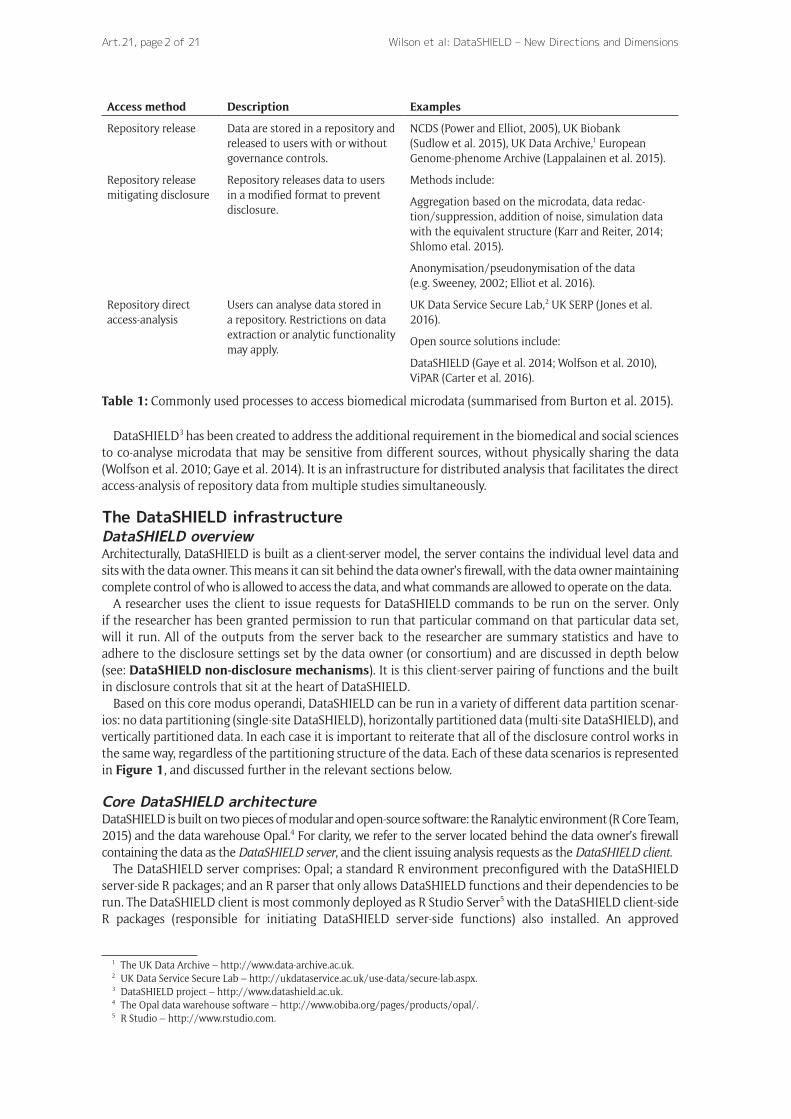
Access method Description Examples
Repository release Data are stored in a repository and released to users with or without governance controls.
NCDS (Power and Elliot, 2005), UK Biobank (Sudlow et al. 2015), UK Data Archive,1 European Genome-phenome Archive (Lappalainen et al. 2015).
Repository release mitigating disclosure
Repository releases data to users in a modified format to prevent disclosure.
Methods include:
Aggregation based on the microdata, data redac-tion/suppression, addition of noise, simulation data with the equivalent structure (Karr and Reiter, 2014; Shlomo etal. 2015).
Anonymisation/pseudonymisation of the data (e.g. Sweeney, 2002; Elliot et al. 2016).
Repository direct access-analysis
Users can analyse data stored in a repository. Restrictions on data extraction or analytic functionality may apply.
UK Data Service Secure Lab,2 UK SERP (Jones et al. 2016).
Open source solutions include:
DataSHIELD (Gaye et al. 2014; Wolfson et al. 2010), ViPAR (Carter et al. 2016).
Table 1: Commonly used processes to access biomedical microdata (summarised from Burton et al. 2015).
Wilson et al: DataSHIELD – New Directions and Dimensions Art. 21, page 3 of 21
researcher can access the DataSHIELD client from their web browser, without any software installation. Alternative DataSHIELD client infrastructure models are discussed in the sections below specific to different data partitionings.
DataSHIELD client-side functions are issued by the researcher through the R command line, coordinated by the DataSHIELD client and communicated to Opal on the DataSHIELD server via standard REST com-mands over HTTPS. The analysis on the microdata (i.e. running DataSHIELD server-side commands) occurs in the R environment behind the data owner firewall after commands have been checked through the DataSHIELD R parser. The DataSHIELD client only receives low-dimensional summary statistics from the DataSHIELD server that are calculated from the individual level data, these are then communicated to the researcher. The optimal choice of summary statistics utilised is function-specific, usually self-evident and, wherever possible, makes use of sufficient statistics i.e. they carry 100% of the information held in the data relating to the particular analysis being undertaken.
Hardware and software requirementsHardware or virtual server requirements for DataSHIELD infrastructure implementation are relatively low. Servers in the system require a recent server-grade CPU (or ≥ 2 virtual CPUs), a minimum 2GB RAM (recommended > 4GB RAM) and an appropriate amount of disk space for the dataset (approximately 10GB for the operating system and 4 GB per 10000 participants). The client runs optimally from a consumer grade CPU or ≥ 2 virtual CPUs. Within a DataSHIELD infrastructure, data processing servers or virtual servers ben-efit from utilising threaded, multi-core CPUs or multiple virtual CPUs as these ensure efficiency in running multiple DataSHIELD analysis sessions simultaneously. Similarly, increased RAM > 8GB can be assigned for use by the analysis environment and/or the data management layer to increase efficiency in analysing or importing larger data sets respectively.
It is recommended that the DataSHIELD server infrastructure is deployed on a Debian derivative or an RPM based linux distribution, with Java, MongoDB and/or MySQL, and R as software prerequisites. Implementation of the DataSHIELD infrastructure is flexible but is dependent on the data partitioning (Figure 1) and whether pooled analysis is required.
Data ingestionThere is a wide variety of data formats and structures utilised in biomedical studies. It is common in longi-tudinal studies to store the canonical processed data in formats such as SPSS (.sav) or STATA (.dta) data files rather than databases. Historically, this would have been an easier mechanism to distribute their data to end users. In its current form, DataSHIELD is built to work with tabular data. As such, it is possible to import data and data dictionaries into Opal (on the DataSHIELD server) using a variety of file formats including comma-separated values (.csv), Microsoft Excel (.xls), SPSS data file (.sav) as well as SQL tables. Once imported, the
Figure 1: Data partitioning most commonly utilised in health sciences (from Gaye et al. 2014). If there is no data partitioning (a) then the data can be analysed all together, if the data is partitioned horizontally (b) or vertically (c) then computational or statistical methods to co-analyse the data must be employed.

Wilson et al: DataSHIELD – New Directions and DimensionsArt. 21, page 4 of 21
data owner can then use the simple Opal web interface to manage their data availability in DataSHIELD, user permissions and define which analyses are allowed to be carried out on the data.
It is worth emphasising that Opal is a data warehouse to facilitate access to the data in this setting. As such only a copy, and not the canonical version, of the data is required. If necessary, it can hold a much reduced data set e.g. with identifiers stripped out, data aggregated up etc. The utility of Opal mitigates against issues around revoking user access and data deletion (e.g. due to withdrawal of consent) as these can be managed centrally.
Single-site DataSHIELD for data without partitioningSingle site DataSHIELD is akin to a secure data enclave allowing the analysis of data from one provider alone (Figure 2). Examples of use include enabling open access to simple descriptive statistics from a rigor-ously governed study and analytic access to sensitive (but not ultra-sensitive) datasets that have been linked through record linkage. Beyond this, single-site DataSHIELD also has applications as a free-ware and low-cost solution to accessing and analysing datasets from individual studies based in low and middle income coun-tries – ensuring that the intellectual property and control of the dataset remains with the study.
In this simple case, the client portal may be located with the data owner alongside the server instance, or with a third-party e.g. the body responsible for governing access. Alternatively, it is possible to allow the researcher to be the DataSHIELD client in the system e.g. to run the DataSHIELD packages locally in R with-out running R Studio Server.
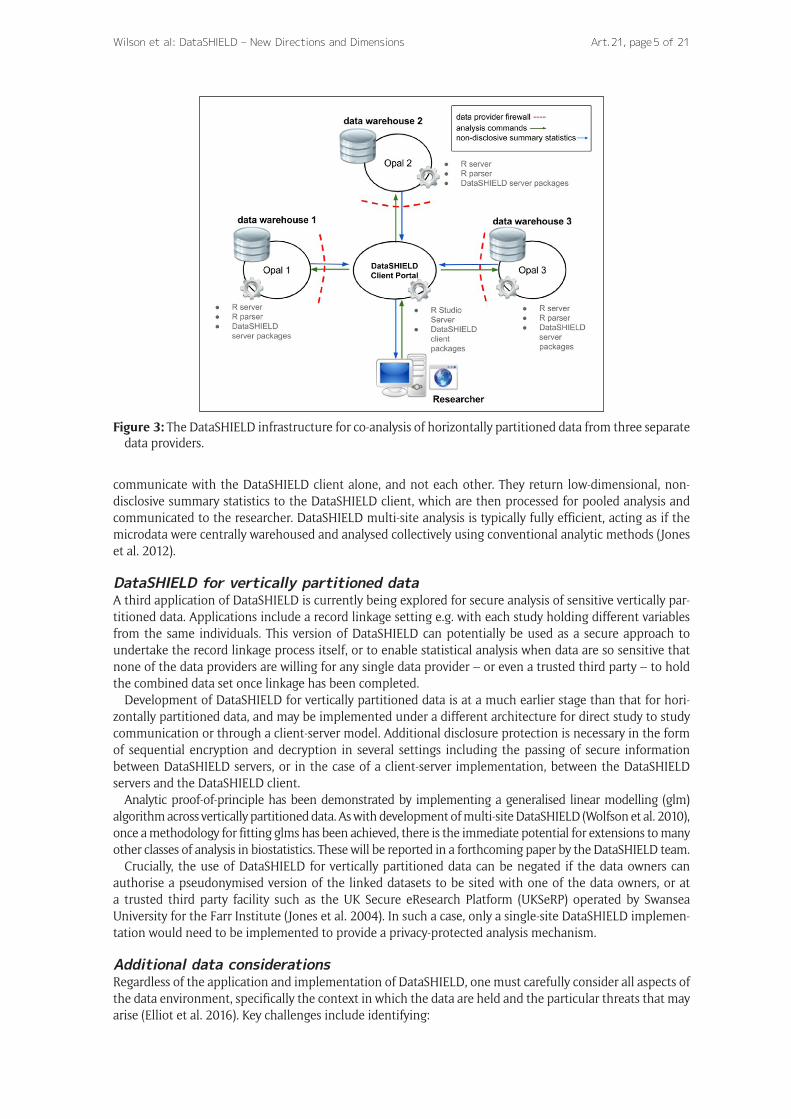
Multi-site DataSHIELD for horizontally partitioned dataTo date, the most common implementation of DataSHIELD is for the co-analysis of harmonised data within a consortium, whereby the data is horizontally partitioned i.e. each study holds the same variables but differ-ent individuals. In this setting, DataSHIELD can be used for secured individual participant data meta-analysis or study-level meta-analysis.
Figure 3 summarises the DataSHIELD infrastructure used in a multi-site instance, with each data owner hosting a DataSHIELD server. Data owners will need to harmonise their variables in order for pooled analy-sis to work. This can be done prior to ingesting their data sets into their respective Opal instances, or new harmonised data sets can be derived from the relevant data already ingested into the Opal instances (Doiron et al. 2015; Fortier et al. 2016).
The DataSHIELD client can sit inside, or separate to, the firewall of any data provider in the consortium – or even at a third party locality such as a national data facility. Functions initiated by the researcher are coordi-nated by the DataSHIELD client for co-analysis across all studies. This process is function dependant and is detailed further in the section below (see: DataSHIELD analytic methodology). The DataSHIELD servers
Figure 2: An example infrastructure for single site DataSHIELD.
Wilson et al: DataSHIELD – New Directions and Dimensions Art. 21, page 5 of 21
communicate with the DataSHIELD client alone, and not each other. They return low-dimensional, non-disclosive summary statistics to the DataSHIELD client, which are then processed for pooled analysis and communicated to the researcher. DataSHIELD multi-site analysis is typically fully efficient, acting as if the microdata were centrally warehoused and analysed collectively using conventional analytic methods (Jones et al. 2012).
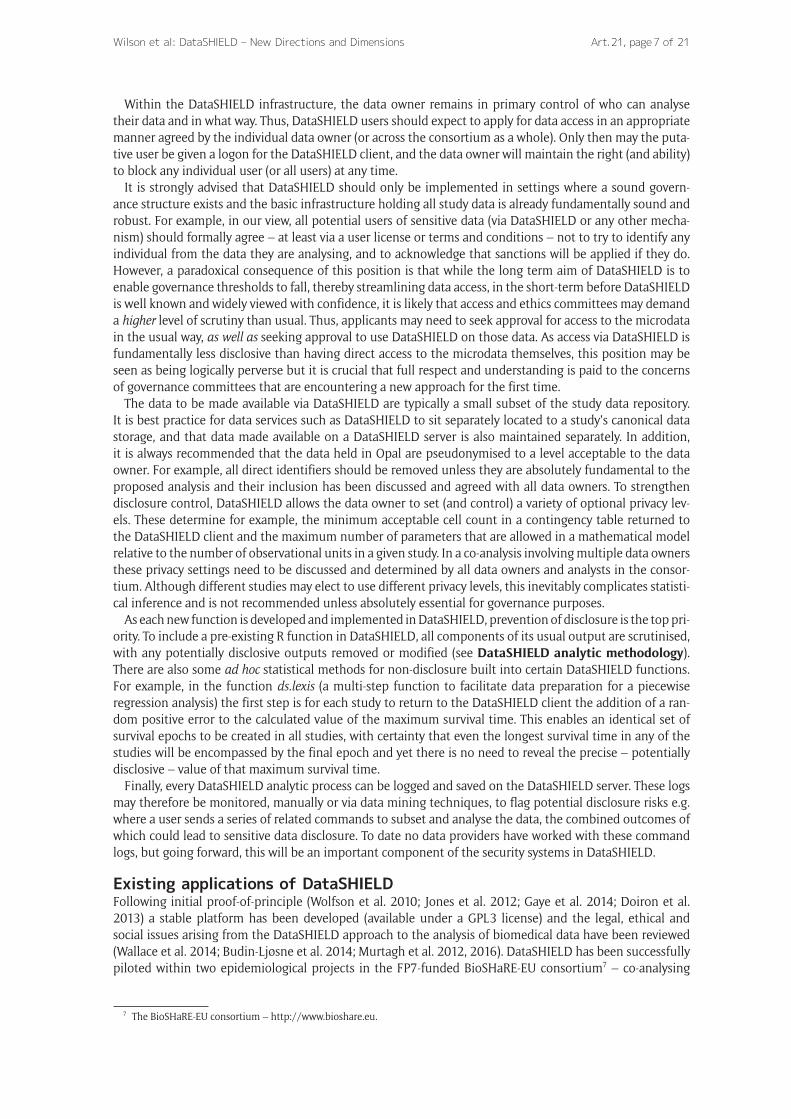
DataSHIELD for vertically partitioned dataA third application of DataSHIELD is currently being explored for secure analysis of sensitive vertically par-titioned data. Applications include a record linkage setting e.g. with each study holding different variables from the same individuals. This version of DataSHIELD can potentially be used as a secure approach to undertake the record linkage process itself, or to enable statistical analysis when data are so sensitive that none of the data providers are willing for any single data provider – or even a trusted third party – to hold the combined data set once linkage has been completed.
Development of DataSHIELD for vertically partitioned data is at a much earlier stage than that for hori-zontally partitioned data, and may be implemented under a different architecture for direct study to study communication or through a client-server model. Additional disclosure protection is necessary in the form of sequential encryption and decryption in several settings including the passing of secure information between DataSHIELD servers, or in the case of a client-server implementation, between the DataSHIELD servers and the DataSHIELD client.
Analytic proof-of-principle has been demonstrated by implementing a generalised linear modelling (glm) algorithm across vertically partitioned data. As with development of multi-site DataSHIELD (Wolfson et al. 2010), once a methodology for fitting glms has been achieved, there is the immediate potential for extensions to many other classes of analysis in biostatistics. These will be reported in a forthcoming paper by the DataSHIELD team.
Crucially, the use of DataSHIELD for vertically partitioned data can be negated if the data owners can authorise a pseudonymised version of the linked datasets to be sited with one of the data owners, or at a trusted third party facility such as the UK Secure eResearch Platform (UKSeRP) operated by Swansea University for the Farr Institute (Jones et al. 2004). In such a case, only a single-site DataSHIELD implemen-tation would need to be implemented to provide a privacy-protected analysis mechanism.
Additional data considerationsRegardless of the application and implementation of DataSHIELD, one must carefully consider all aspects of the data environment, specifically the context in which the data are held and the particular threats that may arise (Elliot et al. 2016). Key challenges include identifying:
Figure 3: The DataSHIELD infrastructure for co-analysis of horizontally partitioned data from three separate data providers.

Wilson et al: DataSHIELD – New Directions and DimensionsArt. 21, page 6 of 21
• a secure location for the data to be held• individuals that should maintain or manage the dataset• a formal governance mechanism for data access via DataSHIELD• optimal rules for disclosure protection• whether contextual rules for disclosure protection are required – this is of particular importance
when using text data.
DataSHIELD analytic methodologyThe DataSHIELD analytic methodology is based on client-server function pairs (Gaye et al. 2014). From the DataSHIELD client the researcher runs DataSHIELD client-side functions, these call DataSHIELD server-side functions to run on the individual level data that only return low dimensional (non-disclosive) outputs, and wherever possible configured as sufficient statistics. For example, for a generalised linear model (glm), the relevant outputs are score vectors and information matrices and the resultant analysis is mathematically identical to placing all of the microdata in a single data warehouse and analysing those data using a standard glm (Jones et al. 2012; Jones et al. 2013).
In principle, any native R function or R package can be implemented in DataSHIELD, but any disclosure risk must be blocked. Some functions can therefore be implemented directly, while others require some components of their output to be changed or removed. For example, unlike the native R glm() function, the DataSHIELD equivalent ds.glm() function will not return regression residuals because they are disclosive. Similarly, the quantileMeanDS function that drives the estimation of means and quantiles will not permit the 0 % or 100 % quantiles to be returned because they are potentially disclosive. We are now developing methods to enable some of these disclosive outputs to be utilised in a non-disclosive manner, rather than blocking them e.g. methods for the glm residuals to be used for regression diagnostics.
Finally, there are some R functions with a primary purpose that is fundamentally disclosive and blocking that disclosure risk would negate the value of the function itself. For example, DataSHIELD cannot include the equivalent of R’s native print() function which lists every element of a designated data object – clearly this would be highly disclosive.
In practice there are three types of DataSHIELD analysis:
• One-step analyses – the client-side function requests non-disclosive output from all data sources e.g. ds.table2D (creates two dimensional contingency table) or ds.quantileMean (generates the mean and selected quantiles for a quantitative variable) (Gaye et al. 2014).
• Multi-step analyses – where the client-side function sequentially calls a number of server-side functions to be run for an analysis e.g. ds.histogram where the first step is to calculate the data bins for the histogram across all servers, and the second step calculates the frequency of each bin at each server.
• Iterative analyses – the DataSHIELD client coordinates parallel processes linked together by non-identifying summary statistics e.g. ds.glm (Wolfson et al. 2010, Jones et al. 2012; Jones et al. 2013; Gaye et al. 2014).
DataSHIELD v.4.06 currently includes approximately 140 client-side/server-side functions comprising core analytic functionality: descriptive statistics (e.g. mean); exploratory statistics (e.g. histogram); contingency tables (e.g. ID and 2D); and modelling (survival analysis using piecewise exponential regression, glm). In addition to these, a number of functions are available for testing in our beta-test branch.
DataSHIELD non-disclosure mechanismsThe DataSHIELD architecture itself subsumes numerous measures aimed at mitigating the risk of sensitive data disclosure. These include that: microdata analysis occurs only behind the firewall at each data pro-vider; typically each DataSHIELD server communicates solely with a single DataSHIELD client with a fixed IP address; the DataSHIELD client authenticates with the DataSHIELD server(s) using SSL certificates, with communications via secure web services (REST over HTTPS); each DataSHIELD server contains an R parser configured to permit DataSHIELD approved functions – with approved arguments – to be run on it. For example, the parser will block text strings as they may contain requests to active subroutines.
6 The DataSHIELD software repository – http://www.githun.com/datashield.
Wilson et al: DataSHIELD – New Directions and Dimensions Art. 21, page 7 of 21
Within the DataSHIELD infrastructure, the data owner remains in primary control of who can analyse their data and in what way. Thus, DataSHIELD users should expect to apply for data access in an appropriate manner agreed by the individual data owner (or across the consortium as a whole). Only then may the puta-tive user be given a logon for the DataSHIELD client, and the data owner will maintain the right (and ability) to block any individual user (or all users) at any time.
It is strongly advised that DataSHIELD should only be implemented in settings where a sound govern-ance structure exists and the basic infrastructure holding all study data is already fundamentally sound and robust. For example, in our view, all potential users of sensitive data (via DataSHIELD or any other mecha-nism) should formally agree – at least via a user license or terms and conditions – not to try to identify any individual from the data they are analysing, and to acknowledge that sanctions will be applied if they do. However, a paradoxical consequence of this position is that while the long term aim of DataSHIELD is to enable governance thresholds to fall, thereby streamlining data access, in the short-term before DataSHIELD is well known and widely viewed with confidence, it is likely that access and ethics committees may demand a higher level of scrutiny than usual. Thus, applicants may need to seek approval for access to the microdata in the usual way, as well as seeking approval to use DataSHIELD on those data. As access via DataSHIELD is fundamentally less disclosive than having direct access to the microdata themselves, this position may be seen as being logically perverse but it is crucial that full respect and understanding is paid to the concerns of governance committees that are encountering a new approach for the first time.
The data to be made available via DataSHIELD are typically a small subset of the study data repository. It is best practice for data services such as DataSHIELD to sit separately located to a study’s canonical data storage, and that data made available on a DataSHIELD server is also maintained separately. In addition, it is always recommended that the data held in Opal are pseudonymised to a level acceptable to the data owner. For example, all direct identifiers should be removed unless they are absolutely fundamental to the proposed analysis and their inclusion has been discussed and agreed with all data owners. To strengthen disclosure control, DataSHIELD allows the data owner to set (and control) a variety of optional privacy lev-els. These determine for example, the minimum acceptable cell count in a contingency table returned to the DataSHIELD client and the maximum number of parameters that are allowed in a mathematical model relative to the number of observational units in a given study. In a co-analysis involving multiple data owners these privacy settings need to be discussed and determined by all data owners and analysts in the consor-tium. Although different studies may elect to use different privacy levels, this inevitably complicates statisti-cal inference and is not recommended unless absolutely essential for governance purposes.
As each new function is developed and implemented in DataSHIELD, prevention of disclosure is the top pri-ority. To include a pre-existing R function in DataSHIELD, all components of its usual output are scrutinised, with any potentially disclosive outputs removed or modified (see DataSHIELD analytic methodology). There are also some ad hoc statistical methods for non-disclosure built into certain DataSHIELD functions. For example, in the function ds.lexis (a multi-step function to facilitate data preparation for a piecewise regression analysis) the first step is for each study to return to the DataSHIELD client the addition of a ran-dom positive error to the calculated value of the maximum survival time. This enables an identical set of survival epochs to be created in all studies, with certainty that even the longest survival time in any of the studies will be encompassed by the final epoch and yet there is no need to reveal the precise – potentially disclosive – value of that maximum survival time.
Finally, every DataSHIELD analytic process can be logged and saved on the DataSHIELD server. These logs may therefore be monitored, manually or via data mining techniques, to flag potential disclosure risks e.g. where a user sends a series of related commands to subset and analyse the data, the combined outcomes of which could lead to sensitive data disclosure. To date no data providers have worked with these command logs, but going forward, this will be an important component of the security systems in DataSHIELD.
Existing applications of DataSHIELDFollowing initial proof-of-principle (Wolfson et al. 2010; Jones et al. 2012; Gaye et al. 2014; Doiron et al. 2013) a stable platform has been developed (available under a GPL3 license) and the legal, ethical and social issues arising from the DataSHIELD approach to the analysis of biomedical data have been reviewed (Wallace et al. 2014; Budin-Ljøsne et al. 2014; Murtagh et al. 2012, 2016). DataSHIELD has been successfully piloted within two epidemiological projects in the FP7-funded BioSHaRE-EU consortium7 – co-analysing
7 The BioSHaRE-EU consortium – http://www.bioshare.eu.
Wilson et al: DataSHIELD – New Directions and DimensionsArt. 21, page 8 of 21
phenotypic data from separately located European biobanks investigating i) healthy obesity comprising 10 biobanks with 99 phenotypic variables (Gaye et al. 2014) and ii) the effect of environmental determinants on health comprising five biobanks with 51 phenotypic variables and 14 environmental variables extracted from exposure models (Cai et al. 2016; Zijlema et al. 2016).
A number of consortia are now in the process of implementing multi-site DataSHIELD in order to co-analyse harmonised horizontally partitioned data relating to nutrition (ENPADASI),8 diabetes (Interconnect)9 and intra-uterine determinants of child health and development and perinatal health services in Quebec and Shanghai, China (SPIRIT).10 Further interest in DataSHIELD has stemmed from a requirement to analyse: geospatial data linked to health data, national clinical audit datasets and commercially sensitive datasets.
Current DataSHIELD prototyping and integrationIncreasing DataSHIELD functionality will facilitate its sustainability and broader use beyond biomedical research. Three distinct areas currently prototyped and discussed below are: applications in post-publication data access, text analysis and data visualisation.
Post-publication data accessThe open science trend is seeing more funders and publishers requiring datasets underpinning biomedical research to be published alongside academic papers, or to be accessible for reuse by researchers (Boulton et al. 2011; Ross and Krumholz, 2013). Overall this encourages research and peer review transparency as well as encouraging reproducibility and data reuse (Kratz and Strasser, 2014). Difficulties in making sensitive datasets available in this way can arise from legal, ethical and governance concerns related to data privacy and security. Presently, any researcher wanting to replicate a published analysis would have to complete the data access request for each study/studies to gain access to the microdata used in an article. The current lack of ubiquity of DOIs for data extracts from repositories also means that there is no way of guaranteeing a request for the same data will yield an identical dataset. This has obvious implications for reproducibility.
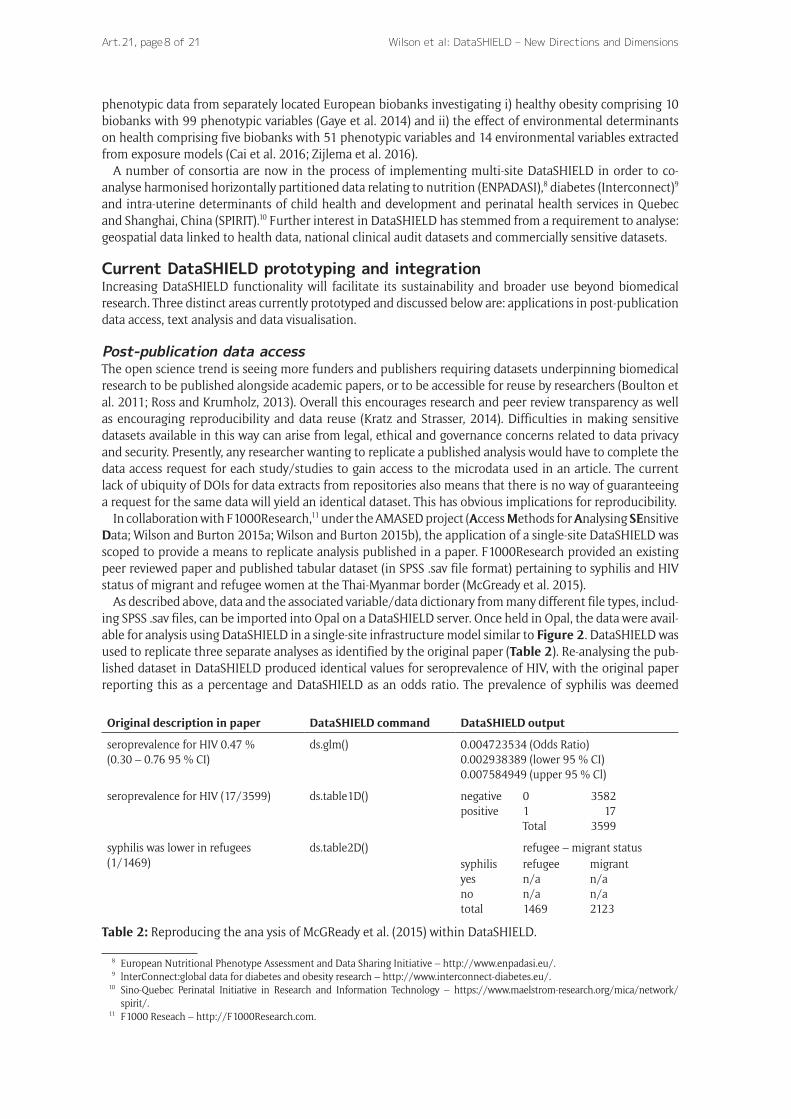
In collaboration with F1000Research,11 under the AMASED project (Access Methods for Analysing SEnsitive Data; Wilson and Burton 2015a; Wilson and Burton 2015b), the application of a single-site DataSHIELD was scoped to provide a means to replicate analysis published in a paper. F1000Research provided an existing peer reviewed paper and published tabular dataset (in SPSS .sav file format) pertaining to syphilis and HIV status of migrant and refugee women at the Thai-Myanmar border (McGready et al. 2015).
As described above, data and the associated variable/data dictionary from many different file types, includ-ing SPSS .sav files, can be imported into Opal on a DataSHIELD server. Once held in Opal, the data were avail-able for analysis using DataSHIELD in a single-site infrastructure model similar to Figure 2. DataSHIELD was used to replicate three separate analyses as identified by the original paper (Table 2). Re-analysing the pub-lished dataset in DataSHIELD produced identical values for seroprevalence of HIV, with the original paper reporting this as a percentage and DataSHIELD as an odds ratio. The prevalence of syphilis was deemed
8 European Nutritional Phenotype Assessment and Data Sharing Initiative – http://www.enpadasi.eu/. 9 lnterConnect:global data for diabetes and obesity research – http://www.interconnect-diabetes.eu/. 10 Sino-Quebec Perinatal Initiative in Research and Information Technology – https://www.maelstrom-research.org/mica/network/
spirit/. 11 F1000 Reseach – http://F1000Research.com.
Original description in paper DataSHIELD command DataSHIELD output
seroprevalence for HIV 0.47 % (0.30 – 0.76 95 % CI)
ds.glm() 0.004723534 (Odds Ratio) 0.002938389 (lower 95 % CI) 0.007584949 (upper 95 % Cl)
seroprevalence for HIV (17/3599) ds.table1D() negative positive
01Total
358217
3599
syphilis was lower in refugees (1/1469)
ds.table2D() refugee – migrant statussyphilisyesnototal
refugeen/an/a1469
migrantn/an/a2123
Table 2: Reproducing the ana ysis of McGReady et al. (2015) within DataSHIELD.

Wilson et al: DataSHIELD – New Directions and Dimensions Art. 21, page 9 of 21
invalid in the DataSHIELD analysis, as data from less than five participants was returned in the result and the privacy level for the minimum cell count in a contingency table was, at that time, set by default at five. In discussion between the journal, authors and data owners, there is no reason that the relevant privacy level could not be relaxed to three (the current default) or even to one (no restriction on minimum cell count). The latter setting may rationally be determined appropriate for studying a rare condition where low cell counts can be so common that any attempt to block them so hinders the scientific analysis. In such a case, a decision has to be taken that balances the small and uncertain risk that a significant disclosure event may occur, against the ‘damage’ to scientific knowledge and the broader interests of society as a whole of prohib-iting the analysis from taking place at all.
Applying DataSHIELD in academic publishingThe proposed implementation of DataSHIELD within academic publishing is intended to facilitate replica-tion of analysis – and not new analysis – in the paper, through a restriction of DataSHIELD functionality (i.e. only a subset of functions would be available to run on the dataset in order to replicate the analysis). This is necessary when articles are published based on data from studies that have their own immutable legal or governance constraints that mandate formal oversight of full data access and new analysis provision e.g. most of the UK’s major cohort studies, biomedical studies and other sensitive datasets.
F1000Research already facilitate the publishing (with DOIs) of ‘Data Notes’ to describe new datasets and implement methods to cite and access data from their publications e.g. via direct download from the paper; data citation from the paper; data availability statement which can include a DOI or link to an external data source (e.g. figshare,12 national research data repositories etc). When revisions of a paper, or the data within the paper, occur these can be clearly identified in subsequent paper versions by the author(s) and given a new (but related) DOI. Working within the existing data and publication versioning framework of F1000Research it would be possible to manage, and make available, multiple versions of a dataset within the DataSHIELD infrastructure, for example through the hierarchical naming of data tables imported into Opal. In this way, a reader could re-analyse in DataSHIELD the version of a data set associated with a version of a paper, however it is critical to provide transparency to the reader about these details.
We have demonstrated the utility of single-site DataSHIELD (with a single data source) in the context of post-publication data access. It provides a mechanism to fulfill the increasing requirements by research funders to make data more accessible, and can facilitate readers and reviewers to flexibly explore the data sets underpinning published articles without having physical access to the raw microdata. Further engage-ment with data owners, however, is required to ensure synchronicity of DataSHIELD post-publication data access with their own data governance processes.
Structured text dataThe back end infrastructure and compatibility of structured text analysis within DataSHIELD have been scoped within two seed funded projects: AMASED (Wilson and Burton 2015a; Wilson and Burton 2015b) and BRISSKit13 (Butters et al. 2016).
Under AMASED, a DataSHIELD approach was scoped for application to digitised text held by the British Library. The British Library holds tens of thousands of digitised books, hundreds of thousands of digitised newspaper pages, and billions of web pages. Each month the library’s digital and digitised collection of text, image and audio-visual material grows by 6.8 terabytes (British Library Report, 2015). Many of these digitised materials are available to researchers as open data, however some are only available under license. The license used for each item stems from the copyright status of, and licensing agreements relating to, the digitised material. Some licenses limit researchers to analysing the data hosted onsite at the British Library or to only view/analyse a percentage of the data.
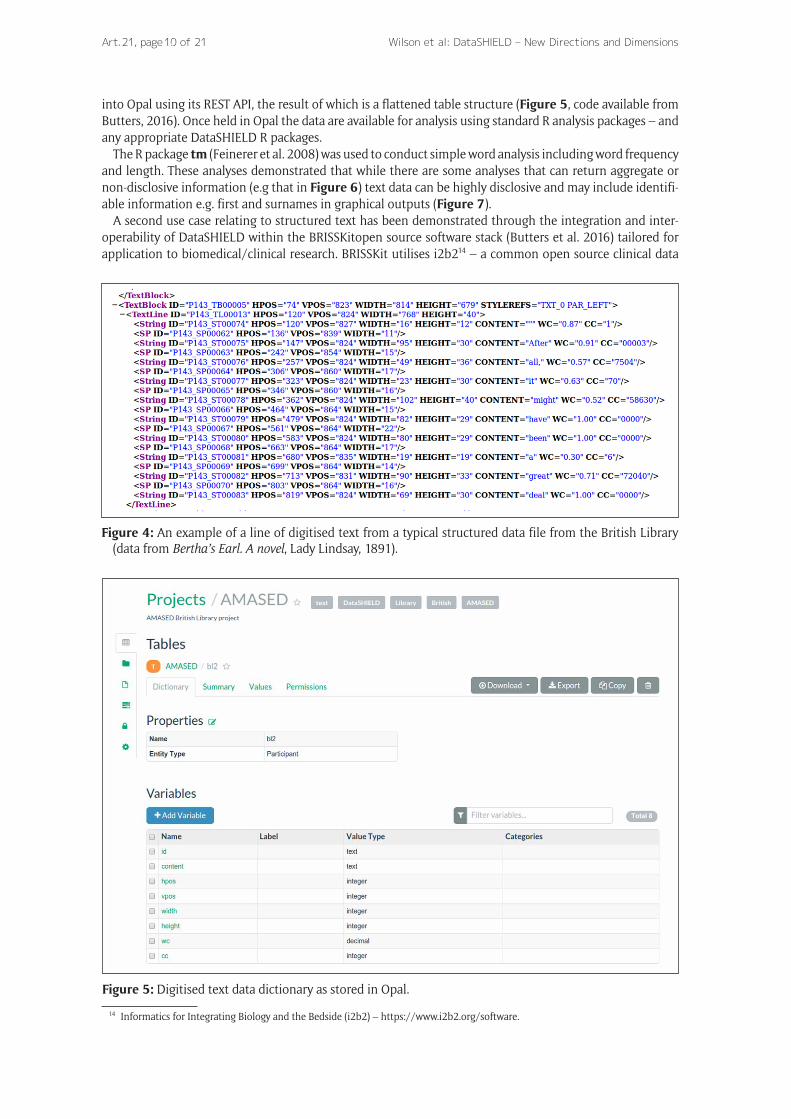
A test dataset of ~15,000 openly available digitised books was used in this scoping exercise. Each digitised book was a collection of well structured XML files, following the ALTO (open XML) schema. Each digitised book page was represented by an XML file, with each row of the XML file comprising one word and its meta-data (Figure 4). This standardised format meant that a table could be generated in Opal to hold the data, with the relevant data types. This was achieved by using the Opal REST API to automatically build a table for each book. Each page was then iterated through, extracting the data from the XML and importing it
12 Figshare – http://figshare.com. 13 Biomedical Research Software as a Service Kit – http://www.brisskit.le.ac.uk.
Wilson et al: DataSHIELD – New Directions and DimensionsArt. 21, page 10 of 21
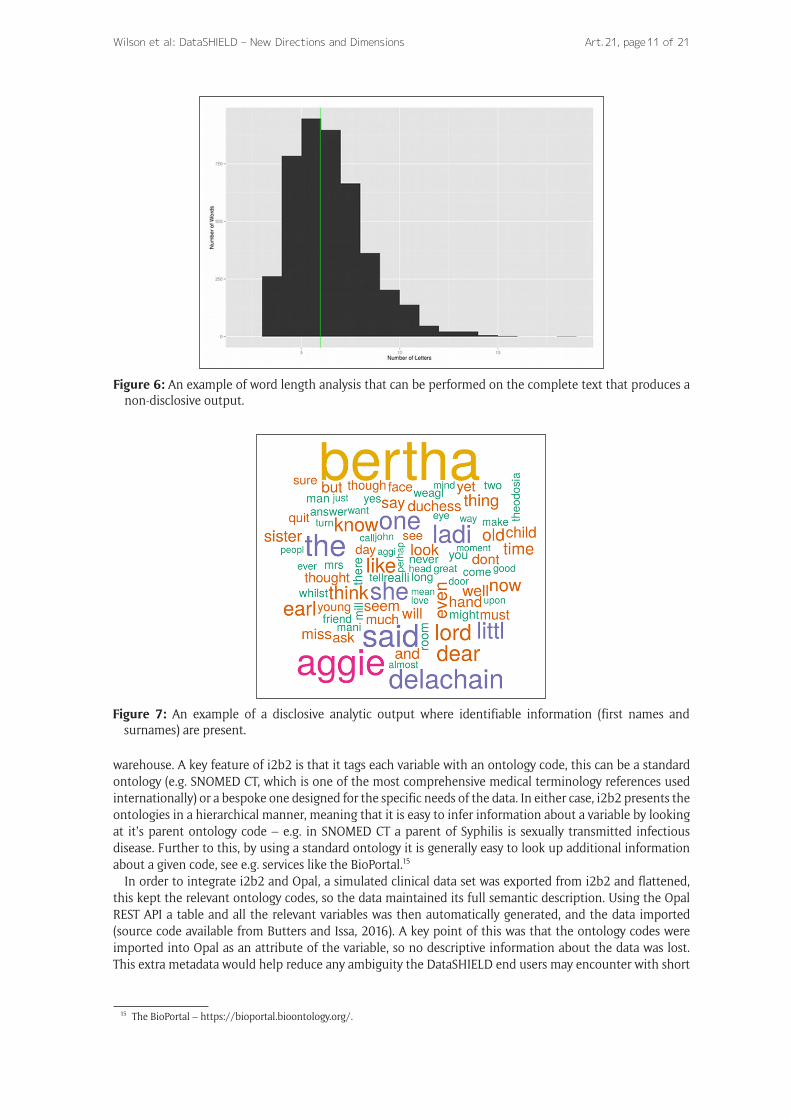
into Opal using its REST API, the result of which is a flattened table structure (Figure 5, code available from Butters, 2016). Once held in Opal the data are available for analysis using standard R analysis packages – and any appropriate DataSHIELD R packages.
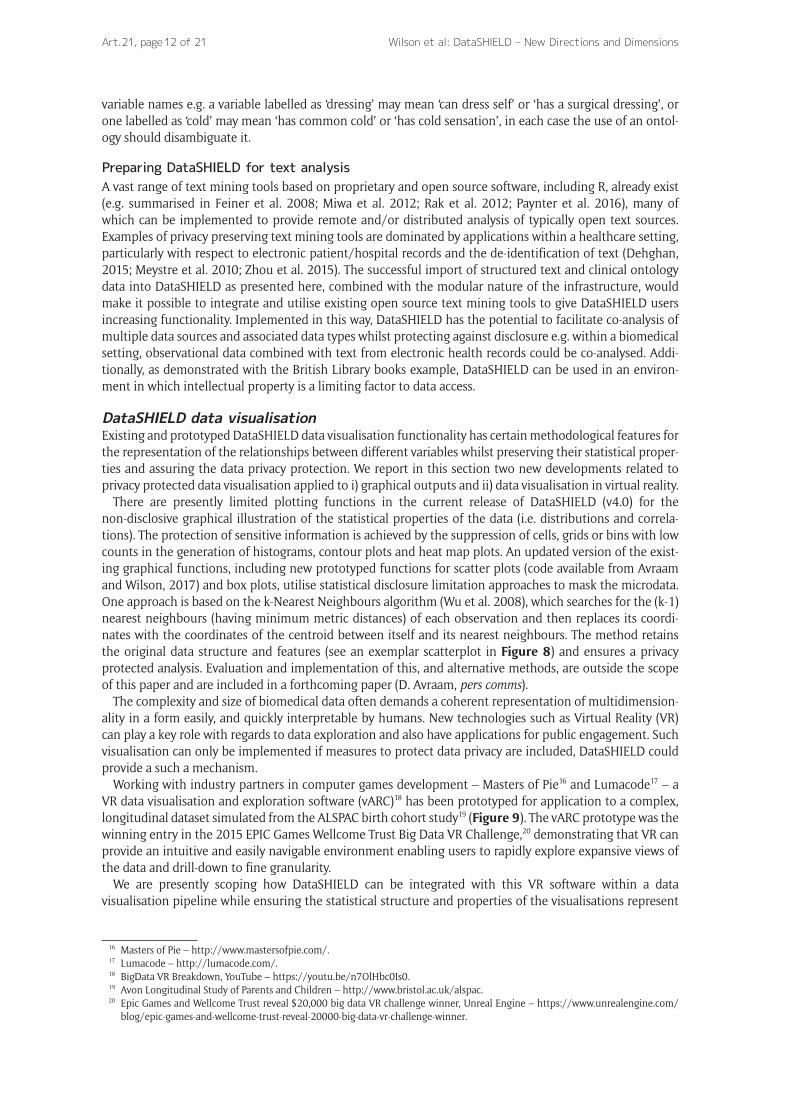
The R package tm (Feinerer et al. 2008) was used to conduct simple word analysis including word frequency and length. These analyses demonstrated that while there are some analyses that can return aggregate or non-disclosive information (e.g that in Figure 6) text data can be highly disclosive and may include identifi-able information e.g. first and surnames in graphical outputs (Figure 7).
A second use case relating to structured text has been demonstrated through the integration and inter-operability of DataSHIELD within the BRISSKitopen source software stack (Butters et al. 2016) tailored for application to biomedical/clinical research. BRISSKit utilises i2b214 – a common open source clinical data
14 Informatics for Integrating Biology and the Bedside (i2b2) – https://www.i2b2.org/software.
Figure 4: An example of a line of digitised text from a typical structured data file from the British Library (data from Bertha’s Earl. A novel, Lady Lindsay, 1891).
Figure 5: Digitised text data dictionary as stored in Opal.
Wilson et al: DataSHIELD – New Directions and Dimensions Art. 21, page 11 of 21
warehouse. A key feature of i2b2 is that it tags each variable with an ontology code, this can be a standard ontology (e.g. SNOMED CT, which is one of the most comprehensive medical terminology references used internationally) or a bespoke one designed for the specific needs of the data. In either case, i2b2 presents the ontologies in a hierarchical manner, meaning that it is easy to infer information about a variable by looking at it’s parent ontology code – e.g. in SNOMED CT a parent of Syphilis is sexually transmitted infectious disease. Further to this, by using a standard ontology it is generally easy to look up additional information about a given code, see e.g. services like the BioPortal.15
In order to integrate i2b2 and Opal, a simulated clinical data set was exported from i2b2 and flattened, this kept the relevant ontology codes, so the data maintained its full semantic description. Using the Opal REST API a table and all the relevant variables was then automatically generated, and the data imported (source code available from Butters and Issa, 2016). A key point of this was that the ontology codes were imported into Opal as an attribute of the variable, so no descriptive information about the data was lost. This extra metadata would help reduce any ambiguity the DataSHIELD end users may encounter with short
15 The BioPortal – https://bioportal.bioontology.org/.
Figure 6: An example of word length analysis that can be performed on the complete text that produces a non-disclosive output.
Figure 7: An example of a disclosive analytic output where identifiable information (first names and surnames) are present.
Wilson et al: DataSHIELD – New Directions and DimensionsArt. 21, page 12 of 21
variable names e.g. a variable labelled as ‘dressing’ may mean ‘can dress self’ or ‘has a surgical dressing’, or one labelled as ‘cold’ may mean ‘has common cold’ or ‘has cold sensation’, in each case the use of an ontol-ogy should disambiguate it.
Preparing DataSHIELD for text analysisA vast range of text mining tools based on proprietary and open source software, including R, already exist (e.g. summarised in Feiner et al. 2008; Miwa et al. 2012; Rak et al. 2012; Paynter et al. 2016), many of which can be implemented to provide remote and/or distributed analysis of typically open text sources. Examples of privacy preserving text mining tools are dominated by applications within a healthcare setting, particularly with respect to electronic patient/hospital records and the de-identification of text (Dehghan, 2015; Meystre et al. 2010; Zhou et al. 2015). The successful import of structured text and clinical ontology data into DataSHIELD as presented here, combined with the modular nature of the infrastructure, would make it possible to integrate and utilise existing open source text mining tools to give DataSHIELD users increasing functionality. Implemented in this way, DataSHIELD has the potential to facilitate co-analysis of multiple data sources and associated data types whilst protecting against disclosure e.g. within a biomedical setting, observational data combined with text from electronic health records could be co-analysed. Addi-tionally, as demonstrated with the British Library books example, DataSHIELD can be used in an environ-ment in which intellectual property is a limiting factor to data access.
DataSHIELD data visualisationExisting and prototyped DataSHIELD data visualisation functionality has certain methodological features for the representation of the relationships between different variables whilst preserving their statistical proper-ties and assuring the data privacy protection. We report in this section two new developments related to privacy protected data visualisation applied to i) graphical outputs and ii) data visualisation in virtual reality.
There are presently limited plotting functions in the current release of DataSHIELD (v4.0) for the non-disclosive graphical illustration of the statistical properties of the data (i.e. distributions and correla-tions). The protection of sensitive information is achieved by the suppression of cells, grids or bins with low counts in the generation of histograms, contour plots and heat map plots. An updated version of the exist-ing graphical functions, including new prototyped functions for scatter plots (code available from Avraam and Wilson, 2017) and box plots, utilise statistical disclosure limitation approaches to mask the microdata. One approach is based on the k-Nearest Neighbours algorithm (Wu et al. 2008), which searches for the (k-1) nearest neighbours (having minimum metric distances) of each observation and then replaces its coordi-nates with the coordinates of the centroid between itself and its nearest neighbours. The method retains the original data structure and features (see an exemplar scatterplot in Figure 8) and ensures a privacy protected analysis. Evaluation and implementation of this, and alternative methods, are outside the scope of this paper and are included in a forthcoming paper (D. Avraam, pers comms).
The complexity and size of biomedical data often demands a coherent representation of multidimension-ality in a form easily, and quickly interpretable by humans. New technologies such as Virtual Reality (VR) can play a key role with regards to data exploration and also have applications for public engagement. Such visualisation can only be implemented if measures to protect data privacy are included, DataSHIELD could provide a such a mechanism.
Working with industry partners in computer games development – Masters of Pie16 and Lumacode17 – a VR data visualisation and exploration software (vARC)18 has been prototyped for application to a complex, longitudinal dataset simulated from the ALSPAC birth cohort study19 (Figure 9). The vARC prototype was the winning entry in the 2015 EPIC Games Wellcome Trust Big Data VR Challenge,20 demonstrating that VR can provide an intuitive and easily navigable environment enabling users to rapidly explore expansive views of the data and drill-down to fine granularity.
We are presently scoping how DataSHIELD can be integrated with this VR software within a data visualisation pipeline while ensuring the statistical structure and properties of the visualisations represent
16 Masters of Pie – http://www.mastersofpie.com/. 17 Lumacode – http://lumacode.com/. 18 BigData VR Breakdown, YouTube – https://youtu.be/n7OlHbc0Is0. 19 Avon Longitudinal Study of Parents and Children – http://www.bristol.ac.uk/alspac. 20 Epic Games and Wellcome Trust reveal $20,000 big data VR challenge winner, Unreal Engine – https://www.unrealengine.com/
blog/epic-games-and-wellcome-trust-reveal-20000-big-data-vr-challenge-winner.

Wilson et al: DataSHIELD – New Directions and Dimensions Art. 21, page 13 of 21
Figure 8: Scatterplot of variables x and y. The circles indicate the coordinates of original variables x and y and the solid trend line shows their positive correlation. The crosses are the centroids of each three nearest neighbours of the original data points which generate a non-disclosive scatter plot created by DataSHIELD method. The dashed trend line shows the correlation of those centroids.
Figure 9: Two dimensional representation of the prototype data exploration interface (vARC) in virtual reality applied to simulated ALSPAC data (courtesy Masters of Pie, Lumacode).
Wilson et al: DataSHIELD – New Directions and DimensionsArt. 21, page 14 of 21
the microdata without disclosure. We also hold interests in applying the prototyped DataSHIELD privacy protected graphical visualisation methodologies described above to the VR environment.
DataSHIELD applications for data visualisationDisclosure control in graphical outputs utilising sensitive biomedical data is usually mitigated by analysis restrictions placed in the terms and conditions of data use. Measures may include the agreement that no plots can be created, plots are not allowed to be published or that plots can not be taken away by the researcher. In cases where analysts are allowed to prepare plots, it must not be possible to reconstruct the graphic without access to the microdata (Hundepool et al. 2012). Present developments of privacy preserv-ing graphical functionality are based on statistical disclosure limitation (Karr and Reiter, 2014; Shlomo et al. 2015) or secure multi-party computation (Yuan et al. 2015) approaches. The DataSHIELD prototype scatter plot function described above is based on a statistical disclosure limitation approach and can be imple-mented in DataSHIELD.
VR software is currently dominated by applications for entertainment and gaming purposes. Existing business or research data visualisation applications tend to be focussed on exploiting the VR environment for representation of spatial data such as engineering drawings, structures and mapping (Berg and Vance, 2016; Boulos et al. 2017; Sastry and Boyd, 1998; Seth et al. 2011). Within health and medical sciences VR is used for predominantly therapeutic or rehabilitation applications (e.g. after stroke), typically utilising spatial information (Howard et al. 2017; Iruthayarajah et al. 2017). VR for visual analytics still sits in a very niche area of applications, with just a few limited examples outside our own developments existing in the literature (Coffey et al. 2011; Donalek et al. 2014) and industry.21 This is reflective of the challenges that exist in this area that include: balancing the availability of cost effective and efficient computing resource; combining methods for big data processing and analysis; exploiting the VR environment for representation of multidimensional data; and overcoming the limitations of human perception and cognition to facilitate human interaction with virtual objects (Olshannikova et al. 2015).
Rapid technological development has vastly increased the scale and complexity of data routinely collected in biomedical studies. To optimise return on scientific investment, such data must be readily discoverable and accessible, placing a high value on rapid, intuitive ways to visualise data. Combined with DataSHIELD, emerging VR technologies can undoubtedly provide a powerful way to discover, explore and interpret big and complex data whilst maintaining data privacy.
Discussion Alternative approachesAs a result of the associated legal, ethical and governance restrictions surrounding the use and sharing of biomedical and health data, access to analyse these data is often via either a closed secure platform (e.g. a data safe haven) to which data are imported for researchers to use (but are unable to remove or download any data from), or a distributed analysis network.
Within the UK, the Secure Anonymous Information Linkage (SAIL) system and the Scottish Health Informatics Programme (SHIP) are examples of data safe havens that enable approved researchers to remotely analyse anonymised/pseudonymised microdata and linked Welsh and Scottish health records, respectively, without the researchers downloading the original data itself or removing data from the environment (Ford et al. 2009; Lyons et al. 2009; SHIP Report, 2012). NHS Digital provides access to national data from the UK National Health Service and provides a registry of safe havens22 through which researchers can connect to and analyse these data. Examples from other countries include the Australian SURE project23 and the NIH funded iDASH project that has created tools for secure data access, data analysis and privacy-preserving data sharing (Ohno-Machado et al. 2012).
Alternative approaches for the analysis of population health studies and health data based on distributed database networks have been developed using both proprietary (e.g. Brown et al. 2010a; Brown et al. 2010b) and open source software (e.g. Carter et al. 2016; Narasimhan et al. 2017). The Canadian Network for Observational Drug Effect Studies (CNODES, Suissa et al. 2012) and Mini-Sentinel (a safety surveillance system developed by the U.S. Food and Drugs Administration, Platt and Carnahan, 2012) are both platforms
21 Virtualitics – www.virtualitics.com. 22 NHS Digital safe haven directory – https://digital.nhs.uk/organisation-data-service/our-services/safe-haven-directory. 23 Secure Unified Research Environment – https://www.saxinstitute.org.au/our-work/sure/.

Wilson et al: DataSHIELD – New Directions and Dimensions Art. 21, page 15 of 21
to facilitate the running of analysis requests from approved users locally, along with disclosure checks, prior to securely combining the results centrally as a meta-analysis.
Each of these solutions meets a requirement to securely access or analyse sensitive microdata with disclo-sure controls, but there are limitations to these approaches. Data safe havens represent a major investment in informatics infrastructure and by their very nature as a centralised data warehouse, they have limited application for a co-analysis of multiple data sources i.e. all data sources would have to include their data in the safe haven. Data safe havens are often closed (not open source) systems, meaning they have to be treated as a black box to some extent, this may make it difficult to reproduce the analysis in the future as not all aspects of the system will be known to the end user. In addition to this, it can be difficult for users to contribute to the development of the system or find bugs if they cannot see the underlying code. Data cus-todianship may also be a concern, as data are deposited into these systems, and are outside the immediate control of the data owner. Related issues around the devolvement of management of data access, as well as keeping the deposited data in sync with the master data sets, may also arise. Finally, some safe havens charge a fee for use – whilst this may help the sustainability of a safe haven, cost may be a barrier to some users.
Distributed analysis networks avoid the requirement to implement, maintain, and manage access to a cen-tralised data warehouse. They can be built from licensed or open source software, and have the capacity to be free at the point of use. Under distributed analysis networks, data remain under the control and manage-ment of data owners, however there may be delays in returning results to users. Analysis requests may take of the order of days, weeks or even longer to complete, as each data source is required to perform an analysis on its own data and check the output for disclosure before it can be combined with other sources. Further delays can arise from difficulties gaining access to the data or obtaining approvals for individual studies.
ViPAR uses an alternative co-analysis approach, utilising a central server to securely virtually pool data from distributed sources into memory to perform an analysis, deleting them on completion (Carter et al. 2016). It enables greater analytic flexibility for researchers than DataSHIELD, allowing them to maintain control of their analysis, with the ability to analyse anonymised data using scripts written in open source (R) and licensed (SAS, STATA) statistical software. Unlike DataSHIELD, however, ViPAR currently does not offer additional disclosure controls but has been successfully applied to population health studies (Schendel et al. 2013) with collaboration agreements in place and adherence to the stringent governance procedures of individual data owners.
Advantages and limitations of DataSHIELDDataSHIELD provides an access-analysis solution to sensitive biomedical datasets – for both a single or mul-tiple data sources – using a combination of computational and statistical controls implemented to prevent information disclosure. For example, communications across the DataSHIELD infrastructure only convey non-disclosive information e.g. analysis requests, summary or sufficient statistics. This adds an additional layer of protection within the system compared to other solutions, since even if this communication were somehow intercepted it contains no identifying information. The safeguarding of intellectual property, gov-ernance procedures and data disclosure concerns of the data owner(s) means that DataSHIELD can poten-tially ‘lower the bar’ for the governance processes of such studies, thereby shortening the time taken for approved users to gain access to health-related microdata.
Similar to other distributed analysis network methods, under DataSHIELD, data remains with the data owner where they maintain full control of the data and access permissions. This means all local govern-ance processes can be adhered to at all times, e.g. if a participant withdraws consent and is removed from a DataSHIELD server then that change will be reflected in all analyses connected to that server. This does highlight the issue of versioning of data – changing the number of participants in a data set will change the science. End users need to be aware when this happens, and if publications have been written based on a given data version then this should be archived somewhere. This is not a problem limited to DataSHIELD – all of the alternative approaches have to address this, and it is best resolved by policies rather than new technologies.
An advantage of DataSHIELD, is that researchers are given greater analytic flexibility – they are able to make complete use of microdata in their analyses, without seeing or downloading it. Additionally, as users are able to control their own analyses they do not experience the delays (of days, weeks or longer) associated with existing methods for meta-analysis that rely on third parties to perform their analysis requests at each study. In the most common implementation of the DataSHIELD client, that includes R Studio Server, once approval has been granted to a user they only require a modern web browser and internet access to connect
Wilson et al: DataSHIELD – New Directions and DimensionsArt. 21, page 16 of 21
and start analysing data. Being browser based, analysis can be conducted across a range of operating systems without the need for high specification computer hardware – we have successfully used DataSHIELD for analysis from Windows, Linux, MacOS, Android and iOS.
Unlike closed systems, by using an entirely open source stack there are no operating or software licence costs incurred by data owners for implementation, and no costs at the point of use. Further to this, in keep-ing with the aims of open and reproducible research, end-users can interrogate the DataSHIELD software, report bugs/issues as well as submit solutions and new functionality for consideration to be included in DataSHIELD.
The main limitations of DataSHIELD are due to the way in which it is built. Each statistical function in DataSHIELD – including the adaptation of standard R functions – has to be written from the ground up to work with the infrastructure (i.e. be in client-server pairs) and has to have all of the DataSHIELD methods for disclosure control incorporated into it. As they are more complex (and take more time) to develop and test, there is a limited number of functions currently available. Engagement to grow the DataSHIELD community has encouraged contributions to this open source project and is essential for the longer term software sus-tainability. We have had several new pieces of development contributed by end users.
DataSHIELD is built exclusively for the open-source R analytic environment. Not all researchers use R, and instead may be more familiar with licensed statistical software such as SPSS or STATA. This can mean there is a steep learning curve for some DataSHIELD users. R, however, is well established with an active devel-opment community and numerous packages that can give DataSHIELD developers the flexibility to create additional functionality, including the analysis of additional or new data types (e.g. images, text and ‘omics data) that may not be possible in the other commonly used statistical software.
DataSHIELD in a co-analysis and a vertical DataSHIELD setting will always take marginally longer than that of a single-site instance. This is because the speed of analysis is limited by the network latency or low-est specification hardware or virtual server in the whole system. For one step analysis this should have a negligible impact, but for multi-step and iterative analyses this may be more noticeable. Where this effect will be most noticeable is when one (or more) of the data providers has a particularly slow connection or lower server specification compared to the others, since each step of the analysis has to wait for the entire step to finish before progressing to the next. Certain methods employed for prevent statistical disclosure also require marginally longer computing time. For example, additional processing is required to compute the k-Nearest Neighbours based algorithm to populate a scatter plot from multiple data sources. This takes a few seconds longer than creating a scatter plot and is not a limitation of DataSHIELD per se – but the consequence of the statistical technique to prevent data disclosure.
ConclusionsContemporary bioscience depends critically on the effective access, sharing and exploitation of “big” and “complex” data. At the same time the legal, ethical and data governance requirements associated with the data must be adhered to, without hindering the research process. We have shown that DataSHIELD uniquely provides a mechanism for the (co-)analysis of sensitive data by building in statistical disclosure controls and security measures to meet the requirements of data owners. Unlike existing approaches, DataSHIELD does not require the setup of substantial infrastructure (technical and social) that is necessary of a closed reposi-tory or data safe haven. It is this unique placement and flexibility that we believe makes DataSHIELD an attractive solution for data owners, who have a requirement to make their data more widely available, but may not be able to deposit it in a closed (or public) repository.
A key strength of DataSHIELD is that it avoids the serious inferential and analytic shortcomings of approaches that are aimed at rendering data truly anonymous, that often discard or distort information that may be of analytic relevance. For the researcher, DataSHIELD can reduce data governance restrictions (giving overall quicker access to the data), and can reduce the time taken for co-analysis – unlike existing approaches, all DataSHIELD analytic functions have disclosure control built in and do not require manual or third party disclosure checks. By using a completely open software stack with flexible components, addi-tional functionality and the ability to process additional data types (such as those highlighted in this paper), can be built with automated disclosure controls and incorporated into DataSHIELD for users.
In its current form DataSHIELD has been shown to have a firm foundation in the biomedical domain as evidenced by its use in various international projects. In this paper we have demonstrated that it has potential applications in other domains, where disclosure control or data sensitivity is important. We also demonstrate the utility of DataSHIELD within the wider research data cycle such as academic publishing. In
Wilson et al: DataSHIELD – New Directions and Dimensions Art. 21, page 17 of 21
the next phase of DataSHIELD we will build on the prototype work outlined here and broaden out in both domain and scope to help reduce the barriers to transparency and reproducibility in biomedical research, and enhance the discoverability and usability of associated data.
AcknowledgementsWe thank the BioSHaRE-EU consortium for their involvement in the DataSHIELD pilots; F1000Research and the British Library for providing sample datasets and the active DataSHIELD development community. We also thank Masters of Pie, and Lumacode for their creativity and expertise in developing the prototype VR analytic platform and their ongoing collaboration with us. This work was supported through: the European Union’s 7th Framework Programme BioSHaRE-EU (HEALTH-F4-2010-261433); a strategic award from MRC and Wellcome Trust underpinning the ALSPAC project; the Welsh and Scottish Farr Institutes funded by MRC, BBMRI-LPC (EU FP7, I3 grant); a Jisc Research Data Spring phase one grant for AMASED and Jisc core funding for BRISSKit.
Competing InterestsThe authors have no competing interests to declare.
ReferencesAvraam, D and Wilson, R C 2017 davraam/DS_Graphics_Development: Prototyped ds.scatterPlot. Zenodo.
DOI: https://doi.org/10.5281/zenodo.321893Berg, L P and Vance, J M 2016 Industry use of virtual reality in product design and manufacturing: a survey.
Virtual Reality. DOI: https://doi.org/10.1007/s10055-016-0293-9 Boulton, G, Rawlins, M, Vallance, P and Walport, M 2011 Science as a public enterprise: the case for open
data. The Lancet 377: 1633–1635. DOI: https://doi.org/10.1016/S0140-6736(11)60647-8British Library 2015 Living Knowledge: The British Library 2015–2023. Available at: https://www.bl.uk/
projects/living-knowledge-the-british-library-2015-2023 [Last accessed 31st October 2016].Brown, J, Holmes, J, Syat, B, Lane, K, Lazarus, R and Platt, R 2010a Proof-of-Principle Evaluation
of a Distributed Research Network (No. 26), Effective Health Care Research Report. Agency for Healthcare Research and Quality, Rockville, MD. Available at: https://effectivehealthcare.ahrq.gov/search-for-guides-reviews-and-reports/?pageaction=displayproduct&productid=464 [Last accessed 27th January 2017].
Brown, J, Syat, B, Lane, K and Platt, R 2010b Blueprint for a Distributed Research Network To Conduct Population Studies and Safety Surveillance (No. 27), Effective Health Care Research Report. Agency for Healthcare Research and Quality, Rockville, MD. Available at: https://effectivehealthcare.ahrq.gov/search-for-guides-reviews-and-reports/?pageaction=displayproduct&productid=465 [Last accessed 27th January 2017].
Budin-Ljøsne, I, Burton, P, Isaeva, J, Gaye, A, Turner, A, Murtagh, M J, Wallace, S, Ferretti, V and Harris, J R 2014 DataSHIELD: An Ethically Robust Solution to Multiple-Site Individual-Level Data Analysis. Public Health Genomics 18: 87–96. DOI: https://doi.org/10.1159/000368959
Burton, P R, Murtagh, M J, Boyd, A, Williams, J B, Dove, E S, Wallace, S E, Tassé, A-M, Little, J, Chisholm, R L, Gaye, A, Hveem, K, Brookes, A J, Goodwin, P, Fistein, J, Bobrow, M and Knoppers, B M, 2015 Data Safe Havens in health research and healthcare. Bioinformatics 31: 3241–3248. DOI: https://doi.org/10.1093/bioinformatics/btv279
Butters, O 2016 OllyButters/flatten-bl-xml v1.0 [Dataset], Zenodo. DOI: https://doi.org/10.5281/zenodo.163847
Butters, O W and Issa, S 2016 brisskit-uol/i2b2-opal v1.1 [Dataset], Zenodo. DOI: https://doi.org/10.5281/zenodo.163849
Butters, O W, Issa, S, Lusted, J, Newbury, M, Parsloe, R, Holden, N, Free, R C, Beck, T, Wilson, R C, Burton, P R and Tedds, J A 2016 The Biomedical Research Infrastructure Software as a Service Kit (BRIS-SKit): technical description [version 1; referees: 2 approved with reservations], F1000Research 5: 1905. DOI: https://doi.org/10.12688/f1000research.8736.1
Cai, Y, Zijlema, W L, Doiron, D, Blangiardo, M, Burton, P R, Fortier, I, Gaye, A, Gulliver, J, de Hoogh, K, Hveem, K, Mbatchou, S, Morley, D W, Stolk, R P, Elliott, P, Hansell, A L and Hodgson, S 2016 Ambient air pollution, traffic noise and adult asthma prevalence: a BioSHaRE approach. European Respiratory Journal ERJ-02127-2015. DOI: https://doi.org/10.1183/13993003.02127-2015

Wilson et al: DataSHIELD – New Directions and DimensionsArt. 21, page 18 of 21
Carter, K W, Francis, R W, Bresnahan, M, Gissler, M, Grønborg, T K, Gross, R, Gunnes, N, Hammond, G, Hornig, M, Hultman, C M, Huttunen, J, Langridge, A, Leonard, H, Newman, S, Parner, E T, Petersson, G, Reichenberg, A, Sandin, S, Schendel, D E, Schalkwyk, L, Sourander, A, Steadman, C, Stoltenberg, C, Suominen, A, Surén, P, Susser, E, Sylvester Vethanayagam, A, and Yusof, Z 2016 ViPAR: a software platform for the Virtual Pooling and Analysis of Research Data. International Journal of Epidemiology 45: 408–416. DOI: https://doi.org/10.1093/ije/dyv193
Coffey, D, Malbraaten, N, Le, T, Borazjani, I, Sotiropoulos, F and Keefe, D F 2011 Slice WIM: a multi-surface, multi-touch interface for overview + detail exploration of volume datasets in virtual real-ity. In: I3D ‘11 Symposium on Interactive 3D Graphics and Games, San Francisco, CA, on February 18–20, 2011 pp. 191–198. DOI: https://doi.org/10.1145/1944745.1944777
Dehghan, A, Kovacevic, A, Karystianis, G, Keane, J A and Nenadic, G 2015 Combining knowledge- and data-driven methods for de-identification of clinical narratives. Journal of Biomedical Informatics 58: S53–S59. DOI: https://doi.org/10.1016/j.jbi.2015.06.029
Doiron, D, Burton, P, Marcon, Y, Gaye, A, Wolffenbuttel, B H R, Perola, M, Stolk, R P, Foco, L, Minelli, C, Waldenberger, M, Holle, R, Kvaloy, K, Hillege, H L, Tassé, A-M, Ferretti, V and Fortier, I 2013 Data harmonization and federated analysis of population-based studies: the BioSHaRE project. Emerging Themes in Epidemiology 10: 12. DOI: https://doi.org/10.1186/1742-7622-10-12
Donalek, C, Djorgovski, S G, Cioc, A, Wang, A, Zhang, J, Lawler, E, Yeh, S, Mahabal, A, Graham, M, Drake, A, Davidoff, S, Norris, J S and Longo, G 2014 Immersive and collaborative data visualization using virtual reality platforms. In: 2014 IEEE International Conference on Big Data, Washington DC, on 27 – 30 October, 2014 pp. 609–614. DOI: https://doi.org/10.1109/BigData.2014.7004282
Elliot, M, Mackey, E, O’Hara, K and Tudor, C 2016 The Anonymisation Decision-Making Framework. UKAN. Available at: http://ukanon.net/ukan-resources/ukan-decision-making-framework/ [Last accessed 31st October 2016].
Feinerer, I, Hornik, K and Meyer, D 2008 Text Mining Infrastructure in R. Journal of Statistical Software 25. DOI: https://doi.org/10.18637/jss.v025.i05
Ford, D V, Jones, K H, Verplancke, J-P, Lyons, R A, John, G, Brown, G, Brooks, C J, Thompson, S, Bodger, O, Couch, T and Leake, K 2009 The SAIL Databank: building a national architecture for e-health research and evaluation. BMC Health Services Research 9. DOI: https://doi.org/10.1186/1472-6963-9-157
Fortier, I, Raina, P, Van den Heuvel, E R, Griffith, L E, Craig, C, Saliba, M, Doiron, D, Stolk, R P, Knoppers, B M, Ferretti, V, Granda, P and Burton, P 2016 Maelstrom Research guidelines for rigor-ous retrospective data harmonization. International Journal of Epidemiology dyw075. DOI: https://doi.org/10.1093/ije/dyw075
Gaye, A, Marcon, Y, Isaeva, J, LaFlamme, P, Turner, A, Jones, E M, Minion, J, Boyd, A W, Newby, C J, Nuotio, M-L, Wilson, R, Butters, O, Murtagh, B, Demir, I, Doiron, D, Giepmans, L, Wallace, S E, Budin-Ljøsne, I, Oliver Schmidt, C, Boffetta, P, Boniol, M, Bota, M, Carter, K W, deKlerk, N, Dibben, C, Francis, R W, Hiekkalinna, T, Hveem, K, Kvaloy, K, Millar, S, Perry, I J, Peters, A, Phillips, C M, Popham, F, Raab, G, Reischl, E, Sheehan, N, Waldenberger, M, Perola, M, van den Heuvel, E, Macleod, J, Knoppers, B M, Stolk, R P, Fortier, I, Harris, J R, Woffenbuttel, B H, Murtagh, M J, Ferretti, V and Burton, P R 2014 DataSHIELD: taking the analysis to the data, not the data to the analysis. International Journal of Epidemiology 43: 1929–1944. DOI: https://doi.org/10.1093/ije/dyu188
Howard, M C 2017 A meta-analysis and systematic literature review of virtual reality rehabilitation programs. Computers in Human Behavior 70: 317–327. DOI: https://doi.org/10.1016/j.chb.2017.01.013
Hundepool, A, Domingo-Ferrer, J, Franconi, L, Giessing, S, Nordholt, E S, Spicer, K and de Wolf, P-R 2012 Statistical Disclosure Control. John Wiley & Sons, Ltd, Chichester, UK. DOI: https://doi.org/10.1002/9781118348239
Iruthayarajah, J, McIntyre, A, Cotoi, A, Macaluso, S and Teasell, R 2017 The use of virtual reality for balance among individuals with chronic stroke: a systematic review and meta-analysis. Topics in Stroke Rehabilitation 24: 68–79. DOI: https://doi.org/10.1080/10749357.2016.1192361
Jones, E M, Sheehan, N A, Gaye, A, Laflamme, P and Burton, P 2013 Combined analysis of correlated data when data cannot be pooled: Combined analysis of correlated data. Stat 2: 72–85. DOI: https://doi.org/10.1002/sta4.19
Jones, E M, Sheehan, N A, Masca, N, Wallace, S E, Murtagh, M J and Burton, P R 2012 DataSHIELD – shared individual-level analysis without sharing the data: a biostatistical perspective. Norsk Epidemiologi 21. DOI: https://doi.org/10.5324/nje.v21i2.1499
Wilson et al: DataSHIELD – New Directions and Dimensions Art. 21, page 19 of 21
Jones, K H, Ford, D V, Ellwood-Thompson, S and Lyons, R A 2016 The UK Secure eResearch Platform for public health research: a case study. The Lancet 388: S62. DOI: https://doi.org/10.1016/S0140-6736(16)32298-X
Jones, K H, Ford, D V, Jones, C, Dsilva, R, Thompson, S, Brooks, C J, Heaven, M L, Thayer, D S, McNerney, C L and Lyons, R A 2014 A case study of the Secure Anonymous Information Linkage (SAIL) Gateway: A privacy-protecting remote access system for health-related research and evaluation. Journal of Biomedical Informatics 50: 196–204. DOI: https://doi.org/10.1016/j.jbi.2014.01.003
Kamel Boulos, M N, Lu, Z, Guerrero, P, Jennett, C and Steed, A 2017 From urban planning and emergency training to Pokémon Go: applications of virtual reality GIS (VRGIS) and augmented reality GIS (ARGIS) in personal, public and environmental health. International Journal of Health Geographies 16. DOI: https://doi.org/10.1186/s12942-017-0081-0
Karr, A F and Reiter, J P 2014 Using Statistics to Protect Privacy, In: Privacy Big Data, and the Public Good: Frameworks for Engagement. Cambridge University Press, New York. DOI: https://doi.org/10.1017/CBO9781107590205.017
Kratz, J and Strasser, C 2014 Data publication consensus and controversies [version 3; referees: 3 approved], F1000Research. DOI: https://doi.org/10.12688/f1000research.3979.3
Lappalainen, I, Almeida-King, J, Kumanduri, V, Senf, A, Spalding, J D, ur-Rehman, S, Saunders, G, Kandasamy, J, Caccamo, M, Leinonen, R, Vaughan, B, Laurent, T, Rowland, F, Marin-Garcia, P, Barker, J, Jokinen, P, Torres, A C, de Argila, J R, Llobet, O M, Medina, I, Puy, M S, Alberich, M, de la Torre, S, Navarro, A, Paschall, J and Flicek, P 2015 The European Genome-phenome Archive of human data consented for biomedical research. Nature Genetics 47: 692–695. DOI: https://doi.org/10.1038/ng.3312
Lindsay Lady, C B E 1891 Bertha’s Earl. A novel. R. Bentley and Son, London. Digitsed copy available at: http://access.bl.uk/item/viewer/ark:/81055/vdc_0000000511E6 [Last accessed 28th February 2017].
Lyons, R A, Jones, K H, John, G, Brooks, C J, Verplancke, J-P, Ford, D V, Brown, G and Leake, K 2009 The SAIL databank: linking multiple health and social care datasets. BMC Medical Informatics and Decision Making 9. DOI: https://doi.org/10.1186/1472-6947-9-3
McGready, R, Kang, J, Watts, I, Tyrosvoutis, M E G, Torchinsky, M B, Htut, A M, Tun, N W, Keereecharoen, L, Wangsing, C, Hanboonkunupakarn, B and Nosten, F H 2015 Audit of antenatal screening for syphilis and HIV in migrant and refugee women on the Thai-Myanmar border: a descriptive study [version 2; referees: 2 approved], F1000Research. DOI: https://doi.org/10.12688/f1000research.4190.2
Meystre, S M, Friedlin, F J, South, B R, Shen, S and Samore, M H 2010 Automatic de-identification of textual documents in the electronic health record: a review of recent research. BMC Medical Research Methodology 10. DOI: https://doi.org/10.1186/1471-2288-10-70
Miwa, M, Thompson, P, McNaught, J, Kell, D B and Ananiadou, S 2012 Extracting semantically enriched events from biomedical literature. BMC Bioinformatics 13: 108. DOI: https://doi.org/10.1186/1471-2105-13-108
Murtagh, M J, Demir, I, Jenkings, K N, Wallace, S E, Murtagh, B, Boniol, M, Bota, M, Laflamme, P, Boffetta, P, Ferretti, V and Burton, P R 2012 Securing the Data Economy: Translating Privacy and Enacting Security in the Development of DataSHIELD. Public Health Genomics 15: 243–253. DOI: https://doi.org/10.1159/000336673
Murtagh, M J, Turner, A, Minion, J T, Fay, M and Burton, P R 2016 International Data Sharing in Practice: New Technologies Meet Old Governance. Biopreservation and Biobanking 14: 231–240. DOI: https://doi.org/10.1089/bio.2016.0002
Narasimhan, B, Rubin, D L, Gross, S M, Bendersky, M and Lavori, P W 2017 Software for Distributed Computation on Medical Databases: A Demonstration Project. ArXiv e-prints arXiv: 1412.6890v2 [stat.CO], Available at: https://arxiv.org/abs/1412.6890v2 [Last accessed 18th February 2017].
Ohno-Machado, L, Bafna, V, Boxwala, A A, Chapman, B E, Chapman, W W, Chaudhuri, K, Day, M E, Farcas, C, Heintzman, N D, Jiang, X, Kim, H, Kim, J, Matheny, M E, Resnic, F S and Vinterbo, S A the iDASH team, 2012. iDASH: integrating data for analysis, anonymization, and sharing. Journal of the American Medical Informatics Association 19: 196–201. DOI: https://doi.org/10.1136/amia-jnl-2011-000538
Olshannikova, E, Ometov, A, Koucheryavy, Y and Olsson, T 2015 Visualizing Big Data with augmented and virtual reality: challenges and research agenda. Journal of Big Data 2. DOI: https://doi.org/10.1186/s40537-015-0031-2

Wilson et al: DataSHIELD – New Directions and DimensionsArt. 21, page 20 of 21
Paynter, R, Bañez, L L, Berliner, E, Erinoff, E, Lege-Matsuura, J, Potter, S and Uhl, S 2016 EPC Methods: An Exploration of the Use of Text-Mining Software in Systematic Reviews, AHRQ Methods for Effective Health Care. Agency for Healthcare Research and Quality (US), Rockville (MD). PMID: 27195359. Available from https://www.ncbi.nlm.nih.gov/books/NBK362044/ [Last accessed 21st February 2017]
Platt, R and Carnahan, R 2012 The U.S. Food and Drug Administration’s Mini-Sentinel Program. Pharmacoepidemiology and Drug Safety 21: 1–303. DOI: https://doi.org/10.1002/pds.3230
Power, C and Elliot, J 2005 Cohort profile: 1958 British birth cohort (National Child Development Study). International Journal of Epidemiology 35: 34–41. DOI: https://doi.org/10.1093/ije/dyi183
Rak, R, Rowley, A, Black, W and Ananiadou, S 2012 Argo: an integrative, interactive, text mining-based workbench supporting curation. Database. DOI: https://doi.org/10.1093/database/bas010
R Core Team 2015 R: A language and environment for statistical computing [Internet], Vienna, Austria: R Foundation for Statistical Computing. Available at: http://www.r-project.org. [Last accessed 27th October 2016.]
Ross, J S and Krumholz, H M 2013 Ushering in a New Era of Open Science Through Data Sharing: The Wall Must Come Down. JAMA 309: 1355. DOI: https://doi.org/10.1001/jama.2013.1299
Sastry, L and Boyd, D R S 1998 Virtual environments for engineering applications. Virtual Reality 3: 235–244. DOI: https://doi.org/10.1007/BF01408704
Schendel, D E, Bresnahan, M, Carter, K W, Francis, R W, Gissler, M, Gronborg, T K, Gross, R, Gunnes, N, Hornig, M, Hultman, C M, Langridge, A, Lauritsen, M B, Leonard, H, Parner, E T, Reichenberg, A, Sandin, S, Sourander, A, Stoltenberg, C, Suominen, A, Surén, P and Susser, E 2013 The International Collaboration for Autism Registry Epidemiology (iCARE): Multinational Registry-Based Investigations of Autism Risk Factors and Trends. Journal of Autism and Developmental Disorders 43: 2650–2663. DOI: https://doi.org/10.1007/s10803-013-1815-x
Seth, A, Vance, J M and Oliver, J H 2011 Virtual reality for assembly methods prototyping: a review. Virtual Reality 15: 5–20. DOI: https://doi.org/10.1007/s10055-009-0153-y
SHIP 2012 SHIP: A Blueprint for Health Records Research in Scotland. Available at: http://www.scotship.ac.uk/sites/default/files/Reports/SHIP_BLUEPRINT_DOCUMENT_final_100712.pdf [Last accessed 27th February 2017]
Shlomo, N 2015 Statistical Disclosure Limitation for Health Data: A Statistical Agency Perspective, In: Gkoulalas-Divanis, A, Loukides, G. (Eds.), Medical Data Privacy Handbook. Springer International Publishing, Cham, pp. 201–230. DOI: https://doi.org/10.1007/978-3-319-23633-9_9
Sudlow, C, Gallacher, J, Allen, N, Beral, V, Burton, P, Danesh, J, Downey, P, Elliott, P, Green, J, Landray, M, Liu, B, Matthews, P, Ong, G, Pell, J, Silman, A, Young, A, Sprosen, T, Peakman, T and Collins, R 2015 UK Biobank: An Open Access Resource for Identifying the Causes of a Wide Range of Complex Diseases of Middle and Old Age. PLOS Medicine 12; e1001779. DOI: https://doi.org/10.1371/journal.pmed.1001779
Suissa, S, Henry, D, Caetano, P, Dormuth, C R, Ernst, P, Hemmelgarn, B, Lelorier, J, Levy, A, Martens, P J, Paterson, J M, Platt, R W, Sketris, I and Teare, G. Canadian Network for Observational Drug Effect Studies (CNODES), 2012. CNODES: the Canadian Network for Observational Drug Effect Studies. Open Med 6: e134–140. PM ID: 23687528
Sweeney, L 2002 k-anonymity: a model for protecting privacy. International Journal of Uncertainty, Fuzziness and Knowledge-Based Systems 10: 557–570. DOI: https://doi.org/10.1142/S0218488502001648
Wallace, S E, Gaye, A, Shoush, O and Burton, P R 2014 Protecting Personal Data in Epidemiological Research: DataSHIELD and UK Law. Public Health Genomics 17: 149–157. DOI: https://doi.org/10.1159/000360255
Wilson, R C and Burton, P R 2015a JISC Research Data Spring Project 3.8 (AMASED). Figshare. DOI: https://doi.org/10.6084/m9.figshare.1319503.v4
Wilson, R C and Burton, P R 2015b AMASED Second Phase (Jisc Data Spring Sandpit 2). Figshare. DOI: https://doi.org/10.6084/m9.figshare.1480941.v6
Wolfson, M, Wallace, S E, Masca, N, Rowe, G, Sheehan, N A, Ferretti, V, LaFlamme, P, Tobin, M D, Macleod, J, Little, J, Fortier, I, Knoppers, B M and Burton, P R 2010 DataSHIELD: resolving a conflict in contemporary bioscience—performing a pooled analysis of individual-level data without sharing the data. International Journal of Epidemiology 39: 1372–1382. DOI: https://doi.org/10.6084/10.1093/ije/dyq111
Wu, X, Kumar, V, Quinlan, J R, Ghosh, J, Yang, Q, Motoda, H, McLachlan, G J, Ng, A, Liu, B, Yu, P S, Zhou, Z-H, Steinbach, M, Hand, D J and Steinberg, D 2008 Top 10 algorithms in data mining. Knowledge and Information Systems 14: 1–37. DOI: https://doi.org/10.1007/s10115-007-0114-2

Wilson et al: DataSHIELD – New Directions and Dimensions Art. 21, page 21 of 21
Yuan, M, Chen, L, Yu, P S and Mei, H 2015 Privacy preserving graph publication in a distributed environment. World Wide Web 18: 1481–1517. DOI: https://doi.org/10.1007/s11280-014-0290-4
Zhou, J, Cao, Z, Dong, X and Lin, X 2015 PPDM: A Privacy-Preserving Protocol for Cloud-Assisted e-Healthcare Systems. IEEE Journal of Selected Topics in Signal Processing 9: 1332–1344. DOI: https://doi.org/10.1109/JSTSP.2015.2427113
Zijlema, W, Cai, Y, Doiron, D, Mbatchou, S, Fortier, I, Gulliver, J, de Hoogh, K, Morley, D, Hodgson, S, Elliott, P, Key, T, Kongsgard, H, Hveem, K, Gaye, A, Burton, P, Hansell, A, Stolk, R and Rosmalen, J 2016 Road traffic noise, blood pressure and heart rate: Pooled analyses of harmonized data from 88,336 participants. Environmental Research 151: 804–813. DOI: https://doi.org/10.1016/j.envres.2016.09.014
How to cite this article: Wilson, R C, Butters, O W, Avraam, D, Baker, J, Tedds, J A, Turner, A, Murtagh, M and Burton, P R 2017 DataSHIELD – New Directions and Dimensions. Data Science Journal, 16: 21, pp. 1–21, DOI: https://doi.org/10.5334/dsj-2017-021
Submitted: 31 October 2016 Accepted: 05 April 2017 Published: 19 April 2017
Copyright: © 2017 The Author(s). This is an open-access article distributed under the terms of the Creative Commons Attribution 4.0 International License (CC-BY 4.0), which permits unrestricted use, distribution, and reproduction in any medium, provided the original author and source are credited. See http://creativecommons.org/licenses/by/4.0/.
OPEN ACCESS Data Science Journal is a peer-reviewed open access journal published by Ubiquity Press.