data mining for network intrusion detection
TRANSCRIPT
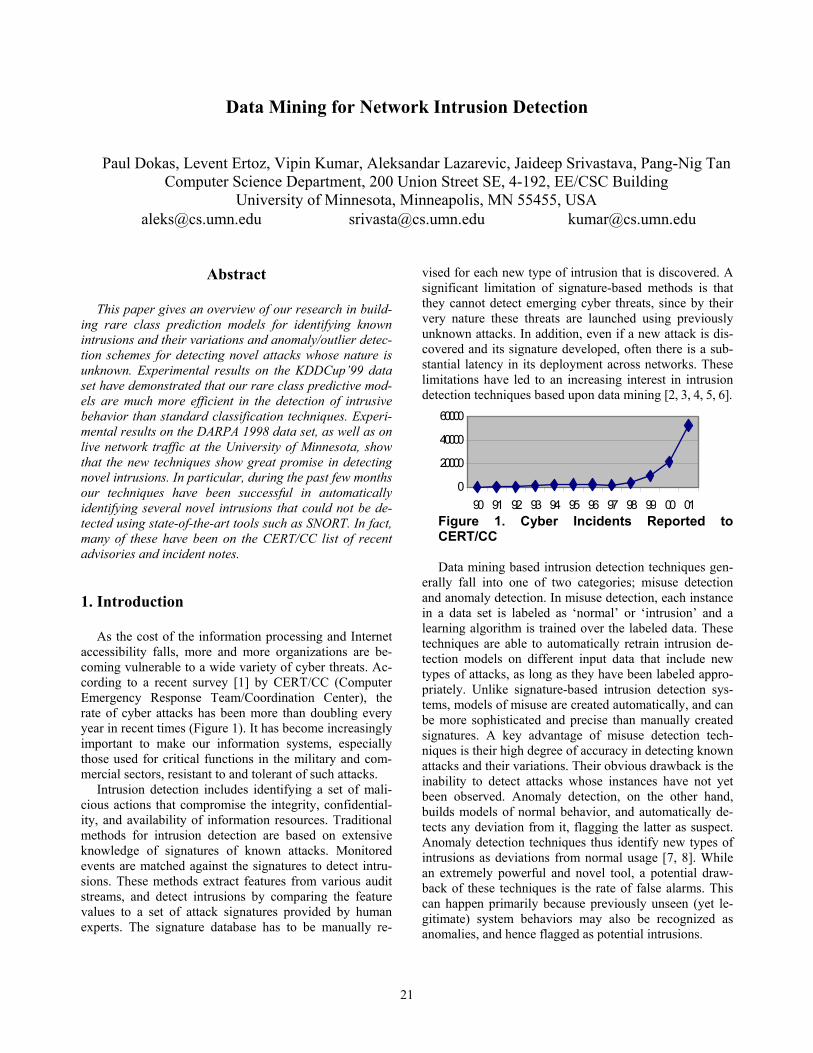
090 91 92 93 94 95 96 97 98 99 00 01
20000
40000
60000
Data Mining for Network Intrusion Detection
Paul Dokas, Levent Ertoz, Vipin Kumar, Aleksandar Lazarevic, Jaideep Srivastava, Pang-Nig Tan Computer Science Department, 200 Union Street SE, 4-192, EE/CSC Building
University of Minnesota, Minneapolis, MN 55455, USA [email protected] [email protected] [email protected]
Abstract
This paper gives an overview of our research in build-ing rare class prediction models for identifying known intrusions and their variations and anomaly/outlier detec-tion schemes for detecting novel attacks whose nature is unknown. Experimental results on the KDDCup’99 data set have demonstrated that our rare class predictive mod-els are much more efficient in the detection of intrusive behavior than standard classification techniques. Experi-mental results on the DARPA 1998 data set, as well as on live network traffic at the University of Minnesota, show that the new techniques show great promise in detecting novel intrusions. In particular, during the past few months our techniques have been successful in automatically identifying several novel intrusions that could not be de-tected using state-of-the-art tools such as SNORT. In fact, many of these have been on the CERT/CC list of recent advisories and incident notes. 1. Introduction
As the cost of the information processing and Internet accessibility falls, more and more organizations are be-coming vulnerable to a wide variety of cyber threats. Ac-cording to a recent survey [1] by CERT/CC (Computer Emergency Response Team/Coordination Center), the rate of cyber attacks has been more than doubling every year in recent times (Figure 1). It has become increasingly important to make our information systems, especially those used for critical functions in the military and com-mercial sectors, resistant to and tolerant of such attacks.
Intrusion detection includes identifying a set of mali-cious actions that compromise the integrity, confidential-ity, and availability of information resources. Traditional methods for intrusion detection are based on extensive knowledge of signatures of known attacks. Monitored events are matched against the signatures to detect intru-sions. These methods extract features from various audit streams, and detect intrusions by comparing the feature values to a set of attack signatures provided by human experts. The signature database has to be manually re-
vised for each new type of intrusion that is discovered. A significant limitation of signature-based methods is that they cannot detect emerging cyber threats, since by their very nature these threats are launched using previously unknown attacks. In addition, even if a new attack is dis-covered and its signature developed, often there is a sub-stantial latency in its deployment across networks. These limitations have led to an increasing interest in intrusion detection techniques based upon data mining [2, 3, 4, 5, 6].
Figure 1. Cyber Incidents Reported to CERT/CC Data mining based intrusion detection techniques gen-
erally fall into one of two categories; misuse detection and anomaly detection. In misuse detection, each instance in a data set is labeled as ‘normal’ or ‘intrusion’ and a learning algorithm is trained over the labeled data. These techniques are able to automatically retrain intrusion de-tection models on different input data that include new types of attacks, as long as they have been labeled appro-priately. Unlike signature-based intrusion detection sys-tems, models of misuse are created automatically, and can be more sophisticated and precise than manually created signatures. A key advantage of misuse detection tech-niques is their high degree of accuracy in detecting known attacks and their variations. Their obvious drawback is the inability to detect attacks whose instances have not yet been observed. Anomaly detection, on the other hand, builds models of normal behavior, and automatically de-tects any deviation from it, flagging the latter as suspect. Anomaly detection techniques thus identify new types of intrusions as deviations from normal usage [7, 8]. While an extremely powerful and novel tool, a potential draw-back of these techniques is the rate of false alarms. This can happen primarily because previously unseen (yet le-gitimate) system behaviors may also be recognized as anomalies, and hence flagged as potential intrusions.
21
This paper presents the scope and status of our re-search work both in misuse detection and anomaly detec-tion. After the brief overview of our research in building predictive models for learning from rare classes, the paper gives a comparative study of several anomaly detection schemes for identifying novel network intrusions. We present experimental results on DARPA 1998 Intrusion Detection Evaluation Data, the KDDCup’99 data set, as well as on real network data from the University of Min-nesota. Experimental results on the KDDCup’99 data set have demonstrated that our rare class predictive models are much more efficient in the detection of intrusive be-havior than standard classification techniques. Experi-mental results on the DARPA 1998 data set [9], as well as on live network traffic at the University of Minnesota, show that the new techniques show great promise in de-tecting novel intrusions. In particular, during the past few months our techniques have been successful in automati-cally identifying several novel intrusions that could not be detected using state-of-the-art tools such as SNORT. In fact, many of these have been on the CERT/CC list of recent advisories and incident notes.
2. Learning from Rare Classes
In misuse detection related problems, standard data
mining techniques are not applicable due to several spe-cific details that include dealing with skewed class distri-bution, learning from data streams and labeling network connections. The problem of skewed class distribution in the network intrusion detection is very apparent since intrusion as a class of interest is much smaller i.e. rarer than the class representing normal network behavior. In such scenarios when the normal behavior may typically represent 98-99% of the entire population a trivial classi-fier that labels everything with the majority class can achieve 98-99% accuracy. It is apparent that in this case classification accuracy is not sufficient as a standard per-formance measure. ROC analysis [10] and metrics such as precision, recall and F-value [11, 12] have been used to understand the performance of the learning algorithm on the minority class. A confusion matrix as shown in Table 1 is typically used to evaluate performance of a machine learning algorithm.
Table 1. Standard metrics for evaluations of intrusions (attacks)
Predicted connection label Confusion matrix (Standard metrics) Normal Intrusions(Attacks)
Normal True Negative (TN) False Alarm (FP)Actual
connection label Intrusions
(Attacks) False Negative
(FN) Correctly detected
attacks (TP)
From Table 1, recall, precision and F-value may be defined as follows: Precision = TP / (TP + FP)
Recall = TP / (TP + FN)
F-value = ecisionPrcallRe
ecisionPrcallRe)+⋅
⋅⋅+2
21β
β( ,
where β corresponds to relative importance of precision vs. recall and it is usually set to 1.
In addition, intrusions very often represent sequence of events and therefore are more suitable to be addressed by some temporal data mining algorithms. Finally, misuse detection algorithms require all data to be labeled, but labeling network connections as normal or intrusive re-quires enormous amount of time for many human experts. All these issues cause building misuse detection models very complex.
We have developed several novel classification algo-rithms designed especially for learning from the rare classes. For example, PN rule [13] is a two-stage learning algorithm based on computing the rules. The first stage is aimed at discovering P-rules that cover most of the intru-sive examples, while the second stage discovers N-rules and eliminates false alarms generated in the first phase. CREDOS [14] is a novel algorithm that first uses the rip-ple down rules to overfit the training data and then to prune them to improve generalization capability.
In data mining community it is well known that a combination of classifiers can be an effective technique for improving prediction accuracy. Rare-Boost [11, 12] attempts to incorporate rare class learning algorithms into the boosting technique. Unlike standard boosting tech-nique where the weights of the examples are updated uni-formly, in Rare-Boost the weights are updated differently for all four entries shown in Table 1. This paper shows that our algorithms for learning from rare class when in-tegrated within the boosting algorithm produce signifi-cantly better performance regarding better recall/precision balance than the boosting technique applied on standard data mining algorithms. SMOTEBoost [15] further inves-tigates this idea by embedding the procedure for generat-ing artificial examples from the minority (intrusion) class within the boosting procedure. Artificial examples are created after each boosting round, classifiers are then built on such newly generated data and finally they are com-bined using the boosting technique.
We have also investigated a standard association-based classification algorithm in order to focus on a rare class problem. First, a frequent itemset generation algorithm is applied to each class and then the best itemsets are se-lected as “meta-features”. These constructed features are added to the original data set and a standard classification algorithm is applied to such obtained data set. Current classification algorithms based on associations use confi-dence-like measures to select the best rules to be added as
22
bursty attack
Time →
t
features into the classifiers. However, these techniques may work well only if each class is well-represented in the data set. For the rare class problems, some of the high recall itemsets could be also beneficial as long as their precision is not too low. Therefore, the best itemsets that will be added to the original data set are selected not only according to the precision but also according to high re-call and F-value.
hreshold
False alarmsreal attack
curve
score value
surface area
3. Anomaly Detection Algorithms False alarm
Most supervised anomaly detection approaches attempt to build some kind of a model over the normal data and then check to see how well new data fits into that model. In this section our focus is on several outlier detection algorithms as well as on unsupervised support vector ma-chine algorithms for detecting network intrusions.
ndi
tresponse 3.1. Evaluation of Anomaly Detection Systems
There are generally two types of attacks in network in-
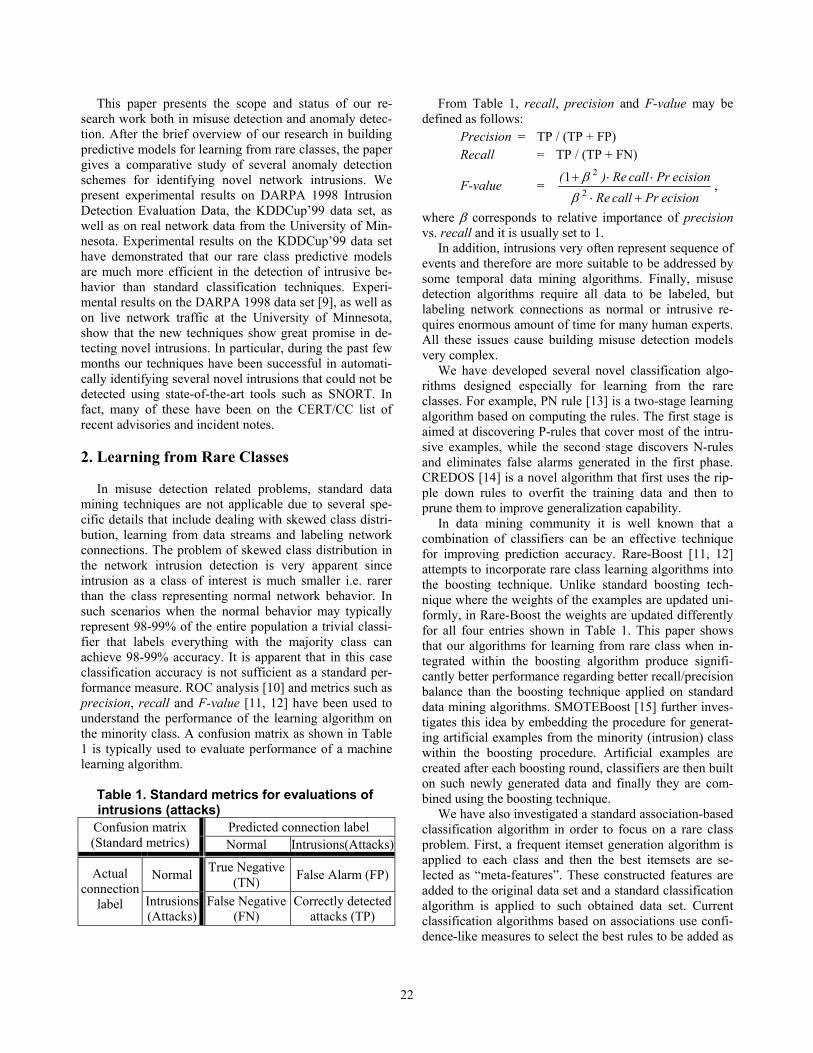
trusion detection: the attacks that involve single connec-tions and the attacks that involve multiple connections (bursts of connections). The standard metrics (Table 1) treat all types of attacks similarly thus failing to provide sufficiently generic and systematic evaluation for the at-tacks that involve many network connections (bursty at-tacks). Therefore, two types of analysis may be applied; multi-connection attack analysis for bursty attacks and the single-connection attack analysis for single connection attacks. Assume that for a given network traffic in some time interval, each connection is assigned a score value, represented as a vertical line (Figure 2) The score value corresponds to the likelihood that the network connection is associated with an intrusion
The first derived metric corresponds to the surface ar-eas between the real attack curve and the predicted attack curve (surfaces denoted as \\\ in Figure 2). The smaller the surface under the real attack curve, the better the intrusion detection algorithm. However, the surface area itself is not sufficient to capture many relevant aspects of intru-sion detection algorithms (e.g. how many connections are associated with the attack, how fast the intrusion detection algorithm is, etc.). Therefore, additional metrics may be used to address these issues. They are defined as follows:
1. Burst detection rate (bdr) is defined for each burst and it represents the ratio between the total number of intrusive network connections ndi that have the score higher than prespecified threshold within the bursty attack and the total number of intrusive network con-nections within attack intervals (Figure 2). Similar metric was used in DARPA 1998 evaluation [9].
2. Response time represents the time elapsed from the beginning of the attack till the moment when the first network connection has the score value higher than prespecified threshold (tresponse in Figure 2). Similar metric was used in DARPA 1999 evaluation [16] where 60s time interval was allowed to detect the bursty attack.
Figure 2. Assigning scores in network intrusion detection scheme
3.2. Outlier Detection Schemes Most anomaly detection algorithms require a set of
purely normal data to train the model, and they implicitly assume that anomalies can be treated as patterns not ob-served before. Since an outlier may be defined as a data point which is very different from the rest of the data, based on some measure, we employ several outlier detec-tion schemes in order to see how efficiently these schemes may deal with the problem of anomaly detection.
In statistics-based outlier detection techniques [17] the data points are modeled using a stochastic distribution and points are determined to be outliers depending upon their relationship with this model. However, with increasing dimensionality, it becomes increasingly difficult and in-accurate to estimate the multidimensional distributions of the data points [18]. However, recent outlier detection algorithms that we utilize in this study are based on com-puting the full dimensional distances of the points from one another [19, 20] as well as on computing the densities of local neighborhoods [21].
3.2.1. Nearest Neighbor (NN) Approach. This approach is based on the distance Dk(O) of the k-th nearest neighbor from the point O. For instance, points with larger values Dk(O) have more sparse neighborhoods and they typically represent stronger outliers than points belonging to dense clusters. In our NN approach we chose k = 1 and specify an “outlier threshold” that will serve to determine whether the point is an outlier or not. The threshold is based only on the training data and it is set to 2%. In order to com-pute the threshold, for all data points from training data (e.g. “normal behavior”) distances to their nearest
23
neighbors are computed and then sorted. All test data points that have distances to their nearest neighbors greater than the threshold are detected as outliers. 3.2.2. Mahalanobis-distance Based Outlier Detection. Since the training data corresponds to “normal behavior”, the Mahalanobis distance [22] between the particular point p and the mean µ of the normal data is computed as:
dM = )p()p( T µµ −⋅Σ⋅− −1 ,
where the Σ is the covariance matrix of the “normal” data. Similarly to the previous approach, the threshold is com-puted according to the most distant points from the mean of the “normal” data and it is set to be 2% of total number of points. All test data points that have distances to the mean of the training “normal” data greater than the threshold are detected as outliers.
**
* **
**
***
*
* ** **
*
**
*
**
•♦
x’y’
p1 p2
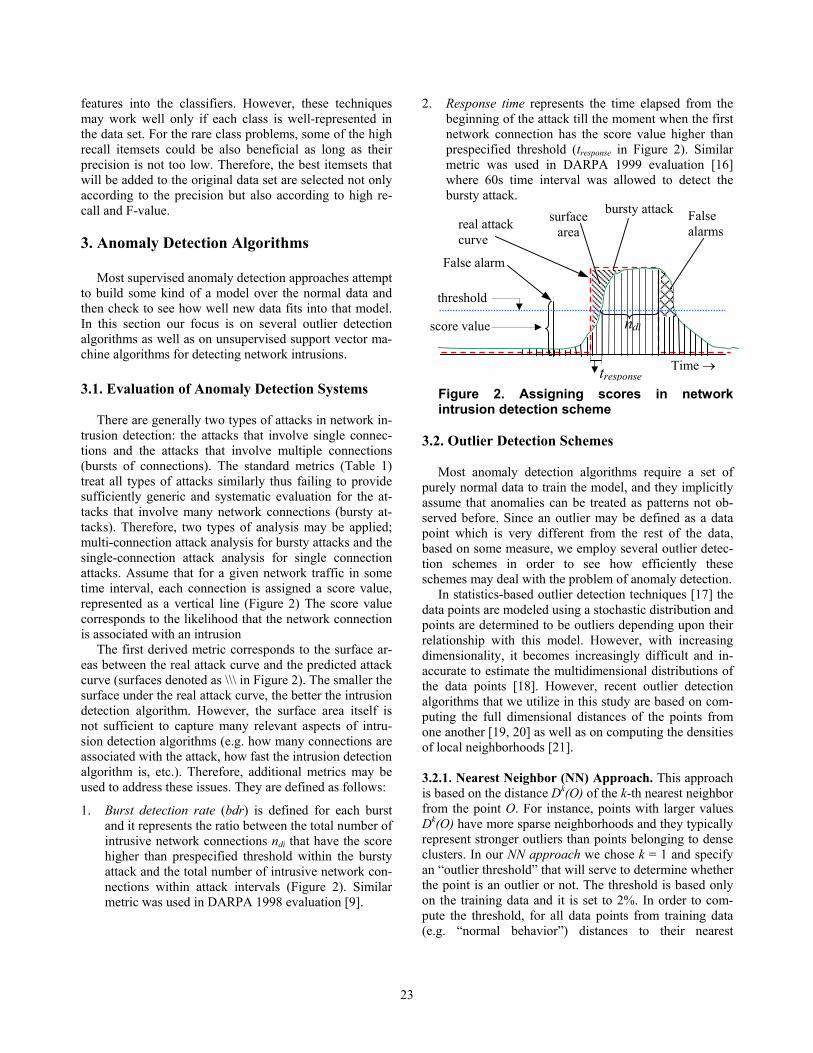
Computing distances using standard Euclidean dis-tance metric is not always beneficial, especially when the data has a distribution similar to that presented in Figure 3. When using standard Euclidean metric, the distance between p2 and its nearest neighbor is greater than the distance from p1 to its nearest neighbor. However, when using the Mahalanobis distance metric, these two dis-tances are the same. It is apparent that in these scenarios, Mahalanobis based approach is beneficial compared to the Euclidean metric.
p2× p1
×
Figure 3. Advantage of Mahalanobis-distance based approach when computing distances
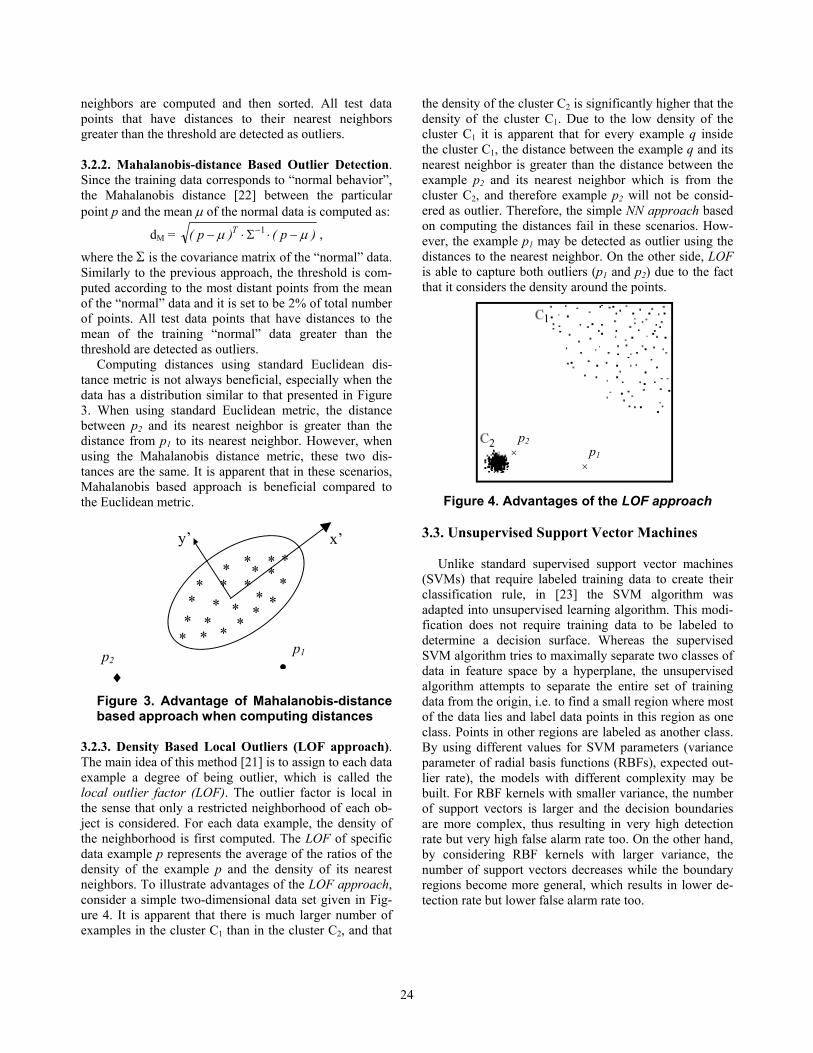
3.2.3. Density Based Local Outliers (LOF approach). The main idea of this method [21] is to assign to each data example a degree of being outlier, which is called the local outlier factor (LOF). The outlier factor is local in the sense that only a restricted neighborhood of each ob-ject is considered. For each data example, the density of the neighborhood is first computed. The LOF of specific data example p represents the average of the ratios of the density of the example p and the density of its nearest neighbors. To illustrate advantages of the LOF approach, consider a simple two-dimensional data set given in Fig-ure 4. It is apparent that there is much larger number of examples in the cluster C1 than in the cluster C2, and that
the density of the cluster C2 is significantly higher that the density of the cluster C1. Due to the low density of the cluster C1 it is apparent that for every example q inside the cluster C1, the distance between the example q and its nearest neighbor is greater than the distance between the example p2 and its nearest neighbor which is from the cluster C2, and therefore example p2 will not be consid-ered as outlier. Therefore, the simple NN approach based on computing the distances fail in these scenarios. How-ever, the example p1 may be detected as outlier using the distances to the nearest neighbor. On the other side, LOF is able to capture both outliers (p1 and p2) due to the fact that it considers the density around the points.
Figure 4. Advantages of the LOF approach
3.3. Unsupervised Support Vector Machines
Unlike standard supervised support vector machines (SVMs) that require labeled training data to create their classification rule, in [23] the SVM algorithm was adapted into unsupervised learning algorithm. This modi-fication does not require training data to be labeled to determine a decision surface. Whereas the supervised SVM algorithm tries to maximally separate two classes of data in feature space by a hyperplane, the unsupervised algorithm attempts to separate the entire set of training data from the origin, i.e. to find a small region where most of the data lies and label data points in this region as one class. Points in other regions are labeled as another class. By using different values for SVM parameters (variance parameter of radial basis functions (RBFs), expected out-lier rate), the models with different complexity may be built. For RBF kernels with smaller variance, the number of support vectors is larger and the decision boundaries are more complex, thus resulting in very high detection rate but very high false alarm rate too. On the other hand, by considering RBF kernels with larger variance, the number of support vectors decreases while the boundary regions become more general, which results in lower de-tection rate but lower false alarm rate too.
24
4. Experiments We first applied the proposed intrusion detection
schemes to 1998 DARPA Intrusion Detection Evaluation Data [9] and to its modification, KDDCup’99 data set [2]. The DARPA’98 data contains both training data and test data. The training data consists of 7 weeks of labeled network-based attacks inserted in the normal background data. The test data contained 2 weeks of network-based attacks and normal background data. The data contains four main categories of attacks:
• DoS (Denial of Service), for example, ping-of-death, teardrop, smurf, SYN flood, etc.,
• R2L, unauthorized access from a remote machine, for example, guessing password,
• U2R, unauthorized access to local superuser privi-leges by a local unprivileged user, for example, vari-ous buffer overflow attacks,
• PROBING, surveillance and probing, for example, port-scan, ping-sweep, etc.
Although DARPA’98 evaluation represents a signifi-cant contribution to the field of intrusion detection, there are many unresolved issues associated with its design and execution. In his critique, McHugh [24] questioned a number of results of DARPA evaluation, starting from usage of synthetic simulated data for the background (normal data) and using attacks implemented via scripts and programs collected from a variety of sources. In addi-tion, it is known that the background data contains none of the background noise (packet storms, strange frag-ments, etc.) that characterizes real data. However, in the lack of better benchmarks, vast amount of the research is based on the experiments performed on this data set and its modification, KDDCup’99 data. However, in order to assess the performance of our anomaly detection algo-rithms in a real setting, we also applied our techniques to real network data from the University of Minnesota.
4.1. Feature construction
We used tcptrace utility software [25] as the packet fil-
tering tool in order to extract information about packets from TCP connections and to construct new features. The DARPA98 training data includes “list files” that identify the time stamps (start time and duration), service type, source IP address, source port, destination IP address, destination port and the type of each attack. We used this information to map the connection records from “list files” to the connections obtained using tcptrace utility software and to correctly label each connection record with “normal” or an attack type. The akin technique was used to construct KDDCup’99 data set [2], but this data set did not keep the time information about the attacks. Therefore, we constructed our own features that were very similar in nature. These features include the number
of packets, data bytes, acknowledgment packets, retrans-mitted packets, pushed packets, SYN and FIN packets flowing from source to destination as well as from desti-nation to source. We have also added connection status as the content-based feature.
The main reason for this procedure is to associate new constructed features with the connection records from “list files” and to create more informative data set for learning. However, this procedure was applied only to TCP connection records, since tcptrace software utility was not able to handle ICMP and UDP packets. For these connection records, in addition to the features provided by DARPA, we used the features that represented the num-ber of packets that flowed from source to destination.
Since majority of the DoS and probing attacks may use hundreds of packets or connections, we have constructed time-based features that attempt to capture previous re-cent connections with similar characteristics. The same approach was used for constructing features in KDDCup’99 data [2], but our own features examine only the connection records in the past 5 seconds. Table 2 summarizes these derived time-windows features.
“Slow” probing attacks that scan the hosts (or ports) and use a much larger interval than 5 seconds (e.g. one scan per minute or even one scan per hour) cannot be de-tected using derived “time based” features. To capture these types of the attacks, we also derived “connection based” features that capture the same characteristics of the connection records as time based features but they are computed in the last 100 connections.
Table 2. The extracted “time-based” features
Feature Name Feature description count_src Number of connections made by the
same source as the current record in the last 5 seconds
count_dest Number of connections made to the same destination as the current record in the last 5 seconds
count_serv_src Number of different services from the same source as the current record in the last 5 seconds
count_serv_dest Number of different services to the same destination as the current record in the last 5 seconds
It is well known that constructed features from the data
content of the connections are more important when de-tecting R2L and U2R attack types, while “time-based’ and “connection-based” features were more important for detection DoS and probing attack types [2].
25
4.2. Results for Learning from Rare Class KddCup’99 data set is an extension of DARPA’98 data
set with a set of additionally constructed features. It is very similar to the data set that we have developed, but it does not contain some basic information about the net-work connections (e.g. start time, IP addresses, ports, etc.) that we needed for our analysis of multi-connection at-tacks. The data set was mainly constructed for the purpose of applying data mining algorithms. Therefore, we have also used this data set as a testbed for our algorithms for learning from rare class. In addition to 4 main attack classes (categories), KDDCup’99 data set has also the class of normal network connections. Two of five classes are considered rare, U2R and R2L classes respectively with 0.4% and 5.7% of the entire population.
0 2 4 6 8 10 12 14 16 18 200.72
0.74
0.76
0.78
0.8
0.82
0.84
0.86
0.88
0.9U2R SMOTE parameter = 100, R2L SMOTE parameter = 100
Boosting rounds
F-va
lue
AdaBoost.M2 techniqueSMOTE applied on RIPPERSMOTEBoost algorithm
0 2 4 6 8 10 12 14 16 18 20
0.7
0.75
0.8
0.85
0.9
0.95
U2R SMOTE parameter = 100, R2L SMOTE parameter = 100
Boosting rounds
SMOTEBoost RecallSMOTEBoost PrecisionBoosting RecallBoosting Precision
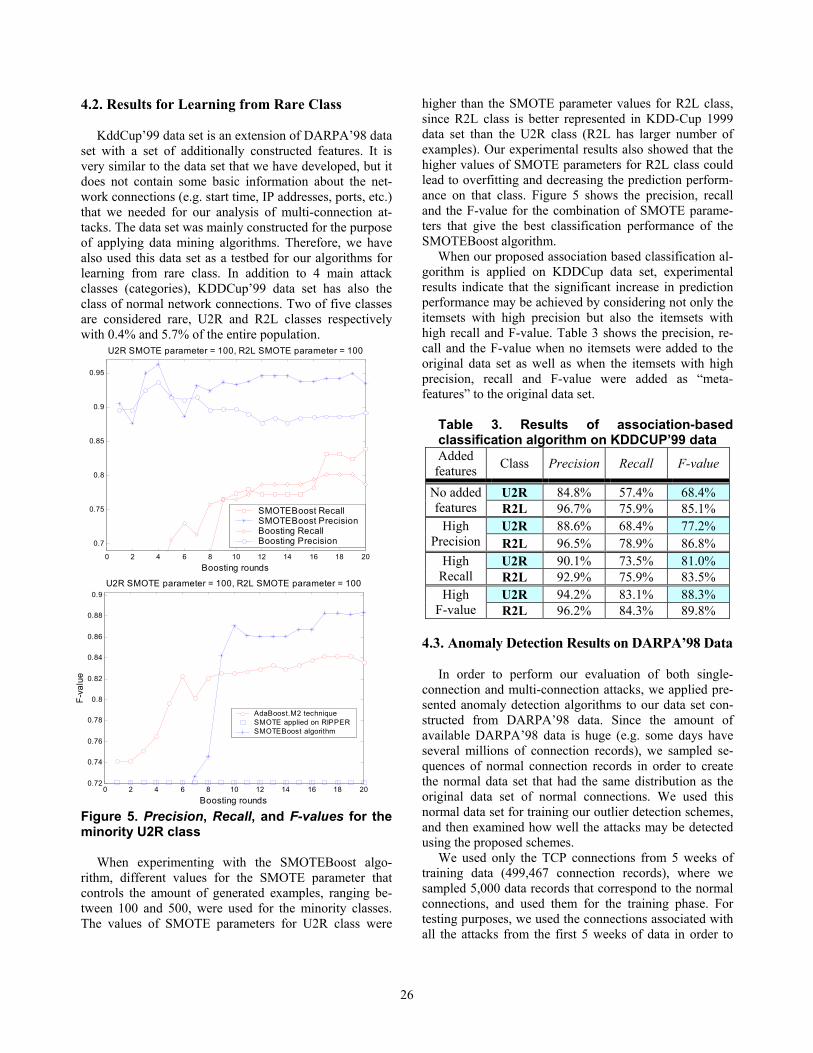
Figure 5. Precision, Recall, and F-values for the minority U2R class
When experimenting with the SMOTEBoost algo-
rithm, different values for the SMOTE parameter that controls the amount of generated examples, ranging be-tween 100 and 500, were used for the minority classes. The values of SMOTE parameters for U2R class were
higher than the SMOTE parameter values for R2L class, since R2L class is better represented in KDD-Cup 1999 data set than the U2R class (R2L has larger number of examples). Our experimental results also showed that the higher values of SMOTE parameters for R2L class could lead to overfitting and decreasing the prediction perform-ance on that class. Figure 5 shows the precision, recall and the F-value for the combination of SMOTE parame-ters that give the best classification performance of the SMOTEBoost algorithm.
When our proposed association based classification al-gorithm is applied on KDDCup data set, experimental results indicate that the significant increase in prediction performance may be achieved by considering not only the itemsets with high precision but also the itemsets with high recall and F-value. Table 3 shows the precision, re-call and the F-value when no itemsets were added to the original data set as well as when the itemsets with high precision, recall and F-value were added as “meta-features” to the original data set.
Table 3. Results of association-based classification algorithm on KDDCUP’99 data Added
features Class Precision Recall F-value
U2R 84.8% 57.4% 68.4% No added features R2L 96.7% 75.9% 85.1%
U2R 88.6% 68.4% 77.2% High Precision R2L 96.5% 78.9% 86.8%
U2R 90.1% 73.5% 81.0% High Recall R2L 92.9% 75.9% 83.5%
U2R 94.2% 83.1% 88.3% High F-value R2L 96.2% 84.3% 89.8%
4.3. Anomaly Detection Results on DARPA’98 Data In order to perform our evaluation of both single-
connection and multi-connection attacks, we applied pre-sented anomaly detection algorithms to our data set con-structed from DARPA’98 data. Since the amount of available DARPA’98 data is huge (e.g. some days have several millions of connection records), we sampled se-quences of normal connection records in order to create the normal data set that had the same distribution as the original data set of normal connections. We used this normal data set for training our outlier detection schemes, and then examined how well the attacks may be detected using the proposed schemes.
We used only the TCP connections from 5 weeks of training data (499,467 connection records), where we sampled 5,000 data records that correspond to the normal connections, and used them for the training phase. For testing purposes, we used the connections associated with all the attacks from the first 5 weeks of data in order to
26
determine detection rate. Also we considered a random sample of 1,000 connection records that correspond to normal data in order to determine the false alarm rate. It is important to note that the sample used for testing pur-poses had the same distribution as the original set of nor-mal connections. After the features are constructed and normalized, anomaly detection schemes were tested sepa-rately for the attack bursts, mixed bursty attacks and non-bursty attacks. In all the experiments, the percentage of the outliers in the training data (allowed false alarm rate) is set to be approximately 2%.
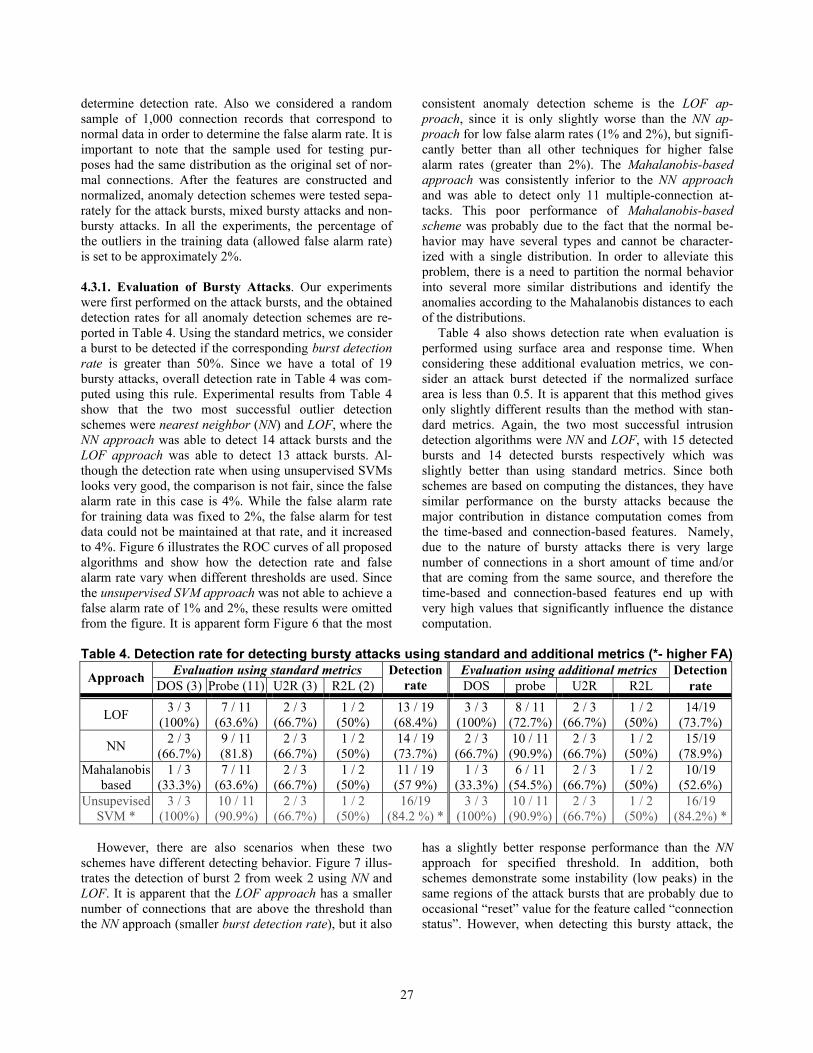
4.3.1. Evaluation of Bursty Attacks. Our experiments were first performed on the attack bursts, and the obtained detection rates for all anomaly detection schemes are re-ported in Table 4. Using the standard metrics, we consider a burst to be detected if the corresponding burst detection rate is greater than 50%. Since we have a total of 19 bursty attacks, overall detection rate in Table 4 was com-puted using this rule. Experimental results from Table 4 show that the two most successful outlier detection schemes were nearest neighbor (NN) and LOF, where the NN approach was able to detect 14 attack bursts and the LOF approach was able to detect 13 attack bursts. Al-though the detection rate when using unsupervised SVMs looks very good, the comparison is not fair, since the false alarm rate in this case is 4%. While the false alarm rate for training data was fixed to 2%, the false alarm for test data could not be maintained at that rate, and it increased to 4%. Figure 6 illustrates the ROC curves of all proposed algorithms and show how the detection rate and false alarm rate vary when different thresholds are used. Since the unsupervised SVM approach was not able to achieve a false alarm rate of 1% and 2%, these results were omitted from the figure. It is apparent form Figure 6 that the most
consistent anomaly detection scheme is the LOF ap-proach, since it is only slightly worse than the NN ap-proach for low false alarm rates (1% and 2%), but signifi-cantly better than all other techniques for higher false alarm rates (greater than 2%). The Mahalanobis-based approach was consistently inferior to the NN approach and was able to detect only 11 multiple-connection at-tacks. This poor performance of Mahalanobis-based scheme was probably due to the fact that the normal be-havior may have several types and cannot be character-ized with a single distribution. In order to alleviate this problem, there is a need to partition the normal behavior into several more similar distributions and identify the anomalies according to the Mahalanobis distances to each of the distributions.
Table 4 also shows detection rate when evaluation is performed using surface area and response time. When considering these additional evaluation metrics, we con-sider an attack burst detected if the normalized surface area is less than 0.5. It is apparent that this method gives only slightly different results than the method with stan-dard metrics. Again, the two most successful intrusion detection algorithms were NN and LOF, with 15 detected bursts and 14 detected bursts respectively which was slightly better than using standard metrics. Since both schemes are based on computing the distances, they have similar performance on the bursty attacks because the major contribution in distance computation comes from the time-based and connection-based features. Namely, due to the nature of bursty attacks there is very large number of connections in a short amount of time and/or that are coming from the same source, and therefore the time-based and connection-based features end up with very high values that significantly influence the distance computation.
Table 4. Detection rate for detecting bursty attacks using standard and additional metrics (*- higher FA)
Evaluation using standard metrics Evaluation using additional metrics DetectionApproach DOS (3) Probe (11) U2R (3) R2L (2) Detection
rate DOS probe U2R R2L rate
LOF 3 / 3 (100%)
7 / 11 (63.6%)
2 / 3 (66.7%)
1 / 2 (50%)
13 / 19 (68.4%)
3 / 3 (100%)
8 / 11 (72.7%)
2 / 3 (66.7%)
1 / 2 (50%)
14/19 (73.7%)
NN 2 / 3 (66.7%)
9 / 11 (81.8)
2 / 3 (66.7%)
1 / 2 (50%)
14 / 19 (73.7%)
2 / 3 (66.7%)
10 / 11 (90.9%)
2 / 3 (66.7%)
1 / 2 (50%)
15/19 (78.9%)
Mahalanobis based
1 / 3 (33.3%)
7 / 11 (63.6%)
2 / 3 (66.7%)
1 / 2 (50%)
11 / 19 (57 9%)
1 / 3 (33.3%)
6 / 11 (54.5%)
2 / 3 (66.7%)
1 / 2 (50%)
10/19 (52.6%)
Unsupevised SVM *
3 / 3 (100%)
10 / 11 (90.9%)
2 / 3 (66.7%)
1 / 2 (50%)
16/19 (84.2 %) *
3 / 3 (100%)
10 / 11 (90.9%)
2 / 3 (66.7%)
1 / 2 (50%)
16/19 (84.2%) *
However, there are also scenarios when these two
schemes have different detecting behavior. Figure 7 illus-trates the detection of burst 2 from week 2 using NN and LOF. It is apparent that the LOF approach has a smaller number of connections that are above the threshold than the NN approach (smaller burst detection rate), but it also
has a slightly better response performance than the NN approach for specified threshold. In addition, both schemes demonstrate some instability (low peaks) in the same regions of the attack bursts that are probably due to occasional “reset” value for the feature called “connection status”. However, when detecting this bursty attack, the
27
28
10 20 30 40 50 60 70 80 90 100
0.
0.
0.
0.
0.
0.
0.
0.
0.
Number of connections
Con
nect
ion
scor
e
LOF approach
NN aproach
Mahalanobis based approach
00
1
2
3 4 5 6 7 8 9 1
0 0.02 0.04 0.06 0.08 0.1 0.120.1
0.2
0.3
0.4
0.5
0.6
0.7
0.8
0.9
1
ROC Curves for different outlier detection techniques
False Alarm Rate
Det
ectio
n R
ate
LOF approachNN approach Mahalanobis approachUnsupervised SVM
0 0.02 0.04 0.06 0.08 0.10
.1
.2
.3
.4
.5
.6
.7
.8
.9
1
LOF approachNN approach Mahalanobis approachUnsupervised SVM
ROC Curves for different outlier detection techniques
Det
ectio
n R
ate
False Alarm Rate
0
0 0 0 0 0 0
0
0
NN approach was superior to other two approaches. The dominance of the NN approach over the LOF approach probably lies in the fact that the connections of this type of attack (portsweep attack, probe category) are located in the sparse regions of the normal data, and the LOF ap-proach is not able to detect them due to low density, while distances to their nearest neighbors are still rather high and thus the NN approach was able to identify them as outliers. Finally, Figure 7 evidently shows that in spite of the limitations of the LOF approach mentioned above, it was still able to detect the attack burst, but with higher instability which is penalized by larger surface area.
Figure 6. ROC curves showing the performance of anomaly detection algorithms on bursty attacks.
Figure 7. The score values assigned to connections from burst 2, week 2 When detecting the bursty attacks, very often the nor-
mal connections are mixed with the connections from the attack bursts, which makes the task of detecting the at-tacks more complex. It turns out that in these situations, the LOF approach is more suitable for detecting these attacks than the NN approach simply due to the fact that the connections associated with the attack are very close to dense regions of the normal behavior and therefore the
NN approach is not able to detect them only according to the distance. For example, the burst 4 from week 2 in-volves 1000 connections, but within the attack time inter-val there are also 171 normal connections. For this attack the LOF approach was able to detect 752 connections associated with the attack, while the NN approach de-tected only 62 of them. In such situations the presence of normal connections usually causes the low peaks in score values for connections from attack bursts, thus reducing the burst detection rate and increasing the surface area. In addition, a large number of normal connections are mis-classified as connections associated with attacks, thus increasing the false alarm rate.
When predicting the attack bursts, it is also possible that two or more bursty attacks are overlapping. For ex-ample, in the training data that we used for our experi-ments there was a scenario when the DoS attack contain-ing 999 connections was mixed with the slow probing attack that contained 866 connections and with the U2R attack that contained 5 connections. In this scenario, the U2R attack was undetected by any of the techniques since it was hidden within two bursty attacks.
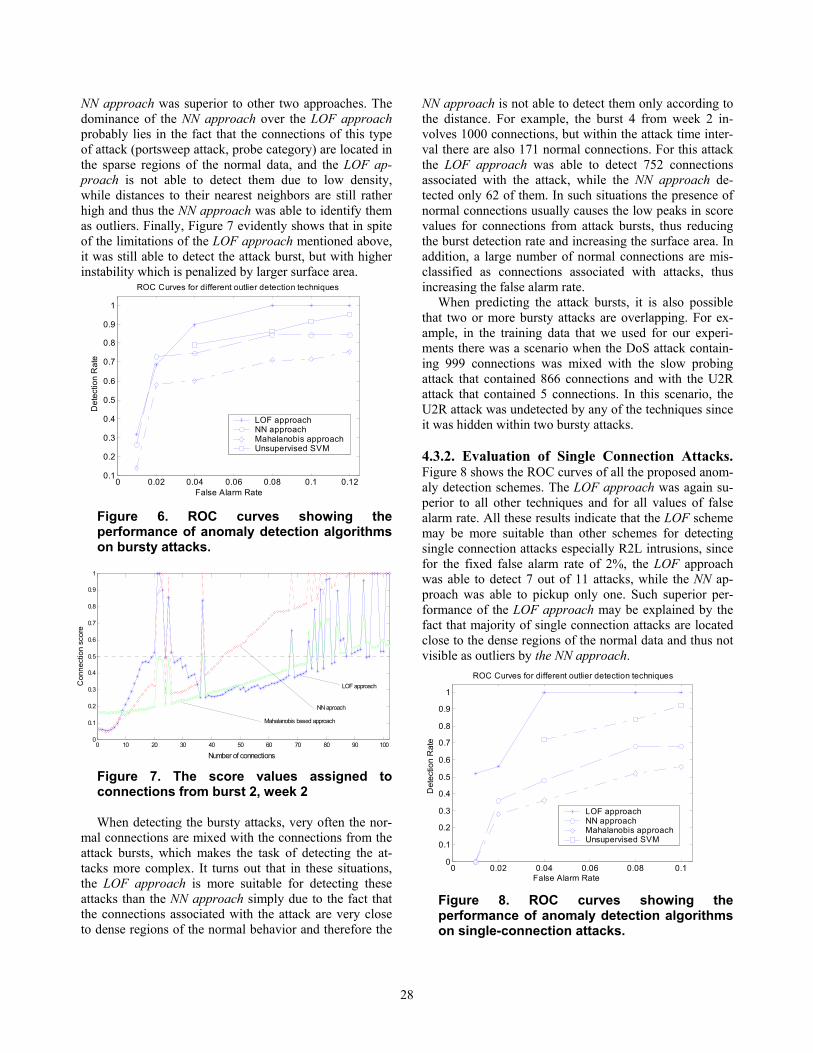
4.3.2. Evaluation of Single Connection Attacks. Figure 8 shows the ROC curves of all the proposed anom-aly detection schemes. The LOF approach was again su-perior to all other techniques and for all values of false alarm rate. All these results indicate that the LOF scheme may be more suitable than other schemes for detecting single connection attacks especially R2L intrusions, since for the fixed false alarm rate of 2%, the LOF approach was able to detect 7 out of 11 attacks, while the NN ap-proach was able to pickup only one. Such superior per-formance of the LOF approach may be explained by the fact that majority of single connection attacks are located close to the dense regions of the normal data and thus not visible as outliers by the NN approach.
Figure 8. ROC curves showing the performance of anomaly detection algorithms on single-connection attacks.
4.4. Results from Real Network Data
Due to various limitations of DARPA’98 intrusion detection evaluation data discussed above [24], we have repeated our experiments on live network traffic at the University of Minnesota. When reporting results on real network data, we were not able to report the detection rate, false alarm rate and other evaluation metrics reported for DARPA’98 intrusion data, mainly due to difficulty to obtain the proper labeling of network connections.
Since we were working on intrusion detection issues together with system administrators at the University of Minnesota, we could not apply all developed algorithms, but only the most prominent one. For this purpose we have selected the LOF approach, since it achieved the most successful results on publicly available DARPA’98 data set, especially in detecting single-connection attacks. The LOF technique showed also great promise in detect-ing novel intrusions in real network data and during the past few months it has been very successful in automati-cally identifying several novel intrusions at the University of Minnesota that could not be detected using state-of-the-art intrusion detection systems such as SNORT [26]. Many of these attacks have been on the high-priority list of CERT/CC recently. Examples include:
• On August 9th, 2002, CERT/CC issued an alert “widespread scanning and possible denial of service activity targeted at the Microsoft-DS service on port 445/TCP” as a novel Denial of Service (DoS) attack that had not been observed before. In addition CERT/CC expressed “interest in receiving reports of this activity from sites with detailed logs and evi-dence of an attack.” This type of attack was the top ranked outlier on August 13th, 2002, by our anomaly detection tool in its regular analysis of University of Minnesota traffic. The port scan module of SNORT could not detect this attack without requiring very large memory, since the port scanning was a low rate non-sequential one.
• On June 13th, 2002, CERT/CC sent an alert for an at-tack that was “scanning for an Oracle server”. This can be a potentially insidious type of database attack. Our tool identified an instance of this attack on Au-gust 13th from the UM network flow data by listing it is as the second highest ranked outlier. This type of attack is difficult to detect using other techniques, since the Oracle scan was embedded within much larger Web scan, and the alerts generated by Web scan could potentially overwhelm the human analysts.
• On August 8th and 10th, 2002, our techniques identi-fied machines running a Microsoft PPTP VPN server, and a FTP server on non-standard ports, which are policy violations. Both attacks were the top ranked outliers. Since FTP attack did not have a known sig-nature SNORT did not detect it. For the VPN attack,
the collected GRE traffic is part of the normal traffic, and not analyzed by tools such as SNORT.
• On October 10th, our anomaly detection tool detected two activities of slapper worm that were not identi-fied by SNORT since they were variations of existing warm code. These worms could be potentially identi-fied by SNORT using possible rules, but the false alarm rate will be too high.
• On October 10th, distributed windows networking scan from two different source locations was identi-fied by our technique. It is interesting to note that all the network connections associated with this attack were assigned the same anomaly score, which indi-cated that the connections belong to the same attack. Since this was also slow scanning activity, SNORT was not able to detect it. Using appropriate rules SNORT would be able to see two or three independ-ent scanning attacks in the best case, but powerless to see a distributed attack.
5. Conclusions and Future Work
Several intrusion detection schemes for detecting net-
work intrusions are proposed in this paper. When applied to KDDCup’99 data set, developed algorithms for learn-ing from rare class were more successful in detecting network attacks than standard data mining techniques. Experimental results performed on DARPA 98 and real network data indicate that the LOF approach was the most promising technique for detecting novel intrusions. When performing experiments on DARPA’98 data, the unsupervised SVMs were very promising in detecting new intrusions but they had very high false alarm rate. Therefore, future work is needed in order to keep high detection rate while lowering the false alarm rate. In addi-tion, for the Mahalanobis based approach, we are cur-rently investigating the idea of defining several types of “normal” behavior and measuring the distance to each of them in order to identify the anomalies.
Our continuing objective is to develop an overall framework for defending against attacks and threats to computer systems. Data generated from network traffic monitoring tends to have very high volume, dimensional-ity and heterogeneity, making the performance of serial data mining algorithms unacceptable for on-line analysis. In addition, cyber attacks may be launched from several different locations and targeted to many different sources, thus creating a need to analyze network data from several networks in order to detect these distributed attacks. Therefore, development of new classification and anom-aly detection algorithms that can take advantage of high performance computers and be computationally tractable for on-line and distributed intrusion detection is a key component of this project. To detect known attacks, our approach will use the public-domain signature-based
29
techniques, while unknown and novel attacks will be de-tected using our anomaly detection schemes. According to our preliminary results on real network data, there is a significant non-overlap of our anomaly detection algo-rithms with the SNORT intrusion detection system, which implies that they could be combined in order to increase coverage. In addition, the system will have a visualization tool to aid the analyst in better understanding anoma-lous/suspicious behavior detected using our techniques.
In addition, we plan to extend our research in applying data mining for other security aspects including preven-tion from cyber attacks, recovery from them, identifying new system vulnerabilities and setting new policy mecha-nisms. Finally, we also intend to apply our rare class pre-dicti0on models as well as anomaly/outlier detection algo-rithms to various applications such as credit card fraud detection, insurance fraud detection and detecting indi-viduals with rare medical syndromes.
Acknowledgments
The authors are grateful to Richard Lippmann and
Daniel Barbara for providing data sets. This work was supported by Army High Performance Computing Re-search Center contract number DAAD19-01-2-0014. The content of the work does not necessarily reflect the posi-tion or policy of the government and no official endorse-ment should be inferred. Access to computing facilities was provided by the AHPCRC and the Minnesota Super-computing Institute.
References
1. Successful Real-Time Security Monitoring, Riptech Inc.
white paper, September 2001. 2. W. Lee, S. J. Stolfo, Data Mining Approaches for Intrusion
Detection, Proceedings of the 1998 USENIX Security Sym-posium, 1998.
3. E. Bloedorn, et al., Data Mining for Network Intrusion Detection: How to Get Started, MITRE Technical Report, August 2001.
4. J. Luo, Integrating Fuzzy Logic With Data Mining Meth-ods for Intrusion Detection, Master's thesis, Department of Computer Science, Mississippi State University, 1999.
5. D. Barbara, N. Wu, S. Jajodia, Detecting Novel Network Intrusions Using Bayes Estimators, First SIAM Conference on Data Mining, Chicago, IL, 2001.
6. S. Manganaris, M. Christensen, D. Serkle, and K. Hermix, A Data Mining Analysis of RTID Alarms, Proceedings of the 2nd International Workshop on Recent Advances in In-trusion Detection (RAID 99), West Lafayette, IN, Septem-ber 1999.
7. D.E. Denning, An Intrusion Detection Model, IEEE Trans-actions on Software Engineering, SE-13:222-232, 1987.
8. H.S. Javitz, and A. Valdes, The NIDES Statistical Compo-nent: Description and Justification, Technical Report, Computer Science Laboratory, SRI International, 1993.
9. R. P. Lippmann, D. J. Fried, I. Graf, J. W. Haines, K. P. Kendall, D. McClung, D. Weber, S. E. Webster, D. Wy-schogrod, R. K. Cunningham, and M. A. Zissman, Evaluat-ing Intrusion Detection Systems: The 1998 DARPA Off-line Intrusion Detection Evaluation, Proceedings DARPA Information Survivability Conference and Exposition (DISCEX) 2000, Vol 2, pp. 12-26, IEEE Computer Society Press, Los Alamitos, CA, 2000.
10. F. Provost and T. Fawcett, Robust Classification for Impre-cise Environments, Machine Learning, vol. 42/3, pp. 203-231, 2001.
11. M. Joshi, V. Kumar, R. Agarwal, Evaluating Boosting Al-gorithms to Classify Rare Classes: Comparison and Im-provements, First IEEE International Conference on Data Mining, San Jose, CA, 2001.
12. M.Joshi, R. Agarwal, V. Kumar, Predicting Rare Classes: Can Boosting Make Any Weak Learner Strong?, Proceed-ings of Eight ACM Conference ACM SIGKDD Interna-tional Conference on Knowledge Discovery and Data Min-ing, Edmonton, Canada, 2002.
13. M. Joshi, R. Agarwal, V. Kumar, PNrule, Mining Needles in a Haystack: Classifying Rare Classes via Two-Phase Rule Induction, Proceedings of ACM SIGMOD Conference on Management of Data, May 2001.
14. M. Joshi, V. Kumar, CREDOS: Classification using Ripple Down Structure (A Case for Rare Classes), in review.
15. A. Lazarevic, N. Chawla, L. Hall, K. Bowyer, SMOTE-Boost: Improving the Prediction of Minority Class in Boosting, AHPCRC Technical Report, 2002.
16. R. P. Lippmann, R. K. Cunningham, D. J. Fried, I. Graf, K. R. Kendall, S. W. Webster, M. Zissman, Results of the 1999 DARPA Off-Line Intrusion Detection Evaluation, Proceedings of the Second International Workshop on Re-cent Advances in Intrusion Detection (RAID99), West La-fayette, IN, 1999.
17. V. Barnett, T. Lewis, Outliers in Statistical Data, John Wiley and Sons, NY 1994.
18. C. C. Aggarwal, P. Yu, Outlier Detection for High Dimen-sional Data, Proceedings of the ACM SIGMOD Confer-ence, 2001.
19. E. Knorr, R. Ng, Algorithms for Mining Distance-based Outliers in Large Data Sets, Proceedings of the VLDB Con-ference, 1998.
20. S. Ramaswamy, R. Rastogi, K. Shim, Efficient Algorithms for Mining Outliers from Large Data Sets, Proceedings of the ACM SIGMOD Conference, 2000.
21. M. M. Breunig, H.-P. Kriegel, R. T. Ng, J. Sander, LOF: Identifying Density-Based Local Outliers, Proceedings of the ACM SIGMOD Conference, 2000.
22. P.C. Mahalanobis, On Tests and Meassures of Groups Di-vergence, International Journal of the Asiatic Society of Benagal, 26:541, 1930.
23. B. Schölkopf, J. Platt, J. Shawe-Taylor, A.J. Smola, R.C. Williamson, Estimating the Support of a High-dimensional Distribution, Neural Computation, vol. 13, no. 7, pp. 1443 1471, 2001.
24. J. McHugh, The 1998 Lincoln Laboratory IDS Evaluation (A Critique), Proceedings of the Recent Advances in Intru-sion Detection, 145-161, Toulouse, France, 2000.
25. Tcptrace software tool, www.tcptrace.org. 26. SNORT Intrusion Detection System. www.snort.org.
30