data mart reconciliation in virtual innovation factories
TRANSCRIPT

Data Mart Reconciliationin Virtual Innovation Factories⋆
Claudia Diamantini, Domenico Potena, and Emanuele Storti
Dipartimento di Ingegneria dell’InformazioneUniversita Politecnica delle Marche
via Brecce Bianche, 60131 Ancona, Italy{c.diamantini,d.potena,e.storti}@univpm.it
Abstract. The present paper deals with the problem of collaboration atstrategic level in innovation-oriented Virtual Enterprises. The problem istaken from the perspective of sharing a special kind of data, Key Perfor-mance Indicators, that are measures adopted to monitor the achievementof certain strategic goals. We discuss the main conflicts that can arise inmeasures coming from autonomous enterprises, adopting the conceptualmultidimensional cube model. Then we propose a novel semantic modelto deal with conflicts related to the structure of a measure, that arisewhen the “same” KPI is calculated in different ways by different enter-prises. Finally, conflict reconciliation strategies enabled by the semanticmodel are discussed.
Keywords: semantic reconciliation, data mart integration, data warehouse,Key Performance Indicators, Virtual Innovation Factories
1 Introduction
In an Open Innovation scenario [1] enterprises pool their experiences and re-sources in order to leverage their innovation potential, and to optimize innova-tion costs. In other words, a Virtual Enterprise (VE) is established, namely a(temporary) network of independent organizations that collaborate in order toachieve a common goal. In particular, they form a Virtual Innovation Factory(VIF), aimed at the production of innovation [2]. It is a dynamic environmentwhere enterprises enter and leave over time according to their interest for sharedinnovation projects, and is characterized by openness, autonomy and distribu-tion of partners as well as heterogeneity and distribution of resources. Froman information system point of view, a VIF should implement all the kinds ofprocesses of a traditional enterprise, from (innovation) production processes, tomanagement and strategic control. Innovation management is the focus of thepresent paper: although innovation is largely perceived as a matter of creativity,
⋆ This work has been partly funded by the European Commission through the ICTProject BIVEE: Business Innovation and Virtual Enterprise Environment (No. FoF-ICT-2011.7.3-285746).

a systematic monitoring and control of the actions performed during an innova-tion project is necessary to transform a great idea into a new successful product,and to guarantee efficiency and effectiveness to the whole process. In the EUProject BIVEE1 a reference framework has been developed, that includes thedefinition of a set of innovation Key Performance Indicators (KPIs). KPIs area kind of performance measurement, that allow to assess the achievement ofcertain strategic goals, like the percentage of defective products, the level ofcustomer satisfaction or, in the context of innovation, the number of new ideasproduced. In order for a VIF to work properly, partners should agree on theset of KPIs to use and share data for their assessment. The sharing of KPIsdemonstrates itself particularly challenging due to a number of heterogeneitiesthat can arise. They will be discussed in this paper in the context of Data Marts,i.e. computer systems for KPI management and decision support, implementingthe conceptual multidimensional cube model.
The key element of a Data Mart schema is the fact, i.e. a particular goal to bemonitored (e.g. productivity). A Fact schema includes a set of measures, allowingto assess the goal under different perspectives (for instance, productivity can bemeasured by monitoring the total number of produced ideas, their revenue, theaverage number of ideas per employee). Measures correspond in fact to the notionof KPI. Each measure is analysed along a set of dimensions, discrete attributes,usually arranged in hierarchies, specifying a way to aggregate and segment theanalysis. For the number of new ideas produced, relevant dimensions are time(e.g. monthly trend), product lines, organization.
In the Literature, as shown in Section 2, much work is devoted to the problemof reconciliation of heterogeneities that can arise when trying to integrate DataMarts from autonomous enterprises. Among them, they mainly address conflictsdue to different naming or unit of measure conventions, structure and defini-tion of the dimensional hierarchies. In this paper we deal with reconciliation atmeasure level considering heterogeneities related to the structure of a measure,intended as the formula used to calculate the KPI, as discussed in Section 3.
The approach, described in Section 4, relies on the definition of a semanticmultidimensional model serving as a shared global model on which every elementbelonging to a fact schema in the Data Marts (i.e. measure and dimensions) ismapped. The main novelty of such a model is that it includes both a concep-tual definition of KPIs and the mathematical representation of their formulas.Although the full conceptual specification of KPIs and their formulas in real-world scenarios is a demanding task and may require a significant effort, theexperience gained within the BIVEE project suggests that such an approach isparticularly stable and robust, as the model requires only minor and incrementalchanges once it has been developed. On the top of the model a set of logic-basedfunctionalities are defined, capable to effectively ease Data Mart integration bysupporting strategies for conflicts reconciliation based on formula manipulation,shown in Section 5 together with a case-study. Finally, Section 6 ends the paperand proposes extensions to this work.
1 http://bivee.eu

2 Related Work
Although the increasing interest in collaboration and networking in business en-vironments, there is a general lack of work on KPIs reconciliation, especiallyin distributed and collaborative contexts. Most of the proposals in the Litera-ture about integration of independent Data Marts has dealt with the resolutionof conflicts about reconciliation of heterogeneous dimensions (e.g., [3, 4]), whileonly few specifically focused on conflicts about measures (e.g. [4], that proposesan XML-based approach). Recently, due to the explosive growth of distributedapplications, semantic technologies have gained more and more interest both asa global conceptualization useful to support the definition of semantic mappingsbetween the local sources and the global ontology, and then to ease reconciliationand integration of Data Marts (e.g. [5]) However, to the best of our knowledge,the only attempt to deal with design and interoperability issues related to thecompound nature of indicators is in [6], where mappings between measures in-clude the description of the formula linking them. However, KPI formulas arepurely syntactic and no reasoning is enabled.
For what concerns formal definition of indicators, several approaches to se-mantic modeling have been proposed (see [7] for a survey). However, almost allof them are specifically targeted to support more advanced monitoring (e.g. [8])or analysis (e.g., [8, 9]) within the context of business processes, and hence fo-cusing only on the operational levels with little or no regard to strategic andmanagerial perspectives, or to innovation KPIs. To the best of our knowledge,the only work dealing with the explicit representation of KPI formulas is byBarone et al. [8], in which indicators are formally represented and arranged inhierarchies, with the aim to exploit run-time monitoring and what-if analysis ofbusiness processes.
3 Typologies of conflicts
Integration of heterogeneous Data Marts from autonomous enterprises is a par-ticularly challenging task due to the multidimensional and aggregate natureof the information. Heterogeneities lead to a large number of possible conflictswhen semantically related elements (facts, dimensions and measures) are charac-terized by different properties. In the following, to support the discussion aboutthe specific typologies of conflict, we refer to a case study that will be used asan illustrative example through the paper. Following the BIVEE framework, weconsider a scenario in which two enterprises, to establish a Virtual Enterprise,agree on a set of KPIs to use and share data they have at disposal. These dataare the KPIs they usually adopt within the boundaries of the enterprise to mon-itor and assess how they are innovating. Figures 1 and 2 show the Data Martsused by the enterprise A (hereafter DMA) and enterprise B (DMB) to manageinnovation projects.
Two Data Marts are characterized by conflicts between facts if they areconceived to analyse the same phenomenon in different ways. Usual fact conflicts

Fig. 1. Innovation Data Mart of the Enterprise A.
occur when Data Marts refer to different representation models (e.g., star schemavs. snowflake). An inconsistent fact schema occurs when two semantically relatedData Marts describe the same fact through different set of measures [10], likein the case study. This problem is similar to a structure conflict in databaseintegration, where the same concept is described using two different structures.
As regards dimensions, a dimension naming conflict occurs when two DataMarts have different names for the same dimensional element (member, level ordimension). In our example, ProductDim in DMA and ProjectDim in DMB re-fer to the same dimension, and Team and Group in the OrganizationDim to thesame level. A dimension schema conflict occurs when Data Marts have differentdimensions or different hierarchies for the same dimension; for instance, the hier-archy of OrganizationDim is Person → Team → Department → Enterprise inDMA and Person → Group → Enterprise in DMB . Finally, there is a dimen-sion member conflict when two semantically related levels differ in members.This kind of conflict can not be recognized by just observing the Data Martschema, and values of dimensional tables must be considered. In our example,since the two SMEs are autonomous, it is very likely that there are no com-mon members, apart those for the time dimension, until the two SMEs begin todevelop projects together.
Measure conflicts occur when semantically related measures of the two DataMarts differ in name (measure naming conflict), formulas (inconsistent formula),values (inconsistent measures) and units (measure scaling conflict). In order todetect these conflicts, it is necessary to rely on an expressive representation modelcapable to deepen the meaning of the reported indicators. In our case study theenterprises provide also the description of metrics used in DMs, as given in theglossaries of Table 1 and Table 2. We observe measure naming conflicts, sinceTotalCost in DMA and to TotalInnoCosts in DMB refer to the same indicator,

Fig. 2. Innovation Data Mart of the Enterprise B.
Data Mart A (DMA)
KPI Description
ROI Return on investment related to innovation projects, that isthe ratio between value of received orders related to prod-ucts designed in innovation projects and costs of innovationprojects
TotalCost The sum of materials costs, personnel costs and other costsrelated to innovation projects
NumInternalIdeas Number of ideas generated from enterprise’s employees
NumExternalIdeas Number of idea generated from the external stakeholders
IdeaYield The ratio of proposed ideas that have been developedTable 1. Measure glossary of DMA
but they have different names: this is a case of synonymy. The use of IdeaYieldleads to another measure naming conflict, namely a homonymy. In this case, thetwo measures share the same name, but from the description one understands avariation in the way they are computed, which makes de-facto the two measuressemantically different.
It is noteworthy that it is hard to recognize homonymies relying only on thetextual description provided by enterprises, which by nature is ambiguous andnot formalized. Indicators TotalCost and TotalInnoCosts give origin also to aninconsistent formula, since they refer to the same metric about the total cost ofan innovation project, but their description suggests a different way to computeit. In the DMA the total cost of innovation is given as the sum of different kindsof cost, while in DMB the formula is given as the sum of costs of each wave. Sincethe cost of a wave can be divided in turn in material, personnel and other costs,the two formulas are equivalent and corresponding measures point to the samemetric. Also, in this situation it is not easy to recognize the conflict from textual

Data Mart B (DMB)
KPI Description
OrdersInnoProj Sum of total margin of orders related to innovation projects
TotalInnoCosts All costs involved in the whole innovation life-cycle (fromcreativity to engineering)
NumHoursInnoProj Number of hours for innovation projects
IdeaYield Ratio between ideas proposed and ideas that have been ac-cepted for the Engineering wave, and then will be furtherdeveloped
NumIdeaAcceptedInEng The number of idea accepted for the Engineering waveTable 2. Measure glossary of DMB
description, and further details about formulas used to compute the indicatorsare required. Furthermore, it is noteworthy that IdeaYieldmeasures do not leadto an inconsistent formula: the two measures refer to semantically non-relatedindicators. We have to emphasize that values provided in the Data Marts cannot be used to identify measure conflicts; since the enterprises are different,the sets of dimensional members on which indicators are computed have almostempty intersection. For the same reason, we do not expect any inconsistentmeasures conflict in this case study; in fact, this kind of conflict occurs whentwo semantically related measures, having same name and same formula, takedifferent values on common members. Finally, to simplify the discussion, weassume that there are no measure scaling conflicts in our example.
Given that the two DMs have only one indicator in common (i.e. the totalcost of innovation project), more information is of course needed to monitor andassess the innovation projects that have been carried out and will be developedtogether. For instance, the two SMEs may decide that it is useful to observe alsothe TotalOrdersRelatedInnovationProjects, namely the value of orders for prod-ucts/services that have been developed as outcome of an innovation project,and the IdeasProposed, that is the total number of ideas that have been pro-posed for a given common project. The former KPI is available only in DMA
(i.e. OrdersInnoProj), while the latter is in no Data Mart. Hence, in order toobtain these KPIs, each enterprise should involve their own IT Managers, pro-viding them the new requirements and waiting for the new implementation ofthe Data Mart. Such a process is time-consuming and constitutes a barrier tothe formation of a new VIF or to the entry of new enterprises in an existing VIF.Furthermore, we have to emphasize that Data Marts store historical data ob-tained over time by querying transactional databases, which by nature maintaincurrent data. Therefore, often it is not possible to obtain values of additionalKPIs related to past projects, hence producing sparse Data Marts.
4 Semantic Multidimensional Model
In this work, in order to provide support to integration of heterogeneous DataMarts, we extend the multidimensional model with semantic annotations, by

mapping every element in a Data Mart with a corresponding concept of an on-tology called KPIOnto. Such an ontology is devoted to formally specify anddisambiguate the meaning of both measures and dimensions and the relationsamong them. In our context every fact table contains a set of measures relatedto KPIs whose semantics is formalized into KPIOnto as instances of the classIndicator. The class Indicator arranges KPIs in classes according to the ValueReference Model (VRM) taxonomy [11]. Indicators can be either atomic or com-pound: while the former is obtained as direct aggregation of transactional data,the latter is a structured datum built by combining several indicators of lowerlevel, that are its dependencies. An indicator is fully described only if both itsshared meaning, structure and dependencies are made explicit. For this reason,in our model for each compound indicator a Formula must be defined, i.e. analgebraic expression describing how to compute it from its dependencies. For
instance, IdeaY ield =NumIdeaAcceptedInEng
IdeasProposed.
In multidimensional models, every dimension is structured into a hierarchy oflevels (e.g., the time dimension has Year, Semester, Month, Day, Week as levels),where each level represents a different way of grouping elements of the dimension[12], namely members (e.g., “2013” and “2014” are members of the level “Year”for the dimension “Time”). Resorting to the approach proposed in [13], thedimensions along which an indicator is measured (e.g., process, organization,time) are modeled as classes, where levels are their subclasses. A hierarchy amongmembers is defined through a part-of relation, that links a member of a levelto one belonging to an upper level (e.g., “June 2014”, member of “Month” ispart-of “2014”, member of “Year”).
For the implementation of the conceptual model introduced herein we makeuse of various knowledge representation formalisms and languages. In partic-ular, we refer to OWL2-RL for the representation of descriptive informationabout indicators, whereas a more sophisticated representation language is neededfor the encoding of mathematical definitions of KPIs. To this aim, we rely toMathML [14] and OpenMath [15], that are mathematical standards for describ-ing both syntax and semantics of formulas in a machine-readable fashion. Onthe top of these languages, in order to define KPI reasoning functionalities as asupport to integration and analysis, we need to represent both OWL2-RL ax-ioms and MathML formulas in a common logic-based layer. To this end, we referto the first-order logic and define the functionalities in logic programming (LP),to which both languages have a simple translation preserving expressiveness and(sub)polynomial complexity in reasoning.
Hence, KPI reasoning functionalities are implemented as Prolog predicates,and include basic functions for formula manipulation, capable to simplify andsolve an equation, and more specific functions to support integration and ad-vanced analysis. The support to the integration is mainly based on functions forchecking inconsistencies among independent definitions of indicators and for thereconciliation of indicators provided by different enterprises. For what concernsanalysis, the proposed ontological model enables usual OLAP operations overindicators, namely roll-up, that has a direct correspondence with the part-of

relationship, and drill-down. Moreover, the ontological description of formulasand dimensions enables a generic method for exploring multidimensional data bymoving from one level of detail to the next, namely an extended drill-down. Thisoperator generalizes the definition of drill-down, allowing to decompose the valueof a KPI both descending the hierarchy of a dimension (from the value about“2013” to values about “January 2013”, ..., “December 2013”) and extractingthe values of components of its mathematical formula (from “IdeaYield” to “Nu-mIdeaAcceptedInEng” and “IdeasProposed”).
In addition, further predicates are devoted to provide specific support forVirtual Enterprise setup. Such functions are developed to support enterprises inunderstanding how a certain indicator can be measured by using other indicatorsalready available in the ontology, exploiting inference and algebraic manipula-tions over the set of formulas. We refer the interested reader to [2] for moredetails on KPIOnto and to [16] for more details on reasoning functionalities.
5 Conflict Reconciliation
By exploiting the semantic model described in previous section, several con-flicts can be easily solved once the semantic annotation of the Data Marts hasbeen performed. Annotation is usually done by means of manual/automatictechniques well studied in the Literature [17], that for lack of space are not dis-cussed here. For what concerns naming conflicts, two elements from differentData Marts linking to the same ontological concept are considered synonymous.As concerns dimension schema conflict, the joint use of part-of relations betweenlevels’ members and the semantic annotation of Data Mart elements, as exem-plified in Figure 3, allows us to derive common hierarchies and, hence, to resolvethe conflict. As an example, consider the conflict due to the OrganizationDim
dimension of our case study:
– since members of both level Team in DMA and level Group in DMB point tothe same class in the ontology, the two levels are equivalent;
– since instances of the Team class in the ontology are part-of instances of De-partment class, which in turn are linked by the same relation with instancesof Enterprise class, and being part-of transitive, we derive that instances ofTeam are part-of instances of Enterprise.
As a consequence, the OrganizationDim hierarchy of DMA is contained inthe one of DMB . Hence, the hierarchy Person → Team → Enterprise is sharedby the two DMs, and can be used to perform drill-across queries over both DMs.
A specific goal of this work is to address measure conflicts that occur whentwo measures are associated to different formulas. Differently from other propos-als in the Literature, given the explicit formal representation of mathematicalformulas of KPIs, our semantic model allows to automatically recognize:
– homonymies, avoiding to handle in the same way two measures with thesame name that are semantically not equivalent;
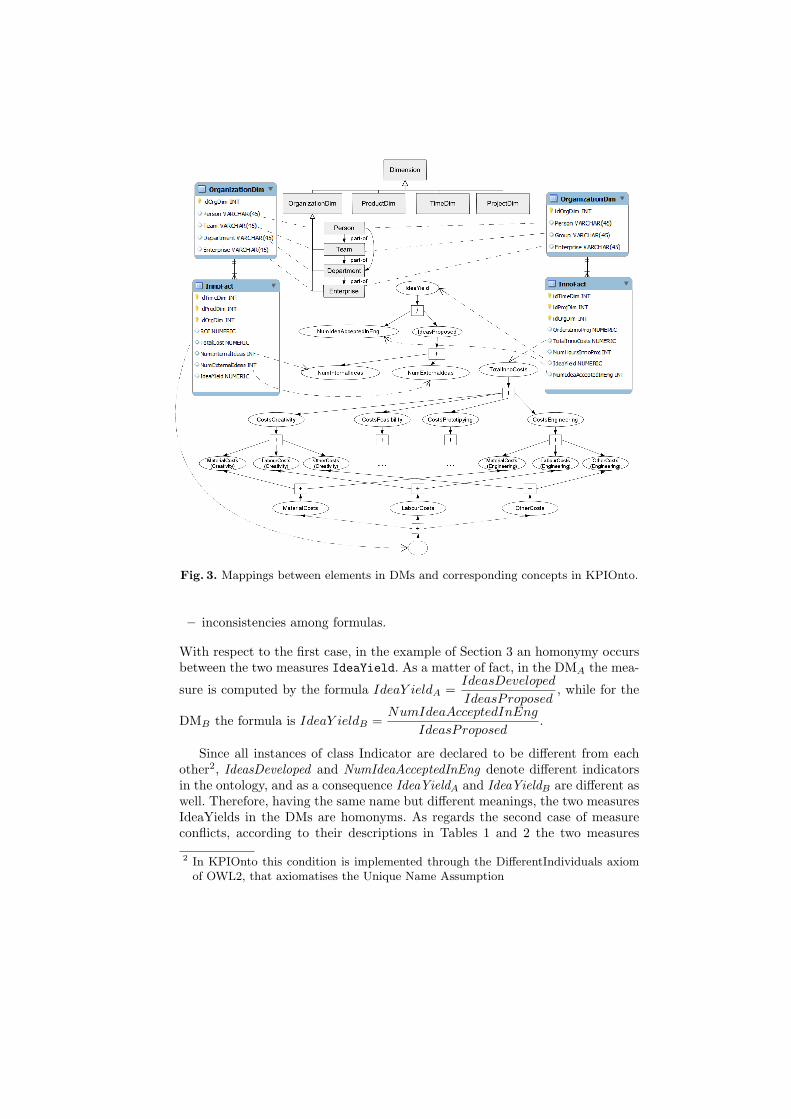
Fig. 3. Mappings between elements in DMs and corresponding concepts in KPIOnto.
– inconsistencies among formulas.
With respect to the first case, in the example of Section 3 an homonymy occursbetween the two measures IdeaYield. As a matter of fact, in the DMA the mea-
sure is computed by the formula IdeaY ieldA =IdeasDeveloped
IdeasProposed, while for the
DMB the formula is IdeaY ieldB =NumIdeaAcceptedInEng
IdeasProposed.
Since all instances of class Indicator are declared to be different from eachother2, IdeasDeveloped and NumIdeaAcceptedInEng denote different indicatorsin the ontology, and as a consequence IdeaYieldA and IdeaYieldB are different aswell. Therefore, having the same name but different meanings, the two measuresIdeaYields in the DMs are homonyms. As regards the second case of measureconflicts, according to their descriptions in Tables 1 and 2 the two measures
2 In KPIOnto this condition is implemented through the DifferentIndividuals axiomof OWL2, that axiomatises the Unique Name Assumption

TotalCost and TotalInnoCosts have the same meaning. However, an inconsis-tency can be identified between their formulas:
DMA: TotalCost = MaterialsCosts+ LabourCosts+OtherCostsDMB: TotalInnoCosts = CostsCreativity+CostsFeasibility+CostsPrototyping+
CostsEngineering
By using formulas in the ontology we have that MaterialsCosts is the sum ofcosts related to materials of the four phases of an innovation project3, and thesame holds true for LabourCosts and OtherCosts (see Figure 3). Furthermore,costs of each phase is given as the sum of costs of materials, labour and otherfor the given phase. As a consequence, it is straightforward to derive that theformulas for TotalCost and TotalInnoCosts, although syntactically different,are mathematically equivalent. Hence, the two measures can be mapped to thesame indicator in the ontology.
The proposed semantic model allows to extract also information that is notexplicitly provided by schemas of DMs. Besides the application to the problemof integration of heterogeneous Data Marts, this approach can be also appliedto the execution of drill-across queries. In both cases the output is a new viewover the whole data warehouse: while a new integrated Data Mart can be con-sidered a materialized view, a drill-across generates a virtual view. To providean example, a drill-across query can be used to extract the value of orders re-lated to innovation projects (i.e. TotalOrdersRelatedInnovationProjects), whichis directly provided only by one enterprise, or the number of ideas proposed (i.e.IdeasProposed), that is not given in any Data Mart. In the following, we discussthis second example, as it is more general.
Let us assume that the two SMEs are working on a joint innovation projectcalled P. During the collaboration the two enterprise have continued to col-lect KPIs as represented in DMA and DMB , without altering their policies fordata sharing and their information systems. At VIF level, SMEs want to anal-yse the values of IdeasProposed for the whole project P and for each Month,without providing further details about organization (i.e. at maximum level ofthe OrganizationDim). In order to simplify the description, we introduce thefollowing notation for a multidimensional query MQ:
MQ =< {I, L,M, σ, S} >
where I is the set {i1, . . . , in} of requested KPIs, L is the set {l1, . . . , lm} ofrequested levels, M the set {m1, . . . ,mm} of members on which to filter, σ isan optional boolean filtering condition, and S is the source Data Mart. WhileM works on members, the filter σ defines a condition on other elements ofthe DM: both descriptive attributes of dimensional schema (e.g. Budget>50K)and values of measures (e.g. NumInternalIdeas<NumExternalIdeas). Hence, theprevious query at VIF level becomes:
MQ =<{IdeasProposed},{Product, Month},{Product=’P’},TRUE,VIF>
3 In BIVEE they are named Creativity, Feasibility, Prototyping, Engineering.

In order to answer the query, we proceed as follows:
1. From the ontology, we obtain that the aggregation function of IdeasProposedis SUM along all dimensions. Hence, given the additivity of the measure, thequery can be rewritten as follows:MQ = MQA +MQB , where:MQA =<{IdeasProposed},{Product,Month},{Product=’P’},TRUE,DMA>MQB =<{IdeasProposed},{Product,Month},{Product=’P’},TRUE,DMB>
2. From the formula of IdeasProposed in the ontology (see also Figure 3), MQA
becomes:MQA =< {NumInternalIdeas+NumExternalIdeas},{Product, Month},{Product=’P’},TRUE,DMA>
3. By using reasoning services, we infer a new formula for IdeasProposed, whichis built on measures provided in DMB , and allow us to rewrite MQB :
MQB =< {NumIdeaAcceptedInEng
IdeaY ield},{Product,Month},
{Product=’P’},TRUE,DMB>
6 Conclusion
In this paper we discussed a preliminary work on an ontology-based approachfor supporting the reconciliation of heterogeneous Data Marts in the context ofVirtual Innovation Factories, in which collaborating partners share some datain order to achieve a common innovation project. We analysed the various typesof conflicts occurring in Data Mart integration, and presented a strategy forreconciliation of conflicts related to measures, that in our context refer to KPIsmeasuring parameters of an innovation projects. Unlike other solutions in theLiterature, the usage of a semantic description of KPIs and their formulas, to-gether with the reasoning functionalities, allows to recognize both homonymiesamong measures, and algebraic equivalences/inconsistencies among formulas.
Although the approach described herein is focused on reconciliation, it canbe extended with the aim to recognize also similarities among indicators thathave different but structurally similar formulas, e.g. X ∗Y and X ∗Y +c. Furtherinvestigation will also be devoted to consider other typologies of conflicts thatmay occur among indicators with the same formula but with different descriptiveproperties. For instance, the conflict related to different sets of dimensions forthe same indicator can be reconciliated by aggregating at the highest level thosedimensions that are not in common.
Within the BIVEE project, 356 KPIs (of which 281 compound and 75 atomic)have been represented so far according to the model described in this paper. Theevaluation of complexity and completeness issues of the reasoning functionalitiesin this real-world context will be topic of future work.
References
1. Chesbrough, H.: Open Innovation: The New Imperative for Creating and Profitingfrom Technology. Harvard Business Press, Boston (2003)

2. Diamantini, C., Potena, D., Proietti, M., Smith, F., Storti, E., Taglino, F.: Asemantic framework for knowledge management in virtual innovation factories.Int. J. Inf. Syst. Model. Des. 4 (2013) 70–92
3. Torlone, R.: Two approaches to the integration of heterogeneous data warehouses.Distrib. Parallel Databases 23 (2008) 69–97
4. Tseng, F.S., Chen, C.W.: Integrating heterogeneous data warehouses using xmltechnologies. J. Inf. Sci. 31 (2005) 209–229
5. Niemi, T., Toivonen, S., Niinimki, M., Nummenmaa, J.: Ontologies with semanticweb/grid in data integration for olap. Int. J. Semantic Web Inf. Syst. 3 (2007)25–49
6. Golfarelli, M., Mandreoli, F., Penzo, W., Rizzi, S., Turricchia, E.: Olap queryreformulation in peer-to-peer data warehousing. Information Systems 37 (2012)393–411
7. del Rıo-Ortega, A., Resinas, M., Cabanillas, C., Ruiz-Cortes, A.: On the definitionand design-time analysis of process performance indicators. Information Systems38 (2013) 470–490
8. Barone, D., Jiang, L., Amyot, D., Mylopoulos, J.: Reasoning with key performanceindicators. In Johannesson, P., Krogstie, J., Opdahl, A., eds.: The Practice of En-terprise Modeling. Volume 92 of Lecture Notes in Business Information Processing.Springer Berlin Heidelberg (2011) 82–96
9. Del-Rıo-Ortega, A., Resinas, M., Ruiz-Cortes, A.: Defining process performanceindicators: An ontological approach. In: Proceedings of the 2010 InternationalConference on On the Move to Meaningful Internet Systems - Volume Part I.OTM’10, Berlin, Heidelberg, Springer-Verlag (2010) 555–572
10. Diamantini, C., Potena, D.: Data mart integration at measure level. In De Marco,M., Te’eni, D., Albano, V., Za, S., eds.: Information Systems: Crossroads for Or-ganization, Management, Accounting and Engineering. Physica-Verlag HD (2012)123–131
11. Value-Chain Group: (Value reference model (vrm), http://www.value-chain.org/en/cms/1960)
12. Kimball, R., Ross, M.: The Data Warehouse Toolkit: The Complete Guide toDimensional Modeling. 2nd edn. John Wiley & Sons, Inc., New York, NY, USA(2002)
13. Neumayr, B., Schrefl, M.: Multi-level conceptual modeling and owl. In: Proceedingsof the ER 2009 Workshops on Advances in Conceptual Modeling - ChallengingPerspectives, Berlin, Heidelberg, Springer-Verlag (2009) 189–199
14. Ausbrooks, R., Carlisle, S.B.D., Chavchanidze, G., Dalmas, S., Devitt, S., Diaz,A., Dooley, S., Hunter, R., Ion, P., Kohlhase, M., et al.: Mathematical markuplanguage (mathml) version 3.0. w3c working draft of 24. september 2009. WorldWide Web Consortium 2009 (2009)
15. Buswell, S., Caprotti, O., Carlisle, D.P., Dewar, M.C., Gaetano, M., Kohlhase,M.: The open math standard. Technical report, version 2.0. Technical report, TheOpen Math Society, 2004. http://www. openmath. org/standard/om20 (2004)
16. Diamantini, C., Potena, D., Storti, E.: A logic-based formalization of kpis forvirtual enterprises. In Franch, X., Soffer, P., eds.: Advanced Information SystemsEngineering Workshops. Volume 148 of Lecture Notes in Business InformationProcessing. Springer Berlin Heidelberg (2013) 274–285
17. Doan, A., Halevy, A.Y.: Semantic-integration research in the database community.AI Mag. 26 (2005) 83–94