dart markers: diversity analyses and mapping in sorghum bicolor
TRANSCRIPT

BioMed CentralBMC Genomics
ss
Open AcceResearch articleDArT markers: diversity analyses and mapping in Sorghum bicolorEmma S Mace†1, Ling Xia†2, David R Jordan1, Kirsten Halloran1, Dipal K Parh3,4, Eric Huttner2, Peter Wenzl2 and Andrzej Kilian*2Address: 1The Department of Primary Industries & Fisheries, Queensland (DPI&F), Hermitage Research Station, Warwick, QLD 4370, Australia, 2Diversity Arrays Technology P/L, PO Box 7141, Yarralumla ACT 2600, Australia, 3School of Land and Food Sciences, University of Queensland, Brisbane, QLD 4072, Australia and 4Bureau of Sugar Experiment Station, DNRP, 50 Meiers Road, Indooroopilly, QLD 4068, Australia
Email: Emma S Mace - [email protected]; Ling Xia - [email protected]; David R Jordan - [email protected]; Kirsten Halloran - [email protected]; Dipal K Parh - [email protected]; Eric Huttner - [email protected]; Peter Wenzl - [email protected]; Andrzej Kilian* - [email protected]
* Corresponding author †Equal contributors
AbstractBackground: The sequential nature of gel-based marker systems entails low throughput and highcosts per assay. Commonly used marker systems such as SSR and SNP are also dependent onsequence information. These limitations result in high cost per data point and significantly limit thecapacity of breeding programs to obtain sufficient return on investment to justify the routine useof marker-assisted breeding for many traits and particularly quantitative traits. Diversity ArraysTechnology (DArT™) is a cost effective hybridisation-based marker technology that offers a highmultiplexing level while being independent of sequence information. This technology offerssorghum breeding programs an alternative approach to whole-genome profiling. We report on thedevelopment, application, mapping and utility of DArT™ markers for sorghum germplasm.
Results: A genotyping array was developed representing approximately 12,000 genomic clonesusing PstI+BanII complexity with a subset of clones obtained through the suppression subtractivehybridisation (SSH) method. The genotyping array was used to analyse a diverse set of sorghumgenotypes and screening a Recombinant Inbred Lines (RIL) mapping population. Over 500 markersdetected variation among 90 accessions used in a diversity analysis. Cluster analysis discriminatedwell between all 90 genotypes. To confirm that the sorghum DArT markers behave in a Mendelianmanner, we constructed a genetic linkage map for a cross between R931945-2-2 and IS 8525integrating DArT and other marker types. In total, 596 markers could be placed on the integratedlinkage map, which spanned 1431.6 cM. The genetic linkage map had an average marker density of1/2.39 cM, with an average DArT marker density of 1/3.9 cM.
Conclusion: We have successfully developed DArT markers for Sorghum bicolor and havedemonstrated that DArT provides high quality markers that can be used for diversity analyses andto construct medium-density genetic linkage maps. The high number of DArT markers generatedin a single assay not only provides a precise estimate of genetic relationships among genotypes, butalso their even distribution over the genome offers real advantages for a range of molecularbreeding and genomics applications.
Published: 22 January 2008
BMC Genomics 2008, 9:26 doi:10.1186/1471-2164-9-26
Received: 28 June 2007Accepted: 22 January 2008
This article is available from: http://www.biomedcentral.com/1471-2164/9/26
© 2008 Mace et al; licensee BioMed Central Ltd. This is an Open Access article distributed under the terms of the Creative Commons Attribution License (http://creativecommons.org/licenses/by/2.0), which permits unrestricted use, distribution, and reproduction in any medium, provided the original work is properly cited.
Page 1 of 11(page number not for citation purposes)

BMC Genomics 2008, 9:26 http://www.biomedcentral.com/1471-2164/9/26
BackgroundSorghum is a major staple food and fodder crop grownworldwide, with an annual average production of 61 mil-lion tonnes over the past decade [1]. The crop is tolerantof many biotic and abiotic stresses and is often grown inmore marginal cropping areas. In developing countries ittends to be a staple food and forage of the poor. In devel-oped countries it is used primarily as an animal feed. Sor-ghum is often preferentially grown in both situations as itis better adapted to water limited environments thanother cereal crops.
Investment in sorghum breeding and genomic resourceshas been less than for the other major cereals rice, wheat,maize and barley. Interest has focused on the crop due toits drought resistance and small genome size (~760 Mb)compared to close relatives maize (~2500 Mb) and sugar-cane (2550 to 4200 Mb) [2-4]. In recent years the poten-tial of sorghum as a biofuel crop has led to additionalinvestment culminating in the sequencing of the sorghumgenome [5].
Numerous studies have demonstrated that sorghum isvery diverse crop, with cultivated sorghums exhibitinggreat phenotypic variability. The cultivated germplasmhas been classified into five major races (bicolor, cauda-tum, durra, guinea and kafir) and 10 intermediate racesbased on panicle and spikelet morphology [6]. In order toexploit this diversity at the genotypic level, an efficientmarker system is required. Many molecular marker tech-nologies have been developed and applied to studyingpatterns of genetic diversity in sorghum germplasm col-lections and in breeding programs, including RFLPs [7-9],RAPDs [10,11], ISSRs [12], SSRs [13-19] and AFLPs[17,20]. However, the major limitation to the widespreaduse of current marker technologies in applied sorghumbreeding programs and germplasm collections is the highcost per data point. Applications that require wholegenome scans such as pedigree analysis [21], associationmapping [22] and mapping as you go (MAYG) [23], orlarge scale genotyping of germplasm collections [24] arenot cost effective using current technologies.
The current molecular marker technologies have charac-teristics which additionally affect the level of genome cov-erage, their discrimination ability, reproducibility andtechnical and time demand. A number of the limitationsassociated with the different marker technologies can beovercome by utilising specialised hardware such as highthroughput capillary electrophoresis machines, which canimpact on discrimination ability, reproducibility andspeed. However, the majority of the limitations are relatedto the sequential nature and high assay costs of the markertechnologies, in addition to reliance on DNA sequenceinformation. Diversity arrays technology (DArT) can over
come these limitations and has been developed as ahybridisation-based alternative to the majority of gel-based marker technologies currently in use. The DArT gen-otyping method was developed originally for rice [25] andhas subsequently been applied to many other plant spe-cies, including barley [26], cassava [27], Arabidopsis [28],pigeonpea [29] and wheat [30]. DArT has been alsoapplied to a number of animal species and microorgan-isms [31]. The DArT methodology offers a high multiplex-ing level, being able to simultaneously type severalthousand loci per assay, while being independent ofsequence information. DArT assays generate whole-genome fingerprints by scoring the presence versusabsence of DNA fragments in genomic representationsgenerated from genomic DNA samples through the proc-ess of complexity reduction.
This paper reports the results of a study designed to (1):develop a sorghum diversity array for DArT genotyping,(2): determine linkage map positions of polymorphicDArTs and (3): assess utility of DArT technology in diver-sity analyses on a set of diverse sorghum lines, includingselected lines from the Department of Primary Industriesand Fisheries (DPI&F) sorghum breeding program. Inorder to evaluate the discriminatory ability of DArTs,efforts have been made to include the same genotypesused in genetic diversity studies based on other molecularmarker technologies.
ResultsEvaluation of complexity reduction methods and array developmentThe initial tests of DArT performance in sorghum weredone on eight sorghum genotypes (Additional File 1).Based on our positive experience with PstI-based genomicrepresentations [25] we initially evaluated several combi-nations of PstI with different frequently cutting restrictionenzymes (RE) as a complexity reduction approach for sor-ghum. DNA samples from the eight sorghum genotypeswere digested with PstI and several frequently cutting RE(PstI+TaqI, PstI+MseI, PstI+ApoI, PstI+AluI, PstI+BanII,PstI+BstNI and PstI+AflIII), ligated to a PstI adapter andthen amplified with the PstI-0 primer. Gel analysis of thePCR products showed that a uniform smear (withoutmajor bands) only appeared in the PstI+BanII combina-tion. Other RE combinations gave a smear with one ormore dominant bands. Such strong bands representhighly amplified restriction fragments and correspond toabundant repetitive sequences in the representation; a fea-ture which is highly detrimental to DArT performance[32].
AFLP-like analysis was performed to estimate the frag-ment number in the PstI+BanII representation followingthe approach utilized by Xia et al. [27]. Four primers con-
Page 2 of 11(page number not for citation purposes)

BMC Genomics 2008, 9:26 http://www.biomedcentral.com/1471-2164/9/26
taining 3 selective bases at the 3'end were used for theamplification. For all four primers, a large number of frag-ments were visible on the gel, making a precise estimate ofthe total number of fragments impossible (data not pre-sented). Interestingly, a similar approach resulted in aneasily quantifiable number of bands in cassava which hasa similar genome size to sorghum and even in barley,which has genome size almost seven times larger than sor-ghum. The results suggest that the PstI+BanII representa-tion in sorghum has a larger number of unique fragmentsthan the PstI+BstNI representation in barley which wasreported to contain 1,546 markers placed on the inte-grated map of barley genome [26].
Based on the extended PstI+BanII sub-libraries and theadditional libraries generated based on the genomic sub-traction (SSH) method [33], the best DArT markers fromthe initial experiments were "cherry picked" and a "re-array library" with 768 polymorphic clones was created.In addition to these 768 polymorphism-enriched clones,a further 5367 clones from PstI+BanII Library C were usedfor all genotyping work reported here.
Genetic relationships between sorghum lines revealed by DArTThe selected DArT clones were tested for their ability toresolve genetic relationships among a set of 90 lines. Thereproducibility of the DArT genotyping array was success-fully validated by independent assays from the sameDNA. The genotypes selected represent a significant pro-portion of the genetic variation in sorghum with all 5races represented and 5 intermediate races also repre-sented. In addition, the germplasm set included elite linesfrom breeding programs some of which had high levels ofco-ancestry.
DArTsoft analysis (see Materials and Methods) identified508 markers polymorphic among 90 genotypes typed onthe array. The PIC values of these 508 markers were veryhigh with over 69% of the markers having a PIC valuebetween 0.4 and 0.5 (Table 1). The average PIC was 0.41,higher than the previous DArT studies in barley (0.38[26]) and comparable with cassava (0.42 [27]). The rela-tionship between the quality of the DArT markers (meas-ured as the % of total variance which existed between the
two clusters: present and absent) and the performance ofthe DArT markers as determined through call rate and PICwas analysed (Table 2). The PIC values were largely inde-pendent of marker quality, with only a small reduction inPIC value observed in the lowest quality class (0.40 in thelowest quality class vs. 0.44 and 0.42 for the two higherquality classes). As expected, the average call ratedecreased with average Q value. The markers with thehighest Q values (above 90% of total variance betweenthe clusters) had very high average call rates (98%), whilethe markers in the lower quality marker classes had loweraverage call rates and higher standard deviations.
Cluster analysis based on the DICE dissimilarity indexand the unweighted neighbour-joining method was per-formed on the 508 DArT markers for 90 genotypes (Figure1). This cluster analysis discriminated well between all 90genotypes and has a cophenetic correlation value of0.9308, indicating an excellent fit of the similarity matrixdata to the tree topology. Thirteen main clusters wereidentified which correspond well with race and origin ofthe genotyped lines. In particular a single predominantrace or origin could be identified in 9 out of the 13 clus-ters. Cluster 1 contained 13 genotypes in total, of which11 were kafir or kafir-caudatum. Cluster 4 contained 9genotypes, of which 5 were of race durra. Additionally,two Ethiopian durra types (IS 12555C and B35) groupedtogether within this cluster with a boot strap value of100%. Cluster 5 consisted of 6 Chinese genotypes of com-plex racial background. Cluster 6 contained the wild spe-cies, S. propinquum and the weedy subspecies, S. bicolorsubsp. verticilliflorum (formerly S. arundinaceum). Cluster9 consisted of 2 caudatum genotypes (IS 12656C and IS10302). Cluster 10 consisted of 11 genotypes in total, ofwhich 8 were caudatum or caudatum-derived. Cluster 11consisted of a tight cluster of restorer (R) lines predomi-nately from Australian breeding programs; R9990066,R999017 and R999003 are all progeny of the lineR31945-2-2. Cluster 12 is a looser cluster consisting of 15lines of which 7 were caudatum or caudatum-derived.Finally cluster 13 consisted of 4 genotypes of which 2 arebicolor or bicolor intermediate and S. bicolor subsp. drum-mondii which is very similar morphologically to thebicolor race.
Table 2: The relationship between the quality and the performance of the DArT markers
100 > Q > 90 90 > Q > 80 80 > Q > 70
Number of markers 37 236 235Call Rate 98.03 ± 1.69 92.75 ± 3.51 88.01 ± 4.83PIC 0.44 ± 0.08 0.42 ± 0.09 0.40 ± 0.11
Table 1: Polymorphism Information content (PIC) values for 508 DArT markers
PIC value # DArTs % DArTs
0.5-0.4 353 69.50.4-0.3 82 16.10.3-0.2 46 9.10.2-0.1 21 4.10.1-0 6 1.2
Page 3 of 11(page number not for citation purposes)

BMC Genomics 2008, 9:26 http://www.biomedcentral.com/1471-2164/9/26
Page 4 of 11(page number not for citation purposes)
Neighbor-joining anlaysis of diverse sorghum genotypes based on 508 DArT markers using the DICE similarity coefficientFigure 1Neighbor-joining anlaysis of diverse sorghum genotypes based on 508 DArT markers using the DICE similarity coefficient. 13 clusters have been defined. The numbers on the branches indicate bootstrap values (expressed in percentages; based on 100 replications).
0 0.1
QL39
QL41
R890562
ICSV 745
R931945-2-2
S. bicolor subsp. vert ic illif lorum
IS 8525
B 923296
SC 170-6-8
B 35
QL12
R9403463-2-1
R9188
B Tx623
QL36
B 923171
B OK11
296B
B Tx399
B Tx3197
B Tx3042
B Tx398
Dwarf Redlan
RTx2895
RTx2536
RTx7000
TA M422
RTx2737
RTx2903
A i4
LR9198
LR2931-2
LR2528
LR2659
LR2490-3
LR2844
ICSV 400
Kuyuma
MP531
Sureño
SDS 1948-3
Macia
RS29
M35-1
Green Leaf
S. bicolor spp. drummondii
S. propinquum
Wray
Rio
IS 12611C
IS 22457C
IS 22525
K S 115
MLT 135
IS 12568C
IS 12608C
IS 2403C
IS 12543C
K arper 669
IS 12648C
IS 12572C
IS 4546C
IS 17214
IS 3614-2
IS 12663C
IS 8163C
IS 11080C
IS 10302
IS 11435
IS 12179C
IS 1237
IS 1596
IS 2263
IS 3151
IS 3511
IS 8336
Hegari
IS 12661
TAM428
Dorado
IS 24756
K aura (black glumes)
IS 2816C
IS 12656C
IS 12555C
IS 8337C
R999003
R999017
R999066
RTx430
94
54
100
18
100
94
48
100
46
100
4422
70
34
67
98
68
51
100
842
9475
100
54100
7946
29
51
49
90
56
79
62
42
81
67
20
97
27
8
91
48
91
92
23
87
64
50
7
69
69
99
67
98
2344
28
100
99
64
93
96
48
41
27
21
32
17
21
45
34
2
9
2
9
2
1
4
100
2
1
C1
C2
C3
C4
C5
C6
C7
C8C9
C10
C11
C12
C13
BMC Genomics 2008, 9:26 http://www.biomedcentral.com/1471-2164/9/26
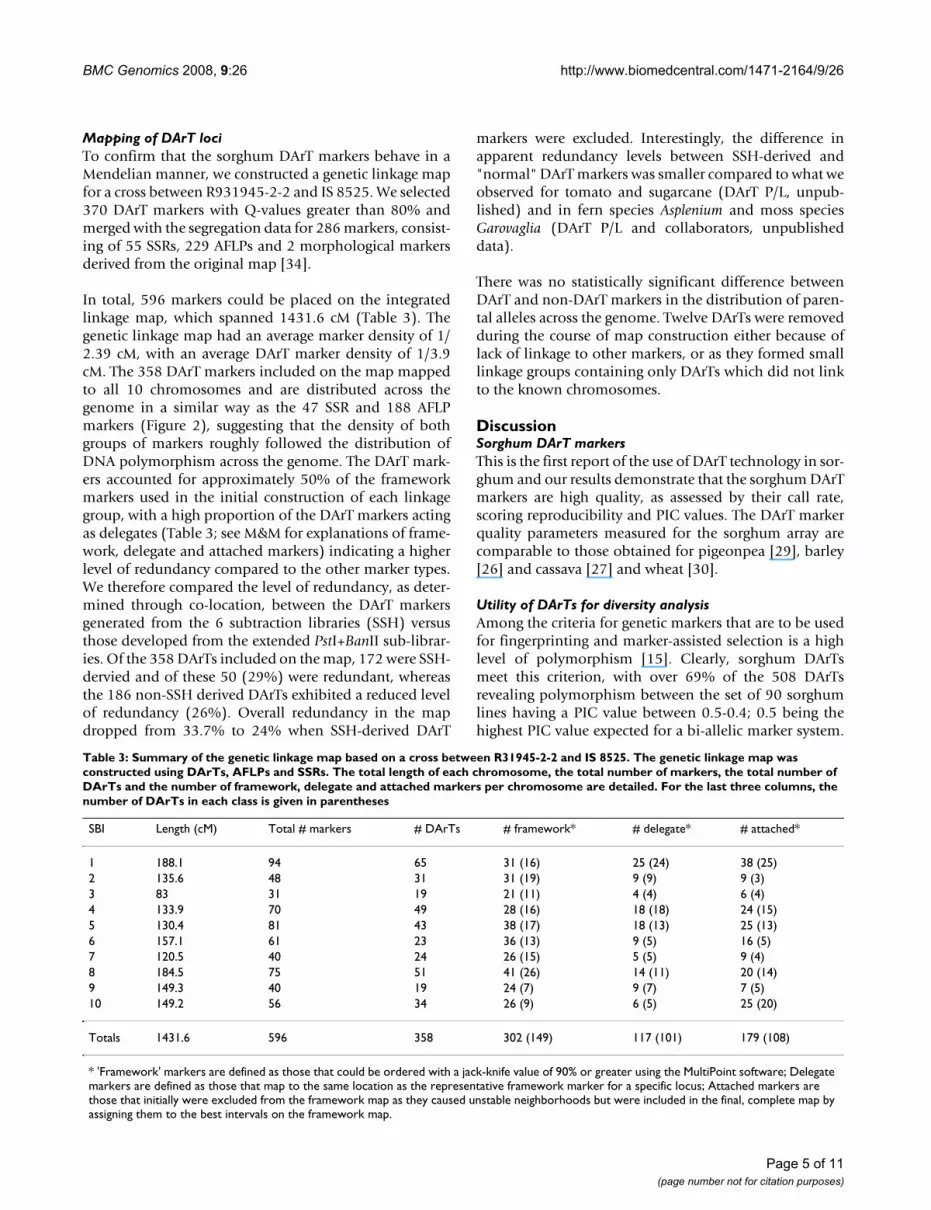
Mapping of DArT lociTo confirm that the sorghum DArT markers behave in aMendelian manner, we constructed a genetic linkage mapfor a cross between R931945-2-2 and IS 8525. We selected370 DArT markers with Q-values greater than 80% andmerged with the segregation data for 286 markers, consist-ing of 55 SSRs, 229 AFLPs and 2 morphological markersderived from the original map [34].
In total, 596 markers could be placed on the integratedlinkage map, which spanned 1431.6 cM (Table 3). Thegenetic linkage map had an average marker density of 1/2.39 cM, with an average DArT marker density of 1/3.9cM. The 358 DArT markers included on the map mappedto all 10 chromosomes and are distributed across thegenome in a similar way as the 47 SSR and 188 AFLPmarkers (Figure 2), suggesting that the density of bothgroups of markers roughly followed the distribution ofDNA polymorphism across the genome. The DArT mark-ers accounted for approximately 50% of the frameworkmarkers used in the initial construction of each linkagegroup, with a high proportion of the DArT markers actingas delegates (Table 3; see M&M for explanations of frame-work, delegate and attached markers) indicating a higherlevel of redundancy compared to the other marker types.We therefore compared the level of redundancy, as deter-mined through co-location, between the DArT markersgenerated from the 6 subtraction libraries (SSH) versusthose developed from the extended PstI+BanII sub-librar-ies. Of the 358 DArTs included on the map, 172 were SSH-dervied and of these 50 (29%) were redundant, whereasthe 186 non-SSH derived DArTs exhibited a reduced levelof redundancy (26%). Overall redundancy in the mapdropped from 33.7% to 24% when SSH-derived DArT
markers were excluded. Interestingly, the difference inapparent redundancy levels between SSH-derived and"normal" DArT markers was smaller compared to what weobserved for tomato and sugarcane (DArT P/L, unpub-lished) and in fern species Asplenium and moss speciesGarovaglia (DArT P/L and collaborators, unpublisheddata).
There was no statistically significant difference betweenDArT and non-DArT markers in the distribution of paren-tal alleles across the genome. Twelve DArTs were removedduring the course of map construction either because oflack of linkage to other markers, or as they formed smalllinkage groups containing only DArTs which did not linkto the known chromosomes.
DiscussionSorghum DArT markersThis is the first report of the use of DArT technology in sor-ghum and our results demonstrate that the sorghum DArTmarkers are high quality, as assessed by their call rate,scoring reproducibility and PIC values. The DArT markerquality parameters measured for the sorghum array arecomparable to those obtained for pigeonpea [29], barley[26] and cassava [27] and wheat [30].
Utility of DArTs for diversity analysisAmong the criteria for genetic markers that are to be usedfor fingerprinting and marker-assisted selection is a highlevel of polymorphism [15]. Clearly, sorghum DArTsmeet this criterion, with over 69% of the 508 DArTsrevealing polymorphism between the set of 90 sorghumlines having a PIC value between 0.5-0.4; 0.5 being thehighest PIC value expected for a bi-allelic marker system.
Table 3: Summary of the genetic linkage map based on a cross between R31945-2-2 and IS 8525. The genetic linkage map was constructed using DArTs, AFLPs and SSRs. The total length of each chromosome, the total number of markers, the total number of DArTs and the number of framework, delegate and attached markers per chromosome are detailed. For the last three columns, the number of DArTs in each class is given in parentheses
SBI Length (cM) Total # markers # DArTs # framework* # delegate* # attached*
1 188.1 94 65 31 (16) 25 (24) 38 (25)2 135.6 48 31 31 (19) 9 (9) 9 (3)3 83 31 19 21 (11) 4 (4) 6 (4)4 133.9 70 49 28 (16) 18 (18) 24 (15)5 130.4 81 43 38 (17) 18 (13) 25 (13)6 157.1 61 23 36 (13) 9 (5) 16 (5)7 120.5 40 24 26 (15) 5 (5) 9 (4)8 184.5 75 51 41 (26) 14 (11) 20 (14)9 149.3 40 19 24 (7) 9 (7) 7 (5)10 149.2 56 34 26 (9) 6 (5) 25 (20)
Totals 1431.6 596 358 302 (149) 117 (101) 179 (108)
* 'Framework' markers are defined as those that could be ordered with a jack-knife value of 90% or greater using the MultiPoint software; Delegate markers are defined as those that map to the same location as the representative framework marker for a specific locus; Attached markers are those that initially were excluded from the framework map as they caused unstable neighborhoods but were included in the final, complete map by assigning them to the best intervals on the framework map.
Page 5 of 11(page number not for citation purposes)

BMC Genomics 2008, 9:26 http://www.biomedcentral.com/1471-2164/9/26
Page 6 of 11(page number not for citation purposes)
Genetic linkage map for a cross between R31945-2-2 and IS 8525Figure 2Genetic linkage map for a cross between R31945-2-2 and IS 8525. Genetic distances are expressed as cumulative map distances from position 0.0 (first locus of LG) in cM (Kosambi estimates). Locus names in bold indicate framework markers; locus names in italics indicate attached and delegate markers.
AAG+CTA10.0sPb-5611 sPb-0939sPb-4492 sPb-6160sPb-5668 sPb-8237
9.1
sPb-060212.0AAG+CAG413.0Xtxp350 Xtxp32513.9sPb-5015 sPb-877315.3sPb-709616.6sPb-748117.3AAG+CAC764.0sPb-2704 sPb-1694AG+CAT15 AGC+CTG4AAG+CAA2
64.8
sPb-111965.5sPb-826171.8sPb-678083.3sPb-042287.7sPb-0333 Xtxp8888.5AAG+CTG189.3sPb-5808 sPb-2070sPb-9514 sPb-8794sPb-2823 sPb-6061AAC+CAC2 AG+CAT10
89.8
sPb-0090 sPb-3386sPb-6883 sPb-9050sPb-0813 sPb-2058sPb-8947 AG+CAC4
90.2
sPb-0232 sPb-254492.4sPb-7229 sPb-993094.5sPb-027496.8AAC+CAC199.1Xtxp37 sPb-3930sPb-0509
112.2
ACC+CTC1124.5sPb-3801 sPb-9203130.7sPb-3103 sPb-4638sPb-7833
133.9
sPb-7958137.1sPb-4029 sPb-8132150.1AGG+CAG1155.2Xtxp61 sPb-0277160.2sPb-7154 sPb-0383sPb-4593 AAC+CAT2
162.7
AAC+CAA5165.2sPb-0233168.4Xtxp319171.6sPb-0725174.1sPb-1984176.5sPb-8066 sPb-8275sPb-5527 sPb-5832
177.8
sPb-5975178.7sPb-0494179.5sPb-7331 sPb-6066181.0sPb-3861 AAG+CAA7182.4sPb-4420 sPb-7850183.5Xtxp248184.6AGG+CAG5 AG+CAG3AGG+CAC6 ACG+CAA5sPb-2729
185.1
Xtxp316185.5ACA+CAA2188.1
SBI-01
sPb-21870.0AAG+CAT27.6sPb-419522.9ACC+CAA732.3Xtxp21135.9sPb-486438.8sPb-9687 sPb-112741.7sPb-864745.6sPb-445350.9ACG+CAA152.7sPb-669354.4ACT+CAT256.8AAG+CAC458.2Xtxp1359.5sPb-178467.6sPb-4311 sPb-2639sPb-6700 sPb-1017sPb-2075
68.9
sPb-508774.3sPb-168475.1Xtxp5675.9ACC+CTC276.7AG+CAC678.5sPb-007383.4sPb-770285.6Xgap8489.2sPb-444491.5sPb-192593.7sPb-054999.0sPb-0971 sPb-9511103.6AAG+CAC6104.3sPb-6663 Xtxp315104.8sPb-4054111.5sPb-7153113.2sPb-1413 Xtxp207114.8AAG+CTG9124.1sPb-5077127.1AGC+CTA4 AG+CTA9127.8sPb-7647 sPb-8896128.5sPb-7015135.6
SBI-02
sPb-66900.0sPb-6982 sPb-24612.0sPb-08922.6sPb-54915.7AG+CTA66.4sPb-42268.5AAC+CAG49.2sPb-612222.5sPb-510824.2sPb-1294 sPb-190125.8sPb-1137 Sb5-23626.2AAG+CTC626.5sPb-035728.4ACA+CAC130.3sPb-224647.0ACT+CAG154.0sPb-6882 sPb-492167.0sPb-526767.7Xtxp28568.5ACG+CAA469.5sPb-718670.7sPb-9977 sPb-462971.8ACA+CAC274.1AGC+CTG374.3AG+CTG474.5AGG+CAA383.0
SBI-03
sPb-66400.0AGG+CAG218.5AGG+CAA520.9sPb-193222.2sPb-6958 sPb-958023.5AG+CTG732.4AGG+CAT434.0Xtxp2242.2sPb-5618 sPb-2138sPb-9635 sPb-4928sPb-2009 sPb-4039sPb-6559 sPb-8296sPb-2699
46.3
sPb-3343 sPb-7210ACC+CAA3 sPb-6231sPb-8521 sPb-9393sPb-1811 sPb-0258sPb-0543 sPb-8138sPb-8378 sPb-1841sPb-5276 sPb-8972
46.6
sPb-0703 sPb-1574sPb-0279 sPb-5530sPb-5742
46.8
AG+CTA455.2AGG+CAC263.5AG+CTA868.1XXtxp343 sPb-753472.7AAG+CTA273.1sPb-114773.4sPb-482577.7sPb-930379.0sPb-8013 sPb-611580.2Xgap1081.8sPb-732482.6sPb-999583.9sPb-971387.7sPb-3838 sPb-473490.4sPb-4473 sPb-4198sPb-9304
93.6
sPb-833794.0AGC+CAA294.3sPb-407099.5Xtxp177105.2Xtxp41 ACA+CAA3Xtxp51
106.6
Xtxp60108.0Xtxp265126.0ACA+CAG1 ACA+CAT2126.7sPb-7434127.3sPb-5550133.9
SBI-04
sPb-09060.0AAG+CAA15.2Xtxp6511.7sPb-704712.5AG+CTG813.3sPb-525616.6sPb-730819.9sPb-294131.9AAG+CAT11 AGG+CAT3sPb-6627 sPb-9815sPb-2539 sPb-4131sPb-7638 sPb-3290sPb-1227 sPb-3977
39.7
sPb-888145.3sPb-954447.2AG+CAT1348.6sPb-580550.0sPb-831650.4sPb-900950.7ACT+CAA451.1ACT+CAA551.5sPb-093257.1AAG+CAA462.0AGC+CAG169.4Xtxp1569.8AG+CTG670.2sPb-073870.9sPb-3031 sPb-6508sPb-5194
71.5
AG+CAC272.2sPb-376672.4AG+CTA272.5AG+CAT6 sPb-036873.3AAG+CTG474.3AG+CTC175.2AG+CTA1077.0sPb-150177.6sPb-934778.7sPb-867779.7sPb-663680.0sPb-6347 sPb-0205sPb-1104
80.3
ACC+CTA581.0sPb-4806 sPb-5209AAG+CAG1 AAG+CTG8AG+CTT1 AGC+CTA3AAG+CTG2
81.2
AGC+CAA3 AG+CAA3AAC+CAA3 AG+CAT3AAG+CTA3
81.4
sPb-660482.9sPb-897384.8sPb-720386.6sPb-6323 AAG+CAT10sPb-6855
87.5
AAG+CAT888.1sPb-381793.1AG+CAA898.5AGG+CAA7 AG+CTT4sPb-1152
98.9
sPb-145499.2AG+CTT5105.4SbKAFGK1_I108.8SBKAFGK1113.2sPb-2874119.4AAC+CAT1130.4
SBI-05
sPb-41830.0sPb-49372.9sPb-51825.3AAG+CAT37.6sPb-25519.0sPb-353911.8AG+CTG914.8Xtxp616.9AG+CAT220.6sPb-842223.5AG+CTC324.9AAG+CAC5 AAG+CTC426.5ACC+CAA626.7AAG+CTT2 AAG+CAA626.9AG+CAT1 ACA+CAT727.2sPb-5564 sPb-1395sPb-7169
27.5
sPb-819827.8sPb-836228.1AGC+CAA129.5ACC+CAA5 AAG+CTC3AAG+CAT7
30.3
ACC+CTA130.5AG+CTC730.6sPb-914638.5sPb-154357.7Xtxp14560.2AG+CAT1264.4Xtxp265-1 ACC+CAG165.9Xtxp27467.4AG+CTG11 AG+CTG570.2AGC+CTG573.0AAG+CTT578.0AAG+CTT686.4CC91.5AAG+CAT599.4sPb-5374115.3sPb-3962125.6sPb-0017 sPb-5603sPb-1486 sPb-4732
131.9
Xtxp17 Xtxp95134.2Xtxp57136.4sPb-5212 sPb-6076138.9AG+CTT2141.4sPb-9667142.9sPb-7428144.3ACA+CAG4146.6ACA+CAT5148.8AG+CTG1150.7ACG+CAA3157.1
SBI-06
AG+CAA40.0sPb-9595 sPb-7064sPb-4740 sPb-3995
2.7
sPb-20343.1ACC+CTA43.4sPb-92234.7sPb-99316.0AGG+CAA111.3AG+CAA112.9sPb-951318.6sPb-336119.6sPb-651820.6AGC+CTG124.7Xtxp15928.0sPb-821631.3AG+CTC542.8ACC+CTC343.2sPb-256643.5sPb-694247.0sPb-277448.3Xtxp22749.5ACA+CAG3 ACA+CAT4sPb-2757
51.5
sPb-1414 sPb-8019sPb-8258
53.4
AG+CTC668.1sPb-559473.9sPb-708691.9sPb-369195.3Xtxp295 AGC+CTA297.5AG+CTA599.7sPb-4306107.8sPb-1014118.4Xtxp168119.1sPb-7549120.5
SBI-07
Xtxp2730.0sPb-65891.1AGC+CAA4 AG+CAA72.2AGG+CAG66.3sPb-2736 sPb-346415.1sPb-5390 sPb-7126sPb-9818
23.9
sPb-582526.2sPb-339628.4AGG+CAT1 AAG+CAT652.2ACC+CAA455.9sPb-9372 sPb-500559.6sPb-214063.0sPb-493464.0sPb-264165.0ACA+CAT668.0ACC+CAA171.7AAG+CAG672.5AGG+CAA6 sPb-1058sPb-2474 sPb-3195
73.2
AG+CAA673.6AG+CAT1474.0sPb-2568 Xtxp21074.4ACA+CAG576.1AAG+CTT377.8AAG+CAT179.1sPb-0599 sPb-984179.8sPb-976282.5sPb-970086.4sPb-946887.0sPb-788988.9sPb-188199.2sPb-1595 Xtxp18AAG+CAC3 sPb-1850100.3
sPb-7375101.3sPb-0031 sPb-2228sPb-9743 sPb-3014
111.3
sPb-3954 sPb-0833113.2Xtxp105115.1AAC+CAA2122.5AAG+CAG3126.2sPb-6918126.4AGG+CAA4126.6sPb-5401129.0sPb-1272133.1sPb-8993 sPb-9584133.5sPb-6960133.9sPb-5250 sPb-2846134.2sPb-7648 sPb-4385134.5AG+CTG10135.2sPb-3434135.9sPb-0087140.2sPb-0144178.2sPb-5473180.3sPb-3274181.7sPb-1997182.4sPb-9449183.8sPb-2770184.5
SBI-08
sPb-00050.0Xtxp2584.9AGC+CAG210.2AG+CAG210.5ACC+CTA215.1ACA+CAT120.6AAG+CAA536.5ACC+CTA350.8sPb-998953.7sPb-968856.6sPb-8873 sPb-478659.3AG+CTA1159.6sPb-1324 sPb-685259.9AG+CTC2 sPb-5312sPb-9272 sPb-3158
61.3
AAG+CTC5 ACT+CAA1AG+CTG3
62.4
AG+CAC364.8ACT+CAA265.2AG+CAA265.9AGG+CAA266.7ACC+CAA267.1AGG+CAC567.5AGG+CAA875.6sPb-514276.3AAG+CTT177.0sPb-397193.5sPb-9107 sPb-4853sPb-9227
94.5
Xgap3295.4sPb-7367 sPb-8368sPb-9091
148.7
sPb-7955149.3
SBI-09
sPb-39120.0sPb-8306 sPb-20416.8sPb-5079 RLAG+CTC87.8
sPb-41298.7AG+CTA158.1sPb-885860.8sPb-3432 sPb-024863.4sPb-3287 sPb-8150sPb-0817
69.9
sPb-2149 sPb-5391sPb-8497 sPb-0562
70.5
sPb-283671.1sPb-3549 sPb-999973.7AAG+CTG576.2AAC+CAG379.9AAG+CAA380.7sPb-7643 sPb-3958sPb-9215 sPb-5512sPb-6875
81.1
ACT+CAA381.4AAG+CTT4 sPb-494482.0AAG+CTG782.6sPb-124483.4ACC+CAG284.2ACA+CAA185.8SvPEPCAA87.0sPb-688988.7sPb-584190.3AAG+CTC293.7sPb-6288 sPb-4480sPb-2318 AG+CTA394.2
AGC+CTA194.6AG+CAT1197.5AAG+CAG2100.3ACA+CAG2102.3ACA+CAT3108.8sPb-3003 sPb-1701126.5AGG+CAC1 sPb-1660133.6Xtxp141 Xgap325140.7sPb-5678149.2
SBI-10

BMC Genomics 2008, 9:26 http://www.biomedcentral.com/1471-2164/9/26
Additionally, this study meets all the criteria proposed forevaluating the use of molecular markers for large scalegermplasm diversity analyses [35]; a large number ofmarkers, thorough representation of these markers on agenetic linkage map of the species and the selection ofmonolocus probes. The 508 DArT markers permitted theunique identification of all 90 genotypes including closelyrelated backcross derived lines. The cluster analysisrevealed that the 90 genotypes examined showed a cleardemarcation of the germplasm according to their racialclassification, consistent with previous studies usingRFLPs [9] and SSRs and AFLPs [17]. The bicolor race wasfound to be highly variable in this study, shown by itspresence in multiple clusters, as also noted by previousstudies [8,9,14]. In fact, it has been noted previously thatrace bicolor resembles spontaneous weedy sorghums andis thought to be the race most closely related to wild sor-ghums [18] and also the most primitive grain sorghum[10]. Indeed, the bicolor race accession IS 12179Cincluded in this study, groups together with the weedysorghum, S. bicolor subsp. drummondii, in cluster 13 (Fig-ure 1).
The race caudatum is one of the most important agro-nomically, providing genes for high yield and excellentseed quality. It has become one of the most importantsources of germplasm in modern breeding programsthroughout the world and in this study, the caudatum racegenotypes were clearly demarcated in clusters 9, 10 and12. In contrast, a previous study [18] found no significantdifferences in diversity between the races, except the kafirrace which was less diverse. Low genetic diversity was alsoobserved in the kafir race in this study, with all the kafirrace accessions constituting a specific cluster (cluster 1).These results are in agreement with the recent origin andrestricted geographic distribution of this race, togetherwith recent studies using SSRs [14] and RFLPs [9].
In addition to the observed clustering on racial groups,differences between the genotypes based on their status asB (maintainer female) and R (male parental restorer) lineswas also noted. In this study, there was less variationamong the B-lines than the R-lines, with the B-lines clus-tering tightly together in only 2 of the 13 clusters, whereasthe R-lines grouped more loosely in 5 clusters. It has alsobeen noted [17] that the lower levels of diversity amongelite B-lines vs. R-lines is expected since B-lines arerequired to produce high quality male-sterile A-lines. Thedevelopment of new A/B-lines is more difficult comparedto R-line development and hence B-line development ismore restrictive and slower to incorporate new germ-plasm. Where pedigree data was available, groupings asso-ciated with these pedigree relationships were observed.
Comparisons of the discrimination ability for DArT mark-ers and their ability to reflect pedigree backgrounds incontrast to other marker types is made much simplerwhen over-lapping sets of germplasm are used in anumber of studies. Seventeen genotypes included in thisstudy were examined by Menz et al. [17], 54 genotypeswere in common with Ritter et al. [20] and 11 with Tao etal. [7]. Very similar groupings of genotypes were observed,e.g. the over-lapping genotypes in cluster 1 also grouptogether in previous studies [17,20], e.g. BTx3197 andBOK11 grouping tightly together in Menz et al. [17], inaddition to RTx7000 and Btx3042. Similarly, ICSV400,MP531 and Macia group together based on AFLPs [17,20]and DArTs (cluster 10), and QL41 and R9188 grouptogether based on RFLPs [7] and DArTs (cluster 2).
The separation of "wild" sorghums from cultivated germ-plasm seems to be less pronounced compared to theresults based on SSR data [18]. This is not surprising, asthe array used for genotyping all materials in this studywas developed using mostly DNA from cultivated materi-als. Even though three accessions from wild relatives wereincluded in library construction, their "private" alleleswere highly "diluted" by common alleles and those whichwere "private" to the cultivated material. The design of thearray did not substantially change the topology of treesgenerated from DArT data, but would reduce the distancebetween the wild and cultivated samples. We expect thatthe distance reduction would be up to two-fold, as wewere effectively finding unique "0" scores for the wildmaterials, but less effectively unique "1" scores. Suchascertainment bias is not limited to DArT, but is a featureof many marker systems. In fact the ascertainment biaswill be significantly larger for SNP technologies, as mostSNP markers are developed from a small number of sam-ples/chromosomes in a limited number of populations,even in well resourced human studies [36,37]. The effectof such "marker source sampling bias" was recognised inmany human studies, e.g. on population migration rate[38], population mutation and recombination rate esti-mates [39] and on Linkage Disequilibrium (LD) estimates[40]. Marker panels in DArT are developed using large andrepresentative sampling from target populations [32] andcan be easily expanded by cloning libraries from the germ-plasm pools for which precise relatedness estimateswould be required.
Distribution of DArT loci in the sorghum genomeThe integrated genetic linkage map comprising DArTs,AFLPs and SSRs clearly demonstrates that the new sor-ghum DArT markers behave in a Mendelian manner. Intotal, 358 DArTs were mapped to 257 unique loci. Thehigher level of redundancy of the DArT markers isreflected by the higher number of AFLP and SSR markershaving unique segregation patterns. However, the markers
Page 7 of 11(page number not for citation purposes)

BMC Genomics 2008, 9:26 http://www.biomedcentral.com/1471-2164/9/26
on the DArT array used in this study were not filtered forredundancy, whereas the SSR/AFLP data set had previ-ously undergone curation [34], to remove markers withredundant segregation patterns. Also, the total number ofDArT markers was higher than in other marker classes,therefore the apparent redundancy would need to be alsocorrected for sample size. After applying such sample-sizecorrection to STMP markers in the linkage map of a crossbetween two wheat cultivars Cranbrook and Halberd, alower level of redundancy was found for the DArT mark-ers [30].
The total length of the integrated genetic linkage map was1431.6 cM, with an average DArT marker density of 1 perevery 3.9 cM. The total map length is comparable to otherrecently reported sorghum genetic maps, being slightlyshorter than the 1713 cM high-density genetic linkagemap based on 2926 AFLP, RFLP and SSR markers [41],and slightly longer than the 1059.2 cM genetic linkagemap based on 2050 RFLP probes [42]. Although the DArTmarkers are distributed across the genome in a similar wayto the non-DArT markers, there are genomic regions con-taining significant excesses or paucity of markers, e.g. thecentromeric region of SBI-05 has a higher than averagemarker density of 1/0.64 cM and the distal ends of SBI-01and SBI-10 have marker-poor regions with gaps spanningover 30 cM. These areas of low marker density may corre-spond to regions of similar ancestry or identity by descent(IBD) in the germplasm included in the initial diversityrepresentation. In addition, lines with photoperiod sensi-tivity and tall stature were under represented in the diver-sity set used to develop the DArT markers. These regionsof low marker density may be therefore associated withgenomic regions that were identical by descent or that hadvery limited genetic variability in the initial diversity rep-resentation. The marker-dense regions appear to corre-spond to the centromeric regions, a feature that has beenobserved previously [42]. This is also supported by therecent observation that the pericentromeric heterochro-matic regions of sorghum chromosomes show muchlower rates of recombination (~8.7 Mbp/cM) comparedto euchromatic regions (~0.25 Mbp/cM), with the averagerate of recombination across the heterochromatic portionof the sorghum genome being ~34-fold lower than recom-bination in the euchromatic region [43]. It should how-ever be noted that clustering around the centromeres isobserved for both DArT and non-DArT markers, due tothe centromeric suppression of recombination. Interest-ingly, DArT markers were significantly less clustered atmost centromeric regions of barley chromosomes com-pared to non-DArT markers on the integrated map con-taining approximately 3,000 markers [26]. We will be inposition to rigorously test if this difference in marker posi-tion holds true in sorghum only after completion ofbuilding the consensus map integrating approximately
1,000 DArT markers with similar number of other types ofmarkers [Mace et al in preparation].
ConclusionWe have successfully developed DArT markers for Sor-ghum bicolor and have demonstrated that DArT provideshigh quality markers that can be used for diversity analy-ses and to construct medium-density genetic linkagemaps. The high number of DArT markers generated in asingle assay not only provides a precise estimate of geneticrelationships among genotypes, but also their even distri-bution over the genome offers real advantages for a rangeof molecular breeding and genomics applications. Addi-tionally, the availability of the sorghum whole genomesequence by the end of 2007 offers very exciting opportu-nities for assessing the colinearity of the DArT markers onthe genetic linkage maps with the markers on thesequence map. As DArT assays are performed on highlyparallel and automated platforms the cost of datapoint (afew cents per marker assay) is reduced by at least an orderof magnitude compared to current, gel-based technolo-gies.
MethodsSource of DNAThe sorghum accessions used to prepare DArT librariesrepresent the genetic diversity present in the cultivatedspecies (S. bicolor subsp. bicolor) with all 5 races and 5intermediate races represented, two weedy subspecies (S.bicolor subsp. drummondii and subsp. verticilliflorum) and awild species, S. propinqum (Additional File 1). In addition,the germplasm set included elite lines from breeding pro-grams some of which had high levels of co-ancestry. DNAwas extracted using a modified CTAB-based extractionprotocol [44,45].
Development of DArT for sorghumSeveral DArT arrays were built in the course of this study.For each of these arrays, a genomic representation wasgenerated from a mixture of sorghum lines using the PstI-based complexity reduction method previously described[26]. Libraries were prepared as described previously [25].Two extended PstI+BanII sub-libraries were subsequentlygenerated using DNA from 31 and 94 genotypes, respec-tively (Additional File 2). In addition, six libraries weregenerated by applying the SSH method to genomic repre-sentations [33]. Drivers and testers used in the subtractionlibraries construction were as shown in Table 4. DNA ofdrivers and testers was digested by PstI/BstNI and ligatedto the PstI adaptor. The digestion/ligation products wereamplified using the PstI-0 primer. The resulting PCR prod-ucts were digested with a RE mixture containing DpnII,HpyCH4IV, MseI and NlaIII. Subtraction was done in a30:1 ratio of driver to tester and carried out in one and tworounds of subtractive hybridization. After final amplifica-
Page 8 of 11(page number not for citation purposes)

BMC Genomics 2008, 9:26 http://www.biomedcentral.com/1471-2164/9/26
tion, the subtraction products were cloned as detailed pre-viously [27]. The sorghum libraries utilized for the initialmarker discovery are summarized in the supplementarymaterial (Additional File 3). Clones from all libraries withthe exception of PstI+BanII Library C were used to createarrays in order to genotype several hundred sorghumaccessions (data not presented). The best markers fromthe initial experiments were "cherry picked" to assemblethe "re-array library" with 768 polymorphic clones.Clones from this library together with 5367 clones fromPstI+BanII Library C were used for all genotyping workreported here. The re-array library was created using thePstI+BanII and the subtraction (SSH) libraries. Details ofthe re-array library and other libraries used for sorghumgenotyping are included in the supplementary material(Additional Files 2 &3).
DArT genotypingGenotyping was performed essentially as described in ref-erences 26 and 30. Briefly, each genomic DNA sample issubjected to the PstI+BanII complexity reduction method.The resulting genomic representation is labelled with flu-orescent nucleotides and hybridised on a microarrayprinted with the DArT clones. A typical experiment is per-formed on about 94 samples of genomic DNA. Followinghybridisation and washing, the microarrays for an experi-ment are scanned, the images are analysed and the scoreof each marker is calculated for each sample by dedicatedsoftware DArTsoft: markers are scored 1 for presence, 0 forabsence and X for inability to score. The quality parameterQ for each marker is calculated by dividing the variance ofthe hybridisation level for the marker between the 2 clus-ters (present and absent) by the total variance of hybridi-sation level of the marker, in the experiment.
Diversity analysisA group of 90 sorghum lines (subset detailed in Addi-tional File 1) were genotyped on the re-array library asdescribed previously [30]. The sorghum lines were chosento provide a reasonable representation of sorghum geneticdiversity as well as including elite inbred lines from theDPI&F and other sorghum breeding programs. Some ofthe elite lines were quite closely related and were includedto demonstrate the discrimination possible with DArT.
The marker scores were subjected to cluster and principalcoordinate analysis using the DARwin [46] to visualizethe genetic relationships among the lines. Additionally,the polymorphism information content (PIC) of eachDArT marker was determined as follows; PIC = 1-ΣPi
2,where Pi is the frequency of the ith allele in the examinedgenotypes [47].
Genetic mappingThe lines R931945-2-2, a commercially accepted restorerline in Australia and IS 8525, an Ethiopian line (kafirrace), in addition to 92 lines of a F5 recombinant inbredline (RIL) population derived from a cross between thetwo lines were typed using the genotyping array. Cloneswith Q > 80% and a call rate of at least 80% were selectedfor mapping. DArTs markers were merged with an existingmapping data set consisting of 286 markers including 55SSRs and 229 AFLPs [34]. A genetic linkage map was con-structed using MultiPoint software [48]. The RIL_Selfingpopulation setting was selected and a maximum thresh-old rfs value of 0.40 was used to initially group the mark-ers into ten linkage groups. Multipoint linkage analysis ofloci within each LG was then performed and marker orderwas further verified through re-sampling for quality con-trol via jack-knifing [49]. Markers that could be orderedwith a jack-knife value of 90% or greater were included as'framework' markers, with any remaining markers causingunstable neighborhoods being initially excluded from themap, including redundant markers mapping to the samelocation. Following a repeated multipoint linkage analy-sis with the reduced set of markers for each LG to achievea stabilised neighbourhood, the previously excludedmarkers were attached by assigning them to the best inter-vals on the framework map and labelled as attached mark-ers. The redundant markers were also included on thefinal, complete map but labelled as delegates. Finally, thelinkage groups were assigned to sorghum chromosomes,SBI-01 to SBI-10 according to recent nomenclature [50].The Kosambi [51] mapping function was used to calculatethe centimorgan (cM) values. The graphical representa-tion of the map was drawn using MapChart software [52].
Authors' contributionsESM carried out the diversity and mapping analyses anddrafted the manuscript. LX co-developed the DArT tech-
Table 4: Drivers and testers used in the subtraction libraries
Library 1 Library 2 Library 3 Library 4 Library 5 Library 6
Subtraction method One round One round One round One round One round Two roundsLibrary Subtraction-1 Subtraction-2 Subtraction-3 Subtraction-4 Subtraction-5 Subtraction-6Driver ISCV745 ISCV745 90562 IS8525 31945-2-2 Mixture of driverstester Tester mixture* 90562 ISCV745 31945-2-2 IS8525 Tester mixture*
* The tester mixture was comprised of 90 sorghum genotypes without the four parental genotypes (ICSV745, B90562, R31945-2-2 and IS 8525).
Page 9 of 11(page number not for citation purposes)

BMC Genomics 2008, 9:26 http://www.biomedcentral.com/1471-2164/9/26
nology for sorghum. DRJ conceived of the study, and par-ticipated in its design and coordination, germplasmdevelopment and selection and helped to draft the manu-script. KH was involved in the optimisation of the meth-odology and participated in the mapping analysis. DKPparticipated in the mapping analysis. EH participated inthe development of the DArT technology and editing ofthe manuscript. PW contributed to ongoing improve-ments of the DArT technology and the quality assessmentof sorghum clones. AK supervised development of theDArT technology, participated in the study's design andcoordination and helped to draft the manuscript.
Additional material
AcknowledgementsWe thank the Australian Grains Research and Development Cooperation [53] for financial support. We thank Robert Henzell, Bert Collard, Mandy Christopher, Sally Dillon and colleagues at Diversity Arrays Technology P/L for helpful discussions and comments on the manuscript.
References1. FAOSTAT [http://faostat.fao.org/default.aspx]2. Pereira MG, Lee M, Bramel-Cox P, Woodman W, Doebley J, Whitkus
R: Construction of an RFLP map in sorghum and compara-tive mapping in maize. Genome 1994, 37:236-243.
3. Grivet L, D'Hont A, Dufour P, Hamon P, Roqes D, Glaszmann JC:Comparative genome mapping of sugar cane with other spe-cies within the Andropogoneae tribe. Heredity 1994,73:500-508.
4. Devos KM: Updating the 'Crop Circle'. Curr Opin Plant Biol 2005,8:155-162.
5. Bowers JE, Rokhsar DS, Paterson AH: Update on the sorghum(Sorghum bicolor) genome sequence [abstract]. Plant & AnimalGenomes XV Conference: 13–17 January 2007. San Diego [http://www.intl-pag.org].
6. Harlan JR, De Wet JMJ: A simplified classification of cultivatedsorghum. Crop Sci 1972, 12:127-176.
7. Tao Y, manners JM, Ludlow MM, Henzell RG: DNA polymor-phisms in grain sorghum (Sorghum bicolor (L.) Moench).Theor Appl Genet 1993, 86:679-688.
8. Deu M, Gonzalez-de-Leon D, Glaszmann J-C, Degremont I, Chan-tereau J, Lanaud C, Hamon P: RFLP diversity in cultivated sor-ghum in relation to racial differentiation. Theor Appl Genet1994, 88:838-844.
9. Deu M, Rattunde F, Chantereau J: A global view of genetic diver-sity in cultivated sorghums using a core collection. Genome2006, 49:168-180.
10. Dahlberg JA, Zhang X, Hart GE, Mullet JE: Comparative assess-ment of variation among sorghum germplasm accessionsusing seed morphology and RAPD measurements. Crop Sci2002, 42:291-296.
11. Ayana A, Bryngelsson T, Bekele E: Genetic variation of Ethiopianand Eritrean sorghum (Sorghum bicolor (L.) Moench) germ-plasm by random amplified polymorphic DNA (RAPD).Genet Resour Crop Evol 2000, 47:471-482.
12. Yang W, de Oliveira AC, Godwin I, Schertz K, Bennetzen JL: Com-parison of DNA marker technologies in characterising plantgenome diversity: Variability in Chinese sorghums. Crop Sci1996, 36:1669-1676.
13. Djè Y, Forciolo D, Ater M, Lefèbvre C, Vekemans X: Assessing pop-ulation genetic structure of sorghum landraces from North-western Morocco using allozyme and microsatellite mark-ers. Theor Appl Genet 1999, 99:157-163.
14. Djè Y, Heuertz M, Lefèbvre C, Vekemans X: Assessment ofgenetic diversity within and among germplasm accessions incultivated sorghum using microsatellite markers. Theor ApplGenet 2000, 100:918-925.
15. Smith JSC, Kresovich S, Hopkins MS, Mitchell SE, Dean RE, WoodmanWL, Lee M, Porter K: Genetic diversity among elite sorghuminbred lines assessed with simple sequence repeats. Crop Sci2000, 40:226-232.
16. Kong L, Dong J, Hart GE: Characteristics, linkage-map posi-tions, and allelic differentiation of Sorghum bicolor (L.)Moench DNA simple-sequence repeats (SSRs). Theor ApplGenet 2000, 101:438-448.
17. Menz MA, Klein RR, Unruh NC, Rooney WL, Klein PE, Mullet JE:Genetic diversity of public inbreds of sorghum determinedby mapped AFLP and SSR markers. Crop Sci 2004,44:1236-1244.
18. Casa AM, Mitchell SE, Hamblin MT, Sun H, Bowers JE, Paterson AH,Aquadro CF, Kresovich S: Diversity and selection in sorghum:simultaneous analyses using simple sequence repeats. TheorAppl Genet 2005, 111:23-30.
19. Folkerstma RT, Frederick H, Rattunde W, Chandra S, Soma Raju G,Hash CT: The pattern of genetic diversity of Guinea-race Sor-ghum bicolor (L.) Moench landraces as revealed with SSRmarkers. Theor Appl Genet 2005, 111:399-409.
20. Ritter KB, McIntyre CL, Godwin ID, Jordan DR, Chapman S: Anassessment of the genetic relationships between sweet andgrain sorghums, within Sorghum bicolor ssp. bicolor (L.)Moench, using AFLP markers. Euphytica in press.
21. Jordan DR, Tao YZ, Godwin ID, Henzell RG, Cooper M, McIntyre CL:Comparison of identity by descent and identity by state fordetecting genetic regions under selection in a sorghum ped-igree breeding program. Mol Breed 2004, 14:441-454.
22. Yu J, Buckler ES: Genetic association mapping and genomeorganization in maize. Curr Opin Biotechnol 2006, 17:155-160.
23. Podlich D, Winkler CR, Cooper M: Mapping As You Go: AnEffective Approach for Marker-Assisted Selection of Com-plex Traits. Crop Sci 2004, 44:1560-1571.
24. Furman BJ: Methodology to establish a composite collection:Case study in lentil. Genet Resour Crop Evol 2006, 4:2-12.
25. Jaccoud D, Peng K, Feinstein D, Kilian A: Diversity arrays: a solidstate technology for sequence information independent gen-otyping. Nucleic Acids Res 2001, 29(4):e25.
26. Wenzl P, Li H, carling J, Zhou M, Raman H, Paul E, Hearnden P, MaierC, Xia L, Caig V, Jaroslava O, Cakir M, Poulsen D, Wang J, Raman R,Smith KP, Muehlbauer GJ, Chalmers KJ, Kleinhofs A, Huttner E, KilianA: A high-density consensus map of barley linking DArTmarkers to SSR, RFLP and STS loci and agricultural traits.BMC Genomics 2006, 7:206-228.
Additional File 1List of sorghum genotypes used for the development of the sorghum DArT array and the diversity analyses. The table includes details of genotype IDs and aliases, race and origin and inclusion status in both the methodology developmental stages and diversity analyses.Click here for file[http://www.biomedcentral.com/content/supplementary/1471-2164-9-26-S1.doc]
Additional File 2Summary of sorghum libraries. The table includes details of the number of genotypes used in the development of each sorghum library and the number of clones identified.Click here for file[http://www.biomedcentral.com/content/supplementary/1471-2164-9-26-S2.doc]
Additional File 3Libraries used for generation of the genotyping array. The table details the barcode for each sorghum library.Click here for file[http://www.biomedcentral.com/content/supplementary/1471-2164-9-26-S3.doc]
Page 10 of 11(page number not for citation purposes)

BMC Genomics 2008, 9:26 http://www.biomedcentral.com/1471-2164/9/26
Publish with BioMed Central and every scientist can read your work free of charge
"BioMed Central will be the most significant development for disseminating the results of biomedical research in our lifetime."
Sir Paul Nurse, Cancer Research UK
Your research papers will be:
available free of charge to the entire biomedical community
peer reviewed and published immediately upon acceptance
cited in PubMed and archived on PubMed Central
yours — you keep the copyright
Submit your manuscript here:http://www.biomedcentral.com/info/publishing_adv.asp
BioMedcentral
27. Xia L, Peng K, Yang S, Wenzl P, Carmen de Vicente M, Fregene M,Kilian A: DArT for high-throughput genotyping of Cassava(Manihot esculenta) and its wild relatives. Theor Appl Genet2005, 110:1092-1098.
28. Wittenberg AHJ, van der Lee T, Cayla C, Kilian A, Visser RGF,Schouten HJ: Validation of the high-throughput marker tech-nology DArT using the model plant Arabidopsis thaliana. MolGen Genomics 2005, 274:30-39.
29. Yang S, Pang W, Ash G, Harper J, Carling J, Wenzl P, Huttner E, ZongX, Kilian A: Low level of genetic diversity in cultivated pigeon-pea compared to its wild relatives is revealed by diversityarrays technology. Theor Appl Genet 2006, 113:585-595.
30. Akbari M, Wenzl P, Caig V, Carling J, Xia L, Yang S, Uszynski G, Moh-ler V, Lehmensiek A, Kuchel H, Hayden MJ, Howes N, Sharp P,Vaughan P, Rathnell B, Huttner E, Kilian A: Diversity arrays tech-nology (DArT) for high-throughput profiling of the hexaploidwheat genome. Theor Appl Genet 2006, 113:1409-1420.
31. The Official Site of Diversity Arrays Technology (DArT P/L)[http://www.diversityarrays.com]
32. Kilian A, Huttner E, Wenzl P, Jaccoud D, Carling J, Caig V, Evers M,Heller-Uszynska K, Cayla C, Patarapuwadol S, Xia L, Yang S, ThomsonB: The fast and the cheap: SNP and DArT-based wholegenome profiling for crop improvement. In Proceedings of theInternational Congress In the Wake of the Double Helix: From the GreenRevolution to the Gene Revolution May 27–31, 2003 Bologna, Italy Editedby: Tuberosa R, Phillips RL, Gale M. Avenue Media; 2005:443-461.
33. Diatchenko L, Lau YF, Campbell AP, Chenchik A, Moqadam F, HuangB, Lukyanov S, Lukyanov K, Gurskaya N, Sverdlov ED, Siebert PD:Suppression subtractive hybridization: a method for gener-ating differentially regulated or tissue-specific cDNA probesand libraries. Proc Natl Acad Sci USA 1996, 93:6025-30.
34. Parh DK: DNA-based markers for ergot resistance in sor-ghum. In PhD thesis University of Queensland, School of Land andFood Sciences; 2005.
35. Dillmann C, Bar-Hen A, Guerin D, Charcosset A, Murigneux A:Comparison of RFLP and morphological distances betweenmaize Zea mays L. inbred lines. Consequence for germplasmprotection purposes. Theor Appl Genet 1997, 95:92-102.
36. Altshuler D, Pollar VJ, Cowles CR, Van Etten WJ, Baldwin J, Linton L,Lander ES: A SNP map of the human genome generated byreduced representation shotgun sequencing. Nature 2000,407:513-516.
37. Irizarry K, Kustanovich V, Li C, Brown N, Nelson S, Wong W, Lee CJ:Genome-wide analysis of single nucleotide polymorphisms inhuman expressed sequences. Nat Genet 2000, 26:233-236.
38. Wakeley J, Nielsen R, Liu-Cordero SN, Ardlie K: The discovery ofsingle-nucleotide polymorphisms and inferences abouthuman demographic history. Am J Hum Genet 2001,69:1332-1347.
39. Nielsen R: Estimation of population parameters and recombi-nation rates from single nucleotide polymorphisms. Genetics2000, 154:931-942.
40. Akey JM, Zhang K, Xiong M, Jin L: The effect of single nucleotidepolymorphism identification strategies on estimates of link-age disequilibrium. Mol Biol Evol 2003, 20:232-242.
41. Menz MA, Klein RR, Mullet JE, Obert JA, Unruh NC, Klein PE: Ahigh-density genetic map of Sorghum bicolor (L.) Moenchbased on 2926 AFLP ®, RFLP and SSR markers. Plant Mol Biol2002, 48:483-499.
42. Bowers JE, Abbey C, Anderson S, Chang C, Draye X, Hoppe AH, Jes-sup R, Lemke C, Lennington J, Li Z, Lin Y, Liu S, Luo L, Marler BS, MingR, Mitchell SE, Qiang D, Reischmann K, Schulze SR, Skinner DN,Wang Y, Kresovich S, Schertz KF, Paterson AH: A high-densitygenetic recombination map of sequence-tagged sites for Sor-ghum, as a framework for comparative structural and evolu-tionary genomics of tropical grains and grasses. Genetics 2003,165:367-386.
43. Kim J-S, Islam-Faridi MN, Klein PE, Stelly DM, Price HJ, Klein RR, Mul-let JE: Comprehensive molecular cytogenetic analysis of sor-ghum genome architecture: distribution of euchromatin,heterochromatin. Genes and recombination in comparisonto rice. Genetics 2005, 171:1963-1976.
44. Saghai-Maroof MA, Soliman KM, Jorgensen RA, Allard RW: Ribos-omal DNA spacer-length polymorphisms in barley: Mende-lian inheritance, chromosomal location, and populationdynamics. Proc Natl Acad Sci USA 1984, 81:8014-8018.
45. Doyle JJ, Doyle JL: A rapid DNA isolation procedure for smallquantities of fresh leaf material. Phytochemical Bulletin 1987,19:11-15.
46. Perrier X, Jacquemoud-Collet JP: DARwin software. 2006 [http://darwin.cirad.fr/Darwin].
47. Weir BS: Genetic data analysis. Methods for discrete genetic data Sunder-land. Mass., Sinauer Associates Inc; 1990.
48. MultiQTL [http://www.multiqtl.com]49. Mester D, Ronin YI, Hu Y, Nevo E, Korol A: Constructing large
scale genetic maps using evolutionary strategy algorithm.Genetics 2003, 165:2269-2282.
50. Kim J-S, Klein P, Klein R, Price H, Mullet J, Stelly D: Chromosomeidentification and nomenclature of Sorghum bicolor. Genetics2005, 169:1169-1173.
51. Kosambi D: The estimation of map distances from recombi-nation values. Ann Eugen 1944, 12:172-175.
52. Voorrips RE: MapChart: Software for the graphical presenta-tion of linkage maps and QTLs. J Hered 2002, 93:77-78.
53. GRDC Inc [http://www.grdc.com]
Page 11 of 11(page number not for citation purposes)