cyber forensics – the present and the future - notesinterpreter
TRANSCRIPT

Chapter 7
Cyber Forensics – The Present and the Future
© Oxford University Press 2018. All rights reserved.

Outline
• Forensic Tools
• Cyber Forensic Suite
• Drive Imaging and Validation Tools
• Forensic Tool for Integrity Verification and Hashing
• Forensic Tools for Data Recovery
• Forensic Tools for RAM Analysis
• Forensic Tools for Analysis of Registry
• Forensic Tools for Encryption / Decryption
• Forensic Tools for Password Recovery
• Forensic Tools for Analysing Network
© Oxford University Press 2018. All rights reserved.

Outline (Cont…)
• Forensic Utility for Metadata Processing
• Miscellaneous Tools
• Forensic Tools for UNIX System Analysis
• Forensic Tools for Other media
• Forensic Hardware
• Forensic Analysis Tools for Mobile Devices
• Forensic Tools for Email Analysis
• Need for Computer Forensic Investigators
• Career Prospects for Forensic Investigators
• Forensic Training and Certifications
© Oxford University Press 2018. All rights reserved.

FORENSIC TOOLS
• Forensic tools are used by forensic investigators
• To acquire digital evidence from ECTs
• To Index
• To Perform detailed analysis
• Uses of Forensic tools are two fold:
1)Criminal investigations
if damage caused is severe like web defacing / intrusion, criminal charges have to filed against offenders
Forensic tools help to locate and identify the offenders so that they may be reported and evidence can be collected
2)Cleaning up & Rebuilding
after an incident , to ascertain its impact, to figure out the damage and rebuild the system
If offender has deleted the files tools can be used to recover the same
© Oxford University Press 2018. All rights reserved.

FORENSIC TOOLS
• Forensic tools are : Proprietary or Open-source/ freely available
• Choice of tools depends on:
• OS supported
• preferences of user interface
• budget
• functionality capability
• Types of Forensic tools:
• Hardware tools:
• include specific components of the server used for investigation
• Software tools:
• include command line applications and technical applications meant for forensic investigation, which either perform a single task or a collection of tasks
© Oxford University Press 2018. All rights reserved.

Forensic Tools (Cont…)
Categories of Forensic Tools
© Oxford University Press 2018. All rights reserved.

Acquisition
• First step after identification of evidence
• Refers to creating an exact bit stream copy of the original storage media that exists on subject’s computerCreating forensic image has follwingbenefits:• Preserves original evidence
• Prevents inadvertent alteration of original evidence during examination
• Allows creation of another image
Acquistion can be : Physical / logical
In physical : entire drive is copied including the deleted files and file fragments
In logical: only the active data, ie the data excluding the deleted space, deleted files and fragments are copied
© Oxford University Press 2018. All rights reserved.

Acquisition
Two ways of copying files from original storage media:
a) Logical back –up
copies directories and files of a logical volume
does not capture other data in deleted files or in slack space
also it modifies timestamps of the data, hence contaminating the timeline
b) Bit stream imaging/ disk imaging / cloning
bit-for-bit copy of original media including hidden and residual data
eg: slack space, swap residue, unused space and deleted files
Bit stream does either :
Disk-to-disk copy- copies contents of media into another media directly
- used to test booting
Disk-to-file copy - copies sontents of media into single logical file which is compressible amdresults in faster searches
Image-to-disk – used to restore an image
Drive imaging tools help in acquisition stage© Oxford University Press 2018. All rights reserved.

Integrity Preservation
Integrity of the data preserved during acquisition is ensured by comparing the secondary with the primary of the original copy of the data
A write blocker:
-ensure backup or imaging process does not alter the data on the original media
-it is a h/w or s/w based tool that prevents a computer from writing to computer storage media connected to it
H/W write blockers are physically connected to the computer and storage media being processed to prevent any write to that media
in h/w write blocker the suspected storage media (original evidence) must be directly connected to dwrite blocker and this write blocker must be directly
connected to computer or device which is performing backup or imaging
© Oxford University Press 2018. All rights reserved.

Integrity Preservation
S/W write blockers : s/w should be loaded on the computer and then the device performing backup or imaging has to be connected to the computer
Forensic image files are created as a result of the imaging process with extensions varying with the drive imaging tool being used
Eg: ‘.p01’ forCyber Check suite
‘.e01’ for Encase
‘.001/.SFB’ for Safe Back
© Oxford University Press 2018. All rights reserved.

Validation and discrimination
Validation include processes for comparison such as hashing and analysing the file header after filtering
After imaging, it is necessary to verify whether the data copied is an exact duplicate of the original data
The message digest is computed to verify its integrity
Message digest is hash that uniquely identifies data and has following property:
Changing a single bit of data results in completely different message digest
Hash algorithm is used as a utility to create binary or hexadecimal number t hat represent uniqueness of the dataset such as file or drive
This unique number is also referred to as Digital finger print
If two file have same hash values , they are 100% identical
© Oxford University Press 2018. All rights reserved.

Validation and discrimination
Utility algorithms tat are used to produce hash values include CRC-32 , MD5, SHA-1, SHA-512
CRC32- 32 bit cyclic redundancy check used for error detection during data transmission
MD5-meesssage digest is a mathematical algorithm that uses cryptographic hash function to produce 128 bit hash value used to demonstrate integrity of data
SHA is secure hash algorithm it represents condensed version of a file produces 160, 256 or 512 bits of the digest based on different versions of it
Upon verification, forensic image files are written to a new freshly formatted media or forensically sterile media
Any no of copies can be made for forensic examination
Discrimination is done by searcshing and comparing file headers, which is necessary to separate suspicious data.
Filtering tools and keyword search utilities help in this phase
© Oxford University Press 2018. All rights reserved.

Extraction
The required data is extracted during investigation using Recovery task
This involves: viewing data, searching for keywords, decompressing data, carving, decrypting etc
Data recovery tools are available to handle this stage
© Oxford University Press 2018. All rights reserved.

Reconstruction
This attempts to reconstruct the suspect’s drive to analyse what happened during the crime
This require acquisition and analysis of the evidence by forensic investigators
Involves actvities such as disk-to-disk copy, image-to-disk copy, partition-to-partition copy
Tools for copying are available
© Oxford University Press 2018. All rights reserved.

Reporting
Last step in forensics
A step-by-step process is carried out during analysis is ppresented in detail
Reporting tools either standalone or those present in forensic suite can be used
© Oxford University Press 2018. All rights reserved.

Miscellaneous tools
Password recovery tools
Mobile forensic tools
Network analysis tools
© Oxford University Press 2018. All rights reserved.

Cyber Forensic Suite
• Forensic suite has Specialized tools for
• RAM analysis
• Hard disk imaging and analysis
• Verification and validation
• Registry analysis
• Data recovery and reconstruction
• Password cracking
© Oxford University Press 2018. All rights reserved.

Cyber Forensic Suite
Free and Open-source Forensic Suite
• OSForensics
• Used for discovering the evidence, identifying and reporting it
• Deiscovers relevant data faster using file searching and indexing
• Can recover deleted files, extract passwords, decrypt files irrespective ofOS and file system
• Identifies evidence & suspicious activity using hash matching, drivesignature analysis features such as
• Creates timeline of user activity
• It can build custom reports, add narratives and can attach another tool’sreports
• A collection of tools are provided as free tools for use with this:
• OSFMount-for mounting dd image files in windows
• OSFClone-self booting disk cloning tool
• ImageUSB-to write images to multiple USB drives
• Volatility workbench- for memory analysis© Oxford University Press 2018. All rights reserved.

Cyber Forensic Suite contd..
• Nirsoft
• Provide a unique collection of freeware utilities forpassword recovery, network monitoring, internet relatedutilites, S-outlook tools, command line utilities, desktoputilities etc.
© Oxford University Press 2018. All rights reserved.

Cyber Forensic Suite contd..
• Windows Sysinternals Live
© Oxford University Press 2018. All rights reserved.

Cyber Forensic Suite contd..
• Autopsy
• Autopsy Forensic browser is a graphical interface to thecommand line investigation tools
• Used by law enforcement , military, corporate examiners
• Supports web artifact analysis & registry analysis
• Types• Dead analysis autopsy
• Live analysis autopsy
© Oxford University Press 2018. All rights reserved.

Cyber Forensic Suite contd..
• Autopsy
© Oxford University Press 2018. All rights reserved.

Cyber Forensic Suite contd..
• Autopsy
© Oxford University Press 2018. All rights reserved.

Cyber Forensic Suite (Cont…)
• Computer Aided Investigative Environment
© Oxford University Press 2018. All rights reserved.

Cyber Forensic Suite (Cont…)
• PALADIN
© Oxford University Press 2018. All rights reserved.

Cyber Forensic Suite (Cont…)
• Hiren’s Boot CD
• All in one bootable CD
• It has following utilities:
• Antivirus tools
• Back up tools
• BIOS/CMOS tools
• Browsers/file managers
• Cleaners
• Device drivers
• Editors/viewers
• File system tools
• Hard disk tools
• Master boot record tools
• Network tools
• Optimizers
• Partition tools
• Password/key tools
• Process tools
• Recovery tools
• Registry tools
• Remote control tools
• Testing tools
• tweakers
© Oxford University Press 2018. All rights reserved.

Cyber Forensic Suite (Cont…)
• Digital Evidence and forensic toolkit
© Oxford University Press 2018. All rights reserved.

Drive Imaging and Validation Tools
• Intelligent Computer Solutions Image Master Solo Forensics Hard Drive Duplicator
• Norton Ghost
• Symantec Ghost
• Safeback
• Encase Forensic Imager
• FTK Imager
• ProDiscover Incident response (IR)
© Oxford University Press 2018. All rights reserved.

Drive Imaging and Validation Tools (Contd)
• X-Ways Forensic (XWF)
• DriveSpy
• Forensic Replicator
• SMART Acquisition Workshop (SAW)
• SMART
• WinHex
© Oxford University Press 2018. All rights reserved.

Forensic Tool for Integrity Verification and Hashing• HashMyFiles
• HashCalc
• CRCMD5
• DiskSig
• MD5summer
© Oxford University Press 2018. All rights reserved.

Forensic Tool for Integrity Verification and Hashing• HashMyFiles
• HashCalc
• CRCMD5
• DiskSig
• MD5summer
© Oxford University Press 2018. All rights reserved.

Forensic Tools for Data Recovery
• Recuva
• Byte Back
• IsoBuster
© Oxford University Press 2018. All rights reserved.

Forensic Tools for Data Recovery
• IsoBuster
© Oxford University Press 2018. All rights reserved.

Forensic Tools for RAM Analysis
• Live RAM Capturer
• Volatility
• DumpIt
• Magnet RAM Capture
© Oxford University Press 2018. All rights reserved.

Forensic Tools for RAM Analysis
• Live RAM Capturer
• Volatility
• DumpIt
• Magnet RAM Capture
© Oxford University Press 2018. All rights reserved.

Forensic Tools for RAM Analysis
• Live RAM Capturer
• Volatility
• DumpIt
• Magnet RAM Capture
© Oxford University Press 2018. All rights reserved.

Forensic Tools for Analysis of Registry• Regshot
• RegRipper
© Oxford University Press 2018. All rights reserved.

Forensic Tools for Encryption / Decryption• VeraCrypt
• Encrypted Disk Detector
© Oxford University Press 2018. All rights reserved.

Forensic Tools for Password Recovery• Passware Kit Forensic
• ElcomSoft
• Ophcrack
© Oxford University Press 2018. All rights reserved.

Forensic Tools for Analysing Network• Wireshark
• Packet Tracer
• OpenVPN
• Network Mapper
• Firewalk
• Tripwire
• Snort
• NetAnalysis
© Oxford University Press 2018. All rights reserved.

Forensic Utility for Metadata Processing• PhotoMe
• Metadata Assistant
© Oxford University Press 2018. All rights reserved.

Miscellaneous Tools
• CD/DVD Inspector
• Mandiant Redline
• Filter_I
• GetFree
• GetSlack
• GetTime
• NTI-DOC
• Seized
© Oxford University Press 2018. All rights reserved.

Miscellaneous Tools (Contd)
• TextSearch Plus
• AnaDisk Diskette Analysis Tool
• CopyQM Plus
• DiskScrub Data Overwrite Utility
• DiskSearch Pro
• Net Threat Analyzer
• M-Sweep Data Scrubber
• TeleDisk
© Oxford University Press 2018. All rights reserved.

Miscellaneous Tools (Contd)
• FileCNVT
• DM
• Palm dd
• WinHex
• SIFT
• X-Ways Forensics
• Dtsearch
• QuickView Plus FileViewer
• Paraben Porn Stick
• Snagit
© Oxford University Press 2018. All rights reserved.

Forensic Tools for UNIX System Analysis• Linux dd Command Utility
• Backing up and restoring entire hard drive or partition
• Creating virtual file system to back up images of CD andDVD as image files
• Backing up and restoring of MBR
• The Coroners Toolkit
© Oxford University Press 2018. All rights reserved.

Forensic Tools for Other Media
• USB Drives
• Digital Cameras
• Non-detachable Hard Disk Drives
© Oxford University Press 2018. All rights reserved.

Forensic Hardware
• Forensic Systems
• FRED Forensic Network
• Forensic Write Blockers
• Forensic Computers Inc.
© Oxford University Press 2018. All rights reserved.

Forensic Analysis Tools for Mobile DevicesFree and Open-source Forensic Tools for MobileDevices
• BitPim
• Mobile Phone Examiner Plus
• MOBILedit Forensic Express
• SIMCon
• AFLogical
© Oxford University Press 2018. All rights reserved.

Forensic Analysis Tools for Mobile Devices (Contd)Proprietary Forensic Tools for Mobile Devices
• XAMN
• Oxygen Forensic Detective
• Paraben’s Device seizure
• XRY
© Oxford University Press 2018. All rights reserved.

Forensic Analysis Tools for Mobile Devices (Contd)Forensic Hardware for Mobile Devices
• CellDEK
• Cellebrite
© Oxford University Press 2018. All rights reserved.

Forensic Tools for Email Analysis
• Aid4Mail
• Digital forensics framework (DFF)
• eMailTrackerPro
• Paraben Email Examiner
• EmailTracer
• Adcomplain
© Oxford University Press 2018. All rights reserved.

Forensic Tools for Email Analysis (Contd)
• MailXaminer
• AbusePipe
• Internet Evidence Finder (IEF)
• FINALeMAIL
• Forensics Investigation Toolkit (FIT)
© Oxford University Press 2018. All rights reserved.

Need for Computer Forensic Investigators• Any organization that relies on an ECD may require
a digital forensic investigator.
• Domains which demand computer forensicinvestigators:• Law enforcement officials
• Legal professionals
• Insurance companies
• Corporate human resources professionals
• System administrators and security consultants
• Private investigators
© Oxford University Press 2018. All rights reserved.

Career Prospects for Forensic Investigators• Computer forensics analyst
• Computer forensics investigator
• Computer forensics specialist
• Computer forensics technician
• Digital forensics specialist
• Forensic computer examiner
• Career Areas:• Local law enforcement• Federal law enforcement• Armed forces• Security department
© Oxford University Press 2018. All rights reserved.

Forensic Training and Certifications
© Oxford University Press 2018. All rights reserved.

Evidence Acquisition Using Access data
FTK Imager
Forensic Toolkit or FTK is a computer forensics software product made by AccessData. This is
a Windows based commercial product. For forensic investigations, the same development team
has created a free version of the commercial product with fewer functionalities. This FTK Imager
tool is capable of both acquiring and analyzing computer forensic evidence.
The evidence FTK Imager can acquire can be split into two main parts. They are:
1.Acquiringvolatile memory
2. Acquiring non-volatile memory (Hard disk)
There are two possible ways this tool can be used in forensics image acquisitions:
1. Using FTK Imager portable version in a USB pen drive or HDD and opening it directly from the evidence machine. This option is most frequently used in live data acquisition where the evidence PC/laptop is switched on.
2. Installing FTK Imager on the investigator’s laptop. In this case the source disk should be mounted into the investigator’s laptop via write blocker. The write blocker prevents data being modified in the evidence source disk while providing read-only access to the investigator’s laptop. This helps to maintain the integrity of the source disk.
Acquiring volatile memory using FTK Imager ThieFTK Imager tool helps investigators to collect the complete volatile memory (RAM) of a
computer. The following steps will show you how to do this.
Open FTK Imager and navigate to the volatile memory icon (capture memory).
Navigate to the destination location where you need to save the captured volatile memory and
create a file name.

NOTE: This tool provides options to include pagefile and AD1 files when acquiring the volatile
memory.
Pagefile: The pagefile (pagefile.sys) is used in Windows operating systems as volatile memory
due to limitation of physical random access memory (RAM). It is located under the “C” partition
ready to use as volatile memory when the existing RAM capacity is exceeded. So this file can
have quite a bit of valuable data when considering the volatile memory. Therefore it is
recommended to capture and collect this file in the acquisition.
AD1 file: AD1 is the FTK imager image file. The investigator has the option to create an AD1
file for later use.
Clicking the “capture memory” button will start acquiring the volatile memory.
NOTE: Once the acquisition has completed, the destination folder will have the acquired
memory with the file extension of “.mem”.

Acquiring non-volatile memory (Disk Image) using FTK
Imager As previously stated, this same tool can be used to collect a disk image as well.
Open FTK Imager and navigate to “Create Disk Image”.
Now select the source that you need to acquire.
NOTE: FTK Imager is capable of acquiring physical drives (physical hard drives), logical drives
(partitions), image files, contents of a folder, or CDs/DVDs. Investigators can connect external
HDDs into the collection computer via write blocker and use the “logical drive” option to select
the mounted HDD as a partition.
Collecting Physical Drives

Select the “Physical Drive” option.
Select the drive you need to acquire and click “Finish”.
Now add a destination. (Click “Add…” to choose your destination.)

Now it is required to select the image format.

Raw (dd): This is the image format most commonly used by modern analysis tools. These raw
file formatted images do not contain headers, metadata, or magic values. The raw format
typically includes padding for any memory ranges that were intentionally skipped (i.e., device
memory) or that could not be read by the acquisition tool, which helps maintain spatial integrity
(relative offsets among data).
SMART: This file format is designed for Linux file systems. This format keeps the disk images
as pure bitstreams with optional compression. The file consists of a standard 13-byte header
followed by a series of sections. Each section includes its type string, a 64-bit offset to the next
section, its 64-bit size, padding, and a CRC, in addition to actual data or comments, if
applicable.
E01: this format is a proprietary format developed by Guidance Software’s EnCase. This format
compresses the image file. An image with this format starts with case information in the header
and footer, which contains an MD5 hash of the entire bit stream. This case information contains
the date and time of acquisition, examiner’s name, special notes and an optional password.
AFF: Advance Forensic Format (AFF) was developed by Simson Garfinkel and Basis
Technology. Its latest implementation is AFF4. The goal is to create a disk image format that
does not lock the user into a proprietary format that may prevent them from being able to
properly analyze it.

Now enter the case details.
Add an image destination (where the image file will be saved), image file name and fragment
size.

Image Fragment Size (MB): this option will separate the image file into multiple images and
save them in the same destination. If you need only one file instead of creating multiple
fragmented images, you must set the image fragment size to “0”.
Select the “verify images after they are created” option. This will verify the hash values once the
image has created. In order to ensure integrity, it is recommended to use this option. However
this will increase the time taken to acquire your evidence, especially if you’re dealing with a
large disk image size.

Click “start” to start acquiring.
Once acquiring is complete, it will create a text file including all the information it has acquired.

Digital Forensics, Part 2: Live Memory Acquisition and Analysis September 27, 2016 |
OTW
In some cases, the forensic investigator will need to grab an image of the live memory. Remember,
RAM is volatile and once the system is turned off, any information in RAM will be likely lost. This
information may include passwords, processes running, sockets open, clipboard contents, etc. All of
this information must be captured before powering down the system or transporting it.
In addition, many hard drives are encrypted with such things as TrueCrypt and the password for these
encryption regimes resides in RAM. If the hard drive is encrypted, then capturing volatile data is
even more crucial as the hard drive information may be unavailable to the forensic investigator
without it.
There are many tools for capturing data from memory, but one company, Access Data, has been
providing their FTK (Forensic Tool Kit) Imager for years for free and, as a result, it has become the
de-facto standard in image capturing. You can the FTK Imager at Access Data's website.

Step 1: Using the FTK Imager to Capture Memory
Once we have downloaded and installed FTK Imager, we should be greeted by a screen like that
below.
Next, click on the "File" pull down menu and go to the "Capture Memory" selection.

t will open a window like that below. You will have to select where to store your memory dump,
what to call the file, whether you want to include the page file (virtual memory), and whether you
want to create an AD1 file (AccessData's proprietary data type).

When you completed each of these, click the "Capture Memory" button.
This will start a window that will track the progress of your capture. If the system has a lot of
memory, that could take awhile.
Step 2: Volatility Memory Analysis Tool
Analyzing a memory capture is a bit different from a hard drive analysis. One of the beauties of
memory analysis is the ability to actually recreate what the suspect was doing at the time of the
system capture.
Among the most widely used tools for memory analysis is the open-source tool appropriately
named Volatility. It is built into Kali Linux, so there's no need to download it. Simply transfer the
memory image you captured to your Kali machine and we can begin our analysis.
If you aren't using Kali, you can download volatility from www.volatilityfoundation.org. It has
been ported for Window, Linux, and Mac OS X, so it will work on nearly any platform.
Step 3: Using Volatility for Analysis
To use Volatility, navigate to /usr/share/volatility
kali > cd /usr/share/volatility
Since Volatility is a python script, you will need to preface the command with the keyword python.
To view the help page, type:
kali > python vol.py -h
This will display a long list a command options.
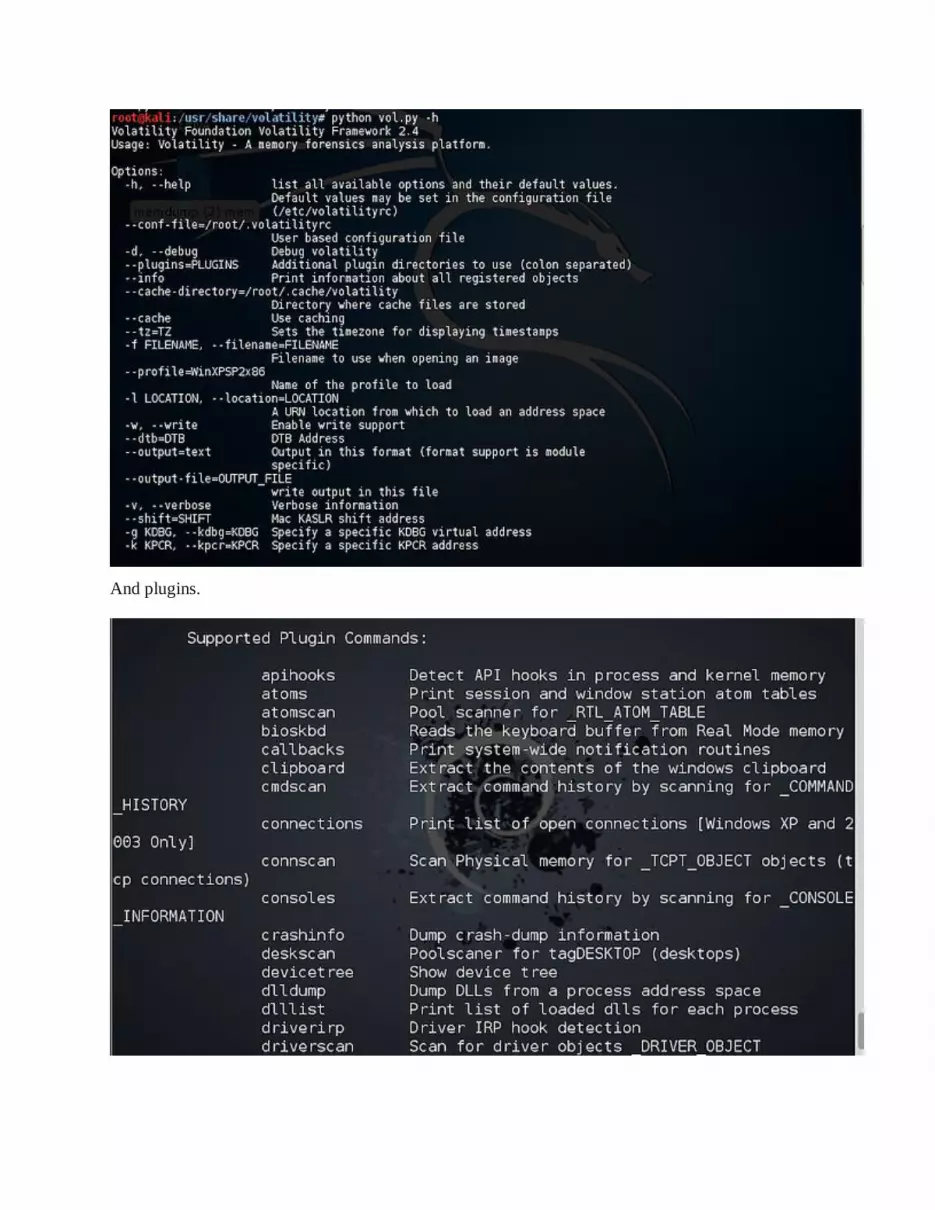
And plugins.

Before we can do any work on this memory image, we first need to get the profile of the image. This
will retrieve key information from the image. This profile will then help volatility to determine
where in the memory capture key information resides, as each operating system places information
in different address spaces.
To get the profile, type:
kali > python vol.py imageinfo -f /location of your imagefile
For instance, I put my image on my desktop, so my command would be:
kali > python vol.py imageinfo -f /root/Desktop/memdump.mem
This command will examine the memory file for evidence of the operating system and other key
information.
As you can see in the screenshot above, Volatility identified the OS as Win7SP0x64 (Windows 7, no
service pack, 64-bit). It also identifies AS layer1 and 2, the number of processors, the service pack,
and the physical address space for each processor, among many other things.
Step 4: Using the Profile
Now that we have recovered the profile of this memory dump, we can begin to use some of the other
functionality of Volatility. For instance, if we wanted to list the registry hives including SAM, we
could use the hiveinfo plugin by typing:

kali > python vol.py --profile Win7SP1x64 hivelist -f /location of your image/
Note that Volatility was able to list all of the hives including their virtual and physical location in
RAM.
Parsing out the image profile is crucial, as each operating system stores information in different
places in RAM. Volatility needs to know the profile (OS, service pack, and architecture) to know
where to look in the memory image for the necessary information. If you put in the wrong profile
information, Volatility will throw errors telling you it can't parse the information properly. In that
case, try another image profile. Unfortunately, the profile image that this tool provides is not
always correct.
Step 5: Getting the List of Processes
As our next step, let's see if we can find the processes that the suspect had running when we captured
the RAM image. We can do this by typing:
kali > python vol.py --profile Win7SP1x64 pslist -f /root/Desktop/memdump.mem

Let's break that down:
python is the interpreter.
vol.py is the name of the Volatility script.
--profile Win7SP1x64 is the profile of the system the memory image was captured from.
pslist is the plugin to parse out the running processes.
-f /root/Desktop/memdump.mem is the location of the image file.

As you can see, Volatility has parsed out all the running processes. To gather even more
information from the RAM image, we can use exactly the same command as above with the
exception of changing the name of the plugin.
To get a list of available plugins you could use, type:
kali > python vol.py -h

Step 6: Getting the Running DLLs
To view the running DLLs on the system, we simply use the dlllist plugin like below:
kali > python vol.py --profile Win7SP1x64 dlllist -f /root/Desktop/memdump.mem

As you can see, Volatility parsed out a list of all the running DLLs.
Step 7: Getting the Contents of the System's Clipboard
Sometimes, what the suspect had in their clipboard can be incriminating. We can retrieve the
information from the suspect's RAM by using the clipboard plugin like below.
kali > python vol.py --profile Win7SP1x64 clipboard -f /root/Desktop/memdump.mem

Unfortunately, all this information is in hexadecimal and must be translated to ASCII.
Step 8: Getting a Timeline of Events
Often times, to prove that a suspect actually committed the action they are accused of, we may need a
timeline of events that took place on that system. We can retrieve this timeline information from the
memory image by using the timeliner plugin like below.
kali > python vol.py --profile Win7SP1x64 timeliner -f /root/Desktop/memdump.mem

Note that each process is time stamped.
Step 9: Looking for Malware in the Memory
Lastly, let's look for any malware running in the memory of the suspect system. Volatility has a
plugin especially designed for this purpose, appropriately named malfind. We can use it like any
other Volatility plugin. Simply type the same command as above but replace the name of the plugin
with malfind.
kali > python vol.py --profile Win7SP1x64 malfind -f /root/Desktop/memdump.mem

As you can see, this suspect had numerous pieces of malware running on their system. This
information may actually be exculpating as the presence of malware would indicate that someone
else had control of the system and may have committed the actions the suspect is accused of.
Volatility is a powerful memory analysis tool with tens of plugins that enable us to find evidence of
what the suspect was doing at the time of computer seizure

Windows Memory Analysis with
Volatility
Analyst Reference
Version 20171116

Windows Memory Analysis with Volatility
2Copyright 2017 Steve Anson
Version 20171116
Table of Volatility Modules 3Before You Start 4Types of Files That Can Be Analyzed 5Volatility Command Syntax 7Analyzing Network Connections 8Analyzing Processes 9Examining Running Services 16Dumping Process Memory for Further Analysis 17Detecting Kernel Loaded DLLs 18Registry Artifacts in Memory 19Special Use Plugins 21
Table of Contents

Windows Memory Analysis with Volatility
3Copyright 2017 Steve Anson
Version 20171116

Windows Memory Analysis with Volatility
4
Memory analysis is most effective when a known-good baseline is established. Where possible, before an incident occurs, collect information on ports in use, processes running, and the location of important executables on important systems to have as a baseline. By comparing results gathered before a compromise to those gathered after an incident, anomalies on the impacted systems will be much easier to detect. Additionally, being familiar with running processes and open ports that are common on Windows systems is helpful for the same reason. Before attempting to examine processes on a system, it is a good idea to familiarize yourself with processes that are typically found on Windows systems, the location of their executable files, the way they are normally initiated (including their parent process), and how many instances of each is normal. To help with that baseline understanding, consult the following article: http://sysforensics.org/2014/01/know-your-windows-processes/.
Installation of Volatility is assumed in these notes. This can be accomplished by using a prebuilt Linux distribution with the tool already installed such as the SANS Investigative Forensic Toolkit (SIFT) found here: https://digital-forensics.sans.org/community/downloads or by following the instructions listed here: https://github.com/volatilityfoundation/volatility/wiki/Installation
These notes are designed to provide a brief introduction to the capabilities of the Volatility Framework and to serve as a quick reference during use. Those looking for a more complete understanding of how to use Volatility are encouraged to read the book The Art of Memory Forensics (http://www.memoryanalysis.net/amf) upon which much of the information in this document is based. More succinct cheat sheets, useful for ongoing quick reference, are also available from here http://downloads.volatilityfoundation.org/releases/2.4/CheatSheet_v2.4.pdf and from here https://digital-forensics.sans.org/media/memory-forensics-cheat-sheet.pdf.
Copyright 2017 Steve Anson Version 20171116

Windows Memory Analysis with Volatility
5
Volatility can process RAM dumps in a number of different formats. It can also be used to process crash dumps, page files, and hibernation files that may be found on forensic images of storage drives. Finally, RAM files from virtual machine hypervisors can also be processed.Keep in mind that since the system is running when RAM is captured, the software tool used to capture the data stored in RAM is not able to make a perfect “Image” in the same way that we can with non-volatile storage devices like hard disks. When capturing RAM, we can only copy each page as it exists at that moment. Therefore, when copying RAM, the data on a page may change right before it is copied and/or right after it is copied. Since RAM will have many pages, copying the contents of each may take several minutes depending upon the capacity of RAM storage, the type of removeable media being used (i.e. USB 2.0 vs. USB 3.0 or 3.1), and other activities occurring on the system at the same time. Therefore, if the copying process takes several minutes to complete, pages copied early in the process may contain totally different data by the time the last page is copied. If too many changes occur during the RAM capture, the resulting RAM dump may end up being corrupted to the point that analysis is not possible. To help minimize this risk, do not interact with the system while capturing RAM any more than is necessary. Also remember that most tools only capture the data that is in RAM at the time of capture, so if data has been paged out to disk, that data may not be captured.
Analysis of memory stored on disk, like crash dumps, page files, and hibernation files, is a bit different than data captured from a RAM dump. Page files generally lack the context necessary to completely interpret their data since they represent only a small amount of data relative to what is stored in RAM. Nonetheless, usable data can be recovered from page files, so they are worth examining. While the normal location of the page file is C:\pagefile.sys on Windows systems, additional or alternate locations can be specified by modifying the PagingFiles registry key located at HKLM/CurrentControlSet/System/ Control/ Session Manager/Memory Management. It is therefore best practice to double check that registry setting when analyzing a disk image for paged RAM data.
Copyright 2017 Steve Anson Version 20171116

Windows Memory Analysis with Volatility
6Copyright 2017 Steve Anson
Version 20171116
Contents of RAM are also stored in a hyberfil.sys hibernation file when a Windows system enters hibernation mode to facilitate the system restarting in its previous state. Windows crash dumps store memory contents to disk to facilitate debugging activities, and these files can likewise be used by examiners to recover memory artifacts from the time when the crash occurred. Much like with page files, not all crash dumps will contain sufficient information for meaningful analysis to occur.
Virtual Machine memory can be acquired as if it were a running on bare metal system or in some cases through the hypervisor itself. For example, VMWare can create memory dump files in its own format by taking a snapshot or suspending the virtual machine. Depending on the version of VMWare and how the files are created, RAM data may be found in files with extensions .vmem, .vmss, or .vmsn.

Windows Memory Analysis with Volatility
7
Volatility is written in Python, and on Linux is executed using the following syntax:
vol.py -f [name of image file] –profile=[profile] [plugin]
In the above line, the -f option is used to indicate the name and location of the RAM dump file to be analyzed. The –profile= option is used to tell Volatility which memory profile to use when analyzing the dump. The [plugin] represents the location where the plugin to be used is provided. Volatility is a flexible framework that allows multiple types of plugins to be used to extract information from a RAM dump. Each plugin performs a specific task or set of tasks to create a result. Note that for Windows installations using the Volatility executable, the vol.py in the example line above is replaced with the appropriate executable name, such as volatility-2.5.exe -f [image file name] –profile=[profile] [plugin]
If you are not sure what type of Windows system a RAM image came from, you can ask Volatility to give you additional details about the image with the vol.py -f [image file name] command. This will give you suggested profiles to use on that image. To further narrow down the most likely profile, the vol.py -f [image file name] command will use the kernel debugger data block scan plugin to make a profile suggestion based on the KDBG header. Since the profile tells volatility the format and type of memory objects that should be present in the RAM dump, getting the profile correct is an important first step before any further analysis.
Note that for the rest of this document, we will simply refer to the location of the image file as [image] and the profile for that image as [profile]. We also will stick to the Linux command syntax, however, the same general format can be used on Windows workstations if that is where you chose to run Volatility. You would simply need to substitute the name of your Volatility executable as noted above, and make substitutions such as findstr for grep where such examples are provided.
Copyright 2017 Steve Anson Version 20171116

Windows Memory Analysis with Volatility
8Copyright 2017 Steve Anson
Version 20171116
A common starting point when examining a system for malicious behavior is identifying rogue network connections. The primary Volatility plugin for determining network connections in Windows systems beyond Windows XP is the plugin. It will carve through the memory dump looking for artifacts from network activity, which means it may find sessions that were active or inactive at the time of the RAM dump. The syntax is
vol.py -f [image] –profile=[profile]
Sometimes this plugin is unable to find all the information necessary to reconstruct all the active sessions due to data being paged out at the time of the dump. Additionally, it may recover partially deleted data regarding old connections and/or generate false positive results. As a result, it is a good idea to run commands like netstat -anob at the time of volatile data collection. To have a point of comparison. Keep in mind that tools like netstat may be fooled by malware is running on the live system, so the plugin may detect hidden network activity that netstat misses. Comparing the results of both commands is therefore a best practice when possible.
While memory analysis can provide valuable insight into network activity, and provide some of the best evidence regarding which code on the system was responsible for it, don’t discount the need to collect network forensics evidence as well. Consider correlating evidence from memory dumps with network-based evidence such as log files and live packet captures. Tools like Security Onion (https://securityonion.net) provide a great platform for network security monitoring, with tools like Bro, Squil or Suricata often being the initial detection mechanism for suspicious network activity.

Windows Memory Analysis with Volatility
9Copyright 2017 Steve Anson
Version 20171116
A process can be thought of as a container that holds executable program code, imported libraries, allocated memory, execution threads, and other elements necessary for a computer program to function. A process receives its own allocation of memory and enables an instance of a computer program to run on the system. Malicious code can run on a victim system either as its own process or by injecting code into the context of an already running process. Therefore, analysis of processes is an important aspect of memory forensics. For additional information about processes on a Windows system, consult Windows Internals Part 1 (now in its 7th exceptional edition) by Mark Russinovich, et. al. (https://docs.microsoft.com/en-us/sysinternals/learn/windows-internals).
Listing Processes
On Windows systems, the kernel tracks the currently active processes using a doubly-linked list. Each running process is found in this list, and therefore most standard Windows calls to list processes accomplish this by walking this list and printing each process found in it. Some malware will attempt to hide by delinking its process from this list. In those instances, most live tools run on the system will fail to detect the malware process. When working with a memory dump, different approaches can be taken to locate processes. For example, each process has a fixed format header that contains a key or tag of “Proc” on Windows systems. By searching through all the memory in a RAM dump for the known structure of a process object’s header and other attributes, Volatility can detect processes that are not linked in the standard doubly-linked process list. By using and comparing different methods of identifying processes, an examiner can identify processes that were attempting to hide their presence.
One of the easiest ways to get a list of processes that were running at the time a RAM dump was made is:
vol.py -f [image] –profile=[profile]
The plugin walks the doubly-linked list of processes in the same way as most commands that run on the live system. It therefore provides a useful baseline of what would have been seen by commands like or tasklist when the system was running, but will not give any information about processes that were hidden by removing themselves from the process list or those that had already terminated before the dump was captured.

Windows Memory Analysis with Volatility
10Copyright 2017 Steve Anson
Version 20171116
The plugin will place the list of processes in a tree format to show which processes spawned other processes and make their parent/child relationship clearer. However, it also relies on walking the doubly-linked process list, and therefore suffers from the same limitations as the plugin. It can, however, be a useful command to run, particularly to understand the relationship between processes. For example, if a particular process is identified as malicious, understanding what other processes it spawned helps identify other processes that may be acting maliciously (fruit of the poisonous tree, if you will). Also, a process that spawns in an abnormal way (such as explorer.exe being used to launch a svchost process) may also signal anomalies caused by malicious activity. The syntax to run the module is simply:
vol.py -f [image] –profile=[profile]
As mentioned earlier, Volatility is not limited to using only the doubly-linked process list to identify processes. The entire memory dump can be scanned for known signatures of process objects, and anything that matches that pattern can be displayed. This is an extremely helpful method to find processes that have delinked from the process list to avoid detection. Since it does not rely on the doubly-linked process list, it can also uncover information about processes that were once running but that terminated before the dump was captured. A process scan can be run with the syntax:
vol.py -f [image] –profile=[profile]
The output from the plugin does not provide the hierarchical view of the parent/child relationship in the way that the plugin does. To get a similar effect, you can output the results of into a dot file, and use a program like graphviz to display it graphically. This can be both an informative investigative approach and also makes illustrative graphs for report purposes. To accomplish this, a command like the following can be used:
vol.py -f [image] –profile=[profile] --output=dot --output-file=processes.dot
This command will create the list of process in the dot format. To then convert that to a format such as JPEG, the dot command can be used as follows:
dot -Tjpg processes.dot > processes.jpg

Windows Memory Analysis with Volatility
11Copyright 2017 Steve Anson
Version 20171116
There are many structures within a Windows system that need to track running processes. While the doubly-linked process list is the most commonly used method for enumerating running processes, it is also the most likely to be targeted by processes that are attempting to evade detection. As a result, comparing the results of the doubly-linked list to other structures within the operating system and other methods of detecting processes can help identify processes that are maliciously hiding their presence. For such comparative analysis, the command vol.py -f [image] –profile=[profile]
uses multiple methods for detecting processes and lists which processes are and are not detected by each method. This comparison can help identify processes that are maliciously trying to avoid detection. Some methods will not detect certain processes, such as those that were started before the object upon which the detection method relies. Similarly processes that have terminated will not be detected by methods that only track running processes. To help account for these expected variations, the command
vol.py -f [image] –profile=[profile] –apply-rules
Will show True when a method detects the process, False when the method does not detect the process, and Okay when the process is expectedly absent due to a known limitation of the method being used. Keep in mind that only the method will detect terminated processes.
Examining A Specific Process
Obtaining a list of processes from a memory dump file can be an important way to identify suspicious activity on a system. However, once a process has been identified as potentially malicious, additional steps are often needed to confirm those suspicions and to determine the nature of the process itself. A number of different methods can be used to learn more about a particular process.
For a process to access other elements of the system it must first acquire a handle to the objects that it wants to manipulate. Whether reading a file, writing to a registry key, or opening a connection to a remote share, the process must have permission to access the object and secure a handle to that object. Permissions are determined based on the user or group that is attempting to perform an action, and the permissions that have been assigned to that user and/or the groups of which it is a member. A process is assigned a security token based on the user or service account context from which it was run. This token lists the user and/or groups for which the process is working, which in turn determines which files it may access and other security permissions. The operating system uniquely refers to each user or group with a numeric Security Identifier (SID). To determine the SIDs that are associated with a process’ token, use the following command:
vol.py -f [image] –profile=[profile] -p [PID]

Windows Memory Analysis with Volatility
12Copyright 2017 Steve Anson
Version 20171116
Where PID is the process identifier of the process that you wish to examine.
In addition to permissions, a process may also be assigned privileges by the operating system to perform certain tasks. Privileges include things like the ability to bypass file permissions in order to read files to make backup copies, the ability to access memory of any process to perform debugging operations, the ability to shutdown or restart the system, or the ability to load kernel drivers. These privileges are determined in accordance with local computer policies set by the system administrator. Malware will frequently attempt to enable privileges to allow a malicious process to perform additional tasks. To list the privileges assigned or enabled for a particular process use the following command:
vol.py -f [image] –profile=[profile] -p [PID]
Where PID is once again the process identifier of the process that you wish to examine. The output of this command will list the various privileges that are present (allowed) for that process, an indicator of whether each privilege is enabled, a note as to whether the system enabled the privilege by default, and a description of what the privilege allows the process to do. Before a privilege may be used, it must first be enabled. Therefore, your analysis should pay particular attention to enabled privileges, particularly those that were not enabled by default as they indicate a privilege that the malware bothered to specifically enable and has therefore likely used or intended to use. The –silent option can be added to only show those privileges that were enabled.
In addition to understanding the permission and privilege context of a process, it is important to understand which it has opened to other system resources. A handle is a mechanism used by the operating system to allow access from one resource to another, and to ensure that different resources are not attempting to make conflicting changes at the same time. Specifically, a handle controls access to kernel objects that represent other resources on the system like files, registry keys, processes, etc. To list the opened by a process use the command:
vol.py -f [image] –profile=[profile] -p [PID]

Windows Memory Analysis with Volatility
13Copyright 2017 Steve Anson
Version 20171116
A process may have many opened, so the -t option can be used to restrict the output to a certain type of handle. Examples include key, file and thread. To list only the to registry keys, use the command:
vol.py -f [image] –profile=[profile] -p [PID] -t key
File objects can obviously represent files stored on disk, but can also be used to represent network connections. The type of device involved should be apparent when looking at the path to the object. Some items that may be less obvious include:
• \Device\Ip \Device\Tcp and \Device\Afd\Endpoint all refer to for network connections.
• \Device\LanmanRedirector and \Device\Mup both refer to to SMB network shares.
Searching for these devices may help you locate indications of network activity by the process being examined. Alternatively, the following command can be used to identify drive letter assignments, such as the C or D drives being assigned to hard drive or optical drives, but also assignment of drive letters to mapped network drives, along with the time when the mapping was created.
vol.py -f [image] –profile=[profile]
If you know that a malicious process is storing data in a certain file, you can search through all the process file to determine which process is using that file. For example, if the file name was hiddenfile.txt, you can use the following command to identify processes that may be using that file:
vol.py -f [image] –profile=[profile] -t file | grep hiddenfile.txt
In addition to , it may be of use to examine the environment variables set by a process. The basic syntax of the plugin is:vol.py -f [image] –profile=[profile]
This will list all environment variables for all processes that were running at the time of the dump. However, the plugin can be restricted to a single process with the -p [PID] switch as seen previously with plugins like , , etc. Finally, the –silent option can be employed to have volatility compare the results of the plugin and compare it to a list of known, normal values and then only display items that do not match the known values as programmed into the module.

Windows Memory Analysis with Volatility
14Copyright 2017 Steve Anson
Version 20171116
When analyzing a process, it is important to know which DLLs (Dynamic Linked Libraries) are imported into the process itself. A DLL contains executable code that can provide a process with specific functionality, so understanding which DLLs a process incorporates may give insight into its capabilities. In addition, malicious software may inject rogue DLLs into otherwise benign processes to introduce malicious activity without standing up a new process on the system, so examining processes for the presence of malicious DLLs or other code injection is an important analysis step. Volatility supports this type of analysis with a few different plugins.
Within a process’ memory space is the Process Environment Block or PEB. The PEB contains a number of different items of interest including but not limited to:
• The path to the process’ executable on disk;• The command line used to invoke the process;• Three different lists of DLLs associated with the process:
• One that lists the order in which each DLL was loaded into the process;• One that lists the DLLs based on their order in process memory;• One that lists the order in which they are executed by the program code.
• The standard input, output, and error for the process;• The process’ working directory.
Most tools that run on a live system determine the DLLs used by a process by consulting the first of the three DLL lists stored in the PEB, which tracks the order in which each DLL is loaded. As a result, malware will sometimes modify that list to hide the presence of a DLL. Volatility has a plugin that also parses this same list, which can be run with the following command:
vol.py -f [image] –profile=[profile] -p [PID]
This plugin will list any executable code module, including the program itself. The program executable will load first and should therefore be the first item in the results of this plugin. As a side benefit, the original command line and any arguments used to originally launch the process is also pulled from the PEB and displayed by this module. Ntdll.dll and kernel32.dll are frequently found DLLs that load early in the invocation of many processes. After that, the Import Address Table (IAT) of the process is used to begin loading other DLLS as specified for the process. The plugin will report a load count of -1 (0xFFFF) for items loaded from the IAT. Other counts will be present for other methods of loading DLLs into the process’ memory space.

Windows Memory Analysis with Volatility
15Copyright 2017 Steve Anson
Version 20171116
To help detect DLLs that have unlinked for the load order list in the PEB, Volatility also has a plugin. This plugin acts similarly to the plugin for processes in that it will enumerate the results of DLLs listed in all three lists in the PEB and present a comparison of the results. This helps an analyst to detect anomalies that may be indicative of an attempt to hide the presence of a DLL. In addition, the plugin also manually scans the process’ executive object in kernel memory looking for signatures of DLLs or other types of executable code and presents a list of all items that it detects. In this way, even if the process memory itself has been tampered with, the lists of stored about the process in kernel memory can be used to help identify any tampering. One thing to be aware of in the output from this plugin is that the executable itself will by default only appear in two out of the three PEB lists since it is not a separately loaded DLL but is rather the main executable code. The plugin can be run with the following syntax
vol.py -f [image] –profile=[profile] -p [PID]
Another plugin that may come in handy in detecting malicious code that has been injected into a process is . This plugin looks for suspicious memory areas within a process and displays them along with their associated assembly code so that an analyst can determine if it is suspicious.

Windows Memory Analysis with Volatility
16Copyright 2017 Steve Anson
Version 20171116
Services are processes that run automatically, typically do not require user interaction, and run in predefined user context rather than the context of a user that manually launches them. The Services Control Manager (SCM) is responsible for starting and managing services. The SCM is implemented by services.exe. Services are typically defined in the registry HKLM\SYSTEM\CurrentControlSet\services key. Each configured service will normally have a subkey and details of any DLLs needed by that services can be found in its respective subkey.
Volatility uses a scanning technique to detect services in memory dumps, even those that use unusual loading methods or actively try to avoid detection. Again, having results of tasklist /SVC as comparison is a good practice, so running such commands at collection time is a good idea.
To scan for services, use the plugin, with the following syntax:
vol.py -f [image] –profile=[profile]
You can optionally include the –verbose option for additional details.

Windows Memory Analysis with Volatility
17Copyright 2017 Steve Anson
Version 20171116
Volatility can dump the contents of a process’ or DLL’s memory space for further analysis with other reverse engineering tools if desired. Keep in mind that variables that exist within the program are instantiated with actual values when a process is running. Additionally, some parts of the process memory space may be paged to disk or otherwise inaccessible at the time of the memory dump. Finally, code that is packed or encoded on disk may be unpacked in memory. As a result, the information dumped from a memory dump is not going to be identical to the information stored in the associated executable on disk. For this reason, traditional hash matching techniques and many signature based detection mechanisms will not work when run against process memory extracted by Volatility. Nonetheless, antivirus tools may be able to offer insight into the nature of a process recovered from a RAM dump and reverse engineering tools may be able to determine the actions taken by the process.
If desired, the plugin can be used to dump contents of process memory.
vol.py -f [image] –profile=[profile] -p [PID] –dump-dir=[directory/]
The above will dump the entire contents of the process memory to a file in the directory specified by –dump-dir= option. With addition of the –memory switch, any memory that is not able to be dumped due to paging or other reasons is filled in with zeros to keep the relative location of other objects consistent with the original process. Similar to the plugin, the and plugins can be used to dump specific DLLs from within a process’ memory space.

Windows Memory Analysis with Volatility
18Copyright 2017 Steve Anson
Version 20171116
If determining which the kernel has loaded is of interest in your analysis, the modules and plugins can be used. The following command walks the doubly-linked list of loaded kernel drivers found in the LDR_DATA_TABLE_ENTRY structures and provides the name and path of DLLs loaded by the kernel. The syntax is as follows:
vol.py -f [image] –profile=[profile]
If a DLL has been removed from that list, the modules plugin will not find it. However, the
plugin will scan the memory dump for the tags or signatures of kernel loaded DLLs and provide a list based on its scan. Because it relies on pattern matching and interpretation of memory data, it may result in false positive results. The syntax is
vol.py -f [image] –profile=[profile]

Windows Memory Analysis with Volatility
19Copyright 2017 Steve Anson
Version 20171116
Since many elements of the Windows registry are updated or read frequently by the OS, it is very common to capture registry key data in a RAM dump. Volatility has a plugin to list registry hives, including their path on disk. There may also be a hive listed by Volatility as “[no name]” that represents pointers to other hives and is normal. The syntax for this command is
vol.py -f [image] –profile=[profile]
Malware will often use autostart locations, places in the registry or elsewhere that causes executable code to be launched automatically as a system starts or a user logs in. Since many of these locations are in the registry it may benefit your analysis to look at specific keys for evidence of malware. The plugin provides the ability to view the text data stored within a registry key. The syntax for this plugin is
vol.py -f [image] –profile=[profile] -K “Path\To\Key”
where “Path\To\Key” represents that path to the specific key that you desire to examine.
For example, to determine the current control set being used by the system, the current control set key can be examined with the command
vol.py -f [image] –profile=[profile] -K currentcontrolset
The registry also stores multiple lists of recently used programs, including the key that tracks recently run programs and the time of their execution. While the exact location of the
key varies depending on the version of Windows involved, the plugin is able to locate and parse the data in the key into readable text. The syntax is
vol.py -f [image] –profile=[profile] -K “Path\To\Key”

Windows Memory Analysis with Volatility
20Copyright 2017 Steve Anson
Version 20171116
Similarly, information about executables that were previously present on the system can be gleaned from the and keys of the registry. The and plugins respectively will parse and present this information.
If needed, password hashes can be dumped from memory for external password cracking. Volatility is able to obtain the system key from the SYSTEM hive and use it to extract the hashes from the SAM hive. The syntax of the command is
vol.py -f [image] –profile=[profile]
Additional user password data may be recoverable from the LSA Secrets stored in the registry. Again, Volatility automates that extraction with the plugin, with the following syntax:
vol.py -f [image] –profile=[profile]

Windows Memory Analysis with Volatility
21Copyright 2017 Steve Anson
Version 20171116
If you notice that a suspect had the notepad.exe application open, there is a volatility plugin that can recover typed text from the notepad.exe process memory. Use the following syntax,
vol.py -f [image] –profile=[profile]
To search for commands previously entered into a command shell, try running the plugin as follows:
vol.py -f [image] –profile=[profile]
Additionally, the plugin uses an alternate method to perform a similar search:
vol.py -f [image] –profile=[profile]

Analysing Hard Drive with WinHex WinHex, made by X-Ways Software Technology AG of Germany, is a powerful
application that you can use as an advanced hex editor, a tool for data analysis, editing, and recovery, a data wiping tool, and a forensics tool used for evidence gathering. Customers using WinHex include the Oak Ridge National Laboratory, Hewlett Packard, National Semiconductor, several law enforcement agencies, and many other companies with data recovery and protection needs.
WinHex, which is compatible with Windows 95 through Windows XP, offers the ability to:
Read and directly edit hard drives (FAT and NTFS), floppy disks, CD-ROMs,
DVDs, Compact Flash cards, and other media.
Read and directly edit RAM.
Interpret 20 data types.
Edit partition tables, boot sectors, and other data structures using templates.
Join and split files.
Analyze and compare files.
Search and replace.
Clone and image drives.
Recover data.
Encrypt files (128-bit strength).
Create hashes and checksums.
Wipe drives.
Forensics features (which require a Specialist license) include the ability to:
Gather free and slack space.
Search for text based on keywords.
Create tab-delimited tables of drive contents. These tables can be imported into a
spreadsheet such as Microsoft Excel and sorted.
Licenses cost $44 (Private, $25 per additional license), $84 (Professional, $48
per additional license), and $126 (Specialist, $67 per additional license),
making this application a bargain for the features it offers.
Download and installation
If you want to try out WinHex, download an evaluation version of Winhex.zip.

This version works for the most part, but the Professional and Specialist
features are disabled. After you’ve downloaded Winhex.zip, unzip the
contents into a temporary directory on your administration workstation.
Launch the setup program and choose a destination folder and language for
installation. WinHex comes in English, German, French, Spanish, Italian, and
Portuguese versions. (The latest release is version 10.75.) WinHex’s Setup
program works like every other Windows installation wizard you’ve ever used.
Just follow the onscreen prompts and you won’t go wrong.
WinHex does not store configuration information in the registry or
configuration files in the Windows OS folders, making it portable and helping
you keep your registry size down.
In order for Windows 9x and Me users to directly access CD-ROM sectors,
the Windows file wnaspi32.dll must be present. The file is usually installed
with Windows. If it isn't, you can find it on the Windows Setup CD.
To edit hard disk sectors under Windows NT, 2000, or XP, you'll need
Administrator privileges.
Using WinHex
At its most basic level, WinHex is a hex editor. That is, like most hex editors it
displays three columns: an address, a 16-byte hex display, and a 16-character
text display.
The data viewer can be extensively configured. For example, by clicking the
up, down, right, and left arrows on the toolbar, you can add lines, remove
lines, add columns, and remove columns from the data display. You can view
hex only, text only, or both by clicking check boxes in the View menu. General
options let you set the colors and font, and clicking the Offset column toggles
between decimal and hex address values.
WinHex sessions begin with a Start Center, shown in Figure A, where you can
open files, disks, RAM, and previously edited files that you can select from a
list. WinHex remembers the last editing position of previous files and the state

of the last session, and it allows you to open the entire previous session by
clicking Continue Last Session from the Start Center's Projects window. You
can also open projects and launch scripts (a script editor is enabled in the
Professional and Specialist versions).
Figure A
Begin your WinHex session at the Start Center.
Like other hex editors, WinHex can open files as editable or as read-only.
Edited data is stored in a temporary file until saved, at which time your
changes are committed. There is also an in-place Edit mode in which all
changes are made directly in real time (the default when editing RAM). You
can choose the Edit mode from the Open File dialog. When you open an
entire disk or partition, the default mode is Edit.

Figure B shows the WinHex status bar, appearing to the right of the hex display. In addition to familiar status info such as the filename, creation date, and time, the status bar also shows the file's State (Original/Modified) and undo levels.
Figure B
The status bar displays vital statistics about the data being edited.
The Data Interpreter, at the bottom of the status bar, translates hex values at the insertion point into decimal equivalents, based on the data types you choose. The default types are 8-, 16-, and 32-bit signed. Double-click the Data Interpreter to open a menu of additional options, which include displaying Assembly Language codes, date formats, and different integer types, as shown in Figure C.

Figure C
By default, the Data Interpreter shows 8-, 16-, and 32-bit values for the selected hex code "EB."
Options added here are floating value and Assembly Language op code.
Editing disks and other media
When using WinHex as a disk editor, you can access the media through the operating system (logically) or through the BIOS (physically). Accessing logically allows you to browse the disk by clusters. You can view the file system and access partition boot sectors and file allocation tables. With the Professional license, you can also view free space and slack space.
When physically accessing a disk, it is often possible to edit a disk that the operating system can't access, for whatever reason. It is also possible to view, edit, and back up the Master Boot Record (MBR) partition tables and partition boot sectors.
Open the Disk Editor by selecting Disk Editor from the Tools menu. The Edit Disk window, shown in Figure D, appears and lets you choose which disk, logical or physical, you wish to edit. The disk is now open in Edit mode. Changes are not made in place, but only when you choose Save.
Figure D

Use the Disk Editor to logically or physically access a drive.
In order to repair a disk using WinHex, it's essential to know the difference
between viewing disk data displayed logically and viewing disk data displayed
physically.
When you open Drive C: through logical access, what appears as the 00
address of the disk is really the first byte of that partition's boot sector, and not
the first byte of the disk. Referring again to Figure D, you can see that logical
access on my disk offers two choices: C:\ and D:\ (this machine's hard drive is
partitioned into C:, formatted FAT32, and D:, formatted NTFS), while physical
access offers only one choice: Hard Disk One.
Selecting Hard Disk One reads in the entire drive. Here, offset 00 really
means the actual physical start of the hard drive, head 0, cylinder 0, sector 1,
where the bootstrap code and partition tables for the disk are stored. In
physical view, Drive C: actually begins at offset 7E00h. For comparison,
Figure E shows the first 16 bytes of C:\ accessed logically (1), the first 16

bytes of the hard drive accessed physically (2), and the first 16 bytes of
partition C: accessed physically (3).
Figure E
These three data displays demonstrate the difference in addressing and in accessing data when logically
and physically accessing a drive.
What does this discussion of logical vs. physical access mean? To back up
and restore your MBR with its bootstrap code and the drive's partition tables,
access the disk physically (preferably from another disk that has WinHex
installed). If you only want to back up and restore your partition's boot sector,
it's a bit easier to access the disk logically.
More disk access options
When you open a drive, an Access button appears on the right of the display.
Clicking Access opens a series of options, depending on the type of media
opened.
For example, as C:\ is a FAT32 partition on my system, clicking Access allows
me to jump to the boot sector, FAT 1, FAT 2, a directory browser, root
directory, free clusters, surplus sectors, and others, as shown in Figure F. On
an NTFS partition, I would be able to access the master file table records.

Figure F
These options are available when you're logically accessing a drive.
Had I opened C:\ physically, selecting Access would have offered me the
choices of accessing either disk partition, viewing the partition table and boot
sector, cloning a partition, and creating a backup, as shown in Figure G.
Figure G
Options for working with drives differ for physical access. Use the tool you need.

In Figure F, note the two Access choices: Boot Sector Template and Root Directory Template. Templates are convenient ways to view and edit these disk areas. Figure H shows the result of choosing Boot Sector Template. You can also directly modify information in the hex display.
Figure H
Templates make it easier to work with raw data.
Other templates are available for viewing your drive. Choose View | Template
Manager to see a listing. In addition, WinHex users have made available other

templates. For example, there are templates for reading Zip disk and Palm
database file formats.
Backing up and restoring MBRs, partition tables, and boot sectors
In order for a machine to boot, the hard drive needs to contain a valid MBR, a
partition table naming at least one active partition, and a valid boot sector on
that partition (which will also contain the operating system's boot loader). For
any drive partition to be visible to the operating system, it must be listed in the
MBR's partition table and have a valid boot sector.
The MBR consists of the first 512 bytes of information (512 bytes per sector)
of the hard disk, in sector 1. The first 446 bytes of information contain the
actual bootstrap code. The next 64 bytes are the partition table—four 16-byte
records—and the last two bytes contain a signature that identifies the end of
all boot sectors: 55h AAh.
Backing up and restoring a primary partition's boot sector is a little safer than
working with the MBR, and it's a useful way of demonstrating WinHex's
features.
The boot sector is contained in the first 512 bytes of each partition. In each case, the sector ends with the signature hex code 55h AAh. WinHex makes it easy to manually back up and restore these crucial bytes of code. It's also possible to manually edit this information directly or through a template.
To back up a partition's boot sector, click Access | Boot Sector. From the menu, choose Edit | Copy Sector | Into New File. You'll be asked for a filename. Choose a name such as bootcopy.dat (dat is a WinHex file type) and save. A new window opens with the copied sector.
Be aware that if you save this file to the same disk or partition you are viewing, you have changed the data in that partition. If you're attempting to recover erased data, some of the data may be lost. When you work with a hard drive that may be used as evidence, never work with the original copy. For that, you would clone a disk. However, for our example, we'll continue working with the OS disk.
You could print the template information to save a hard copy in case you ever need to rebuild your MBR manually. At that time, simply access the drive with

WinHex and write the data into the Boot Sector template.
There are a few ways to restore the boot sector. One method would be to open your backup file copy and paste the information to the boot sector area.
Another way that doesn't involve as much file manipulation would be to copy the backup boot sector, if there is one, provided it hasn't also been damaged by a virus or corrupted in some way, back to the beginning of the partition.
In a FAT32 file system, the boot sector copy is stored on sector 6, which begins at offset C00h. NTFS file systems stash a copy near the end of the volume. But you could find the backup without this information by searching for the boot sector header—coincidentally a good way to demonstrate WinHex's Search feature.
The boot sector begins with a jump command (EBh) and contains a header in the fourth position (offset 3). FAT32 headers will read, for example, MSWN4.1.
Copy the entire string from JMP to MSWN4.1 by dragging the cursor over it in either the text column or the hex display column. The string will be highlighted (Figure I). From the menu, choose Edit | Copy Block | Normal to copy a text string to the clipboard, or Edit | Copy Block | Hex Values to copy the hex code. The choice is up to you.
Figure I
WinHex highlights the block of data being manipulated.
Now choose Search | Find Text if you copied text, or Search | Find Hex Values if you copied a string of hex. Paste the string into the search box and click OK. The first search will stop at sector 0. Press F3 to continue the search. The next hit will likely be the backup boot copy.

Let's make sure this sector is really an exact duplicate of the boot sector by using the Compare feature. With the cursor in that sector, choose Edit | Copy Into File. Name that file bootcopy2.
Make sure both files are open in WinHex. From the menu, choose File Manager | Compare. Use the browse buttons to add the file's bootcopy1.dat and bootcopy2.dat to the first and second file boxes. Next, give a name to the report file WinHex will create, as shown in Figure J. Click OK. A message will appear with the result, hopefully the one you want: "No differences found," meaning that the two files (and boot sectors) are identical.
Figure J
You're ready to see if you've located the backup boot sector.
At this point, you know the location of your boot sector's backup, and you
have two files containing exact copies of your current boot sector.
Now practice copying and replacing the boot sector from the partition's backup
copy. Warning: This is not for the faint of heart. If you mess up, you may have
to practice replacing your boot sector for real.
Navigate to the backup copy of your boot sector. For FAT32 drives, a quick
way to do this is to select Position | Go To Sector. Enter 6 and click OK.
Choose Edit | Copy Sector | Normal. This places the data in the clipboard.

Return the insertion point to offset 0 of the original boot sector. Choose Edit |
Clipboard Data | Write. A message will inform you that, "The clipboard data
will be written at offset 0." Click OK.
The clipboard data overwrites sector 0 and is highlighted. The status bar at
the right now shows the following helpful information: State: Modified, Undo
Level: 1, Undo Reverses: Clipboard Writing.
You can back out of the changes by choosing Edit | Undo. At this point in the
exercise, you can also exit Drive C: without committing the changes. If you
feel especially brave and want to test your drive repair skills, choose File |
Save Sectors. Only the modifications you made will be saved.
You've now replaced your boot sector. To back up and replace the drive's
MBR and partition tables, choose Tools | Disk Editor and access the disk
physically. Then copy the MBR to a file and have it ready in case you need to
replace it.
Additional tools
Figures K and L show other tools and options available for working with disks.
Among them are the ability to browse the directory structure, list file clusters,
and clone a disk. Specialist tools include the ability to gather free space, slack
space, and text for analysis; search simultaneously for different keywords;
create tables of contents for the drive; create a table of Bates numbers (a
format used by lawyers for referencing evidence); and highlight free and slack
space.
Figure K

WinHex's disk tools
Figure L
WinHex's Specialist tools
Wipe sensitive files
One last feature is worthy of note, because it pertains to the opposite of data
recovery: WinHex's ability to wipe confidential information so that it can't be
recovered. The File Manager | Wipe Securely option goes beyond many file
shredder tools. When applied to a file, according to WinHex, "Even
professional attempts to restore the file will be futile."

Wipe Securely does not just overwrite a file several times with zeros or other
characters. The file is also reduced to zero length and then deleted. Specialist
and Professional licenses go even further: WinHex erases the name entry of
the file as well.
For more information
WinHex's Professional and Specialist features make this app a low-cost,
formidable arsenal of tools for the IT professional or law enforcement
specialist. It meets the needs of those who need to edit and examine disks for
data recovery and criminal evidence, as well as those who work with sensitive
data that must be securely erased.