customer’s satisfaction in organized retail stores: a study of a rapidly growing metro city
TRANSCRIPT
CASIRJ Volume 5 Issue 3 [Year - 2014] ISSN 2319 – 9202
International Research Journal of Commerce Arts and Science http://www.casirj.com Page 286
Customer’s Satisfaction in Organized Retail STORES: a Study of a Rapidly
Growing Metro City
Prof R.R.Saini* and Kapil Malhotra**
*Professor, Dept. of Commerce,
M.D.University, Rohtak, Haryana
**UGC-JRF, Research Scholar,
Dept. of Commerce, M.D.University, Rohtak
Abstract
In a country like India, where around 60% of the population is dependent on agriculture and
related activities for sustainance, 35-40% of the food get perished/destroyed due to poor facilities
of storage, shortage of cold-houses, poor cold-chain management, poor infrastructure for
transportation etc. One of the major steps taken by the Central Government recently to encourage
the organized retailing in the country was the recent decision of the cabinet to allow 51% FDI in
multi brand retail and 100% in single brand retail, welcoming anyone in the world to invest in
Indian retail market. Now, Multi-brand retailers must bring minimum investment of US$ 100
million. Half of this must be invested in back-end infrastructure facilities such as cold chains,
refrigeration, transportation, packaging etc. to reduce post-harvest losses and provide
remunerative prices to farmers. Various Multinationals and Indian Retail companies have
invested a lot in the organised retail segment (wholesale & retail) and have ambitious plans
further. As the organised retail stores are being openned in almost every city of the country, it
has become necessary to measure the satisfaction level of customers of these stores also to
understand their future purchase intentions. Satisfied customers are more likely to tell others of
their favorable experiences and thus engage in positive word of mouth advertising. This study
has been conducted to measure the level of customer satisfaction of the organized retail stores
(Food & Grocery) in Gurgaon city of Haryana state in India.
Key Words: Customer Satisfaction, Organised Retail Stores, Foreign Direct
Investment, Word of Mouth Advertising.
CASIRJ Volume 5 Issue 3 [Year - 2014] ISSN 2319 – 9202
International Research Journal of Commerce Arts and Science http://www.casirj.com Page 287
Introduction
With a population of over 1.25 billion, India is one of the World’s most attractive future markets
and the Indian subcontinent could potentially become the fastest-growing economy in the world
over the next ten to fifteen years1. The indian economy has undergone considerable deregulation
and privatization in the recent years. Since this process began, the country has grown rapidly and
benefited handsomely from globalization.
Retail - The word ‘Retailing’ is derived from french word ‘Retailer’ meaning to ‘cut a piece off’
or ‘break the bulk’. It is defined as distribution function which includes activities in buying
products from suppliers and selling goods or services or both to the customers for their personal,
family or household use. The term Retailing involves the sale of goods and services in small
quantity for the purpose of final consumption.
Retailing in India is one of the business enterprises of its economy and accounts for 14 to 15% of
its GDP. India is one of the fastest growing retail markets in the world and the 5th
most
favourable destination for international retailers (See Table 1). Indian Retail Sector has made a
good progress in the last few years, thus become as one of the sunrise sectors in the economy.
The Indian Retail Market is estimated to exceed US$ 750 billion by 20152, presenting a strong
potential for foreign retailers planning to enter India. For a strong, stable and consistently
growing economy, a well-organized and efficient retail sector is a must. India’s retailing industry
consists over 90% owner manned small shops i.e. Mom & Pop shops. Of the total Indian Retail
Market, 8% is made up by the Orgnised Retail segment. This segment is estimated to grow at the
rate of almost 30% by 2015. Untill 2011, the Indian Central Government did not allow FDI in
multi brand retail. This prevented foreign groups from any ownership in supermarkets,
convenience stores or other retail outlets. In late 2012, The Government introduced a FDI policy
which allows foreign retailers to own upto 51% in multi brand retail and 100% in single brand
retail. Retailing has come to occupy a prominent position in today’s modern society. Inspite of
1. Retail Management : Principles and Practices, pg 167, New century publications
2. Report on Retail Sector in India, Aug. 2013 available at www.cci.in
CASIRJ Volume 5 Issue 3 [Year - 2014] ISSN 2319 – 9202
International Research Journal of Commerce Arts and Science http://www.casirj.com Page 288
the Indian retail revolution, it is said that over 90% of the sales in Urban India are still through
traditional trade3. Neverthless, modern organised retail format is slowly gaining acceptance and
can easily be said to be emerging as a sturdy contender among consumers.
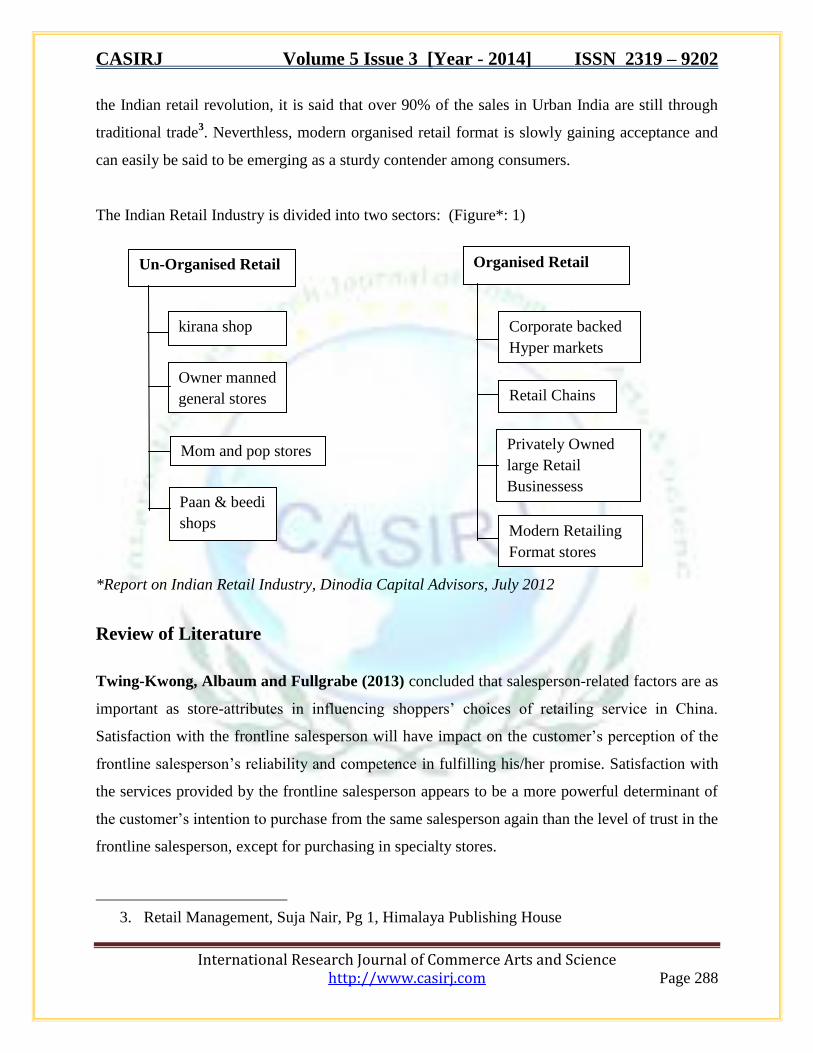
The Indian Retail Industry is divided into two sectors: (Figure*: 1)
*Report on Indian Retail Industry, Dinodia Capital Advisors, July 2012
Review of Literature
Twing-Kwong, Albaum and Fullgrabe (2013) concluded that salesperson-related factors are as
important as store-attributes in influencing shoppers’ choices of retailing service in China.
Satisfaction with the frontline salesperson will have impact on the customer’s perception of the
frontline salesperson’s reliability and competence in fulfilling his/her promise. Satisfaction with
the services provided by the frontline salesperson appears to be a more powerful determinant of
the customer’s intention to purchase from the same salesperson again than the level of trust in the
frontline salesperson, except for purchasing in specialty stores.
3. Retail Management, Suja Nair, Pg 1, Himalaya Publishing House
Owner manned
general stores
kirana shop
Un-Organised Retail
Mom and pop stores
Paan & beedi
shops
Organised Retail
Corporate backed
Hyper markets
Retail Chains
Privately Owned
large Retail
Businessess
Modern Retailing
Format stores

CASIRJ Volume 5 Issue 3 [Year - 2014] ISSN 2319 – 9202
International Research Journal of Commerce Arts and Science http://www.casirj.com Page 289
Patel and Desai (2013) found that five factors namely Product Convenience, Employee Service,
Shopping Convenience, Physical Features and Pricing have been lead to the customer
satisfaction of organized retail stores. Shopping Convenience (Location, Flexibility in Payment
Mode, Convenient Billing Counters, Operating time and Cleaniliness of stores) has the strongest
impact on satisfaction, followed by Pricing, Product Convenience and Employee Service. While
Physical Features (Visually attractive Store, Soft Ambience, Spacious shop floor, Parking) has
no impact on satisfaction.
Mukherjee et al. (2012) concluded that as the level of disposable income of Indian consumers
are rising, their consumption pattern is changing and level of brand consciousness is rising. Most
of the expenditure is on food and groccery products and they largely buy non-branded products.
The consumers knowledge and use of foreign brands is low but they would like more foreign
brands to enter in Indian market.
Madan and Kumari (2012) found that people of below 30 years of age consists the major
portion of the consumers. Further that the consumers were not satisfied with the insufficient
parking space/no parking space/paid parking space. The preference of customers visiting the
retail outlet are variety of products, reasonable price, and the convenient location. Among the
respondents there is a point of dissatisfaction in terms of credit facility, free gifts, discounts and
coupons.
Prasad and Aryasri (2011) found that Indian food and grocery consumers have cross-shopping
behaviour in terms of store formats. No single retail format seems to be prime in meeting
consumer needs/wants. Consumers first choose a store format, and then move into a particular
store within the format where they can save time, money and effort.
Ali, Kumar and Moorthy (2010) concluded that Consumers prioritize the cleanliness/freshness
of food products followed by price, quality, variety, packaging, and non-seasonal availability.
The consumers’ preference of marketplace largely depends on the convenience in purchasing at
the marketplace along with the availability of additional services, attraction for children, basic
amenities and affordability.
Goswami and Mishra (2009) found that Kiranas as well as organized retailers have certain
positive as well as negative aspects. Organized retailer is preferred for their cleanliness, offers,
exclusive store brands, whereas kiranas are preferred for their location and possibility of
Monthly Shopping. Location being one of the primary deciding factors for grocery purchase, the
CASIRJ Volume 5 Issue 3 [Year - 2014] ISSN 2319 – 9202
International Research Journal of Commerce Arts and Science http://www.casirj.com Page 290
kiranas presently have an advantage, but with corporate involvement and large business houses
like Reliance, Bharti, RPG Enterprises etc. coming into foray by opening stores in residential
areas like the small-box retailers, this advantage seems to be short lived.
Kantabutra (2008) found that Vision, empowerment of staff, organizational alignment, vision
communication are four indirect predictors and Motivation of staff is direct predictor of
improved staff satisfaction. On the other hand, vision, vision communication, empowerment of
staff, motivation of staff, and staff satisfaction are five indirect predictors of enhanced customer
satisfaction.
Kaur and Singh (2007) found that Youth are an important consuming class with high disposable
incomes. They view shopping as a means to break the monotony of daily routine. Sensory
stimulants such as the background music, odour, or feel of the products play an important role in
shaping the shopping exercise of these individuals and could set off impulse buying activity in
them. Young consumers are highly information seeking, price discounts or other schemes can be
framed accordingly and communicated to them such that they are liked and accepted by them.
Objectives of the Study
O1 - To study the growth of Organized Retailing in India.
O2 - To evaluate the level of customers’ satisfaction of Organised Retail stores.
Research Methodology
In this study, descriptive research is adopted to find out the customer satisfaction. The survey is
conducted on the organised retail customers (Food & Grocery) in Metro city ‘Gurgaon’ of
various retail stores i.e. discount & convenience stores, supermarkets and hypermarkets. The
sample size is 100. The sampling technique is convenience sampling. Data for this study is
collected from both primary and secondary sources. A simple and easy to understand structured
Questionnaire was designed to collect the primary responses of the customers and various
sources like journals, books, online material were used as secondary sources. A five point likert
scale questionnaire was used here in survey indicating as HD- Highly dissatisfied, DS-
Dissatisfied, N-Neutral, S-Satisfied and HS-Highly satisfied.
CASIRJ Volume 5 Issue 3 [Year - 2014] ISSN 2319 – 9202
International Research Journal of Commerce Arts and Science http://www.casirj.com Page 291
Results & Analysis
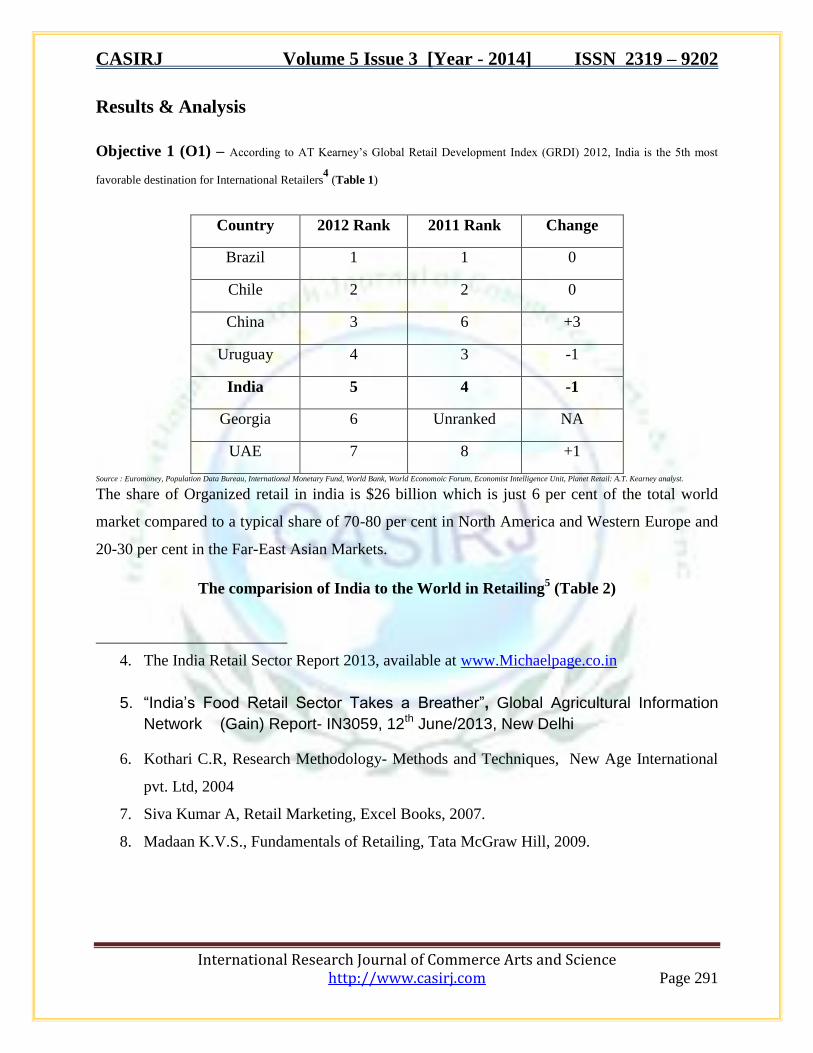
Objective 1 (O1) – According to AT Kearney’s Global Retail Development Index (GRDI) 2012, India is the 5th most
favorable destination for International Retailers4 (Table 1)
Country 2012 Rank 2011 Rank Change
Brazil 1 1 0
Chile 2 2 0
China 3 6 +3
Uruguay 4 3 -1
India 5 4 -1
Georgia 6 Unranked NA
UAE 7 8 +1
Source : Euromoney, Population Data Bureau, International Monetary Fund, World Bank, World Economoic Forum, Economist Intelligence Unit, Planet Retail: A.T. Kearney analyst. The share of Organized retail in india is $26 billion which is just 6 per cent of the total world
market compared to a typical share of 70-80 per cent in North America and Western Europe and
20-30 per cent in the Far-East Asian Markets.
The comparision of India to the World in Retailing5 (Table 2)
4. The India Retail Sector Report 2013, available at www.Michaelpage.co.in
5. “India’s Food Retail Sector Takes a Breather”, Global Agricultural Information
Network (Gain) Report- IN3059, 12th June/2013, New Delhi
6. Kothari C.R, Research Methodology- Methods and Techniques, New Age International
pvt. Ltd, 2004
7. Siva Kumar A, Retail Marketing, Excel Books, 2007.
8. Madaan K.V.S., Fundamentals of Retailing, Tata McGraw Hill, 2009.
CASIRJ Volume 5 Issue 3 [Year - 2014] ISSN 2319 – 9202
International Research Journal of Commerce Arts and Science http://www.casirj.com Page 292
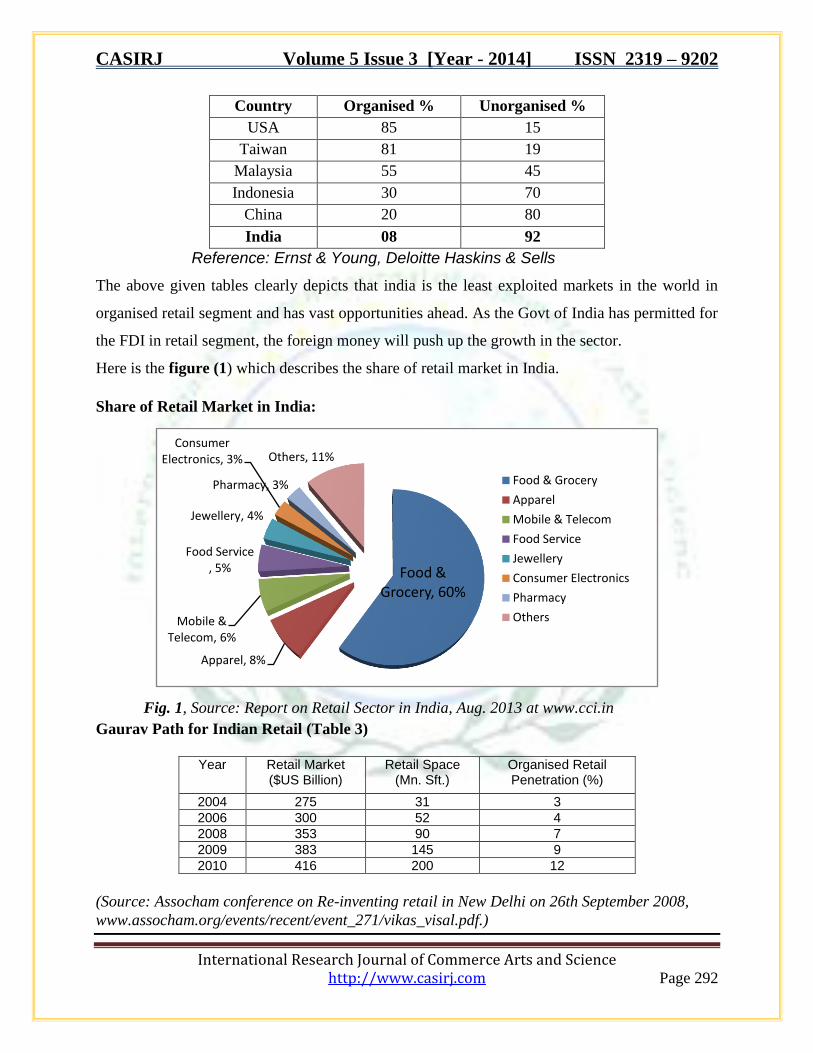
Country Organised % Unorganised %
USA 85 15
Taiwan 81 19
Malaysia 55 45
Indonesia 30 70
China 20 80
India 08 92
Reference: Ernst & Young, Deloitte Haskins & Sells
The above given tables clearly depicts that india is the least exploited markets in the world in
organised retail segment and has vast opportunities ahead. As the Govt of India has permitted for
the FDI in retail segment, the foreign money will push up the growth in the sector.
Here is the figure (1) which describes the share of retail market in India.
Share of Retail Market in India:
Fig. 1, Source: Report on Retail Sector in India, Aug. 2013 at www.cci.in
Gaurav Path for Indian Retail (Table 3)
Year Retail Market
($US Billion) Retail Space
(Mn. Sft.) Organised Retail Penetration (%)
2004 275 31 3
2006 300 52 4
2008 353 90 7
2009 383 145 9
2010 416 200 12
(Source: Assocham conference on Re-inventing retail in New Delhi on 26th September 2008,
www.assocham.org/events/recent/event_271/vikas_visal.pdf.)
Food & Grocery, 60%
Apparel, 8%
Mobile & Telecom, 6%
Food Service , 5%
Jewellery, 4%
Consumer Electronics, 3%
Pharmacy, 3%
Others, 11%
Food & Grocery
Apparel
Mobile & Telecom
Food Service
Jewellery
Consumer Electronics
Pharmacy
Others
CASIRJ Volume 5 Issue 3 [Year - 2014] ISSN 2319 – 9202
International Research Journal of Commerce Arts and Science http://www.casirj.com Page 293
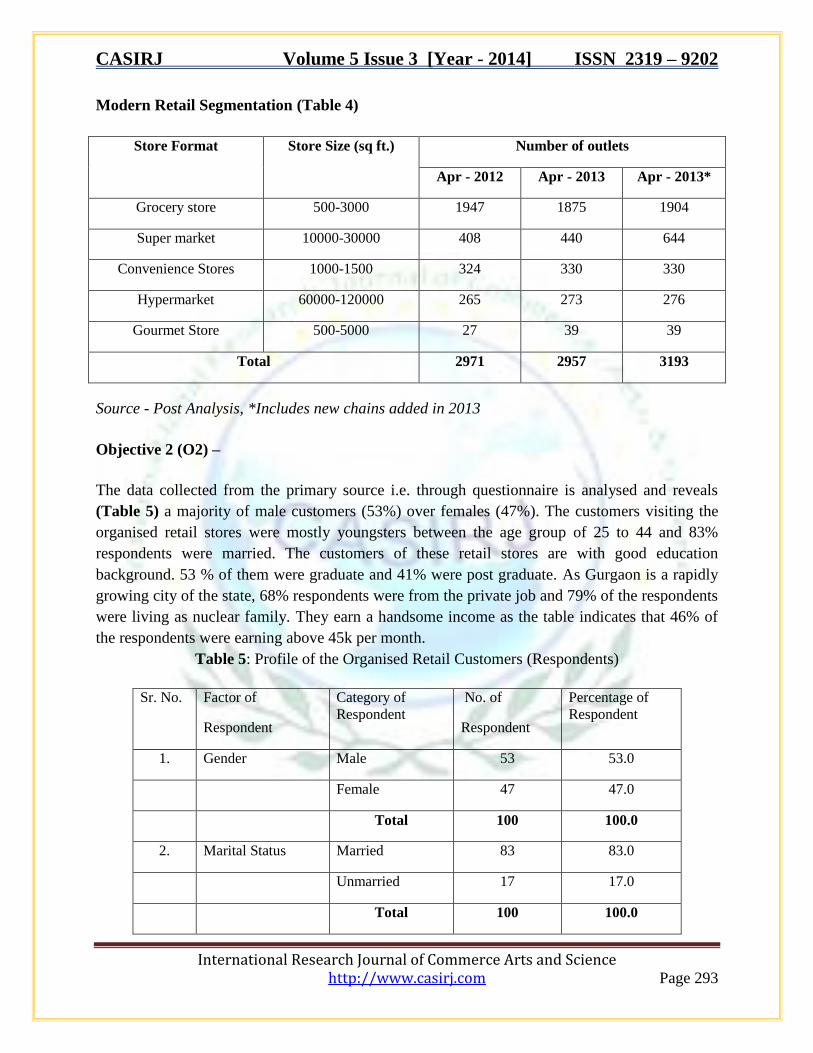
Modern Retail Segmentation (Table 4)
Store Format Store Size (sq ft.) Number of outlets
Apr - 2012 Apr - 2013 Apr - 2013*
Grocery store 500-3000 1947 1875 1904
Super market 10000-30000 408 440 644
Convenience Stores 1000-1500 324 330 330
Hypermarket 60000-120000 265 273 276
Gourmet Store 500-5000 27 39 39
Total 2971 2957 3193
Source - Post Analysis, *Includes new chains added in 2013
Objective 2 (O2) –
The data collected from the primary source i.e. through questionnaire is analysed and reveals
(Table 5) a majority of male customers (53%) over females (47%). The customers visiting the
organised retail stores were mostly youngsters between the age group of 25 to 44 and 83%
respondents were married. The customers of these retail stores are with good education
background. 53 % of them were graduate and 41% were post graduate. As Gurgaon is a rapidly
growing city of the state, 68% respondents were from the private job and 79% of the respondents
were living as nuclear family. They earn a handsome income as the table indicates that 46% of
the respondents were earning above 45k per month.
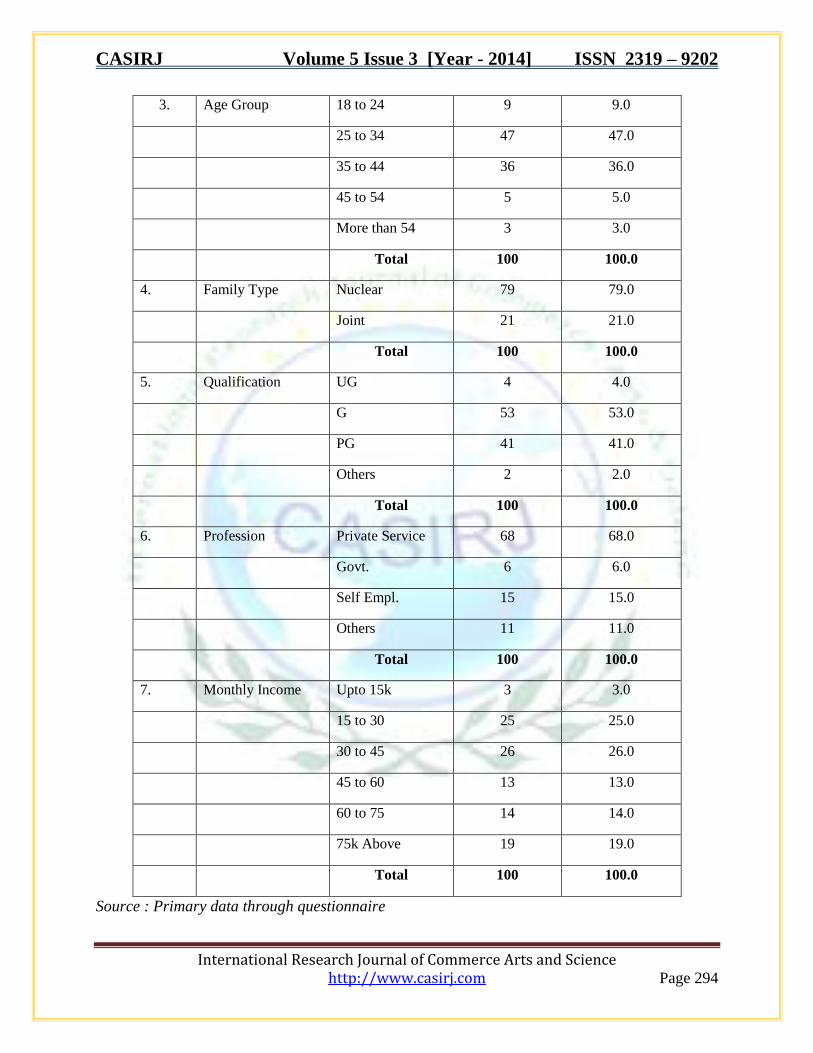
Table 5: Profile of the Organised Retail Customers (Respondents)
Sr. No. Factor of
Respondent
Category of
Respondent
No. of
Respondent
Percentage of
Respondent
1. Gender Male 53 53.0
Female 47 47.0
Total 100 100.0
2. Marital Status Married 83 83.0
Unmarried 17 17.0
Total 100 100.0
CASIRJ Volume 5 Issue 3 [Year - 2014] ISSN 2319 – 9202
International Research Journal of Commerce Arts and Science http://www.casirj.com Page 294
3. Age Group 18 to 24 9 9.0
25 to 34 47 47.0
35 to 44 36 36.0
45 to 54 5 5.0
More than 54 3 3.0
Total 100 100.0
4. Family Type Nuclear 79 79.0
Joint 21 21.0
Total 100 100.0
5. Qualification UG 4 4.0
G 53 53.0
PG 41 41.0
Others 2 2.0
Total 100 100.0
6. Profession Private Service 68 68.0
Govt. 6 6.0
Self Empl. 15 15.0
Others 11 11.0
Total 100 100.0
7. Monthly Income Upto 15k 3 3.0
15 to 30 25 25.0
30 to 45 26 26.0
45 to 60 13 13.0
60 to 75 14 14.0
75k Above 19 19.0
Total 100 100.0
Source : Primary data through questionnaire
CASIRJ Volume 5 Issue 3 [Year - 2014] ISSN 2319 – 9202
International Research Journal of Commerce Arts and Science http://www.casirj.com Page 295
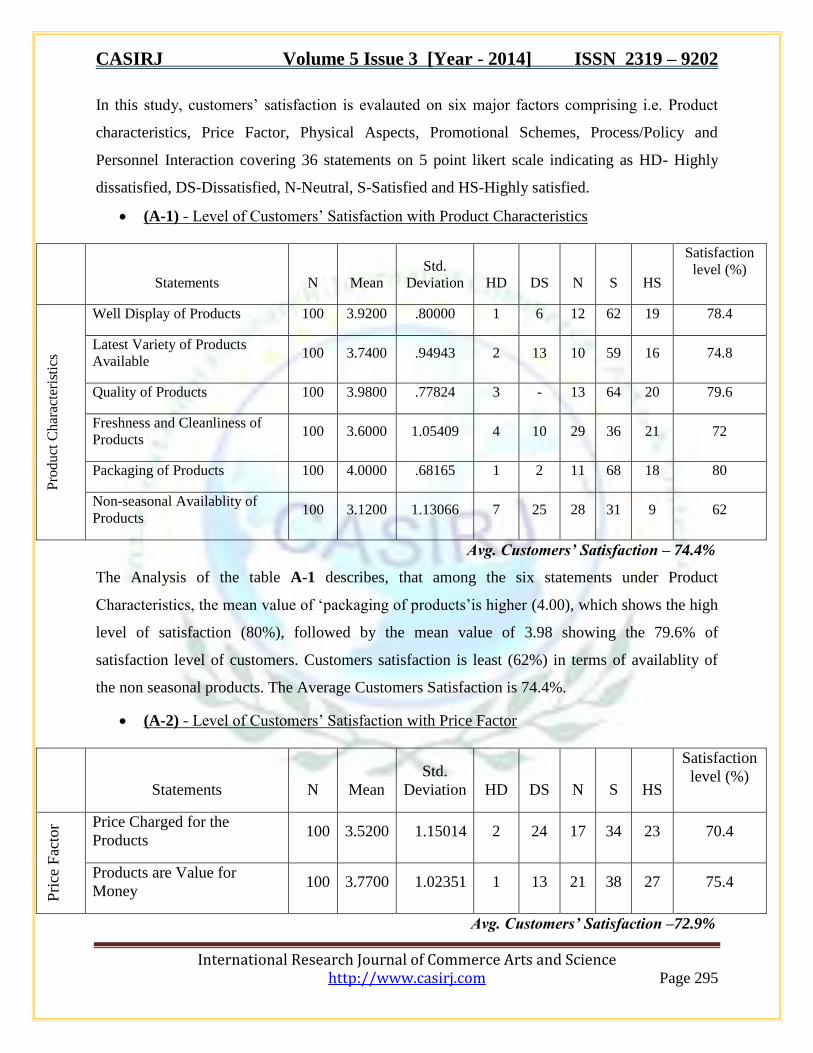
In this study, customers’ satisfaction is evalauted on six major factors comprising i.e. Product
characteristics, Price Factor, Physical Aspects, Promotional Schemes, Process/Policy and
Personnel Interaction covering 36 statements on 5 point likert scale indicating as HD- Highly
dissatisfied, DS-Dissatisfied, N-Neutral, S-Satisfied and HS-Highly satisfied.
(A-1) - Level of Customers’ Satisfaction with Product Characteristics
Statements N Mean
Std.
Deviation
HD
DS
N
S
HS
Satisfaction
level (%)
Pro
duct
Char
acte
rist
ics
Well Display of Products 100 3.9200 .80000 1 6 12 62 19 78.4
Latest Variety of Products
Available 100 3.7400 .94943 2 13 10 59 16 74.8
Quality of Products 100 3.9800 .77824 3 - 13 64 20 79.6
Freshness and Cleanliness of
Products 100 3.6000 1.05409 4 10 29 36 21 72
Packaging of Products 100 4.0000 .68165 1 2 11 68 18 80
Non-seasonal Availablity of
Products 100 3.1200 1.13066 7 25 28 31 9 62
Avg. Customers’ Satisfaction – 74.4%
The Analysis of the table A-1 describes, that among the six statements under Product
Characteristics, the mean value of ‘packaging of products’is higher (4.00), which shows the high
level of satisfaction (80%), followed by the mean value of 3.98 showing the 79.6% of
satisfaction level of customers. Customers satisfaction is least (62%) in terms of availablity of
the non seasonal products. The Average Customers Satisfaction is 74.4%.
(A-2) - Level of Customers’ Satisfaction with Price Factor
Statements N Mean
Std.
Deviation
HD
DS
N
S
HS
Satisfaction
level (%)
Pri
ce F
acto
r Price Charged for the
Products 100 3.5200 1.15014 2 24 17 34 23 70.4
Products are Value for
Money 100 3.7700 1.02351 1 13 21 38 27 75.4
Avg. Customers’ Satisfaction –72.9%
CASIRJ Volume 5 Issue 3 [Year - 2014] ISSN 2319 – 9202
International Research Journal of Commerce Arts and Science http://www.casirj.com Page 296
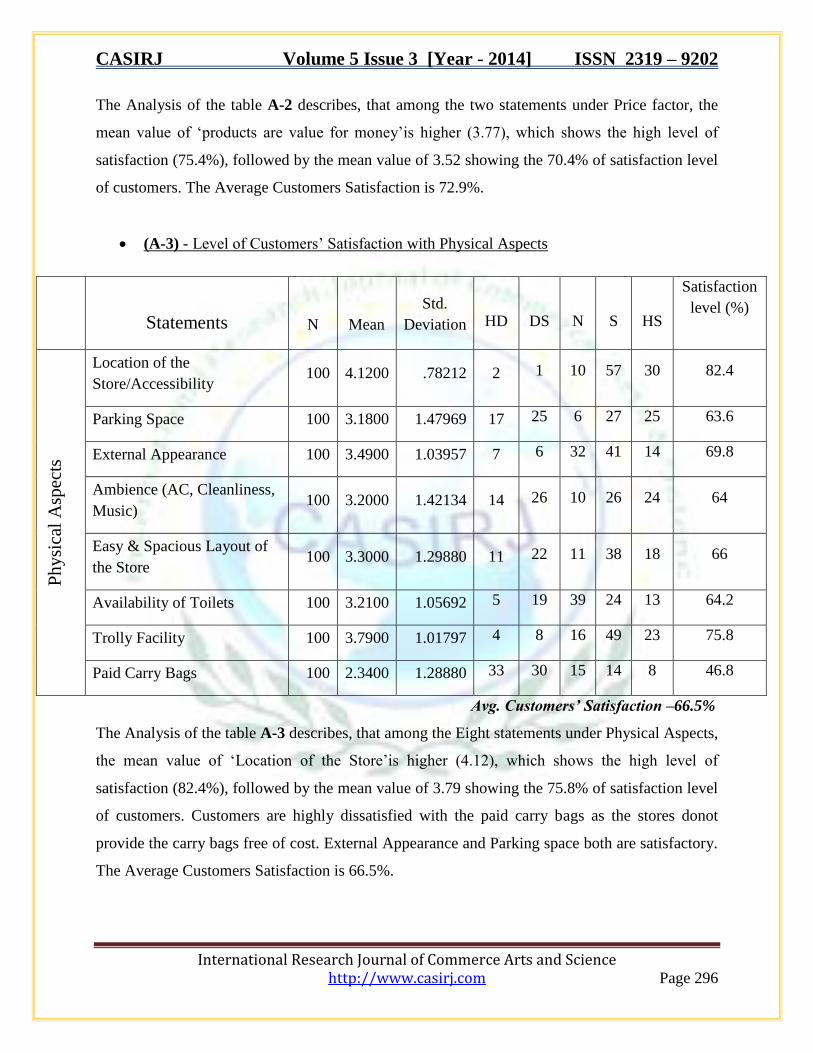
The Analysis of the table A-2 describes, that among the two statements under Price factor, the
mean value of ‘products are value for money’is higher (3.77), which shows the high level of
satisfaction (75.4%), followed by the mean value of 3.52 showing the 70.4% of satisfaction level
of customers. The Average Customers Satisfaction is 72.9%.
(A-3) - Level of Customers’ Satisfaction with Physical Aspects
Statements N Mean
Std.
Deviation
HD
DS
N
S
HS
Satisfaction
level (%)
Ph
ysi
cal
Asp
ects
Location of the
Store/Accessibility 100 4.1200 .78212 2 1 10 57 30 82.4
Parking Space 100 3.1800 1.47969 17 25 6 27 25 63.6
External Appearance 100 3.4900 1.03957 7 6 32 41 14 69.8
Ambience (AC, Cleanliness,
Music) 100 3.2000 1.42134 14 26 10 26 24 64
Easy & Spacious Layout of
the Store 100 3.3000 1.29880 11 22 11 38 18 66
Availability of Toilets 100 3.2100 1.05692 5 19 39 24 13 64.2
Trolly Facility 100 3.7900 1.01797 4 8 16 49 23 75.8
Paid Carry Bags 100 2.3400 1.28880 33 30 15 14 8 46.8
Avg. Customers’ Satisfaction –66.5%
The Analysis of the table A-3 describes, that among the Eight statements under Physical Aspects,
the mean value of ‘Location of the Store’is higher (4.12), which shows the high level of
satisfaction (82.4%), followed by the mean value of 3.79 showing the 75.8% of satisfaction level
of customers. Customers are highly dissatisfied with the paid carry bags as the stores donot
provide the carry bags free of cost. External Appearance and Parking space both are satisfactory.
The Average Customers Satisfaction is 66.5%.
CASIRJ Volume 5 Issue 3 [Year - 2014] ISSN 2319 – 9202
International Research Journal of Commerce Arts and Science http://www.casirj.com Page 297
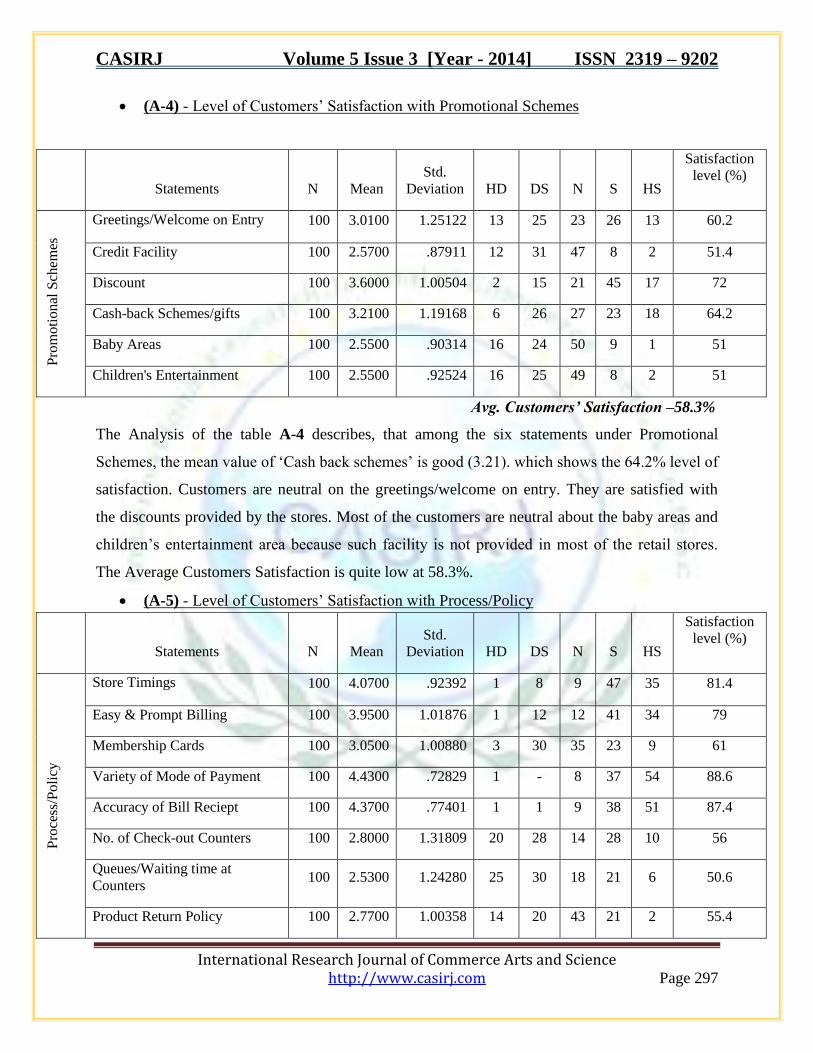
(A-4) - Level of Customers’ Satisfaction with Promotional Schemes
Statements N Mean
Std.
Deviation
HD
DS
N
S
HS
Satisfaction
level (%)
Pro
mo
tio
nal
Sch
emes
Greetings/Welcome on Entry 100 3.0100 1.25122 13 25 23 26 13 60.2
Credit Facility 100 2.5700 .87911 12 31 47 8 2 51.4
Discount 100 3.6000 1.00504 2 15 21 45 17 72
Cash-back Schemes/gifts 100 3.2100 1.19168 6 26 27 23 18 64.2
Baby Areas 100 2.5500 .90314 16 24 50 9 1 51
Children's Entertainment 100 2.5500 .92524 16 25 49 8 2 51
Avg. Customers’ Satisfaction –58.3%
The Analysis of the table A-4 describes, that among the six statements under Promotional
Schemes, the mean value of ‘Cash back schemes’ is good (3.21). which shows the 64.2% level of
satisfaction. Customers are neutral on the greetings/welcome on entry. They are satisfied with
the discounts provided by the stores. Most of the customers are neutral about the baby areas and
children’s entertainment area because such facility is not provided in most of the retail stores.
The Average Customers Satisfaction is quite low at 58.3%.
(A-5) - Level of Customers’ Satisfaction with Process/Policy
Statements N Mean
Std.
Deviation
HD
DS
N
S
HS
Satisfaction
level (%)
Pro
cess
/Po
licy
Store Timings 100 4.0700 .92392 1 8 9 47 35 81.4
Easy & Prompt Billing 100 3.9500 1.01876 1 12 12 41 34 79
Membership Cards 100 3.0500 1.00880 3 30 35 23 9 61
Variety of Mode of Payment 100 4.4300 .72829 1 - 8 37 54 88.6
Accuracy of Bill Reciept 100 4.3700 .77401 1 1 9 38 51 87.4
No. of Check-out Counters 100 2.8000 1.31809 20 28 14 28 10 56
Queues/Waiting time at
Counters 100 2.5300 1.24280 25 30 18 21 6 50.6
Product Return Policy 100 2.7700 1.00358 14 20 43 21 2 55.4
CASIRJ Volume 5 Issue 3 [Year - 2014] ISSN 2319 – 9202
International Research Journal of Commerce Arts and Science http://www.casirj.com Page 298
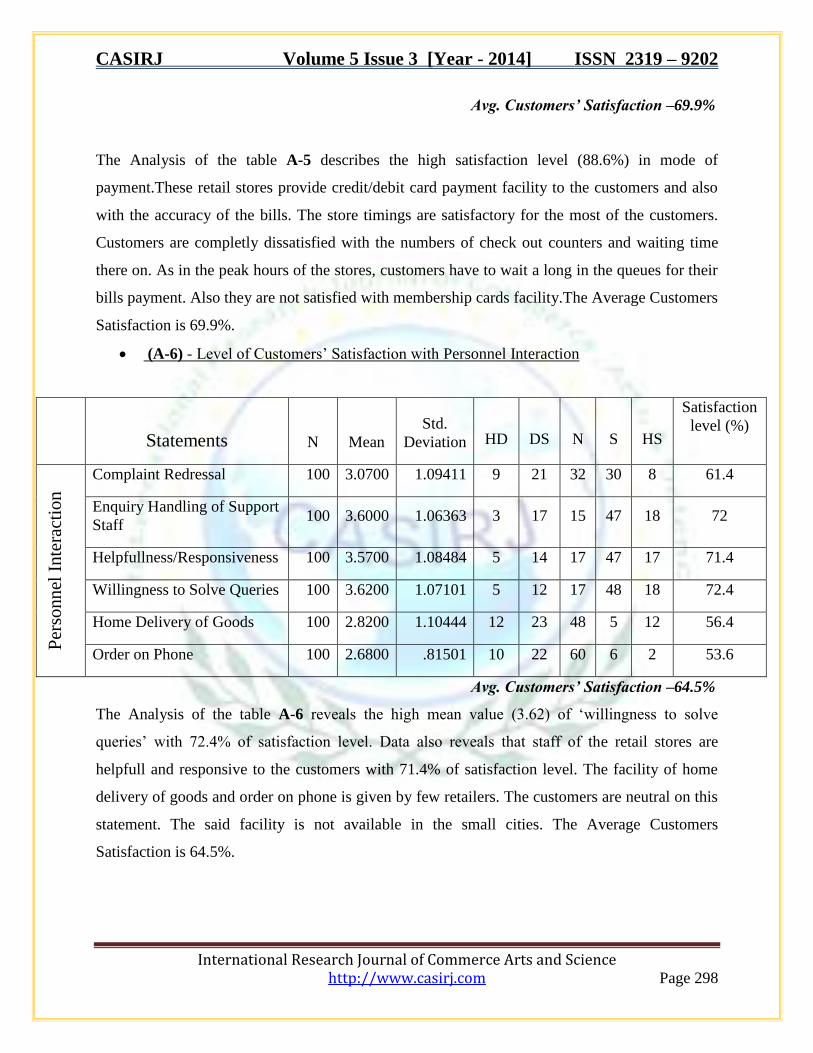
Avg. Customers’ Satisfaction –69.9%
The Analysis of the table A-5 describes the high satisfaction level (88.6%) in mode of
payment.These retail stores provide credit/debit card payment facility to the customers and also
with the accuracy of the bills. The store timings are satisfactory for the most of the customers.
Customers are completly dissatisfied with the numbers of check out counters and waiting time
there on. As in the peak hours of the stores, customers have to wait a long in the queues for their
bills payment. Also they are not satisfied with membership cards facility.The Average Customers
Satisfaction is 69.9%.
(A-6) - Level of Customers’ Satisfaction with Personnel Interaction
Statements N Mean
Std.
Deviation
HD
DS
N
S
HS
Satisfaction
level (%)
Per
sonn
el I
nte
ract
ion
Complaint Redressal 100 3.0700 1.09411 9 21 32 30 8 61.4
Enquiry Handling of Support
Staff 100 3.6000 1.06363 3 17 15 47 18 72
Helpfullness/Responsiveness 100 3.5700 1.08484 5 14 17 47 17 71.4
Willingness to Solve Queries 100 3.6200 1.07101 5 12 17 48 18 72.4
Home Delivery of Goods 100 2.8200 1.10444 12 23 48 5 12 56.4
Order on Phone 100 2.6800 .81501 10 22 60 6 2 53.6
Avg. Customers’ Satisfaction –64.5%
The Analysis of the table A-6 reveals the high mean value (3.62) of ‘willingness to solve
queries’ with 72.4% of satisfaction level. Data also reveals that staff of the retail stores are
helpfull and responsive to the customers with 71.4% of satisfaction level. The facility of home
delivery of goods and order on phone is given by few retailers. The customers are neutral on this
statement. The said facility is not available in the small cities. The Average Customers
Satisfaction is 64.5%.

CASIRJ Volume 5 Issue 3 [Year - 2014] ISSN 2319 – 9202
International Research Journal of Commerce Arts and Science http://www.casirj.com Page 299
Conclusion
According to the results & analysis, it is concluded that customers of organised retail stores are
mostly youngsters, having good education, earn handsome income and lives a nuclear life. Metro
cities of the country attracts huge young manpower thus results in big purchasing from these
organised retail stores. Results shows that Orgainised retailing of our country growing every
year. Various multinationals and big indian retail giants are opening their stores in every city.
The customers satisfaction level related to all six major factors were analysed and revealed that
customers are delighted with the proper display of goods, packaging, variety and quality of
goods. The stores must try to provide non seasonal products as well to the customers. Customers
found the retail stores products value for money and satisfied with the price charged by them. In
metro cities, vehicle parking is the major problem that most of the customers faced. Toilet
facility is poor. The food & grocery retail stores donot provide the free carry bags. As they
charge for the bags, customers were highly dissatisfied with this. The stores have the
membership card facility as well but customers donot find it helpful. As they donot get additional
privileges as compare to other normal customers. The discounts are satisfactory. The stores
should provide the children entertainment/baby areas. Customers are highly satisfied with the
store timings, mode pf payment, accuracy of bills but complains a lot about the numbers of check
out counters. During the peak hours, customers face long queues to make the payments. Stores
must try to open additional checkout counters at peak hours. Product return policy is poor in the
stores, complaint redressal is bit satisfactory. Home delivery and order on phone facility is
provided by few stores but major part of customers were neutral at this point. They like to come
to the stores and shop. They are satisfied with the staff of the stores. The Total Customers’
Satisfaction of Gurgaon City is 67.7%