current biotechnology, mehpara, 2012
TRANSCRIPT

Current Biotechnology, 2012, 1, 217-226 217
2211-551X/12 $58.00+.00 © 2012 Bentham Science Publishers
Protoplast Isolation, Culture and Plant Regeneration in Catharanthus roseus (L.) G. Don via Somatic Embryogenesis
Mehpara Maqsood1, A. Mujib
*,1, Dipti Tonk
1 and M.Z. Abdin
2
1Cellular Differentiation and Molecular Genetics Section, Department of Botany, Hamdard University, New Delhi
110062, India
2Department of Biotechnology, Hamdard University, New Delhi-110062, India
Abstract: An efficient protocol for plant regeneration from protoplasts in Catharanthus roseus is reported. Hypocotyl-
derived embryogenic callus was used as a source of protoplasts. The embryogenic suspension was established in liquid
MS, added with 1.0 mg l-1
NAA and 1.0 mg l-1
BAP; and then suspension was treated with various enzymatic solutions
either alone or in combinations. The cocktail of cellulase (2.0%), pectinase (1.0%), macerozyme (0.02%) and driselase
(0.50%) showed maximum yield of protoplasts (37.25 ± 1.86a X 105) with highest viability (65.25 ± 3.26a). The yield
(8.50 ± 0.42a X 106) and viable protoplasts number (70.18 ± 3.51a) was even more when sorbitol was added with above
enzyme mixtures as osmoticum. In 0.50 mg l-1
NAA +0.50 mg l-1
2, 4-D containing medium, protoplasts divided well and
maximum number of micro colony formation was noticed (13.33 ± 1.53a/Petriplate). The callus biomass (fresh weight)
was, however low in protoplast derived embryogenic callus (PDEC) than in normal embryogenic callus (NEC).
Biochemically, the protein, proline, sugar and enzyme activity level (CAT, SOD, GR and APX) were also higher in PDEC
than in NEC. The protoplast derived somatic embryos latter germinated and regenerated into plantlets. The recovery
period from ‘protoplast to plantlet’ was around 40 weeks in contrast to 16 weeks in normal somatic embryogenesis
pathway.
Keywords: Alkaloids, antioxidative enymes, Catharanthus roseus, embryogenic callus, enzymatic digestion, fluorecein diacetate, hypocotyl, micro-colony, osmoticum, somatic embryogenesis, regeneration, suspension culture, plant growth regulators, protoplast, protoplast isolation.
INTRODUCTION
Catharanthus roseus is an important medicinal plant, belonging to the family Apocynaceae and is a rich source of alkaloids. The plant contains about 130 alkaloids of the indole group. Two of the dimeric alkaloids vinblastine and vincristine, mainly present in the aerial parts of the plant, have found extensive application in the treatment of human neoplasma. Among the monomeric alkaloids ajmalicine (raubacine), present in roots, was confirmed to have a broad application in the treatment of circulatory diseases, especially in the relief of obstruction of normal cerebral blood flow; several other alkaloids demonstrated various pharmaceutical activities, therefore were important [1]. In recent time, cellular and biotechnology-based methods have been attempted [2,3] to improve the yield of these two alkaloids, vincristine and vinblastine as the content is extremely low [4]. Synthetic preparations and semi-synthetic mechanisms using vindoline were also used in a few cases for vinblastine synthesis [5]. In Catharanthus plant tissue culture, various organs, zygotic - and somatic embryos were utilized as potential source for the synthesis of enhanced level of alkaloids [2, 6]. The protoplast technology however, was never utilized in a big way in enriching alkaloids in C. roseus except a few early reports of protoplast isolation
*Address correspondence to this author at the Cellular Differentiation and
Molecular Genetics Section, Department of Botany, Hamdard University,
New Delhi 110062, India; Tel: +91-11-26059683; Fax: +91-11-26059663;
E-mail: [email protected]
and cloning which did not regenerate into plants [7-9]. The protoplast isolation and subsequent fusion has currently been exploited as a single cellular system for investigating ultra-structure, genetics, and physiology of cells with potential in improving biosynthesis of secondary products [10].
The first enzymatic isolation of plant protoplasts was reported by Cocking [11] and the achievement on somatic hybridization was, however reported little later in tobacco [12]. Since then a good number of reports on protoplast isolation and fusion were available in a wide variety of plant genera including model and economic crop plants like tobacco, tomato, potato, rice etc. [13]. In medicinal plants too, protoplast isolation method was established in a number of important genera with or without plant regeneration [14-16]. In recent times, a large populations of protoplasts were isolated from cultured plant cells or tissues like expanded leaves, flower petals, seedling organs such as hypocotyls, cotyledons, roots, dedifferentiated tissues i.e. callus and embryogenic suspensions [17, 18], the later being the most preferred source for protoplast isolation study along with mesophyll cells [19, 20]. The success is, however, primarily depends on tissue condition and the enzymes mixture being used [21]. The individual cell or tissue source sometimes requires special conditions for successful isolation and culturing of protoplasts. In protoplast isolation study, cell suspension usually regenerated into dividing cells at a reasonable frequency [22]. Thus, the embryogenic suspension was used as a valuable source of regenerable protoplasts [23-25]. It was also noted that if plant

218 Current Biotechnology, 2012, Volume 1, No. 3 Maqsood et al.
regeneration was accomplished from cultured cells of suspension, the same regeneration was also often possible from suspension derived protoplasts [26]. Due to recalcitrance and non-regenerative nature however, isolated protoplasts did not always produce plantlets and a protoplast-to-plant regeneration system was absolutely essential for studies like enhancement of alkaloids [14].
The isolated protoplasts were also used in studies like genetic manipulation and in developing genetic diversity by exploiting somatic hybridization [27]. In other experiments, protoplasts were continuously used for up-taking DNA as it routinely generated transgenics in several plant genera [28-30]. Variation in protoplast derived plants, called protoclonal variation, was observed in a range of traits including plant morphology, flower colour, yield, nutritional value, resistance to pathogens, tolerance to environmental conditions and even in production of secondary products [31]. The longer the duration and cultures kept particularly at dedifferentiated callusing stage generally induced more variability in protoplast-derived cells and tissues [32]. The protoplast induced variation was, considered to be important and could be integrated in plant breeding programme as it increased genetic diversity and it bypassed sexual cycle as well [14].
So far, there is no report available on plant regeneration from protoplast-derived callus of this important medicinal plant C. roseus. In this present study, a protoplast isolation method was established and discussed from which plant regeneration had achieved via somatic embryogenesis pathway.
MATERIALS AND METHODS
Plant Material and In Vitro Seed Germination
Catharanthus roseus fruits were collected from herbal garden, Hamdard University, New Delhi. Seeds were isolated and surface-sterilised with 0.5% (w/v) HgCl2 for 2 min and then rinsed four-times with sterilized double-distilled water. Seeds (n=15) were placed in a conical flask containing 50 ml of MS medium [33] without organic compounds and plant growth regulators (PGRs).
Embryogenic Callus Initiation
Various explants (leaf, root, nodal stem and hypocotyl) of in vitro germinated seeds were placed on MS medium supplemented with various PGRs. The requirement of PGR’s concentration/s and other information on establishing culture and post-culture responses were described previously [34] and was followed. Hypocotyl-derived embryogenic calli, induced on 1.0 mg l
-of 2, 4-Dichlorophenoxyaceticacid (2, 4-
D) was used in this present study. All media were adjusted to pH 5.6 by using 0.1(N) NaOH and were sterilised in an autoclave for 15 min at 121
0C. All the reagents were made
using Milli-Q water supplied by a Milli-Q system (Billerica, Massachusetts, USA). Cultures were incubated at 25 ± 2
0C
under a 16-h photoperiod provided by cool-white fluorescent lamps (100 �mol m
-2 s
-1 PFD).
Suspension Culture Establishment
The fine cell suspension cultures were obtained by inoculating 0.5gm friable embryogenic callus into 100 ml
conical flasks containing 50 ml of fresh liquid medium and were used as a source of protoplasts. The cell suspensions were kept on a rotary shaker at 100 rpm under continuous light provided by cool white fluorescent lamps (35 �mol m�2
s�1 PFD) at 25°C.
Protoplast Isolation
In the first set of experiments protoplasts were isolated from embryogenic suspension in which four-day old suspension cultures were used. Suspended cells (0.5 gm fresh weight) was incubated with 10 ml of enzyme solution containing 2.0% (w/v) cellulase (Sigma-Aldrich), 2.0% cellulase and 1.0% (w/v) pectinase (Sigma Aldrich), 2.0% cellulase, 1.0% pectinase, 0.02% (w/v) macerozyme (Sigma Aldrich) and 0.5% (w/v) driselase (Sigma Aldrich). Different concentrations of cellulase (0.4, 0.8, 1.0 and 2.0%), pectinase (0.6, 0.8 and 1.0), macerozyme (0.01, 0.02 and 0.03%) and 0.5% driselase were tested for protoplast isolation.
In the second set of experiments different osmotica (sorbitol, mannitol, glucose and sucrose) in combination with CaCl2.2H20, were used to prevent endosmosis and subsequently filter sterilized with 0.45�m Millipore filters. The mixture was later incubated on a rotator shaker (50 rpm) for different period of time (6, 12 and 18 h) under constant light conditions at 25
0 C for liberating protoplasts. The
viability and yield of protoplasts was recorded to determine the effect of degradation periods. The cell-enzyme mixture was further incubated for 30-60 min. The digested cells were filtered through stainless steel mesh (50�m) under sterile conditions and the filtrate was centrifuged at 100 x g for 10 min. The pellet of protoplasts was washed twice with washing solution (0.6 M sorbitol, 5 Mm CaCl2. 2H2O, pH 5.8) to remove all traces of enzymatic solution. Before second washing, the yield of protoplast was determined by counting the number of protoplasts using haematocytometer. The viability of the protoplasts was assessed by using fluorescein diacetate (FDA) [35]. The plating efficiency (PE) was calculated by using the below formula.
PE = No. of dividing colonies per field
No. of live protoplasts at plating�100
Protoplast Culture
Two protoplast culture methods were used namely, the liquid medium- and alginate bead method. For the liquid medium method, protoplasts in liquid MS medium at the density of 5 � 10
5 protoplasts/ml were poured into a conical
flask containing 25 ml MS liquid medium with various PGRs combinations that resulted into the division of protoplasts. Cell-division frequencies were determined 7 and 14 days after protoplast isolation.
For alginate beads method, 1.0%, 1.5% and 2.5% (w/v) Na-alginate was used. About 1.0 ml of the suspension in Na-alginate was dropped to give approximately 20 beads from a Pasteur pipette into each Petri dish (60 mm � 15 mm). The protoplasts in the beads method were sub -cultured every 2 weeks by replacing the surrounding solid culture medium by the fresh solid MS medium.

Protoplast Culture and Plant Regeneration in C. roseus Current Biotechnology, 2012, Volume 1, No. 3 219
Micro Colony, Callus, Embryo Induction from Cultured Protoplasts
Suspended protoplasts were sub-cultured regularly to develop micro colonies on medium supplemented with appropriate PGR concentrations i.e. 0.25 mg l
-1 NAA, 0.50
mg l-1
NAA, 0.25 mg l-1
2,4-D, 0.50 mg l-1
2,4-D, and combination of 0.25 mg l
-1 NAA+ 0.25 mg l
-1 2,4-D, 0.50
mg l-1
NAA+0.50 mg l-1
2,4-D. For proliferation of somatic embryos, embryogenic calli were placed on MS medium added with optimized concentration of 1.0 mg l
-1 NAA + 1.5
mg l-1
BA in which a heterogeneous mass of embryos were induced. For maturation of embryos, protoplasts- derived embryos were placed in various GA3 (0.12, 0.25 and 0.50 mg l-1
) amended medium. For better growth of regenerated plantlets, medium was added with 0.50 mg l
-1 NAA+0.50 mg
l-1
BA. Each and every embryo-stage was maintained till the end of the study by providing specific PGRs to the nutrient MS medium by regular sub-culturing at an interval of 4 weeks unless mention otherwise.
Fresh Weight/Dry Weight
To determine the absolute fresh- and dry weight, 0.15 g of callus was cultured in MS medium. The fresh weight was taken after regular interval of 2 weeks (4 and 6 weeks) and the dry weight was measured (data not presented) after dried the biomass in hot air oven at 65
oC.
Biochemical Analysis
Estimation of Protein
Protein was estimated by Bradford method [36], 0.5 g tissue was ground in a pre-cooled mortar and pestle with 1.5 ml (0.1 M) phosphate buffer (pH 7.0), placed on ice and centrifuged at 10,000 rpm for 10 min. With 0.5 ml Trichloroacetic acid (TCA), the sample was again centrifuged at 5,000 rpm for 10 min. The supernatant was discarded, and the pellet was washed with chilled acetone and dissolved in 1.0 ml of 0.1N Sodium hydroxide (NaOH). Then 0.5 ml aliquot was added with 5.0 ml of Bradford reagent, the optical density was measured at 595 nm.
Estimation of Proline
For measurement of proline content, 0.1 g of tissue was homogenized in 5.0 ml 3% aqueous sulfosalicylic acid and filtered by Whatman filter paper (No. 1). To 1.0 ml extract, 1.0 ml acid ninhydrin and 1.0 ml of glacial acetic acid were added and the reaction mixture incubated at 60
0C for 1 h.
The reaction mixture was placed on ice and extracted with 2.0 ml toluene. Proline content in the extract was subjected to the spectrophotometric assay of [37].
Estimation of Total Sugar
Estimation of total sugar was made according to Dey [38]. Different tissues (0.5 g) were extracted twice with 90% ethanol, and the extracts were pooled. The final volume of the pooled extract was made up to 25 ml with double distilled water. To an aliquot of 1.0 ml, 1.0 ml 5% phenol and 5.0 ml of concentrated analytical-grade sulphuric acid were added, and cooled in air. The optical density was measured at 485 nm. A solution containing 1.5 ml of 55%
glycerol, 0.5 ml ninhydrin and 4.0 ml double distilled water was used as a calibration standard.
Enzymatic Activity
Fresh plant material was homogenized in 2.0 ml of 0.1 M common extraction buffer (pH 7.5, 0.1 M K-phosphate, 0.5 mM EDTA, 1 mM ascorbic acid)) and centrifuged at 10,000 rpm for 20 min at 4
0C. Supernatant (enzyme extract) was
taken for enzyme analysis. The activity of enzymes was expressed in EU mg
-1 protein min
-1
Catalase (CAT)
The CAT activity was determined by the method of Aebi [39]. The activity in enzyme extract was determined by monitoring the decomposition in H2O2, measuring a decrease in the absorbance at 240 nm of reaction mixture containing 1.0 ml of 0.5M reaction phosphate buffer (Na-phosphates, pH 7.5), 0.1 ml EDTA, 0.2 ml enzyme extract and 0.1 ml H2O2. The reaction was run for 3 minutes. The activity of enzymes was expressed in EU mg
-1 protein min
-1. One unit
of enzyme determines the amount necessary to decompose 1 �mol of H2O2 per min. CAT activity was calculated by using the co-efficient of absorbance 0.036 mM
-1 cm
-1.
Superoxide Dismutase (SOD)
The method of Dhindsa et al. [40] was followed, with slight modifications to estimate SOD activities. Embryos (0.1 g) at different developmental stages were homogenised in 2.0 ml of extraction mixture containing 0.5 M sodium phosphate buffer (pH 7.3), 3.0 mM EDTA, 1.0% (w/v) Polyvinylpyrollidone (PVP), 1.0% (v/v) TritonX100, and centrifuged at 10,000 rpm at 4°C. The SOD activity in the supernatant was assayed by its ability to inhibit the photo-chemical reduction. The assay mixture, consisting of 1.5 ml reaction buffer, 0.2 ml methionine, 0.1 ml of enzyme extract with equal volume of 1.0 M NaCO3 and 2.25 mM Nitro Blue Tetrazolium (NBT) solution, 3.0 mM EDTA, riboflavin, 1.0 ml of Millipore H2O was taken in test tubes and incubated under light for 10 min at 25°C. A 50% reduction in the colour is 1 unit and enzyme activity was expressed in EU mg
-1 protein min
-1.
Ascorbate Peroxidase (APX)
The method developed by Nakana and Asada [41] was used to determine the activity of APX. The reaction mixture contains 1.0 ml of 0.1 M sodium buffer (pH 7.2), 0.1 ml of EDTA and 0.1 ml of enzyme extract. Ascorbate was added and the reaction was run for 3 min at 25
0C. APX activity
was estimated by monitoring the decrease in the absorbance due to the breakdown of APX by ascorbate. APX activity was calculated by using the co-efficient of absorbance 2.81mM
-1 cm
-1. Activity of APX was expressed in EU mg
-1
protein min-1
One unit of enzyme determines the amount necessary to decompose 1 �m of ascorbate per min.
Glutothione Reductase (GR)
The GR activity was determined by the method of Foyer and Halliwel [42]. The enzyme extract was rapidly assayed

220 Current Biotechnology, 2012, Volume 1, No. 3 Maqsood et al.
for the GR activity by taking 0.1 ml of enzyme extract and 1.0 ml of reaction buffer (Tris 0.1M/pH 7.0, to 100 ml of Tris 0.2Mm NADPH and 0.5m M GSSG was added). The reaction was run for 3 min at 25
0C. The GR activity was
calculated by using the co-efficient of absorbance 6.22 mM-1
cm
-1. The GR activity was determined through glutathione-
dependent oxidation of NADPH at 340 nm. Activity of GR was expressed in EU mg
-1 protein min
-1. One unit of enzyme
determines its amount necessary to decompose 1�mol of NADPH per min.
Statistical Analysis
The data on the effects of enzyme mixtures on the protoplast yield and viability with and without osmoticum were analyzed by one-way analysis of variance (ANOVAs) followed by least significant difference (LSD) test. Values
are means of three-five replicates from two experiments with six to nine embryos in each replicate. The presented mean values were separated using LSD at p � 0.05.
RESULTS
Experiment 1: Effect of different enzyme mixtures on the protoplast yield and viability with and without osmoticum
In the first experiment, various enzymes were used either alone or in combinations without any osmoticum. Among the various combinations, the cocktail mixtures of cellulase (2.0%) + pectinase (1.0%) + macerozyme (0.02%) + driselase (0.50%) showed good yield (37.25 ± 1.86a X10
5)
(Fig. 1a) of protoplasts with maximum viability (65.25 ± 3.26a%) (Fig. 1b); the protoplast viability data is presented in Table 1.
Fig. (1). a) Isolated protoplasts in C. roseus; b) protoplasts in the presence of phenosafranine; c) dividing protoplasts in liquid MS medium;
d) formation of micro colonies in MS medium containing 0.50 mg l-1
NAA+0.50 mg l-1
2, 4-D; e) somatic embryos formed in MS medium
containing 1.0 mg l-1
NAA+ 1.0 mg l-1
BAP; f) matured green embryos developed on MS medium containing 1.0 mg l-1
GA3 having shoot
and root axis; g) regenerated plantlet, grown on 0.5 mg l-1
BAP added medium. (Bar 1a-c=200 �m, bar 1d, 1e=2mm and bar 1f, 1g=1 cm).
(a)
(b)�
(c)�
(d)
(e)
(f)
(g)
Protoplast Culture and Plant Regeneration in C. roseus Current Biotechnology, 2012, Volume 1, No. 3 221
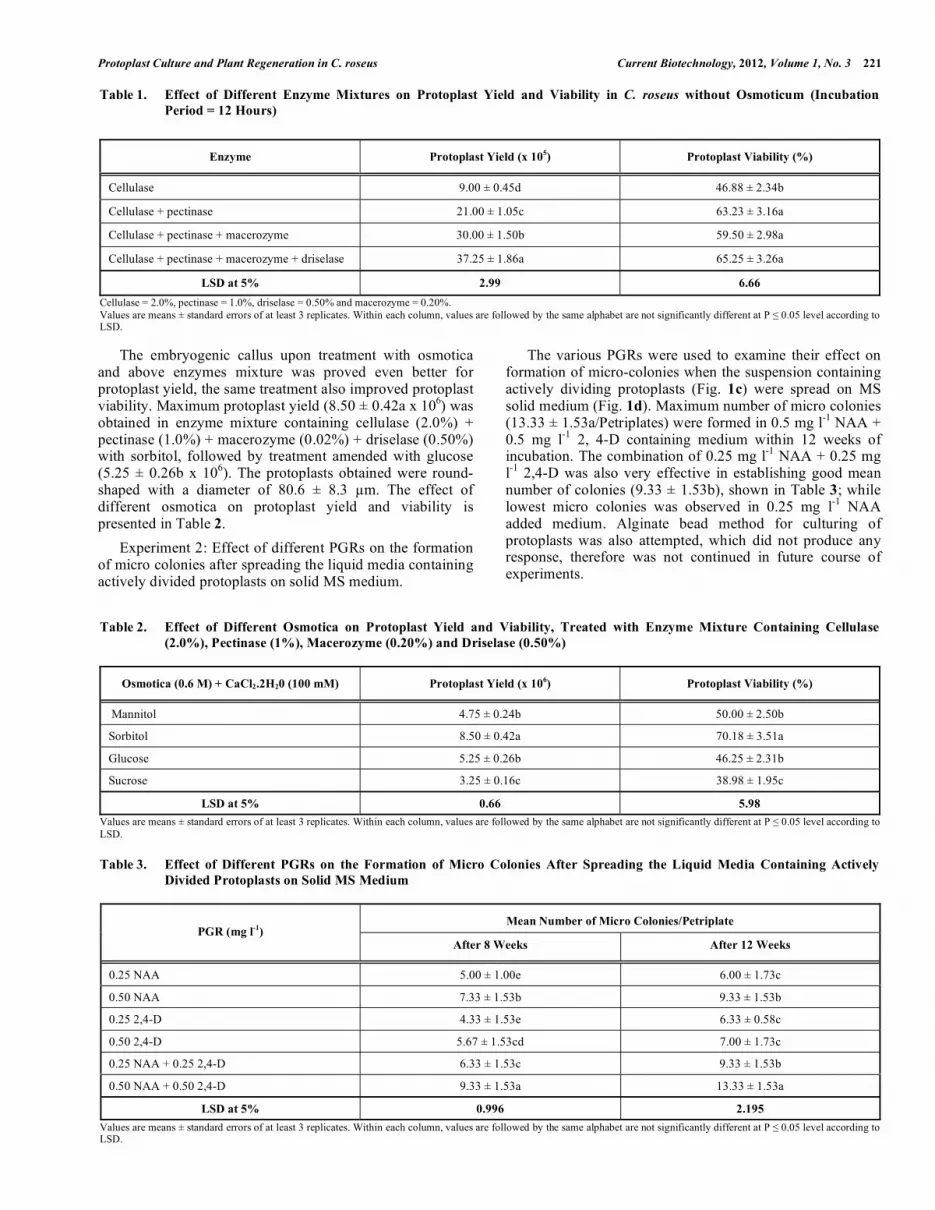
The embryogenic callus upon treatment with osmotica and above enzymes mixture was proved even better for protoplast yield, the same treatment also improved protoplast viability. Maximum protoplast yield (8.50 ± 0.42a x 10
6) was
obtained in enzyme mixture containing cellulase (2.0%) + pectinase (1.0%) + macerozyme (0.02%) + driselase (0.50%) with sorbitol, followed by treatment amended with glucose (5.25 ± 0.26b x 10
6). The protoplasts obtained were round-
shaped with a diameter of 80.6 ± 8.3 �m. The effect of different osmotica on protoplast yield and viability is presented in Table 2.
Experiment 2: Effect of different PGRs on the formation of micro colonies after spreading the liquid media containing actively divided protoplasts on solid MS medium.
The various PGRs were used to examine their effect on formation of micro-colonies when the suspension containing actively dividing protoplasts (Fig. 1c) were spread on MS solid medium (Fig. 1d). Maximum number of micro colonies (13.33 ± 1.53a/Petriplates) were formed in 0.5 mg l
-1 NAA +
0.5 mg l-1
2, 4-D containing medium within 12 weeks of incubation. The combination of 0.25 mg l
-1 NAA + 0.25 mg
l-1
2,4-D was also very effective in establishing good mean number of colonies (9.33 ± 1.53b), shown in Table 3; while lowest micro colonies was observed in 0.25 mg l
-1 NAA
added medium. Alginate bead method for culturing of protoplasts was also attempted, which did not produce any response, therefore was not continued in future course of experiments.
Table 1. Effect of Different Enzyme Mixtures on Protoplast Yield and Viability in C. roseus without Osmoticum (Incubation
Period = 12 Hours)
Enzyme Protoplast Yield (x 105) Protoplast Viability (%)
Cellulase 9.00 ± 0.45d 46.88 ± 2.34b
Cellulase + pectinase 21.00 ± 1.05c 63.23 ± 3.16a
Cellulase + pectinase + macerozyme 30.00 ± 1.50b 59.50 ± 2.98a
Cellulase + pectinase + macerozyme + driselase 37.25 ± 1.86a 65.25 ± 3.26a
LSD at 5% 2.99 6.66
Cellulase = 2.0%, pectinase = 1.0%, driselase = 0.50% and macerozyme = 0.20%.
Values are means ± standard errors of at least 3 replicates. Within each column, values are followed by the same alphabet are not significantly different at P � 0.05 level according to LSD.
Table 2. Effect of Different Osmotica on Protoplast Yield and Viability, Treated with Enzyme Mixture Containing Cellulase
(2.0%), Pectinase (1%), Macerozyme (0.20%) and Driselase (0.50%)
Osmotica (0.6 M) + CaCl2.2H20 (100 mM) Protoplast Yield (x 106) Protoplast Viability (%)
Mannitol 4.75 ± 0.24b 50.00 ± 2.50b
Sorbitol 8.50 ± 0.42a 70.18 ± 3.51a
Glucose 5.25 ± 0.26b 46.25 ± 2.31b
Sucrose 3.25 ± 0.16c 38.98 ± 1.95c
LSD at 5% 0.66 5.98
Values are means ± standard errors of at least 3 replicates. Within each column, values are followed by the same alphabet are not significantly different at P � 0.05 level according to
LSD.
Table 3. Effect of Different PGRs on the Formation of Micro Colonies After Spreading the Liquid Media Containing Actively
Divided Protoplasts on Solid MS Medium
Mean Number of Micro Colonies/Petriplate PGR (mg l
-1)
After 8 Weeks After 12 Weeks
0.25 NAA 5.00 ± 1.00e 6.00 ± 1.73c
0.50 NAA 7.33 ± 1.53b 9.33 ± 1.53b
0.25 2,4-D 4.33 ± 1.53e 6.33 ± 0.58c
0.50 2,4-D 5.67 ± 1.53cd 7.00 ± 1.73c
0.25 NAA + 0.25 2,4-D 6.33 ± 1.53c 9.33 ± 1.53b
0.50 NAA + 0.50 2,4-D 9.33 ± 1.53a 13.33 ± 1.53a
LSD at 5% 0.996 2.195
Values are means ± standard errors of at least 3 replicates. Within each column, values are followed by the same alphabet are not significantly different at P � 0.05 level according to LSD.

222 Current Biotechnology, 2012, Volume 1, No. 3 Maqsood et al.
Experiment 3: Biomass of NEC and PDEC: Callus once produced was sub-cultured regularly (initial callus mass was 0.15 g) and biomass (fresh weight) was measured after 4 and 6 weeks of culture. It was observed that the biomasses of PDEC were relatively low compared with the NEC. At induction stage, NEC biomass was 0.385 ± 0.013 g while PDEC biomass was 0.372 ± 0.012 g after 4 weeks of culture (Fig. 2). The same low biomasses were also observed in PDEC during proliferation (0.974 ± 0.019 g, Fig. 2), maturation (0.436 ± 0.028) and germination (0.301b ± 0.011g) stages of development compared to NEC biomasses. Although, PDEC derived biomasses showed slow growth at early stages, the tissues however, regained normal growth with time as those cultured cells overcame stress gradually, caused by enzyme mixtures and osmoticum treatment.
Experiment 4: Number of somatic embryos formed in NEC and PDEC: PDEC derived micro colonies started to produce somatic embryos within 8 weeks of culture, when cultivated on MS medium. The embryos were produced in masses and were easily separable. A heterogeneous mixture
of embryos were formed (Fig. 1e) on embryogenic calli in which globular and heart-stage embryos were more in number, later torpedo and cotyledonary embryos were gradually developed. The maximum number of embryos (103.33 ± 3.21a/40 mg tissue) was observed in PDEC on medium containing 1.0 mg l
-1 NAA and 1.5 mg l
-1 BA. The
Table 4 summarizes the embryo number in different treatments fortified with NAA and BA.
Experiment 5: Biochemical analyses at different developmental stages: At induction stage, the soluble protein content was more in PDEC (3.41a ± 0.07a mg g
-1 fw) than in
NEC (2.44 ± 0.03c mg g-1
fw). It was also observed that the protein level showed upward trend with the passage of time i.e. after 2, 4 and 6 weeks. During proliferation stage, protein content was again found high in PDEC compared to NEC (Table 5).
Similarly, at induction stage, proline level was high in PDEC (8.46 ± 0.04a mg g
-1 fw) as compared to the NEC
(7.46 ± 0.02c mg g-1
fw). During proliferation stage, proline content was more in PDEC (7.91 ± 0.07a mg g
-1 fw) as
Fig. (2). Biomass of NEC* and PDEC** after 4 and 6 weeks of cultures (initial mass taken=0.15g). At initiation stage, MS was added with
0.50 mg l-1
2,4-D; proliferation medium contained 1.0 mg l-1
NAA+ 1.5 mg l-1
BA; at maturation stage, the MS medium contained 1.0 mg l-1
GA3: germination medium was added with 0.50 mg l-1
BA + 0.50 mg l-1
NAA. *NEC: Normal embryogenic callus; **PDEC: Protoplast
derived embryogenic callus.
Table 4. Number of Somatic Embryos Formed per 40 mg of NEC (Normal Embrygenic Callus) and PDEC (Protoplast Derived
Embryogenic Callus), MS Medium Contained NAA (1.0 mg dm-3
) with Various Concentrations of BAP
BA (mg l-1
) No Somatic Embryos from NEC (Control),
After 8 Weeks Culture
No. of Somatic Embryos from PDEC
After 8 Weeks Culture
0.5 38.75 ± 2.27d 40.00 ± 3.00b
1.0 82.5 ± 3.69b 88.00 ± 4.58a
1.5 99.25 ± 2.27a 103.33 ± 3.21a
LSD at 5% 3.909 7.56
Values are means ± standard errors of at least 3 replicates. Within each column, values are followed by the same alphabet are not significantly different at P � 0.05 level according to LSD.

Protoplast Culture and Plant Regeneration in C. roseus Current Biotechnology, 2012, Volume 1, No. 3 223
compared to NEC (7.25 ± 0.04c mg g-1
fw). As in protein and proline, sugar content was also more in PDEC (32.80 ± 0.36a mg g
-1 fw) compared with NEC (20.50 ± 0.36c mg g
-1
fw) both at induction and in proliferation stage.
Experiment 6: Enzymatic activities in NEC and PDEC at different developmental stages: The enzyme activities of SOD, CAT, APX and GR in NEC and in PDEC were measured as these enzymes play an important role in scavenging growing level of stress, created during protoplast isolation, post-isolation and culturing time. At induction
stage, increased CAT activity was observed in PDEC (4.89 ± 0.04a EU mg
-1 protein min
-1) as compared to NEC (3.82 ±
0.03d EU mg-1
protein min-1
) and the same trend was observed at proliferation stage. APX activity was also enhanced at induction stage in PDEC (0.99 ± 0.05a EU mg
-1
protein min-1
) than in the NEC (0.85 ± 0.04bc EU mg-1
protein min
-1) however, the difference was marginal. The
activity of SOD and GR in PDEC was higher than in the NEC and the level of these enzymes often increased with time (Table 6).
Table 5. Protein, Proline and Sugar Levels at Induction and Proliferation Stages of NEC (Normal Embrygenic Callus) and PDEC
(Protoplast Derived Embryogenic Callus)
NEC (Control) PDEC Developmental
Stage
Parameters
(�g/g) 2 wks 4 wks 6 wks 2 wks 4 wks 6 wks
LSD at 5%
Protein 1.86 ± 0.04e 2.09 ± 0.07d 2.44 ± 0.03c 2.08 ± 0.06d 2.93 ± 0.04b 3.41 ± 0.07a 0.051
Proline 6.07 ± 0.05f 7.34 ± 0.03d 7.46 ± 0.02c 7.16 ± 0.06e 7.96 ± 0.03b 8.46 ± 0.04a 0.029 Induction
Sugar 18.33 ± 0.55e 19.23 ± 0.31d 20.50 ± 0.36c 20.37 ± 0.23c 28.47 ± 0.40b 32.80 ± 0.36a 0.602
Protein 1.60 ± 0.05f 1.95 ± 0.03d 3.5 ± 0.04c 1.88 ± 0.05e 2.37 ± 0.04b 3.07 ± 0.06a 0.054
Proline 5.59 ± 0.04f 7.13 ± 0.02d 7.25 ± 0.04c 6.51 ± 0.03e 7.57 ± 0.03b 7.91 ± 0.07a 0.080 Proliferation
sugar 15.17 ± 0.31f 17.67e ± 0.25 19.47c ± 0.45 18.70 ± 0.20d 25.63 ± 0.31b 30.37 ± 0.35a 0.533
Values are means ± standard errors of at least replicates. Within each column, values are followed by the same alphabet are not significantly different at P= 5% level according to LSD.
Table 6. CAT, SOD, APX and GR Content (EU mg-1
Protein min-1
) at Induction and Proliferation Stages of NEC (Normal
Embrygenic Callus) and PDEC (Protoplast Derived Embryogenic Callus)
NEC (Control) PDEC Developmental Stage Parameters
2 wks 4 wks 6 wks 2 wks 4 wks 6 wks
LSD at 5%
CAT 3.60 ± 0.03f 3.69 ± 0.04e 3.82 ± 0.03d 4.45 ± 0.04c 4.75 ± 0.06b 4.89 ± 0.04a 0.059
SOD 2.92 ± 0.03f 3.04 ± 0.06e 3.14 ± 0.04d 3.20 ± 0.03c 3.91 ± 0.06b 4.31 ± 0.05a 0.038
APX 0.79 ± 0.04c 0.82 ± 0.04c 0.85 ± 0.04bc 0.88 ± 0.04b 0.93 ± 0.05ab 0.99 ± 0.05a 0.082 Induction
GR 0.58 ± 0.03c 0.67 ± 0.03b 0.71 ± 0.04b 0.68 ± 0.03b 0.72 ± 0.04b 0.85 ± 0.04a 0.066
CAT 3.01 ± 0.15d 3.43 ± 0.17c 3.61 ± 0.18c 4.12 ± 0.21b 4.54 ± 0.23a 4.66 ± 0.23a 0.364
SOD 2.36 ± 0.12d 2.89 ± 0.14c 2.99 ± 0.15c 2.84 ± 0.14c 3.42 ± 0.17b 3.91 ± 0.20a 0.289
APX 0.62 ± 0.03b 0.77 ± 0.04a 0.81 ± 0.04a 0.75 ± 0.04a 0.79 ± 0.04a 0.82 ± 0.04a 0.072 Proliferation
GR 0.41 ± 0.02c 0.57 ± 0.03c 0.64 ± 0.03c 0.685 ± 0.34b 0.690 ± 0.34b 0.860 ± 0.43a 0.0470
Values are means ± standard errors of at least 3 replicates. Within each column, values are followed by the same alphabet are not significantly different at P � 0.05 level according to LSD.
Table 7. Effect of Different GA3 Concentrations on the Maturation Frequency of Somatic Embryos Derived from Protoplast
Maturation Frequency (%) GA3 (mg l
-1)
8 Weeks 16 Weeks 32 Weeks
Regeneration Frequency (%)
After 40 Weeks of Culture
0.50 18.33 ± 2.89c 37.67 ± 4.51c 49.33 ± 4.04c 45.00 ± 5.00c
1.0 45.33 ± 6.11b 58.33 ± 3.51b 66.33 ± 6.03b 61.67 ± 1.53b
1.5 64.67 ± 4.51a 75.67 ± 3.51a 84.33 ± 4.04a 78.67 ± 0.58a
LSD at 5% 4.95 1.51 2.62 5.37
Values are means ± standard errors of at least 3 replicates with 10 embryos in each replicate. Within each column, values are followed by the same alphabet are not significantly different at P � 0.05 level according to LSD.

224 Current Biotechnology, 2012, Volume 1, No. 3 Maqsood et al.
Experiment 7: Effect of different GA3 concentrations on embryo maturation derived from protoplast culture: Three concentrations of GA3 were used for somatic embryo maturation that was derived from protoplasts. Embryo maturation (Fig. 1f) and percentage of maturation were observed after 8, 16 and 32 weeks of culture (Table 7). The embryo maturation was very high on 1.5 mg l
-1 GA3
containing medium and with time the frequency of maturation was increased, maximum frequency (84.33 ± 4.04a%) was noted after 32 weeks of incubation. In the same maturation medium, the embryos started to regenerate plants. It took about 40 weeks to obtain a plantlet (Fig. 1g) from protoplast.
DISCUSSION
In the present study, protoplast isolation method and subsequent plant regeneration were established from embryogenic suspension, derived from hypocotyl callus. Hypocotyl derived embryogenic suspension was earlier used for protoplast isolation studies in plants like sugar beet where it offered better source for the regeneration of plants [43] as compared to guard cells-derived protoplasts [28]. In the present study, protoplast isolation was accomplished by using different enzyme mixtures with or without osmoticum, incubated for different time periods. It was earlier reported that a combination of enzymes was very efficient in making protoplasts in oil-palm [44]. The mixture of enzyme in digestion solution was reported to be an important factor on yield and viability of protoplasts in many other studied plant species such as Artemisia judaica L., Echinops spinosissimus Turra etc. [21]. In C. roseus too, the cocktail of different enzymes i.e. cellulase, pectinase, macerozyme, driselase showed higher yield and viability of protoplasts. The various osmotica concentrations, used in enzyme solution significantly affected the yield and viability of the protoplasts as well in our experiment. The osmotic used in protoplast study are sorbitol, mannitol, sucrose, CaCl2.2H20, KCl, etc. In C. roseus, 0.6 M sorbitol with 100 mM CaCl2.2H20 showed good yield of protoplast with improved viability. In Aponogeton madagascariansis, the use of mannitol, glucose and sucrose separately in protoplast buffer and enzyme mixture produced a poor number of protoplasts when compared with sorbitol used conditions [45]. Sorbitol as a carbohydrate seemed to provide the most suitable osmotic pressure in culture and allowed the cells to remain intact [46] while mannitol level was effective in generating maximum yield of protoplasts in plants like poplar [47], Rorippa [48], Betula [49], and in Ipomoea [50]. After protoplast isolation, the culture was cultivated in medium amended with different PGRs. In our study, culture medium amended with different PGR combinations showed diverse response; 0.5 mg l
-1 NAA+0.5 mg l
-1 2, 4-D was observed to
be the best treatment in which maximum number of micro-colonies were formed, followed by 0.25 mg l
-1 NAA + 0.25
mg l-1
2, 4-D. Dietert et al. [51] also reported that a low concentration of 2, 4-D improved callus growth in protoplast culture of genus Brassica. Better cell division and callus proliferation were noted in high 2, 4-D added medium in some other reports [52]. In saffron, it was noted that different auxin-cytokinin combinations exerted a key influence on regeneration of plantlets [53]. Ebrahemzadeh and Karamian [54] reported that the treatment of NAA-BA was more
effective on regeneration of germinated embryos when a variety of PGRs combinations were studied and compared. The same auxin-cytokinin combinations promoted plant regeneration from protoplast-derived calli in several plant systems [15]. In C. roseus, the combination of NAA and BA had no major influence at initial stage of growth of micro colonies; however, both improved responses at proliferation stage. A low level of PGR use in medium lowered the cost and helped to reduce the accumulation of 2, 4-D or other PGRs in culture during protoplast isolation and post-culturing time; in some cases the gradual accumulation of 2, 4-D exhibited a negative effect on somatic embryo formation and regeneration [55]. In our study, after culturing the protoplasts on optimum medium composition, the micro-callus and callus were formed, which slowly overcame the stress, imposed by wall degrading enzymes and regained normal growth as evidenced with gradual increase of biomass.
As digestion of cells with enzyme mixture and osmotica created a cellular stress, we investigated various biochemical attributes and different antioxidant enzyme (CAT, SOD, APX and GR) activities in protoplast raised tissues and compared with normal tissues developed in vitro. The protein content was observed to be high in PDEC than in NEC; and this protein level also increased with time. Similar response i.e., enhanced level of protein was noticed in NaCl-stress callus cultures in rice [56]. Sugar content was also high in enzyme treated callus than in the normal callus; however, the content gradually decreased towards proliferation stage. In TN5-M6 rice, soluble sugar content was high during callus induction stage, this enhanced level was reported to be developed by the over-uptake of sugar from the medium [57]. In a majority of plants, salt stress altered gene expression with increased synthesis of osmo-protectors and osmo-regulators [58]. In other plants, there was an increased accumulation of amino acids and amines such as proline and B-alanine in their tissues in response to salt stress [59]. In our investigation, increased protein content was noted in PDEC than in NEC and the level gradually increased with time. The enzyme CAT, which catalyzes the disproportionation of hydrogen peroxide to dioxygen and water, is found in all aerobic microorganisms, plant and animal cells. It was reported that the CAT activity was activated in S. pombe cells that were exposed to hydrogen peroxide and the activity was regulated at the mRNA level [60]. In C. roseus, we found increased activity of CAT in PDEC than in the NEC. The increased activities of antioxidant enzymes upon salt stress were often related to the enhanced protection, given to cells in order to tolerate adverse stress situation [61]. In barley root, increase of APX activity was relatively low compared with that of SOD and CAT under NaCl-treatment [62]. In our experiment, we also found increased activity of APX in PDEC than in the NEC but was low compared with SOD and CAT. The SOD activity was also high in PDEC than in the NEC. The increased enzyme activity in stress tissues including in C. roseus is primarily due to exposure of plant cells in digestion mixtures containing various enzymes and salts. The GR activity was lowest among the studied enzymes like CAT, SOD and APX but the activity was higher in PDEC when compared to NEC. Yung and Don [63] earlier observed about 8 times high enzyme activity in cells than in the stress-

Protoplast Culture and Plant Regeneration in C. roseus Current Biotechnology, 2012, Volume 1, No. 3 225
free protoplasts. In summary, the significant increase in SOD, CAT, APX and GR activities was due to reactive oxygen species (ROS) formed after the plant cells were treated with enzymes and salts. This is the first protoplast isolation study in C. roseus embryogenic cell lines from which plant regeneration was achieved. The result provides a realistic basis for future work on production of somatic hybrids through fusion, and in generating and screening of protoclones with high alkaloid productivity.
The protoplast research has several applications in diverse areas of research like in genetic manipulation through fusion and in up-taking DNA. The protoplast technology is also able to overcome the limitations of hybridization owing to sexual incompatibility. It also offers as important source to engineer new cells by altering secondary metabolism in synthesizing enriched level of active compounds (vinblastine and vincristine) in C. roseus. The same technique may be used extensively in fungi and other lower groups of organisms to produce hybrid-organisms with altered secondary metabolite levels.
ACKNOWLEDGEMENT
Authors (MM and AM) are highly thankful to University Grant Commission (UGC) and the Department of Botany, Hamdard University (Jamia Hamdard), New Delhi, for financial grant and other provided facilities. We wish to thank anonymous reviewers for their constructive comments on manuscript.
CONFLICT OF INTEREST
We have no Conflict of Interest.
ABBREVIATIONS
2, 4-D = 2, 4-Dichlorophenoxyacetic acid
APX = Ascorbate peroxidase
BA = 6-Benzyladenine
CAT = Catalase
FDA = Fluorecein diacetate
GA3 = Gibberellic acid
GR = Glutothione reductase
GSSG = Oxidised Glutothione
MS = Murashige and Skoog
NAA = �-Naphthalene acetic acid
NADPH = Nicotiniamide adeninediphosphate
NEC = Normal embryogenic callus
PDEC = Protoplast derived embryogenic callus
PFD = Photon flux density
PGR = Plant growth regulator
SOD = Superoxide dismutase
REFERENCES
[1] Mukherjee AK, Basu S, Sarkar N, et al. Advances in cancer
therapy with plant based natural products. Curr Med Chem 2001; 8: 1467-86.
[2] Favretto D, Piovan A, Filippini R. Monitoring the production yields of vincristine and vinblastine in Catharanthus roseus from somatic
embryogenesis. Semiquantitative determination by flow-injection electrospray ionization mass spectrometry. Rapid Commun Mass
Spectrom 2001; 15: 364-9. [3] Van der Heijden R, Jacobs DT, Snoeijer W, et al. The catharanthus
alkaloids: pharamacognosy and biochemistry. Curr Med Chem 2004; 11: 607-28.
[4] La flamme P, St Pierre B, De Luca V. Molecular and biochemical analysis of a Madagascar periwinkle root specific minovincinine-
19-hydroxy-O-acetyltransferase. Plant Physiol 2001; 125: 189-98. [5] Kuboyama T, Yokoshima S, Tokuyama H, et al. Stereo controlled
total synthesis of (+) vincristine. Proc Natl Acad Sci USA 2004; 101: 11966-70.
[6] Aslam J, Mujib A, Zohra F, et al. Variations in vinblastine production at different stages of somatic embryogenesis, embryo
and field grown plantlets of Catharanthus roseus L. (G) Don, as revealed by HPLC. In Vitro. Cell Dev Biol Plant 2010; 46: 348-53.
[7] Bapat VA, Sipahimalani AT, Rao PS, et al. Growth and alkaloid synthesis in cell lines of Catharanthus rosues obtained through
immobilization of cells and protoplasts. Proc Ind Acad Sci (Plant Sci) 1990; 100: 211-4.
[8] Perronnet C, Chénieux JC, Rideau M. Protoplast fusion of Catharanthus roseus cells by electrofusion of chemically-
agglutinated protoplasts. Biol Plant 1994; 36: 1-8. [9] Tremouillaux GJ, Kodja H, Chenieux JC. Single-cell cloning of a
crown gall from protoplasts regenerated in hormone-free medium. Establishment of pure transformed cell-lines of Catharanthus
roseus. Plant Cell Tissue Organ Cult 1994; 37: 25-30. [10] Kantharajah AS, Golegaonkar PJ. Somatic embryogenesis in egg
plant. Sci Hortic 2004; 99: 107-17. [11] Cocking EC. Enzymatic degradation of cell wall for protoplast
formation. Nature 1960 187: 927-9. [12] Carlson PS. The use of protoplasts in genetic research. Proc Natl
Acad Sci USA 1973; 70: 598-602. [13] Davey MR, Anthony P, Power JB, et al. Plant protoplast
technology: Current status. Acta Physiol Plant 2005; 27: 117-29. [14] Borgato L, Pisani F, Furini A. Plant regeneration from leaf
protoplasts of Solanum virginianum L. (Solanaceae). Plant Cell Tissue Org Cult 2007; 88: 247-52.
[15] Fiuk A, Rajkiewicz M, Rybczynski JJ. In vitro culture of Gentiana kurroo (Royle). Biotech 2003; 3: 267-74.
[16] Thomas TD. Isolation, callus formation and plantlet regeneration from mesophyll protoplasts of Tylophora indica (Burm. f.) Merrill:
an important medicinal plant. In Vitro Cell Dev Biol- Plant 2009; 45: 591-8.
[17] Kim SW, Seung CO, Dong SI, et al. Plant regeneration of rose (Rosa hybridia) from embryogenic cell-derived protoplasts. Plant
Cell Tissue Org Cult 2003; 73: 15-9. [18] Yang X, Guo X, Zhang X, et al. Plant regeneration from
Gossypium davidsonii protoplasts via somatic embryogenesis. Biol Plant 2007; 51: 533-7.
[19] Assani A, Haicour R, Wenzel G, et al. Influence of donor material and genotype on protoplast regeneration in banana and plantain
cultivars (Musa spp.). Plant Sci 2002; 162: 355-62 [20] Guo JM, Liu QC, Zhai H, et al. Regeneration of plants from
Ipomoea cairica L. protoplasts and production of somatic hybrids between I. cairica L. and sweetpotato, I. batatas (L.) Lam. Plant
Cell Tissue Org Cult 2006; 87: 321-7. [21] Pan ZG, Liu CZ, Murch SJ, et al. Plant regeneration from
mesophyll protoplasts of the Egyptian medicinal plants Artmesia judaica L. and Echinops spinosissimus Turra. Plant Sci 2003; 165:
681-7. [22] Shrestha BR, Tokuhara K, Mii M. Plant regeneration from cell
suspension-derived protoplasts of Phalaenopsis. Plant Cell Rep 2007; 26: 719-25.
[23] Chang YF, Wong JR. Regeneration of plants from protoplasts of Triticum aestivum L.(Wheat) In: Bajaj YPS, Ed. Plant protoplasts
and genetic engineering. Berlin: Springer 1994; vol. 29: pp. 161-71.

226 Current Biotechnology, 2012, Volume 1, No. 3 Maqsood et al.
[24] Jimenez V.M. El Cltivo de protoplatos en citricos y su potencial
para el mejoramieento genetic. Agron Costarric 1996; 20: 187-204. [25] Mahanom J, Norzulaani K, Rofina YO. Plant regeneration from
embryogenic suspension cultures of Musa acuminata cv. Mas (AA). Plant Cell Tissue Org Cult 2003; 75: 209-14.
[26] Tan ML, Boerrigter HS, Kool AJ. A rapid procedure for plant regeneration from protoplasts isolated from suspension cultures and
leaf mesophyll cells of wild Solanum species and Lycopersicon pennellii. Plant Sci 1987; 49: 63-72.
[27] Fayez KA, Hassanein AM. Chlorophyll synthesis retardation and ultra structural alterations to Solanum tuberosum chloroplasts in
Solanum nigrum cells. Photosynthetica 2000; 38: 37-44. [28] Hall RD, Riksen BT, Weyens GJ, et al. A high efficiency technique
for the generation of transgenic sugar beets from stomatal guard cells. Nat Biotechnol 1996; 14: 1133-8.
[29] Li CZ, Murch SJ, Demerdash MEL, et al. Regeneration of the Egyptian medicinal plant Artemisia judaica L. Plant Cell Rep 2002;
21: 525-30. [30] Liu F, Ryschka U, Marthe F, et al. Culture and fusion of pollen
protoplasts of Brassica oleracea L. var. italica with haploid mesophyll protoplasts of B. rapa L. ssp. Pekinensis. Protoplasma
2007; 231: 89-7. [31] Mizuhiro M, Kenichi Y, Ito K, et al. Plant regeneration from cell
suspension-derived protoplasts of Primula malacoides and Pimula obconica. Plant Sci 2001; 160: 1221-8.
[32] Hao YJ, Deng XX. Single-cell-derived sibling lines established as an experimental system to assess chromosome number variations in
embryogenic callus cultures of sweet orange. Plant Cell Tissue Org Cult 2003; 73: 275-80.
[33] Murashige T, Skoog F. A revised medium for rapid growth and bioassay with tobacco tissue cultures. Physiol Plant 1962; 15: 473-
97. [34] Junaid A, Bhat MA, Mujib A, et al. Somatic embryo proliferation,
maturation and germination in Catharanthus roseus. Plant Cell Tissue Org Cult 2006; 84: 325-32.
[35] Widholm JM. The use of fluorescein diacetate and phenosafranine for determining viability of cultured plant cells. Stain Technol
1972; 47: 189-94. [36] Bradford MM. A rapid and sensitive method for measuring
quantities of protein utilizing the principle of protein dye binding. Ann Biochem 1976; 72: 248-53.
[37] Bates LS, Waldren RP, Teare ID. Rapid determination of free proline for water stress studies. Plant Soil 1973; 39: 205-7.
[38] Dey PM. Methods in plant biochemistry, Carbohydrates. London: Academic Press 1990; vol. 2.
[39] Aebi H. Catalase in vitro. Methods Enzymol 1984; 105:121-6. [40] Dhindsa RH, Plumb DP, Thorpe TA. Leaf senescence correlated
with increased level of membrane permeability, lipid peroxidation and decreased level of SOD and CAT. J Exp Bot 1981: 32: 93-101.
[41] Nakano Y, Asada K. Hydrogen peroxide is scavenged by ascorbate-specific peroxidase in spinach chloroplasts. Plant Cell
Physiol 1981; 22: 867-80. [42] Foyer CH, Halliwell B. The presence of glutathione and
glutathione reductase in chloroplasts: a proposed role in ascorbic acid metabolism. Planta 1976; 133: 21-5.
[43] Dovzhenko A, Koop HU. Sugar beet (Beta vulgaris L.): Shoot regeneration from callus and callus protoplasts. Planta 2001; 217:
374-81.
[44] Te-Chato S, Hilae A, Moosikapala L. Microcolony formation from
embryogenic callus-derived protoplasts of oil palm. Songklana-karin J Sci Technol 2005 27: 685-91.
[45] Christina ENL, Arunika H. Isolation of leaf protoplasts from the submerged aquatic monocot Aponogeton madagascariansis. Am J
Plant Sci Biotechnol 2010; 4: 6-11. [46] Pongchawee K, Na- Nakorn U, Laamseejan S, et al. Protoplast
isolation and culture of aquatic plant Cryptocoryne wendtii De Wit. Kasetsart J Nat Sci 2007; 41: 300-10.
[47] Park YG, Son SH. In vitro shoot regeneration from leaf mesophyll protoplasts of hybrid poplar (Populus nigra x P. maximowiczil).
Plant Cell Rep 1992; 11: 2-6. [48] Mandal P, Sikdar SR. Plant regeneration from mesophyll
protoplasts of Rorippa indica (L.) Hiern, a wild crucifer. Curr Sci 2003; 85: 1451-4.
[49] Wakita Y, Yokota S, Yoshizawa N, et al. Interfamilial cell fusion among leaf protoplasts of Populus alba, Betula platyphylla and
Alnus firma: assessment of electric treatment and in vitro culture conditions. Plant Cell Tissue Org Cult 2005; 83: 319-26.
[50] Guo Y, Bai J, Zhang Z. Plant regeneration from embryogenic suspension-derived protoplasts of ginger (Zingiber officinale
Rosc.). Plant Cell Tissue Org Cult 2007; 89: 151-7. [51] Dietert MF, Barron SA, Yoder OC. Effects of genotype on in vitro
culture in the genus Brassica. Plant Sci Lett 1982; 26: 233-40. [52] Kohlenbach HW, Wenzel G, Hoffmann F. Regeneration of
Brassica napus plantlets in cultures from isolated protoplasts of haploid stem embryos as compared with leaf protoplasts.
Zeitschrift. Pflanzen. Physiol 1982; 105: 131-42. [53] Babak C, Reza Z, Cyrus AM, et al. Effects of different hormonal
treatments on the callus production and plantlet regeneration in saffron (Crocus sativus L.). Pak J Biol Sci 2007; 10:1625-31.
[54] Ebrahimzadeh H, Karamian R. Plantlet regeneration from protoplast-derived embryogenic calli of Crocus cancellatus. Plant
Cell Tissue Org Cult 2001; 65:115-21. [55] Negrutiu I, Jacobs M, Gaspar T. Leaf formation and peroxidases
from Arabidopsis callus. Z Pflanzenphysiol 1979; 91: 119-26. [56] Priya AM, Karutha SP, Ramesh M. Effect of NaCl on in vitro plant
regeneration from embryogenic callus cultures of 'cv IR 64' indica rice (Oryza sativa L.). Afr J Biotechnol 2011; 10: 6947-53.
[57] Wen-Lii H, Li-Fei L. Carbohydrate metabolism in rice during callus induction and shoot regeneration induced by osmotic stress.
Bot Bull Acad Sin 2002; 43: 107-13. [58] Demiral T, Turkan I. Exogenous glycine betaine affects growth and
proline accumulation and retards senescence in two rice cultivars under NaCl stress. Environ Exp Bot 2006; 56: 72-9.
[59] Gobinathan P, Murali PV, Panneerselvam R. Interactive effects of calcium chloride on salinity-induced proline metabolism in
Pennisetum typoidie. Adv Biol Res 2009; 3: 168-73. [60] Mutoh N, Nakagawa CW, Hayashi Y. Adaptive response of
Schizosaccharomyces pombe to hydrogen peroxide. FEMS Microbiol Lett 1995; 132: 67-72.
[61] Mittova V, Guy M, Tal M, et al. Salinity upregulates the antioxidative system in root mitochondria and peroxisomes of the
wild salt-tolerant tomato species Lycopersicon pennellii. J Exp Bot 2004; 55: 1105-13.
[62] Sang YK, Jung HL, Myoung RP, et al. Enhanced antioxidant enzymes are associated with reduced hydrogen peroxide in barley
roots under saline stress. J Biochem Mol Biol 2005; 38: 218-24. [63] Yung KH, Don HN. Some enzymes present in the walls of
mesophyll cells of tobacco leaves. Biochem J 1975; 151: 141-4.
Received: March 8, 2012 Revised: April 24, 2012 Accepted: April 30, 2012