crystallization kinetics of poly(ethylene terephthalate) with thermotropic liquid crystalline...
TRANSCRIPT
Crystallization Kinetics of Poly(ethylene terephthalate) withThermotropic Liquid Crystalline Polymer Blends
SEONG HUN KIM,1 SANG WOOK PARK,2 EUN SEOK GIL1
1 Department of Textile Engineering, College of Engineering, Hanyang University, Seoul 133-791, Korea
2 Technical Research Center, Dongbu Chemical, Co., Ulsan 680-110, Korea
Received 17 February 1997; accepted 16 June 1997
ABSTRACT: The isothermal and dynamic crystallization behaviors of polyethylene tere-phthalate (PET) blended with three types of liquid crystal polymers, i.e., PHB60–PET40, HBA73–HNA27, [(PHB60–PET40) – (HBA73–HNA27) 50 : 50], have beenstudied using differential scanning calorimetry (DSC). The kinetics were calculatedusing the slope of the crystallization versus time plot, the time for 50% reduced crys-tallinity, the time to attain maximum rate of crystallization, and the Avrami equation.All the liquid crystalline polymer reinforcements with 10 wt % added accelerated therate of crystallization of PET; however, the order of the acceleration effect among theliquid crystalline polymers could not be defined from the isothermal crystallizationkinetics. The order of the effect for liquid crystalline polymer on the crystallization ofPET is as follows: (PHB60–PET40) – (HBA73–HNA27) (50 : 50); HBA73–HNA27;PHB60–PET40: This order forms the dynamic scan of the DSC measurements. q 1998John Wiley & Sons, Inc. J Appl Polym Sci 67: 1383–1392, 1998
Key words: liquid crystal polymer; crystallization kinetics; poly(ethylene tere-phthalate; isothermal scan of differential scanning calorimetry (DSC); dynamic scanof DSC
INTRODUCTION tropic LCP blends. The effect of TLCP on the ki-netics and thermodynamics of polymer crystalli-zation has been also researched to define thatPoly(ethylene terephthalate) (PET) has variousTLCP can accelerate the rate of crystallization.5,6applications, such as in films, bottles, and fibers;TLCPs are able to improve the mechanical prop-recently, the focus is on the high strength polymererty of thermoplastics as reinforcement. However,molecular composite to pursue stronger materi-if they cause a reduction of crystallization rate,als. For a reinforced PET composite, choppedthe cycle time of manufacturing the products isglass fiber is widely used, but it makes processingincreased and, therefore, the productivity is de-difficulty because of increasing melt viscosity andcreased.decreasing rate of crystallization.1
In recent articles, it is reported that an inclu-Thermotropic liquid crystalline polymers (TLCPs)sion of a second TLCP in an incompatible TLCP–can provide not only improved mechanical proper-thermoplastic blend not only leads potentially toties to the thermoplastic matrix polymer by thea ternary blend system with improved adhesionformation of fibril in situ but also improve thedue to physical or chemical compatibilization butprocessability of the polymer.2–4
also provides the advantage of enhanced process-There are many recent articles on the thermo-ability.7
The crystallization kinetic of PET has been in-Correspondence to: S. H. Kim.vestigated using differential scanning calorimetryJournal of Applied Polymer Science, Vol. 67, 1383–1392 (1998)
q 1998 John Wiley & Sons, Inc. CCC 0021-8995/98/081383-10 (DSC) measurement and polarized microscopy,
1383
8E07 4690/ 8E07$$4690 01-15-98 09:05:34 polaal W: Poly Applied
1384 KIM, PARK, AND GIL
and the crystallization study of the blend of TLCP HNA27, were blended at first in the proportionof 50 wt % each at 3257C. This TLCP/TLCP bi-with PET has been reported. Ou and Lin8 and
Pratt and Hobbs9 reported the effect of PET–PHB nary blend was extruded in Brabender and thenpalletized after passing the water bath. The ter-copolyesters, which are flexible copolyesters com-
posed of 40 mol % of PET molecular structure and nary blend was then prepared by blending theratio of 10 wt % of the binary (PHB60–PET40) –show compatibility with PET, especially with the
crystallization and thermal behavior of PET. (HBA73–HNA27) blend in PET. All the PET–TLCP blends were extruded in Brabender andThe objective of this research is to investigate
the effect of the hydroxy benzoic acid–hydroxy palletized. These pellets were dried at 1107C invacuo for at least 24 h and extruded throughnaphthoic acid copolyester, which is a wholly aro-
matic TLCP and has a poor compatibility with Mini Max disc extruder for the thermal propertymeasurements. All the samples for differentialPET, which is a semiaromatic TLCP and has a
good compatibility with PET, and the effect of scanning calorimetry (DSC) measurementswere prepared from same radius extrudates inPET–PHB copolyester on the crystallization ki-
netics and thermal behaviors of PET. Further- order to achieve even thermal history.more, in the ternary system, which is devised forimproving the adhesivity between the PET andHBA–HNA copolyester, by using the PHB–PET DSC Measurementcopolyester as a polymer coupling agent in ourresearch group, the effect of our TLCP–TLCP The weight of all samples was kept in approxi-blend on the crystallization kinetics and thermal mately 10 mg in DSC measurement by using Per-property of PET is also studied.10
kin–Elmer DSC-7. The DSC was calibrated byusing 10 mg of indium. The melting temperatureof indium is 156.47C, and the indium has an en-
EXPERIMENTAL thalpy of fusion of 288.40 J/g (6.79 cal/g) .The heating and cooling scans were obtained
by the following procedure. The samples wereMaterialsheated up to 3007C at the rate of 107C/min under
The PET used in this experiment was provided nitrogen, and the melting thermograms were re-by Sun Kyung Industry Co. in Korea. The wholly corded. At 3007C, all the samples were held for 5aromatic TLCP was obtained from Hoechst Cel- min before crystallization in order to remove theanese, and the semiaromatic TLCP was pur- previous thermal history. The crystallizationchased from Unitika Ltd. The wholly aromatic thermograms were obtained by cooling the sampleTLCP is based on p -hydroxy benzoic acid (73 mol at the rate of 107C/min until 207C.%) and 6-hydroxy-2-naphthoic acid (27 mol %) The kinetics of isothermal crystallization wasand is denoted in this article as HBA73–HNA27. measured by heating each sample to 3007C at theThe semi-aromatic TLCP is based on p -hydroxy rate of 107C/min, holding these for 5 min in orderbenzoic acid (60 mol %) and ethylene terephthal- to remove anisotropy; then the cooling scan wasate (40 mol %), and it is abbreviated as PHB60– performed at the rate of 2007C/min to the isother-PET40. mal crystallization temperature (Tc ) . The corre-
sponding crystallization exotherms scanned as afunction of time until no change was observed.Preparation of Blends
All the materials were dried at 1107C in vacuofor at least 24 h before used. The blends werecarried out by using Brabender Plasti-Corder THEORETICAL CONSIDERATIONwith twin screw at the screw speed of 40 rpmand prepared in the composition of 10 wt % ofTLCP in PET. PET and PHB60–PET40 were In the isothermal DSC operation, the heat evolved
during crystallization yields exothermic peaks,compounded at 2807C. The PET and HBA73–HNA27 binary blend and PET with HBA73– which could assist in interpreting the plot of the
rate of heat evaluation, dH /dt , versus time.HNA27 and PHB60–PET40 ternary blend wereprepared at 2957C. The ternary blend was pre- The kinetic data of PET crystallization is based
on the Avrami analysis. The following expressionpared through a two-step melt blending pro-cess. Two TLCPs, PHB60–PET40 and HBA73– is used to measure the extent of crystallization.10
8E07 4690/ 8E07$$4690 01-15-98 09:05:34 polaal W: Poly Applied
CRYSTALLIZATION OF PET AND TLCP BLENDS 1385
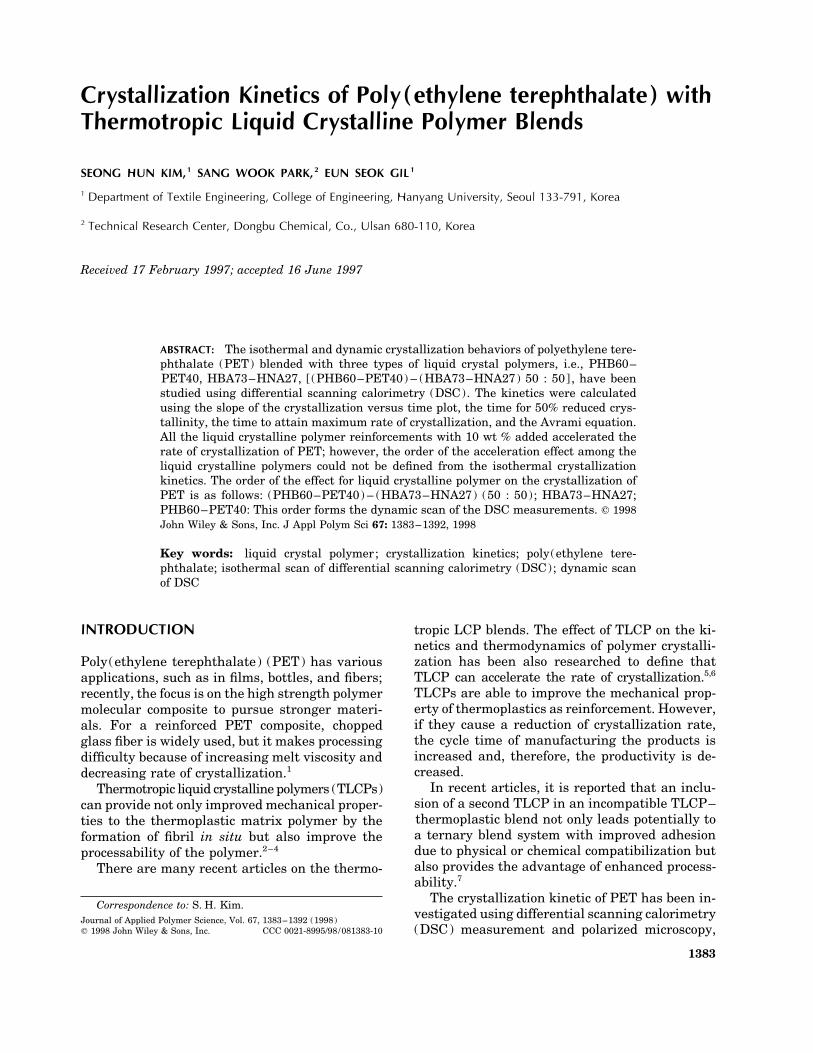
Figure 1 Reduced crystallinity of PET as a function of time.
carried out using the following Avrami equa-tion10–12:
X (t ) Å*
t
0
dHdt
dt
*`
0
dHdt
dt(1)
X (t ) Å 1 0 exp(0ktn ) (3a)
where k is the rate coefficient; and n is the AvramiEquating the integrals to areas of the isother- exponent, which is a constant that depends on
mal DSC curves, eq. (1) can be shaped into both nucleation and growth of the crystals. Tak-ing logarithms, eq. (3a) can be expressed as thefollowing form:
X (t ) Å At
A`
(2)log[0ln{1 0 X (t ) } ] Å n log t / log k (3b)
where At is the area under the DSC curves from Plotting the first term versus log t , both k and nt Å 0 to t Å t , and A` is the total area under could be obtained from the slope and the interceptthe crystallization curve. X (` ) is also called the at log t Å 0, respectively.equilibrium degree of crystallization. From this The rate coefficient can be also calculated fromequation, the weight fraction of crystalline mate- the half-life for the crystallization, t0.5 , by meansrial X (t ) at a specific time can be calculated. Since of the following equation:any polymer can transform from amorphous to100% crystalline, X (t ) is referred as the reduced k * Å ln 2/tn
0.5 (4)crystallinity. The plots of X (t ) versus time foreach composition and crystallization temperature Tmax denotes the time to attain maximum rateTc are shown in Figures 1–4. The induction time, of crystallization. The value of Tmax can be theoret-ti , which is the distance from the thermal equilib- ically correlated with eq. (2). When t is large andrium point to the isotherm starting point, is found X x 1, eq. (2) can be modified to the followingfrom the DSC curves. ti must be considered in all form:the isothermal DSC kinetic analysis. However, asthe initiation of the exotherm does not mean that X (t )
X (` )Å 1 0exp(0Ktn ) (5)the crystalline content is zero in this moment, it
must be considered that ti is not an exactly properinduction time. Furthermore, it may be difficult orto detect the true initial point of the exotherm atthe low crystallization temperature because it is
log F0lnH1 0 X (t )X (` ) JG Å n log t / log K (6)difficult to attain the complete thermal equilib-
rium at that moment. The kinetic analysis can be
8E07 4690/ 8E07$$4690 01-15-98 09:05:34 polaal W: Poly Applied
1386 KIM, PARK, AND GIL
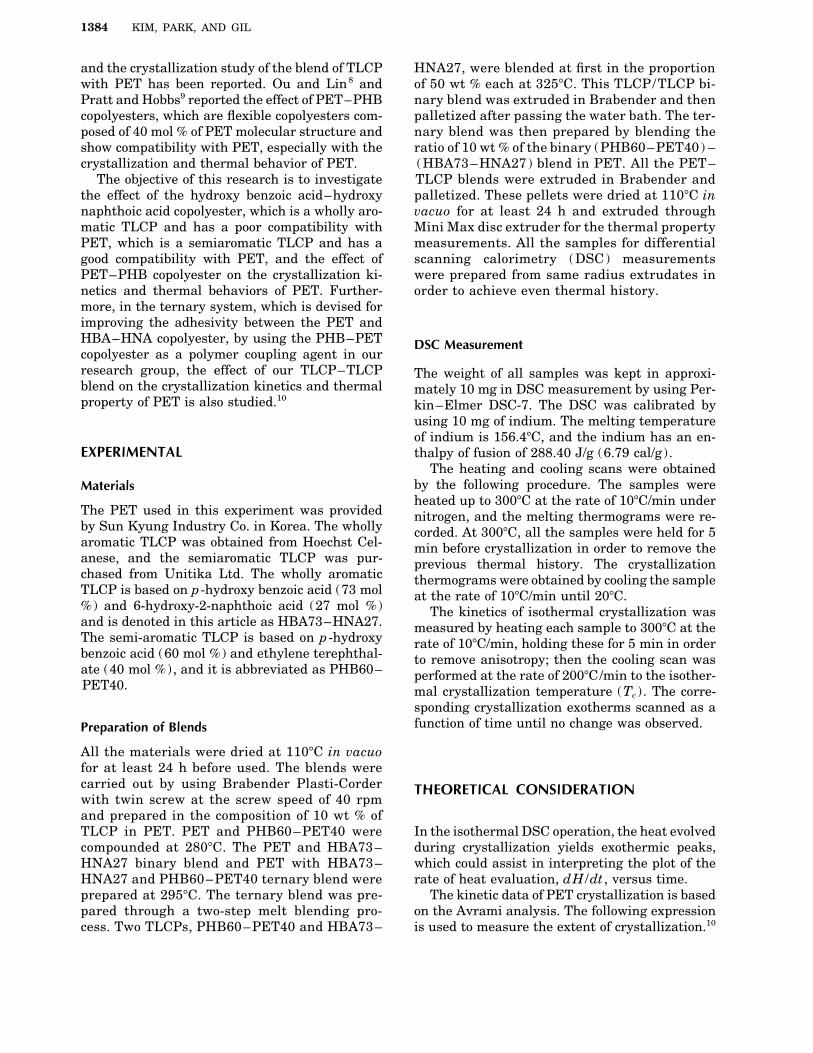
Figure 2 Reduced crystallinity as a function of time for PET– (PHB60–PET40) (90 :10) blends.
Equation (6) can be differentiated as the follow- d2X (t )dt2 Å 0ing form:
anddX (t )dt
Å X (` ) nKtn01 exp(0Ktn ) (7)
nKtn 0 (n 0 1) Å 0
Then, the differentiation of eq. (7) will show The time at this situation is the tmax in the isother-mal DSC curves, as follows:
d2X (t )dt2 Å 0X (` ) (0nKtn01)2 exp(0Ktn )
tmax Å S n 0 1nK D1/n
(9)/ X (` ) n (n 0 1)Ktn02 exp(0Ktn ) (8)
when The combination of eq. (5) with eq. (9) yields
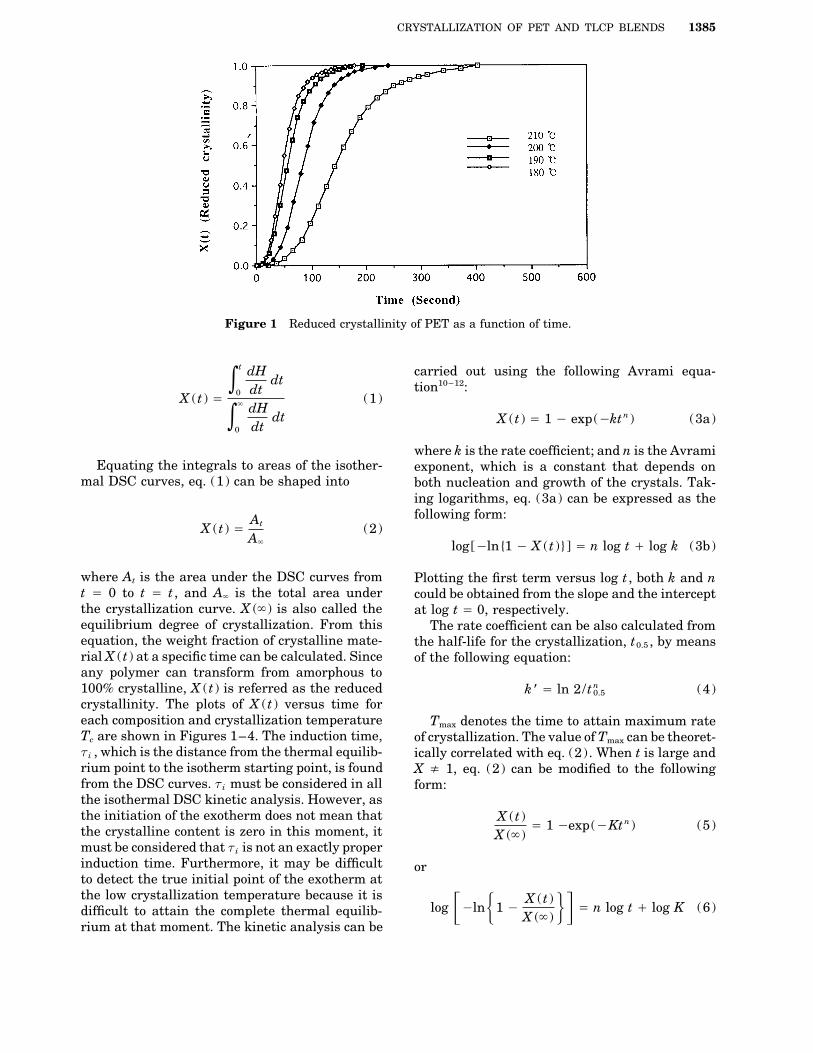
Figure 3 Reduced crystallinity as a function of time for PET– (HBA73–HNA27) (90 :10) blends.
8E07 4690/ 8E07$$4690 01-15-98 09:05:34 polaal W: Poly Applied
CRYSTALLIZATION OF PET AND TLCP BLENDS 1387
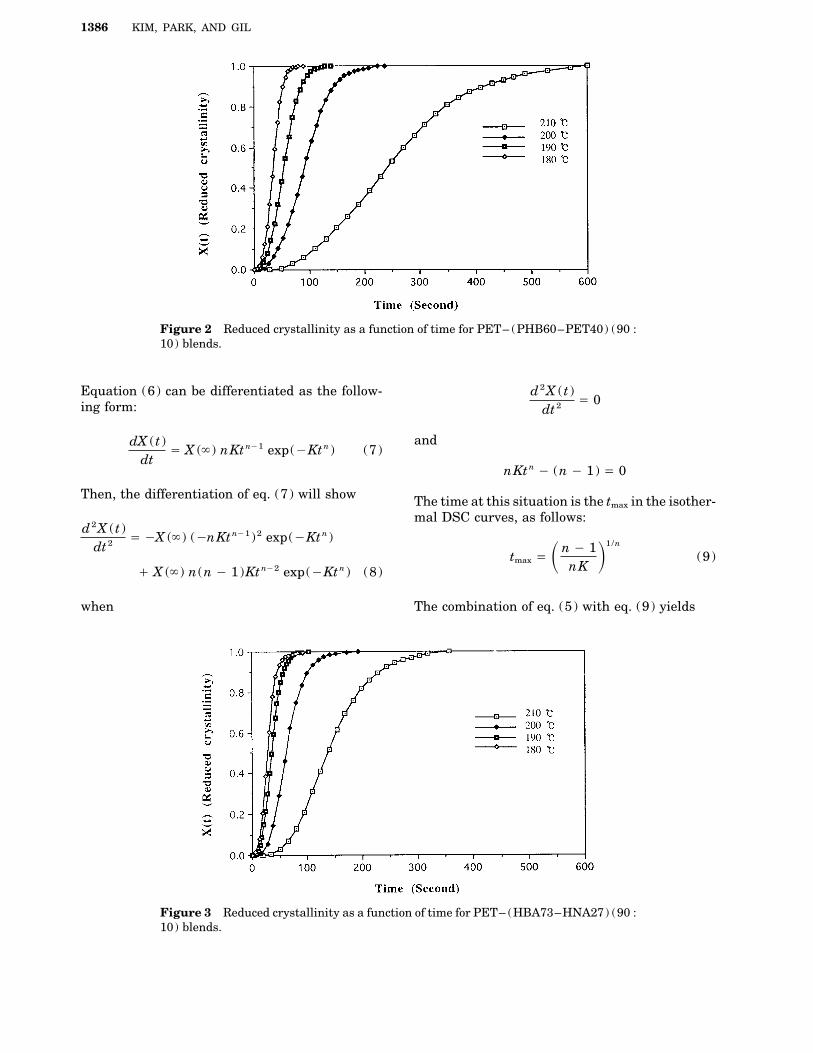
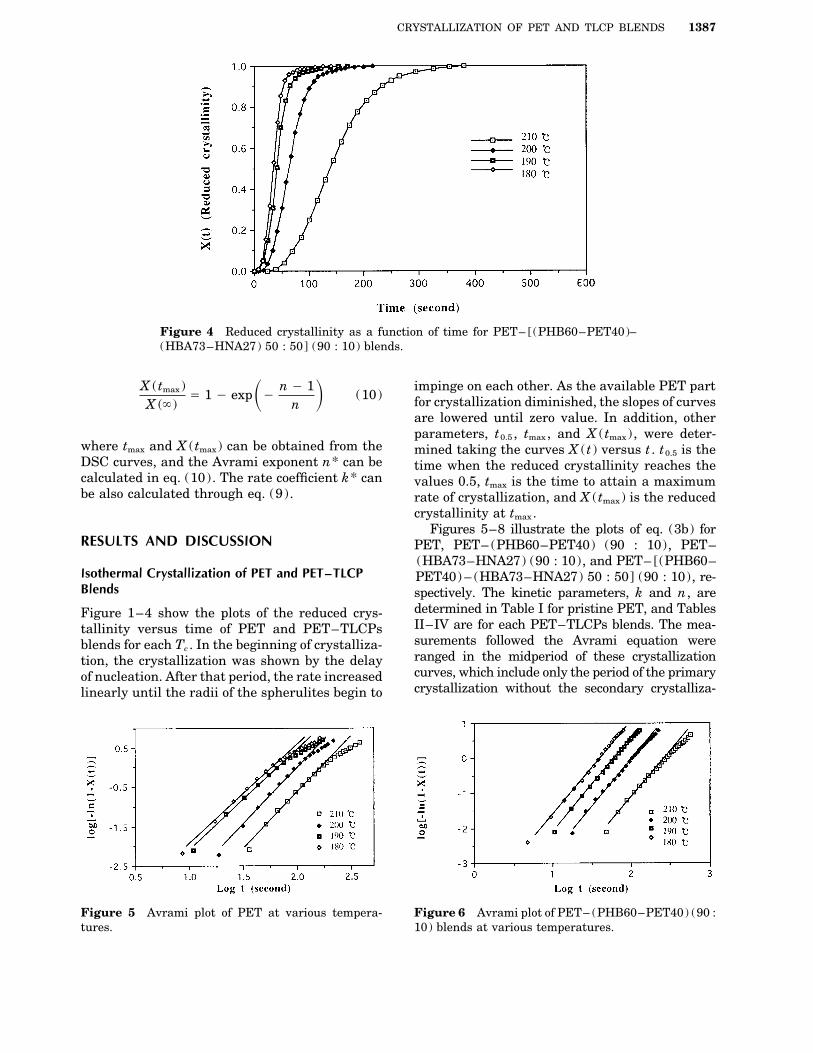
Figure 4 Reduced crystallinity as a function of time for PET– [(PHB60–PET40)–(HBA73–HNA27) 50 : 50] (90 : 10) blends.
impinge on each other. As the available PET partX (tmax)X (` )
Å 1 0 expS0 n 0 1n D (10) for crystallization diminished, the slopes of curves
are lowered until zero value. In addition, otherparameters, t0.5 , tmax, and X (tmax) , were deter-
where tmax and X (tmax) can be obtained from the mined taking the curves X (t ) versus t . t0.5 is theDSC curves, and the Avrami exponent n* can be time when the reduced crystallinity reaches thecalculated in eq. (10). The rate coefficient k* can values 0.5, tmax is the time to attain a maximumbe also calculated through eq. (9). rate of crystallization, and X (tmax) is the reduced
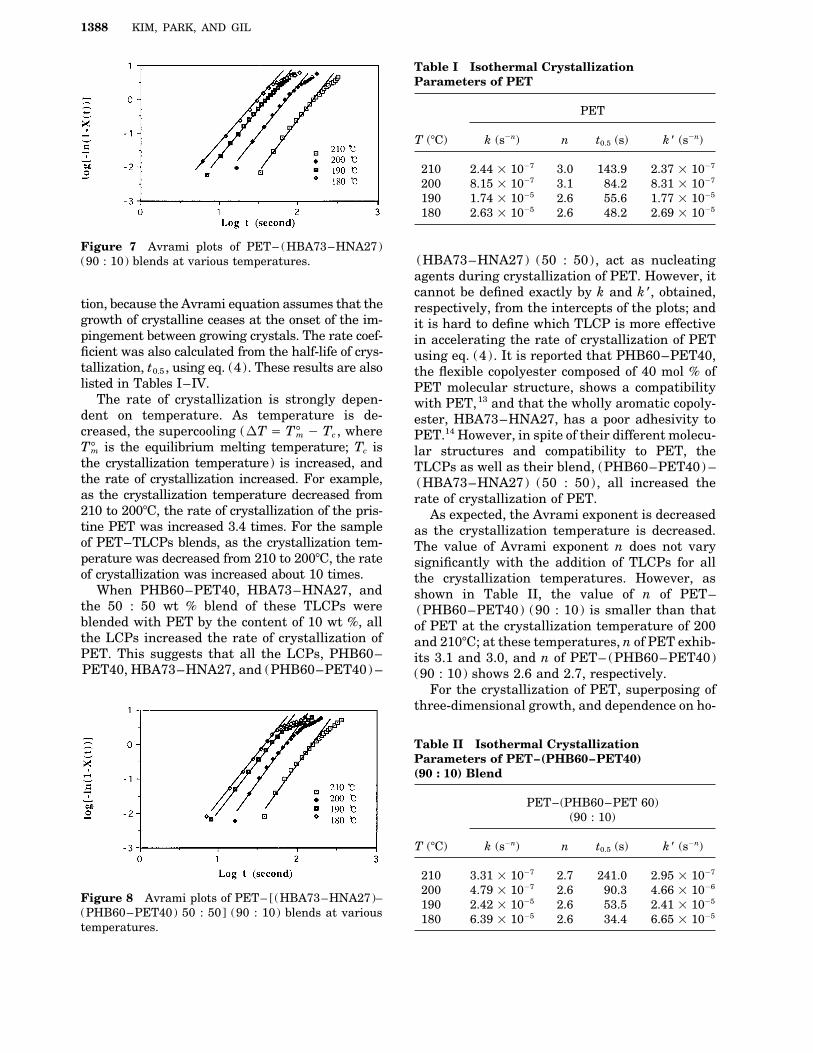
crystallinity at tmax.Figures 5–8 illustrate the plots of eq. (3b) for
RESULTS AND DISCUSSION PET, PET– (PHB60–PET40) (90 : 10), PET–(HBA73–HNA27) (90 : 10), and PET– [(PHB60–
Isothermal Crystallization of PET and PET–TLCP PET40) – (HBA73–HNA27) 50 : 50] (90 : 10), re-Blends spectively. The kinetic parameters, k and n, are
determined in Table I for pristine PET, and TablesFigure 1–4 show the plots of the reduced crys-II–IV are for each PET–TLCPs blends. The mea-tallinity versus time of PET and PET–TLCPssurements followed the Avrami equation wereblends for each Tc . In the beginning of crystalliza-ranged in the midperiod of these crystallizationtion, the crystallization was shown by the delaycurves, which include only the period of the primaryof nucleation. After that period, the rate increasedcrystallization without the secondary crystalliza-linearly until the radii of the spherulites begin to
Figure 5 Avrami plot of PET at various tempera- Figure 6 Avrami plot of PET– (PHB60–PET40) (90 :10) blends at various temperatures.tures.
8E07 4690/ 8E07$$4690 01-15-98 09:05:34 polaal W: Poly Applied
1388 KIM, PARK, AND GIL
Table I Isothermal CrystallizationParameters of PET
PET
T (7C) k (s0n) n t0.5 (s) k * (s0n)
210 2.44 1 1007 3.0 143.9 2.37 1 1007
200 8.15 1 1007 3.1 84.2 8.31 1 1007
190 1.74 1 1005 2.6 55.6 1.77 1 1005
180 2.63 1 1005 2.6 48.2 2.69 1 1005
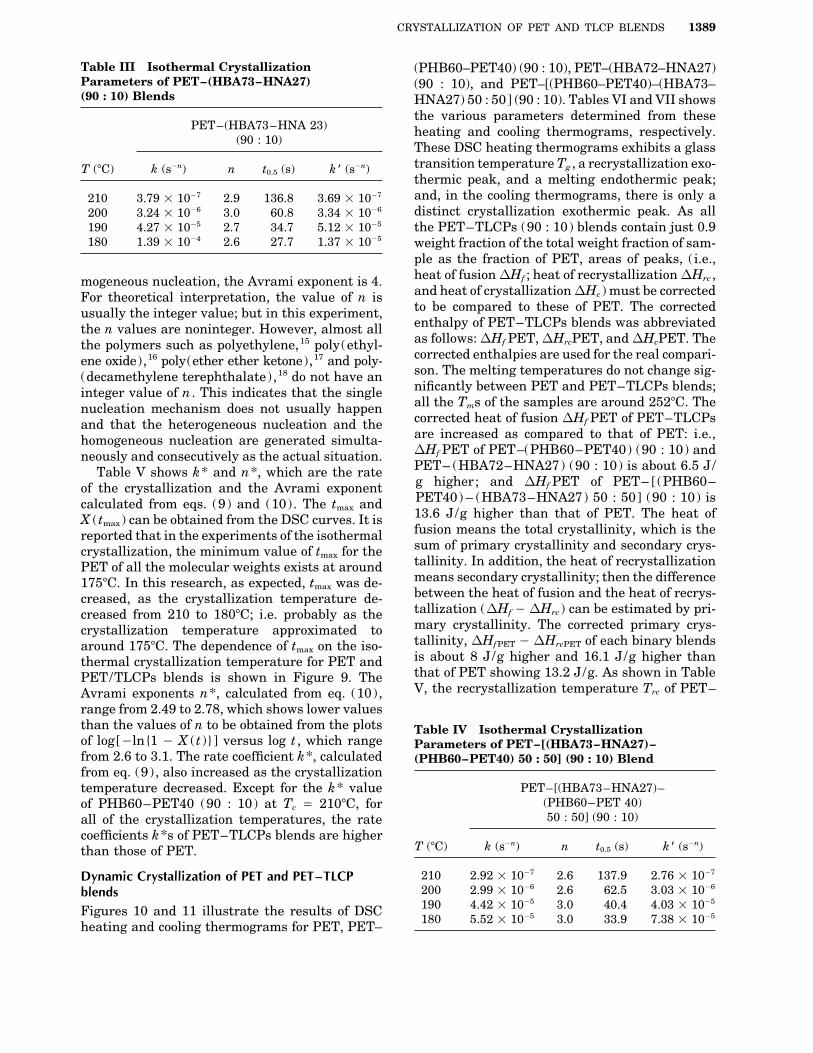
Figure 7 Avrami plots of PET– (HBA73–HNA27)(HBA73–HNA27) (50 : 50), act as nucleating(90 : 10) blends at various temperatures.agents during crystallization of PET. However, itcannot be defined exactly by k and k *, obtained,
tion, because the Avrami equation assumes that the respectively, from the intercepts of the plots; andgrowth of crystalline ceases at the onset of the im- it is hard to define which TLCP is more effectivepingement between growing crystals. The rate coef- in accelerating the rate of crystallization of PETficient was also calculated from the half-life of crys- using eq. (4). It is reported that PHB60–PET40,tallization, t0.5 , using eq. (4). These results are also the flexible copolyester composed of 40 mol % oflisted in Tables I–IV. PET molecular structure, shows a compatibility
The rate of crystallization is strongly depen- with PET,13 and that the wholly aromatic copoly-dent on temperature. As temperature is de- ester, HBA73–HNA27, has a poor adhesivity tocreased, the supercooling (DT Å T 7m 0 Tc , where PET.14 However, in spite of their different molecu-T7m is the equilibrium melting temperature; Tc is lar structures and compatibility to PET, thethe crystallization temperature) is increased, and TLCPs as well as their blend, (PHB60–PET40) –the rate of crystallization increased. For example, (HBA73–HNA27) (50 : 50), all increased theas the crystallization temperature decreased from rate of crystallization of PET.210 to 2007C, the rate of crystallization of the pris- As expected, the Avrami exponent is decreasedtine PET was increased 3.4 times. For the sample as the crystallization temperature is decreased.of PET–TLCPs blends, as the crystallization tem- The value of Avrami exponent n does not varyperature was decreased from 210 to 2007C, the rate significantly with the addition of TLCPs for allof crystallization was increased about 10 times. the crystallization temperatures. However, as
When PHB60–PET40, HBA73–HNA27, and shown in Table II, the value of n of PET–the 50 : 50 wt % blend of these TLCPs were (PHB60–PET40) (90 : 10) is smaller than thatblended with PET by the content of 10 wt %, all of PET at the crystallization temperature of 200the LCPs increased the rate of crystallization of and 2107C; at these temperatures, n of PET exhib-PET. This suggests that all the LCPs, PHB60– its 3.1 and 3.0, and n of PET– (PHB60–PET40)PET40, HBA73–HNA27, and (PHB60–PET40) – (90 : 10) shows 2.6 and 2.7, respectively.
For the crystallization of PET, superposing ofthree-dimensional growth, and dependence on ho-
Table II Isothermal CrystallizationParameters of PET–(PHB60–PET40)(90 : 10) Blend
PET–(PHB60–PET 60)(90 : 10)
T (7C) k (s0n) n t0.5 (s) k * (s0n)
210 3.31 1 1007 2.7 241.0 2.95 1 1007
200 4.79 1 1007 2.6 90.3 4.66 1 1006
Figure 8 Avrami plots of PET– [(HBA73–HNA27)– 190 2.42 1 1005 2.6 53.5 2.41 1 1005
(PHB60–PET40) 50 : 50] (90 : 10) blends at various 180 6.39 1 1005 2.6 34.4 6.65 1 1005
temperatures.
8E07 4690/ 8E07$$4690 01-15-98 09:05:34 polaal W: Poly Applied
CRYSTALLIZATION OF PET AND TLCP BLENDS 1389
Table III Isothermal Crystallization (PHB60–PET40) (90 : 10), PET–(HBA72–HNA27)Parameters of PET–(HBA73–HNA27) (90 : 10), and PET–[(PHB60–PET40)–(HBA73–(90 : 10) Blends HNA27) 50 : 50] (90 : 10). Tables VI and VII shows
the various parameters determined from thesePET–(HBA73–HNA 23) heating and cooling thermograms, respectively.
(90 : 10) These DSC heating thermograms exhibits a glasstransition temperature Tg , a recrystallization exo-T (7C) k (s0n) n t0.5 (s) k * (s0n)thermic peak, and a melting endothermic peak;and, in the cooling thermograms, there is only a210 3.79 1 1007 2.9 136.8 3.69 1 1007
distinct crystallization exothermic peak. As all200 3.24 1 1006 3.0 60.8 3.34 1 1006
190 4.27 1 1005 2.7 34.7 5.12 1 1005 the PET–TLCPs (90 : 10) blends contain just 0.9180 1.39 1 1004 2.6 27.7 1.37 1 1005 weight fraction of the total weight fraction of sam-
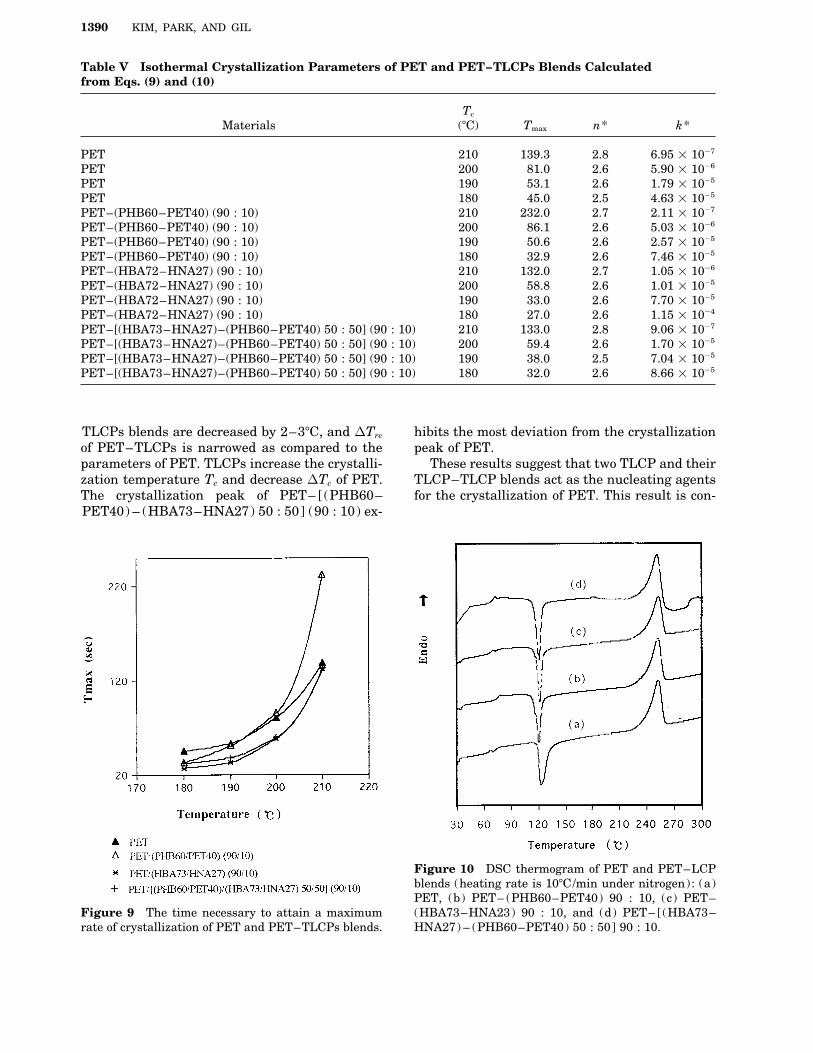
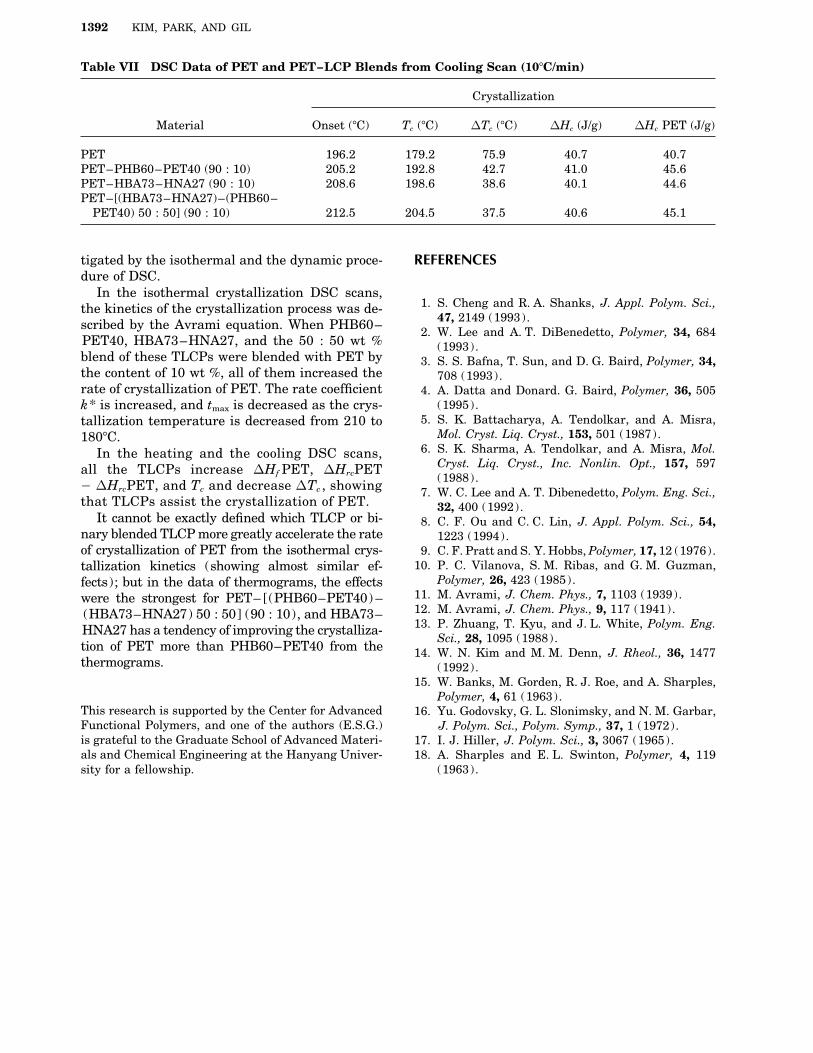
ple as the fraction of PET, areas of peaks, (i.e.,heat of fusion DHf ; heat of recrystallization DHrc ,mogeneous nucleation, the Avrami exponent is 4.and heat of crystallization DHc ) must be correctedFor theoretical interpretation, the value of n isto be compared to these of PET. The correctedusually the integer value; but in this experiment,enthalpy of PET–TLCPs blends was abbreviatedthe n values are noninteger. However, almost allas follows: DHf PET, DHrcPET, and DHcPET. Thethe polymers such as polyethylene,15 poly(ethyl-corrected enthalpies are used for the real compari-ene oxide),16 poly(ether ether ketone),17 and poly-son. The melting temperatures do not change sig-(decamethylene terephthalate),18 do not have annificantly between PET and PET–TLCPs blends;integer value of n . This indicates that the singleall the Tms of the samples are around 2527C. Thenucleation mechanism does not usually happencorrected heat of fusion DHf PET of PET–TLCPsand that the heterogeneous nucleation and theare increased as compared to that of PET: i.e.,homogeneous nucleation are generated simulta-DHf PET of PET–(PHB60–PET40) (90 : 10) andneously and consecutively as the actual situation.PET– (HBA72–HNA27) (90 : 10) is about 6.5 J/Table V shows k* and n*, which are the rateg higher; and DHf PET of PET– [(PHB60–of the crystallization and the Avrami exponentPET40) – (HBA73–HNA27) 50 : 50] (90 : 10) iscalculated from eqs. (9) and (10). The tmax and13.6 J/g higher than that of PET. The heat ofX (tmax) can be obtained from the DSC curves. It isfusion means the total crystallinity, which is thereported that in the experiments of the isothermalsum of primary crystallinity and secondary crys-crystallization, the minimum value of tmax for thetallinity. In addition, the heat of recrystallizationPET of all the molecular weights exists at aroundmeans secondary crystallinity; then the difference1757C. In this research, as expected, tmax was de-between the heat of fusion and the heat of recrys-creased, as the crystallization temperature de-tallization (DHf 0 DHrc ) can be estimated by pri-creased from 210 to 1807C; i.e. probably as themary crystallinity. The corrected primary crys-crystallization temperature approximated totallinity, DHfPET 0 DHrcPET of each binary blendsaround 1757C. The dependence of tmax on the iso-is about 8 J/g higher and 16.1 J/g higher thanthermal crystallization temperature for PET andthat of PET showing 13.2 J/g. As shown in TablePET/TLCPs blends is shown in Figure 9. TheV, the recrystallization temperature Trc of PET–Avrami exponents n*, calculated from eq. (10),
range from 2.49 to 2.78, which shows lower valuesthan the values of n to be obtained from the plots Table IV Isothermal Crystallizationof log[0ln{1 0 X (t ) } ] versus log t , which range Parameters of PET–[(HBA73–HNA27)–from 2.6 to 3.1. The rate coefficient k*, calculated (PHB60–PET40) 50 : 50] (90 : 10) Blendfrom eq. (9), also increased as the crystallization
PET–[(HBA73–HNA27)–temperature decreased. Except for the k* value(PHB60–PET 40)of PHB60–PET40 (90 : 10) at Tc Å 2107C, for50 : 50] (90 : 10)all of the crystallization temperatures, the rate
coefficients k*s of PET–TLCPs blends are higherT (7C) k (s0n) n t0.5 (s) k * (s0n)than those of PET.
210 2.92 1 1007 2.6 137.9 2.76 1 1007Dynamic Crystallization of PET and PET–TLCP200 2.99 1 1006 2.6 62.5 3.03 1 1006blends190 4.42 1 1005 3.0 40.4 4.03 1 1005
Figures 10 and 11 illustrate the results of DSC180 5.52 1 1005 3.0 33.9 7.38 1 1005
heating and cooling thermograms for PET, PET–
8E07 4690/ 8E07$$4690 01-15-98 09:05:34 polaal W: Poly Applied
1390 KIM, PARK, AND GIL
Table V Isothermal Crystallization Parameters of PET and PET–TLCPs Blends Calculatedfrom Eqs. (9) and (10)
Tc
Materials (7C) Tmax n* k*
PET 210 139.3 2.8 6.95 1 1007
PET 200 81.0 2.6 5.90 1 1006
PET 190 53.1 2.6 1.79 1 1005
PET 180 45.0 2.5 4.63 1 1005
PET–(PHB60–PET40) (90 : 10) 210 232.0 2.7 2.11 1 1007
PET–(PHB60–PET40) (90 : 10) 200 86.1 2.6 5.03 1 1006
PET–(PHB60–PET40) (90 : 10) 190 50.6 2.6 2.57 1 1005
PET–(PHB60–PET40) (90 : 10) 180 32.9 2.6 7.46 1 1005
PET–(HBA72–HNA27) (90 : 10) 210 132.0 2.7 1.05 1 1006
PET–(HBA72–HNA27) (90 : 10) 200 58.8 2.6 1.01 1 1005
PET–(HBA72–HNA27) (90 : 10) 190 33.0 2.6 7.70 1 1005
PET–(HBA72–HNA27) (90 : 10) 180 27.0 2.6 1.15 1 1004
PET–[(HBA73–HNA27)–(PHB60–PET40) 50 : 50] (90 : 10) 210 133.0 2.8 9.06 1 1007
PET–[(HBA73–HNA27)–(PHB60–PET40) 50 : 50] (90 : 10) 200 59.4 2.6 1.70 1 1005
PET–[(HBA73–HNA27)–(PHB60–PET40) 50 : 50] (90 : 10) 190 38.0 2.5 7.04 1 1005
PET–[(HBA73–HNA27)–(PHB60–PET40) 50 : 50] (90 : 10) 180 32.0 2.6 8.66 1 1005
TLCPs blends are decreased by 2–37C, and DTrc hibits the most deviation from the crystallizationpeak of PET.of PET–TLCPs is narrowed as compared to the
parameters of PET. TLCPs increase the crystalli- These results suggest that two TLCP and theirTLCP–TLCP blends act as the nucleating agentszation temperature Tc and decrease DTc of PET.
The crystallization peak of PET– [(PHB60– for the crystallization of PET. This result is con-PET40) – (HBA73–HNA27) 50 : 50] (90 : 10) ex-
Figure 10 DSC thermogram of PET and PET–LCPblends (heating rate is 107C/min under nitrogen): (a)PET, (b) PET– (PHB60–PET40) 90 : 10, (c) PET–(HBA73–HNA23) 90 : 10, and (d) PET– [(HBA73–Figure 9 The time necessary to attain a maximum
rate of crystallization of PET and PET–TLCPs blends. HNA27) – (PHB60–PET40) 50 : 50] 90 : 10.
8E07 4690/ 8E07$$4690 01-15-98 09:05:34 polaal W: Poly Applied
CRYSTALLIZATION OF PET AND TLCP BLENDS 1391
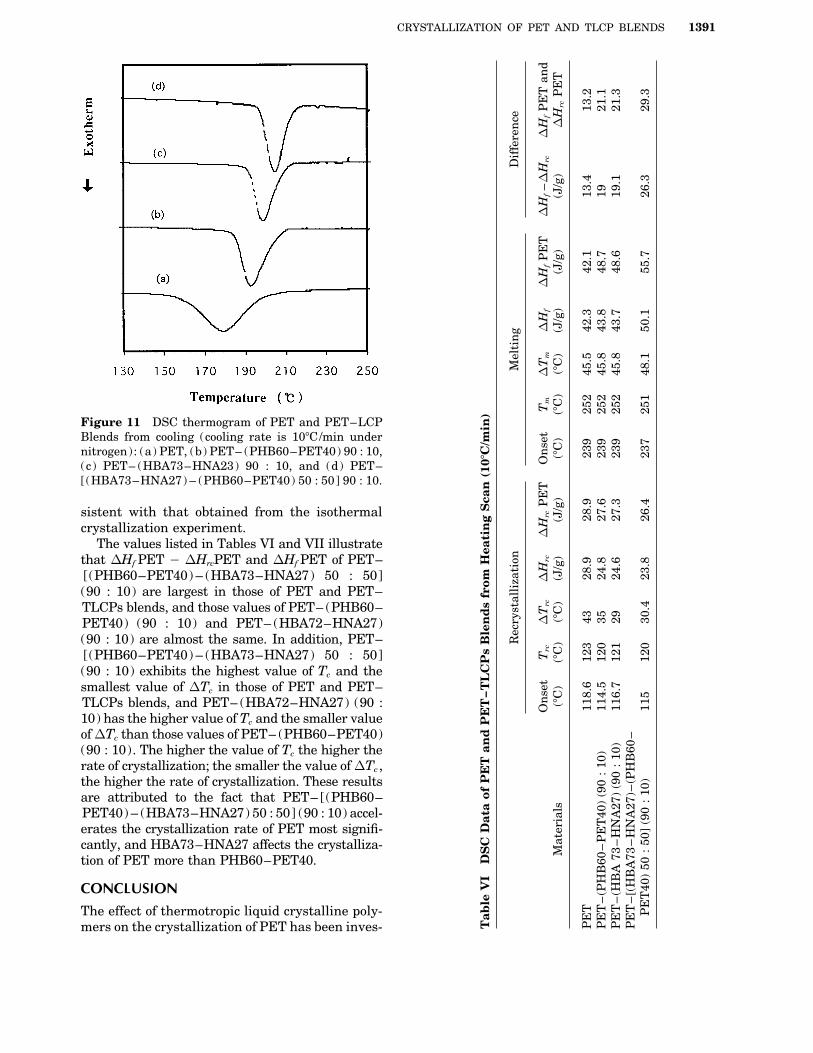
Figure 11 DSC thermogram of PET and PET–LCPBlends from cooling (cooling rate is 107C/min undernitrogen): (a) PET, (b) PET– (PHB60–PET40) 90 : 10,(c) PET– (HBA73–HNA23) 90 : 10, and (d) PET–[(HBA73–HNA27) – (PHB60–PET40) 50 : 50] 90 : 10.
sistent with that obtained from the isothermalcrystallization experiment.
The values listed in Tables VI and VII illustratethat DHf PET 0 DHrcPET and DHf PET of PET–[(PHB60–PET40) – (HBA73–HNA27) 50 : 50](90 : 10) are largest in those of PET and PET–TLCPs blends, and those values of PET– (PHB60–PET40) (90 : 10) and PET– (HBA72–HNA27)(90 : 10) are almost the same. In addition, PET–[(PHB60–PET40) – (HBA73–HNA27) 50 : 50](90 : 10) exhibits the highest value of Tc and thesmallest value of DTc in those of PET and PET–TLCPs blends, and PET– (HBA72–HNA27) (90 :10) has the higher value of Tc and the smaller valueof DTc than those values of PET– (PHB60–PET40)(90 : 10). The higher the value of Tc the higher therate of crystallization; the smaller the value of DTc ,the higher the rate of crystallization. These resultsare attributed to the fact that PET– [(PHB60–PET40) – (HBA73–HNA27) 50 : 50] (90 : 10) accel-erates the crystallization rate of PET most signifi-cantly, and HBA73–HNA27 affects the crystalliza-tion of PET more than PHB60–PET40.
CONCLUSION
The effect of thermotropic liquid crystalline poly-
Tab
leV
ID
SC
Dat
aof
PE
Tan
dP
ET
–TL
CP
sB
len
ds
from
Hea
tin
gS
can
(107
C/m
in)
Rec
ryst
alli
zati
onM
elti
ng
Dif
fere
nce
On
set
Trc
DT
rcD
Hrc
DH
rcP
ET
On
set
Tm
DT
mD
Hf
DH
fP
ET
DH
f–D
Hrc
DH
fP
ET
and
Mat
eria
ls(7
C)
(7C
)(7
C)
(J/g
)(J
/g)
(7C
)(7
C)
(7C
)(J
/g)
(J/g
)(J
/g)
DH
rcP
ET
PE
T11
8.6
123
4328
.928
.923
925
245
.542
.342
.113
.413
.2P
ET
–(P
HB
60–
PE
T40
)(9
0:
10)
114.
512
035
24.8
27.6
239
252
45.8
43.8
48.7
1921
.1P
ET
–(H
BA
73–
HN
A27
)(9
0:
10)
116.
712
129
24.6
27.3
239
252
45.8
43.7
48.6
19.1
21.3
PE
T–
[(H
BA
73–
HN
A27
)–(P
HB
60–
PE
T40
)50
:50
](9
0:
10)
115
120
30.4
23.8
26.4
237
251
48.1
50.1
55.7
26.3
29.3
mers on the crystallization of PET has been inves-
8E07 4690/ 8E07$$4690 01-15-98 09:05:34 polaal W: Poly Applied
1392 KIM, PARK, AND GIL
Table VII DSC Data of PET and PET–LCP Blends from Cooling Scan (107C/min)
Crystallization
Material Onset (7C) Tc (7C) DTc (7C) DHc (J/g) DHc PET (J/g)
PET 196.2 179.2 75.9 40.7 40.7PET–PHB60–PET40 (90 : 10) 205.2 192.8 42.7 41.0 45.6PET–HBA73–HNA27 (90 : 10) 208.6 198.6 38.6 40.1 44.6PET–[(HBA73–HNA27)–(PHB60–
PET40) 50 : 50] (90 : 10) 212.5 204.5 37.5 40.6 45.1
tigated by the isothermal and the dynamic proce- REFERENCESdure of DSC.
In the isothermal crystallization DSC scans,1. S. Cheng and R. A. Shanks, J. Appl. Polym. Sci.,the kinetics of the crystallization process was de-
47, 2149 (1993).scribed by the Avrami equation. When PHB60– 2. W. Lee and A. T. DiBenedetto, Polymer, 34, 684PET40, HBA73–HNA27, and the 50 : 50 wt % (1993).blend of these TLCPs were blended with PET by 3. S. S. Bafna, T. Sun, and D. G. Baird, Polymer, 34,the content of 10 wt %, all of them increased the 708 (1993).rate of crystallization of PET. The rate coefficient 4. A. Datta and Donard. G. Baird, Polymer, 36, 505
(1995).k* is increased, and tmax is decreased as the crys-5. S. K. Battacharya, A. Tendolkar, and A. Misra,tallization temperature is decreased from 210 to
Mol. Cryst. Liq. Cryst., 153, 501 (1987).1807C.6. S. K. Sharma, A. Tendolkar, and A. Misra, Mol.In the heating and the cooling DSC scans,
Cryst. Liq. Cryst., Inc. Nonlin. Opt., 157, 597all the TLCPs increase DHf PET, DHrcPET(1988).0 DHrcPET, and Tc and decrease DTc , showing 7. W. C. Lee and A. T. Dibenedetto, Polym. Eng. Sci.,
that TLCPs assist the crystallization of PET. 32, 400 (1992).It cannot be exactly defined which TLCP or bi- 8. C. F. Ou and C. C. Lin, J. Appl. Polym. Sci., 54,
nary blended TLCP more greatly accelerate the rate 1223 (1994).of crystallization of PET from the isothermal crys- 9. C. F. Pratt and S. Y. Hobbs, Polymer, 17, 12 (1976).
10. P. C. Vilanova, S. M. Ribas, and G. M. Guzman,tallization kinetics (showing almost similar ef-Polymer, 26, 423 (1985).fects); but in the data of thermograms, the effects
11. M. Avrami, J. Chem. Phys., 7, 1103 (1939).were the strongest for PET– [(PHB60–PET40) –12. M. Avrami, J. Chem. Phys., 9, 117 (1941).(HBA73–HNA27) 50 : 50] (90 : 10), and HBA73–13. P. Zhuang, T. Kyu, and J. L. White, Polym. Eng.HNA27 has a tendency of improving the crystalliza-
Sci., 28, 1095 (1988).tion of PET more than PHB60–PET40 from the 14. W. N. Kim and M. M. Denn, J. Rheol., 36, 1477thermograms. (1992).
15. W. Banks, M. Gorden, R. J. Roe, and A. Sharples,Polymer, 4, 61 (1963).
This research is supported by the Center for Advanced 16. Yu. Godovsky, G. L. Slonimsky, and N. M. Garbar,Functional Polymers, and one of the authors (E.S.G.) J. Polym. Sci., Polym. Symp., 37, 1 (1972).is grateful to the Graduate School of Advanced Materi- 17. I. J. Hiller, J. Polym. Sci., 3, 3067 (1965).als and Chemical Engineering at the Hanyang Univer- 18. A. Sharples and E. L. Swinton, Polymer, 4, 119
(1963).sity for a fellowship.
8E07 4690/ 8E07$$4690 01-15-98 09:05:34 polaal W: Poly Applied