crustal motion in the southern andes (26°–36°s): do the andes behave like a microplate
TRANSCRIPT
Crustal motion in the Southern Andes (26�–36�S): Do theAndes behave like a microplate?
Benjamin A. Brooks and Michael BevisSchool of Ocean and Earth Science and Technology, University of Hawaii, 1680 East-West Road, Honolulu, Hawaii96822, USA ([email protected]; [email protected])
Robert Smalley Jr.Center for Earthquake Research and Information, University of Memphis, 3876 Central Ave Ste 1, Memphis, Tennessee38152, USA ([email protected])
Eric KendrickSchool of Ocean and Earth Science and Technology, University of Hawaii, 1680 East-West Road, Honolulu, Hawaii96822, USA ([email protected])
Rene MancedaRepsolYPF, 1330 Lake Robbins Drive, The Woodlands, Texas 77380, USA ([email protected])
Eduardo LaurıaInstituto Geografico Militar Argentina, Cabildo 381, Buenos Aires, Argentina ([email protected])
Rodrigo MaturanaInstituto Geografico Militar Chile, Dieciocho N � 369, Santiago, Chile ([email protected])
Mario AraujoInstituto Nacional de Prevencion Sısmica, Roger Balet Norte 47, 5400, San Juan, Argentina([email protected])
[1] A new Global Positioning System (GPS)-derived velocity field for the Andes mountains (26�–36�S)allows analysis of instantaneous partitioning between elastic and anelastic deformation at the orogen’s
opposing sides. Adding an ‘‘Andes’’ microplate to the traditional description of Nazca-South America
plate convergence provides the kinematic framework for nearly complete explanation of the observed
velocity field. The results suggest the oceanic Nazca boundary is fully locked while the continental backarc
boundary creeps continuously at �4.5 mm/yr. The excellent fit of model to data (1.7 mm/yr RMS velocity
misfit), and the relative aseismicity of the upper crust in the interior Andean region in comparison with its
boundaries, supports the notion that the mountains are not currently accruing significant permanent strains.
Additionally, the model implies permanent deformation is not accumulating throughout the backarc
contractional wedge, but rather that the deformation is accommodated only within a narrow deformational
zone in the backarc.
Components: 5915 words, 7 figures, 2 tables.
Keywords: Continental deformation; Andes; GPS; interseismic.
Index Terms: 8102 Tectonophysics: Continental contractional orogenic belts; 7230 Seismology: Seismicity and
seismotectonics; 8107 Tectonophysics: Continental neotectonics.
G3G3GeochemistryGeophysics
Geosystems
Published by AGU and the Geochemical Society
AN ELECTRONIC JOURNAL OF THE EARTH SCIENCES
GeochemistryGeophysics
Geosystems
Article
Volume 4, Number 10
8 October 2003
1085, doi:10.1029/2003GC000505
ISSN: 1525-2027
Copyright 2003 by the American Geophysical Union 1 of 14
Received 2 January 2003; Revised 31 March 2003; Accepted 23 May 2003; Published 8 October 2003.
Brooks, B. A., M. Bevis, R. Smalley Jr., E. Kendrick, R. Manceda, E. Laurıa, R. Maturana, and M. Araujo, Crustal motion in
the Southern Andes (26�–36�S): Do the Andes behave like a microplate?, Geochem. Geophys. Geosyst., 4(10), 1085,
doi:10.1029/2003GC000505, 2003.
1. Introduction
[2] Surface velocity fields measured with GPS
(Global Positioning System) geodesy promise
new insight into the incremental processes that
actively deform continents and, over geologic
time, construct mountains. For continental regions
associated with plate boundaries such as the
Andes of South America, an interpretive chal-
lenge in relating the GPS-derived velocity field to
the long-term deformational pattern is that the
current pattern likely represents the superposition
of an ephemeral (self-reversing) elastic signal
driven by the plate boundary earthquake cycle
and steadily accumulating deformation that pro-
duces mountain growth. Specifically accounting
for these two signals is important if we wish to be
able to address first order issues such as the
degree of seismic coupling at the main plate
boundary [Savage, 1983] and whether specific
instances of continental deformation are more
aptly described by the relative motions of
rigid microplates or as the deformation of a
viscous continuum [England and McKenzie,
1982; Thatcher, 1995]. Here, we present a new
GPS-derived velocity field from a >1000 km
long section of the Andes mountains (26–36�S)(Figure 1, Table 1, Table 2). In our analysis, we
test the hypothesis that the orogen itself behaves
as a rigid unit with a class of models that
combines ephemeral (plate boundary) and per-
manent (microplate) deformational components.
[3] In the Andes, subduction of the oceanic Nazca
plate and locking of the subduction interface strains
the upper plate until rupture during major earth-
quakes [Barazangi and Isacks, 1976]. Shortening
in backarc contractional orogenic wedges such as
the Argentine Precordillera (PC) accommodates
underthrusting of the South American craton and
makes a significant contribution to permanent
orogenic deformation [Allmendinger et al., 1990;
Kley and Monaldi, 1998; Ramos et al., 1996].
Norabuena et al. [1998] explained their GPS
velocity field for the central Andes (12�–22�S)by assuming the Nazca boundary is only � 50%
locked and that slip of �10–15mm/yr occurs on
backarc reverse faults locked to 20km depth.
Kendrick et al. [2001] produced an improved
velocity field for the region, and Bevis et al.
[2001] argued that this favored 100% locking of
the Nazca plate boundary and reduced rates of
backarc shortening. Similarly, Klotz et al. [2001]
concluded that the Nazca plate boundary was fully
locked, though their analysis did not explicitly
include any velocity component from backarc
contraction.
[4] Less attention has been focused on interpret-
ing and modeling the velocity field in the back-
arc region of the Andes, largely because
horizontal velocities in these regions tend to be
10 mm/yr or less. In one recent study, however,
Lamb [2000] found that velocity gradients (from
geologic and Norabuena et al.’s [1998] GPS
data) do not share the same orientation as calcu-
lated buoyancy stress gradients in the central
Andean foreland; thus, the thin viscous sheet
approximation has not been applied to this por-
tion of the Andes as successfully as it has been
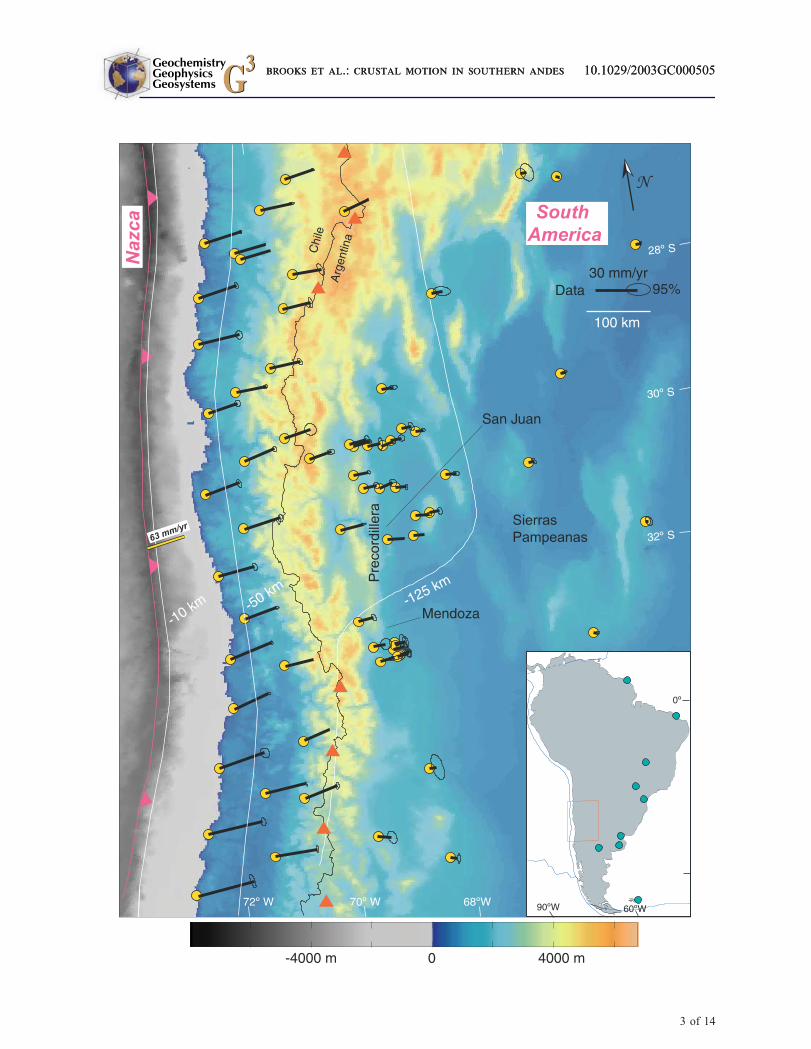
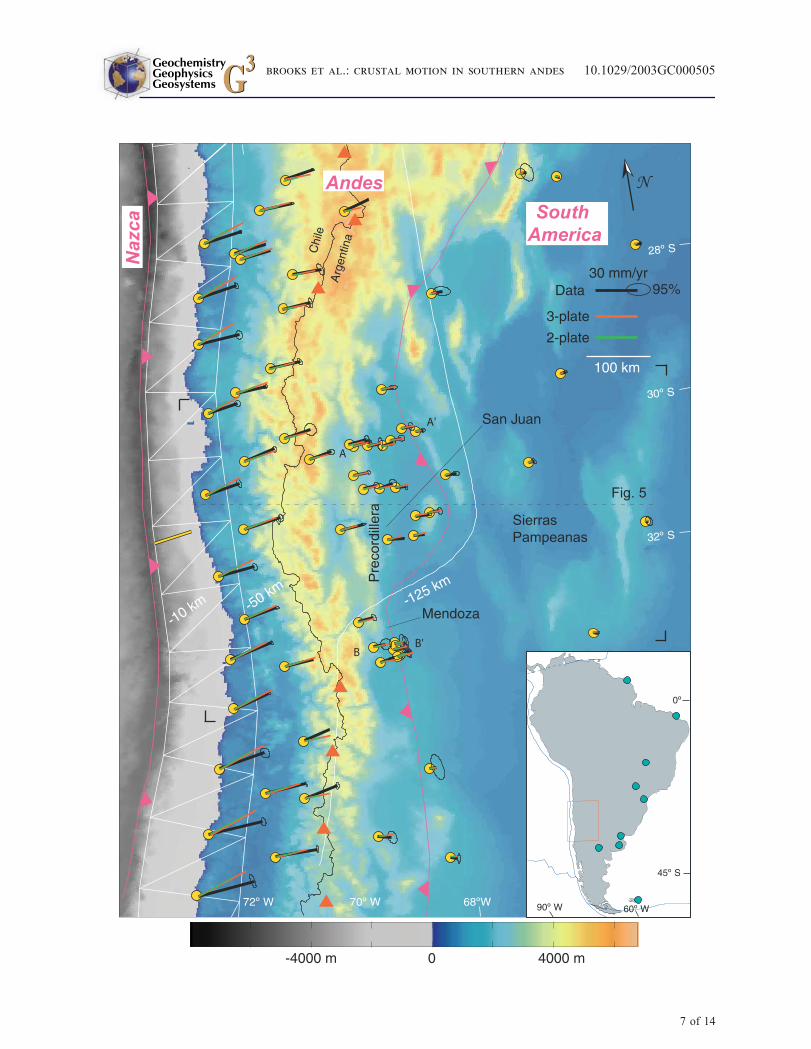
Figure 1. (opposite) GPS velocity field superimposed on Andean topography. Inset shows map of South Americawith the study area highlighted (red box) and stations used to define the reference frame (blue circles). Plates denotedwith magenta labels. White contours are of the subducted Nazca plate and red triangles denote schematically thepresence of active arc volcanism [Cahill and Isacks, 1992]. Yellow tic mark is the Nazca-South America convergencedirection with a magnitude of �63 mm/yr.
GeochemistryGeophysicsGeosystems G3G3
brooks et al.: crustal motion in southern andes 10.1029/2003GC000505
2 of 14
GeochemistryGeophysicsGeosystems G3G3
brooks et al.: crustal motion in southern andes 10.1029/2003GC000505brooks et al.: crustal motion in southern andes 10.1029/2003GC000505
3 of 14
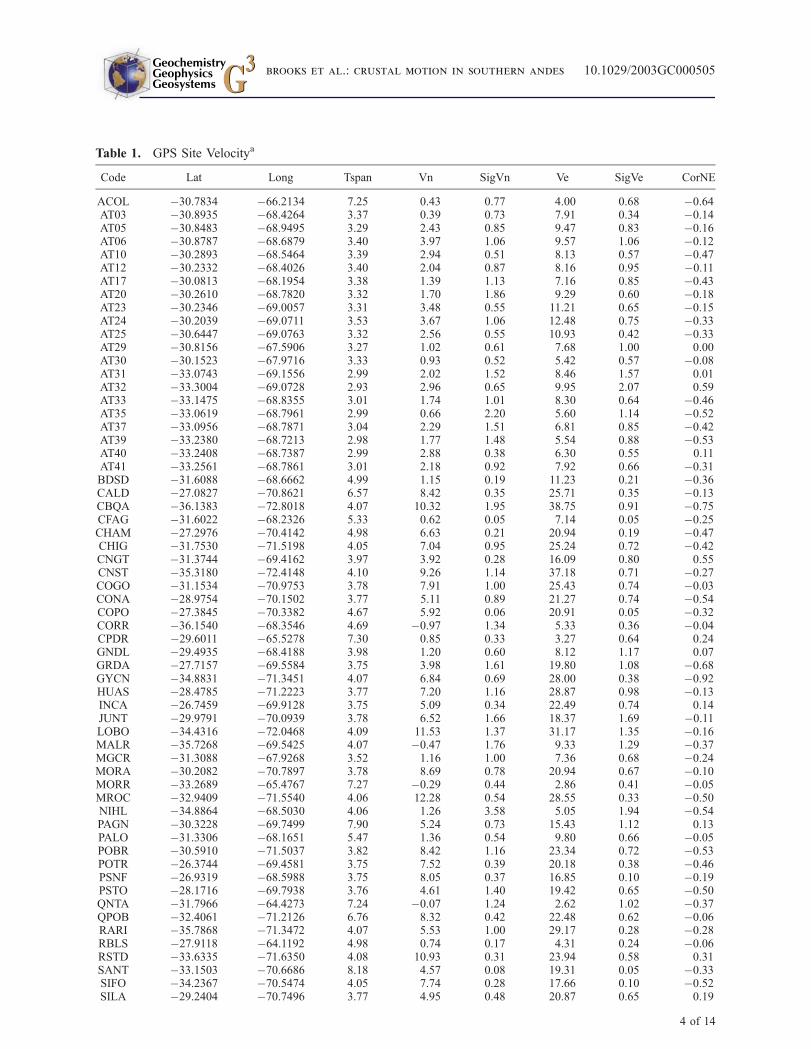
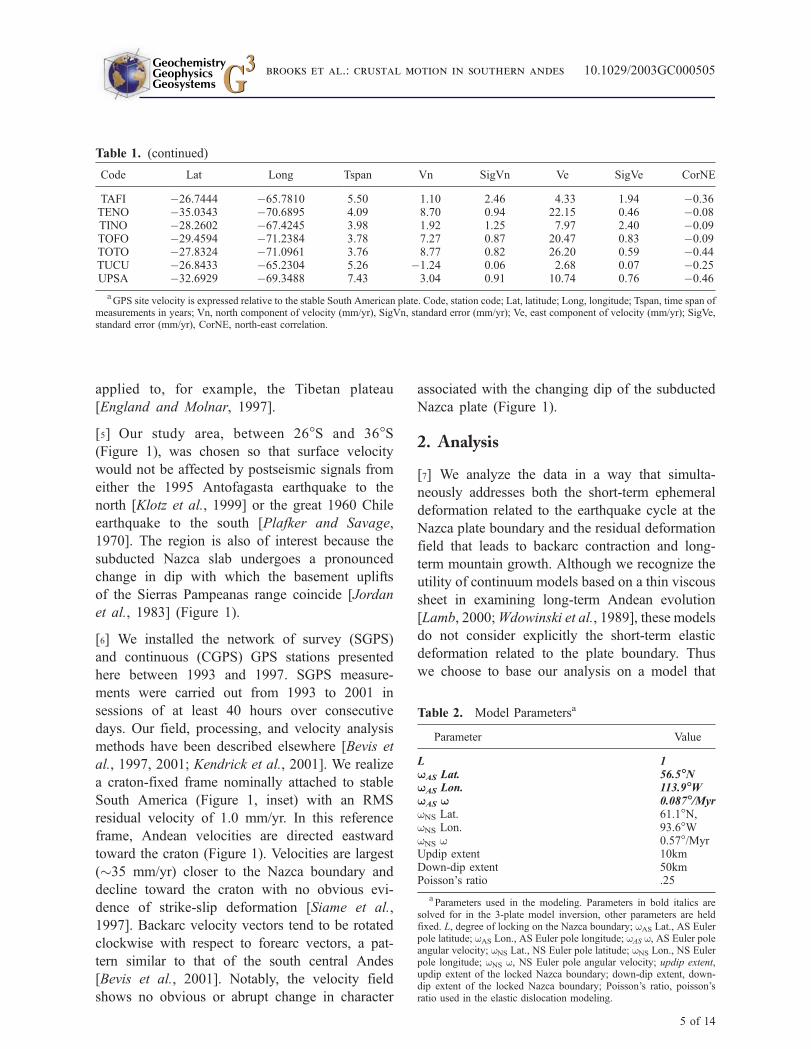
Table 1. GPS Site Velocitya
Code Lat Long Tspan Vn SigVn Ve SigVe CorNE
ACOL �30.7834 �66.2134 7.25 0.43 0.77 4.00 0.68 �0.64AT03 �30.8935 �68.4264 3.37 0.39 0.73 7.91 0.34 �0.14AT05 �30.8483 �68.9495 3.29 2.43 0.85 9.47 0.83 �0.16AT06 �30.8787 �68.6879 3.40 3.97 1.06 9.57 1.06 �0.12AT10 �30.2893 �68.5464 3.39 2.94 0.51 8.13 0.57 �0.47AT12 �30.2332 �68.4026 3.40 2.04 0.87 8.16 0.95 �0.11AT17 �30.0813 �68.1954 3.38 1.39 1.13 7.16 0.85 �0.43AT20 �30.2610 �68.7820 3.32 1.70 1.86 9.29 0.60 �0.18AT23 �30.2346 �69.0057 3.31 3.48 0.55 11.21 0.65 �0.15AT24 �30.2039 �69.0711 3.53 3.67 1.06 12.48 0.75 �0.33AT25 �30.6447 �69.0763 3.32 2.56 0.55 10.93 0.42 �0.33AT29 �30.8156 �67.5906 3.27 1.02 0.61 7.68 1.00 0.00AT30 �30.1523 �67.9716 3.33 0.93 0.52 5.42 0.57 �0.08AT31 �33.0743 �69.1556 2.99 2.02 1.52 8.46 1.57 0.01AT32 �33.3004 �69.0728 2.93 2.96 0.65 9.95 2.07 0.59AT33 �33.1475 �68.8355 3.01 1.74 1.01 8.30 0.64 �0.46AT35 �33.0619 �68.7961 2.99 0.66 2.20 5.60 1.14 �0.52AT37 �33.0956 �68.7871 3.04 2.29 1.51 6.81 0.85 �0.42AT39 �33.2380 �68.7213 2.98 1.77 1.48 5.54 0.88 �0.53AT40 �33.2408 �68.7387 2.99 2.88 0.38 6.30 0.55 0.11AT41 �33.2561 �68.7861 3.01 2.18 0.92 7.92 0.66 �0.31BDSD �31.6088 �68.6662 4.99 1.15 0.19 11.23 0.21 �0.36CALD �27.0827 �70.8621 6.57 8.42 0.35 25.71 0.35 �0.13CBQA �36.1383 �72.8018 4.07 10.32 1.95 38.75 0.91 �0.75CFAG �31.6022 �68.2326 5.33 0.62 0.05 7.14 0.05 �0.25CHAM �27.2976 �70.4142 4.98 6.63 0.21 20.94 0.19 �0.47CHIG �31.7530 �71.5198 4.05 7.04 0.95 25.24 0.72 �0.42CNGT �31.3744 �69.4162 3.97 3.92 0.28 16.09 0.80 0.55CNST �35.3180 �72.4148 4.10 9.26 1.14 37.18 0.71 �0.27COGO �31.1534 �70.9753 3.78 7.91 1.00 25.43 0.74 �0.03CONA �28.9754 �70.1502 3.77 5.11 0.89 21.27 0.74 �0.54COPO �27.3845 �70.3382 4.67 5.92 0.06 20.91 0.05 �0.32CORR �36.1540 �68.3546 4.69 �0.97 1.34 5.33 0.36 �0.04CPDR �29.6011 �65.5278 7.30 0.85 0.33 3.27 0.64 0.24GNDL �29.4935 �68.4188 3.98 1.20 0.60 8.12 1.17 0.07GRDA �27.7157 �69.5584 3.75 3.98 1.61 19.80 1.08 �0.68GYCN �34.8831 �71.3451 4.07 6.84 0.69 28.00 0.38 �0.92HUAS �28.4785 �71.2223 3.77 7.20 1.16 28.87 0.98 �0.13INCA �26.7459 �69.9128 3.75 5.09 0.34 22.49 0.74 0.14JUNT �29.9791 �70.0939 3.78 6.52 1.66 18.37 1.69 �0.11LOBO �34.4316 �72.0468 4.09 11.53 1.37 31.17 1.35 �0.16MALR �35.7268 �69.5425 4.07 �0.47 1.76 9.33 1.29 �0.37MGCR �31.3088 �67.9268 3.52 1.16 1.00 7.36 0.68 �0.24MORA �30.2082 �70.7897 3.78 8.69 0.78 20.94 0.67 �0.10MORR �33.2689 �65.4767 7.27 �0.29 0.44 2.86 0.41 �0.05MROC �32.9409 �71.5540 4.06 12.28 0.54 28.55 0.33 �0.50NIHL �34.8864 �68.5030 4.06 1.26 3.58 5.05 1.94 �0.54PAGN �30.3228 �69.7499 7.90 5.24 0.73 15.43 1.12 0.13PALO �31.3306 �68.1651 5.47 1.36 0.54 9.80 0.66 �0.05POBR �30.5910 �71.5037 3.82 8.42 1.16 23.34 0.72 �0.53POTR �26.3744 �69.4581 3.75 7.52 0.39 20.18 0.38 �0.46PSNF �26.9319 �68.5988 3.75 8.05 0.37 16.85 0.10 �0.19PSTO �28.1716 �69.7938 3.76 4.61 1.40 19.42 0.65 �0.50QNTA �31.7966 �64.4273 7.24 �0.07 1.24 2.62 1.02 �0.37QPOB �32.4061 �71.2126 6.76 8.32 0.42 22.48 0.62 �0.06RARI �35.7868 �71.3472 4.07 5.53 1.00 29.17 0.28 �0.28RBLS �27.9118 �64.1192 4.98 0.74 0.17 4.31 0.24 �0.06RSTD �33.6335 �71.6350 4.08 10.93 0.31 23.94 0.58 0.31SANT �33.1503 �70.6686 8.18 4.57 0.08 19.31 0.05 �0.33SIFO �34.2367 �70.5474 4.05 7.74 0.28 17.66 0.10 �0.52SILA �29.2404 �70.7496 3.77 4.95 0.48 20.87 0.65 0.19
GeochemistryGeophysicsGeosystems G3G3
brooks et al.: crustal motion in southern andes 10.1029/2003GC000505
4 of 14
applied to, for example, the Tibetan plateau
[England and Molnar, 1997].
[5] Our study area, between 26�S and 36�S(Figure 1), was chosen so that surface velocity
would not be affected by postseismic signals from
either the 1995 Antofagasta earthquake to the
north [Klotz et al., 1999] or the great 1960 Chile
earthquake to the south [Plafker and Savage,
1970]. The region is also of interest because the
subducted Nazca slab undergoes a pronounced
change in dip with which the basement uplifts
of the Sierras Pampeanas range coincide [Jordan
et al., 1983] (Figure 1).
[6] We installed the network of survey (SGPS)
and continuous (CGPS) GPS stations presented
here between 1993 and 1997. SGPS measure-
ments were carried out from 1993 to 2001 in
sessions of at least 40 hours over consecutive
days. Our field, processing, and velocity analysis
methods have been described elsewhere [Bevis et
al., 1997, 2001; Kendrick et al., 2001]. We realize
a craton-fixed frame nominally attached to stable
South America (Figure 1, inset) with an RMS
residual velocity of 1.0 mm/yr. In this reference
frame, Andean velocities are directed eastward
toward the craton (Figure 1). Velocities are largest
(�35 mm/yr) closer to the Nazca boundary and
decline toward the craton with no obvious evi-
dence of strike-slip deformation [Siame et al.,
1997]. Backarc velocity vectors tend to be rotated
clockwise with respect to forearc vectors, a pat-
tern similar to that of the south central Andes
[Bevis et al., 2001]. Notably, the velocity field
shows no obvious or abrupt change in character
associated with the changing dip of the subducted
Nazca plate (Figure 1).
2. Analysis
[7] We analyze the data in a way that simulta-
neously addresses both the short-term ephemeral
deformation related to the earthquake cycle at the
Nazca plate boundary and the residual deformation
field that leads to backarc contraction and long-
term mountain growth. Although we recognize the
utility of continuum models based on a thin viscous
sheet in examining long-term Andean evolution
[Lamb, 2000;Wdowinski et al., 1989], these models
do not consider explicitly the short-term elastic
deformation related to the plate boundary. Thus
we choose to base our analysis on a model that
Table 1. (continued)
Code Lat Long Tspan Vn SigVn Ve SigVe CorNE
TAFI �26.7444 �65.7810 5.50 1.10 2.46 4.33 1.94 �0.36TENO �35.0343 �70.6895 4.09 8.70 0.94 22.15 0.46 �0.08TINO �28.2602 �67.4245 3.98 1.92 1.25 7.97 2.40 �0.09TOFO �29.4594 �71.2384 3.78 7.27 0.87 20.47 0.83 �0.09TOTO �27.8324 �71.0961 3.76 8.77 0.82 26.20 0.59 �0.44TUCU �26.8433 �65.2304 5.26 �1.24 0.06 2.68 0.07 �0.25UPSA �32.6929 �69.3488 7.43 3.04 0.91 10.74 0.76 �0.46
aGPS site velocity is expressed relative to the stable South American plate. Code, station code; Lat, latitude; Long, longitude; Tspan, time span of
measurements in years; Vn, north component of velocity (mm/yr), SigVn, standard error (mm/yr); Ve, east component of velocity (mm/yr); SigVe,standard error (mm/yr), CorNE, north-east correlation.
Table 2. Model Parametersa
Parameter Value
L 1WAS Lat. 56.5�NWAS Lon. 113.9�WWAS W 0.087�/MyrwNS Lat. 61.1�N,wNS Lon. 93.6�WwNS w 0.57�/MyrUpdip extent 10kmDown-dip extent 50kmPoisson’s ratio .25
aParameters used in the modeling. Parameters in bold italics are
solved for in the 3-plate model inversion, other parameters are heldfixed. L, degree of locking on the Nazca boundary; wAS Lat., AS Eulerpole latitude; wAS Lon., AS Euler pole longitude; wAS w, AS Euler poleangular velocity; wNS Lat., NS Euler pole latitude; wNS Lon., NS Eulerpole longitude; wNS w, NS Euler pole angular velocity; updip extent,updip extent of the locked Nazca boundary; down-dip extent, down-dip extent of the locked Nazca boundary; Poisson’s ratio, poisson’sratio used in the elastic dislocation modeling.
GeochemistryGeophysicsGeosystems G3G3
brooks et al.: crustal motion in southern andes 10.1029/2003GC000505
5 of 14
combines elastic half-space deformation due to slip
on embedded discontinuities and the steady motion
of rigid plates on a spherical earth [Bevis et al.,
2001; McCaffrey, 2002].
[8] To best reproduce the smoothly curving geom-
etry of the subduction zone in this �1000 km long
stretch of the Andes we implement our calculations
using triangular dislocation elements in an elastic
half-space [Bevis et al., 2001]. We find that elastic
half-space models driven only by convergence at
the Nazca boundary significantly underpredict
velocity magnitude at all stations from the trench
to the backarc (Figure 2, green vectors). This
observation, combined with the evidence that the
PC fold and thrust belt has accommodated more
than 100 km of shortening during the most
recent phase of Andean orogeny [Allmendinger
et al., 1990; Jordan et al., 1993; Zapata and
Allmendinger, 1996], suggests that a 2-plate
model [Williams and McCaffrey, 2001] may be
oversimplified, and so we add an independent
microplate to the kinematic description of Nazca-
South America convergence.
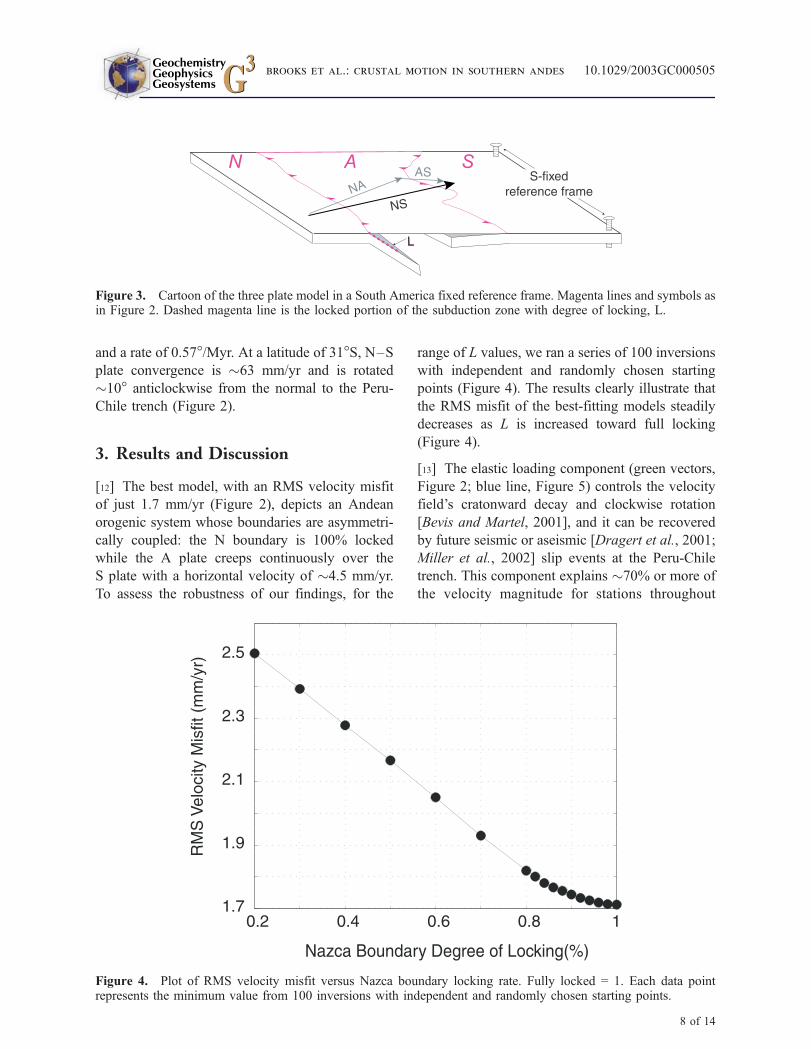
[9] Our preferred analysis employs a 3-plate model
in which an Andean microplate (A) is located
between the Nazca (N) and South America (S)
plates (Figure 3). At timescales large compared
with that of the earthquake cycle, relative plate
motions are steady and can be described using
Euler vectors (w) [Cox and Hart, 1986] subject to
the constraint that wNS = wNA + wAS. We assume
that the A–S boundary creeps continuously at a
constant rate on what we envision as a sub-hori-
zontal decollement rooted at deeper crustal levels
beneath the Andean arc. The only explicit geo-
metrical assumption we make about the A-plate is
that the A–S surface trace is chosen to correspond
with the geologically youngest structures of the
thrust front (Figure 2). Where station spacing is
sparse, the precise location of the surface trace does
not affect the model results. We treat locking of the
Nazca boundary as an elastic perturbation super-
imposed on steady plate convergence [Savage,
1983]. The magnitude of this perturbation, the
elastic loading field, is proportional to the degree
of locking, L, at the N–A boundary. The velocity
field in A is then a combination of elastic loading
and steady A–S plate convergence, whereas in S
all motion is due to elastic loading.
[10] Previous workers have attempted to model
similar data sets by solving for the lower locking
depth on the subduction interface [Klotz et al.,
2001] as well as solving for the down-dip and
along-strike variations in coupling [McCaffrey et
al., 2000]. In preliminary analyses we found that
inclusion of these added components to the model
did not significantly improve model-data misfit
while adding as many as 9 parameters to the
inverse problem. Thus by assuming uniform
along-strike and down-dip coupling and a lower
locking depth of 50km we are able to describe our
3 plate model with only 4 parameters (L and the
3 parameters describing the euler vector, wAS).
[11] We find the best-fitting velocity model by
repeatedly selecting L and wAS, calculating wNA,
and minimizing misfit with an L1 norm using a
Nelder-Mead simplex algorithm. In order to do this
we must adopt a value for wNS. We [Kendrick et
al., 2003] and others [Angermann et al., 1999;
Norabuena et al., 1999] have used GPS velocities
to find the modern Euler vector describing N–S
plate convergence. These studies find convergence
velocities significantly slower than the geologically
averaged value predicted by the Nuvel �1A plate
model [DeMets et al., 1994]; thus, we choose to
adopt a modern value as opposed to the other
approaches [Ruegg et al., 2002]. We use our
estimate for wNS with a pole at 61.1�N, 93.6�W
Figure 2. (opposite) GPS velocity field with best 3-plate model (red vectors) and 2-plate model (green vectors)superimposed on Andean topography. Magenta lines denote the western and eastern boundaries of the proposed‘Andean’ plate, with the hachures on the overthrusting plate (see Figure 3 for a description of the 3-plate model).White triangles are the dislocation elements used in the elastic portion of the model with the upper (�10 km) andlower (�50 km) boundaries constrained by earthquake catalogs [Cahill and Isacks, 1992]. Bold black angle markscontain the yellow stations in the velocity profile which is denoted by the black dashed line (Figure 5).A-A’ and B-B’are the geologic cross-sections in Figure 7. All other annotation as in Figure 1.
GeochemistryGeophysicsGeosystems G3G3
brooks et al.: crustal motion in southern andes 10.1029/2003GC000505
6 of 14
GeochemistryGeophysicsGeosystems G3G3
brooks et al.: crustal motion in southern andes 10.1029/2003GC000505
7 of 14
and a rate of 0.57�/Myr. At a latitude of 31�S, N–S
plate convergence is �63 mm/yr and is rotated
�10� anticlockwise from the normal to the Peru-
Chile trench (Figure 2).
3. Results and Discussion
[12] The best model, with an RMS velocity misfit
of just 1.7 mm/yr (Figure 2), depicts an Andean
orogenic system whose boundaries are asymmetri-
cally coupled: the N boundary is 100% locked
while the A plate creeps continuously over the
S plate with a horizontal velocity of �4.5 mm/yr.
To assess the robustness of our findings, for the
range of L values, we ran a series of 100 inversions
with independent and randomly chosen starting
points (Figure 4). The results clearly illustrate that
the RMS misfit of the best-fitting models steadily
decreases as L is increased toward full locking
(Figure 4).
[13] The elastic loading component (green vectors,
Figure 2; blue line, Figure 5) controls the velocity
field’s cratonward decay and clockwise rotation
[Bevis and Martel, 2001], and it can be recovered
by future seismic or aseismic [Dragert et al., 2001;
Miller et al., 2002] slip events at the Peru-Chile
trench. This component explains �70% or more of
the velocity magnitude for stations throughout
Figure 3. Cartoon of the three plate model in a South America fixed reference frame. Magenta lines and symbols asin Figure 2. Dashed magenta line is the locked portion of the subduction zone with degree of locking, L.
Figure 4. Plot of RMS velocity misfit versus Nazca boundary locking rate. Fully locked = 1. Each data pointrepresents the minimum value from 100 inversions with independent and randomly chosen starting points.
GeochemistryGeophysicsGeosystems G3G3
brooks et al.: crustal motion in southern andes 10.1029/2003GC000505
8 of 14
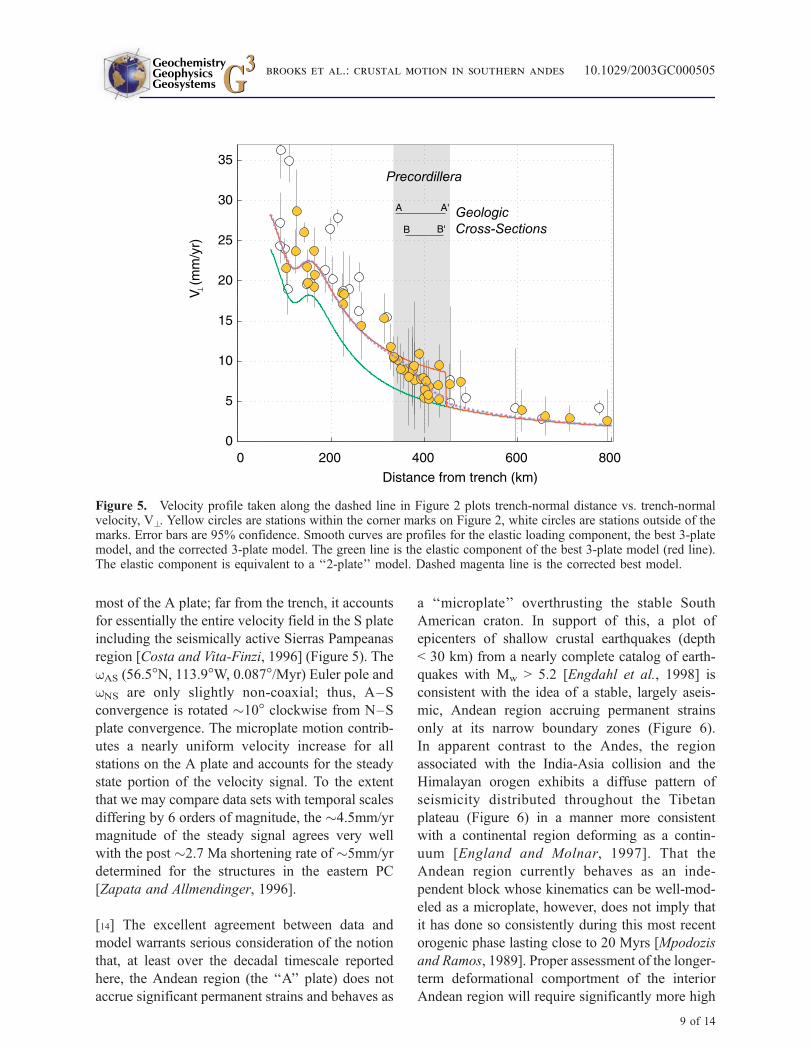
most of the A plate; far from the trench, it accounts
for essentially the entire velocity field in the S plate
including the seismically active Sierras Pampeanas
region [Costa and Vita-Finzi, 1996] (Figure 5). The
wAS (56.5�N, 113.9�W, 0.087�/Myr) Euler pole and
wNS are only slightly non-coaxial; thus, A–S
convergence is rotated �10� clockwise from N–S
plate convergence. The microplate motion contrib-
utes a nearly uniform velocity increase for all
stations on the A plate and accounts for the steady
state portion of the velocity signal. To the extent
that we may compare data sets with temporal scales
differing by 6 orders of magnitude, the �4.5mm/yr
magnitude of the steady signal agrees very well
with the post �2.7 Ma shortening rate of �5mm/yr
determined for the structures in the eastern PC
[Zapata and Allmendinger, 1996].
[14] The excellent agreement between data and
model warrants serious consideration of the notion
that, at least over the decadal timescale reported
here, the Andean region (the ‘‘A’’ plate) does not
accrue significant permanent strains and behaves as
a ‘‘microplate’’ overthrusting the stable South
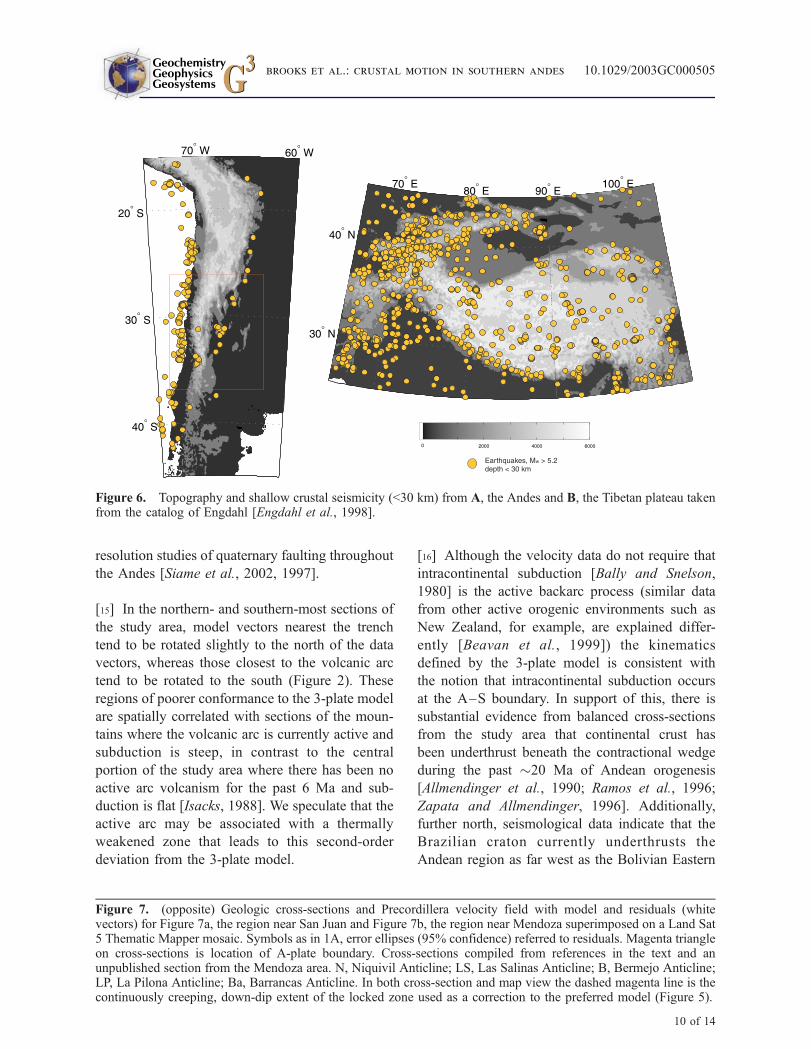
American craton. In support of this, a plot of
epicenters of shallow crustal earthquakes (depth
< 30 km) from a nearly complete catalog of earth-
quakes with Mw > 5.2 [Engdahl et al., 1998] is
consistent with the idea of a stable, largely aseis-
mic, Andean region accruing permanent strains
only at its narrow boundary zones (Figure 6).
In apparent contrast to the Andes, the region
associated with the India-Asia collision and the
Himalayan orogen exhibits a diffuse pattern of
seismicity distributed throughout the Tibetan
plateau (Figure 6) in a manner more consistent
with a continental region deforming as a contin-
uum [England and Molnar, 1997]. That the
Andean region currently behaves as an inde-
pendent block whose kinematics can be well-mod-
eled as a microplate, however, does not imply that
it has done so consistently during this most recent
orogenic phase lasting close to 20 Myrs [Mpodozis
and Ramos, 1989]. Proper assessment of the longer-
term deformational comportment of the interior
Andean region will require significantly more high
Figure 5. Velocity profile taken along the dashed line in Figure 2 plots trench-normal distance vs. trench-normalvelocity, V?. Yellow circles are stations within the corner marks on Figure 2, white circles are stations outside of themarks. Error bars are 95% confidence. Smooth curves are profiles for the elastic loading component, the best 3-platemodel, and the corrected 3-plate model. The green line is the elastic component of the best 3-plate model (red line).The elastic component is equivalent to a ‘‘2-plate’’ model. Dashed magenta line is the corrected best model.
GeochemistryGeophysicsGeosystems G3G3
brooks et al.: crustal motion in southern andes 10.1029/2003GC000505
9 of 14
resolution studies of quaternary faulting throughout
the Andes [Siame et al., 2002, 1997].
[15] In the northern- and southern-most sections of
the study area, model vectors nearest the trench
tend to be rotated slightly to the north of the data
vectors, whereas those closest to the volcanic arc
tend to be rotated to the south (Figure 2). These
regions of poorer conformance to the 3-plate model
are spatially correlated with sections of the moun-
tains where the volcanic arc is currently active and
subduction is steep, in contrast to the central
portion of the study area where there has been no
active arc volcanism for the past 6 Ma and sub-
duction is flat [Isacks, 1988]. We speculate that the
active arc may be associated with a thermally
weakened zone that leads to this second-order
deviation from the 3-plate model.
[16] Although the velocity data do not require that
intracontinental subduction [Bally and Snelson,
1980] is the active backarc process (similar data
from other active orogenic environments such as
New Zealand, for example, are explained differ-
ently [Beavan et al., 1999]) the kinematics
defined by the 3-plate model is consistent with
the notion that intracontinental subduction occurs
at the A–S boundary. In support of this, there is
substantial evidence from balanced cross-sections
from the study area that continental crust has
been underthrust beneath the contractional wedge
during the past �20 Ma of Andean orogenesis
[Allmendinger et al., 1990; Ramos et al., 1996;
Zapata and Allmendinger, 1996]. Additionally,
further north, seismological data indicate that the
Brazilian craton currently underthrusts the
Andean region as far west as the Bolivian Eastern
Figure 6. Topography and shallow crustal seismicity (<30 km) from A, the Andes and B, the Tibetan plateau takenfrom the catalog of Engdahl [Engdahl et al., 1998].
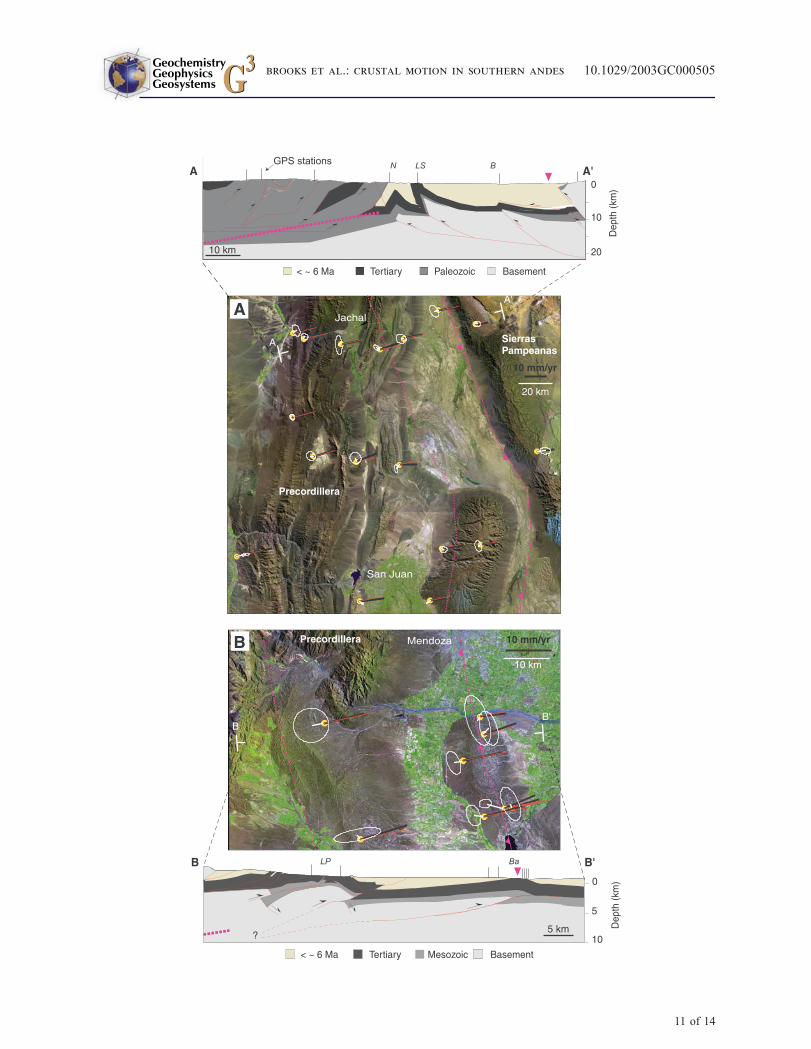
Figure 7. (opposite) Geologic cross-sections and Precordillera velocity field with model and residuals (whitevectors) for Figure 7a, the region near San Juan and Figure 7b, the region near Mendoza superimposed on a Land Sat5 Thematic Mapper mosaic. Symbols as in 1A, error ellipses (95% confidence) referred to residuals. Magenta triangleon cross-sections is location of A-plate boundary. Cross-sections compiled from references in the text and anunpublished section from the Mendoza area. N, Niquivil Anticline; LS, Las Salinas Anticline; B, Bermejo Anticline;LP, La Pilona Anticline; Ba, Barrancas Anticline. In both cross-section and map view the dashed magenta line is thecontinuously creeping, down-dip extent of the locked zone used as a correction to the preferred model (Figure 5).
GeochemistryGeophysicsGeosystems G3G3
brooks et al.: crustal motion in southern andes 10.1029/2003GC000505
10 of 14
GeochemistryGeophysicsGeosystems G3G3
brooks et al.: crustal motion in southern andes 10.1029/2003GC000505
11 of 14
Cordillera [Beck and Zandt, 2002]. We do not,
however, intend to suggest that intracontinental
subduction has progressed to the point that
continental material is being subducted into the
mantle beneath the Andean arc - a process that
may or may not be physically unlikely [Molnar
and Gray, 1979].
[17] Our analysis places strong constraint on the
mechanical behavior of the backarc contractional
wedge by demonstrating that permanent deforma-
tion is currently accommodated at the front of the
PC fold and thrust belt and not distributed
throughout its width. This is consistent with
the narrow band of seismicity described above
(Figure 6) and also with post-20 Ma geological
reconstructions demonstrating eastward migration
of the PC through active deformation near its tip
[Jordan et al., 1993; Zapata and Allmendinger,
1996]. In the context of an orogenic wedge
whose kinematics are forced by the competition
between tectonics and erosion [Dahlen and
Suppe, 1988], it is also illustrative to consider
mountain belt scale geomorphic indices demon-
strating that the eastern margin of the Andes
between �17� and 36�S is a regime of relatively
low erosional intensity [Montgomery et al.,
2001]. The combined geodetic, geologic, and
geomorphic analyses suggest that the PC has
not attained a steady state balance of erosion
and tectonics, but rather, that it continually
widens through accretion of new material at its
toe.
[18] Our modeling is carried out at the plate
tectonic scale and is not intended to be precise at
the scale of individual structures. For instance,
though the model provides an excellent fit to the
data as a whole, residual examination demon-
strates a small, but systematic velocity overpre-
diction near the A–S boundary (Figures 2 and 7).
The spatial coherence suggests this signal is
significant, albeit second-order, even though indi-
vidual residual vectors are rarely larger than their
associated uncertainty. We can account for this
anomaly by modifying our model: we assume that
the A–S boundary dips westward at 10� and is
locked from its tip to a down-dip length of
�50km (Figure 7). (Here, we model backarc
locking using the backslip formalism in the same
way as at the Nazca boundary.) This simple (and
probably non-unique) correction is sufficient
throughout the PC despite the fact that the struc-
tures comprising the locked zone differ in the
north and south [Brooks et al., 2000; Jordan
et al., 1993; Zapata and Allmendinger, 1996]
(Figure 7). In the north, the west-vergent Niquivil,
Las Salinas, and Bermejo anticlines comprise the
locked zone and the Sierra de Valle Fertil thrust
fault, the westernmost expression of the Sierras
Pampeanas basement uplifts, abuts the A–S
boundary (Figure 7a). In the south, the zone is
composed of only two, east-vergent structures, the
La Pilona and Barrancas anticlines, and the thrust
front is separated from the westernmost expression
of the Sierras Pampeanas by �200 km of unde-
formed foreland basin strata (Figure 7d). Discern-
ing the details of deformation in the frontal zone,
such as activity, strain accumulation, and seismic
hazard of individual structures, will require finer
velocity resolution through longer measurement
time spans.
[19] That we find the decollement below the
A-plate to be continuously creeping does not imply
that it is ‘‘freely’’ slipping in the sense that it is
shear traction-free. On the contrary, we envision
this boundary to be viscously coupled, a configu-
ration that allows both continuous motion and
stress transmission across the boundary. Thus we
speculate that transmission of stresses across the
fully locked oceanic subduction boundary drives
microplate motion and deformation at the intra-
continental boundary. If the stress drop associ-
ated with major subduction earthquakes is small
compared to the failure stress, then creep at the
A–S boundary should vary only slightly during
the earthquake deformation cycle at the Nazca
boundary.
Acknowledgments
[20] Funding provided by NSF grants EAR-9115576 and
EAR-9615393. We thank R. Allmendinger and C. Wolfe for
previous reviews of this paper. We especially acknowledge
Fernando Galban of IGM Argentina for his continuing support
and collaboration. We gratefully acknowledge the many peo-
GeochemistryGeophysicsGeosystems G3G3
brooks et al.: crustal motion in southern andes 10.1029/2003GC000505
12 of 14
ple whose collaboration in the field made this project possible.
These include but are not limited to: A. A. Garcia, B. Knight,
R. Barriga, H. Parra, W. Rubio, P. Gallardo, J. Baron,
M. Blanco, P. Euillades, L. Euillades, V. Bonfils, G. Cabrera,
C. Gardini, J. Argento, S. Bea, J. Yu, M. Burns, M. Patrick,
and F. Forconesi. This is SOEST contribution 6174 and CERI
contribution 473.
References
Allmendinger, R., D. Figueroa, D. Snyder, J. Beer, C.Mpodozis,
and B. L. Isacks, Foreland shortening and crustal balan-
cing in the Andes at 30�S latitude, Tectonics, 9, 789–809,
1990.
Angermann, D., J. Klotz, and C. Reigber, Space-geodetic
estimation of the Nazca-South America Euler vector, Earth
Planet. Sci. Lett., 171, 329–334, 1999.
Bally, A. W., and S. Snelson, Realms of subsidence, in Facts
and Principles of World Oil Occurrence, vol. 6, edited by
A. D. Miall, pp. 9–75, Can. Soc. of Petrol. Geol.,Calgory, 1980.
Barazangi, M., and B. Isacks, Spatial distribution of earth-
quakes and subduction of the Nazca plate beneath South
America, Geology, 4, 686–692, 1976.
Beavan, J., et al., Crustal deformation during 1994–1998 due
to oblique continental collision in the central Southern Alps,
New Zealand, and implications for seismic potential of the
Alpine Fault, J. Geophys. Res., 104, 25,233–25,255, 1999.
Beck, S. L., and G. Zandt, The nature of orogenic crust in the
central Andes, J. Geophys. Res., 107(B10), 2230,
doi:10.1029/2000JB000124, 2002.
Bevis, M., and S. Martel, Oblique plate convergence and inter-
seismic strain accumulation, Geochem. Geophys. Geosyst.,
2, Paper number 2000GC000125, 2001.
Bevis, M., Y. Bock, P. Fang, R. Reilinger, T. Herring,
J.Stowell, andR.SmalleyJr.,Blendingoldandnewapproaches
to regional geodesy, Eos Trans. AGU, 78, 61, 64–66, 1997.
Bevis, M., E. Kendrick, R. Smalley Jr., B. A. Brooks, R. W.
Allmendinger, and B. L. Isacks, On the strength of inter-
plate coupling and the rate of back arc convergence in the
central Andes: An analysis of the interseismic velocity field,
Geochem. Geophys. Geosyst., 2, 10.129/2001GC000198,
2001.
Brooks, B. A., E. Sandvol, and A. Ross, Fold style inversion:
Placing probabilistic constraints on the predicted shape of
blind thrust faults, J. Geophys. Res., 105, 13,281–13,302,
2000.
Cahill, T., and B. L. Isacks, Seismicity and shape of the sub-
ducted Nazca plate, J. Geophys. Res., 97, 17,503–17,529,
1992.
Costa, C. H., and C. Vita-Finzi, Late Holocene faulting in the
southeast Sierras Pampeanas of Argentina, Geology, 24,
1127–1130, 1996.
Cox, A., and R. B. Hart, Plate Tectonics How it Works, 392 pp.,
Blackwell Sci., Cambridge, Mass., 1986.
Dahlen, F. A., and J. Suppe, Mechanics, growth, and erosion of
mountain belts, Spec. Pap. Geol. Soc. Am., 218, 161–178,
1988.
DeMets, C., R. G. Gordon, D. F. Argus, and S. Stein, Effect of
recent revisions to the geomagnetic reversal time scale on
estimates of current plate motions, Geophys. Res. Lett., 21,
2191–2194, 1994.
Dragert, H., K. Wang, and T. S. James, A silent slip event on
the deeper Cascadia subduction interface, Science, 292,
1525–1528, 2001.
Engdahl, E. R., R. D. van der Hilst, and R. P. Buland, Global
teleseismic earthquake relocation with improved travel times
and procedures for depth determination, Bull. Seismol. Soc.
Am., 88, 722–743, 1998.
England, P., and D. McKenzie, A thin viscous sheet model for
continental deformation, Geophys. J. R. Astron. Soc., 70,
295–321, 1982.
England, P., and P. Molnar, Active deformation of Asia; from
kinematics to dynamics, Science, 278, 647–650, 1997.
Isacks, B. L., Uplift of the Central Andean Plateau and Bend-
ing of the Bolivian Orocline, J. Geophys. Res., 93, 3211–
3231, 1988.
Jordan, T. E., B. L. Isacks, R. W. Allmendinger, J. A. Brewer,
V. Ramos, and C. J. Ando, Andean tectonics related to geo-
metry of subducted Nazca plate, Geol. Soc. Am. Bull., 94,
341–361, 1983.
Jordan, T. E., R. W. Allmendinger, J. F. Damanti, and R. E.
Drake, Chronology of motion in a complete thrust belt: The
Precordillera, 30–31�S, Andes Mountains, J. Geol., 101,
135–156, 1993.
Kendrick, E., M. G. Bevis, R. Smalley Jr., and B. A. Brooks,
An integrated crustal velocity field for the central Andes,
Geochem. Geophys. Geosyst., 2, 10.1029/2001GC000191,
2001.
Kendrick, E., M. Bevis, R. Smalley Jr., B. Brooks, R. B.
Vargas, E. Laurıa, and L. P. S. Fortes, The Nazca-South
America Euler Vector and its Rate of Change, J. South
Am. Earth Sci., in press, 2003.
Kley, J., and C. R. Monaldi, Tectonic shortening and crustal
thickness in the Central Andes: How good is the correlation,
Geology, 26, 723–726, 1998.
Klotz, J., et al., GPS-derived Deformation of the Central Andes
Including the 1995 Antofagasta Mw = 8.0 Earthquake, Pure
Appl. Geophys., 154, 709–730, 1999.
Klotz, J., G. Khazaradze, D. Angermann, C. Reigber,
R. Perdomo, and O. Cifuentes, Earthquake cycle dominates
contemporary crustal deformation in Central and Southern
Andes, Earth Planet. Sci. Lett., 193, 437–446, 2001.
Lamb, S., Active deformation in the Bolivian Andes, South
America, J. Geophys. Res., 105, 25,627–25,653, 2000.
McCaffrey, R., Crustal block rotations and plate coupling, in
Plate Boundary Zones, Geodyn. Ser., vol. 30, edited byS. Stein and J. T. Freymueller, pp. 101–122, AGU,Washington, D.C., 2002.
McCaffrey, R., M. D. Long, C. Goldfinger, P. C. Zwick, J. L.
Nabelek, C. K. Johnson, and C. Smith, Rotation and plate
locking at the southern Cascadia subduction zone, Geophys.
Res. Lett., 27, 3117–3120, 2000.
Miller, M. M., T. Melbourne, D. J. Johnson, and W. Q.
Sumner, Periodic slow earthquakes from the Cascadia
Subduction Zone, Science, 295, 2423, 2002.
GeochemistryGeophysicsGeosystems G3G3
brooks et al.: crustal motion in southern andes 10.1029/2003GC000505
13 of 14
Molnar, P., and D. Gray, Subduction of continental litho-
sphere: Some constraints and uncertainties, Geology, 7,
58–62, 1979.
Montgomery, D. R., G. Balco, and S. D. Willett, Climate,
tectonics, and the morphology of the Andes, Geology, 29,
579–582, 2001.
Mpodozis, C., and V. Ramos, The Andes of Chile and
Argentina, in Geology of the Andes and its Relation to
Hydrocarbon and Mineral Resources, Earth Sci. Ser.,
edited by G. E. Ericksen et al., pp. 59–90, Circum-Pacific
Council for Energy and Mineral Resources, Menlo Park,
Calif., 1989.
Norabuena, E. O., T. H. Dixon, S. Stein, and C. G. A.
Harrison, Decelerating Nazca-South America and Nazca-
Pacific plate motions, Geophys. Res. Lett., 26, 3405–
3408, 1999.
Plafker, G., and J. C. Savage, Mechanism of the Chilean earth-
quake of May 21 and 22, 1960, Geol. Soc. Am. Bull., 81,
1001–1030, 1970.
Ramos, V. A., M. Cegarra, and E. Cristallini, Cenozoic tec-
tonics of the High Andes of west-central Argentina (30–36�latitude), Tectonophysics, 259, 185–200, 1996.
Ruegg, J. C., J. Campos, R. Madariaga, E. Kausel, J. B.
de Chabalier, R. Armijo, D. Dimitriv, I. Georgiev, and
S. Barrientos, Interseismic strain accumulation in south
central Chile from GPS measurements, 1996–1999, Geo-
phys. Res. Lett., 29, 1517, 2002.
Savage, J. C., A dislocation model of strain accumulation and
release at a subduction zone, J. Geophys. Res., 88, 4984–
4996, 1983.
Siame, L. L., D. L. Bourles, M. Sebrier, O. Bellier, J. C.
Castano, M. Araujo, M. Perez, G. M. Raisbeck, and F. Yiou,
Cosmogenic dating ranging from 20 to 700 ka of a series of
alluvial fan surfaces affected by the El Tigre fault, Argentina,
Geology, 25, 975–978, 1997.
Siame, L. L., O. Bellier, M. Sebrier, D. L. Bourles, P. Leturmy,
and M. Perez, Seismic hazard reappraisal from combined
structural geology, geomorphology and cosmic ray exposure
dating analyses: The Eastern Precordillera thrust system
(NW Argentina), Geophys. J. Int., 150, 241–260, 2002.
Thatcher, W. R., Microplate versus continuum descriptions of
active tectonic deformation: J. Geophys. Res., 100, 3885–
3894, 1995.
Wdowinski, S., R. J. O’Connell, and P. England, A continuum
model of continental deformation above subduction zones;
application to the Andes and the Aegean, J. Geophys. Res.,
94, 10,331–10,346, 1989.
Williams, C., and R. McCaffrey, Stress rates in the central
Cascadia subduction zone inferred from an elastic platemodel,
Geophys.Res.Lett.,28, 2125–2128, 2001.
Zapata, T. R., and R. W. Allmendinger, Growth stratal records
of instantaneous and progressive limb rotation in the Precor-
dillera thrust belt and Bermejo basin, Argentina, Tectonics,
15, 1065–1083, 1996.
GeochemistryGeophysicsGeosystems G3G3
brooks et al.: crustal motion in southern andes 10.1029/2003GC000505
14 of 14