crsp book of posters fall 2019 - city tech
TRANSCRIPT
The Ethical Implications of Bioengineering Advancements, Mainstream Media Coverage of those Developments, and the Future of Motherhood
Aliff Abad1 and Katherine Gregory, PhD2
1Department of Restorative Dentistry 2Department of Health Sciences New York City College of Technology/CUNY
Abstract
How do the media interpret reproductive interventions that involve genetic testing? When a scientist performed the first known genetic editing on twins, Lulu and Nana, he ignored ethical considerations of CRISPR use. This project provides a content analysis based on a review of popular science and newspaper articles. Our interpretation of these articles suggest that there is a lack of critical understanding of this unethical procedure and a similar attitude towards future genetic developments. While the public is curious about the repercussions of genetic editing, not enough focus is applied to the ethics of conducting such a procedure.
Materials and Methods
• Vigorous online search on databases from scholars
• Read articles
• Decoded information provided by scholars
• Searched for reliable and accredited works
• Online research and search engines utilized
• Created timelines
• Brainstormed
Literature Cited
Brock, D. W. (1995). The Non-Identity Problem And Genetic Harms – The
Case of Wrongful Handicaps. Bioethics, 9(3), 269–275. doi: 10.1111/j.1467-
8519.1995.tb00361.x
Gregory, K. (2018). Online Communication Settings and the Qualitative
Research Process: Acclimating Students and Novice
Researchers. Qualitative Health Research, 28(10), 1610–1620. doi:
10.1177/1049732318776625
Heath, D., Rapp , R., & Sue-Taussig , K. (2001). Genealogical Dis-
Ease. Relativ Values, 384–409. doi: 10.1215/9780822383222-015
Lanzeni, D., Pink, S. (2018). Future Anthropology Ethics and Datafication: Temporality and
Responsibility in Research. Social Media Society, 4(2), 205630511876829.
doi:10.1177/2056305118768298
Reardon, J., & Tallbear, K. (2012). “Your DNA Is Our
History.” Current Anthropology, 53(S5). doi: 10.1086/662629
Saukko, P. (2017). Shifting metaphors in direct-to-consumer genetic testing: from genes
as information to genes as big data. New Genetics and Society, 36(3), 296–313.
doi:10.1080/14636778.2017.1354691
Results
As a result, our findings indicate it is unclear why there
hasn’t been a greater pool of people speaking on these
unethical practices. Gene editing is not analogous to
changing the taste, size and shape of a salmon fish. We
are addressing the alteration of the biologicals of a
human, specifically without a mother’s consent. What
will happen in the future? Why hasn’t there been any
mainstream media coverage on these unethical
practices? Our research shows that we, as humanists,
need to be more aware of what happens regarding our
pregnancies. Is it fair that our rights as patients require
that we search deeper to find critical information on
such a sensitive topic? As a result, there is little to no
information about the unethical practices of scientists
and medical providers in regards to their ethical
practices when in comes to our bodies. It is not
publicly known what practices are taking place in
laboratories experimenting with our human bodies,
tissue, or DNA for research purposes, and it doesn’t seem like it will come to light anytime soon.
Conclusion
In conclusion, it was evident that the public is
uninformed about the unethicality's of professionals
involved in the developments of gene editing. This is a
very sensitive subject and not something that seems
will be brought to light anytime soon. We as humans
should be aware that acts of unethical behavior are
happening without our consent when it comes to
genetic engineering. Whether it be for the good of
humanity or with the best of intentions, the public
needs to take proper precautions. When one alters the
future the result can be irreversible. Consequently,
alteration of biology can lead to unimaginable results,
for example concluding to human classification and
separation. Further Information
Could genetically modified embryos result in
something more chaotic than what we can handle? This
topic is relatively new and there is a limited amount of
critical research available for review. We don’t know
what can arise of this nonconsensual practice. Counter
arguments suggest this type information will inevitably
violate HIPAA patient privacy regulations and health
access in the case of DNA databases; or in the case of
prenatal diagnosis during a pregnancy, it could lead to
discriminatory actions if a genetic disease has been
passed on from parent to fetus. Genetic counselors are
now deployed as part of this process of understanding
and decision-making upon discovery of inherited
markers (Armstrong, 1998).
Acknowledgements ...
CUNY Research Scholar Program (CRSP) C-STEP
Support for this project was provided by a PSC-CUNY Award, jointly funded
by The Professional Staff Congress and The City University of New York.

Self-Driving Toy Car Using Deep Learning Researcher: Fahim Ahmed, Suleyman Turac, Mubtasem Ali
Mentor: Dr. Benito Mendoza Department of Computer Engineering Technology, New York City College of Technology, CUNY
Abstract
Our research focuses on building a student affordable platform for scale model self-driving cars. The goal of this project is to explore current developments of Open Source hardware and software to build a low-cost platform consisting of the car chassis/framework, sensors, and software for the autopilot. Our research will allow other students with low budget to enter into the world of Deep Learning, self-driving cars, and autonomous cars racing competitions.
Introduction
Self-driving car technology is one of the hottest areas of research and business. In the last few years, we have seen an enormous evolution in this area with autonomous cars from Uber, Tesla, Waymo. Artificial Intelligence, in particular Machine Learning and Deep Learning, has contributed to developing the latest generation of algorithms for the essential elements in the self-driving pipeline Localization, Perception, Prediction, Planning, and Control. Moreover, in recent years, an evolving sport of racing autonomous, electrically powered vehicles has emerged. These type of racing competitions such as Roborace are exciting and lucrative attractions that also worked as platforms for research and development for tech companies.
Background
Roborace's expensive high tech vehicles are out of reach for an average student. The alternatives are Amazon Deepracer & Donkeycar; a 1/18th and 1/10th scale model autonomous racing cars. These platforms provide developers with the opportunity to explore advanced AI techniques used on real self-driving cars. However, the cost of the hardware goes from $300 to $400. Our goal is to make cheaper and novice friendly version to make the process more streamlined for new users of donkeycar.
Materials & Method
To build the self driving car we used the following:
Hardware: • Raspberry Pi 3B+ / NVIDIA Jetson Nano • Raspberry Pi Camera V.2 • PCA 9685 Servo • 3D printed hat & chassis • 4 channel ESP • NiMh 7.4V battery • DC 5V battery
Software: • Donkey Pi • Donkey auto pilot. • Tensorflow and Keras to train
Results
• Our model is capable of taking commands through local host.
• After the first run, the successful autopilot rate is 68%- 96%.
• While in autopilot mode, it can capture video at 30 frames per second @720p.
Conclusions
Our hardware and motor modifications already cut the cost to half of an actual donkey car. We are exploring JetBot as well, which is made by NVIDIA. Our goal is to make an understandable & simple version of self driving CityTech Race Car with a lower cost.
Future Work
• Voice control will be added • Advanced hardware modification to achieve at
least 40 mph speed. • 3D printed body & upgraded chassis to
maintain light weight. • New simple software for training AutoPilot. • CityTech Race Car and CityTech Race League
Acknowledgement
• Undergraduate Research Program • CUNY Research Scholars Program (CRSP)
References
• https://sergioskar.github.io/Self_driving_cars/ • https://www.donkeycar.com/ • https://en.wikipedia.org/wiki/Autonomous_rac
ing • https://roborace.com/ • http://f1tenth.org/build.html • https://aws.amazon.com/deepracer/

Roboqueen 3DAuthors: Jensy Maldonado and Anny Baez - Mentor: Professor Farrukh Zia
Computer Engineering Technology Department
Roboqueen is a persistent research project in the Computer Engineering Technology Department. It is being designed as a full body interactive robotic mannequin in response to the needs of the fashion technology industry. The Roboqueen’s hardware circuits and components will be improved and updated with the help of 3D printed electronic, embedded circuits and sensors. These custom 3D printed devices and circuits will be used to add functionality and features to the Roboqueen project. Thus, a challenge is proposed to use MATLAB, to study forward and inverse kinematic equations and their solutions in 3D, to control the body movements. Furthermore with the upgraded hardware the movements of the robot are more fluent compared to the previous version.
INTRODUCTIONThere are two aspects of the project; hardware and software. The 3D body profile is designed using cardboard segments and 3D CAD tools to image a human body. The voice synthesis and recognition that’s synced with the bar graph lips and RGB LED based eyes helped attained this purpose. Besides, we are using Blynk to control the head and arm movement in a synchronized way based on kinematic calculations.
REFERENCESInstructables. “Robotic Claw Business Card.” Instructables
Workshops, Instructables, 1 Nov. 2017,
www.instructables.com/id/Robotic-claw-business-card/.
ACKNOWLEDGEMENTSEmerging Scholars Program 2019
CUNY Research Scholars Program 2019
CONCLUSION & FUTURE WORK
The advances that have been implemented and improved in terms of movement the mounting frame of the servomotor, open up the possibilities of future improvements that can be implemented not only for Roboqueen but also for other projects involving the servomotors. In addition, improvements will be made in speech synchronization with communication with arm and head movements.
HARDWARE & PARTS LISTThe hardware for this project includes extruded aluminum frame and 3D laser cut cardboard body, two microcontrollers (Arduino and Raspberry Pi), 8 servo motors, USB microphone, probe sensor, audio amplifier and speakers. Two RGB LEDs for the eyes, LED for the lips and AC / DC power supplies are also used.
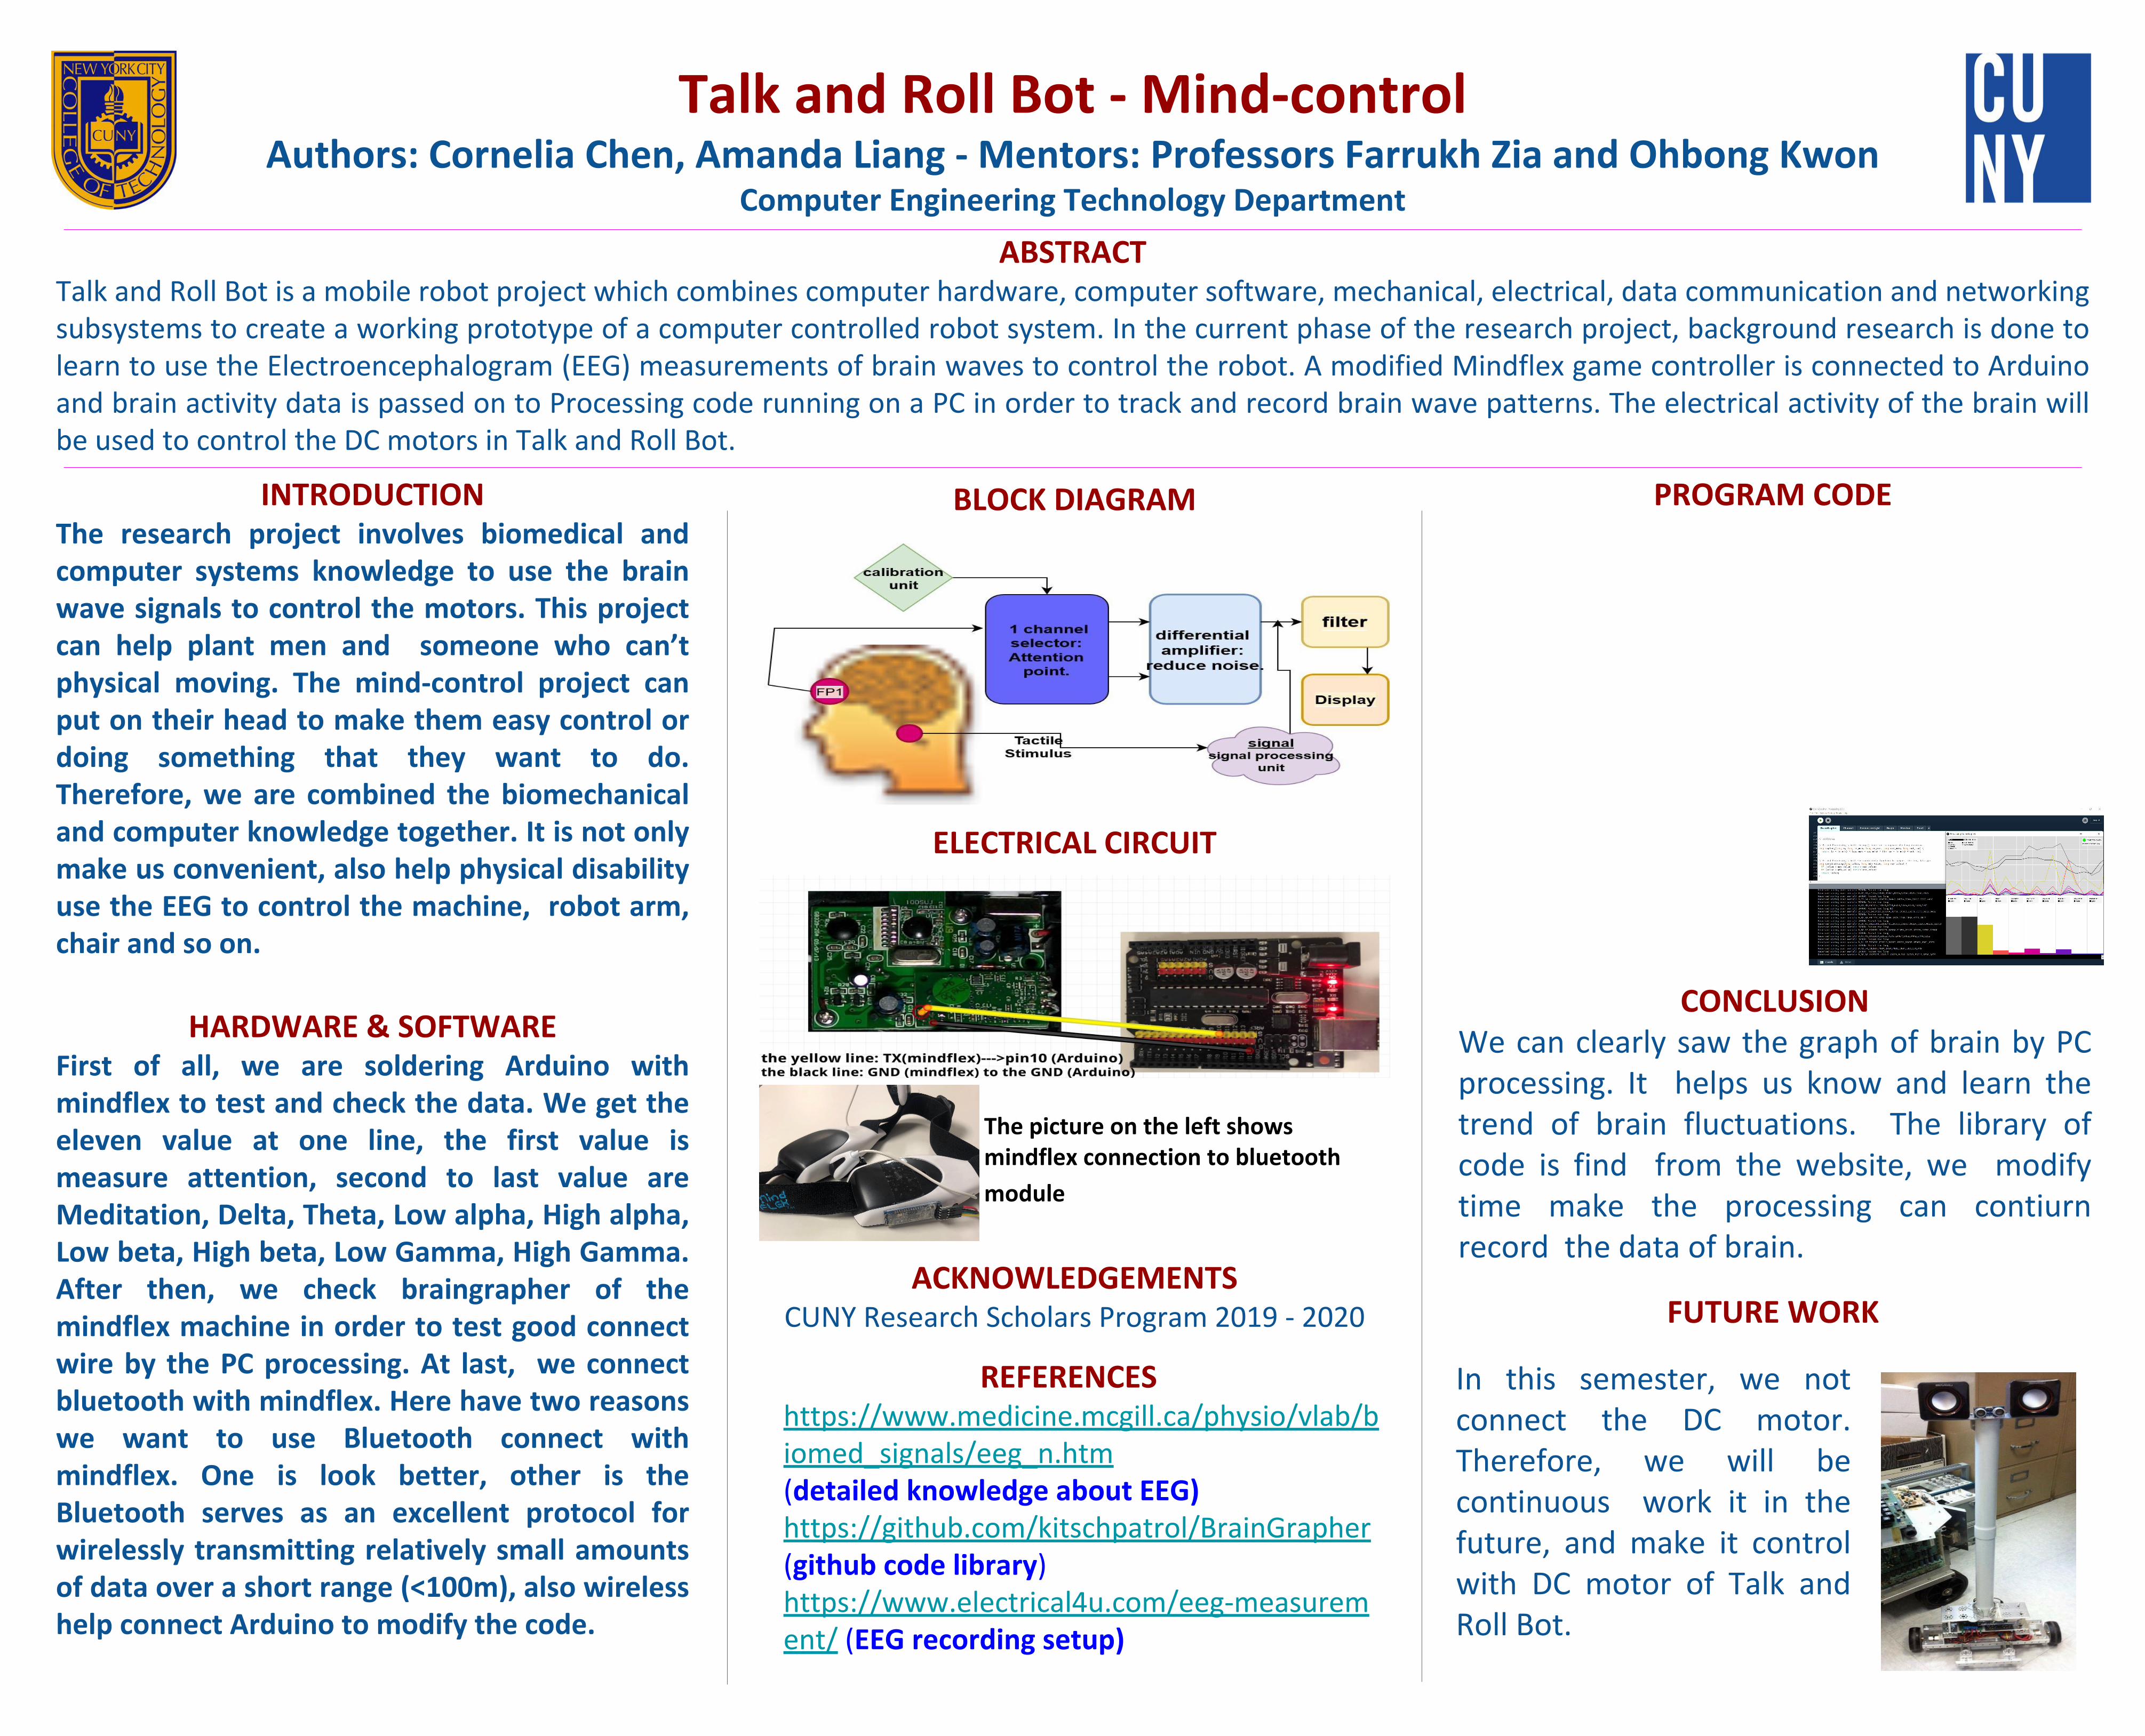
ELECTRICAL CIRCUIT
PROGRAM CODEBLOCK DIAGRAMThe diagram below displays a detailed chart of the electrical circuit built on Roboqueen. The code shown to
the right shows a simulation run in MATLAB. This simulation helps us discover the angles needed to move the arms in 3D dimensions (X, Y, and Z Axis).

3D Printed Computer CircuitsAuthor: Sultana Begum - Mentors: Professors Ohbong Kwon & Farrukh Zia
Computer Engineering Technology Department
ABSTRACT3D printing technology has rapidly become a mature technology due to the availability of low cost 3D printers based on open source designs and components. A wide variety of 3D print materials are now available with many different physical and electrical properties. This ongoing research project explores novel and innovative ways to use 3D printing technology to create electronic computer circuits, sub-systems and devices by using a combination of conducting and non-conducting materials and components. The 3D printed computer circuits will have a range of applications in creating systems such as IoT (Internet of Things) devices, miniature robots, bio-sensors, wearable tech garments and electronic jewelry.
INTRODUCTION3D printing technology is likely to replace many traditionalmanufacturing methods. There are many applications wherea 3D printer can deliver a design quickly, with high accuracyfrom a functional material. 3D printing creates parts bybuilding up objects one layer at a time. This method offersmany advantages over traditional manufacturing techniques.3D printing allows designers to make better decisions whenselecting a manufacturing process and enables them todeliver an optimal product. It’s an easier way to producecomplex objects. The musical arm-band is an example of thisapproach. The shell of the musical arm-band is 3D printed inCET department with a 3D printer. The 3D printing processfollows a predetermined plan provided by computersoftware. The computer directs the 3D printer to add eachnew layer as a precise cross-section of the final object. 3Ddesign of arm-band has a flat space on top of the shell forthe circuit to be placed. Arduino Mini is connected withother components and placed on the flat space in order forthe musical arm band to work.
REFERENCES● Instructables. “3D Printing Pen Tutorial.” Instructables.com, Instructables, 11
Oct. 2017, www.instructables.com/id/3D-Printing-Pen-Tutorial/.● “Redirecting...” G-Code - RepRap, reprap.org● “Arduino - Home.” Arduino - Introduction, www.arduino.cc
ACKNOWLEDGEMENTSCUNY Research Scholars Program 2019
CONCLUSION3D printing offers significant benefits in many fields such as medicine, engineering and business. 3D printed prosthetics are low-cost compared to traditional ones which are quite expensive. With 3D printing, customization is easy, so getting a new one after the old one is worn out, is much more affordable. 3D printing a production-ready prototype builds confidence before making large investments. 3D printing makes this possible in a shorter time and at a cheaper price. It offers the user the freedom to personalize anything without additional cost. In this way, people can set themselves apart when it comes to fashion or jewelry. In the traditional industrial manufacturing, production of the tools takes time, labor and cost. However, for low to medium volume applications in industrial 3D printing, this can be eliminated, thereby saving cost, time and labor. The 3D printer can build infinite shapes and complex figures. This feature gives 3D printing a higher structural integrity.
FUTURE WORKThe musical arm band will be used for medical purposes, such as for patients with Arthritis.Also patients who are taking physiotherapy can use it to detect the movements with the help of the circuit.
HARDWAREThe program code for Arduino is simple and straightforward. The motion sensor measures tilt angles along X, Y and Z axes. It can detect motion based on changes in acceleration due to gravity. It is an ideal sensor for detecting the movements of the arm. The motion sensor and a battery are connected to Arduino which outputs precise frequencies of musical notes through the speaker and the Wi-Fi circuit.
EQUIPMENT & PARTS LIST● 3D Printer ● PLA Filament● Printed Circuit Board ● Motion Sensor● Arduino mini Board● Speaker● Battery
ELECTRICAL CIRCUIT & 3D Printed Bracelet
PROGRAM CODE/* Melody: Plays a melody Circuit: 8-ohm speaker on digital pin 8 Created 21 Jan 2018, Modified 16 Apr 2019
by Sultana Begum*/#include "pitches.h"
// notes in the melody:int melody[] = { NOTE_C4, NOTE_G3, NOTE_G3, NOTE_A3, NOTE_G3, 0, NOTE_B3, NOTE_C4};
// note durations: 4 = quarter note, 8 = eighth note, etc.:int noteDurations[] = { 4, 8, 8, 4, 4, 4, 4, 4};
void setup() {// iterate over the notes of the melody:for (int thisNote = 0; thisNote < 8; thisNote++) {
// to calculate the note duration, take one second// divided by the note type.//e.g. quarter note = 1000 / 4, eighth note = 1000/8, etc.int noteDuration = 1000 / noteDurations[thisNote];tone(8, melody[thisNote], noteDuration);
// to distinguish the notes, set a minimum time between them.// the note's duration + 30% seems to work well:int pauseBetweenNotes = noteDuration * 1.30;delay(pauseBetweenNotes);// stop the tone playing:noTone(8);
BLOCK DIAGRAM
Motion Sensor
Battery
Arduino Speaker
Wi-Fi Circuit
●
●
●
import processing.serial.*;import controlP5.*; ControlP5 controlP5;Serial serial;Channel[] channels = new Channel[11];Monitor[] monitors = new Monitor[10];Graph graph;ConnectionLight connectionLight;int packetCount = 0;int globalMax = 0;String scaleMode;void setup() { // Set up window size(1024, 768); frameRate(60); smooth(); surface.setTitle("Processing Brain Grapher"); // Set up serial connection println("Find your Arduino in the list below, note its [index]:\n"); for (int i = 0; i < Serial.list().length; i++) {
println("[" + i + "] " + Serial.list()[i]); } // Put the index found above here: serial = new Serial(this, Serial.list()[0], 9600); serial.bufferUntil(10); // Set up the ControlP5 knobs and dials controlP5 = new ControlP5(this); controlP5.setColorValueLabel(color(0)); controlP5.setColorCaptionLabel(color(0)); controlP5.setColorBackground(color(0)); controlP5.disableShortcuts(); controlP5.setMouseWheelRotation(0);
controlP5.setMoveable(false); // Create the channel objects channels[0] = new Channel("Signal Quality", color(0), ""); channels[1] = new Channel("Attention", color(100), ""); channels[2] = new Channel("Meditation", color(50), ""); channels[3] = new Channel("Delta", color(219, 211, 42), "Dreamless Sleep"); channels[4] = new Channel("Theta", color(245, 80, 71), "Drowsy"); channels[5] = new Channel("Low Alpha", color(237, 0, 119), "Relaxed"); channels[6] = new Channel("High Alpha", color(212, 0, 149),

Degradation Rate Calculations of Polydimethylsiloxane (PDMS) Ibrahim Chouman, Matthew Sanchez
Professor. Dr. Ozlem Yasar Department of Mechanical Engineering Technology, New York City College of Technology, CUNY
Tissue Engineering has been studied to develop tissues as an alternative approach to the organ regeneration. Successful artificial tissue growth in regenerative medicine depends on the precise scaffold fabrication as well as the cell-cell and cell-scaffold interaction.
PDMS is a biodegradable and biocompatible material that is commonly used in the Tissue Engineering field. In this research, the degradation rate of PDMS is investigated by dissolving the PDMS within the water and ethyl alcohol. Outcomes are compared to decide the degradation speed of engineered scaffolds. Our preliminary results indicate that PDMS can be dissolved within ethyl alcohol faster.
Abstract:
Introduction:
Results:
Tissue Engineering is the study of the growth of new connective tissues, or organs, from cells and a collagenous scaffold to produce a fully functional organ for implantation back into the donor host.
Tissue Engineering aims to regenerate damaged tissues by combining cells from the body with highly porous scaffold biomaterials, which act as templates for tissue regeneration, to guide the growth of new tissue. Scaffolds should have the mechanical strength needed for the creation of a microporous structures that will retain its properties after implantation.
In this research, our preliminary experimental results showed that PDMS can easily be prepared in different thicknesses bymixing the base and the curing agent in 10:1 ratio.
Tissue Engineering has achieved remarkable success. However precise fabrication of tissue scaffolds always has been a challenge. Our research showed that 100% PEGDA scaffolds has the lowest yield strength whereas 20% PEGDA has the highest yield strength.
Conclusion:
References:
- Yasar, O and Starly B. “A Lindenmayer System-Based Approach for the Design of Nutrient Delivery Networks in Tissue Constructs.Biofabrication I (2009) 045004 - Suh, J.-K Francis, and Howard W.t Matthew. "Application of Chitosan-based Polysaccharide Biomaterials in Cartilage Tissue Engineering: A Review."Biomaterials 21.24 (2000): 2589-598. Web. 13 Aug. 2014 - Suh, J.-K Francis, and Howard W.t Matthew. "Application of Polysaccharide Biomaterials in Cartilage Tissue Engineering: A Review."Biomaterials 21.24 (2000): 25Chitosan-based 89-598. Web. 13 Aug. 2014.
Acknowledgment:
Literature Review:
Today in the research world many successful research institutes are working in this promising field Tissue Engineering. MIT, North Carolina University, Texas A&M, Drexel and many more universities are using different biocompatible materials for scaffold fabrication.
The authors acknowledge the research support from Dean’s
Office, Research Scholars’ funds and SET-CUNY
Figure 1. Tissue Regeneration
Fully solidified PDMS samples will be studied to investigate the toxicity rates. Then, INSTRON Machine will be use to do the compressive tests for PDMS mechanical characterizations.
PDMS: In this research, a thin layer of PDMS solution was prepared by mixing curing agent and base in 10:1 ratio.
Then they were baked in the oven in different temperatures.
Figure 2. Tissue Regeneration
Figure 3. PDMS preperation
= 4
R Studio code & Plot
Analyzing exotic function in Calculus under the microscope
Showmik K. Chowdhury, Mentor: Satyanand Singh CUNY Research Scholars Program
Abstract
In studying Calculus, we learn about exotic functions which can be seen everywhere, and we
can differentiate them. By differentiating a
function, we can visualize and understand the rule
of its nature. People frequently wonder if such
functions have real life applications. It turns out
that movies such as “The Dark Knight” used
exotic functions to create special sound effects. In
our case, we closely studied the behavior of the
Weierstrass function and sequences of functions
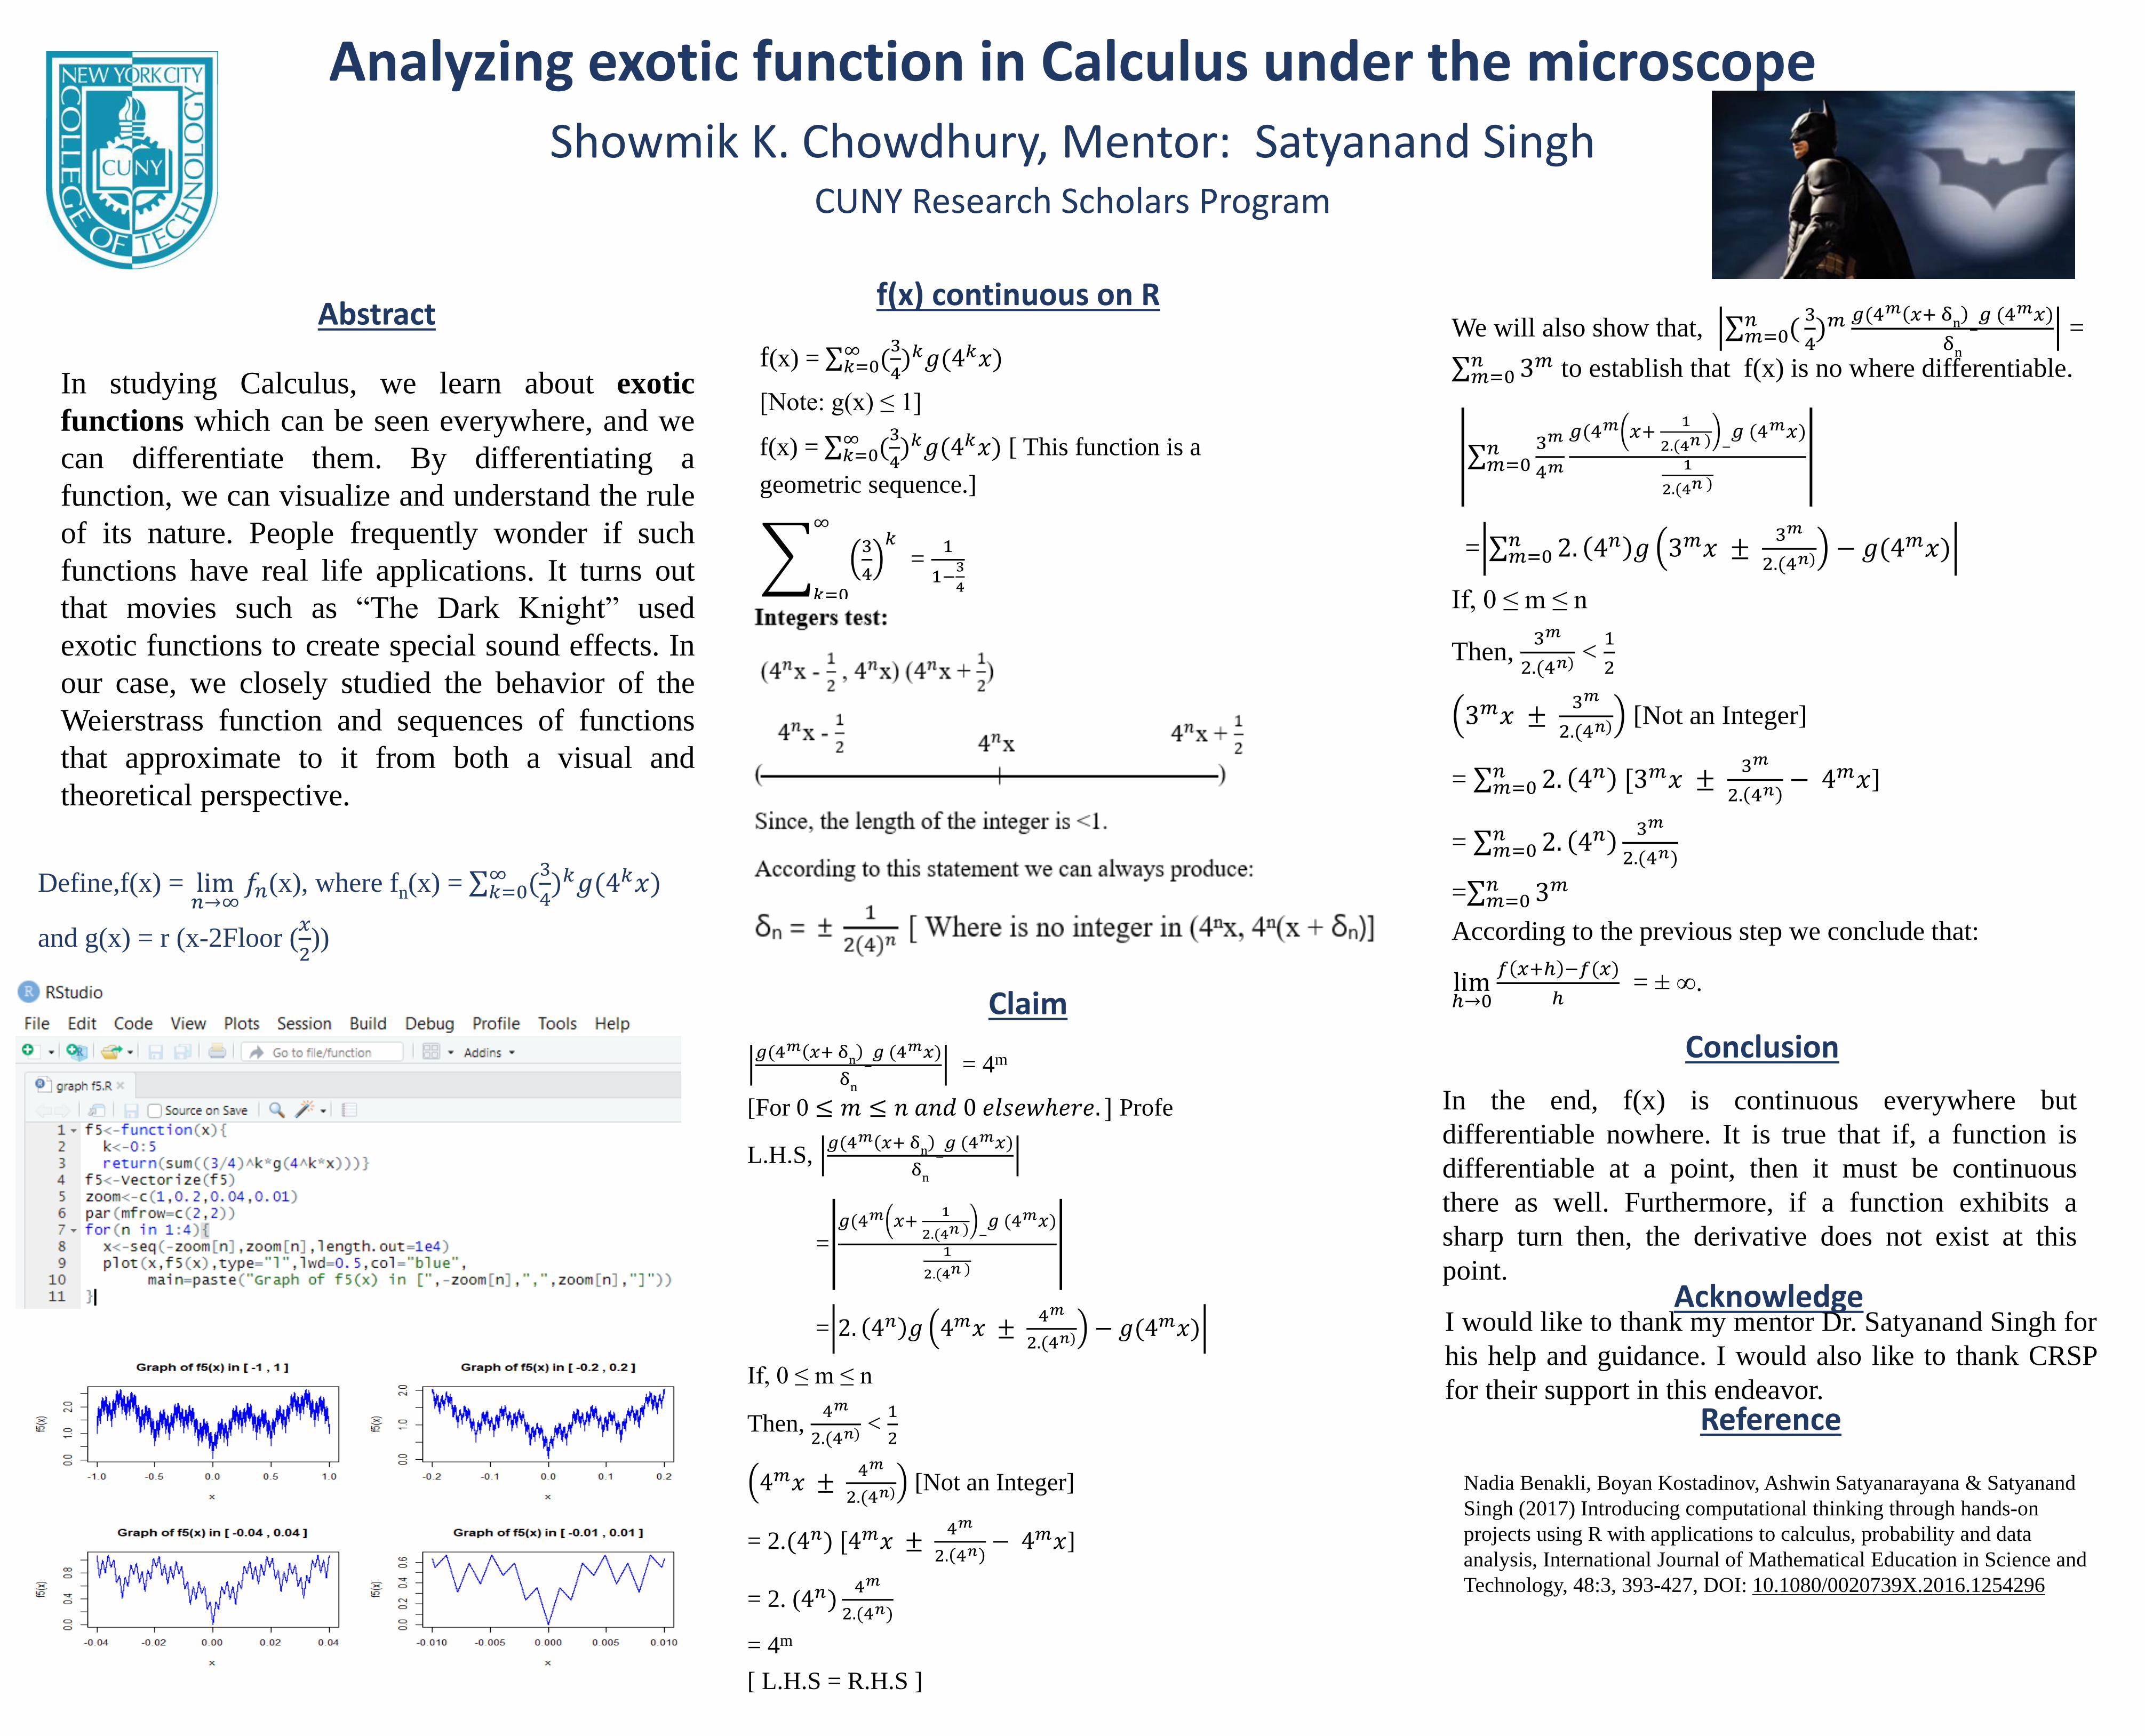
Define,f(x) = lim 𝑓𝑛(x), where f (x) = σ𝑘=0( )𝑘𝑔(4𝑘𝑥)
that approximate to it from both a visual and
theoretical perspective.
∞ 3 n𝑛→∞ 4
𝑥 and g(x) = r (x-2Floor ( ))
2
f(x) continuous on R
3∞f(x) = σ𝑘=0( )𝑘𝑔(4𝑘𝑥)
4
[Note: g(x) ≤ 1] 3∞f(x) = σ𝑘=0( )𝑘𝑔(4𝑘𝑥) [ This function is a
4 geometric sequence.]
∞ 𝑘 3 1
= 34 1− 4𝑘=0
Claim
𝑔(4𝑚 𝑥+ δ 𝑔 (4𝑚𝑥)n − = 4m
δ n
[For 0 ≤ 𝑚 ≤ 𝑛 𝑎𝑛𝑑 0 𝑒𝑙𝑠𝑒𝑤ℎ𝑒𝑟𝑒. ] Profe
𝑔(4𝑚 𝑥+ δ 𝑔 (4𝑚𝑥)n −L.H.S,
δ n
1𝑔(4𝑚 𝑥+ 𝑔 (4𝑚𝑥)
2.(4𝑛 ) − = 1
2.(4𝑛 )
4𝑛 = 2. 𝑔 4𝑚𝑥 ± 4𝑚
− 𝑔(4𝑚𝑥)2.(4𝑛)
If, 0 ≤ m ≤ n 4𝑚 1
Then, < 2.(4𝑛) 2
4𝑚𝑥 ± 4𝑚
[Not an Integer] 2.(4𝑛)
4𝑚
− 4𝑚𝑥]= 2.(4𝑛) [4𝑚𝑥 ± 4𝑛 2.
= 2. (4𝑛) 4𝑚
2.(4𝑛)
= 4m
[ L.H.S = R.H.S ]
3)𝑚 𝑔(4
𝑚 𝑥+ δ 𝑔 (4𝑚𝑥)We will also show that, =σ𝑚
𝑛 =0(
n −
4 δ 𝑛 n
σ𝑚=0 3𝑚 to establish that f(x) is no where differentiable.
1
3𝑚 𝑔(4𝑚 𝑥+ 𝑔 (4𝑚𝑥)
2.(4𝑛 )𝑛 −σ𝑚=0 4𝑚 1
2.(4𝑛 )
𝑛 4𝑛 = σ𝑚=0 2. 𝑔 3𝑚𝑥 ± 2.
3
(4
𝑚
𝑛) − 𝑔(4𝑚𝑥)
If, 0 ≤ m ≤ n 3𝑚 1
Then, < 2.(4𝑛) 2
3𝑚𝑥 ± 2.
3
(4
𝑚
𝑛) [Not an Integer]
𝑛 4𝑛 [3𝑚𝑥 ± 3𝑚
− 4𝑚𝑥]= σ𝑚=0 2. 4𝑛 2.
3𝑚 𝑛 4𝑛 = σ𝑚=0 2. 2.(4𝑛) 𝑛 3𝑚 =σ𝑚=0
According to the previous step we conclude that:
𝑓 𝑥+ℎ −𝑓(𝑥)lim = ± ∞. ℎ→0 ℎ
Conclusion
In the end, f(x) is continuous everywhere but
differentiable nowhere. It is true that if, a function is
differentiable at a point, then it must be continuous
there as well. Furthermore, if a function exhibits a
sharp turn then, the derivative does not exist at this
point. Acknowledge
I would like to thank my mentor Dr. Satyanand Singh for
his help and guidance. I would also like to thank CRSP
for their support in this endeavor. Reference
Nadia Benakli, Boyan Kostadinov, Ashwin Satyanarayana & Satyanand
Singh (2017) Introducing computational thinking through hands-on
projects using R with applications to calculus, probability and data
analysis, International Journal of Mathematical Education in Science and
Technology, 48:3, 393-427, DOI: 10.1080/0020739X.2016.1254296

Know your body: Health Data Analysis Across gender and ethnic populations Maria DeLeon*, Niloufar Haque**, and Alberto Martinez*
Chemistry Department* Biological Sciences** NYCCT, 285 Jay street, Brooklyn NY 11201
Abstract Data collected (Results)
Why knowing your body is important? It’s important for your health. Our diet, (A) Male vs. Female Calories Intake (C) (B) Male vs. Female Sleep Cycle (Hour/min)
sleep pattern, pulse rate, lung capacity are key indicators of our risk for major 2500 7.4 illness. The human body consists of organized yet complicated organs and
Slee
p cy
cle
(hou
rs/m
in) 7.2
7
6.8
6.6 Female
6.4 Male
6.2
6
5.8
systems, making it work-day in and out. It can be affected by a person’s life-style. Quality of an individual life depends largely on a person's mental and physical health. One’s life-style plays a key role, however, one’s genetic predisposition also is an important factor to be taken into consideration. Family history is a good index to identify disease traits early on. We hypothesize that life-style and genetic predisposition may be the key factors in triggering various chronic diseases. In this study we collected patient information from 20 females and 7 males. Our results
1000 Male
2000
Calo
ries I
ntak
e (C
)
1500
Female
500
show that there is a significant difference between male and female calorie intake and slept hours. Our results confirm that physiologically male and female body functions differently. Understanding sex differences as between calories intake, slept hours, lung capacity and pulse rate will allow a better diagnosis, treatment, and eventually prevention of diseases in men and women. Additional details will be discussed one the project is completed.
Introduction
0
Female Male Figure 1: Female vs male calories intake (C). Patients between 19-27-year-old. Male n=7 and Female N=20. The values represent the difference between male and female, in the y-axis number of calories (C), and x-axis gender. Bars represent standard error of mean; a significant different *P<0.05. Male average 2078.34 whereas female average 1623.71.
Female vs. Male Pulse Rate (Bpm) ( C) 90
80
5.6
Female Male Figure 2: Female vs. Male sleep cycle (hour/min). Patients between 19-27-year-old. Male n=7 and Female N=20. The values represent the difference between male and female, in the y-axis the amount of sleep and x-axis gender. Bars represent standard error of mean; a significant different *P<0.05. Male average 6.57 whereas female average 6.91.
Female vs. Male Lung Capacity (mL) (D) 7000
6000
Lung
Cap
acity
(mL)
Human body is very complex but well programmed. Healthy habits including a healthy diet, and proper sleep condition are essentials to maintain its efficient working throughout on life. This is because what we eat can impact our short-term and long-term health1. Make sleep a priority because without adequate sleep, we may be less productive, less mentally sharp, and health can be highly affected. Previous research support, that average sleep quality was better
70
60
50
40
Puls
e Ra
te (B
pm)
5000
4000 Female Female 3000 Male Male
2000
1000
30
20
related to health, affect balance, satisfaction with life, and feelings of tension, depression, anger, fatigue, and confusion2. Men and women have different needs and those individual needs will vary depending on their life-style in which it can affect in their calorie intake, sleep, pulse and lung capacity. According to the American Society, a teenage male should aim for around 3,200 calories per day, while a man in his 30s should eat around 2,200 calories 3. However, a moderately active woman requires about 1,800 to 2,200 calories each day for healthy weight maintenance 4. In our research, we found that there is a difference between male and female sleep cycle. Our data shows that women sleep longer than men, and it confirms previous findings5 . The normal average sleep cycle for a man is about 496.4 minutes, and women 507.6 minutes. Furthermore, our data shows a slightly difference in resting heart rate by gender. It was found that women have higher pulse rate than men. In this study, women ages 19-25 have the higher average at 77.95 BPM, while men ages 19-27 have an average among male at 71.80 BPM. However, according to its lung capacity, the volume of adult female lungs is typically 10–12% smaller than that of males who have the same height and age(19-27).
Materials and Methods
In this study patients used the following add to record their sleep cycle “Sleep cycle-iphone”, “Sleep analysis”, “sleeptimefree”, sleep time to wake up time. These apps helped patients maintain equilibrium about the way to sleep. “MyfitnessPal”, “LifeSum”, “CouchTo5k”, “My Plate”, “fitbit” were the apps used to calculate the amount of calories intake. In order to calculate their pulse apps such as “Companion”, “Livestrong”, “Sommology” as well as Iphone watch were utilized. These apps helped the patients collected their sleep, calories, pulse rate and lung capacity for a period of 4 months.
10 0
0 Female Male Female Male Figure 4: Female vs. male lung capacity (mL). Patients between 19-27-year-old.
Figure 3: Female vs. male Pulse rate (BPM). Patients between 19-27-year-old. Male Male n=6, and Female n=15. The values represent the difference between male n=5, and Female n=20. The values represent the difference between male and female, and female, y-axis lung capacity(mL) , and x-axis gender. Male average 4130.66 y-axis pulse rate (BPM), and x-axis gender. Male average 71.8 whereas female average whereas female average 2834.375. No significant differences was observed 77.95. No significant differences was observed
Discussions and conclusions
The goal was to investigate the difference between gender and its calories, sleep cycle, pulse rate, and lung capacity. Life-style and genetic predisposition may be the cause of various chronic conditions. Prevention is better than a cure because it is better and easier to stop a problem or illness from happening than it is to stop or correct it after it has started. Results show that male are more likely to become obese than female (figure 1). It can conclude that females have a more balanced healthy diet than male. On the other hand, male and female sleep cycle are significantly different (figure 2). However, lung Capacity and pulse rate are different as previously reported in the range of 19-20 years old. There is a difference between male and female pulse and lung capacity (figure 3 and 4). Understanding these differences between males and females may allow the discovery of preventive and treatment strategies for diseases associated with body weight, such as cancer, cardiovascular disease, Cholesterol, Hypertension, insomnia, etc. In conclusion, this study of 20 females and 7 males was conducted to analyze the differences between genders and our results confirm that physiologically male and female body functions differently.
Future work Acknowledgments and References
I would like to thank Hamid Norouz, Abdou Bah Chritopher Navarrete, Reneta Lansiquot, and Jean Hillstrom for giving me this opportunity. 1. “How Your Eating Habits Affect Your Health.” National Institutes of Health, U.S. Department of Health and Human Services, 8 Sept. 2017, https://newsinhealth.nih.gov/2017/05/how-your-eating-habits-affect-your-health. 2. Pilcher, June J., et al. “Sleep Quality versus Sleep Quantity: Relationships between Sleep and Measures of Health, Well-Being and Sleepiness in College Students.” Journal of Psychosomatic Research, Elsevier, 5 Jan. 1998, • Work with different patients across variable groups https://www.sciencedirect.com/science/article/pii/S0022399997000044. 3. Donald Hensrud, M.D. “The Surprising Health Benefits of Coffee.” Mayo Clinic, Mayo Foundation for Medical Education and Research, 4 Mar. 2017, https://www.mayoclinic.org/healthy-lifestyle/nutrition-and-healthy-• Study variable across ethnic groups eating/expert-answers/coffee-and-health/faq-20058339. 4. Hong, Jina, et al. “Differential Susceptibility to Obesity between Male, Female and Ovariectomized Female Mice.” Nutrition Journal, BioMed Central, 17 Feb. 2009, https://www.ncbi.nlm.nih.gov/pmc/articles/PMC2650703/. 5. Wick, Jessica. “The Average Number of Calories Americans Eat Every Day May Surprise You.” Showbiz Cheat Sheet, 25 May 2018, https://www.cheatsheet.com/health-fitness/how-many-calories-does-the-average-american-eat-in-a-day.html/. 6. Lee KA, Kryger MH. Women and sleep. J Womens Health (Larchmt) 2008;17:1189–1190 [PubMed] [Google Scholar]
Departments of Radiologic Technology & Medical Imaging1 and Computational Engineering Technology2
Amina Shahbaz1 , Aldona Gjoni1, Zoya Vinokur,1 Chen Xu2 and Subhendra Sarkar1
Physico-Chemical Modeling, Optical Microscopy and Near-Infrared Spectroscopic Characterization of Model Biomaterials.
Abstract Figure 2 Discussion
Biopolymers are being developed with nanostructures
which acts as a carriers for drug delivery to treat different
diseases including cancers. In this project, the authors
made one biopolymer PDMS with 0-0.9% of SiC filler a
novel characterization was demonstrated.
Characterization included optical surface microscopy (5-
100X) and 2D X-ray imaging at low kVp and low mAs to
ensure proper loading and uniform distribution of SiC
filler content in PDMS matrix distinguishable within 0.2
vol% of SiC. MR measurements also seemed to be very
promising.
Background
Physics and Chemistry of tissue/biopolymer interaction
is ill-understood. Biopolymers are being developed with
embedded nanostructures in biomedicine while effective
characterizations are lacking.
Methods
In the current project one biopolymer was designed and
fabricated under a separate project: poly di-methoxy
siloxane (PDMS) with 0-0.9 vol% of SiC nano whisker
(fillers) that were non-destructively characterized and
modeled by the authors. Optical spectroscopy is a
technique for measuring light intensity in the
ultraviolent, visible, near-infrared and infrared
wavelength ranges. This system used in the experiments
is AvaSpec-ULS2048, which can scan wavelength range
from 200 to 1100 nm, and resolution can reach 0.05nm.
To demonstrate the PDMS signals under the MR, we
used the 3T Siemens Prisma from McClean Hospital
Boston.
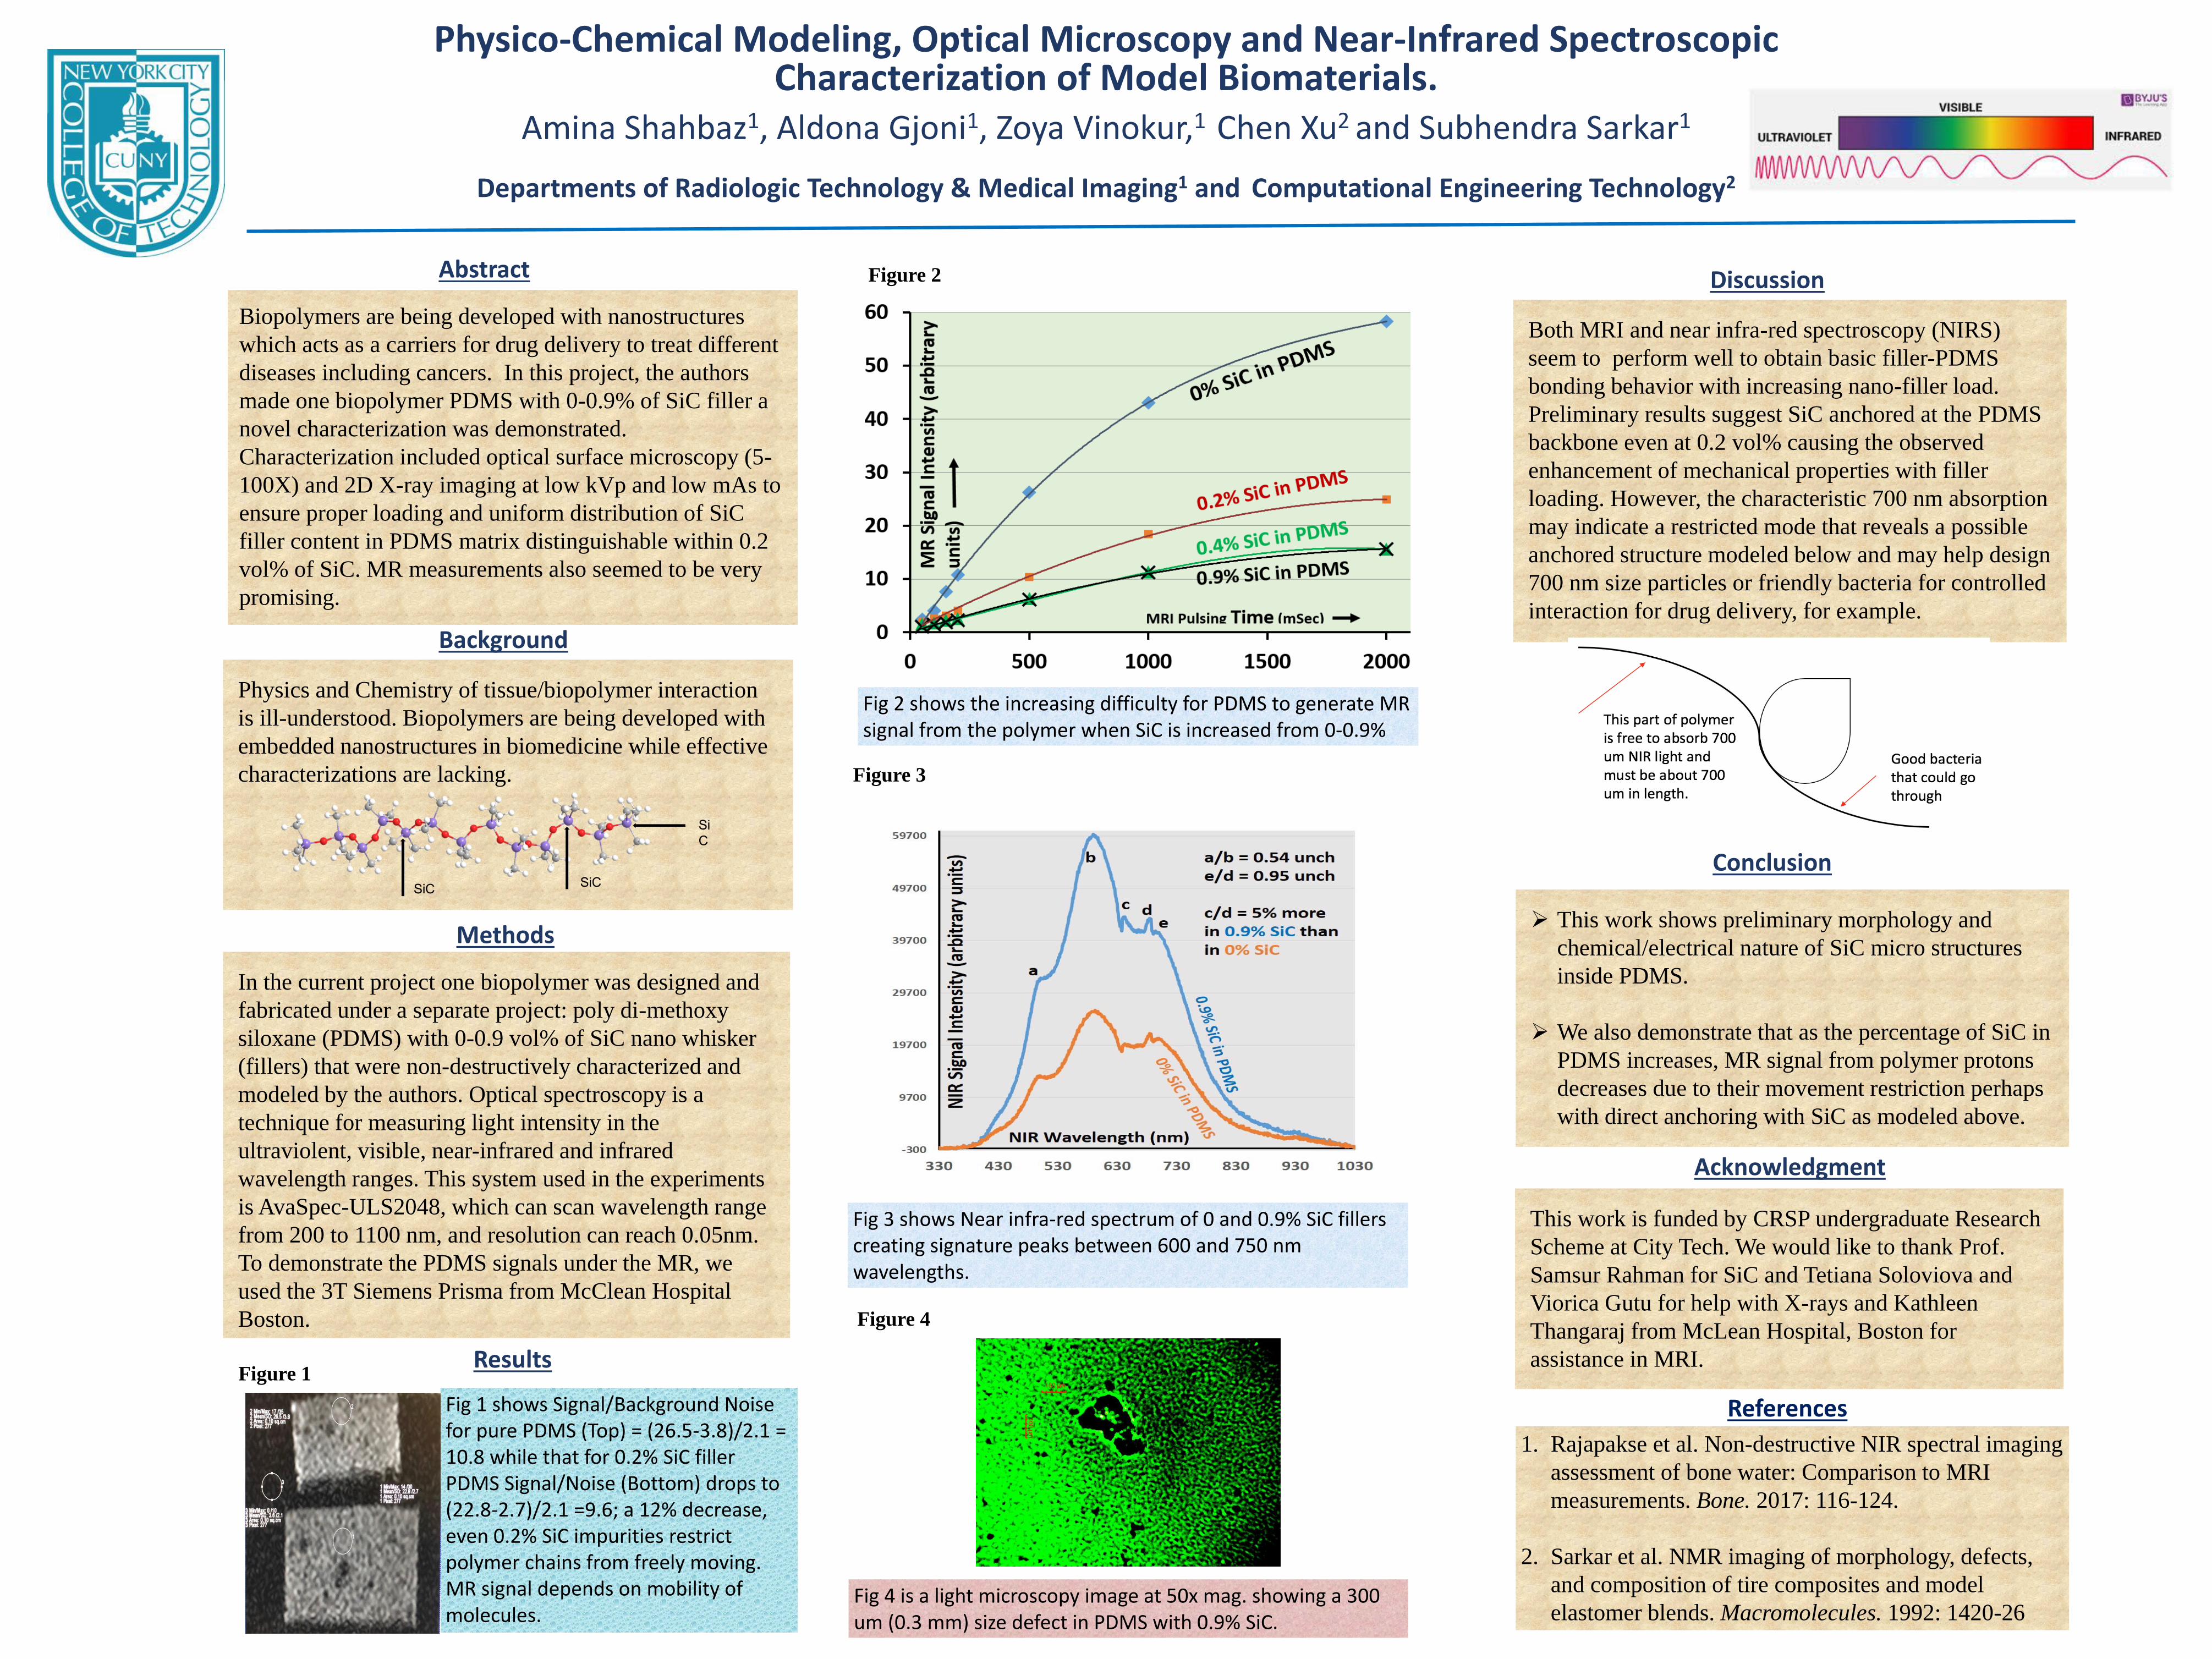
Results Figure 1
Fig 1 shows Signal/Background Noise for pure PDMS (Top) = (26.5-3.8)/2.1 = 10.8 while that for 0.2% SiC filler PDMS Signal/Noise (Bottom) drops to (22.8-2.7)/2.1 =9.6; a 12% decrease, even 0.2% SiC impurities restrict polymer chains from freely moving. MR signal depends on mobility of molecules.
Fig 2 shows the increasing difficulty for PDMS to generate MR signal from the polymer when SiC is increased from 0-0.9%
Figure 3
Fig 3 shows Near infra-red spectrum of 0 and 0.9% SiC fillers creating signature peaks between 600 and 750 nm wavelengths.
Figure 4
Fig 4 is a light microscopy image at 50x mag. showing a 300 um (0.3 mm) size defect in PDMS with 0.9% SiC.
Both MRI and near infra-red spectroscopy (NIRS)
seem to perform well to obtain basic filler-PDMS
bonding behavior with increasing nano-filler load.
Preliminary results suggest SiC anchored at the PDMS
backbone even at 0.2 vol% causing the observed
enhancement of mechanical properties with filler
loading. However, the characteristic 700 nm absorption
may indicate a restricted mode that reveals a possible
anchored structure modeled below and may help design
700 nm size particles or friendly bacteria for controlled
interaction for drug delivery, for example.
Conclusion
➢ This work shows preliminary morphology and
chemical/electrical nature of SiC micro structures
inside PDMS.
➢ We also demonstrate that as the percentage of SiC in
PDMS increases, MR signal from polymer protons
decreases due to their movement restriction perhaps
with direct anchoring with SiC as modeled above.
Acknowledgment
This work is funded by CRSP undergraduate Research
Scheme at City Tech. We would like to thank Prof.
Samsur Rahman for SiC and Tetiana Soloviova and
Viorica Gutu for help with X-rays and Kathleen
Thangaraj from McLean Hospital, Boston for
assistance in MRI.
References
1. Rajapakse et al. Non-destructive NIR spectral imaging
assessment of bone water: Comparison to MRI
measurements. Bone. 2017: 116-124.
2. Sarkar et al. NMR imaging of morphology, defects,
and composition of tire composites and model
elastomer blends. Macromolecules. 1992: 1420-26
Biotechnology and reconstructing the self through genetic health markers and elevated health risks.
Nadia Gordon1 and Katherine Gregory, PhD2
1Department of Biological Sciences, NYCCT, CUNY, 2Department of Health Service, NYCCT, CUNY
ABSTRACT
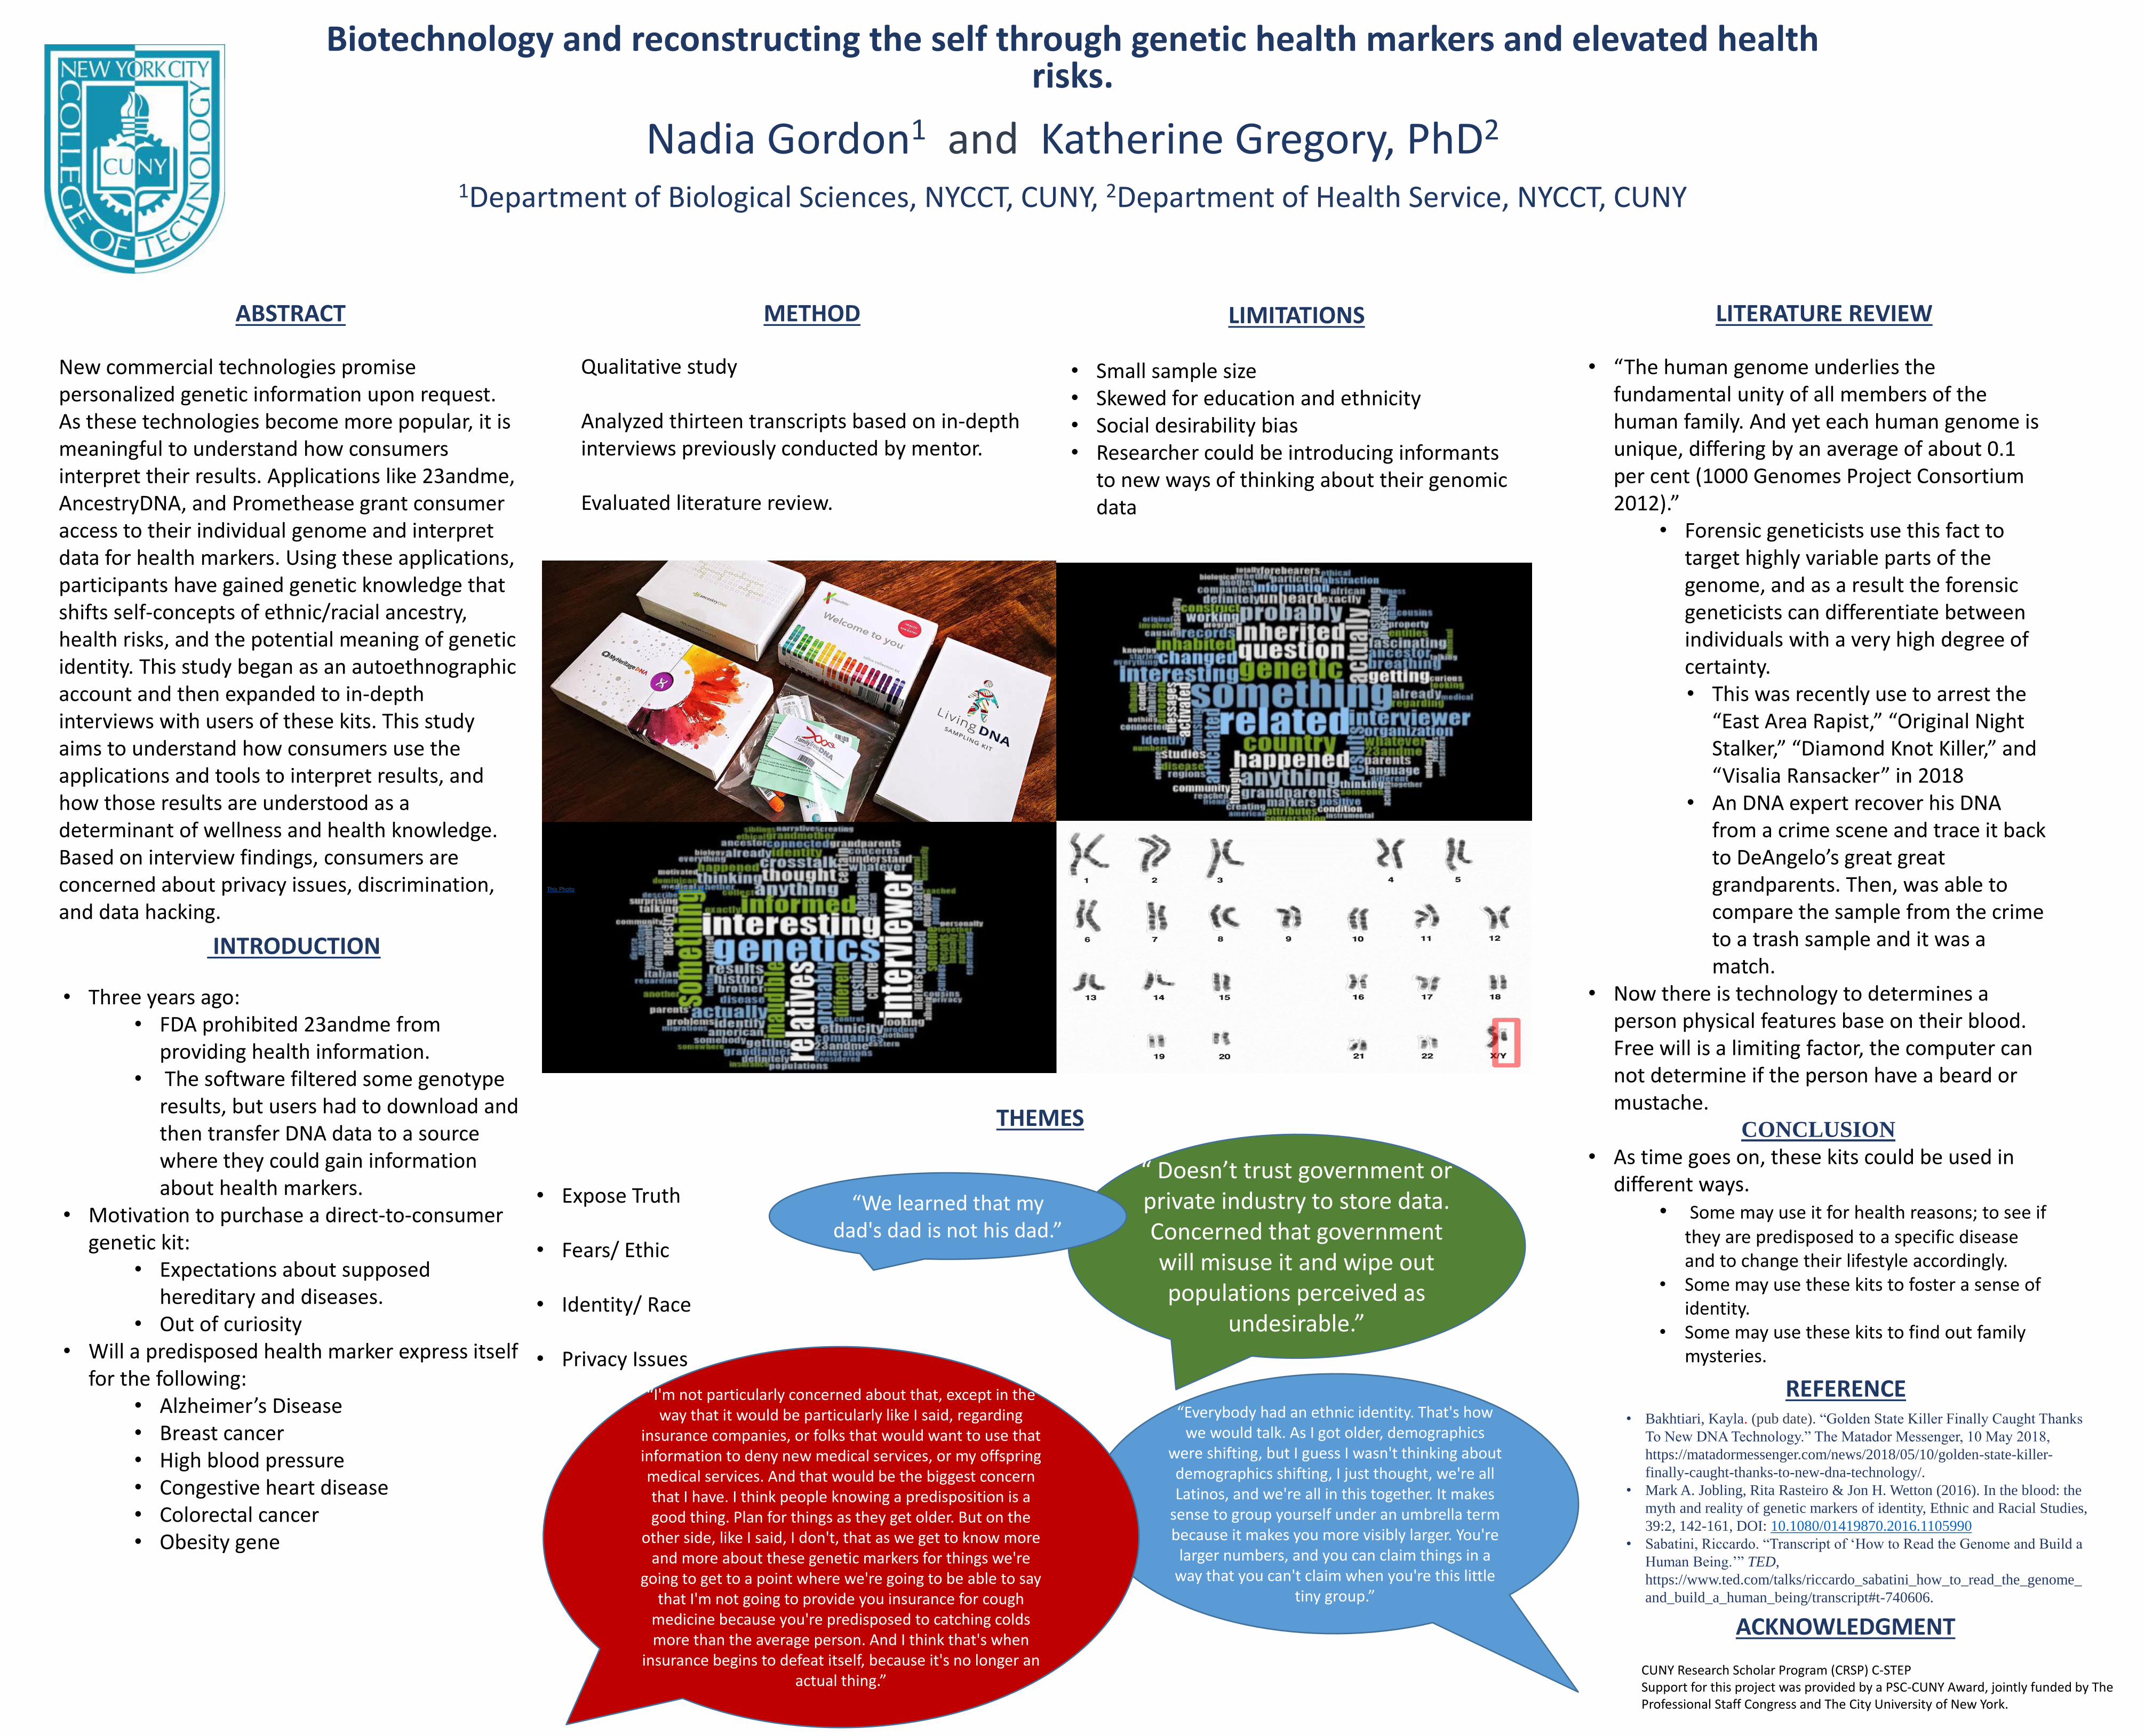
New commercial technologies promise personalized genetic information upon request. As these technologies become more popular, it is meaningful to understand how consumers interpret their results. Applications like 23andme, AncestryDNA, and Promethease grant consumer access to their individual genome and interpret data for health markers. Using these applications, participants have gained genetic knowledge that shifts self-concepts of ethnic/racial ancestry, health risks, and the potential meaning of genetic identity. This study began as an autoethnographic account and then expanded to in-depth interviews with users of these kits. This study aims to understand how consumers use the applications and tools to interpret results, and how those results are understood as a determinant of wellness and health knowledge. Based on interview findings, consumers are concerned about privacy issues, discrimination, and data hacking.
INTRODUCTION
• Three years ago: • FDA prohibited 23andme from
providing health information. • The software filtered some genotype
results, but users had to download and then transfer DNA data to a source where they could gain information about health markers.
• Motivation to purchase a direct-to-consumer genetic kit:
• Expectations about supposed hereditary and diseases.
• Out of curiosity • Will a predisposed health marker express itself
for the following: • Alzheimer’s Disease • Breast cancer • High blood pressure • Congestive heart disease • Colorectal cancer • Obesity gene
METHOD LIMITATIONS
Qualitative study • Small sample size • Skewed for education and ethnicity
Analyzed thirteen transcripts based on in-depth • Social desirability bias interviews previously conducted by mentor. • Researcher could be introducing informants
to new ways of thinking about their genomic Evaluated literature review. data
This Photo by Unknown Author is licensed under CC BY-SA-NC
THEMES
• Expose Truth
• Fears/ Ethic
• Identity/ Race
• Privacy Issues
“ Doesn’t trust government or private industry to store data. Concerned that government will misuse it and wipe out populations perceived as
undesirable.”
“We learned that my dad's dad is not his dad.”
“Everybody had an ethnic identity. That's how we would talk. As I got older, demographics
were shifting, but I guess I wasn't thinking about demographics shifting, I just thought, we're all Latinos, and we're all in this together. It makes
sense to group yourself under an umbrella term because it makes you more visibly larger. You're
larger numbers, and you can claim things in a way that you can't claim when you're this little
tiny group.”
“I'm not particularly concerned about that, except in the way that it would be particularly like I said, regarding
insurance companies, or folks that would want to use that information to deny new medical services, or my offspring medical services. And that would be the biggest concern that I have. I think people knowing a predisposition is a good thing. Plan for things as they get older. But on the
other side, like I said, I don't, that as we get to know more and more about these genetic markers for things we're
going to get to a point where we're going to be able to say that I'm not going to provide you insurance for cough
medicine because you're predisposed to catching colds more than the average person. And I think that's when
insurance begins to defeat itself, because it's no longer an actual thing.”
LITERATURE REVIEW
• “The human genome underlies the fundamental unity of all members of the human family. And yet each human genome is unique, differing by an average of about 0.1 per cent (1000 Genomes Project Consortium 2012).”
• Forensic geneticists use this fact to target highly variable parts of the genome, and as a result the forensic geneticists can differentiate between individuals with a very high degree of certainty. • This was recently use to arrest the
“East Area Rapist,” “Original Night Stalker,” “Diamond Knot Killer,” and “Visalia Ransacker” in 2018
• An DNA expert recover his DNA from a crime scene and trace it back to DeAngelo’s great great grandparents. Then, was able to compare the sample from the crime to a trash sample and it was a match.
• Now there is technology to determines a person physical features base on their blood. Free will is a limiting factor, the computer can not determine if the person have a beard or mustache.
CONCLUSION • As time goes on, these kits could be used in
different ways. • Some may use it for health reasons; to see if
they are predisposed to a specific disease and to change their lifestyle accordingly.
• Some may use these kits to foster a sense of identity.
• Some may use these kits to find out family mysteries.
REFERENCE • Bakhtiari, Kayla. (pub date). “Golden State Killer Finally Caught Thanks
To New DNA Technology.” The Matador Messenger, 10 May 2018,
https://matadormessenger.com/news/2018/05/10/golden-state-killer-
finally-caught-thanks-to-new-dna-technology/.
• Mark A. Jobling, Rita Rasteiro & Jon H. Wetton (2016). In the blood: the
myth and reality of genetic markers of identity, Ethnic and Racial Studies,
39:2, 142-161, DOI: 10.1080/01419870.2016.1105990
• Sabatini, Riccardo. “Transcript of ‘How to Read the Genome and Build a
Human Being.’” TED,
https://www.ted.com/talks/riccardo_sabatini_how_to_read_the_genome_
and_build_a_human_being/transcript#t-740606.
ACKNOWLEDGMENT
CUNY Research Scholar Program (CRSP) C-STEP Support for this project was provided by a PSC-CUNY Award, jointly funded by The Professional Staff Congress and The City University of New York.

0% 0.2%
0.4% 0.9%
Fabrication and Imaging Characterization of Poly (Dimethyl Siloxane)/SiC Nano-fillers Samples as Model Biomaterials.
Viorica Gutu1, Tetiana Soloviova1, Samsur Rahman2, Zoya Vinokur1 and Subhendra Sarkar1
Departments of 1Radiologic Technology & Medical Imaging & 2Mechanical Engineering Technology
Abstract
Biopolymers are being developed with embedded
nanostructures for in vivo drug delivery to treat various
diseases including cancers. In the current project we developed
fabrication steps to prepare two biopolymers, poly di-methoxy
siloxane (PDMS) with 0-0.9 vol% of SiC nano whisker (fillers)
followed by non- destructive characterization. Optical
reflection microscopy (5-100X) was performed to ensure
loading and distribution of increasing SiC content. Optical
microscopy showed progressively higher SiC distribution as
filler loading was increased from 0-0.9 vol%. X-ray imaging at
low kV (kilovoltage) and low mAs (milliamperage per second)
were optimized to allow distinction between filled PDMS with
SiC concentration that differed as low as by 0.2%. In addition,
MRI characterizations are under investigation to obtain basic
inter-molecular relaxation information with and without nano-
fillers. Preliminary results suggest SiC attached at the PDMS
backbone even at 0.2 vol% explaining observed enhanced
mechanical properties with filer loading.
Introduction
Four samples of polymers with different concentration of SiC
(silicone carbide) were prepared at Mechanical engineering
department.
Sylgard 182 Silicone Elastomer Base with Agent in proportion
10:1 was used to develop neat clear sample of polymer.
Further, SiC powder (filler) was added in different proportions
to get 0.2, 0.4, and 0.9 vol % SiC mixed. Acquired solutions
were placed in molds and heated for two hours. Four obtained
samples were characterized using x-ray and MRI systems to
detect defects and model filler-polymer interactions.
Results Fig 1
Light microscopy images
(50x) for PDMS (top left)
and PDMS + 0.2, 0.4, 0.9
vol% of SiC nanofillers .
Note: 0% SIC sample does
not show any micro
structures while 0.2-0.9
vol% of SiC are showing
progressively more dense
microstructures.
Fig 3
Fig 2
PDMS + 0.2 % SiC
(top) low x-ray techniques (40kV,
1 mAs), and (bottom) is medium
power X-ray 45kV, 10 mAS,
no grid, 10 magnification).
Low power x-ray image appears
noisy (quantum mottle).
X-ray image: PDMS with 0%, 0.2%,
0.4%, and 0.9% from top left, clockwise
Fig 4
X-ray images of 0% SiC/polymer is shown on the
right and 0.9% of SiC/polymer is shown on the left.
Absorbed x-ray intensity and background noise are
shown in the ROI’s.
Fig 5
200 um resolution MR
image (from Prisma 3T)
Of 0% SiC/PDMS (top);
0.9% SiC/PDMS (bottom).
Defects (white arrows) are
approximately 1-2 mm in
size (1000-2000 um)
Analysis of data
Figure 3 shows progressively less x-ray absorption as the SiC content
increased from 0% to 0.9%. Small air bubble defect seen on 0% sample.
On 0.9% we can see slightly darker area also marked with arrow.
Figure 4 MRI images show higher MR signal for 0% and lower signal for
0.9% sample. MRI theory behind MR signal is under investigation.
Figure 4 demonstrates difference between signal (S) to noise ratio of two
samples: 0% and 0.9% SiC
S (0%) / Bkgd Noise = (1282-123):91=12.8
S (0.9%) / Bkgd Noise = (1199-116):91=11.9
Percent Difference in S/N = (12.8-11.9) / (12.8+11.9)/2 = 7%
Discussion
SiC filler range (0-0.9% tested here) should be varied to obtain
desirable biopolymer mechanical strengths, biocompatibility and drug
transport properties. The signal pattern seen on x-ray and MR is not
well understood.
Future plan includes, electrospinning generation of poly lactic acid
(PLA) biopolymers as well as X ray and MRI with iodine and
gadolinium contrast will be performed to understand pores and defects
that affect tissue compatibility and utility of such biomaterials.
Conclusion
➢We observed SiC particulates in optical images (Fig 1) while those
structures are beyond the resolution of X Ray (Figs 2-4) and MRI
(Fig 5).
➢X-ray imaging is important while somewhat insensitive tool for
microstructure characterization of biopolymers.
➢MRI is important while excessively sensitive tool for mapping defects
in characterization of biopolymers.
Acknowledgement
This work is funded by CRSP undergraduate research scheme at City
Tech. We would like to thank Prof. Chen Xu for valuable discussions,
Amina Shahbaz and Aldona Gjoni for help with X-ray and Kathleen
Thangaraj from McLean Hospital, Boston for assistance with MRI.
References
1. Regehr et al. Biological implications of polydimethylsiloxane-based
microfluidic cell culture. Lab Chip. 2009 August 7; 9(15): 2132–2139.
2. Sarkar et al. NMR imaging of morphology, defects, and composition of tire
composites and model elastomer blends. Macromolecules. 1992: 1420-26.

Open invaluable students weekly requirement student's improving requirementshow school, designated
References
Conclusion
Correlation of Open Lab X and Students’ Final Grades
Introduction
The Department of Radiological Technology and Medical Imaging mission is to provide education that will enable our students to become competent entry level Radiologic Technologist by utilizing open-ended laboratory. Open-ended laboratory plays an important role in the radiology. In other universities that use open lab, they have demonstrated that using this resource pushes student to self-think and to formulate their own strategies while applying their understanding of concepts.1 We will discuss how first, and second year students utilize open-ended laboratory and how does it impact their grades. Does it improve performance, communication skills and build confidence.?In addition, we are going to compare data from other years and see what trends impact the use of open laboratory.
Fahameda Hassan, Mary Lee Mentor: Prof. Vinokur
Department of Radiological Technology New York City College of Technology
300 Jay Street Brooklyn, NY 11201
Abstract
ended laboratory or open lab as it is known to the Radiological Technology students is an tool that the Radiological Technology and Medical Imaging Department provides to help the
become better radiographers. One way to ensure students use this resource is to make it a requirement for some classes, other classes have no requirements or may have a set total hour
per semester. We hope to study how utilizing this department resource impacts the final grades over a multi-year study. Does making it mandatory help the students succeed in
their skills and knowledge base or does it harm students if they are unable to complete . In surveying the Radiological students, we will investigate whether other factors impact
both the first and second students use this resource, such as personal commitments outside academic requirements that make it difficult to use this resource and whether or not the times
as open lab are sufficient for all the students in the department.
of
to
Methodology
Our research builds upon data obtained from previous years of open laboratory and focuses on the students in the Radiological Technology Program. As part of a full year study to understand how attitudes, time and personal responsibilities, in addition to a participation requirement of open laboratory, we hope to understand how having or not having a mandatory open lab helps students perform better as radiographers. For the Fall of 2019, we have gathered statistical data detailing specific reasons of how students utilize the open laboratory hours that are set aside. Final grades for the fall will not be available for this poster session but will be presented in the Spring 2020 and a full year analysis will be available in the Summer of 2020.
Data will include snapshots of how the students are utilizing open lab over the fall semester. The same survey will be distributed several times in the Spring, and we will see if different semester academic and clinical requirements will impact how often and the end effect of open laboratory on the first-year students as they enter and complete the first phase of the clinical portion of their education
All data was exported into Microsoft Access for organization and analysis. We also used Microsoft Excel to create charts for more detailed data analysis.
Program Structure The program is separated into two, one-year phases with each year divided into trimesters. The first year is heavily weighted on the didactic side with classroom work three times a week and clinical twice a week. In this phase the student will be introduced to the science of Radiologic Technology and the different components to creating an acceptable x-ray. The second year consists of three days of clinical and two days classroom work. In this phase, emphasis is placed on clinical competency and preparation for the American Registry of Radiologic Technology exam.
Goals To produce Radiologic Technologists who hold entry-level clinical skills for employment, can demonstrate critical thinking skills, allowing them to meet the patients needs in the clinical setting, have excellent communication skills and to monitor overall program effectiveness ensure we are meeting the needs of the students via the utilization of open-ended laboratory.
Results continued
When analyzing 2nd year Radiological Technology students and their open lab requirement, only 9 out of 58 students have fully completed the total requirements at the mid-semester point. The remaining data will be gathered at the end of the semester, including any analytical correlation of increased open lab usage with final grades assessment.
Some of the objectives we will be looking at to see the correlation of grades with open lab ❑ Does increase number of open lab hours equal greater
competency or greater communication skills in the clinic setting
❑ Does the increase number of open lab hours correlate to a higher grade
❑ Compare/correlation of the didactic and clinical grades. ❑ When tracking 1st years, does the weekly requirement
lead to better technical performance during 1st clinical. ❑ Are the factors that impact first year utilization, have
the same impact during the 2nd year, and for clinical ❑ When comparing grades of students, and open lab hours
turn out a technically competent technologist or a compassionate, emphatic technologist.
Open lab requires students to think about what they are doing and why, while working collaboratively with others.2 In the end, students are self-directed, reflective, who can think critically, all the while building on the skills that are highly desirable in the field of medical imaging. Successful use of open lab requires that students know how to use and operate the equipment, as well as having all the needed imaging phantoms. The open labs are meant to expand upon the professor taught labs and to reinforce patient positioning and proper technique to create the optimal radiograph for diagnosis.
1. N. Abd. Rahman, N. Tan Kofli, M. S. Takriff and S. R. Sheikh Abdullah, "Comparative study between open ended laboratory and traditional laboratory," 2011 IEEE Global Engineering
Education Conference (EDUCON), Amman, 2011, pp. 40-44.
1. RITZLINE, PD, et al.OPEN LAB: AN INNOVATIVE TEACHING ADJUNCT. Physical
Therapy, May 1999, p. S51. Gale
First year students practice on each other to learn proper position of body parts and placement of the central ray for the X-ray machines.
Second year students in the clinical sites and some at the open lab learning proper machine replacement for portable X-rays.
The learning experience may vary for the senior students in the open lab as they are heading towards becoming a licensed technologist. Second year students are getting a real-life experience from their clinical sites by being able to work with real patients, however, they are required to complete certain hours in the open lab to work on their weakness and building self confidence. They have more responsibilities as to give the best care to the patient and take the best images possible for the radiologist to diagnose the patient.
Results
Utilizing surveys, we can gather snapshots of how the first year students are utilizing open lab and what external factors can impact their ability to use the lab during the hours that are available. This survey will be repeated before finals this semester and three more times for the first students in the Spring semester.
The importance gradient starts from zero which indicates no response to Very. Initial survey results demonstrate the students are “Very” satisfied with the availability and accessibility of open lab, low stress levels for completing open lab and high concern for the correlation of how open lab will affect their grades. As more surveys are completed, there may be shifting trends trends as first year students enter the clinical phase of their education.
PART I: COMPARATIVE ANALYSIS BETWEEN NATURAL AND CERAMIC TEETH Ibeth Erazo & Aneeza Hussain
Mentor Professor Daniel Alter
New York City College of Technology, Department of Restorative Dentistry, Honors Scholars Program, ESP, CRSP
Mature dentin is a crystalline material. Mature dentin is by Classification by Microstructure. At the microstructural ceramics
weight 70% inorganic material, 20% organic material, and are defined by the nature of their composition of glass-to-ABSTRACT
The aim of this study is to attain a general understanding regarding
the developments in the composition and indications of ceramics in
dental applications. An in-depth analysis of the evolution this
material has undergone during the last century in order to obtain
esthetic and functional dental prosthesis that replace natural teeth
when they are missing.
MATERIALS AND METHODS
• Selected articles from the PubMed database. Ten scientific
articles were selected.
• Key words: natural teeth, dental materials, dental ceramics,
ceramic restorations.
• Selection criteria: 2000 to 2019
• Experts consulted: Professor Daniel Alter CDT/MDT, Professor
Avis Smith CDT, experienced Ceramists.
INTRODUCTION
Dental Ceramic materials have physical and optical properties that
attempt to mimic the properties of natural teeth. The fabrication of
ceramic restorations for every case is a complex process due to the
particularities that natural teeth exhibit. Dental technicians must
work ceramic materials with the purpose of obtaining natural colors
aiming to achieve proper esthetics, as well as functionality and
durability. Valuable data for ceramic systems is becoming
increasingly available and results can be obtained with many
commercial materials, providing guidance, regarding proper
indications, in order to obtain successful results. However, dental
technicians are responsible for processing restorations that meet the
particular and desired characteristics for each case, because they
are to make the best decision with regards to the use of different
ceramic materials.
RESULTS
Natural Teeth
Figure 1. Tooth composition: pulp chamber (pc); enamel (e);
dentin (d); cemento-enamel junction (cej); cementum (c)
Mature enamel is a crystalline material. Mature enamel is by
weight 96% inorganic material, 1% organic material, and 3%
water. This crystalline formation consists mainly of calcium
hydroxyapatite/Ca10(PO4)6(OH)2. CO3, Mg, K, Na, F are
present in smaller amounts. The ribbon-like crystals of enamel are
set at different angles throughout the crown area, each 30% larger
than those in dentin. Enamel can endure crushing pressure of
around 100,000 pounds per square inch. Enamel appears
radiopaque (or lighter). Enamel alone is various shades of bluish
white, which is seen on the incisal ridge of newly erupted incisors,
but it turns various shades of yellow-white elsewhere because of
the underlying dentin.
10% water. This crystalline formation of mature dentin mainly
consists of calcium hydroxyapatite/Ca10(PO4)6(OH)2. Small
amounts of other minerals, such as carbonate and fluoride, are also
present. The crystals in dentin are plate like in shape. Dentin also
has great tensile strength, providing an elastic basis for the more
brittle enamel. Because of the translucency of overlying enamel,
the dentin of the tooth gives the white enamel crown its underlying
yellow hue, which is a deeper tone in permanent teeth. Dentin
appears more radiolucent (or darker).
Figure 2. Structural Characteristics of Enamel (left) and Dentin (right)
Ceramic Teeth
Dental ceramics are characterized by their refractory nature,
hardness, chemical inertness, biocompatibility and susceptibility to
brittle fracture. They are usually referred as nonmetallic, inorganic
structures primarily containing compounds of oxygen with one or
more metallic or semi-metallic elements like aluminum, calcium,
lithium, magnesium, phosphorus, potassium, silicon, sodium,
zirconium & titanium.
Physical And Mechanical Properties. Ceramics and glasses are
brittle, which means that they display a high compressive strength
but low tensile strength and may be fractured under very low strain
(0.1%, 0.2%) dental ceramics have disadvantages mostly due to
their inability to withstand functional forces that are present in the
oral cavity. The structure of porcelain depends upon its
composition, surface integrity and presence of voids.
Table 1. Physical and Mechanical Properties of Dental Ceramics
Classification Of Dental Ceramics. Microstructure and
Translucency are the two classifications to consider and focus on.
However, dental ceramics classifications interrelate.
Table 1. Physical and Mechanical Properties of Dental Ceramics
crystalline ratio. Ceramics can be broadly classified as non-
crystalline (Amorphous Solids or glasses) and Crystalline ceramics.
They can be broken down into four basic compositional categories,
with a few subgroups:
1. Composition category 1 – glass-based systems (mainly silica)
2. Composition category 2 – glass-based systems (mainly silica) with fillers
3. Composition category 3 – crystalline- based systems with glass fillers
4. Composition category 4 – polycrystalline solids (alumina and zirconia)
Figure 3. Dental Ceramics Based on Their Microstructure: (1) predominantly glass; (2) particle‐filled glass; and (3) fully polycrystalline.
Classification by Translucency. A natural tooth derives most of its
color as a result of the light reflectance from dentin that is altered
by absorption and scattering by the enamel. Several factors affect
the translucency of dental ceramics. Thickness of the material has
the greatest effect, but translucency can also be affected by the
number of firings, the shade of the substrate, and the type of light
source or illuminant. Porcelain translucency is usually measured
with the translucency parameter. or the contrast ratio (CR). The
chemical nature, size, and number of crystals in a ceramic matrix
will determine the amount of light that is absorbed, reflected, and
transmitted compared with the wavelength of the source light.
Figure 4. Relation Between Translucency and Opacity
All teeth that are naturally covered by the enamel present
opalescence. In ceramic systems, opalescence has been responsible
to solve aesthetic problems making possible to produce
unnoticeable restorations. The correct reproduction of opalescence
involves careful observation of adjacent teeth and the selection and
application of opalescent in appropriate locations.
Figure 5. Central Incisors Opalescence. Under Reflected Light (left). Under Transmitted Light (right)
Fluorescence is a luminescence phenomenon. Tooth fluorescence is
usually associated with a blue-white chromatic appearance caused
by the incidence of the UV wavelength. Under natural light,
fluorescence makes teeth more luminous and shinier, giving them
an internal luminescence. The incidence of UV wavelengths in a
tooth restored with nonfluorescent material causes metameric
failure and is responsible for highlighting the restorative material.
Fluorescence must be present in restorative materials to obtain
natural-looking results.
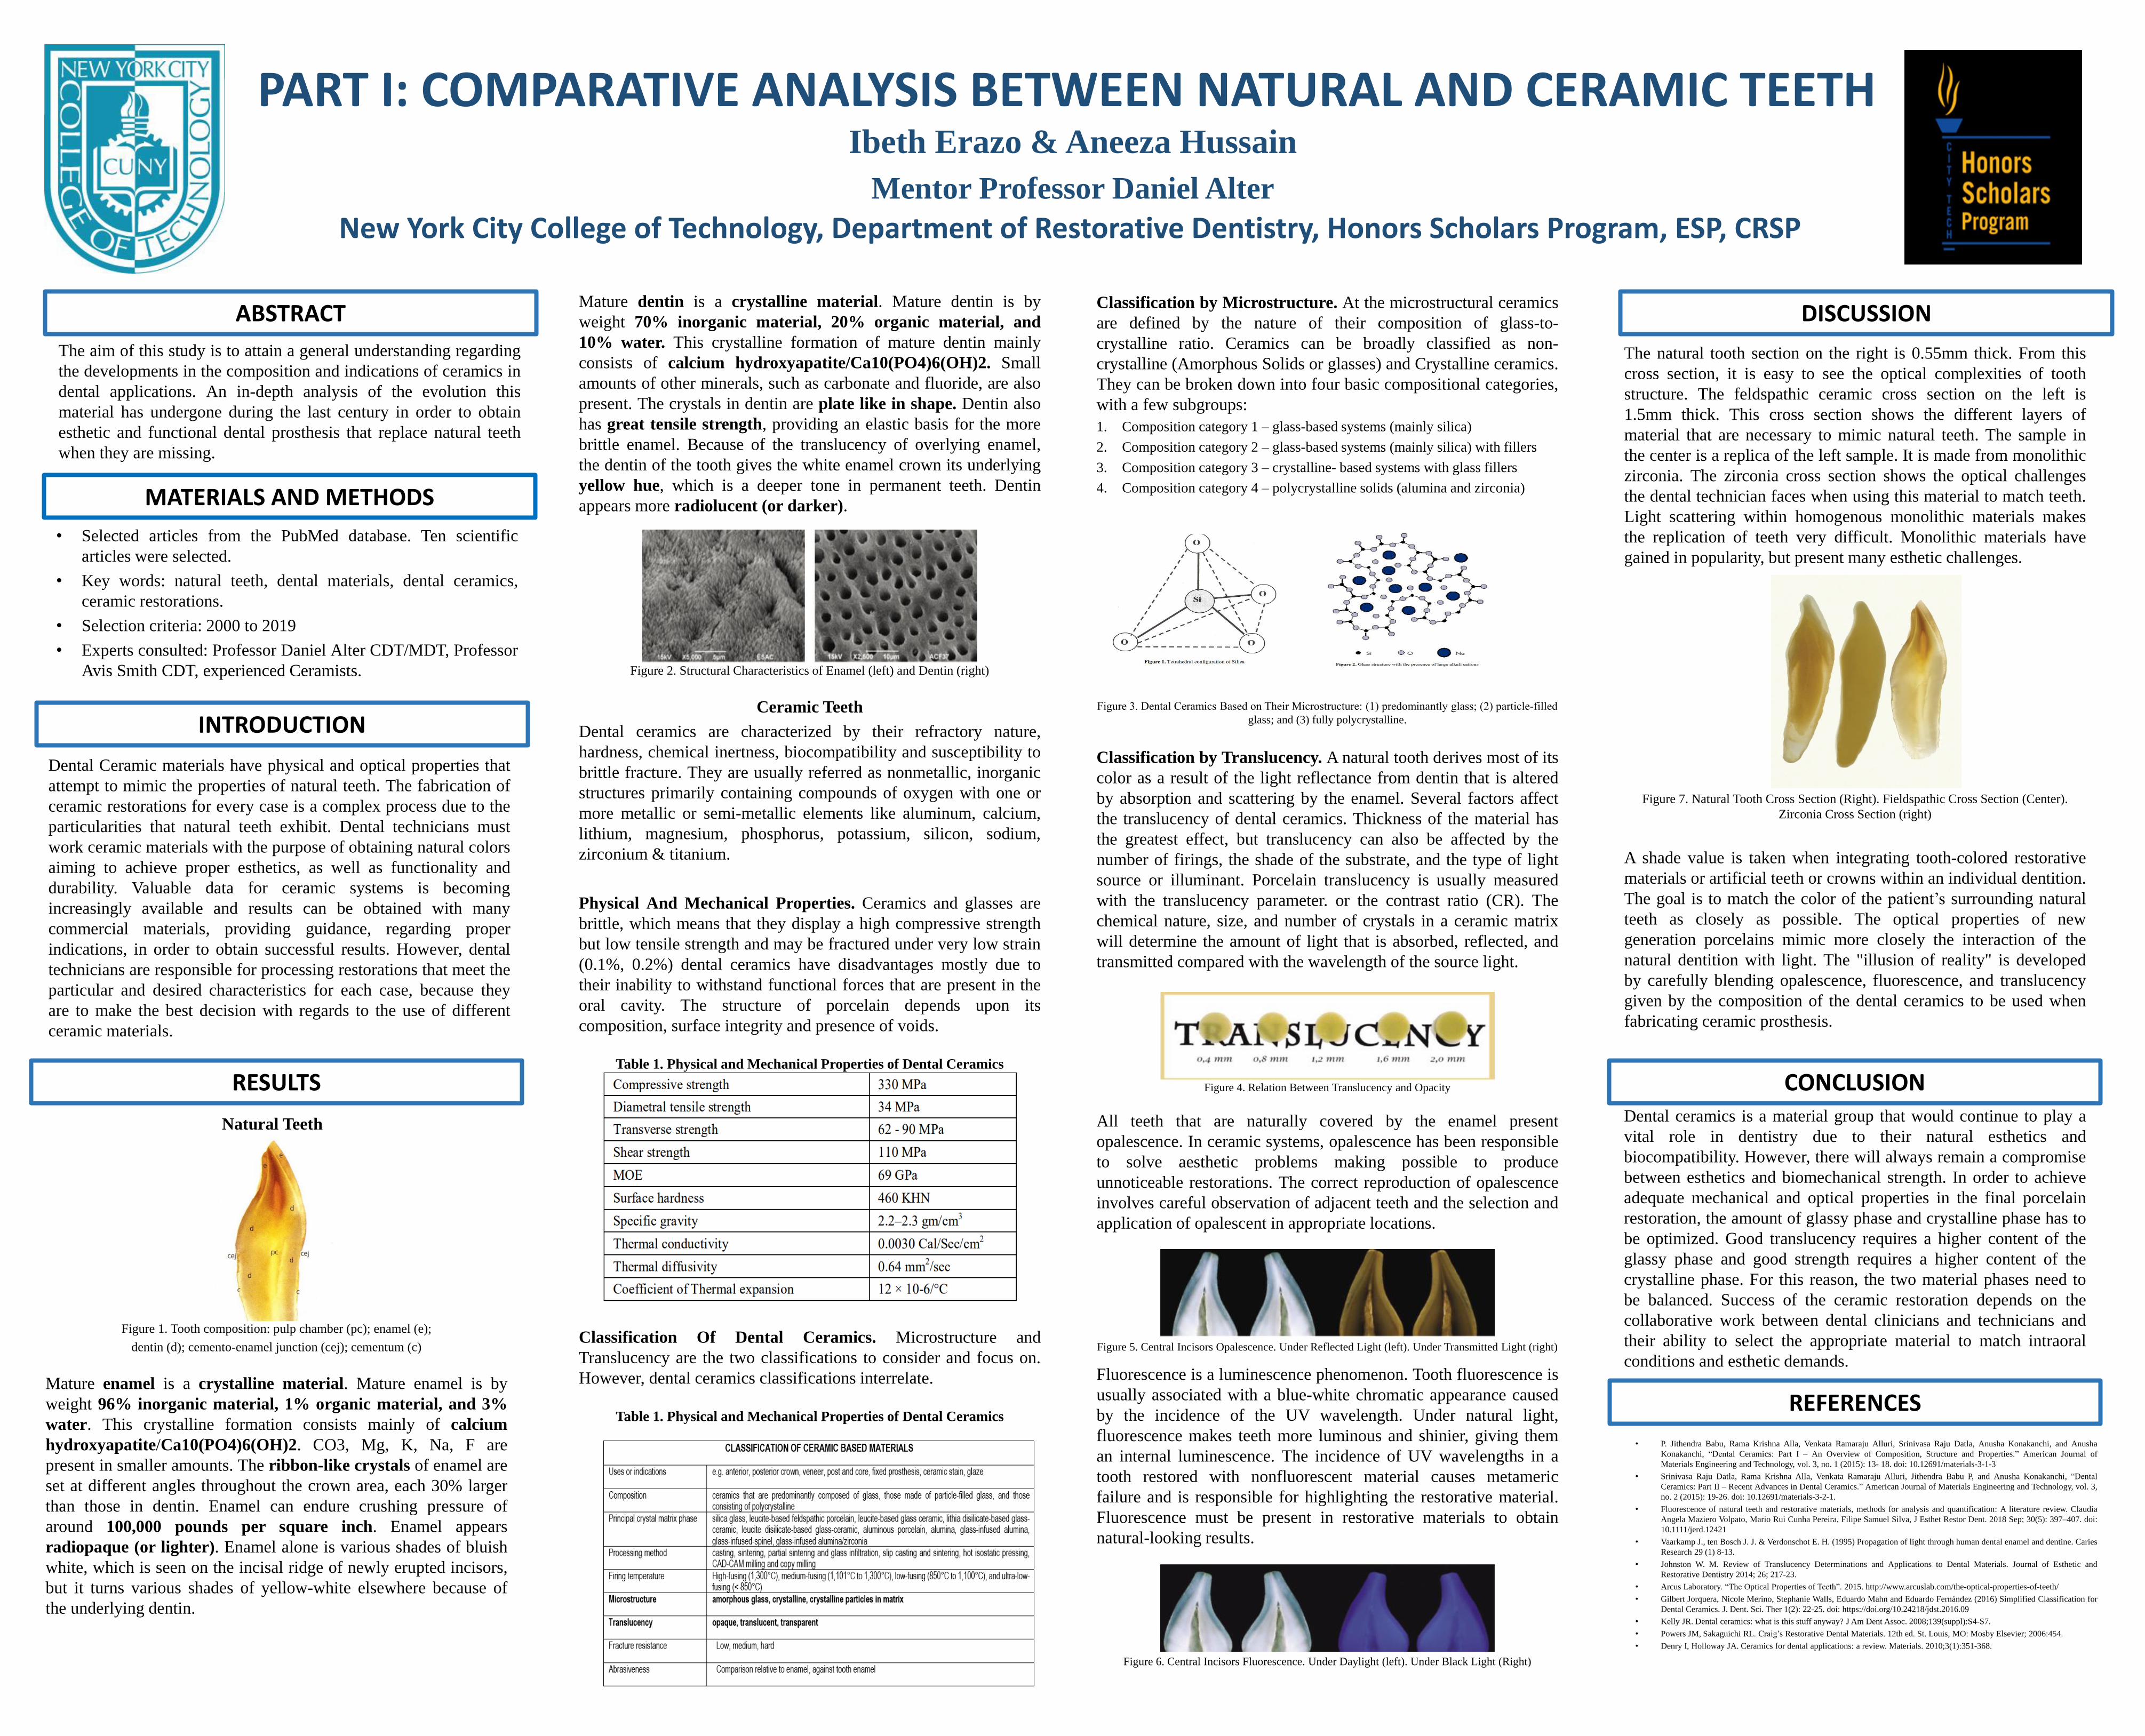
DISCUSSION
The natural tooth section on the right is 0.55mm thick. From this
cross section, it is easy to see the optical complexities of tooth
structure. The feldspathic ceramic cross section on the left is
1.5mm thick. This cross section shows the different layers of
material that are necessary to mimic natural teeth. The sample in
the center is a replica of the left sample. It is made from monolithic
zirconia. The zirconia cross section shows the optical challenges
the dental technician faces when using this material to match teeth.
Light scattering within homogenous monolithic materials makes
the replication of teeth very difficult. Monolithic materials have
gained in popularity, but present many esthetic challenges.
Figure 7. Natural Tooth Cross Section (Right). Fieldspathic Cross Section (Center).
Zirconia Cross Section (right)
A shade value is taken when integrating tooth-colored restorative
materials or artificial teeth or crowns within an individual dentition.
The goal is to match the color of the patient’s surrounding natural
teeth as closely as possible. The optical properties of new
generation porcelains mimic more closely the interaction of the
natural dentition with light. The "illusion of reality" is developed
by carefully blending opalescence, fluorescence, and translucency
given by the composition of the dental ceramics to be used when
fabricating ceramic prosthesis.
CONCLUSION Dental ceramics is a material group that would continue to play a
vital role in dentistry due to their natural esthetics and
biocompatibility. However, there will always remain a compromise
between esthetics and biomechanical strength. In order to achieve
adequate mechanical and optical properties in the final porcelain
restoration, the amount of glassy phase and crystalline phase has to
be optimized. Good translucency requires a higher content of the
glassy phase and good strength requires a higher content of the
crystalline phase. For this reason, the two material phases need to
be balanced. Success of the ceramic restoration depends on the
collaborative work between dental clinicians and technicians and
their ability to select the appropriate material to match intraoral
conditions and esthetic demands.
REFERENCES
• P. Jithendra Babu, Rama Krishna Alla, Venkata Ramaraju Alluri, Srinivasa Raju Datla, Anusha Konakanchi, and Anusha
Konakanchi, “Dental Ceramics: Part I – An Overview of Composition, Structure and Properties.” American Journal of
Materials Engineering and Technology, vol. 3, no. 1 (2015): 13- 18. doi: 10.12691/materials-3-1-3
• Srinivasa Raju Datla, Rama Krishna Alla, Venkata Ramaraju Alluri, Jithendra Babu P, and Anusha Konakanchi, “Dental Ceramics: Part II – Recent Advances in Dental Ceramics.” American Journal of Materials Engineering and Technology, vol. 3,
no. 2 (2015): 19-26. doi: 10.12691/materials-3-2-1.
• Fluorescence of natural teeth and restorative materials, methods for analysis and quantification: A literature review. Claudia
Angela Maziero Volpato, Mario Rui Cunha Pereira, Filipe Samuel Silva, J Esthet Restor Dent. 2018 Sep; 30(5): 397–407. doi:
10.1111/jerd.12421
• Vaarkamp J., ten Bosch J. J. & Verdonschot E. H. (1995) Propagation of light through human dental enamel and dentine. Caries
Research 29 (1) 8-13.
• Johnston W. M. Review of Translucency Determinations and Applications to Dental Materials. Journal of Esthetic and
Restorative Dentistry 2014; 26; 217-23.
• Arcus Laboratory. “The Optical Properties of Teeth”. 2015. http://www.arcuslab.com/the-optical-properties-of-teeth/
• Gilbert Jorquera, Nicole Merino, Stephanie Walls, Eduardo Mahn and Eduardo Fernández (2016) Simplified Classification for
Dental Ceramics. J. Dent. Sci. Ther 1(2): 22-25. doi: https://doi.org/10.24218/jdst.2016.09
• Kelly JR. Dental ceramics: what is this stuff anyway? J Am Dent Assoc. 2008;139(suppl):S4-S7.
• Powers JM, Sakaguichi RL. Craig’s Restorative Dental Materials. 12th ed. St. Louis, MO: Mosby Elsevier; 2006:454.
• Denry I, Holloway JA. Ceramics for dental applications: a review. Materials. 2010;3(1):351-368.
Figure 6. Central Incisors Fluorescence. Under Daylight (left). Under Black Light (Right)

Non-Destructive Testing on Concrete Shaylin Venitelli, Raadiya James, Professor Navid Allahverdi
Civil Engineering and Construction Management Technology
Abstract
The use of concrete in the world's infrastructure dates back centuries. Builders in Ancient Rome used limestone and volcanic rock to create structures more durable than many of those erected today. In order to assess the strength of existing structures the construction industry utilizes Non-Destructive Testing. Non-destructive testing applies to a diverse array of techniques used in science and technological fields in order to evaluate the properties of a material, component or system without causing damage. Non-destructive testing is applicable to many fields and circumstances in which properties are unknown or have changed due to time. It allows analysts to determine how strong structures are without destroying their integrity and preserving their form.
With the use of devices such as the Schmidt Hammer, the elastic properties, or strength of concrete, are determined through the rebound resistance that the tested material exerts on the device. The accuracy of non-destructive testing results will be assessed through comparison with results obtained from destructive techniques. With comparative data describing the benefits of non-destructive, the industry can focus on efficiency and productivity.
Research Findings
1. Determine the most efficient means of NDT • The Schmidt Hammer provides an
inexpensive means of analysis in determining the strength of concrete.
• Most NDT techniques are expensive and determine a variety of different properties.
2. Evaluate how the Schmidt Hammer works: • It determines the strength and homogeneity
of an existing concrete specimen. • It provides a value to allow the user to
analyze the compressive strength.
Schmidt Hammer for Sclerometric Method
The above images represent the process of taking a reading from a Humboldt Schmidt Hammer.
Depending on the position in which the test was taken, in this case Class A, the hammer rebound helps to determine the compressive strength in either PSI or MPa.
Future Analysis
In the semesters to come we will explore: • The Schmidt Hammer under proper
conditions to determine the strength of materials.
• Comparative data between non-destructive techniques and destructive techniques.
• Different types of NDT methods to determine different properties of the concrete specimen being examined.
• Analyzing and comparing data found.
Conclusion
The construction industry is a large contributor to how an economy functions and grows. With the constant need for concrete analysis the amount of waste that compiles daily is unfortunate. With the use of NDT approaches in the field the amount of waste can be limited in the construction industry. Once these procedures are adapted and implemented it can be an efficient means of determining the strength of structures both new and existing.
In the upcoming semester we hope to find valuable comparative data that will help to prove the reliability of NDT such as the Schmidt Hammer, as well as other means of NDT testing
Refernces
J. Hola, J. Bien, L. Sadowski, and K. Schabowitz. (2015). "Non-destructive and semi-destructive diagnostics of concrete structures in assessment of their durability". Bulletin of the Polish Acadamy of Sciences. Technical Sciences, Vol. 63, No. 1.

Machine Learning Application in Physical ComputingAuthor: Joan Beatrice Ladaban - Computer Systems Technology Department
Mentor: Professor Farrukh Zia - Computer Engineering Technology Department
ABSTRACTMachine Learning and Physical Computing are important areas of research. This project involves the use of Machine Learning and Physical Computing to control an autonomous robot. Machine Learning refers to writing code that learns from data and improves its performance and is a topic related to Software Engineering. Physical Computing refers to writing code to interact with the physical environment by using sensors and physical devices. This is a topic related to Hardware Engineering and where one can use open source hardware such as Arduino and Raspberry Pi. This research project combines the Software and Hardware aspects into one working system.
INTRODUCTIONThe first phase of this project is mostly focused on building the robot car, mounting the sensors and modifying the code. The code is a combination of the line tracking and obstacle avoidance code.
REFERENCES● DroneBot Workshop. “Building the Elegoo Smart Robot
Car.” DroneBot Workshop, Publisher Name DroneBotWorkshop Publisher Logo, 24 June 2019,
● DroneBot Workshop. “DC Motors with L298N DualH-Bridge and Arduino.” DroneBot Workshop, PublisherName DroneBot Workshop Publisher Logo, 24 June 2019.
● Workshop, Dronebot. “Analog Feedback Servo Motor.”DroneBot Workshop, Publisher Name DronebotWorkshop Publisher Logo, 20 Oct. 2019.
ACKNOWLEDGEMENTS● CUNY Research Scholars Program 2019 - 2020
● Professor Farrukh Zia from Computer Engineering
Department for encouraging students to be more involved
in technology related research projects.
FUTURE WORKIn the next phase of this project, the 3D printed case will be added on top of the robot to illustrate a model of the Volkswagencar. Raspberry Pi will be added in the future. LED lights will be added in front of the robot to mimic the headlights of a car.
HARDWAREFor this project, Arduino microcontroller is used to get input from sensors to do certain tasks. Arduino uses the C++ programming language. A shield is mounted on top of Arduino for the batteries and the bluetooth module. Direct Current (DC) motors control the movement of the car, which are located on the bottom side of the car. Raspberry Pi will be used in the next phase of the project to run machine learning code and the control car’s movement with the help of sensors.
PARTS LIST● Arduino UNO● DC and Servo Motors● Infrared Remote ● Line Tracking Sensor● Obstacle Avoidance Sensor ● Batteries ● LED Lights
PROGRAM CODE SAMPLEBLOCK DIAGRAM//servo library#include <Servo.h>//create servo objectServo myservo;//hardware connectionsint Echo = A4;int Trig = A5;#define ENB 5#define IN1 7#define IN2 8#define IN3 9#define IN4 11#define ENA 6#define carSpeed 200int rightDistance = 0, leftDistance = 0, middleDistance = 0;
//Ultrasonic distance//measurement sub functionint getDistance() {
digitalWrite(Trig, LOW);delayMicroseconds(2);digitalWrite(Trig, HIGH);delayMicroseconds(10);digitalWrite(Trig, LOW);return (int)pulseIn
(Echo, HIGH)/58;}
void loop() { //set servo position myservo.write(90);
middleDistance= getDistance();
rightDistance= getDistance();
leftDistance= getDistance();
if(rightDistance > leftDistance) { right();
delay(360); }else if(rightDistance <
leftDistance) { left();
delay(360); }else if((rightDistance<20)
|| (leftDistance<20)){ back();
delay(180); }else {
forward(); } }}

Augmented Reality Gaming: Harnessing Real-World Environment With Game Interactions
Steven Li; Prof. Mendoza
Computer Engineering Technology Department, New York City College Of Technology
Introduction
Augmented Reality or AR is a technology that allows people to use computers that bring visual objects which does not actually exist into the real world surroundings. AR technologies enhance the version of the physical environment with computer-generated sensory input such as sound, video, or graphics overlaid on top of the real-world view. AR can also be used to improve the user experience while interacting with the world. Today, some examples of AR games consist of Pokémon Go and Zombies Run!. These games display virtual characters in the real-world using smartphones, capturing the surrounding environment, and embedding the virtual characters as if they were real ones. In these games, players are also able to interact and play against each other. AR has other uses beyond gaming, for example, it can be used to display an interactive MTA map just by scanning a small barcode. In this project, we focus on making virtual characters interact with the real-world environment and explore more possibilities on how AR can be used to communicate between the people and virtual objects. Many AR applications bring virtual objects to the real-world environment but are unable to make them interact with real objects around them because both objects are in two different worlds. Our goal is to make AR interact with real-world objects like they actually coexist in a cyber-physical world.
•
•
•
Process
An AR camera was added in order to catch the characters and display it to the real world.
Like any other games, two characters will attack each other while also being affected by the objects that surround them in the actual world.
Objects like a box will be placed in the game world between them, making them unable to pass. If there was also a box like structure between them in the real world, then it will make it seem as if the characters are really interacting with them.
•
•
•
Results
Through the camera on the computer, the characters was able to be seen in the real world.
Both characters was able to move and interact with each other.
The box in the image will serve as an object like a notebook. If a real notebook exist in the real world, then when the box and notebook overlap together, it will look like as if the characters are touching the notebook.
Next Step
In the next step of the project, I will try to display the AR image through goggles instead of other electronic devices such as a smart phone or computers. The reason behind to this next step is because goggles are much easier to wear and bring around to scan AR than a phone. There are limits to how much a phone can capture while when using AR goggles, it is able to capture much more view and objects all at once.
Additionally, I will also find a new way in how people can scan barcodes or other actions using buttons existing on AR goggles. If people are able to use their hands to give out instructions to the AR goggles, then it would definitely be a lot easier for people to use.
Conclusion
AR have always been used in a way where people are able to see the virtual image created but are unable to react with the real environment. Therefore, I think by creating a shape like object in the virtual world and make it coexist with a same shape object, then it is able to make the characters and object move at the same pace.
If AR are able to communicate with the real world, then in a way, it would make it more realistic and more fun.
References
- AR goggle image from the following website: https://arpost.co/2018/08/27/the-big-year-for-
ar-your-ar-glasses-intro-guide-for-2018/
Acknowledgements
Thanks to Prof. Mendoza for introducing me to CRSP and supporting me in this project.
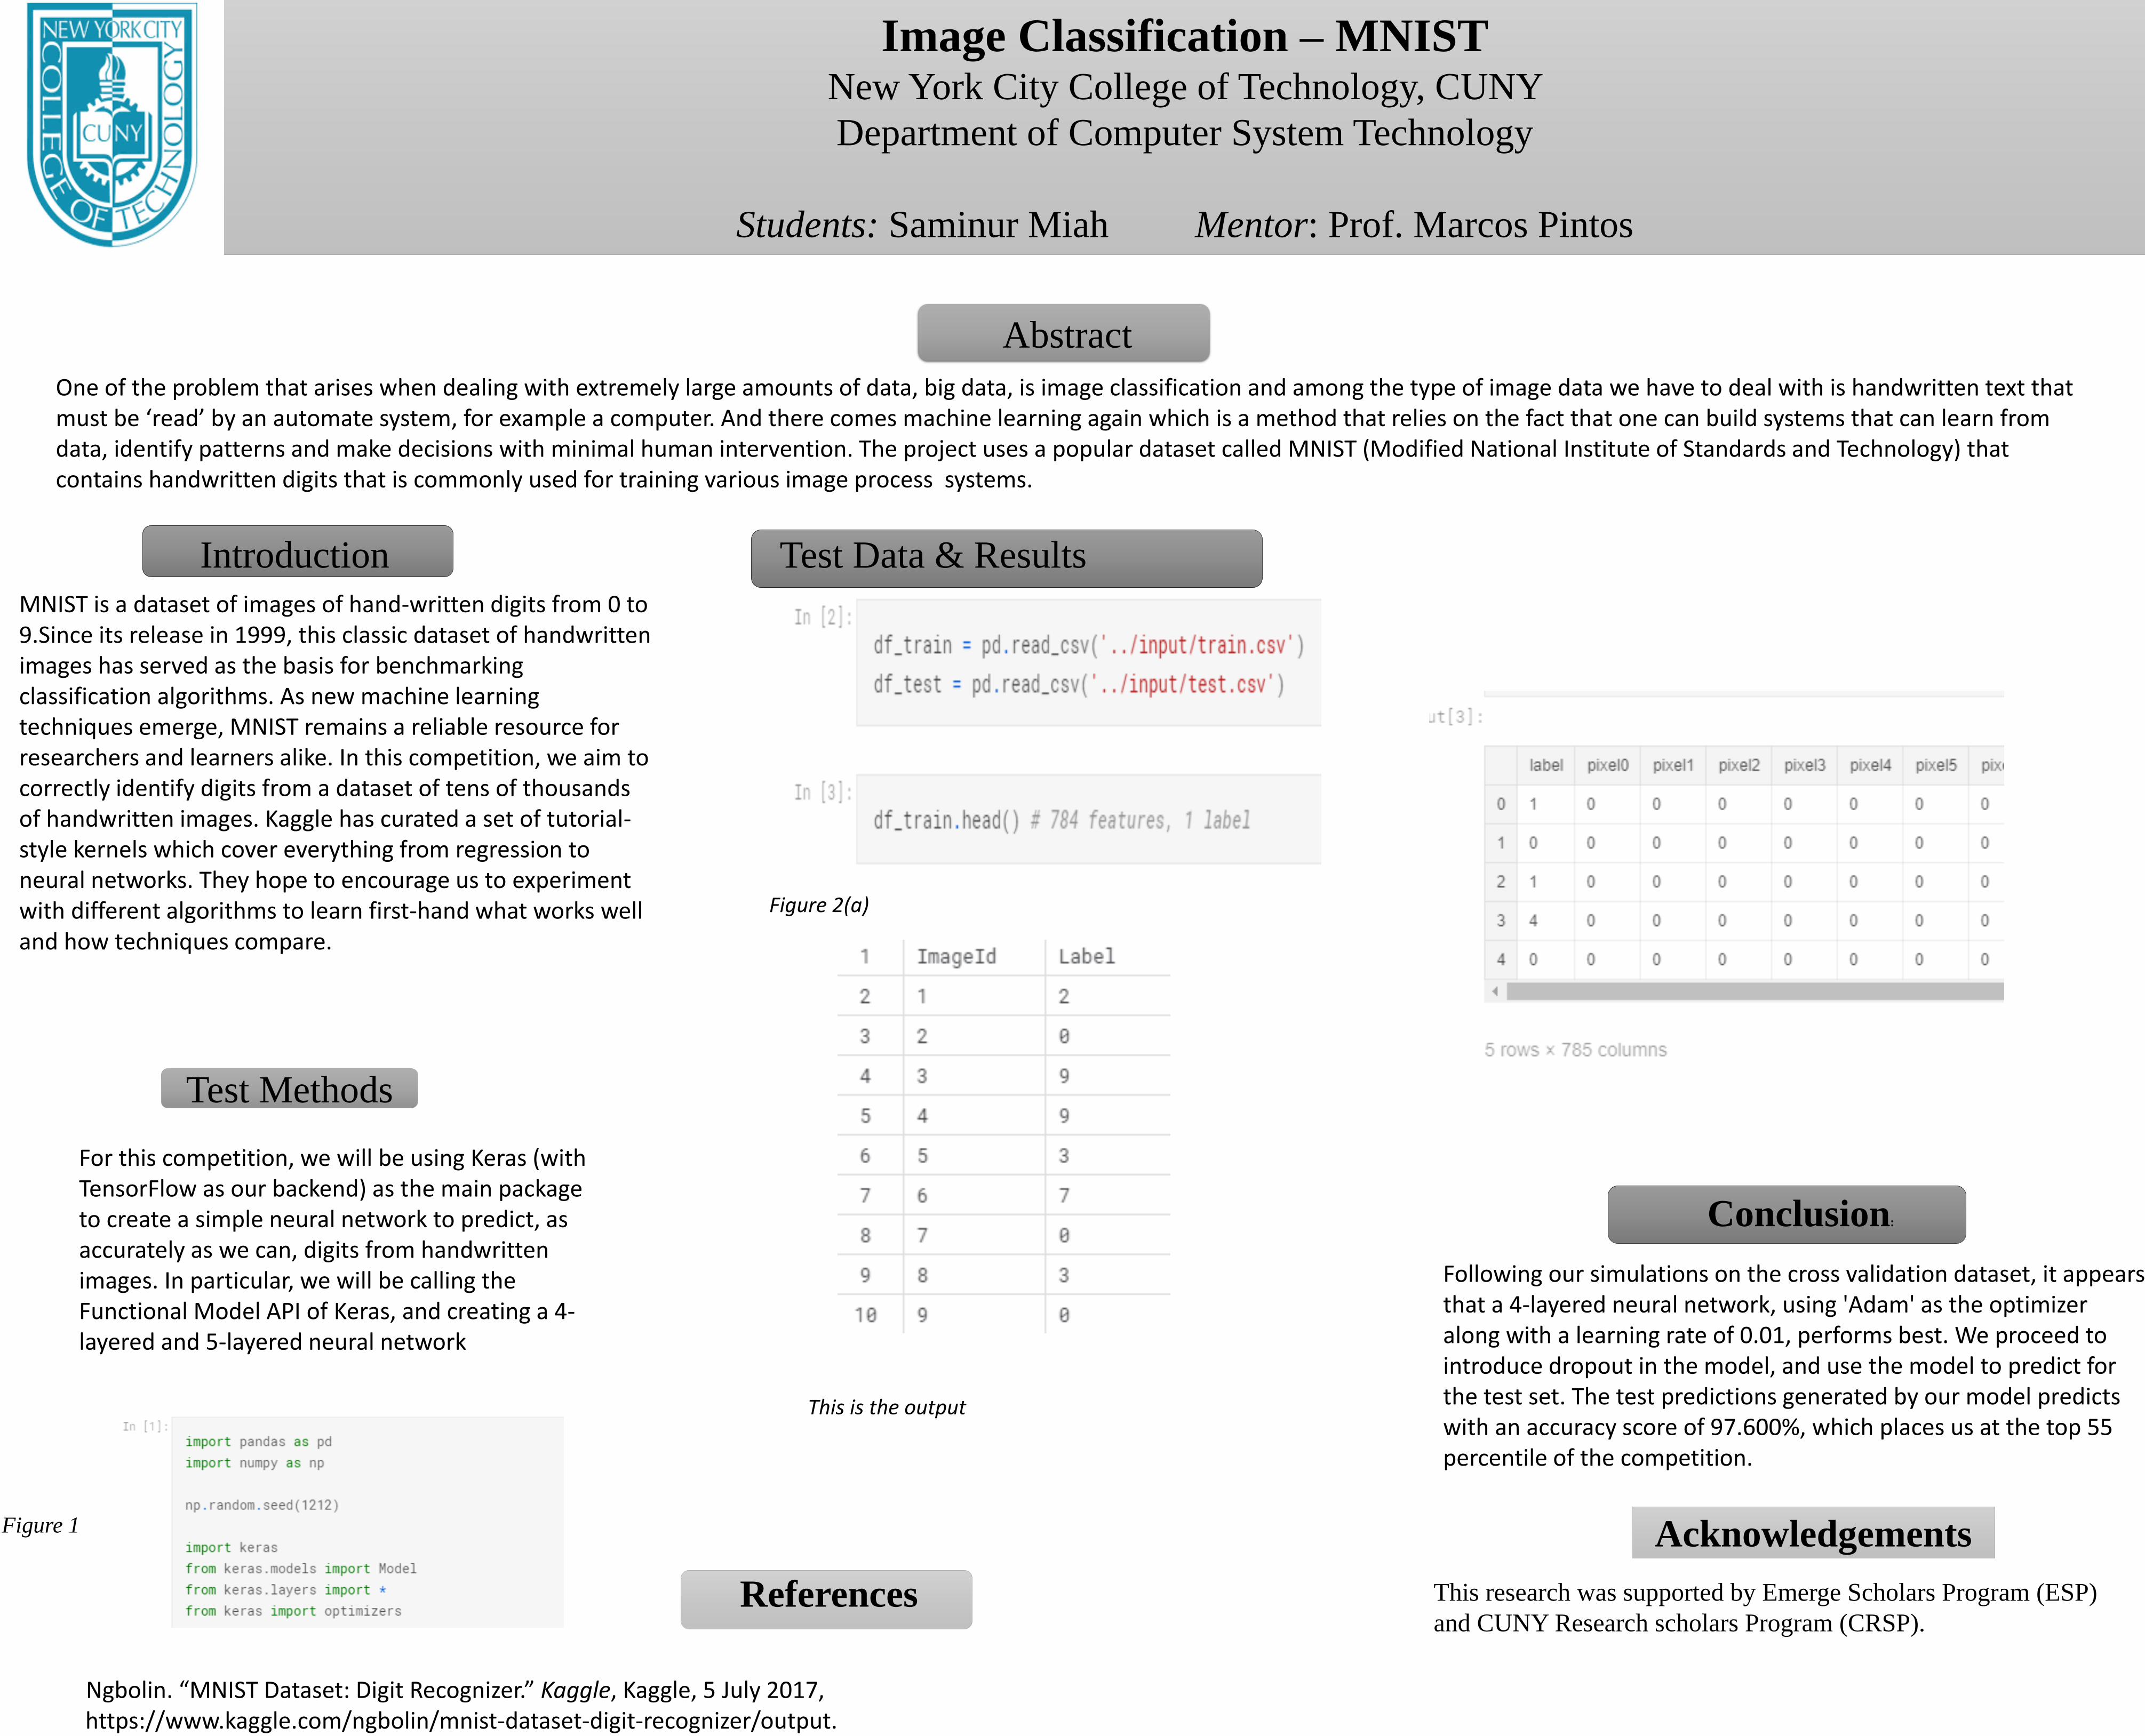
Image Classification – MNIST New York City College of Technology, CUNY
Department of Computer System Technology
Students: Saminur Miah Mentor: Prof. Marcos Pintos
Abstract
One of the problem that arises when dealing with extremely large amounts of data, big data, is image classification and among the type of image data we have to deal with is handwritten text that must be ‘read’ by an automate system, for example a computer. And there comes machine learning again which is a method that relies on the fact that one can build systems that can learn from data, identify patterns and make decisions with minimal human intervention. The project uses a popular dataset called MNIST (Modified National Institute of Standards and Technology) that contains handwritten digits that is commonly used for training various image process systems.
Introduction Test Data & Results
MNIST is a dataset of images of hand-written digits from 0 to 9.Since its release in 1999, this classic dataset of handwritten images has served as the basis for benchmarking classification algorithms. As new machine learning techniques emerge, MNIST remains a reliable resource for researchers and learners alike. In this competition, we aim to correctly identify digits from a dataset of tens of thousands of handwritten images. Kaggle has curated a set of tutorial-style kernels which cover everything from regression to neural networks. They hope to encourage us to experiment with different algorithms to learn first-hand what works well and how techniques compare.
Figure 2(a)
For this competition, we will be using Keras (with TensorFlow as our backend) as the main package to create a simple neural network to predict, as accurately as we can, digits from handwritten
Conclusion:
Following our simulations on the cross validation dataset, it appears images. In particular, we will be calling the that a 4-layered neural network, using 'Adam' as the optimizer Functional Model API of Keras, and creating a 4-along with a learning rate of 0.01, performs best. We proceed to layered and 5-layered neural network introduce dropout in the model, and use the model to predict for the test set. The test predictions generated by our model predicts This is the output with an accuracy score of 97.600%, which places us at the top 55 percentile of the competition.
Figure 1 Acknowledgements
References This research was supported by Emerge Scholars Program (ESP)
and CUNY Research scholars Program (CRSP).
Test Methods
Ngbolin. “MNIST Dataset: Digit Recognizer.” Kaggle, Kaggle, 5 July 2017, https://www.kaggle.com/ngbolin/mnist-dataset-digit-recognizer/output.

Implication of local weather on heat transfer rates by infiltration Anthony Rivera and Kyungmin Park
Department of Environmental Control Technology and Facilities Management, New York City College of Technology Mentor: Prof. Daeho Kang
ABSTRACT The first law of thermodynamics, also known as “Law of Conservation of Energy”, states that energy can neither be created nor destroyed; energy can only be transferred or changed from one form to another. The natural transfer of heat flows from a warmer environment to a colder environment. Infiltration through a building entrance door has major impacts on the indoor thermal environment, indoor air quality and energy performance. In our research, we measured differential pressure and air velocity across entrance doors. We also monitored the indoor and outdoor environments in the Environmental Building by collecting data using specialized instruments and sensors. After analyzing the measured data, we were able to calculate the heat transfer of the infiltration through the entrance doors. Finally, we were able to compare the heat transfer rates calculated from local weather and standard weather.
INTRODUCTION The Architectural Design for a building has an effect on the day to day operations and functionality. This is especially true when it comes down to deciding what materials to choose for the building envelope, determining where to place the entrance doors & what types of entrance doors to use. These factors have a direct impact to the indoor thermal environment, indoor air quality & the building energy performance. For this project we conducted research on infiltration through the entrance doors in the Environmental Building. On a cold winter day, we measured local weather conditions, along with other environmental parameters in the Environmental building. With the measured data we were able to accurately calculate the airflow rates & quantify energy losses through the entrance doors. This poster presents the methods we developed & the significance of the weather sources in the calculation of heat transfer rates by natural air flow through building entrance.
RESULTS Table 2 Heat loss calculated by two weather data sources in Environmental Building
Variable Measured Weather Standard Weather
Door 1 Door 2 Door 1 Door 2
Velocity (fpm) 109 139 350 351
Flow Rate (CFM) 2179 2756 6999 7017
Temp Difference (F) 9.8 9.6 11.3 11.6
Heat Loss (MBTU) 24 29 86 86
DISCUSSION This is part of a long-term project to investigate the impact of infiltration through building entrance doors. This poster focuses on the influence of weather resources on the prediction of the infiltration through entrance doors. We have developed a method to accurately quantify infiltration rates and successfully estimate the heat losses due to the infiltration as shown in Table 2. Table 2 shows that using the local measured weather is critical in the accurate prediction of heat losses through building entrance door. Standard weather data is widely used to predict physical phenomena taking place in buildings and their surroundings. The heat transfer rates of infiltration are solely dependent on the weather data since the energy equation is the function of an air flow rate and a temperature difference. The results indicate that if the standard weather data is continuously used to quantify heat loss through buildings entrance door will lead to the system being oversizing and the heat loss being overestimated. As infiltration may improve indoor air quality, this aspect should also be studied.
METHODS
Figure 1 The measuring points on a building plan and the section of entrance doors
This differential pressure across the entrance doors in in. wg. can be expressed as
𝑃𝑑𝑖𝑓𝑓 = 𝑃ℎ − 𝑃𝑙 where 𝑷𝒉 is high-pressure side in in. wg. and 𝑷𝒍 is low-pressure side in in. wg. The air flow rate in CFM across the entrance doors is expressed as
𝑄 = 𝐴𝑉
where A is the area of doors and V is the velocity of incoming air in fps. The energy equation is used to calculate the heat transfer rate of the natural airflow as
𝑞ሶ = 1.1𝑄∆𝑡
where ∆𝑡 is temperature difference in °F between outdoor air and indoor air.
Table 1 Measuring parameters and specification of the measuring instruments
Parameters Instrument Measuring Interval
Range Accuracy Resolution
OA Temp/RH HOBO MX2301 1 min -40-70°C ±0.2°C 0.04°C
Indoor Temp HOBO U10 1 min -20-70°C ±0.53°C 0.14°C
Door Opening HOBO UX90-6M 1 sec 12m / 102° - -
Velocity TSI Velometer - 0-20 m/s ±5% 0.01 m/s
Wind Speed HOBO U30 1 min 0-76m/s ±4% 0.5m/s
Wind Direction HOBO U30 1 min 0-355° ±5° 1.4°
REFERENCES H Cho, K Gowri, and B Liu. “Energy saving impact of ASHRAE 90.1 vestibule requirements: modeling of air infiltration through door openings.” Technical Report PNNL-20026, 2010. B.A. Cullum, O Lee, S Sukkasi, and D Wesolowski. “Modifying habits towards sustainability: a study of revolving door usage on the MIT campus., 2006. Lin Du. “Air Infiltration through Revolving Doors.” Master’s Thesis. 2009. Yuill GK. 1996. Impact of high use of automatic door on infiltration. ASHARE Research Project 763-TRP. PA: University Park.

------------------------
MQTT Protocol for Application of In Internet of Things (IOT)
Student: Yani Acham A Yaou Zakari Maidama Mentor: Professor Xinzhou Wei
Abstract The Internet of Things (IoT) refers to a vast number of “things” that are connected to the internet so they can share data with other things. ThingsBoard is an open-source IoT platform that enables rapid development, management and scaling of IoT projects. With ThingsBoard, we can collect and visualize data from devices and assets.
Introduction In our research topic we get familiar with internet of things in ThingsBords, it is a free open source grant by the government, it is used by most of technology companies in the USA.
MQTT can analyze incoming telemetry and trigger alarms in our system. MQTT is a publish-subscribe-based messaging protocol used in the internet of Things. It works on top of the TCP/IP protocol, and is designed for connections with remote locations where a "small code footprint" is required or the network bandwidth is limited. The goal is to provide a protocol, which is bandwidth-efficient and uses little battery power. So, it’s the perfect solution for Internet of Things applications. In our research project, we adopt the MQTT protocol with an open source platform, Thingboard, to collect real time data and display them in real time with user design dashboard. MQTT Integration allows to connect to external MQTT brokers, subscribe to data streams from those brokers and convert any type of payload from your devices to ThingsBoard message format. Its typical use is whenever your devices are already connected to external MQTT broker or any other IoT platform or connectivity provider with MQTT based back-end.
Fig. 1 MQTT bing.com • ThingsBoard Website https://thingsboard.io/docs/samples/arduino/temperatur e/
Figure 2 Knowledge MQTT cloud • Thank you to Professor Xinzhou Wei to his
explanations on MQTT,
clc
close all
s=tf('s');
R=0.4e3;
R1=10;
%find inductance and capacitance from
impedances and frequencies
L=(5e3)/(2*pi*5e3);
C=1/((5e3)*2*pi*pi*5e3);
XL=s*L;
Xc=1/(s*C);
%transfer function
G=(R1+XL+Xc)/(R+R1+XL+Xc);
disp('Required transfer function')
minreal(G)
bode(G)
grid on
%this is notch filter or band reject
filter
%with fo=5kHz
Required transfer function
ans = Fig. 3 System circuit
Fig. 4 Code MQTT System Fig.5 hardware Systeme use by MQTT
s^2 + 62.83 s + 3.101e09
s^2 + 2576 s + 3.101e09
Continuous-time transfer function.
Fig. 3 code of high band system
References
Plot .
Fig. 4 MQQ Ssignal represented n the modulated signal.
Conclusion MQTT is an open OASIS and ISO standard lightweight publish-subscribe network protocol that connect information between devices. MQTT use two different signals to create a modulated signal. MQTT also use frequency and other modulate the amplitude between the connection of Things. In this research we learned about how MQTT use intelligent in ThingsBoard, although it suppresses the carrier leaving only the sidebands. In amplitude modulation we also use a carrier signal superimposed on the intelligence signal, the benefit of this design is that to demodulate the signal we can use a single rectifier diode circuit in the application of things.. That is also the reason why MQTT is more widely used than because the process is very easy and can be achieving without having any noise.
Network Access Methods Use by MQTT . When multiples device need to share a communication or connect line, access methods are required to identify which devices can transmit data at appropriate time, this technique is called polling and selecting. MQTT use the broadband networks apply the frequency division, separating the communications line into many different frequency channels. The most common types of access methods use by MQTT are contention methods : Ethernet. Since the wireless technology can also be used to interconnect two wired networks, as result MQTT have also been used widely adopted by home users, technology companies, who prefer to plug in Ethernet for live video, home safe camera connect to the cellular or devices.