crosscutting social circles and political choice
TRANSCRIPT

Social Networks 22 (2000) 313–335
Crosscutting social circles and political choiceEffects of personal network composition on voting
behavior in The Netherlandsq
Paul Nieuwbeerta∗, Henk Flap1
Utrecht University, P.O. Box 80125, 3508 TC Utrecht, The Netherlands
Abstract
This paper describes the personal networks of those who were eligible to vote in The Netherlandsin 1998. It also examines and tests alternative explanations for the effects of the social compositionof networks on voting behavior. To this end, data were collected in two representative nationalsurveys (validN = 3148). Multinomial logistic diagonal reference models are applied to analyzethese data. The results show that the personal networks of the Dutch are homogenous with respectto religion, education and social status. These characteristics of members of personal networkshave significant effects on the respondent’s voting behavior, effects that are stronger for social tiescharacterized by intimate contact. There were no effects of crosscutting social circles on not voting.Contrary to what was expected, ego’s similarity to his network members did not affect his votingeither. We interpret our findings in terms of a process of social influence through direct ties ratherthan of social comparison to similar others. © 2000 Elsevier Science B.V. All rights reserved.
1. Introduction
The influence of the social networks people are enmeshed in on their voting behavior is aclassic research theme in political sociology and political science (Knoke, 1990a, pp. 29–56;Huckfeldt and Sprague, 1995; Carmines and Huckfeldt, 1996). In their study ‘The People’s
q Earlier versions of this paper were presented in sessions at the annual meeting of the Dutch sociologicalassociation on May 27, 1999 in Utrecht and at the annual meeting of the Dutch political scientists on June 10–11,1999 in Doorn, both in The Netherlands.
∗ Corresponding author. Tel.:+31-30-253-3550; fax:+31-30-253-3388.E-mail address:[email protected] (H. Flap).
1 When writing this paper, Paul Nieuwbeerta and Henk Flap were affiliated with the Department of Sociology/ICSResearch School, Utrecht University, The Netherlands. Address correspondence to Henk Flap: Department ofSociology, Utrecht University, Heidelberglaan 1, 3584 CS Utrecht, The Netherlands.
0378-8733/00/$ – see front matter © 2000 Elsevier Science B.V. All rights reserved.PII: S0378-8733(00)00029-0
314 P. Nieuwbeerta, H. Flap / Social Networks 22 (2000) 313–335
Choice’ (1944), more than 50 years ago Lazarsfeld, Berelson and Gaudet emphasized theimportance of personal influence in how voters make up their mind: “. . . face-to-facecontacts turned out to be the most important influences stimulating opinion change” (1944,p. xiii). In ‘the American Voter’ Berelson et al. (1954) again addressed personal contacts andtheir role in political participation, which they saw as an important factor in the differencesin party preference and political voting behavior between various social groups.
Even after this promising start, the network approach has rarely been used in electionstudies. This is partly due to the rise of other theories. After the famous Columbia school casestudies by Lazarsfeld, traditional democratic theories prevailed. They focus on the individualand his capacity to make informed decisions. No wonder they stimulated the emergence ofeconomic voting theories that portray the voter as a rational consumer (Downs, 1957), butresearch into the social processes through which political party preferences are acquiredwas momentarily overlooked.
In addition, voting research in the United States and in Europe as well has been stronglydominated by a psychological approach stressing the role of political values and partyidentification (Campbell et al., 1960). Political values and party identification are assumedto be acquired through personal contacts, but in an early stage of life in the family of origin.That is why this approach devoted so little attention in its empirical research to the roleplayed by adults’ social networks, e.g. within the neighborhood or at work.
Voting research only recently regained interest in social networks. Huckfeldt and Sprague(1991, 1995) contributed to this when they charted personal networks in South Bend,Indiana, and their influence on political behavior. Burt (1984) was also instrumental inthis revival. He included questions on the social composition of respondents’ personal net-works in the 1985 general social survey (GSS) in the United States. In the 1987 GSS, thesenetwork questions were repeated and supplemented by questions on the political preferenceof the respondent and his network members. This made it feasible to analyze the effectsof the composition of a person’s social network on his political preference for a large rep-resentative national sample (Knoke, 1990a,b). In other countries, like UK (Harrop et al.,1991) and Israel (Burstein, 1976), similar efforts were made to revive research on networksand voting.
We build on earlier contributions and improve upon them in at least three respects. Firstwe study The Netherlands, a country where the influence of personal networks on politicshas not been studied before. This puts the case of The Netherlands in an internationalcomparative perspective, and allows us to shed some light on one of the features thatmake The Netherlands unique in a comparative respect: we study the classic question ofwhy political strife was so peaceful in Dutch society although it was strongly pillarized,i.e. divided along religious and political lines throughout the last century at least until 1960(Kruyt and Goddijn, 1961; Lijphardt, 1968). People lived their everyday life with religiouslylike-minded people, and were usually members of associations based on criteria of religionor worldview.
One explanation is that notwithstanding these cleavages, there were many crosscuttingsolidarities, especially class based ties that induce people to take a less extreme politicalposition (Ellemers, 1968; Flap, 1997). In our contribution, we test this idea for the first timein a Dutch context. In other words, class-based voting is less important in The Netherlandsbecause class divisions are crossed by religious ones. The idea is that ‘Kreuzung sozialer

P. Nieuwbeerta, H. Flap / Social Networks 22 (2000) 313–335 315
Kreise’ creates conflicting loyalties that make it difficult for people to choose either side(Simmel, 1910; Lipset, 1960; Ellemers, 1968; Lijphardt, 1968; Blau and Schwartz, 1984;McAllister, 1983; Flap, 1988, 1997).
Secondly, in contrast to earlier studies like the GSS (see Knoke, 1990a,b), we collectednational representative data on both political and social characteristics of network members.This enables us to confront different theories on the effects of social networks on voting.Thirdly, we introduce diagonal reference models in network analysis. These models havebeen used before to analyze the effects on political choice of social mobility and mixedmarriage (de Graaf et al., 1995; Nieuwbeerta, 1995, 1996; Nieuwbeerta and Wittebrood,1995; van Berkel, 1997). We show how they can be used to analyze the effects of mixedsocial networks on political choice.
To study the role of personal networks in voting in The Netherlands, we employ newdata collected in two large surveys in 1998 during the elections for the Dutch nationalparliament, the so-called Tweede Kamer. In these surveys, a representative sample of theDutch population above the age of 18 years was asked to fill out a written questionnaire.In addition to the many characteristics of the respondents themselves, this questionnaireasks explicitly about the features of the three most important alters in the respondents’social networks. These characteristics pertain to their religion, education, social status andpolitical preference. This information makes it possible to gain a better insight into the roleof the voter’s social network in the decision which party to vote for. In addition, it allowsus to say something about the mechanism that produces the association between specifictypes of networks and specific types of voting behavior. In this paper we will answer thefollowing major questions.1. To what degree are personal networks of the Dutch homogeneous with respect to material
and ideal interests as indicated by the religion, education and social position of thenetwork members?
2. To what extent does the social composition of someone’s personal network influence hisor her own voting behavior? More specifically, how strong is the effect of coinciding orcrosscutting social circles on people’s voting behavior?
3. How can the effect of someone’s personal network on his or her voting behavior beexplained? Are these effects the outcome of direct social influence or of social compar-ison processes?
2. Social networks and voting behavior
In ‘The People’s Choice’, Lazarsfeld, Berelson and Gaudet demonstrated already in 1944that when they vote, people are influenced by whom they interact with socially. This kindof personal influence is more important than the statements that are made in the course ofpolitical campaigns. Moreover, to the extent that the media and political campaigning dohave an influence on voting, it is mediated by a person’s social contacts. This discoveryled to the notion of a ‘two-step flow of communication’ (Katz, 1957; Weatherford, 1982;Huckfeldt, 1986).
Lazarsfeld et al. (1944) assume voting to be a social act and hold that a person’s valuesand preferences, including political preferences, are directly influenced by those they have

316 P. Nieuwbeerta, H. Flap / Social Networks 22 (2000) 313–335
direct contact with. This is referred to as direct political influence or political assimilation orsocialization (Jennings and Niemi, 1974, 1981; Huckfeldt and Sprague, 1995). The longerand more intensive this interaction is, the greater the influence will be (Katz, 1957).2 EarlierDutch research shows that parents and partners play a major role in how someone acquires aparticular party preference (Nieuwbeerta and de Graaf, 1993; Nieuwbeerta and Wittebrood,1995; Need, 1997; van Berkel, 1997; Jansen et al., 1998). Based on these ideas we formulatethe following hypotheses.• The more people from a specific group there are in someone’s network, the greater the
chance that he will vote according to the ‘typical’ voting behavior of members of thatgroup (controlled for social characteristics of the focal person).
• The more ‘intimate’ the relationship, the more frequent the interaction and the politicaldiscussions they have, the stronger the relative influence of that network member will beon the voting behavior of the focal person (socialization hypothesis).In the following discussion, the notion of personal network influence was specified in
still other ways (for a review, see Flanagan, 1991, pp. 146–150; Carmines and Huckfeldt,1996). Some authors assume that voting is less of a social act, than a result of rationalchoice. People are thought to have a preference for whatever political party they thinkbest serves their interests (Downs, 1957). This could explain why people in similar socialpositions, including network positions, often demonstrate the same voting behavior. Thissocial network influence is not generated by the fact that people copy a certain politicalopinion from their direct social environment. It is because they acquire political informationin a cheap fashion by looking at what others do who are similarly placed in the world,including their network position (Downs, 1957; Huckfeldt and Sprague, 1991; Popkin,1991).3 Working from this idea we have formulated the next hypothesis.• If a network member belongs to the same group as ego, his relative influence on the
voting decision of ego is greater than if he or she belongs to another group (hypothesison reference groups and interests).Burt (1987), who was the first to distinguish the two mechanisms referred to above, calls
the socialization mechanism ‘contagion by cohesion’ and the reference group mechanism‘contagion by equivalence’. Although the two mechanisms differ considerably, the hypothe-ses generated by them do not necessarily conflict. The more others people have around themwho share the same interests, values and political preferences, the clearer they will be aboutwhich political party will best serve their interest. The more homogeneous someone’s per-
2 McAllister (1983) conducted research in Northern Ireland on the political consequences of various types ofsocial contacts between the two socially segregated religious communities of the protestants and catholics. Ofall the contacts with different-minded people, only the ties with in-laws of the other religion had a significanteffect on the voting behavior, probably because only within the confines of close family did people trust eachother enough to discuss politics. Implicitly McAllister worked from the hypothesis that in social situations, whererelative strangers are afraid of each other, crosscutting social circles have an effect only if they consist of strongties (for a very similar effect, be it in a communist context, see Völker and Flap, 1997).
3 From a theoretical point of view, this assumption on networks and search costs has special importance since ina certain sense voting outcomes are collective goods. The individual contribution of the single voter has very littleeffect on the production of the voting outcome. This is why people do not bother to vote, let alone to find out whatparties are standing for or to keep informed on which party is propagating what (Olsen, 1965). Social networksmight make a difference because they present a ‘short cut’ that introduces some rationality in their decision tovote, and to vote for a specific party.
P. Nieuwbeerta, H. Flap / Social Networks 22 (2000) 313–335 317
sonal network is in these respects, the stronger the effect will be. The socialization and thereference group approach both assume that the social network will exert a greater influenceif it is more homogeneous. The difference is that the first approach assumes that it is aboutdirect contact, whereas the second approach envisages a commonality of interests. In fact,Popkin’s reinterpretation of the economic theory of voting behavior obliterates the differ-ence between the first and the third theory. So we cannot really confront the theories, all wecan do is test their predictions and try to establish which mechanism is more important.
If we want to arrive at predictions on the effects of heterogeneous networks, we needto make assumptions on how people learn. Depending on whether we assume that peopletry to solve contradictions by further research and discussion, or try to suppress or bancontradicting evidence, a heterogeneous social network will lead to more or less politicaldiscussion (see also Laumann, 1973; Flap, 1976, 1997, pp. 210–212). Starting from the ideathat people try to discover what is in their interest and which party best serves their interest,people can be assumed to receive more information from the individuals they interact withand discuss politics with. In addition, the information they receive from people who areclose to them can be assumed to be taken more seriously. In these cases, everyone involvedwill exhibit similar political preferences and voting behavior.
These assumptions lay near hypotheses on the chance of people voting or not voting in anelection. If people receive no equivocal information from their personal environment, it willbe less clear to them which party to vote for, and they will be more apt not to vote at all in theelection. Lazarsfeld et al. already found that people who are under cross-pressures more of-ten have no specific political preference compared with those without such cross-pressures.Therefore, we can forward the following hypotheses.• The more heterogeneous the composition of a person’s network (with respect to interests
represented in it), the smaller the chances that he will go to the ballots (hypothesis on theeffect of heterogeneity).
• The more members of a person’s network who belong to a different group (with respect toreligion or education) than the group the focal person belongs to, the greater the chancesthat the focal person will not vote (hypothesis on the effect of heterogeneity).
3. Data, measurement and method of analysis
These formulated hypotheses were tested with data from two studies conducted in TheNetherlands in 1998. Data were collected from randomly selected respondents represen-tative of the Dutch population. They were interviewed by a mail survey. The first surveypertained to a study on ‘social and economic developments in The Netherlands’, the Dutchpart of the ‘International Survey of Economic Attitudes’ (N = 933), and the second to the‘Usage of Information and Communication Technology’ (N = 2500). The Department ofSociology at Utrecht University in The Netherlands conducted the fieldwork for both of thesurveys. The questionnaires both contained two identical modules, one on the respondents’social background and political preferences, and one on social and political characteristicsof their network members. Detailed descriptions of the sampling design, data collection andquestionnaires are included in the surveys’ accompanying codebooks (Nieuwbeerta et al.,1998; van Dijk et al., 1999).

318 P. Nieuwbeerta, H. Flap / Social Networks 22 (2000) 313–335
In this paper, descriptive analyses only pertain to the respondents whose individual per-sonal characteristics are all known, i.e. 3148 respondents (82% of the total group). Whentesting the hypotheses, a further restriction was applied. Only the respondents who suppliedvalid information on three network members and their relevant characteristics have beenincluded (N = 2430).
3.1. Respondents’ voting behavior
The respondents’ voting behavior is the dependent variable in our analyses. To measureit in the first survey, the respondents were asked: ‘if parliamentary elections were heldtoday, would you vote? And if so: which party would you vote for?’ In the second survey,the respondents were simply asked to say which political party they had voted for at theparliamentary elections in May 1998. The distribution of the respondents’ voting behaviorlargely corresponds with the official election results (see Table 1). The only discrepancy isthat 13% of the respondents said they would not vote, or did not vote. This is substantiallylower than the 27% of voters who in reality did not vote at the parliamentary elections of1998.
In The Netherlands, various types of political parties run in the parliamentary elections,which cannot easily be placed on a single dimension. At any rate the socio-economic(left–right) and religious (confessional–non-confessional) dimensions can be distinguished(see Lijphardt, 1968, 1999; Middendorp, 1978). Consequently, our analyses treat votingbehavior as a nominal variable and distinguish three types of political parties: confessional(CDA, GPV, SGP and RPF), left-wing (PvdA, D66, Groen Links and the SP) and right-wingparties (VVD). ‘non-voting’ or ‘do not know’ (only for network members) are treated asthe fourth category of our voting variable.
3.2. Respondents’ individual characteristics
When investigating the role of personal networks in respondents’ voting behavior, it iswise to take into account the influences of the respondents’ individual characteristics. Inthe interviews, the respondents were asked about their sex, religion, social position andeducation. With regard to religion, they were asked whether they consider themselves amember of a religious denomination or group. A distinction was drawn between thosewho do (‘religious’ respondents) and those who do not (‘non-religious’ respondents). Therespondents’ social position is based on questions about their employment status and oc-cupation. Those who are employed as higher- and middle-level non-manual workers, andthose who have supervisory positions, or are small self-employed (not in agriculture) areclassified as non-manual workers, the others — lower non-manual workers and skilled orunskilled manual workers — are classified as manual workers. To establish their level ofeducation, the respondents were asked to list their highest completed level of education orthe level of school they are attending at the moment. In our analyses, we distinguish threeeducational levels: elementary school or lower vocational school (LBO/VBO), secondaryschool education (MAVO, MULO, HAVO, HBS, VWO), and college (HBO) or univer-sity. In Table 1 the descriptive statistics of the respondents’ individual characteristics arepresented.
P. Nieuwbeerta, H. Flap / Social Networks 22 (2000) 313–335 319
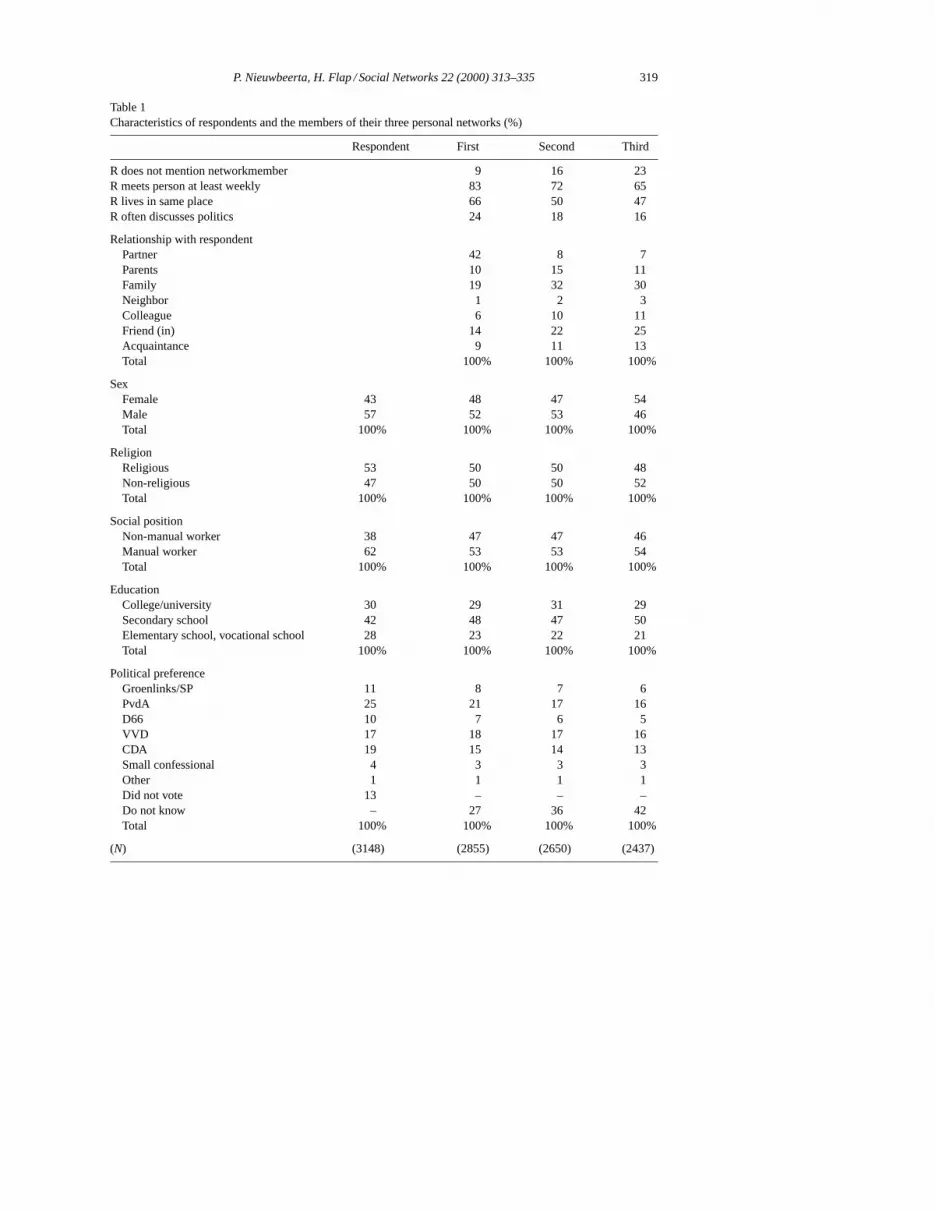
Table 1Characteristics of respondents and the members of their three personal networks (%)
Respondent First Second Third
R does not mention networkmember 9 16 23R meets person at least weekly 83 72 65R lives in same place 66 50 47R often discusses politics 24 18 16
Relationship with respondentPartner 42 8 7Parents 10 15 11Family 19 32 30Neighbor 1 2 3Colleague 6 10 11Friend (in) 14 22 25Acquaintance 9 11 13Total 100% 100% 100%
SexFemale 43 48 47 54Male 57 52 53 46Total 100% 100% 100% 100%
ReligionReligious 53 50 50 48Non-religious 47 50 50 52Total 100% 100% 100% 100%
Social positionNon-manual worker 38 47 47 46Manual worker 62 53 53 54Total 100% 100% 100% 100%
EducationCollege/university 30 29 31 29Secondary school 42 48 47 50Elementary school, vocational school 28 23 22 21Total 100% 100% 100% 100%
Political preferenceGroenlinks/SP 11 8 7 6PvdA 25 21 17 16D66 10 7 6 5VVD 17 18 17 16CDA 19 15 14 13Small confessional 4 3 3 3Other 1 1 1 1Did not vote 13 – – –Do not know – 27 36 42Total 100% 100% 100% 100%
(N) (3148) (2855) (2650) (2437)
320 P. Nieuwbeerta, H. Flap / Social Networks 22 (2000) 313–335
3.3. Social networks
To establish the influence of social network composition on voting behavior, it is necessaryto have data on the social characteristics of personal network members. There are variousways to obtain this information. In this study we used questions previously asked in theGSS in 1985 and 1987 in the United States and in the 1992 British national election study.The introduction to these questions reads as follows:
From time to time, most people discuss important matters with other people. Looking backover the last 6 months, who are the people with whom you discussed matters importantto you? Just tell me their first names or initials. We would like to ask you some questionsabout the three people you regularly discuss matters important to you with? Just tell metheir names.These questions generate the names of people in the respondent’s core network (Marsden,
1987). Since these questions were asked for the first time in 1985, they have become astandard measurement instrument in every large-scale network survey.
Following this name generator, questions are asked about how often the respondentsmeet their network members and how often they talk about politics. The density of theentire network is detected by asking question about how well the network members knoweach other. The names of the three network members can also be interpreted since their sex,education, marital status, religious denomination, and employment status were asked,4
as were their relationship to the respondent (family, friends, etc.). Respondents were alsoasked about the political party preference of their most important network members. Table 1presents the distributions of the relevant social network members’ characteristics.
Of all the 3148 respondents in the analyses, only 9% did not mention a first networkmember; 16% did not mention a second network member and 23% of the respondentsdid not mention a third. So, most of the respondents (77%) indicated that their networkconsists of at least three persons. In most cases, they indicated their partners (42%) orfamily relatives (29%) as the first person they discuss important matters with. The secondand third network members are also often relatives for (47 and 41%) but friends were alsofrequently mentioned (22 and 25%).
3.4. Methodological issues
Before analyzing our data, perhaps some problems should be mentioned with respect tothe research design applied in this study. The first problem pertains to the self-selectionby respondents. The response rate, although certainly not exceptionally low for a mailsurvey in The Netherlands, is rather low (also see Section 3), and the non-response is pre-sumably biased towards people with heterogeneous networks (also see Slobbe, 1999). Inreality, the heterogeneity of personal networks is therefore probably somewhat higher thanreported in this study. Self-selection probably also accounts for the fact that the officialelection results in 1998 show a lower level of non-voting than the data on our respon-
4 Unfortunately no questions about the network members’ occupations were asked in the ‘usage of informationand communication technology’ survey. That is why we used education as an indicator of social position insteadof occupational status (cf. Popkin, 1991).

P. Nieuwbeerta, H. Flap / Social Networks 22 (2000) 313–335 321
dents. Nevertheless, these possible biases do not devalue our findings as a testing groundfor hypotheses on the effects of crosscutting social circles on voting behavior, discussingpolitics and abstaining from voting, as this selection biases make our test of the argumentmore conservative. After all, an under-representation of network members with character-istics different from ego makes it more difficult to detect the effects of crosscutting socialcircles.
The selection that occurs when the respondents choose their network members mightbe another problem for our analyses. If the respondents prefer to be acquainted with po-litically like-minded people, this results in a strong association between the characteristicsof network members and ego’s voting behavior. A related problem is that we do not takethe mutual influences between the respondents and their network members into account.We assume that network members influence ego, but disregard the fact that this also mightoccur the other way around. We assume that this bias in our study is not substantial. Thatis, our name generator does not refer to politics, but asks the respondents to name peoplewith whom they discuss important matters in general. Consequently, a selection of networkmembers based on political characteristics is no likely explanation for our findings. More-over, without the availability of longitudinal data and interviewing the alters themselves,these issues cannot be solved (also see Knoke, 1990b).
4. Social homogeneity of present-day personal networks in The Netherlands
To start with, we address the extent to which the respondents’ social and political charac-teristics correspond to the characteristics of the members of their personal networks. Thisis of interest since it is for the first time that the social and political characteristics of thepersonal networks of randomly chosen Dutch citizens have been documented. It is alsoof interest since it demonstrates the extent to which the composition of personal networksinfluences these people’s personal networks.
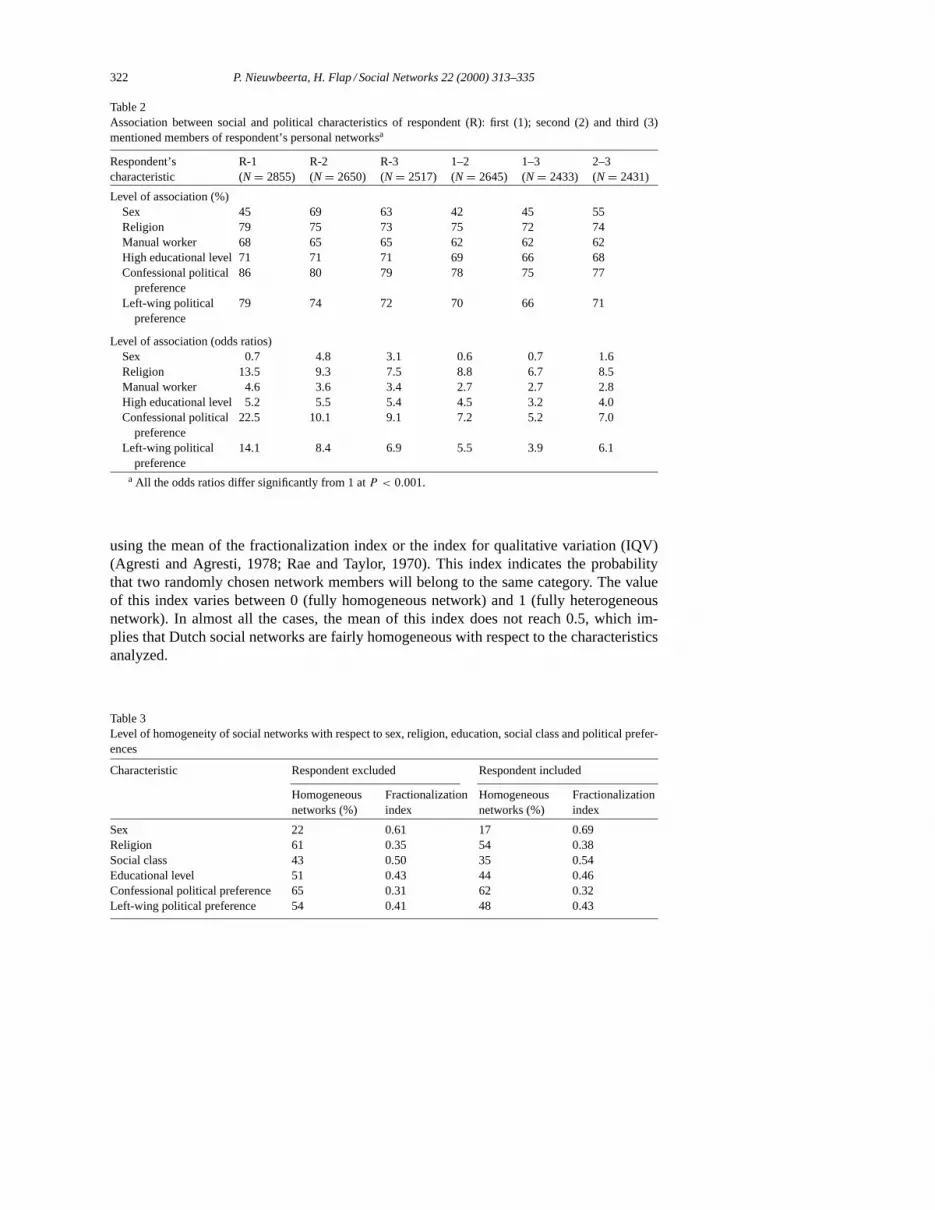
Table 2 first shows large similarities between the respondents’ characteristics and those oftheir network members and also between the characteristics of the various network members.If there were no relation between network members, the percentages — depending on themarginal distributions of course — would be around 50%. The odds ratios would be about 1.Yet in all but one exception, the percentages are larger than 60% and in some cases they evengo beyond 80%. The odds ratios have a value significantly larger than 1. So there is a largecorrespondence between the respondents’ and their network members’ characteristics, andalso among the characteristics of the network members themselves. The correspondence insex between the respondents and the first network members is the only exception to thisrule. Here the correspondence is low, since almost half of the respondents mentioned theirpartner as their first network member.
The large correspondence between the respondents’ and their network members’ char-acteristics is also clear from the networks with three network members as a whole, as inTable 3. The figures in this table show that over 50% of the networks are completely homo-geneous with regard to educational level and 40% with respect to occupational status andleft-wing political preference. Over 60% of all the networks are fully homogeneous withregard to religion and confessional political preference. Similar conclusions can be drawn
322 P. Nieuwbeerta, H. Flap / Social Networks 22 (2000) 313–335
Table 2Association between social and political characteristics of respondent (R): first (1); second (2) and third (3)mentioned members of respondent’s personal networksa
Respondent’scharacteristic
R-1(N = 2855)
R-2(N = 2650)
R-3(N = 2517)
1–2(N = 2645)
1–3(N = 2433)
2–3(N = 2431)
Level of association (%)Sex 45 69 63 42 45 55Religion 79 75 73 75 72 74Manual worker 68 65 65 62 62 62High educational level 71 71 71 69 66 68Confessional political
preference86 80 79 78 75 77
Left-wing politicalpreference
79 74 72 70 66 71
Level of association (odds ratios)Sex 0.7 4.8 3.1 0.6 0.7 1.6Religion 13.5 9.3 7.5 8.8 6.7 8.5Manual worker 4.6 3.6 3.4 2.7 2.7 2.8High educational level 5.2 5.5 5.4 4.5 3.2 4.0Confessional political
preference22.5 10.1 9.1 7.2 5.2 7.0
Left-wing politicalpreference
14.1 8.4 6.9 5.5 3.9 6.1
a All the odds ratios differ significantly from 1 atP < 0.001.
using the mean of the fractionalization index or the index for qualitative variation (IQV)(Agresti and Agresti, 1978; Rae and Taylor, 1970). This index indicates the probabilitythat two randomly chosen network members will belong to the same category. The valueof this index varies between 0 (fully homogeneous network) and 1 (fully heterogeneousnetwork). In almost all the cases, the mean of this index does not reach 0.5, which im-plies that Dutch social networks are fairly homogeneous with respect to the characteristicsanalyzed.
Table 3Level of homogeneity of social networks with respect to sex, religion, education, social class and political prefer-ences
Characteristic Respondent excluded Respondent included
Homogeneousnetworks (%)
Fractionalizationindex
Homogeneousnetworks (%)
Fractionalizationindex
Sex 22 0.61 17 0.69Religion 61 0.35 54 0.38Social class 43 0.50 35 0.54Educational level 51 0.43 44 0.46Confessional political preference 65 0.31 62 0.32Left-wing political preference 54 0.41 48 0.43

P. Nieuwbeerta, H. Flap / Social Networks 22 (2000) 313–335 323
5. Relation between the composition of social networks and voting behavior
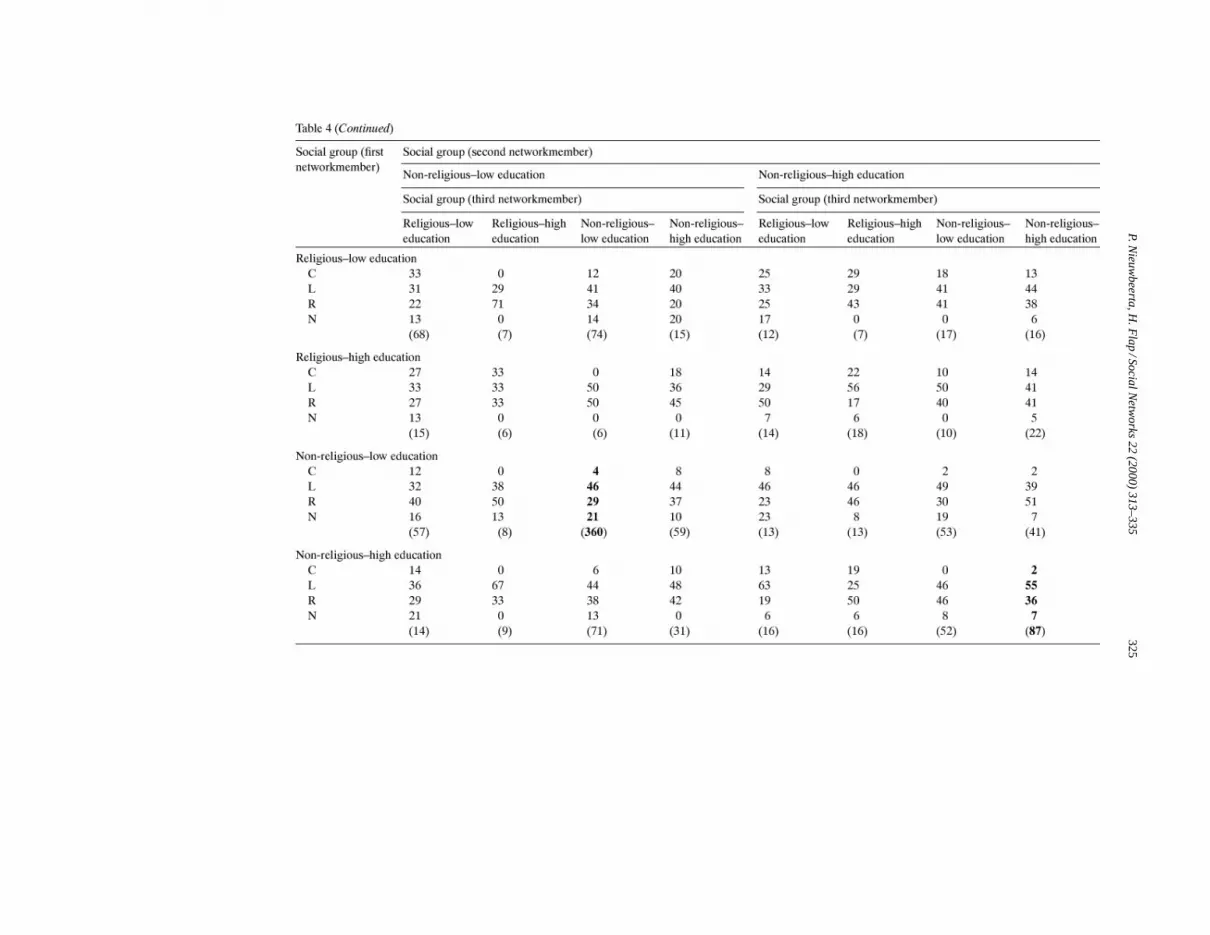
Having established the similarities in the social characteristics of the respondents andtheir network members, it is useful to address the extent to which the network composi-tion is related to the respondents’ political party preferences. The chances of respondentshaving a specific political party preference, given the number of persons in their networkwith certain characteristics, are presented in Table 4. The figures in the cells on the maindiagonal (mentioned in bold) of this table give the political party preferences of respondentswith homogeneous networks. The upper left cell shows that respondents with three networkmembers who are religious and have a lower educational level, have a 41% chance of pre-ferring a confessional political party. It is not exceptional for the probabilities of preferringa certain political party to correlate with the composition of the networks. The figures inthe other cells on the main diagonal show that the respondents with homogeneous networksof non-religious people with a lower educational level only have a 4% chance of havinga confessional political party preference. Moreover, the respondents with homogeneousnon-religious networks with a higher educational level have a 36% chance of having a pref-erence for a right-wing party, whereas the respondents with a homogeneous non-religiousnetwork with a lower educational level, have a 29% chance of preferring this kind of party.
The off-diagonal cells show the chance of the respondents with socially heterogeneousnetworks having a particular political party preference. For these respondents, the chanceof having a certain political party preference in general is less than for respondents withcorresponding homogeneous networks. For example, the respondents whose first and secondnetwork members are religious and have a lower educational level, but whose third networkmember is non-religious (but still has lower educational level), have a 25% chance of havinga confessional political party preference. This is in between 41% chance for respondentswith a homogeneous religious network with a lower educational level and 4% chance forrespondents with a homogeneous non-religious network with a lower educational level.The figures in this table also give a first indication that the respondents with heterogeneousnetworks do not systematically differ from the ones with homogeneous networks in theirchances of not preferring a political party.
6. Diagonal reference models
Research on the effects of the network composition on political party preference has beenconfronted with the problem of how to model the influence of the network members’ socialand political characteristics (Knoke, 1990a,b). Applying classical techniques such as linearregression-like models (e.g. OLS, MCA, or ANOVA models), the main problem is that thecharacteristics of different network members are highly correlated. In 54% of the all casesin this study all three network members and ego have the same religion. Furthermore, thesemodels are troublesome for analyzing the impact of heterogeneity effects as such. As Hope(1971) and Sobel (1981) stated, the main effects of the network members’ characteristicsin these models contain some heterogeneity effects.
Another way to examine the effects of network members’ characteristics is by calculatinga summary measure for the composition of the total network and using that in analyses

324P.N
ieu
wb
ee
rta,H
.Fla
p/S
ocia
lNe
two
rks2
2(2
00
0)
31
3–
33
5
P.Nie
uw
be
erta
,H.F
lap
/So
cialN
etw
orks
22
(20
00
)3
13
–3
35
325

326 P. Nieuwbeerta, H. Flap / Social Networks 22 (2000) 313–335
(see Knoke, 1990b). This does not, however, enable researchers to examine whether theeffects of different network members relatively differ. It also does not enable researchersto examine the effects of heterogeneity as such. There is a logical U-shaped relationshipbetween the “direction of a network” and its level of heterogeneity (also see Knoke, 1990b,p. 1051).5
In this study, we therefore introduce diagonal reference models of Sobel (1981, 1985) forresearching social networks. These models do not have the above-mentioned disadvantages.De Graaf and Ultee (1987, 1990) introduced them in research on political behavior. Theywere subsequently frequently used in studies on the effects of social mobility and sociallymixed marriages on political preferences (de Graaf et al., 1995; de Graaf and Health, 1992;Nieuwbeerta, 1995; Nieuwbeerta et al., 2000; van Berkel, 1997).
The original diagonal reference models designed by Sobel (1981, 1985) were onlyequipped to deal with ordinal dependent variables. In this article, we have applied anadapted version of these models that is equipped to deal with dependent variables withseveral nominal categories. This multinomial version was developed by Nieuwbeerta andWittebrood (1995) when they examined the influence of fathers’ and mothers’ characteris-tics on their children’s political party preferences. This kind of adaptation of the diagonalreference models is relevant because it is important to treat political party preference inThe Netherlands as a nominal variable. First of all, the Dutch political party system is amulti-party system with strong socio-economic and religious dimensions. Thus, the politi-cal parties cannot be easily placed on one dimension (Lijphardt, 1968; Middendorp, 1978).Secondly, this paper treats not having a political preference as an important category of thedependent variable political preference.
The mechanism of the multinomial diagonal reference models can best be explained usingthe figures in Table 4. The upper left cell of this table shows that the respondents with threenetwork members who are all religious and have a lower educational level, have an odds of41/(100− 41) of preferring a confessional political party. This gives a log odds of−0.36(log(41/(100− 41))). In the main diagonal cell, diagonally under it, the respondents withthree network members who are all non-religious and have a lower educational level, havea log odds of−3.17 (log(4/(100−4))) of preferring a confessional political party. Diagonalreference models assume that for respondents who have two religious network members witha lower educational level, and a third who is non-religious but also has a lower educationallevel, the log odds of preferring a confessional political party is a weighted mean of theabove-mentioned log odds for respondents with homogeneous networks. Assuming that therelative influence of the three network members is equal, according to the mechanism of thediagonal reference models, the log odds can be calculated as:((1/3) × −0.36) + ((1/3) ×−0.36) + ((1/3) × −3.17) = −1.30.6 This corresponds with a 21% chance of having apreference for a confessional political party. Analogous calculations can be made for therespondents with other combinations of heterogeneous networks.
5 In Knoke’s analyses the scores 3 (three democrats) and−3 (three republicans) both refer to homogeneousnetworks, and 0 to heterogeneous networks. Consequently, no distinction can be drawn in linear models.
6 Note that theµ-parameters (of the main diagonal cells) and the weight parameter are estimated simultaneously(also see Sobel, 1981).
P. Nieuwbeerta, H. Flap / Social Networks 22 (2000) 313–335 327
A general multinomial logistic diagonal reference model for the effects of social charac-teristics of ego and three network members can be represented as
Bijklpr = exp(θijklp)∑exp(θijklp)
(1)
θijklp = (1 − q − r − s)µiiiip + (q)µjjjjp + (r)µkkkkp+ (s)µllllp
+βLp × covariateL (2)
whereBijklpr is the probability that respondentr has party preferencep, given that he orshe has characteristici, the first network member characteristicj, the second characteristick and the third network member characteristicl. The termθijklp stands for the log odds thatthe same respondentr will prefer partyp to other parties. The parametersµiiiip, µjjjjp,µkkkkp andµllllp indicate the political party preference (in log odds) for respondents withdifferent types of homogenous networks. The terms(l − q − r − s) andq, r ands standfor the relative weight of ego and the first, second and third network member, respectively.We have included covariates in the models representing the sex and age of the respondents,with L standing for the various covariates andβLp for the accompanying parameters. Foreach possible political party preferencep, with the exception of the reference category, aβLp parameter was estimated. An important advantage of the diagonal reference models isthat they are parsimonious in the use of parameters. For example, only a single parameteris needed to model the relative influence of various network members.
7. Testing the hypotheses
7.1. Model selection
To test the hypotheses, we fitted various diagonal reference models, each representing asingle hypothesis or combination of hypotheses.7 The identification of the models (A–E)is related to the naming of the corresponding hypothesis. To select the model that rep-resented our data best, we compared the fit of one model with a less general one nestedwithin that model. To detect whether the fit of the models differs significantly, we used
7 The estimation of the parameters of multinomial logistic diagonal reference models is straightforward (seeAgresti, 1990, p. 40, 41, 316). We presume the political parties to be distinct and weighted independently, especiallyafter conditioning on the explanatory variables (see McFadden, 1974). Consequently, given the observed data{np , p = 1, . . . , P}, and assuming multinomial sampling, the log likelihood function is
L =∑
np log(Bijklpr ) (3)
To eliminate redundancies in the parameters, we treatL as a function of theP − 1 probabilities obtained bydroppingBp , sinceBp = 1 − (B1 + · · · + Bp − 1). A multinomial logistic diagonal reference probability modelfor Bijklpr is already given in Eqs. (1) and (2). Since maximizing the log likelihood is equivalent to minimizing thenegative of the log likelihood, we use the loss function in the CNLR procedure of SPSS to estimate the parametersof the specified models. Readers interested in more information on how to fit these models should write to the firstauthor.
328 P. Nieuwbeerta, H. Flap / Social Networks 22 (2000) 313–335
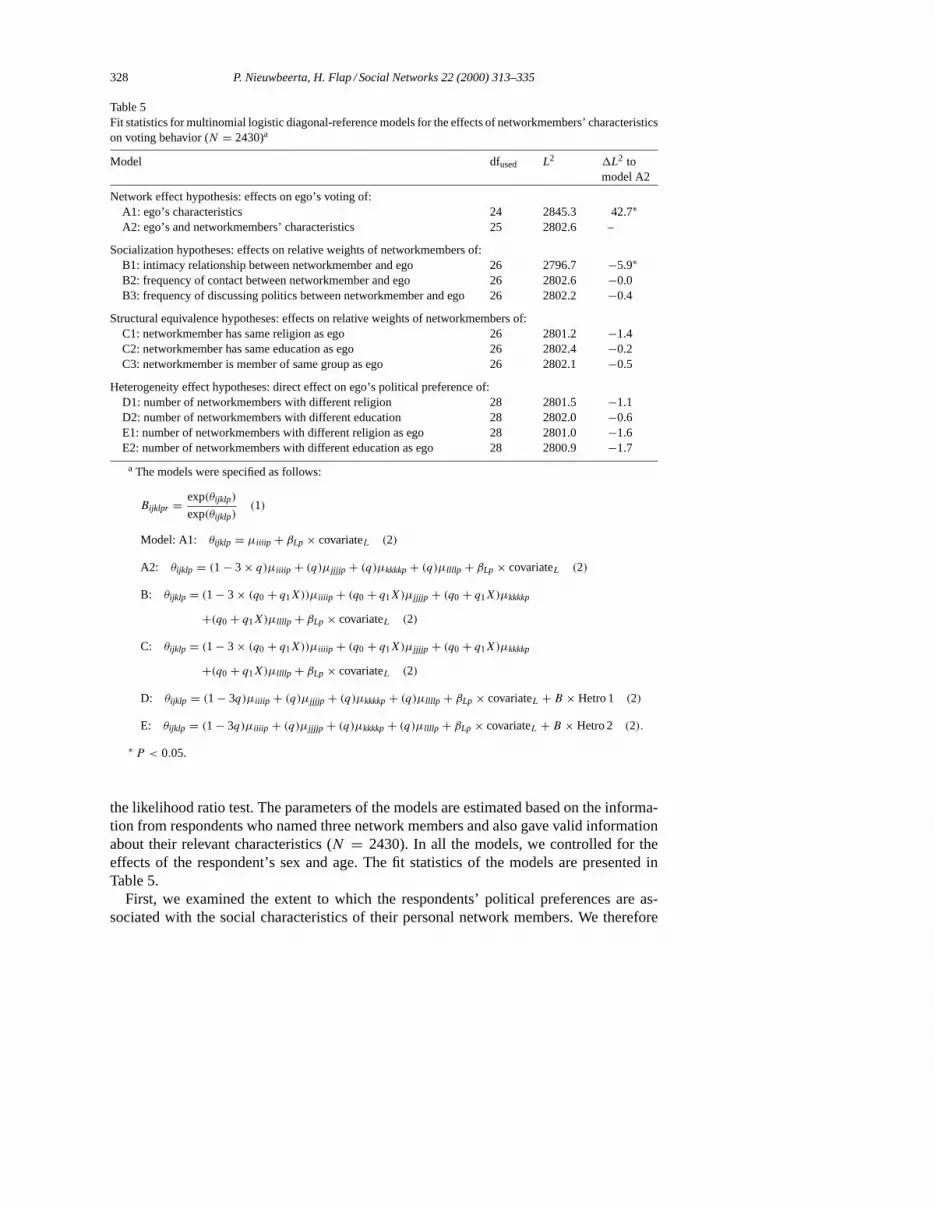
Table 5Fit statistics for multinomial logistic diagonal-reference models for the effects of networkmembers’ characteristicson voting behavior (N = 2430)a
Model dfused L2 1L2 tomodel A2
Network effect hypothesis: effects on ego’s voting of:A1: ego’s characteristics 24 2845.3 42.7∗A2: ego’s and networkmembers’ characteristics 25 2802.6 –
Socialization hypotheses: effects on relative weights of networkmembers of:B1: intimacy relationship between networkmember and ego 26 2796.7−5.9∗B2: frequency of contact between networkmember and ego 26 2802.6−0.0B3: frequency of discussing politics between networkmember and ego 26 2802.2−0.4
Structural equivalence hypotheses: effects on relative weights of networkmembers of:C1: networkmember has same religion as ego 26 2801.2 −1.4C2: networkmember has same education as ego 26 2802.4−0.2C3: networkmember is member of same group as ego 26 2802.1−0.5
Heterogeneity effect hypotheses: direct effect on ego’s political preference of:D1: number of networkmembers with different religion 28 2801.5 −1.1D2: number of networkmembers with different education 28 2802.0 −0.6E1: number of networkmembers with different religion as ego 28 2801.0 −1.6E2: number of networkmembers with different education as ego 28 2800.9−1.7
a The models were specified as follows:
Bijklpr = exp(θijklp)
exp(θijklp)(1)
Model: A1: θijklp = µiiiip + βLp × covariateL (2)
A2: θijklp = (1 − 3 × q)µiiiip + (q)µjjjjp + (q)µkkkkp+ (q)µllllp + βLp × covariateL (2)
B: θijklp = (1 − 3 × (q0 + q1X))µiiiip + (q0 + q1X)µjjjjp + (q0 + q1X)µkkkkp
+(q0 + q1X)µllllp + βLp × covariateL (2)
C: θijklp = (1 − 3 × (q0 + q1X))µiiiip + (q0 + q1X)µjjjjp + (q0 + q1X)µkkkkp
+(q0 + q1X)µllllp + βLp × covariateL (2)
D: θijklp = (1 − 3q)µiiiip + (q)µjjjjp + (q)µkkkkp+ (q)µllllp + βLp × covariateL + B × Hetro 1 (2)
E: θijklp = (1 − 3q)µiiiip + (q)µjjjjp + (q)µkkkkp+ (q)µllllp + βLp × covariateL + B × Hetro 2 (2).
∗ P < 0.05.
the likelihood ratio test. The parameters of the models are estimated based on the informa-tion from respondents who named three network members and also gave valid informationabout their relevant characteristics (N = 2430). In all the models, we controlled for theeffects of the respondent’s sex and age. The fit statistics of the models are presented inTable 5.
First, we examined the extent to which the respondents’ political preferences are as-sociated with the social characteristics of their personal network members. We therefore
P. Nieuwbeerta, H. Flap / Social Networks 22 (2000) 313–335 329
estimated model A1 only if the characteristics of the respondents themselves (ego) areincluded, and model A2 if the characteristics of all three network members are included.Table 5 shows that, as expected, adding the characteristics of network member characteris-tics to the model results in a significant improvement in fit. Clearly, the network members’characteristics affect people’s political preferences. For the moment, model A2 is thus thepreferable model. In this model, the relative influences of all three network members areassumed to be equal. To test whether this assumption is valid, or whether some networkmembers have relatively more or less influence on ego’s voting than others, we used othermodels.
Models B1–B3 represent the hypotheses based on the socialization theory. These hy-potheses assume that the more ‘intimate’ a relationship between a network member andego, the more contact a network member and ego have, and the more frequent a networkmember discusses politics with ego, the stronger that network member relatively influencesego’s political preferences. In models B1–B3, we allowed the relative influences of the vari-ous network members to differ by adding parameters for the effects of the relevant variablesto the relative weights of the network members (for example,q = q0+q1× ‘intimacy of therelationship between network member and ego’). Table 5 shows that only model B1 resultsin a significant improvement in fit as compared with model A2. The frequency of contactor of discussing politics is shown to be unimportant. The intimacy of a relationship is whatis important. As expected, the accompanying parameters (also see Table 6) indicate that themore intimate the relationship between a network member and ego, the more influence thisnetwork member has on ego’s voting behavior.
On the basis of the reference group theory, we assumed that if network members belong tothe same group as ego with respect to religion and education, their influence on ego’s votingbehavior is larger than if they belong to a different group. Models C1–C3 represent thishypothesis. In these models, parameters for the effects of belonging to the same religiousand/or educational group are included on the weight parameter.8 Table 5 shows that noneof these models results in a better fit than models A2 and B1. Burt’s idea about the relevanceof ‘structural equivalence’ to the spread of opinions in social networks has no empiricalgrounds in our analysis.
Finally, we assumed that having a heterogeneous personal network has an independenteffect on ego’s voting behavior. We assumed that the more heterogeneous the compositionof ego’s network (with respect to religion and education), the higher the odds that ego doesnot vote at parliamentary elections. To test this hypothesis, we modified our models byadding variables indicating the extent to which characteristics of network members differfrom each other (models D1–D2) or the extent network members’ characteristics differ fromthe respondent’s characteristics (models E1–E2). Table 5 shows that none of these modelsresult in a better fit than model A2 or B1 either. So our hypotheses assuming a heterogeneityeffect also have to be rejected.
8 We also fitted an extra “status maximization model” to test whether network members had more or less influenceif they had a higher level of education than ego. This model did not however result in a significant improvementin fit compared with model A2 (1L2 = 0.2, 1df = 1).
330P.N
ieu
wb
ee
rta,H
.Fla
p/S
ocia
lNe
two
rks2
2(2
00
0)
31
3–
33
5
P. Nieuwbeerta, H. Flap / Social Networks 22 (2000) 313–335 331
7.2. Interpretation of the parameters of the best model
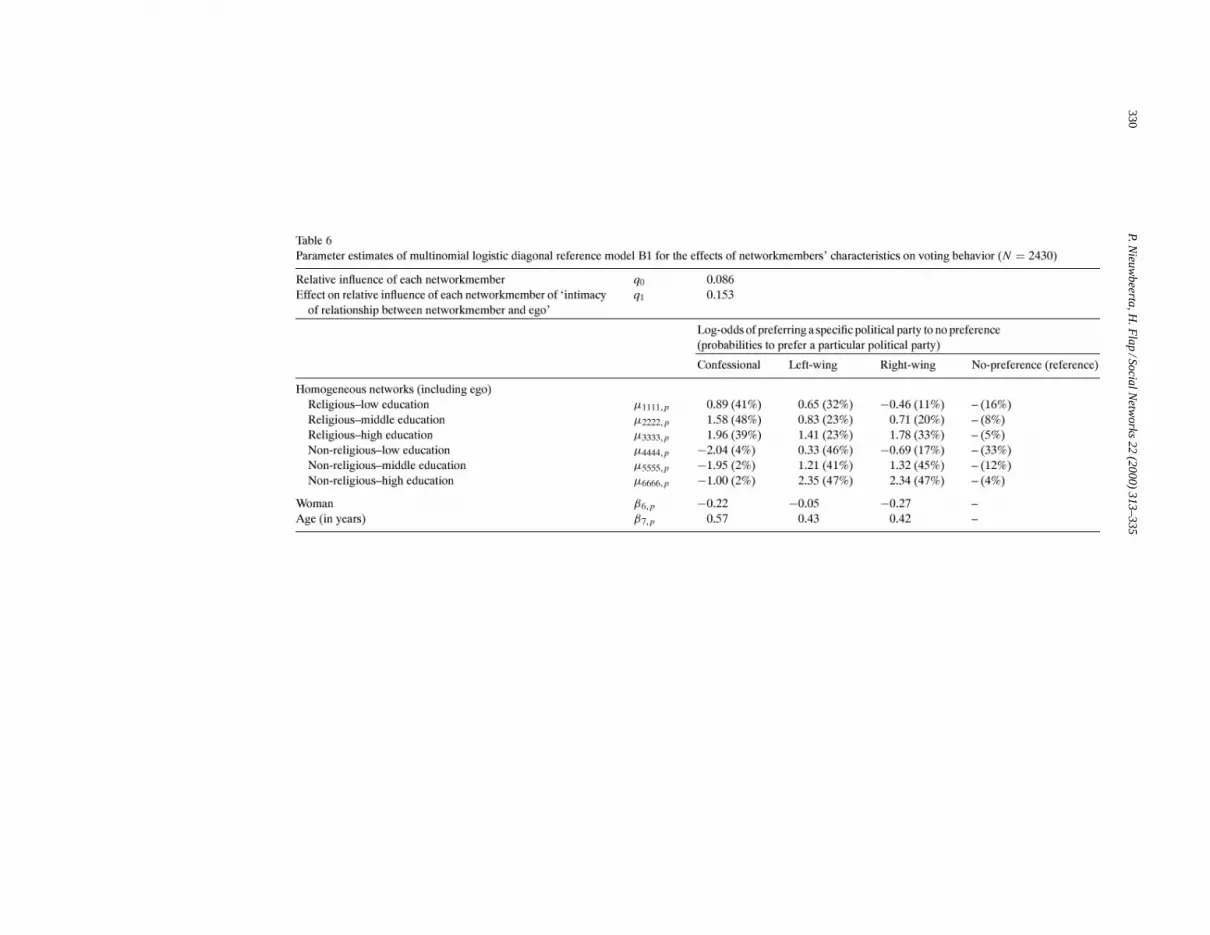
The model selection thus indicates that model B1 gives the best data representation. Thismodel represents the socialization hypothesis, which assumes that the more intimate therelationship between ego and a network member, the more this network member influencesego’s voting behavior. In Table 6 the estimated parameters of this model are presented.
The upper part of the table shows the estimated parameters of the relative weights of egoand the network members’ characteristics on ego’s voting behavior. Parametersq0 andq1together represent the relative weight of the separate network members according to theformula: 0.086+0.153× ‘intimacy of the relationship between network member and ego’.The ‘intimacy’ variable is coded in such a way that it has the value 0 for neighbors, 0.33 forcolleagues and acquaintances, 0.66 for friends and relatives, and 1 for partners.9 Dependingon the type of relationship, the influence of separate network members is thus at least 0.086and at most 0.239 (0.086+0.153). If a network only consisted of neighbors, the total effect ofall three network members would amount to 0.24 (3×0.086). The relative influence of ego’scharacteristics would equal 1− 0.24 = 0.76 (see Eq. (2)). If a personal network consistedof a partner and two family members, the joint relative influence of the network memberswould amount to 0.61 (0.086+0.153×1)+(0.086+0.153×0.66)+(0.086+0.153×0.66).For all the other compositions of personal networks, similar calculations can be done.
The estimatedµ-parameters of the model are presented in the middle section of Table 6.These parameters give the log odds of preferring a specific political partyp to not votingfor men at the age of 40 years (the reference category) with homogeneous networks. Fromthe estimatedµ-parameters, we calculated the chances of preferring each political party forrespondents with homogeneous networks. These chances are noted in brackets. The figuresshow that respondents with a low educational level and homogeneous religious networkshave a 41% chance of voting for a confessional political party.10 Theµ-parameters and thecalculated chances show strong effects of religion. Non-religious persons with homogeneousnon-religious networks barely ever vote for confessional parties. The educational level ofrespondents and their network members also have strong effects on voting. Here, levels ofeducation barely affect chances of having preferences for specific political parties, but theydefinitively do affect the chances of having no preference at all. Non-religious people witha lower educational level and a homogeneous network have a 33% chance of having no
9 We have opted for this scaling since it is closely related to our research questions, resulted in the most parsi-monious modeling, and provided the best results. We also tried various scaling procedures, but they resulted invery similar findings. We tested whether the effects of the “intimacy of the relationship between network membersand ego” could in fact be regarded as only a ‘spouse effect’. Fitting model B1 with a dummy for spouse insteadof the ‘intimacy’ indicator did not however result in a significant improvement in fit compared with model A2(1L2 = 1.8, 1df = 1). Furthermore, a model including three dummy variables indicating whether the networkmembers are spouses, family members or acquaintances (neighbors taken as reference category) resulted in a betterfit, but used two extra degrees of freedom compared with model B2 (1L2 = 0.3). Moreover, the parameters forthe effects of being neighbors (reference category), acquaintances, family and partners were 0, 0.067, 0.082 and0.154, respectively, and show almost the same linear pattern as our ‘intimacy’ variable. Also note that the effectsof acquaintances and family differ significantly from the effects of being neighbors or partners.10 In these multinomial logistic models, the probabilities of preferring a confessional political party on the part ofrespondents with a homogeneous religious network with a low educational level can be calculated as: exp(0.89)/(1+exp(0.89) + exp(0.65) + exp(−0.46)) × 100= 41%.
332 P. Nieuwbeerta, H. Flap / Social Networks 22 (2000) 313–335
particular party preference, whereas people with a high educational level and homogeneousnetworks only have a 4% chance.
Using the weight parameters and theµ-parameters, the chances of preferring a specificpolitical party can be calculated for respondents with heterogeneous networks. Accordingto Eqs. (1) and (2), the chances of people with heterogeneous networks preferring a specificparty is a weighted mean of the chances of respondents with homogeneous networks prefer-ring that party. For example, the log odds that a religious woman with a lower educationallevel and a network consisting of three neighbors, two of whom are religious and have alower educational level, and a third who is non-religious but also has a low educationallevel will prefer a confessional party to not preferring a political party at all amounts to:(1–3× 0.086) × 0.89+ 2(0.086× 0.89) + (0.086× −2.04). This corresponds to a chanceof 38%. This chance is in between the chances of homogeneous religious networks witha lower educational level (41%) and the chances of homogeneous non-religious networkswith a low educational level (4%).
8. Conclusions and discussion
Even now that the heyday of pillarization in The Netherlands is long passed, the networksof the Dutch are still strongly homogeneous with respect to ideal and material interests andthe political preferences represented in them. This tendency is strongest for religion. Thenetworks we described are core networks, which means networks of ties based on mutualtrust. In the year 1998 religion in The Netherlands is still a very strong integrative forceamong similar-minded people and a very strong divisive force in social contacts with others.That the situation was like this 50 years ago can be accepted without further research.However, that this is still the case in The Netherlands in the year 1998 that is quite striking.So if only because of these findings, we feel our research is valuable.
A second major empirical result is that in The Netherlands, a country with a multi-dimensional multiple party system, the personal network composition affects politicalchoices. Furthermore, we gained greater insight into the mechanisms responsible for thiseffect. The effect of the characteristics of the others is stronger in more intimate socialrelationships. Thus, personal influence means direct political influence or socialization. Wefound no support for the theory that explains these network effects as the outcome of socialcomparison processes. Nor did we find any evidence of the independent effects of havinga heterogeneous network on not voting at all. People are not kept from voting by havingconflicting information or conflicting loyalties (see Smeenk et al., 1995). Our analysis doesimplicitly lead to the conclusion that crosscutting social circles do make for voting lessaccording to lines of class and religion. The existence of cross-pressures could help us tounderstand why there has been relatively little political violence in The Netherlands.
In new research, we would like to study whether an open heterogeneous network hasother effects on political behavior. In his research in the United States, Laumann (1973,p. 127) found that friendship networks that are more open and heterogeneous lead to greatertolerance. Research has yet to establish whether an open network does indeed lead to an openmind. We would furthermore like to analyze whether crosscutting social circles increaseswavering voting behavior. Heterogeneous networks do not seem to promote political apathy,
P. Nieuwbeerta, H. Flap / Social Networks 22 (2000) 313–335 333
but perhaps they make people less firm in their opinions and voting behaving across differentelections (cf. Knoke, 1990a).
Lastly, we would like to inquire into the potential effects weak ties have on politicalbehavior. In the present study, we only have data on core networks that consist of strongties. Another useful addition would be a study of the role of the network members’ politicalpreferences in determining ego’s voting behavior. In this study we only had informationon the network members’ political preference that was provided by the respondents them-selves. In future research network information on network members’ political preferencesshould preferably be gathered by asking these network members directly (see Huckfeldtand Sprague, 1991). This would enable us to better analyze the extent to which the mecha-nisms of socialization, or social comparison can account for the effects of social networkson political behavior.
Acknowledgements
The authors would like to express their appreciation to Karin Wittebrood and those whoattended these sessions where previous versions of this paper were presented for their usefulcomments.
References
Agresti, A., 1990. Categorical Data Analysis. Wiley, New York.Agresti, F., Agresti, B.F., 1978. Statistical analysis of qualitative variation. In: Schuessler, K.F. (Ed.), Sociological
Methodology. Jossey Bass, San Francisco, pp. 204–237.Berelson, B., Lazarsfeld, P.F., McPhee, W.N., 1954. Voting: A Study of Opinion Formation in a Presidential
Campaign. University of Chicago Press, Chicago.van Berkel, M., 1997. Who Dominates When? Asymmetrical Patterns of Influence among Dutch Husbands and
Wives. Nijmegen University, Nijmegen.Blau, P.M., Schwartz, J.E., 1984. Crosscutting Social Circles. Academic Press, New York.Burstein, P., 1976. Social networks and voting: some Israeli data. Social Forces 54, 833–847.Burt, R.S., 1984. Network items and the general social survey. Social Networks 6, 293–339.Burt, R.S., 1987. Social contagion and innovation: cohesion versus structural equivalence. American Journal of
Sociology 92, 1287–1335.Campbell, A., Converse, P.E., Miller, W.E., Stokes, D.E., 1960. The American Voter. Wiley, New York.Carmines, E.G., Huckfeldt, R., 1996. Political behavior: an overview. In: Goodin, R.E., Klingmann, H. (Eds.), A
New Handbook of Political Science. Oxford University Press, Oxford, pp. 223–254.van Dijk, L., de Haan, J., Verwey, A., 1999. Gebruik van Nieuwe Communicatiemiddelen. ICS, Utrecht (use of
new media).Downs, A., 1957, An Economic Theory of Democracy. Harper & Row, New York.Ellemers, J.E., 1968. De Nederlandse maatschappij in sociologisch perspectief. Sociologische Gids 15, 326–336
(Dutch society in sociological perspective).Flanagan, S.C., 1991. Mechanisms of social network influence in Japanese voting behavior. In: Flanagan, S.C.,
Kohei, S., Miyake, I., Richardson, B.M., Watanuki, J. (Eds.), The Japanese Voter. Yale University Press, NewHaven, pp. 143–197.
Flap, H., 1976. De kracht van zwakke bindingen of de zwakte van sterke bindingen. In: Arts, W., Lindenberg, S.,Wippler, R. (Eds.), Gedrag en Structuur. Universitaire Pers, Rotterdam, pp. 161–176 (the strength of weak tiesor the weakness of strong ties).
Flap, H., 1988. Conflict, Loyalty and Violence. The Effects of Social Networks on Behaviour. Lang, Bern.

334 P. Nieuwbeerta, H. Flap / Social Networks 22 (2000) 313–335
Flap, H., 1997. The conflicting loyalties theory. L’Année Sociologique 47, 183–215.De Graaf, N.D., Ultee, W.C., 1987. Intergenerationele mobiliteit en politieke verhoudingen. Acta Politica 22,
3–37.De Graaf, N.D., Ultee, W.C., 1990. Individual preferences, social mobility and electoral outcomes. Electoral
Studies 9, 109–132.De Graaf, N.D., Health, A., 1992. Husbands’ and wives’ voting behavior in Britain: class-dependent mutual
influence of spouses. Acta Sociologica 35, 311–322.De Graaf, N.D., Nieuwbeerta, P., Health, A., 1995. Class mobility and political preference: individual and
contextual effects. American Journal of Sociology 100, 997–1027.Harrop, M., Heath, A., Openshaw, S., 1991. Does neighborhood influence voting behaviour — and why? In:
Broughton, D., Crewe, I., Denver, D., Norris, P. (Eds.), British Elections and Parties Yearbook 1991. HarvesterWheatsheaf, London, pp. 103–120.
Hope, K., 1971. Social mobility and fertility. American Sociological Review 36, 1019–1032.Huckfeldt, R.R., 1986. Politics in Context: Assimilation and Conflict in Urban Neighborhoods. Agathon, New
York.Huckfeldt, R., Sprague, J., 1991. Discussant effects on vote choice: intimacy, structure, and interdependence.
Journal of Politics 53, 122–158.Huckfeldt, R., Sprague, J., 1995. Citizens, Politics and Social Communication. Cambridge University Press,
Cambridge.Jansen, J.P.G., Need, A., De Graaf, N.D., 1998. Does intergenerational class and religious mobility affect
class-based and religion-based voting? Acta Politica 33, 56–76.Jennings, M.K., Niemi, R.G., 1974. The Political Character of Adolescence: The Influence of Families and Schools.
Princeton University Press, Princeton.Jennings, M.K., Niemi, R.G., 1981. Generations and Politics: A Panel Study of Young Adults and their Parents.
Princeton University Press, Princeton.Katz, E., 1957. The two-step flow of political information: an up-to-date report on a hypothesis. Public Opinion
Quarterly 21, 61–78.Knoke, D., 1990a. Political Networks: The Structural Perspective. Cambridge University Press, Cambridge.Knoke, D., 1990b. Networks of political action: toward theory construction. Social Forces 68, 1041–1063.Kruyt, J.P., Goddijn, W., 1961. Verzuiling en ontzuiling. In: Drift en koers. Een halve eeuw Sociale Verandering
in Nederland. van Gorcum, Assen, pp. 227–263 (Drift and Direction, half a century of social change in TheNetherlands).
Laumann, E., 1973. Bonds of Pluralism: The Form and Substance of Urban Social Networks. Wiley, New York.Lazarsfeld, P.F., Berelson, B., Gaudet, H., 1944. The People’s Choice: How the Voter Makes up his Mind in
Presidential Campaigns. Columbia University Press, New York.Lijphardt, A., 1968. The Politics of Accommodation. Pluralism and Democracy in The Netherlands. University
of California Press, Berkeley.Lijphardt, A., 1999. Patterns of Democracy. Wiley, New York.Lipset, S., 1960. Political Man. The Social Bases of Politics. Doubleday, New York.Marsden, P.V., 1987. Core discussion networks of Americans. American Sociological Review 52, 122–131.McAllister, I., 1983. Social contacts and political behavior in northern Ireland, 1968–1978. Social Networks 5,
303–313.McFadden, D., 1974. Conditional logit analysis in qualitative choice behavior. In: Zarembka (Ed.), Frontiers in
Econometrics. Academic Press, New York, pp. 105–142.Middendorp, G.P., 1978. Progressiveness and Conservatism, the Fundamental Dimensions of Ideological
Controversy and their Relationship to Social Class. Mouton, The Hague.Need, A., 1997. The Kindred Vote. Individual and Family Effects of Social Class and Religion on Electoral Change
in The Netherlands, 1956–1994. Thesis, Amsterdam.Nieuwbeerta, P., 1995. The Democratic Class Struggle in 20 Countries, 1945/1990. Thesis, Amsterdam.Nieuwbeerta, P., 1996. The democratic class struggle in postwar societies: class voting in 20 countries, 1945–1990.
Acta Sociologica 39, 345–383.Nieuwbeerta, P., De Graaf, N.D., 1993. Intergenerational class mobility and political preference in The Netherlands
between 1970 and 1986. Netherlands Journal of Social Sciences 29, 27–45.

P. Nieuwbeerta, H. Flap / Social Networks 22 (2000) 313–335 335
Nieuwbeerta, P., Wittebrood, K., 1995. The intergenerational transmission of political preferences in TheNetherlands. Social Science Research 24, 243–261.
Nieuwbeerta, P., Gijsberts, M., Ganzeboom, H., 1998. Social and Economic Attitudes in The Netherlands, 1998.ICS, Utrecht (codebook).
Nieuwbeerta, P., De Graaf, N.D., Ultee, W.C., 2000. Effects of class mobility on class voting in post-war westernindustrialized countries. European Sociological Review 16 (4) 1–22.
Olsen, M., 1965. The Logic of Collective Action. Harvard University Press, Cambridge.Popkin, S., 1991. The Reasoning Voter. Communication and Persuasion in Presidential Campaigns. Chicago
University Press, Chicago.Rae, D., Taylor, M., 1970. The Analysis of Political Cleavages. Yale University Press, New Haven.Simmel, G., 1910. Die Kreuzung sozialer Kreise. In: Soziologie. Duncker und Humblot, Berlin.Slobbe, D., 1999. Politieke interesse en non-response. Facta 7, 24–25 (political interest and non-response).Smeenk, W., Graaf, N.D., Ultee, W., 1995. Thuisblijven bij verkiezingen in Nederland en de Verenigde Staten.
Mens en Maatschappij 70, 220–242 (non-participation in elections in The Netherlands and the United States).Sobel, M.E., 1981. Diagonal mobility tables: a substantively motivated class of designs for the analysis of mobility
effects. American Sociological Research 46, 893–906.Sobel, M.E., 1985. Social mobility and fertility revisited: some new models for the analysis of the mobility effects
hypothesis. American Sociological Research 50, 699–712.Völker, B., Flap, H., 1997. The comrades’ belief: intended and unintended consequences of communism.
Neighborhood relations in the former GDR. European Sociological Review 13, 241–265.Weatherford, M.S., 1982. Interpersonal networks and political behavior. American Journal of Political Science
26, 117–143.