creating riverine wetlands: ecological succession, nutrient retention, and pulsing effects
TRANSCRIPT

Ecological Engineering 25 (2005) 510–527
Creating riverine wetlands: Ecological succession,nutrient retention, and pulsing effects
William J. Mitsch∗, Li Zhang, Christopher J. Anderson, Anne E. Altor,Maria E. Hernandez
Olentangy River Wetland Research Park, School of Natural Resources, The Ohio State University,352 W. Dodridge Street, Columbus, OH 43202, USA
Received 17 February 2005; accepted 17 April 2005
Abstract
Successional patterns, water quality changes, and effects of hydrologic pulsing are documented for a whole-ecosystem exper-iment involving two created wetlands that have been subjected to continuous inflow of pumped river water for more than 10years. At the beginning of the growing season in the first year of the experiment (1994), 2400 individuals representing 13macrophyte species were introduced to one of the wetland basins. The other basin was an unplanted control. Patterns of suc-cession are illustrated by macrophyte community diversity and net aboveground primary productivity, soil development, waterquality changes, and nutrient retention for the two basins. The planted wetland continued to be more diverse in plant cover 10years after planting and the unplanted wetland appeared to be more productive but more susceptible to stress. Soil color ando ew yearso d. Plantd on, waterq horus 10y years ofr scribedf©
K k
f
reatt-et-for
0
rganic content continued to change after wetland creation and wetlands had robust features of hydric soils within a ff flooding. Organic matter content in surface soils in the wetlands increased by approximately 1% per 3-year perioiversity and species differences led to some differences in the basins in macrophyte productivity, carbon sequestratiuality changes and nutrient retention. The wetlands continued to retain nitrate–nitrogen and soluble reactive phospears after their creation. There are some signs that sediment and total phosphorus retention are diminishing after 10iver flow. Preliminary results from the beginnings of a flood pulsing experiment in the two basins in 2003–2004 are deor water quality, nutrient retention, aboveground productivity, and methane and nitrous oxide gaseous fluxes.
2005 Elsevier B.V. All rights reserved.
eywords: Created wetlands; Wetland restoration; Floodplain wetlands; Wetland succession; Olentangy River Wetland Research Par
∗ Corresponding author. Tel.: +1 614 292 9774;ax: +1 614 292 9773.
E-mail address: [email protected] (W.J. Mitsch).
1. Introduction
Wetlands are being created and restored at gfrequency around the world both as “mitigation” welands that are meant to replace or compensate for wland habitat loss and as wetland treatment systems
925-8574/$ – see front matter © 2005 Elsevier B.V. All rights reserved.
doi:10.1016/j.ecoleng.2005.04.014
W.J. Mitsch et al. / Ecological Engineering 25 (2005) 510–527 511
improving water quality. As important as the functionsof wetlands are for providing values such as habi-tat structure and water quality improvement, there arescarcely any long-term data from thousands of createdand restored non-tidal freshwater wetlands. In contrast,there are some results of long-term (>10-year) in theliterature for created salt marshes and tidal freshwatermarshes (Craft et al., 2002, 2003; Leck, 2003). Further,few studies have investigated how macrophyte diver-sity and cover affect ecosystem function in created andrestored wetlands, despite the frequent use of macro-phyte cover and species requirements as determinantsof legal and ecological success of these wetlands in mit-igating wetland loss (Mitsch et al., 1998; NRC, 2001).
This paper presents the results of 10 years of study oftwo created riverine wetlands developed “from scratch”on non-wetland soils and maintained for those 10 yearsby pumped river water. These experimental wetlandsallowed the simultaneous long-term study of three dif-ferent aspects of newly created wetlands: (1) measuringthe importance of wetland plant introduction on ecosys-tem function; (2) investigating the time it takes forthe development of hydric soils at a site where nohydric soils previously existed; and (3) determiningthe long-term patterns of water quality changes of aflow-through wetland as it develops from open pondsof water to vegetated, hydric-soil, marshes.
For the plant introduction study, our hypothesis inthis study was that planted and unplanted wetlandswould initially diverge in structure but eventually con-v signw
1 any
2 io-ro-ttle
3
teda man-i wet-l e ani sh-o tory,a storew -year
Fig. 1. Four possible outcomes of propagule introduction (e.g., plant-ing of macrophytes) in newly created wetlands. Pathways 1 and 2 leadto healthy wetlands; Pathways 3 and 4 lead to a failed ecosystem state.
periods, the importance of species introduction in gen-eral and macrophyte planting in particular on ecosys-tem function remains poorly understood. Changes thatare long-term in nature, e.g. woody plant invasionor soil carbon increases, can have significant effectson shorter-term dynamics of wetlands, e.g. algal andmacrophyte vegetation dynamics. For example,Fig. 1illustrates four possible ecosystem states possible forwetlands with two different initial conditions. In onecase, a wetland is planted (high propagule introduc-tion) and in the second case, a wetland is left to naturalcolonization (low propagule introduction). Achievinga healthy ecosystem state for shorter-term variablesis possible in both situations (Pathways 1 and 2) butunexpected threshold shifts can occur (Pathways 3 and4); these short-term dynamics couple with long-termecosystem processes (Carpenter and Turner, 2001).
We have 10 years detailed data on ecosystem struc-ture and function in two 1-ha wetland basins main-tained under strict and well documented hydrologicconditions that, when analyzed in a retrospective anal-ysis, will reveal: (1) the importance of macrophyteintroduction and subsequent macrophyte communitydiversity on ecosystem function and (2) the effectsof this diversity on ecosystem resiliency to stressorsand coupling of fast and slow turnover dynamics. Ourhypothesis is that in wetland ecosystems with essen-tially identical forcing functions, the introduction ofpropagules can lead to alternative ecosystem states.These alternate states may or may not provide thef atoryn forw
erge in structure. Three major questions in self-deere also part of this study:
. Does human introduction of propagules havemeasurable effect on ecosystem function?
. At what rate and to what degree will a diverse blogical community develop in newly created hydlogically open wetland ecosystems in which libiological life initially existed?
. Does biodiversity affect ecosystem function?
We believe that introducing macrophytes in creand restored wetlands could be regarded as a hu
nduced switch that changes the resiliency of theands and that this resiliency or lack thereof may bmportant factor in allowing systems to cross threlds that alter ecosystem function, recovery trajecnd successional patterns. Because created and reetlands have rarely been monitored beyond the 5
dunctions necessary to meet restoration and reguleeds for wetlands or provide the right conditionsater quality improvement.

512 W.J. Mitsch et al. / Ecological Engineering 25 (2005) 510–527
1.1. A whole-ecosystem approach
Studies that attempt to link wetland function withstructure are often done at inappropriate spatial andtemporal scales to assist those responsible for the man-agement of wetland landscapes. While there is nosingle optimum scale for ecosystem experimentation,it is well know that it is easier to apply statisticalmethods successfully when many small replicated sys-tems or plots are used (Carpenter, 1998; Carpenter etal., 1998b). As a result, these scales are often cho-sen to make inferences about wetland management.Unfortunately, when results of small-scale, short-termstudies are applied to full-scale conditions, conclu-sions are questionable at best. For example,Engelhardtand Ritchie (2001)manipulated seventy 1.5-m diam-eter wading pools with one, two, and three species ofthe submersed pondweed (Potamogeton spp.) over onegrowing season and found that higher algal biomassand higher phosphorus uptake occurred in the poolswith highest macrophyte species richness. They con-cluded that higher species richness created up to 25%higher algal biomass and caused 30% more phospho-rus uptake and thus would support more wildlife andfish. They further concluded that a wetland with highrichness or diversity due to disturbance might better“sustain ecosystem functioning and promote the ser-vices of those wetlands to humans.” We consider thisextrapolation of short-term results from 1.5-m poolsto national wetland policy in a prestigious scientificj rmm atials ques-t
so-c ermw po-n diesasa ,1 7;Ces , andl ett thed result
when large-scale experiments are used. Results fromlarge-scale experiments are less stochastic and thusmore homeostatic, and often allow for the demonstra-tion of ecosystem properties that otherwise would notappear in smaller scale experiments (Pomeroy et al.,1988; Odum, 1990; Carpenter et al., 1995; Carpenter,1998). Kemp et al. (2001)illustrate in plankton experi-ments that as the scale of the experiment increases, therelative variance decreases. This may be a general prin-ciple and if it is, there is less need for great numbersof replications with increasing size of the experiment.There needs to be more understanding and acceptanceof large-scale experiments and observations in the lit-erature, if for no other reason than that they serve as acheck on theories and management recommendationsbeing published from smaller-scale studies chosen pri-marily because of elegant replications and statistics.
2. Methods
2.1. Experimental design
Two 1-ha experimental wetlands and a river waterdelivery system were constructed in 1993–1994 atThe Olentangy River Wetland Research Park, a 12-ha wetland research site on the campus of The OhioState University in Columbus (Fig. 2). Over 2400 plantpropagules (mostly root stock and rhizomes) represent-ing 13 species typical of Midwestern USA marsheswere planted in one wetland (Wetland 1, W1) in May1 d.B andq en-t iod1 ew cca-s fters vel-o o ort latesp uralf inedf rei wasa , sot edi ear.W are
ournal to be infelicitous. Extrapolation of short-teicrocosm experiments across temporal and sp
cales for adaptive management of ecosystems isionable at best.
Alternatives to the replicated small-scale meosms for wetland study are large-scale, long-thole ecosystem studies that include more coments of the ecosystem. Examples of such sture described byMitsch and Day (2004)and includeystems such studies of tropical rain forests (Odumnd Pigeon, 1970); forested watersheds (Likens et al.977); lakes (Schindler, 1977; Schindler et al., 199arpenter et al., 1996,1998a), and wetlands (Odumt al., 1977; Mitsch et al., 1995). Whole-ecosystemtudies are often criticized because the size, costogistics do not allow for much if any replication. Yhe lack of replication can be compensated for byecrease in variances that has been shown to
994 (Fig. 3). Wetland 2 (W2) remained unplanteoth wetlands have received the same amountuality of pumped river water and remained ess
ially identical hydroperiods over the 10-year per994–2003 (Fig. 4). River water is pumped into thetlands continuously, day and night, except for oional short-term unscheduled electrical failures. Atart-up trials in 1994, a pumping protocol was deped that involves changing the pumping rate tw
hree times per week based on a formula that reumping rate to river discharge. In 2003, extram
unding from Ohio and Federal agencies was obtaor a pulsing study whereby artificial “floods” wentroduced to the wetland basins; each wetlanddministered with the same hydrologic conditions
he “planting experiment” was not violated. Pumpnflow to each wetland has averaged 20–30 m/y
ater depths in the major portions of the wetland

W.J. Mitsch et al. / Ecological Engineering 25 (2005) 510–527 513
Fig. 2. Olentangy River Wetland Research Park at Ohio State University, showing two experimental wetlands used for long-term whole-ecosystemstudy described in this proposal.
generally 20–40 cm in the shallow areas where most ofthe emergent macrophytes grow and 50–80 cm in thedeepwater areas that were constructed in the wetlandto allow overwintering of fish (for mosquito control)and long-term sediment storage.
Early results illustrated system divergence and con-vergence (Mitsch et al., 1998) and water qualitychanges caused by the wetlands (Nairn and Mitsch,2000; Spieles and Mitsch, 2000a) in the first 3 yearsof this study. There was a clear pattern of ecosys-tem divergence 6 years after planting (Mitsch et al.,2005a). Other studies published on the ecosystem-scale experimental wetlands include those on aquaticsystem modeling (Metzker and Mitsch, 1997), algal
dynamics (Wu and Mitsch, 1998), hydrology (Korenyet al., 1999; Zhang and Mitsch, 2005), water qual-ity (Kang et al., 1998), benthic invertebrates (Spielesand Mitsch, 2000b), sedimentation patterns (Harter andMitsch, 2003), and Typha hybridization (Selbo andSnow, 2004). Methods for some of the prominent datacollected annually at the experimental wetlands aredescribed here.
2.2. Macrophyte coverage and communitydiversity
Macrophyte coverage by dominant community hasbeen estimated each year from aerial color photogra-

514 W.J. Mitsch et al. / Ecological Engineering 25 (2005) 510–527
Fig. 3. Macrophyte species planted in experimental Wetland 1 (W1)in May 1994. Mudflat was designation used for shallow slightlysloping convex portion of experimental wetlands where the mostdiversity of plants were introduced. Graphic shows survival of indi-vidual plants, as marked by flagging, in June and August 1994 andAugust 1995.
phy taken at the period of peak biomass (late August),coupled with ground truth surveys. Ground surveysinvolved mapping plant communities along 500 m ofseven transects in each wetland. Transects are on per-manent walkways that are about 1.5 m above the wet-land, thus giving a good perspective even with 3-m tallplants. A 10 m× 10 m grid system marked with per-manent numbered PVC poles is used to identify thelocation of plant communities in each wetland. Vege-tation community maps for each year are normalized
to the same size basin map utilizing geographic infor-mation system software.
2.3. Macrophyte productivity
Aboveground peak biomass has been used as anestimate of net aboveground primary productivityin the experimental wetlands since 1997 by directaboveground harvesting of random 1-m2 plots in 16general locations in each wetland along samplingboardwalks.
2.4. Soil sampling
Soils have been comprehensively analyzed for colorand organic content on three occasions: 1993 (priorto flooding); 1995 (17 months after flooding began),and in 2003 (approximately 10 years after construc-tion). Surface soils were sampled using a 10-m gridsystem established for the wetlands after they wereconstructed. Permanent field markers were establishedat each grid point that allowed for direct compar-isons of soil samples collected between years. Ateach grid point, a sample was collected at the sur-face (0–8 cm depth) and subsurface (8–16 cm depth).A total of 102 wetland soil samples were collectedand analyzed in 1993 and 1995 (Nairn and Mitsch,1996), and a total of 166 in 2003. Soil color wasdetermined at multiple sites in each wetland basinb lor
Fig. 4. Pattern of pumped inflow to the planted (Wetland 1) and n 003.
y comparing soil color to a standard Munsell co
aturally colonizing (Wetland 2) experimental wetlands, 1994–2

W.J. Mitsch et al. / Ecological Engineering 25 (2005) 510–527 515
chart and the percentage of samples≤2 was deter-mined. Percent organic matter was estimated foreach sample through loss on ignition at 550◦C for1 h.
2.5. Water quality
Sampling of water temperature, dissolved oxygen,pH, conductivity, and redox have been measured twice-per-day (dawn and dusk) for 10 years with water qual-ity sondes at the inflow of the wetlands and outflowsof both wetland basins. One-hundred-milliliter sam-ples are also taken dawn and dusk each day at theinflow and two outflows for turbidity analyses in thelaboratory with a Hach ratio turbidimeter. In addi-tion to the twice-per-day manual sampling, weeklywater samples are taken at inflow, middle, and out-flows of the wetlands for nutrients (SRP, TP, NO3)that are determined by standard methods. Samples aresplit into filtered (0.45�m) and unfiltered samples,frozen until analysis, and analyzed for total phospho-rus, soluble reactive phosphorus, and nitrate–nitrogen(USEPA, 1983; APHA, 1989). Both total phosphorusand soluble reactive phosphorus methods employ theascorbic acid and a molybdate color reagent methodwith a Lachat QuikChem IV automated system. Totalphosphorus samples are first digested by adding 0.5 mlof 5.6 N H2SO4 and 0.2 g (NH4)2S2O8 to 25 ml ofsample and exposing the samples to a heated andpressurized environment for 20 min in an autoclave.N emI tionm 95w egeW uto-a wasc ard,a ff by5
2
froms w ise wet-l yearsa nualr
2.7. Gas fluxes
CH4 fluxes were quantified twice per month dur-ing a year of pulsing flow from March to September,2004, in six 0.26-m2 plots in each wetland basin; halfwere located in the edge zones and contained emer-gent vegetation, and half were located in permanently-inundated areas. Portable, non-steady-state chambers(Livingston and Hutchinson, 1995) were employed forgas flux measurements. Permanent PVC frames andHDPE bases were installed at edge-zone sampling loca-tions; 4-mil, fitted polyethylene bags affixed with sam-pling ports were attached to the frames at the time ofsampling. Permanently inundated areas were sampledwith floating chambers made from the same materials.Sampling was conducted in the morning, afternoon,and after dark on each sampling date. Sampling tookplace during flood pulses, and at the end of the low-flow period before the subsequent pulse. Each flux ratewas determined from three to five samples collectedfrom each chamber at regular intervals over 30–60 min.Samples were injected into evacuated 10-ml autosam-pler vials and stored at 4◦C until analysis, which wascompleted within 1 week. Gas samples were analyzedwith a Shimadzu GC 14-A flame ionization detec-tor (150◦C) using a 40 position HTA Autosampler, a1.8 m Porapak-Q column, and helium as the carrier gas(25 ml min−1). Flux rates were determined by the lin-ear change in concentration by mass of CH4–C overtime (Holland et al., 1999).
ber( -n hD achw itht lotsi andt ed.D for2 rawne imesa ce am plesw uni-f ass raph( p,t ture
itrate + nitrite were analyzed on a Lachat QuikChV automated system with the cadmium reducethod. Samples from April 1994 through July 19ere run by similar methods by Heidelberg Collater Quality Laboratory using a Traacs 800 a
nalyzer. The accuracy of the nutrient analysishecked every 10–20 samples with a known standnd the samples are redone if the accuracy is o%.
.6. Hydrology
Water stages and inflow rates are manually readtaff gauges and flow meters twice per day. Outflostimated from water stages. Water budgets for the
and basins have been calculated for the past 10nd published these results each year in our aneports.
N2O fluxes were measured using a closed chamPlexiglas chamber 24.5 cm× 24.5 cm× 70 cm) techique (Smith et al., 1983) from June 2003 througecember 2004. Nine plots were sampled in eetland near the inflow, middle, and outflow, w
hree plots in a transitional upland zone, three pn the edges with alternate wet and dry conditions,hree plots in the marsh, which were regularly flooduring gas collection the chambers were sealedh using a water seal, gas samples were withdvery 30 min. Samples were taken weekly, three tmonth, when pulsing events occurred and ononth when no pulses were performed. All samere taken between 11:00 a.m. and 3:30 p.m. for
ormity within the diurnal period. Nitrous oxide gamples were analyzed using a gas chromatogShimadzu GC-14-A) fitted with a 2 ml sampling loowo Porapak-Q 1.8 m columns and an electron cap

516 W.J. Mitsch et al. / Ecological Engineering 25 (2005) 510–527
Ni-63 detector. The instrument used ultra pure nitrogencarrier gas (10 ml min−1) and operated at temperaturesof 70, 80, and 300◦C for column, injector, and detec-tor, respectively. Nitrous oxide fluxes were calculatedusing a closed chamber flux equation (Holland et al.,1999).
3. Results and discussion
3.1. Macrophyte cover
Fig. 5presents dominant vegetation community pat-terns from 1994 through 2003. Patterns of dominanceand subsidence of macrophyte communities is summa-rized inFig. 6. By the end of the 10th growing seasonin 2003, Wetlands 1 (W1) and Wetland 2 (W2) hadapproximately 62 and 38% macrophyte cover respect-fully. These values were considerably lower than the 73and 74% cover in the two wetlands in 2002—the high-est percent coverage in the basins since they were cre-ated in 1994. The decrease is probably due to the springpulsing of water through both wetlands and some her-bivory. From 1994, when there was no significantmacrophyte vegetation cover in either basin, macro-phyte coverage increased yearly in both basins through1999. Wetland 1 had a greater percent coverage thanWetland 2 until 1997, when that trend reversed. Cover-age decreased in both Wetlands 1 and 2, from 2000 to2001, probably as a result of a combination of muskrath e too eta-t .
pat-t f thew the“ ro-p -n embp nd,a aredt rgedw
then . Itg er int niz-
ing wetland (W2) was totally dominated by a very pro-ductive cover ofTypha while the planted wetland (W1)had a diversity of communities including ones domi-nated by four communities:Sparganium eurycarpum,S. tabernaemontani, Typha spp., andScirpus fluviatilis.
Wetland macrophyte coverage began to significantlyerode in 2000 and, by 2001, the wetlands had only 27.6and 17.4% macrophyte cover in W1 and W2, respec-tively. This macrophyte vegetation loss was causedprimarily by a peak in muskrat activity that followed theyear of maximum plant coverage in 1999. We believethat after the muskrat activity peak, as measured bywinter lodge counts, the absence of vegetation coverfor food, protection, and lodge construction causedthe muskrat population to drop significantly. Predationundoubtedly was one reason but movement of muskratsto the river and other wetlands is also likely. A signifi-cant drawdown of both basins was done in spring andearly summer 2002 to allow the seed bank to reset.The approach was successful. At the end of the 2002growing season, vegetation coverage was the highest ithad ever been (73–74% cover in the basins) andTyphacoverage was only 9% of the total area of Wetland 2and 5% of the total area of Wetland 1. This was con-siderably reduced from peak year 1999 when it was56% of the cover in Wetland 2. One of the most signif-icant changes in 2002 was the increased coverage byS. tabernaemontani in both wetlands, apparently fromthe marsh seedbank.S. tabernaemontani dominanceincreased in both basins in 2002 from 0.3 to 52% cov-e
nt inW erep ands sonsf andb
3
sityi er-ie
C
erbivory and possibly increased water levels duutflow sedimentation. The overall pattern of veg
ion can be summarized in several distinct periodsWetland 1 was planted in 1994 and a distinct
ern of vegetation development around the edge oetland was observed in 1995 as a result while
unplanted” wetland remained relatively free of machytes except for an edge ofPopulus seedlings begining on the interior mudflat. By the third year, soft-stulrushSchoenoplectus tabernaemontani (a.k.a.Scir-us validus) had colonized in the unplanted wetland by the end of the third growing season, it appe
hat the planted and unplanted wetlands had conveith a domination of cover bySchoenoplectus.Typha spp. dominance increased dramatically in
aturally colonizing Wetland 2 from 1996 to 1999enerally has remained less than 17% or less cov
he planted Wetland 1. By 1999, the naturally colo
rage in W1 and from 0 to 63% in W2.In January 2003, we started a pulsing experime1 and W2 where several 7-day duration floods w
ulsed through the wetlands, mostly in late winterpring. This pulsing was one of the apparent reaor the reduction in macrophyte cover in the wetlasins in that year.
.2. Macrophyte community diversity
We developed a macrophyte community diverndex (CDI) to quantify spatial diversity in these expmental wetlands (Mitsch et al., 2005a). The index isxpressed as:
DI =N∑
i=1
(Ci ln(Ci))

W.J. Mitsch et al. / Ecological Engineering 25 (2005) 510–527 517
Fig. 5. Vegetation community cover in the planted (Wetland 1) and naturally colonizing (Wetland 2) experimental wetlands at Olentangy RiverWetland Research Park, 1994–2003.

518 W.J. Mitsch et al. / Ecological Engineering 25 (2005) 510–527
Fig. 6. Typha and other macrophyte community cover in the planted(Wetland 1) and naturally colonizing (Wetland 2) experimentalwetlands at Olentangy River Wetland Research Park, 1994–2003.Episodes of high muskrat herbivory in 2000 and 2001 are also indi-cated.
whereCi is the percent cover of community “i” (0–1)andN is the number of plant/aquatic communities.
Overall, there were 13 different communities iden-tified from ground surveys supported by aerial photog-raphy during the study, based on the dominant speciesin communities (seeFig. 5). When the wetlands areviewed in terms of our community diversity index,which includes evenness of plant cover as well as num-ber of dominant communities, an interesting pattern ofmacrophyte community diversity in the two wetlands isseen (Fig. 7). The data show a general pattern of higherdiversity in the planted wetland with the exception ofyears 3–5 when community diversity was similar in thetwo basins. By the sixth year (1999), after the 3 yearsof similar plant cover in the two basins, different spa-tial community diversity developed. The CDI in W2dropped asTypha formed close to a monoculture; the
Fig. 7. Macrophyte diversity in the planted (Wetland 1) and nat-u ngyR mu-n
CDI increased in W1 as a good balance among fivecommunities developed. Four of those communitieswere dominated by plants introduced in the planting.Diversity dropped in 2000 and 2001 during the yearsof extensive herbivory but dramatically increased againin 2002 and 2003 (years 9 and 10) when the wetlandvegetation reset.
3.3. Macrophyte productivity
Macrophyte net aboveground primary productivity(NAPP), as estimated by peak aboveground biomass inAugust each year, decreased in both wetlands in 2003compared to similar plot readings in 2002 (Fig. 8a).When paired sites were compared between the twowetlands (16 sites were paired in 2003) macrophyteaboveground biomass was statistically higher in theplanted Wetland 1 than in the naturally colonized Wet-
F et-l nds,1 and( eache
rally colonizing (Wetland 2) experimental wetlands at Olentaiver Wetland Research Park, 1994–2003. CDI stands for comity diversity index, which is defined in the text.
ig. 8. Indicators of macrophyte productivity in the planted (Wand 1) and naturally colonizing (Wetland 2) experimental wetla997–2003: (a) peak aboveground biomass in vegetation zonesb) cumulative organic matter production, kilograms per year inxperimental wetland basin.

W.J. Mitsch et al. / Ecological Engineering 25 (2005) 510–527 519
land 2 (t = 0.0002;α = 0.05) for the first time in 7 years.This is because of a significant decrease in macro-phyte cover in the southern half of Wetland 2 in 2003due, we believe, to a combination of higher herbivoryand effects of temporary high water levels caused bypulsing. Before that, peak aboveground biomass wassignificantly higher in plots in Wetland 2 than in Wet-land 1 for 4 straight years from 1998 to 2001.
Based on the aboveground biomass and estimates ofmacrophyte cover presented above, aboveground pro-ductivity by macrophytes in each wetland basin wasestimated for 1997–2003 (Fig. 8b). Overall macrophyteorganic productivity decreased 46% in Wetland 1 and81% in Wetland 2 from 2002 to 2003. These num-bers are significant for two reasons. First, althoughthe macrophyte community substantially recoveredin 2002 from the herbivory and subsequent macro-phyte losses of 2000 and 2001, productivity once moredecreased in 2003, due to herbivory in Wetland 2 andpossibly due to high water levels that were a result of apulsing experiment in both basins in spring 2003. Sec-ond, 2003 is the second year in a row where the plantedWetland 1 had a higher estimated macrophyte carbonsequestration than the naturally colonized Wetland 2.The total organic matter production by macrophytesover the last 7-year period is now almost the same inthe two wetland basins at 22–23 tonnes per basin.
3.4. Soil development
sub-s 994( face( e ofs anicm ofw .6%.O asedb con-t nto er 10y saltm after1t epthh thew indi-c fter
Fig. 9. Experimental wetlands soil data pooled for both experimentalwetlands: (a) percent organic matter in 1993, 1995, and 2003, and(b) percent of soil samples that exhibited chroma values of 2 or lessin 1993, 1995, and 2003. Soil data indicated as 2003 were collectedbetween December 2002 and March 2003.
water was added to the wetlands, 78% of the samplestaken in the surface layer had soil chromas of 2 or lesswhile only 24% in the 8–16 cm depth had chromas of2 or less. Five years after the creation of a freshwa-ter marsh,Vepraskas et al. (1999)found soil matricesdepleted of iron and low chromas.
3.5. Water quality
Patterns of water quality changes through both wet-lands have been pronounced and variable over the 10years of wetland development, reflecting changes fromcharacteristics of eutrophic shallow ponds in the earlyyears (Wu and Mitsch, 1998) to functioning wetlands inlatter years. The changes in water quality are presentedas “percent change” in all subsequent graphics. Eventhough the results are presented as only one number per
Soil changes at the wetland surface have beentantial since the addition of water to the basins in 1Fig. 9). Most changes have occurred at the sur0–8 cm depth) because of the prevailing influencedimentation and organic accumulation. Soil orgatter (SOM) increased by 63% in the upper 8 cmetland soils over the decade to an average of 8n average, surface organic matter content increy approximately percentage point each 3 years. In
rast,Craft et al. (2003)found an increase in the amouf carbon per unit area in created salt marshes aftears, but to levels 18% of those found in naturalarshes. Color in the soils changed dramatically0 years of inundation (Figs.9b and10) with 94% of
he samples from both 0–8 cm depth and 8–16 cm daving soil chromas of 2 or less in 2003. Beforeetlands were created in 1993, no soil samplesated soil chroma of 2 or less. In 1995, 17 months a

520 W.J. Mitsch et al. / Ecological Engineering 25 (2005) 510–527
Fig. 10. General pattern of surface soil color change, as indicated on a Munsell Color Chart, averaged for both experimental wetlands atOlentangy River Wetland Research Park from 1993 (prior to wetland basin flooding) to 2002. Note that the soil chroma decreased to values of2 or less after 1996, or 2 years after the basins were flooded.
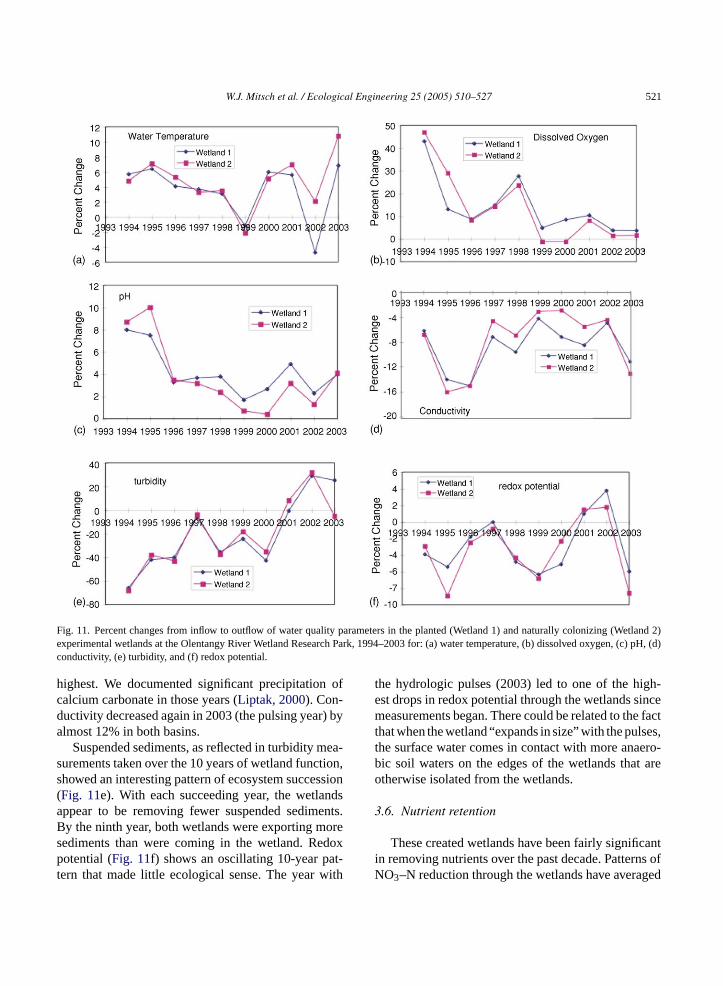
wetland for each year, statistical differences have beendetermined between the wetlands by paired tests of theoutflow concentrations. Water temperature increasesthrough the wetlands (Fig. 11a) showed a consistentpattern of decreasing (there was less net warming frominflow to outflow each year) over the first 6 years in eachwetland as vegetation developed to maximum cover by1999. Then muskrat herbivory removed macrophytecover in 2000 and especially in 2001 (seeFig. 5), expos-ing the water surface to full sunlight that resulted in anet effect of warmer temperatures. The wetland vege-tation recovered dramatically in 2002 and temperaturepatterns once again were less dramatic. That patternreversed in 2003 when our hydrologic pulsing exper-iment decreased vegetation cover but also changedthe basin retention rates, causing higher temperatureincreases again.
Dissolved oxygen change through the wetlands(Fig. 11b) showed a fairly consistent pattern over the10 years of decreasing in importance, probably due to
the continued decrease in the importance of aquatic pri-mary productivity. The site was an experimental farmfor decades prior to the construction of the wetlands andinitial algal blooms were long in duration and intense(Wu and Mitsch, 1998). Gradually, high concentrationsof nutrients have been removed from the wetland soils,resulting in lower aquatic primary productivity. Thelow change in dissolved oxygen persisted in the years1999–2003 despite the fact that macrophyte cover waslower in most of those years. In 2003, the flood pulsingmay have decreased water column productivity in thebasins.
Patterns of pH change through the wetland basins(Fig. 11c) mirrored those seen for dissolved oxygen.Early in the study it was common to see dramaticincreases in pH in the late afternoon due to high pro-ductivity in the water column. In latter years, that wasno longer the case. Conductivity (Fig. 11d) decreaseddramatically through the wetlands in the second andthird years when water column productivity was the
W.J. Mitsch et al. / Ecological Engineering 25 (2005) 510–527 521
Fig. 11. Percent changes from inflow to outflow of water quality parameters in the planted (Wetland 1) and naturally colonizing (Wetland 2)experimental wetlands at the Olentangy River Wetland Research Park, 1994–2003 for: (a) water temperature, (b) dissolved oxygen, (c) pH, (d)conductivity, (e) turbidity, and (f) redox potential.
highest. We documented significant precipitation ofcalcium carbonate in those years (Liptak, 2000). Con-ductivity decreased again in 2003 (the pulsing year) byalmost 12% in both basins.
Suspended sediments, as reflected in turbidity mea-surements taken over the 10 years of wetland function,showed an interesting pattern of ecosystem succession(Fig. 11e). With each succeeding year, the wetlandsappear to be removing fewer suspended sediments.By the ninth year, both wetlands were exporting moresediments than were coming in the wetland. Redoxpotential (Fig. 11f) shows an oscillating 10-year pat-tern that made little ecological sense. The year with
the hydrologic pulses (2003) led to one of the high-est drops in redox potential through the wetlands sincemeasurements began. There could be related to the factthat when the wetland “expands in size” with the pulses,the surface water comes in contact with more anaero-bic soil waters on the edges of the wetlands that areotherwise isolated from the wetlands.
3.6. Nutrient retention
These created wetlands have been fairly significantin removing nutrients over the past decade. Patterns ofNO3–N reduction through the wetlands have averaged

522 W.J. Mitsch et al. / Ecological Engineering 25 (2005) 510–527
Fig. 12. Percent changes from inflow to outflow in the planted (Wetland 1) and naturally colonizing (Wetland 2) experimental wetlands at theOlentangy River Wetland Research Park, 1994–2003 for: (a) nitrate + nitrite-nitrogen; (b) soluble reactive phosphorus (SRP); (c) total phosphorus(TP).
close to 35% by concentration and mass (Mitsch et al.,2005b; Fig. 12a). Nitrate removal patterns in the nat-urally colonizing wetland have been erratic, rangingfrom removal rates in the 20% range 1 year, and high40% range the next. The planted and more diverse wet-land (WI) has removal rates more consistent from yearto year. The spring pulsing in 2003 did not appear toreduce nitrate–nitrogen removal. In fact, the averagenitrate removal by the wetlands was the highest in thetwo wetlands (42% reduction) as it has been since thebeginning of the study a decade earlier. The retentionof soluble reactive phosphorus (SRP) in the wetlandbasins (Fig. 12b) continued to be significant at around70% through the 10th year 2003 (no nutrient data arereported for 2002). In the 10th year after wetland con-struction and during the pulsing year, the planted wet-land retained 63% of SRP while the naturally coloniz-ing wetland retained 73% (not significantly different,α = 0.05). Total phosphorus (TP) showed a much differ-ent picture with little retention and even export by the
10th year (Fig. 12c). TP decreased by only 2% in W2and increased by 14% in W1 after a consistent patternof total phosphorus retention during the first 8 yearssince wetland construction. This pattern is consistentwith the pattern seen for turbidity in the 2003 pulsingyear where there was either a very small reduction orslight increase in turbidity in that year. The sedimentsthat are discharging from the wetlands have significantphosphorus bound to the soil particles.
3.7. Pulsing effects
3.7.1. Macrophyte productivityIn 2003, flood pulses of 7-day durations and inflow
of approximately 500 gpm were pumped into each ofthe two experimental wetlands. Preliminary results ofthe 2003 flood pulses are described here. Macrophytevegetation NAPP appeared to be lower during the puls-ing in 2003 compared to the previous year (Fig. 8a).High water levels in the spring caused by the pulses may

W.J. Mitsch et al. / Ecological Engineering 25 (2005) 510–527 523
have had a detrimental effect on emergent macrophyteproductivity but the lower productivity could have alsobeen due to other causes. The pattern was particularlyacute in W2 where macrophytes disappeared from thesouthern half of the basin in 2003 (Fig. 5). Higher com-munity diversity in W1 may have insulated it from thisstress caused by the flooding whereas the lower diver-sity in W2 made it more susceptible to the combinedstress of flooding and grazing.
3.7.2. Water qualitySome preliminary effects of the flood pulses or arti-
ficial “floods” in 2003 on water quality in the two exper-imental wetlands are shown inTables 1 and 2. Waterquality changes during the pulsing events of 2003 areimmediate. When the two wetlands are investigatedwith frequent two-per-day sampling, water tempera-ture and pH significantly increased in both basin out-flows during flood pulses (Table 1, α = 0.05). Betweenflood pulses (low-flow conditions), temperature and pHwere again higher and conductivity was lower in bothwetland outflows compared to the inflows (Table 1).When data are investigated with both wetland basinscombined at the outflow swale (Table 2), there is a sig-nificant difference between pulsed and non-pulsed con-ditions for conductivity and soluble reactive phospho-rus. Both conductivity and soluble reactive phosphorusdecreased more rapidly during non-pulsing conditionsthan during pulses.
3s of
h nds,p mi-n anefl tm ignifi-c slyd aryr anee hoses
edd er.I eh uls-i rd ns. Ta
ble
1C
ompa
rison
oftw
o-pe
r-da
yw
ater
qual
itysa
mpl
esin
the
two
expe
rimen
talw
etla
nds
durin
gflo
odpu
lsin
gan
dno
n-pu
lsin
gpe
riods
in20
03
Par
amet
ers
Pul
sing
Non
-pul
sing
Inflo
wO
utflo
w1
Out
flow
2In
flow
Out
flow
1O
utflo
w2
Tem
pera
ture
(◦ C)
10.3
±1.
5(3
1)11
.9±
1.8
(31)
*12
.2±
1.8
(31)
*11
.5±
0.8
(94)
13.2
±1.
0(9
5)*
13.6
±1.
0(1
02)*
DO
(mg/
l)10
.79±
0.57
(24)
11.9
6±0.
73(2
5)*
11.9
4±
1.02
(25)
10.6
9±0.
38(8
0)10
.75±
0.55
(89)
11.4
2±0.
52(9
2)*
Con
duct
ivity
(��
/cm
)72
6±
51(3
2)72
9±54
(32)
723±
50(3
2)65
0±23
(101
)53
0±21
(103
)*53
5±
23(1
09)*
pH7.
97±
0.06
(27)
8.15
±0.
07(2
8)*
8.17
±0.
09(2
8)*
7.93
±0.
06(8
6)8.
25±
0.07
(87)
*8.
23±
0.05
(94)
*
Red
ox(m
V)
261±
10(3
1)26
4±15
(32)
246±
13(3
1)28
1±9
(105
)25
7±10
(102
)25
2±9
(113
)*
Tur
bidi
ty(N
TU
)24
±5
(22)
19±
4(2
2)15
±2
(22)
29±
4(6
3)23
±3
(61)
*23
±3
(57)
*S
igni
fican
tdiff
eren
tatα
=0.
05be
twee
nin
flow
vs.o
utflo
w.
.7.3. Gas exchangeStudies are underway to evaluate the effectydrologic pulsing on gas exchange from the wetlaarticularly for methane and nitrous oxide. Preliary results of the effects of flood pulsing on methux in the experimental wetlands (Fig. 13) show thaethane emission in vegetated areas increased s
antly when flooding occurred in zones that previouid not have standing water. However, preliminesults also suggest that overall “average” methmission from pulsed sites was less than that from tites where flooding was permanent.
A seasonal pattern in N2O emissions was observuring the study period with highest rates in summ
n summer 2003 and winter 2004, N2O emissions werigher when no pulses occurred than when flood p
ng occurred. In spring 2004, N2O fluxes were higheuring pulsing than during non-pulsing conditio

524 W.J. Mitsch et al. / Ecological Engineering 25 (2005) 510–527
Table 2Effects of flood pulsing on water quality in the experimental wetlandsin 2003
Inflow Swale outflow Percentchange
Temperature (◦C)Pulse 12.4± 2.8 (11) 13.6± 2.6 (13) +9.7Non-pulse 15.6± 1.8 (16) 16.6± 1.9 (16) +6.4
Dissolved oxygen (mg/l)Pulse 7.47± 1.33 (10) 6.98± 1.37 (11) +6.6Non-pulse 9.29± 0.70 (14) 8.66± 0.84 (16) +6.8
Conductivity (��/cm)Pulse 705± 76 (11) 640± 82 (13) −9.2*
Non-pulse 627± 33 (16) 556± 37 (18) −11.3*
pHPulse 8.28± 0.23 (7) 8.28± 0.15 (7) 0Non-pulse 7.80± 0.14 (15) 7.88± 0.08 (16) +1.0
Redox (mV)Pulse 237± 28 (11) 292± 35 (13) +23.2Non-pulse 263± 26 (16) 230± 20 (18) −12.5
Nitrate–nitrogen (mg N/l)Pulse 4.17± 0.50 (15) 2.88± 0.38 (15) −31Non-pulse 4.48± 0.51 (18) 2.01± 0.44 (26) −55
SRP (�g P/l)Pulse 27± 3 (3) 15± 6 (2) −44*
Non-pulse 46± 26 (3) 5± 1 (6) −89*
Total P (�g P/l)Pulse 54± 12 (3) 47± 2 (3) −13Non-pulse 103± 38 (3) 44± 9 (5) −57
Data for SRP and total P are for July–September and cover only onepulse in early August. Swale outflow is combined outflow from twoexperimental wetlands.
* Significant difference (α = 0.05) in swale concentrations duringpulsing and non-pulsing.
Overall, when marsh and edge plots were inundated,nitrous oxide fluxes were lower than when the sameplots were exposed to air (Fig. 14). In the upland plots,nitrous oxide fluxes were not different between floodedand dry periods.
3.8. Wetland productivity and diversity
Our 10 years of whole-ecosystem measurementsgive us the opportunity to investigate the connectionsbetween diversity and productivity. Previously, weshowed that there appeared to be a negative relationshipbetween the two (Mitsch et al., 2005a). Monospecificwetlands were highly productive and diverse wetlands
Fig. 13. Average (±S.E.) of methane flux for plots pooled for bothexperimental wetlands containing emergent vegetation, when inun-dated vs. when they were exposed, in 2004 growing season (April25–September 29, 2004). Methane flux from permanently-inundatedareas is shown for comparison.
had low productivity. Seven years of productivity datafor each of the two wetlands (14 wetland-years) pro-vides results that are not as obvious (Fig. 15). Datafrom the planted wetland W1, which has never beendominated by one species, appears to have a pattern ofhighest productivity at a mid-level of community diver-sity; inclusion of productivity and diversity data fromtheTypha-dominated wetland W2 does not fit the samepattern.
Fig. 14. Average (±S.E.) of N2O flux pooled for both experimentalwetlands during flooding and non-flooding periods from June 2003through December 2004. Marsh refers to areas normally flooded;edge refers to areas that are flooded seasonally with flood pulses;T-upl refers to uplands that are rarely flooded.

W.J. Mitsch et al. / Ecological Engineering 25 (2005) 510–527 525
Fig. 15. Net aboveground primary productivity, estimated fromaboveground biomass, as a function of community diversity index(CDI) for experimental wetlands, 1997–2003.
4. Conclusions
After 10 years of observing these experimental wet-lands, the following conclusions can be drawn regard-ing the influence of planting of ecosystem successionand on the general development of a wetland when itis created on formerly non-wetland soil:
• Contrary to conventional wisdom, wetlands can becreated if the correct hydrologic conditions are avail-able. Created wetlands with the proper hydrologycan develop appropriate biota (e.g., wetland plants)and physiochemistry (e.g., hydric soils) relativelyrapidly without the need for planting if the properhydrologic conditions are present and plant propag-ules are continually introduced as they were in ourriverine wetlands.
• Planting has a profound effect on ecosystem func-tion of created wetlands, even several years afterplanting. The naturally colonizing wetland and theplanted wetland diverged in macrophyte cover thataffected ecosystem function on several occasionsduring the 10 years of this study. Differences in plantcompostion and productivity, caused in all proba-bility by the introduction of plants to one of thewetlands, led to differences in water quality and car-bon accumulation in the wetlands.
• Hydric soils as valid indicators of natural wetlandscan develop within 2–3 years of wetland creation.We found that soil organic matter can increase by
shes.
• Water quality changes significantly as a wetlanddevelops in primary succession and as perturba-tions occur. Some changes in water quality are directand the immediate result of macrophyte cover andaquatic metabolism; other changes occur over longerperiods due to sediment accumulation, and soil andredox changes.
• Wetlands, if they are not overloaded with nutrients,can be effective nutrient sinks for many years. Oursystems were subjected to nutrient concentrationsand loadings that were significantly less than thoseusually added to treatment wetlands. Thus, our wet-lands continued to be nutrient sinks for 10 years andsupport a reasonable plant diversity as well.
• The addition of species to enhance biodiversity inwetland creation actually can lead to lower produc-tivity of macrophytes and subsequent changes in thefood web and water quality.
• There are desirable values from both “diverse”marshes and “high productivity” marshes and tomake generalizations that one is better than the otheris wrong.
• The continual introduction of plant, animal, andmicrobial species through water flows, atmospherictransport, and biological vectors give self-design asignificant opportunity to manifest itself.
• Flood pulses have significant influences on water andgaseous fluxes from wetlands. Continued study ofthe importance of periodic floods is needed on thecombined effects on water and gas fluxes in these
A
stu-d sistedi here.P ndN the1 aper0
R
A s forC.
1% every 3 years in temperate zone created marand other wetlands.
cknowledgements
We appreciate the many post-docs, graduateents, undergraduate students, and staff who as
n this research over the 11 year period describedarticular appreciation is given to Xinyuan Wu aaiming Wang for their extraordinary assistance in990s. Olentangy River Wetland Research Park p5-010.
eferences
merican Public Health Association, 1989. Standard Methodthe Analysis of Wastewater, 17th ed., APHA, Washington, D

526 W.J. Mitsch et al. / Ecological Engineering 25 (2005) 510–527
Carpenter, S.R., 1998. The need for large-scale experiments to assessand predict the response of ecosystems to perturbation. In: Pace,M.L., Groffman, P.M. (Eds.), Successes, Limitations and Fron-tiers of Ecosystem Science. Springer-Verlag, New York, pp.287–312.
Carpenter, S.R., Chisholm, S.W., Krebs, C.J., Schindler, D.W.,Wright, R.F., 1995. Ecosystem experiments. Science 269,324–327.
Carpenter, S.R., Kitchell, J.F., Cottingham, K.L., Schindler, D.E.,Christensen, D.L., Post, D.M., Voichick, N., 1996. Chlorophyllvariability, nutrient input and grazing: evidence from whole-lakeexperiments. Ecology 77, 725–735.
Carpenter, S.R., Cole, J.J., Kitchell, J.F., Pace, M.L., 1998a. Impactof dissolved organic carbon, phophorus and grazing on phyto-plankton biomass and production in experimental lakes. Limnol.Oceanogr. 43, 73–80.
Carpenter, S.R., Cole, J.J., Essington, T.E., Hodgson, J.R., Houser,J.N., Kitchell, J.F., Pace, M.L., 1998b. Evaluating alternativeexplanations in ecosystem experiments. Ecosystems 1, 335–344.
Carpenter, S.R., Turner, M.G., 2001. Hares and tortoises: interactionsof fast and slow variables in ecosystems. Ecosystems 3, 495–497.
Craft, C.B., Broome, S.W., Campbell, C.L., 2002. Fifteen years ofvegetation and soil development following brackish-water marshcreation. Restoration Ecol. 10, 248–258.
Craft, C.B., Megonigal, J.P., Broome, S.W., Cornell, J., Freese, R.,Stevenson, R.J., Zheng, L., Sacco, J., 2003. The pace of ecosys-tem development of constructed Spartina alterniflora marshes.Ecol. Appl. 13, 1417–1432.
Engelhardt, K.A.M., Ritchie, M.E., 2001. Effects of macrophytespecies richness on ecosystem functioning and services. Nature411, 687–689.
Harter, S.K., Mitsch, W.J., 2003. Patterns of short-term sedimenta-tion in a freshwater created marsh. J. Environ. Qual. 32, 325–334.
Holland, E., Robertson, G.D., Greenberg, J., Groffman, M.P., Boone,t-, Soilford
K es inion.
K cale-s forR.H.,ela-ew
K andands
L cre-ton,
L nson,nger-
Liptak, M., 2000. Water column productivity, calcite precipitation,and phosphorus dynamics in freshwater marshes. Ph.D. Dissera-tion, Environmental Science Graduate Program, The Ohio StateUniversity, Columbus, OH, USA.
Livingston, G.P., Hutchinson, G.L., 1995. Enclosure-based measure-ments of trace gas exchange: applications and sources of error. In:Matson, P.A., Harris, R.C. (Eds.), Biogenic Trace Gases: Measur-ing Emissions from Soil and Water. Blackwell Science, Oxford,pp. 14–51.
Metzker, K., Mitsch, W.J., 1997. Modelling self-design of the aquaticcommunity in a newly created freshwater wetland. Ecol. Model.100, 61–86.
Mitsch, W.J., Cronk, J.K., Wu, X., Nairn, R.W., Hey, D.L., 1995.Phosphorus retention in constructed freshwater riparian marshes.Ecol. Appl. 5, 830–845.
Mitsch, W.J., Wu, X., Nairn, R.W., Weihe, P.E., Wang, N., Deal, R.,Boucher, C.E., 1998. Creating and restoring wetlands: a whole-ecosystem experiment in self-design. BioScience 48, 1019–1030.
Mitsch, W.J., Day Jr., J.W., 2004. Thinking big with whole ecosystemstudies and ecosystem restoration–A legacy of H.T Odum. Ecol.Model. 178, 133–155.
Mitsch, W.J., Wang, N., Zhang, L., Deal, R., Wu, X., Zuwerink, A.,2005a. Using ecological indicators in a whole-ecosystem wetlandexperiment. In: Jørgensen, S.E., Xu, F.-L., Costanza, R. (Eds.),Handbook of Ecological Indicators for Assessment of EcosystemHealth. CRC Press, Boca Raton, FL, pp. 211–235.
Mitsch, W.J., Day Jr., J.W., Zhang, L., Lane, R., 2005b. Nitrate–nitrogen retention in wetlands in the Mississippi River basin.Ecol. Eng. 24 (4), 267–278.
Nairn, R.W., W.J. Mitsch, 1996. Physiochemical changes and genesisof soils in newly constructed wetlands. Olentangy River WetlandResearch Park at The Ohio State University, Annual Report 1995.In: Mitsch, W.J. (Ed.), School of Natural Resources. The OhioState University, Columbus, pp. 103–113.
N wet-.
N ossesandress,
O -level
O EC
O cy-F.M.ress,
P stemts of
S ace,ange.
S kes.
R.D., Gosz, J., 1999. CO2 N2O and CH4 exchange. In: Roberson, G.P., Colleman, D.C., Bledsoe, C.S., Sollins, P. (Eds.)Standard Methods for Long-term Ecological Research. OxUniversity Press, New York, pp. 187–199.
ang, H., Freeman, Lee, D., Mitsch, W.J., 1998. Enzyme activiticonstructed wetlands: Implication for water quality amelioratHydrobiologia 368, 231–235.
emp, W.M., Petersen, J.E., Gardner, R.H., 2001. Sdependence and the problem of extrapolation: Implicationexperimental and natural coastal ecosystems. In: Gardner,Kemp, W.M., Kennedy, V.S., Petersen, J. (Eds.), Scaling Rtions in Experimental Ecology. Columbia University Press, NYork, pp. 3–57.
oreny, J.S., Mitsch, W.J., Bair, E.S., Wu, X., 1999. Regionallocal hydrology of a created riparian wetland system. Wetl19, 182–193.
eck, M.A., 2003. Seed-bank and vegetation development in aated tidal freshwater wetland on the Delaware River, TrenNew Jersey, USA. Wetlands 23, 310–343.
ikens, G.E., Bormann, F.H., Pierce, R.S., Eaton, J.S., JohN.M., 1977. Biogeochemistry of a Forested Ecosystem. SpriVerlag, New York.
airn, R.W., Mitsch, W.J., 2000. Phosphorus removal in createdland ponds receiving river overflow. Ecol. Eng. 14, 107–126
ational Research Council, 2001. Compensating for wetland lunder the Clean Water Act. Committee on Mitigating WetlLosses, National Research Council, National Academy PWashington, DC.
dum, E.P., 1990. Field experimental tests of ecosystemhypotheses. Trends Ecol. Evol. 5, 204–205.
dum, H.T., Pigeon, R. (Eds.), 1970. A Tropical Rain Forest. ADivision of Technical Information. Oak Ridge, TN.
dum, H.T., Ewel, K.C., Mitsch, W.J., Ordway, J.W., 1977. Recling treated sewage through cypress wetlands. In: D’Itri,(Ed.), Wastewater Renovation and Reuse. Marcel Dekker PNew York, pp. 35–67.
omeroy, L.R., Hargrove, E.C., Alberts, J.J., 1988. The ecosyperspective. In: Pomeroy, L.R., Alberts, J.J. (Eds.), ConcepEcosystem Ecology. Springer-Verlag, New York, pp. 1–17.
chindler, D.E., Carpenter, S.R., Cole, J.J., Kitchell, J.F., PM.L., 1997. Influence of food web structure on carbon exchbetween lakes and the atmosphere. Science 227, 248–251
chindler, D.W., 1977. Evolution of phosphorus limitation in laScience 195, 260–262.

W.J. Mitsch et al. / Ecological Engineering 25 (2005) 510–527 527
Selbo, S.M., Snow, A.A., 2004. The potential for hybridizationbetweenTypha angustifolia andT. latafolia in a constructed wet-land. Aquat. Bot. 78, 361–369.
Smith, C.J., Delanue, R.D., Patrick Jr., W.H., 1983. Nitrous oxideemissions from Gulf Coast wetlands. Geochim. Cosmochim.Acta 47, 1805–1814.
Spieles, D.J., Mitsch, W.J., 2000a. The effects of season and hydro-logic and chemical loading on nitrate retention in constructedwetlands: A comparison of low and high nutrient riverine sys-tems. Ecol. Eng. 14, 77–91.
Spieles, D.J., Mitsch, W.J., 2000b. Macroinvertebrate communitystructure in high-and low-nutrient constructed wetlands. Wet-lands 20, 716–729.
U.S. Environmental Protection Agency, 1983. Handbook for meth-ods in water and wastewater analysis. U.S. Environmental Pro-tection Agency, Cincinnati, Ohio.
Vepraskas, M.J., Richardson, J.L., Tandarich, J.P., Teets, S.J., 1999.Dynamics of hydric soil formation across the edge of a createddeep marsh. Wetlands 19, 78–89.
Wu, X., Mitsch, W.J., 1998. Spatial and temporal patterns ofalgae in newly constructed freshwater wetlands. Wetlands 18,9–20.
Zhang, L., Mitsch, W.J., 2005. Modelling of hydrological budgets offlow-through created wetlands: An integrated system approach.Environ. Software Model. 20, 935–946.