cpg island methylator phenotype associates with low-degree chromosomal abnormalities in colorectal...
TRANSCRIPT
CpG island methylator phenotype associates with low-degreechromosomal abnormalities in colorectal cancer
Yu-Wei Cheng1, Hanna Pincas1, Manny Bacolod1, Gunter Schemmann2, Sarah F.Giardina1, Jianmin Huang1, Sandra Barral3, Kamran Idrees4, Sajid A. Khan4, ZhaoshiZeng4, Shoshana Rosenberg4, Daniel A. Notterman2, Jurg Ott5, Philip Paty4, and FrancisBarany1
1Department of Microbiology and Immunology, Weill Medical College of Cornell University, 1300York Avenue, New York, NY 100212Department of Molecular Biology, Princeton University, Princeton, NJ 085443Gertrude H. Sergievsky Center, Columbia University, New York, NY 100324Department of Surgery, Colorectal Surgery Service, Memorial Sloan-Kettering Cancer Center,1275 York Avenue, New York, NY 100215Laboratory of Statistical Genetics, Rockefeller University, New York, NY 10065; and BeijingInstitute of Genomics, Chinese Academy of Sciences, Beijing 100022, China
AbstractPurpose—Aberrant promoter methylation and genomic instability occur frequently duringcolorectal cancer (CRC) development. CpG island methylator phenotype (CIMP) has been shownto associate with microsatellite instability, BRAF mutation and often found in the right-side colon.Nevertheless, the relative importance of CIMP and chromosomal instability (CIN) fortumorigenesis has yet to be thoroughly investigated in sporadic CRCs.
Experimental Design—We determined CIMP in 161 primary CRCs and 66 matched normalmucosae using a quantitative bisulfite/PCR/LDR/Universal Array assay. The validity of CIMPwas confirmed in a subset of 60 primary tumors using MethyLight assay and five independentmarkers. In parallel, chromosomal instability was analyzed in the same study cohort usingAffymetrix 50K Human Mapping arrays.
Results—The identified CIMP-positive cancers correlate with microsatellite instability(p=0.075) and the BRAF mutation V600E (p=0.00005). The array-based high-resolution analysisof chromosomal aberrations indicated that the degree of aneuploidy is spread over a widespectrum among analyzed CRCs. Whether CIN was defined by copy number variations in selectedmicrosatellite loci (criterion 1) or considered as a continuous variable (criterion 2), CIMP-positivesamples showed a strong correlation with low-degree chromosomal aberrations (p=0.075 and0.012, respectively). Similar correlations were observed when CIMP was determined usingMethyLight assay (p=0.001 and 0.013, respectively).
Conclusion—CIMP-positive tumors generally possess lower chromosomal aberrations, whichmay only be revealed using a genome-wide approach. The significant difference in the degree ofchromosomal aberrations between CIMP-positive and the remainder samples suggests thatepigenetic (CIMP) and genetic (CIN) abnormalities may arise from independent molecularmechanisms of tumor progression.
Requests for reprints: Francis Barany, Department of Microbiology and Immunology, Weill Medical College of Cornell University,1300 York Avenue, New York, NY 10021; Phone: (212) 746-6509; Fax: (212) 746-8104; [email protected].
NIH Public AccessAuthor ManuscriptClin Cancer Res. Author manuscript; available in PMC 2012 January 30.
Published in final edited form as:Clin Cancer Res. 2008 October 1; 14(19): 6005–6013. doi:10.1158/1078-0432.CCR-08-0216.
NIH
-PA Author Manuscript
NIH
-PA Author Manuscript
NIH
-PA Author Manuscript
KeywordsCpG island methylator phenotype (CIMP); chromosomal instability (CIN); loss of heterozygosity(LOH); methylation and microarray
IntroductionAberrant DNA methylation and genomic instability are hallmarks of colorectal cancer(CRC) development. Two types of altered methylation patterns, gene-specific promoterhypermethylation and genome-wide hypomethylation, have been demonstrated to interferewith gene expression in CRC. While aberrant promoter hypermethylation at the 5’regulatory regions or CpG islands impairs gene function by transcription silencing, whichhas been demonstrated in numerous well known tumor suppressor genes (1-3), globaldemethylation tends to occur at parasitic sequences or transposons resulting in thereactivation of this otherwise silenced genetic information (4-6). Changes in genomeintegrity during carcinogenesis are typically attributed to either chromosomal instability(CIN) or microsatellite instability (MSI). The characteristic feature of CIN tumors isaneuploidy, which presents as the change of an entire or a significant portion of achromosomal arm, including, but not limited to, deletion, amplification and loss ofheterozygosity (LOH) (7, 8). Alternatively, MSI tumors are known to have different numberof short microsatellite DNA repeats but retain a diploid genome. The relative importance ofaberrant DNA methylation and genomic instability for tumorigenesis has been described inseveral areas. Evidence for biallelic inactivation of tumor suppressor genes resulting frommethylation silencing and LOH has been established in human cancers (9-11). Genome-wide demethylation has been shown to correlate with CIN phenotype in primary CRCs (12).CpG island methylator phenotype (CIMP), a subtype of CRCs originally discovered using aset of hypermethylated genomic loci that were significantly presented in the tumors (alsoreferred to as type “C” or “cancer-specific” markers) (13), has been suggested to precede the“mutator phenotype” in MSI tumor progression. Most interestingly, a recent study proposedthat sporadic CRCs with no CIN and CIN—/MSI— phenotypes were associated with CIMP(14), suggesting that CIN and CIMP represent two independent mechanisms of genetic andepigenetic instability.
Although earlier reports suggested that the designation of a CIMP subgroup is merely anevent with normal distribution of methylation rate and may be age- or MSI-dependent, theobservation of such a phenotype has since been documented using various methylationmarkers (15-18). Recently, Weisenberger et al. conducted an elegant, systematic screeningof 195 CpG island methylation markers using a quantitative MethyLight assay, and a newpanel of robust markers was proposed to stratify CIMP tumors (19). All these carefullydesigned studies have demonstrated that CIMP correlates with DNA mutations andclinicopathologic features, including MSI, mutations in KRAS, BRAF and presentation onthe proximal side of colon (18-23). Traditionally, the study of chromosomal imbalance hasrelied on methods such as flow cytometry–based ploidy assay, fluorescence in situhybridization (FISH) and LOH analysis, yet only selected genomic regions were typicallystudied in each case. Consequently, these assays may not examine sufficient loci todistinguish the near-diploid genome from those with low-degree aberrations. The recentadvances in DNA microarray technology have made the analysis of global aneuploidypossible using comparative genomic hybridization (CGH) and single-nucleotidepolymorphism (SNP) arrays (24, 25). In particular, the latter offers a higher resolutionmapping at the genome-wide scale and provides a mean to study CIN based on the degree ofchromosomal aberrations.
Cheng et al. Page 2
Clin Cancer Res. Author manuscript; available in PMC 2012 January 30.
NIH
-PA Author Manuscript
NIH
-PA Author Manuscript
NIH
-PA Author Manuscript
The current study aimed to thoroughly investigate the relative importance of CIMP and CINin CRC. The DNA methylation status of each tumor sample was determined using aquantitative bisulfite/PCR/LDR/Universal Array assay in a panel of 10 tumor suppressorgenes (26). Tumor specific promoter hypermethylation emerged in the p16INK4a, p14ARF,TIMP3, MGMT and RARβ genes. These five markers, also referred to as classic CIMPgenes, were used for CIMP study, where a total of 161 primary colorectal tumors wereanalyzed. Our results have shown that the presence of CIMP in primary colorectal tumorsand correlated with MSI and the BRAF mutation V600E. Chromosomal aberrations wereanalyzed in 60 primary tumors from the same study cohort using Affymetrix 50K HumanMapping arrays. Aneuploidy was found in over 80% of cases when either LOH, gains orlosses of chromosomes were considered. Our data reveal a variable extent of CIN amongCRC samples, and tumors with a high level of hypermethylated loci associate with low-degree chromosomal aberrations. Similar results were obtained when CIMP was evaluatedusing MethyLight assay and markers of CACNA1G, IGF2, NEUROG1, RUNX3 and SOCS1.We have demonstrated that the degree of chromosomal aberrations in tumors bearing a highlevel of hypermethylated loci (“CIMP-positive”) differs significantly from other tumorswithin the same study cohort. This work emphasizes the importance of using quantitativeand genome-wide approaches to study CIMP and CIN phenotypes in CRC.
Materials and MethodsStudy population
The study population consisted of 161 male and female patients who presented at MemorialSloan-Kettering Cancer Center (MSKCC) with a colonic neoplasm between 1992 and 2004.Following review of clinical and pathological data stored in institutional databases, cases ofsporadic CRCs were selected for further study. This sample cohort was representative ofcolonic neoplasms at different stages of development. Primary colon tumors were located inthe proximal, the distal colon, or the rectum. Stage of disease (AJCC criteria) also variedand included patients who presented to MSKCC with primary colon adenocarcinomas and/or adenomas, patients with primary adenocarcinomas and synchronous metastases to theliver and/or lung, and patients with recurrent disease (local and distant). The study cohortincluded White Non-Hispanic, White Hispanic, Black Non-Hispanic, Asian, and AmericanIndian patients. Age ranged from 17 to 86 years old with a median age of 66. Biologicalspecimens used in this study included primary colon adenocarcinomas, adenomas andcorresponding normal mucosa. All 161 analyzed CRC specimens were thoroughly examinedby MSKCC pathologists and micro-dissected. A subset of 60 tumors with greater than 80%of carcinoma cells was chosen for Affymetrix SNP array experiments. Tissues wereprocured at the time of surgical resection and stored for future use under institutional IRBapproved protocols.
KRAS and BRAF mutation detectionBriefly, KRAS and BRAF mutations were detected using PCR/LDR approaches (27). ThePCR primers used for K-RAS were: the forward primer 5’- TTT CAT TAT TTT TAT TATAAG GCC TGC TGA-3’ and the reverse primer 5’- GAA TGG TCC TGC ACC AGT AATATG C-3’. The PCR primers used for BRAF were: the exon 15 forward primer 5’- TTCTAA TGC TTG CTC TGA TAG GA -3’ and the reverse primer 5’- GGC CAA AAA TTTAAT CAG TGG A -3’. Fluorescently labeled LDR primers were designed for the 7 commonKRAS (Val, Asp, Ala, Arg, Ser, and Cys at codon 12 and Asp at codon 13) and BRAFV600E mutations. The sequences of KRAS LDR primers were reported previously (27). TheLDR primer sequences for detecting BRAF mutation were as follows: wild-type specificprimer: 5’- TTT AGT AAA AAT AGG TGA TTT TGG TCT AGC TAC AGT – 3’, mutantspecific primer: 5’-AAA AAT AGG TGA TTT TGG TCT AGC TAC AGA – 3’, and
Cheng et al. Page 3
Clin Cancer Res. Author manuscript; available in PMC 2012 January 30.
NIH
-PA Author Manuscript
NIH
-PA Author Manuscript
NIH
-PA Author Manuscript
common primer: Phos-5’-GAA ATC TCG ATG GAG TGG GTC C – 3’-FAM. Onemultiplex reaction was performed to assess mutation status. The PCR condition was asfollows: 94 °C for 1.5 min, 35 cycles of 94 °C for 30 sec, 62 °C for 2 min and 72 °C for 1min, followed by a final extension step at 72 °C for 3 min. Inactivation of the polymerasewas achieved by a thermocycled proteinase K reaction. The LDR reaction was performed ina final volume of 20 μl consisting of 20 mM Tris-HCl pH 7.6, 10 mM MgCl2, 100 mM KCl,10 mM DTT, 1 mM NAD, 500 - 800 fmol each of the LDR primers, 40U of Taq DNALigase, and 2 μl of PCR amplicon. The reaction mixture was thermocycled with thefollowing program: 94° C for 1.5 min followed by 10 cycles of 94° C for 1 min and 65° Cfor 4 min. The final LDR products were resolved on a 377 DNA Prism Sequencer or a 3100Genetic Analyzer (Applied Biosystems, Foster City, CA). The PCR/LDR method fordetecting KRAS and BRAF mutations does have an estimated sensitivity of 1 in 500 wild-type sequences as shown in Khanna et al. (27). However, for these samples, a positive LDRsignal represented mutation ranging from 25% to 100% of total peak intensity, verified bydideoxy sequencing and EndoV mutation scanning in selected samples. We determinedKRAS and BRAF mutation statuses with either GeneScan software V3.1 or Genotyper V 3.7,respectively.
Microsatellite instability analysisThe microsatellite instability analysis has been described previously (28). Briefly,oligonucleotide primers for BAT25, BAT26, D2S123, D5S346, and D17S250 weredesigned and fluorescently labeled. The microsatellite assays were performed in a multiplexfashion and the PCR products were resolved on an ABI 3100 DNA Sequencer (AppliedBiosystems, Foster City, CA). Every colorectal cancer specimen and its correspondingnormal tissue were analyzed. Allele Size Instability (ASI) of microsatellite markers incancer specimens was detected and distinguished from PCR stutter using Genotyper 3.7software (Applied Biosystems, Foster City, CA). ASI was defined as the identification in atumor of a novel-size allele; that is, an allele with a length not seen in normal colonicmucosa from the same individual. MSI status was determined in 161 CRCs and in all 161matched normal tissues. MSI was scored as present when at least two of the five markersshowed size instability. MSS was always scored when all markers were allele size stable.
Determination of promoter methylation status using bisulfite/PCR/LDR/Universal ArrayThe methylation levels of cytosines at CpG dinucleotides were determined using aquantitative bisulfite/PCR/LDR/Universal Array approach. The reaction conditions andprimer sequences were described previously (26). The raw methylation levels of theinterrogated cytosines were calculated as the fluorescence ratios of Cy3/(Cy3+Cy5). Bymeasuring the fluorescence intensity of an equal molar amount of Cy3 and Cy5 labeled LDRprimers, a fluorescence intensity ratio (W=ICy3/ICy5) was used to normalize the label bias.To determine the percentage of methylation, calibration curves of interrogated cytosineswere established by mixing genomic DNAs of tumor cell lines (or in vitro methylatedDNAs) and normal human lymphocytes in appropriate ratios. The methylation status ofselected CpG sites present in the promoters of 10 tumor suppressor genes was initiallydetermined in normal human lymphocytes using bisulfite sequencing. The majority ofanalyzed CpG cytosines did not show detectable hypermethylation, except for few sites atthe p16INK4a and RARβ promoters. These few cytosines were either eliminated from thesubsequent LDR assay or replaced with other neighboring non-methylated cytosines. TheCpG cytosines with no detectable hypermethylation were considered as “zero” methylationfor all the calibration curves. A promoter methylation status was determined by averagingthe methylation levels of all six interrogated CpG sites (at the exception of RARβ with onlyfour sites). In general, hypermethylation was scored when the averaged methylation of apromoter region was 10% or higher. Using this cut-off, we have confirmed that MGMT
Cheng et al. Page 4
Clin Cancer Res. Author manuscript; available in PMC 2012 January 30.
NIH
-PA Author Manuscript
NIH
-PA Author Manuscript
NIH
-PA Author Manuscript
promoter hypermethylation correlated with a marked decrease of RNA expression (data notshown).
Determination of promoter methylation status using MethyLightReal-time PCR to measure DNA methylation (MethyLight) was performed as previouslyreported (19). Briefly, five CIMP-specific markers, including CACNA1G, IGF2, NEUROG1,RUNX3 and SOCS1 were analyzed in each tumor sample using ABI 7500 (AppliedBiosystems, Foster City, CA). ALU (Alu repeats) was used to normalize the amount of inputbisulfite treated genomic DNA. All the primer and probe sequences were publishedpreviously (19). The percentage of methylated reference (PMR, i.e., degree of methylation)at each locus was calculated by dividing the ratio of GENE:ALU in a sample by the ratio ofGENE:ALU in SssI-treated human genomic DNA (presumably fully methylated) andmultiplying this value by 100. Positive methylation in each locus was defined as PMR > 10as previously suggested (19). Tumor samples were scored as CIMP-positive when three ormore (>= 3/5) markers were hypermethylated.
Copy Number and LOH analysisThe Affymetrix GeneChip Human Mapping 50K Xba 240 arrays (“SNP array”) were usedto study overall chromosomal abnormalities. A total of 58,960 SNPs were detected on eacharray and the detailed protocol is described in the manufacturer’s manual and summarized inTsafrir et al. (29). Briefly, genomic DNA was digested with XbaI and ligated onto adapters.PCR conditions were optimized to amplify fragments in the range of 250 to 2,000 base pairsin a GeneAmp PCR system 9700 (Applied Biosystems, Foster City, CA). PCR productswere purified using a Qiagen MiniElute 96 UF PCR purification kit (Qiagen, Valencia, CA)and visualized on a 4% TBE agarose gel to confirm that the average size was smaller than180 bp. The fragmented DNA was then biotin-labeled and hybridized to the array asdescribed in the Affymetrix protocol. Following a staining and washing step, the array wasscanned using GeneChip Scanner 3000 to generate image (DAT) and cell intensity (CEL)files. CEL files were imported into GeneChip DNA Analysis Software 4.0 (GDAS 4.0,Affymetrix) to generate the SNP calls. The Chromosomal Copy Number Analysis Tool 3.0software (CNAT, Affymetrix) uses the probe intensity data, as well as the SNP calls togenerate both the Single Point analysis (SPA) and Genomic Smoothed Analysis (GSA) copynumber estimates and the corresponding p values. The degree of chromosomal aberrations ina given sample was determined by counting the number of abnormal chromosomal armswith deletion, amplification or LOH. The concepts and algorithms of CNAT werepreviously described (30). In addition, CNAT generates LOH calls based on the SNP calls.A default value of 0.5 Mb was used as the window size for averaging GSA values.
Statistical analysisAll correlations were performed by computing likelihood ratio chi-square statistics andassociated p-values from the n x m contingency tables. When computing the chi-squarestatistics, the neighboring columns were merged into a single cell count if the expectednumber of observations was smaller than one. The odds ratio (OR) and 95% CI werecomputed from 2 × 2 contingency tables extracted from the n × m tables (SYSTATsoftware). Multiple testing correction was performed using the Benjamini-Hochberg methodto find those tests with a false discovery rate (FDR) of at most 5%.
Cheng et al. Page 5
Clin Cancer Res. Author manuscript; available in PMC 2012 January 30.
NIH
-PA Author Manuscript
NIH
-PA Author Manuscript
NIH
-PA Author Manuscript
ResultsQuantitative Bisulfite/PCR/LDR/Universal Array to determine CIMP
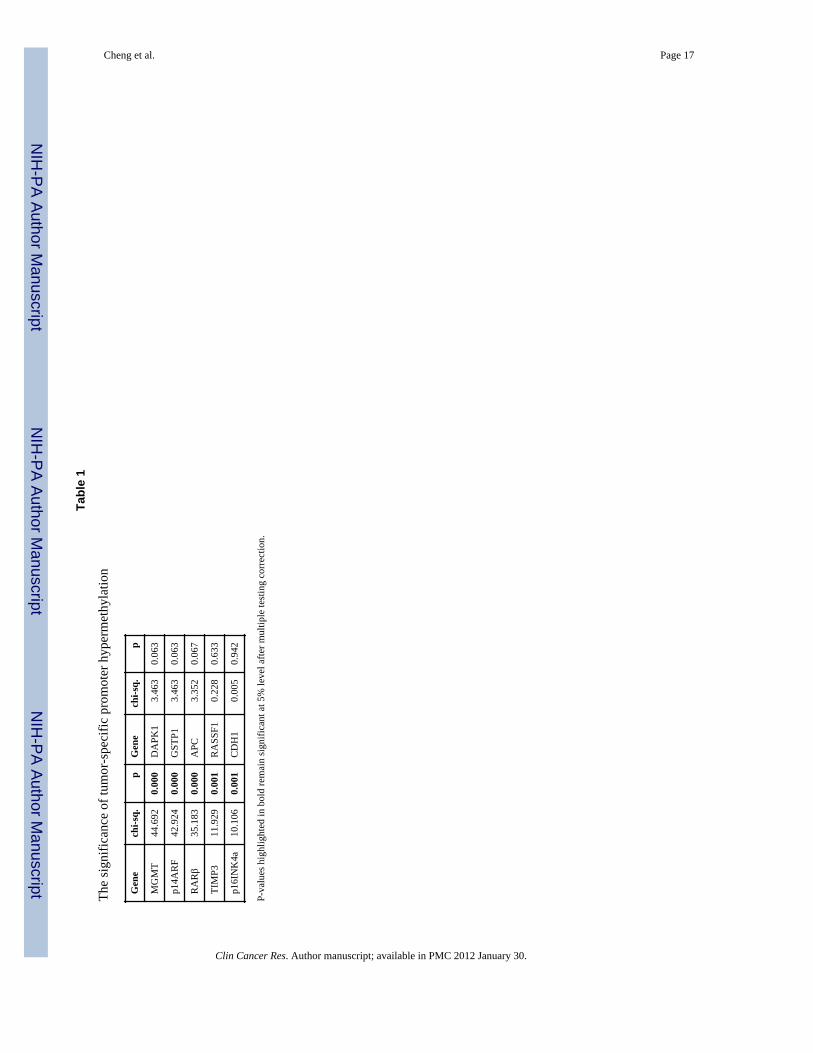
To select differentially hypermethylated candidate promoters in which their presence intumors are statistically significant, a total of 86 primary colorectal tumors and 66 matchednormal tissues were initially analyzed (Fig. 1). We used a recently developed quantitativebisulfite/PCR/LDR/Universal Array assay, that simultaneously detects 58 CpG locimethylation status in a panel of 10 tumor suppressor genes p16INK4a, p14ARF, TIMP3,APC, RASSF1, CDH1, MGMT, DAPK1, GSTP1 and RARβ. PCR primers were designed totarget sequences that are essentially free of CpG dinucleotides, allowing equal amplificationof both methylated and unmethylated DNAs in multiple genomic regions. The methylationlevel of each interrogated cytosine was determined using LDR and displayed on a UniversalArray (26). Six CpG dinucleotide sites per promoter region (except for RARβ, where foursites were used) were analyzed. Promoter methylation status was scored by averaging themethylation levels of all interrogated CpG’s of that gene. This criterion effectivelyeliminated background signals and low level methylation that may not be relevant to thecontrol of gene expression. An example is shown in the RARβ gene, where the fourth CpGsite was frequently methylated from low to medium levels in the matched normal tissues(Fig. 1). By averaging the methylation levels of all four sites in RARβ, the impact of thesporadic methylation site was reduced and the scoring of false positive hypermethylationwas minimized. Five promoter regions (p16INK4a, p14ARF, MGMT, RARβ and TIMP3)showed statistically significant increases of methylation in tumors compared to normaltissues (p < 0.001, Table 1). Using these five markers in a later validation study, themethylation status of 161 colorectal cancer samples were profiled and the number of tumor-specific, hypermethylated promoters in each sample was considered in a continuous fashion(Fig. 2 and Supplementary Materials, Fig S1). The lack of clear bimodal distribution of thehypermethylated loci in CRCs disfavored a simple dichotomization of the analyzed samples,instead, CIMP was regarded as a unimodal distribution in all subsequent studies.
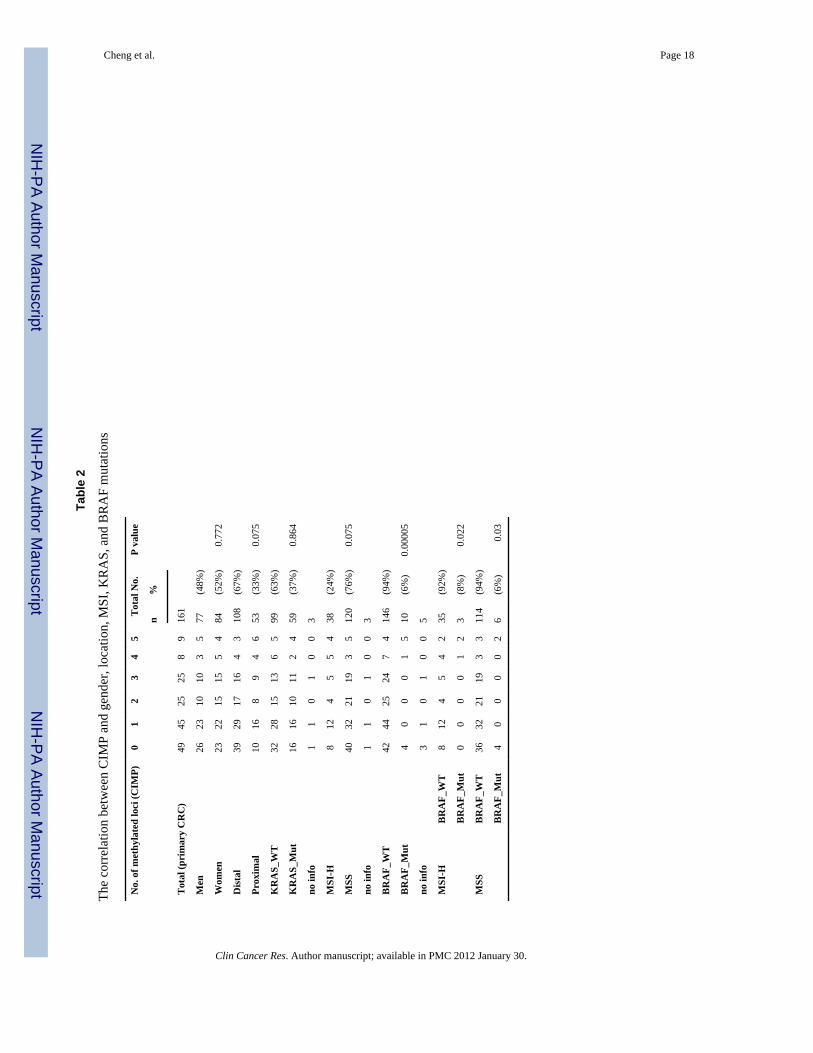
CIMP correlates with MSI and BRAF mutationA characteristic feature of the previously reported CIMP subgroup of CRCs is its substantialenrichment in MSI cases and BRAF mutations. To evaluate whether CIMP-positive samplesidentified in our approach had similar genetic alterations, we established the MSI, BRAF andKRAS mutation profiles in 161 CRC samples (Fig. 2). Our data show that CIMP correlateswith MSI, suggesting that MSI tumors tend to have a higher proportion of methylated locithan their MSS counterparts (p = 0.075) (Table 2). A significant difference was alsoobserved between BRAF V600E mutations and the number of methylated genes (Table 2).Individuals with BRAF mutations had approximately 18-fold risk of being CIMP-positivethan individuals without BRAF mutations (p=0.0001, OR = 18.45, 95%CI = (4.51, 75.11)).The presence of higher percentage of BRAF mutants in the CIMP subgroup indicates thatBRAF mutations significantly correlate with the hypermethylation phenotype (p = 0.00005).
Since BRAF mutations are known to occur frequently in MSI tumors (31), we furtherinvestigated whether the highly significant correlation between BRAF mutation and CIMPmay be MSI dependent. Tumor samples were split into MSI and MSS subgroups accordingto their BRAF mutation status (Table 2). In the MSI category, BRAF mutations were onlyidentified in samples with a high level of methylated loci, but not present in others(p=0.022). In contrast, in the MSS subgroup, samples with no methylated loci harbored aBRAF mutation, which accounted for nearly two thirds of all BRAF mutants in MSS (p =0.03). These findings indicate a higher frequency of BRAF mutations in the CIMP-positivesubgroup independent of the tumor MSI status. Thus, our results strongly suggest that the
Cheng et al. Page 6
Clin Cancer Res. Author manuscript; available in PMC 2012 January 30.
NIH
-PA Author Manuscript
NIH
-PA Author Manuscript
NIH
-PA Author Manuscript
highly significant correlation between BRAF mutation and CIMP does not simply reflect acommon feature of MSI.
CIMP associates with low-degree chromosomal aberrationsThe chromosomal aberration profiles of 60 primary colorectal tumors from the same studycohort were established (Note: A more comprehensive study of chromosomal aberrations inCRCs using the SNP array data will be published separately; Bacolod et al., in preparation).Data obtained from the matched normal tissues, in conjunction with Affymetrix referencecontrols, were used as scoring criteria to minimize the impact of individual germline copynumber variations and random noise of allele intensity at each SNP site (data not shown). Tovalidate SNP array results, the overall DNA fold-change in tumor samples were assessed byCGH arrays (29). A strong genome-wide correlation between SNP-derived and CGH-derived data was observed in all five tested carcinomas (an example is shown inSupplementary Material, Fig S2). In addition, copy number gains and losses at individualloci were determined using conventional assays. Frequent DNA amplification ofchromosomal region 20q13.2 was confirmed in all six tested adenocarcinomas by FISH,with up to 10-20 fold copy number increases (29). The common chromosomal deletion at5q21-22 was corroborated using the analysis of microsatellite markers (SupplementaryMaterial, Fig S3): allelic imbalance was detected by comparing tumors with the matchedadjacent normal tissues. Consistent with the SNP data, samples with no change in copynumber were correctly identified as such using the microsatellite marker based approach.
As shown in Fig. 3, samples No. 1-8 showed relatively stable genomes with no apparentaneuploidy, whereas more than 80% of the analyzed CRCs displayed characteristic CINfeatures of copy number alterations and allelic imbalances. DNA copy number gainsoccurred most frequently in chromosomes 7p, 7q, 8q, 13q, and 20q, while copy numberlosses were most often detected in chromosomes 1p, 4p, 4q, 8p, 14q, 15q, 17p, 18p, and 18q.We noticed that the majority samples with MSI were not diploid and possessed low-degreechromosomal aberrations. Although this observation seems to contradict the conventionalviewpoint of MSI (typically considered as diploid), it is consistent with the results of arecent study, which compared the extent of CIN in 23 MSI and 23 microsatellite stable(MSS) sporadic CRCs using array CGH (32). This study demonstrated that chromosomalaberrations are present in both MSI and MSS sporadic CRCs, but the degree of CIN differssignificantly between the two groups.
Interestingly, genomic instability varied among CIMP-positive samples, with the most stablegenome seen in sample No. 2 and the least stable one in No. 57. Samples No. 10, 11, 12, and14 were clearly not exempt from chromosomal aberrations; however, their abnormalitieswere less substantial than those in No. 40 and 57. For instance, significant chromosomallosses and LOH events at chromosome 21 were identified in samples No. 10, 11, and 12,while gains at chromosomes 8 and 9 were found in samples No. 12, 13, and 14. To study therelationship between CIMP and CIN, we classified the CIN phenotype using two criteria.When defining CIN as aberrations in chromosomes 2p, 3p, 5q, 17p, and 18q (criterion 1) aspreviously proposed (14), samples No. 17-60 were scored as CIN-positive and inverselycorrelated with CIMP (p = 0.075). Alternatively, when considering CIN as the presence ofsignificant gains, losses or LOH in any one or more chromosomal regions (criterion 2), thedegree of chromosomal aberrations varied in a wide spectrum across all tumors. This is ofparticular interest since samples scored as “CIN-negative” (e.g. No. 9-16) by criterion 1were revealed as having low-degree aberrations. Consequently, under the latter criterion thatconsiders CIN as a continuous variable, only samples No. 1-8 were qualified as true “CIN-negative”, and tumors bearing high levels of hypermethylated loci (i.e. “CIMP-positive”)exhibited a significant correlation with low-degree CIN (p = 0.012).
Cheng et al. Page 7
Clin Cancer Res. Author manuscript; available in PMC 2012 January 30.
NIH
-PA Author Manuscript
NIH
-PA Author Manuscript
NIH
-PA Author Manuscript
To ensure that the relationship between CIN and CIMP was independent of the method ofscoring CIMP, we used the five robust methylation markers and MethyLight assay toidentify CIMP-positive as proposed by Weisenberger et al. All experiments were conductedand the 60 tumors were analyzed based on the published protocol (Supplementary Material,Fig S4). As shown in Fig. 3, samples identified as CIMP-positive showed a significantcorrelation with MSI (p=0.0008, two-tailed Fisher’s Exact test). Furthermore, undercriterion 1, we found an inverse relationship between CIMP and CIN (p=0.001, two-tailedFisher’s Exact test). When CIN was viewed as a gradient distribution of high- to low-degreeaberrations (criterion 2), a significant correlation was also found between CIMP and low-degree aberrations (p = 0.013). As shown in Fig. 4A, the relationships between MSI, CIMP,and CIN are depicted in a Venn diagram, which illustrates that CIMP-positive samplesgenerally comprise MSI and low-CIN tumors. We conclude that both quantitativemethylation assays consistently identify CIMP-positive groups. The significance of thecorrelation between CIN and CIMP is independent of the method used for quantitativemethylation detection.
In the course of studying genome instability in CRC samples, we tested whether a differentconclusion on the inverse relationship between CIMP and CIN could be made using selectedLOH at loci of the 15 tumor suppressor genes mentioned above. LOH was examined at eachgene locus using the Affymetrix 50K Human Mapping array (Fig. 4B). In general, LOHevents were found at any of the analyzed tumor suppressor loci in nearly 80% of the tumorsanalyzed; however, tumors with a high level of methylated loci tended to have fewer LOHevents. Interestingly, the majority of CIMP-positive samples (8 out of 12) had low-degree orno LOH. This result is consistent with the above observation that CRCs with high-levelmethylation have a different type of genetic abnormality.
DiscussionWe have employed a recently developed, accurate and quantitative bisulfite/PCR/LDR-/Universal Array approach to test the CIMP in CRCs. Our data are consistent with previousstudies that have indicated the CIMP-positive tumors correlate with MSI, BRAF mutation,and are more likely to occur in tumors of the proximal colon. We have also demonstratedthat the correlation between CIMP-positive and BRAF V600E mutation is independent ofMSI status. A subset of CRCs was assayed using MethyLight and markers of CACNA1G,IGF2, NEUROG1, RUNX3 and SOCS1 which showed the same correlation withclinicopathologic features. All these findings suggest that CIMP-positive tumors are adistinct subgroup of CRCs. We also reported that a subset of CRCs determined usingMethyLight and the five designated markers rendered a bimodal CIMP pattern(Supplementary Material, Fig S4), which is contrary to the continuous phenotype measuredusing p16INK4a, p14ARF, TIMP3, MGMT and RARβ genes. Addressing the extent ofmethylation distribution is important not only to understand the underlying biology, but alsofor CIMP classification and data analysis. Some previous studies have implied that thenumber of MSI tumors and the methylation markers used in a study influenced CIMPdistribution (18-19). Since a consistent number of MSI tumors were present in both 161CRC cohort and the subset of 60 tumors (20-24%), the diverse distribution patterns mostlikely resulte from the choice of methylation markers in the analysis. Our study did notattempt to re-discover CIMP markers, as several robust ones have already been publishedand a unified list is essential for future studies. Rather, we sought to emphasize theimportance of using quantitative assays for methylation profiling.
In our study, CIMP neither correlated with gender nor KRAS mutations, regardless of themethods used for CIMP scoring. Associations between CIMP and either gender or KRASmutations are controversial. In a large population based study, Samowitz et al. showed that
Cheng et al. Page 8
Clin Cancer Res. Author manuscript; available in PMC 2012 January 30.
NIH
-PA Author Manuscript
NIH
-PA Author Manuscript
NIH
-PA Author Manuscript
CIMP correlated with KRAS mutations but not with gender (22). However, recent studiesreported that CIMP significantly associated with wild-type KRAS and female gender (18,19). The discrepancies may result from the use of different methylation markers and/orsampling variation. We favor the latter explanation, as similar results of the absence ofcorrelations were obtained whether the tumor cohort was analyzed by the LDR/UniversalArray or the MethyLight assay (Supplementary Material, Fig S4).
Our findings provide additional nuances to a recent study suggesting that CIN and CIMPrepresent two independent mechanisms of genomic instability in sporadic CRCs (14). First,in our study, promoter methylation status was determined using quantitative methylationassays. These methods have the advantages over a non-quantitative and highly sensitiveassay (e.g. Methylation specific PCR) that tends to detect genomic loci with biologicallyinsignificant levels of methylation. Such an approach has often resulted in an over-estimation of CIMP or even failure to identify it. Second, when a tumor’s CIN status wasassessed based on the presence of one or more LOH events at eight microsatellite sequenceslocated on chromosomes 2p, 3p, 5q, 17p, and 18q, we confirmed the previous report of aninverse correlation between CIN and CIMP. This observation is independent of the methodof CIMP scoring. Nevertheless, since CIN leads to aneuploidy, in which chromosomalregions are either missing or duplicated, aberrations found in any chromosome may beviewed as CIN. Indeed, by employing high throughput assays, such as CGH and SNP arraytechnology, we and others have shown common and broad allelic imbalance events inchromosomes 4p, 4q, 5q, 12q, 14q, 15q, 17p, 18q, and 20p (24, 25, 29), and frequent gainsin chromosomes 7p, 7q, 8q, 13q, and 20q (32). These results allow a genome-wide analysisof CIN phenotype and provide an alternative for determination of CIN status in one third ofCRCs that had moderate to low level chromosomal aberrations. Third, the degree ofaneuploidy in the analyzed CRC samples is spread over a wide spectrum. Thus, a limitedLOH loci approach to determine CIN became challenging and will likely identify tumorswith the most chromosomal abnormalities, but not those, such as MSI and CIMP-positivetumors, which tend to have low-degree chromosomal aberrations. Since MSI constitutes agood proportion of CIMP-positive samples (>50%), our findings suggest that the reportedinverse correlation between CIMP and CIN may reflect the relationship between MSI andCIN (Fig. 4A). It is noteworthy that a subset of CIMP-positive tumors, albeit of small size,has a high degree of chromosomal aberrations. Whether this subset has a different clinicaloutcome needs to be further investigated. In summary, we conclude that CIMP-positivetumors are not free of chromosomal abnormalities; rather, they have significant low-degreechromosomal aberrations. This tendency of CIMP-positive tumors to have low-degree CINmost likely results from the contribution of their MSI feature. Our results indicate that thestratification of sporadic CRCs based on epigenetic and genetic instabilities is best describedusing a quantitative assay and a genome-wide approach, respectively.
Supplementary MaterialRefer to Web version on PubMed Central for supplementary material.
AcknowledgmentsThe authors thank Maneesh Pingle, Richard Shattock, Kathy Granger and Mark Rundell for insightful discussionand technical assistance. We also thank the Gilbert Family Foundation, and the Ludwig Institute for CancerResearch / Conrad N. Hilton Foundation joint Hilton-Ludwig Cancer Metastasis Initiative for their generousfunding in part of this work. Statistical analysis (JO) is supported by China NSFC grant 30730057. Francis Baranyis an Affiliate of the Ludwig Institute for Cancer Research. Work in the Barany laboratory is sponsored by theNational Cancer Institute (P01-CA65930 and RO1-CA81467).
Cheng et al. Page 9
Clin Cancer Res. Author manuscript; available in PMC 2012 January 30.
NIH
-PA Author Manuscript
NIH
-PA Author Manuscript
NIH
-PA Author Manuscript
References1. Jones PA, Baylin SB. The fundamental role of epigenetic events in cancer. Nat Rev Genet. 2002;
3:415–28. [PubMed: 12042769]2. Baylin SB, Herman JG. DNA hypermethylation in tumorigenesis: epigenetics joins genetics. Trends
Genet. 2000; 16:168–74. [PubMed: 10729832]3. Baylin SB, Ohm JE. Epigenetic gene silencing in cancer - a mechanism for early oncogenic pathway
addiction? Nat Rev Cancer. 2006; 6:107–16. [PubMed: 16491070]4. Gardiner-Garden M, Frommer M. CpG islands in vertebrate genomes. J Mol Biol. 1987; 196:261–
82. [PubMed: 3656447]5. Feinberg AP, Vogelstein B. Hypomethylation distinguishes genes of some human cancers from their
normal counterparts. Nature. 1983; 301:89–92. [PubMed: 6185846]6. Warnecke PM, Bestor TH. Cytosine methylation and human cancer. Curr Opin Oncol. 2000; 12:68–
73. [PubMed: 10687732]7. Kops GJ, Weaver BA, Cleveland DW. On the road to cancer: aneuploidy and the mitotic
checkpoint. Nat Rev Cancer. 2005; 5:773–85. [PubMed: 16195750]8. Rajagopalan H, Lengauer C. Aneuploidy and cancer. Nature. 2004; 432:338–41. [PubMed:
15549096]9. Yang Q, Mori I, Shan L, et al. Biallelic inactivation of retinoic acid receptor beta2 gene by
epigenetic change in breast cancer. Am J Pathol. 2001; 158:299–303. [PubMed: 11141504]10. Tokumaru Y, Nomoto S, Jeronimo C, et al. Biallelic inactivation of the RIZ1 gene in human
gastric cancer. Oncogene. 2003; 22:6954–8. [PubMed: 14534544]11. Li Z, Meng ZH, Chandrasekaran R, et al. Biallelic inactivation of the thyroid hormone receptor
beta1 gene in early stage breast cancer. Cancer Res. 2002; 62:1939–43. [PubMed: 11929806]12. Rodriguez J, Frigola J, Vendrell E, et al. Chromosomal Instability Correlates with Genome-wide
DNA Demethylation in Human Primary Colorectal Cancers. Cancer Res. 2006; 66:8462–9468.[PubMed: 16951157]
13. Toyota M, Ahuja N, Ohe-Toyota M, Herman JG, Baylin SB, Issa JP. CpG island methylatorphenotype in colorectal cancer. Proc Natl Acad Sci USA. 1999; 96:8681–6. [PubMed: 10411935]
14. Goel A, Nagasaka T, Arnold CN, et al. The CpG island methylator phenotype and chromosomalinstability are inversely correlated in sporadic colorectal cancer. Gastroenterology. 2007; 132:127–38. [PubMed: 17087942]
15. Eads CA, Danenberg KD, Kawakami K, Saltz LB, Danenberg PV, Laird PW. CpG islandhypermethylation in human colorectal tumors is not associated with DNA methyltransferaseoverexpression. Cancer Res. 1999; 59:2302–6. [PubMed: 10344733]
16. Hawkins N, Norrie M, Cheong K, et al. CpG island methylation in sporadic colorectal cancers andits relationship to microsatellite instability. Gastroenterology. 2002; 122:1376–87. [PubMed:11984524]
17. Yamashita K, Dai T, Dai Y, Yamamoto F, Perucho M. Genetics supersedes epigenetics in coloncancer phenotype. Cancer Cell. 2003; 4:121–31. [PubMed: 12957287]
18. Ogino S, Cantor M, Kawasaki T, et al. CpG island methylator phenotype (CIMP) of colorectalcancer is best characterised by quantitative DNA methylation analysis and prospective cohortstudies. Gut. 2006; 55:1000–6. [PubMed: 16407376]
19. Weisenberger DJ, Siegmund KD, Campan M, et al. CpG island methylator phenotype underliessporadic microsatellite instability and is tightly associated with BRAF mutation in colorectalcancer. Nat Genet. 2006; 38:787–93. [PubMed: 16804544]
20. Nagasaka T, Sasamoto H, Notohara K, et al. Colorectal cancer with mutation in BRAF, KRAS,and wild-type with respect to both oncogenes showing different patterns of DNA methylation. JClin Oncol. 2004; 22:4584–94. [PubMed: 15542810]
21. Toyota M, Ohe-Toyota M, Ahuja N, Issa JP. Distinct genetic profiles in colorectal tumors with orwithout the CpG island methylator phenotype. Proc Natl Acad Sci USA. 2000; 97:710–5.[PubMed: 10639144]
Cheng et al. Page 10
Clin Cancer Res. Author manuscript; available in PMC 2012 January 30.
NIH
-PA Author Manuscript
NIH
-PA Author Manuscript
NIH
-PA Author Manuscript
22. Samowitz WS, Albertsen H, Herrick J, et al. Evaluation of a large, population-based samplesupports a CpG island methylator phenotype in colon cancer. Gastroenterology. 2005; 129:837–45. [PubMed: 16143123]
23. Kambara T, Simms LA, Whitehall VL, et al. BRAF mutation is associated with DNA methylationin serrated polyps and cancers of the colorectum. Gut. 2004; 53:1137–44. [PubMed: 15247181]
24. Gaasenbeek M, Howarth K, Rowan AJ, et al. Combined array-comparative genomic hybridizationand single-nucleotide polymorphism-loss of heterozygosity analysis reveals complex changes andmultiple forms of chromosomal instability in colorectal cancers. Cancer Res. 2006; 66:3471–9.[PubMed: 16585170]
25. Lips EH, Dierssen JW, van Eijk R, et al. Reliable high-throughput genotyping and loss-of-heterozygosity detection in formalin-fixed, paraffin-embedded tumors using single nucleotidepolymorphism arrays. Cancer Res. 2005; 65:10188–91. [PubMed: 16288005]
26. Cheng YW, Shawber C, Notterman D, Paty P, Barany F. Multiplexed profiling of candidate genesfor CpG island methylation status using a flexible PCR/LDR/Universal Array assay. Genome Res.2006; 16:282–9. [PubMed: 16369045]
27. Khanna M, Park P, Zirvi M, et al. Multiplex PCR/LDR for detection of K-ras mutations in primarycolon tumors. Oncogene. 1999; 18:27–38. [PubMed: 9926917]
28. Nash GM, Gimbel M, Shia J, et al. Automated, multiplex assay for high-frequency microsatelliteinstability in colorectal cancer. J Clin Oncol. 2003; 21:3105–12. [PubMed: 12915601]
29. Tsafrir D, Bacolod M, Selvanayagam Z, et al. Relationship of gene expression and chromosomalabnormalities in colorectal cancer. Cancer Res. 2006; 66:2129–37. [PubMed: 16489013]
30. Huang J, Wei W, Zhang J, et al. Whole genome DNA copy number changes identified by highdensity oligonucleotide arrays. Hum Genomics. 2004; 1:287–99. [PubMed: 15588488]
31. Samowitz WS, Sweeney C, Herrick J, et al. Poor survival associated with the BRAF V600Emutation in microsatellite-stable colon cancers. Cancer Res. 2005; 65:6063–9. [PubMed:16024606]
32. Trautmann K, Terdiman JP, French AJ, et al. Chromosomal instability in microsatellite-unstableand stable colon cancer. Clin Cancer Res. 2006; 12:6379–85. [PubMed: 17085649]
Abbreviations
CIMP CpG island methylator phenotype
MSP methylation-specific PCR
LDR ligase detection reaction
LOH loss of heterozygosity
MSI microsatellite instability
CIN chromosomal instability
APC adenomatous polyposis coli
CDH1 E-cadherin
TIMP3 tissue inhibitor of metalloproteinase-3
RARβ retinoic-acid-receptor beta 2
DAPK1 death-associated protein kinase 1
RASSF1 Ras association domain family protein 1A
MGMT O6-methylguanine-DNA methyltransferase
GSTP1 glutathione S-transferase pi
Cheng et al. Page 11
Clin Cancer Res. Author manuscript; available in PMC 2012 January 30.
NIH
-PA Author Manuscript
NIH
-PA Author Manuscript
NIH
-PA Author Manuscript
Statement of Clinical Relevance
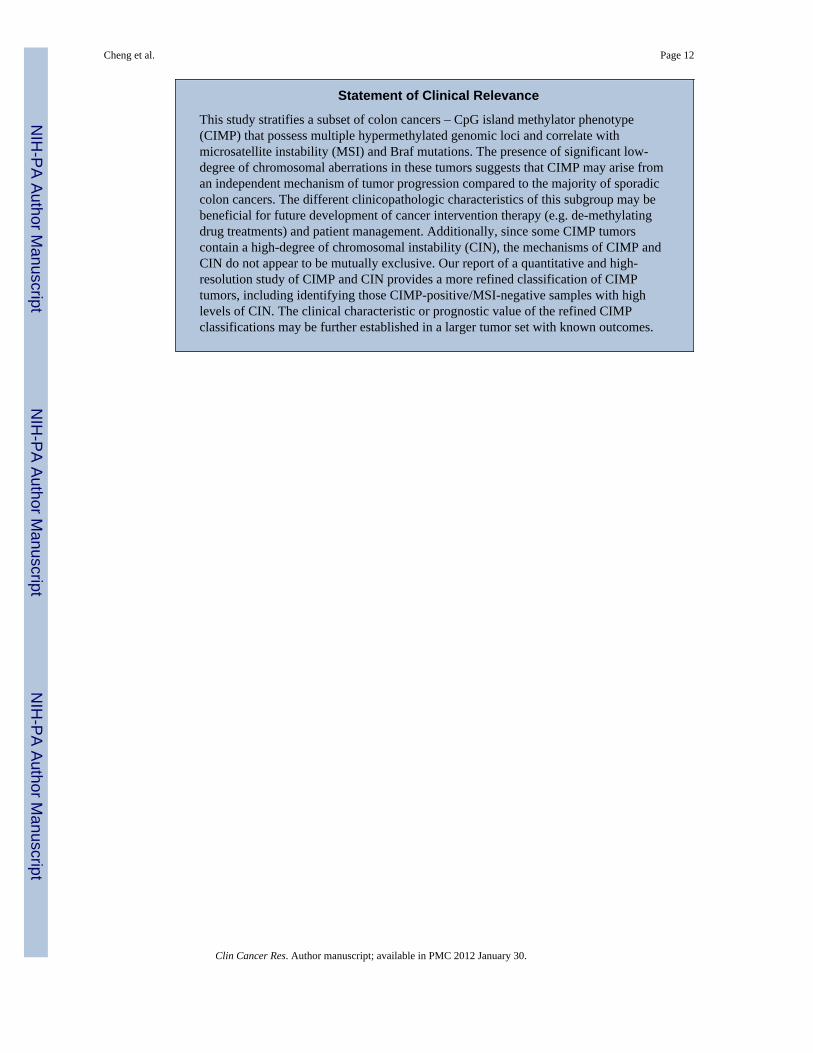
This study stratifies a subset of colon cancers – CpG island methylator phenotype(CIMP) that possess multiple hypermethylated genomic loci and correlate withmicrosatellite instability (MSI) and Braf mutations. The presence of significant low-degree of chromosomal aberrations in these tumors suggests that CIMP may arise froman independent mechanism of tumor progression compared to the majority of sporadiccolon cancers. The different clinicopathologic characteristics of this subgroup may bebeneficial for future development of cancer intervention therapy (e.g. de-methylatingdrug treatments) and patient management. Additionally, since some CIMP tumorscontain a high-degree of chromosomal instability (CIN), the mechanisms of CIMP andCIN do not appear to be mutually exclusive. Our report of a quantitative and high-resolution study of CIMP and CIN provides a more refined classification of CIMPtumors, including identifying those CIMP-positive/MSI-negative samples with highlevels of CIN. The clinical characteristic or prognostic value of the refined CIMPclassifications may be further established in a larger tumor set with known outcomes.
Cheng et al. Page 12
Clin Cancer Res. Author manuscript; available in PMC 2012 January 30.
NIH
-PA Author Manuscript
NIH
-PA Author Manuscript
NIH
-PA Author Manuscript
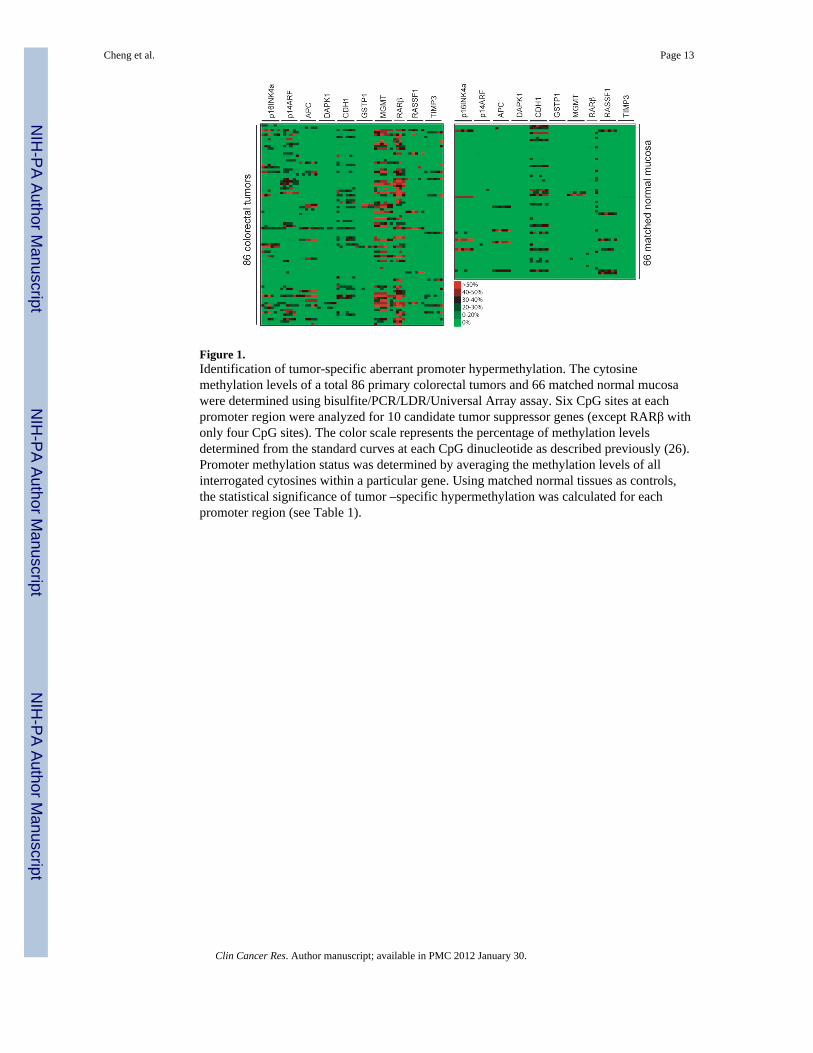
Figure 1.Identification of tumor-specific aberrant promoter hypermethylation. The cytosinemethylation levels of a total 86 primary colorectal tumors and 66 matched normal mucosawere determined using bisulfite/PCR/LDR/Universal Array assay. Six CpG sites at eachpromoter region were analyzed for 10 candidate tumor suppressor genes (except RARβ withonly four CpG sites). The color scale represents the percentage of methylation levelsdetermined from the standard curves at each CpG dinucleotide as described previously (26).Promoter methylation status was determined by averaging the methylation levels of allinterrogated cytosines within a particular gene. Using matched normal tissues as controls,the statistical significance of tumor –specific hypermethylation was calculated for eachpromoter region (see Table 1).
Cheng et al. Page 13
Clin Cancer Res. Author manuscript; available in PMC 2012 January 30.
NIH
-PA Author Manuscript
NIH
-PA Author Manuscript
NIH
-PA Author Manuscript
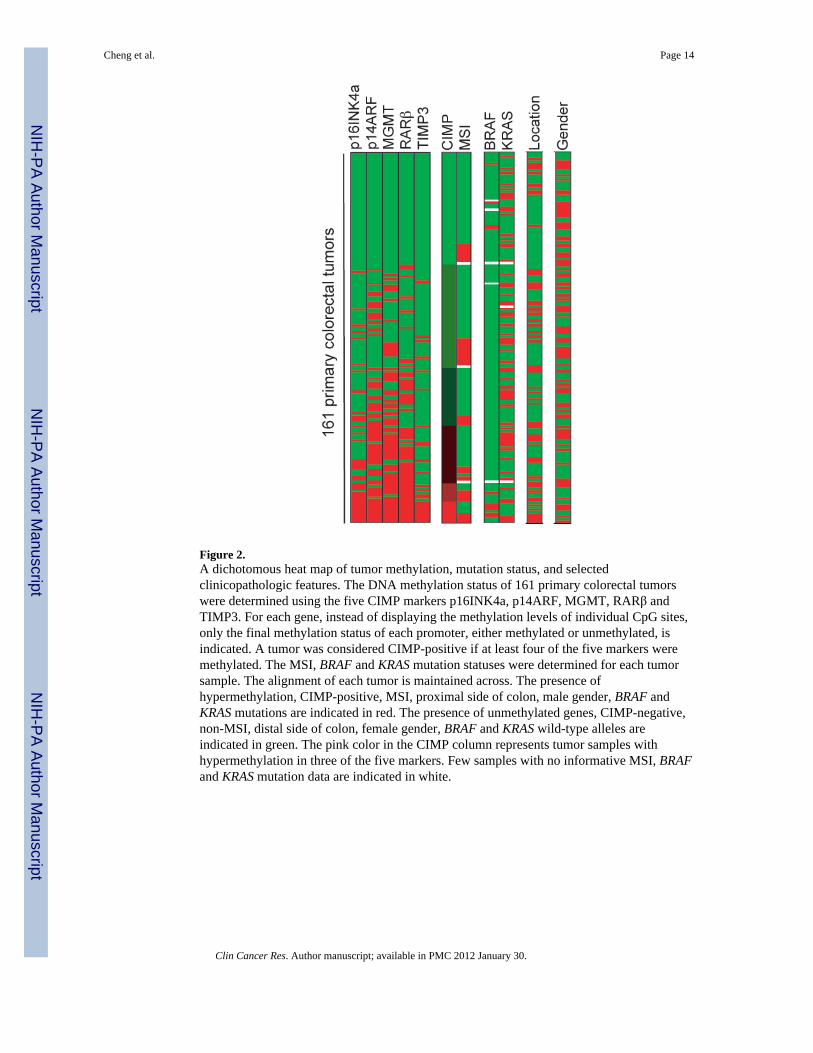
Figure 2.A dichotomous heat map of tumor methylation, mutation status, and selectedclinicopathologic features. The DNA methylation status of 161 primary colorectal tumorswere determined using the five CIMP markers p16INK4a, p14ARF, MGMT, RARβ andTIMP3. For each gene, instead of displaying the methylation levels of individual CpG sites,only the final methylation status of each promoter, either methylated or unmethylated, isindicated. A tumor was considered CIMP-positive if at least four of the five markers weremethylated. The MSI, BRAF and KRAS mutation statuses were determined for each tumorsample. The alignment of each tumor is maintained across. The presence ofhypermethylation, CIMP-positive, MSI, proximal side of colon, male gender, BRAF andKRAS mutations are indicated in red. The presence of unmethylated genes, CIMP-negative,non-MSI, distal side of colon, female gender, BRAF and KRAS wild-type alleles areindicated in green. The pink color in the CIMP column represents tumor samples withhypermethylation in three of the five markers. Few samples with no informative MSI, BRAFand KRAS mutation data are indicated in white.
Cheng et al. Page 14
Clin Cancer Res. Author manuscript; available in PMC 2012 January 30.
NIH
-PA Author Manuscript
NIH
-PA Author Manuscript
NIH
-PA Author Manuscript
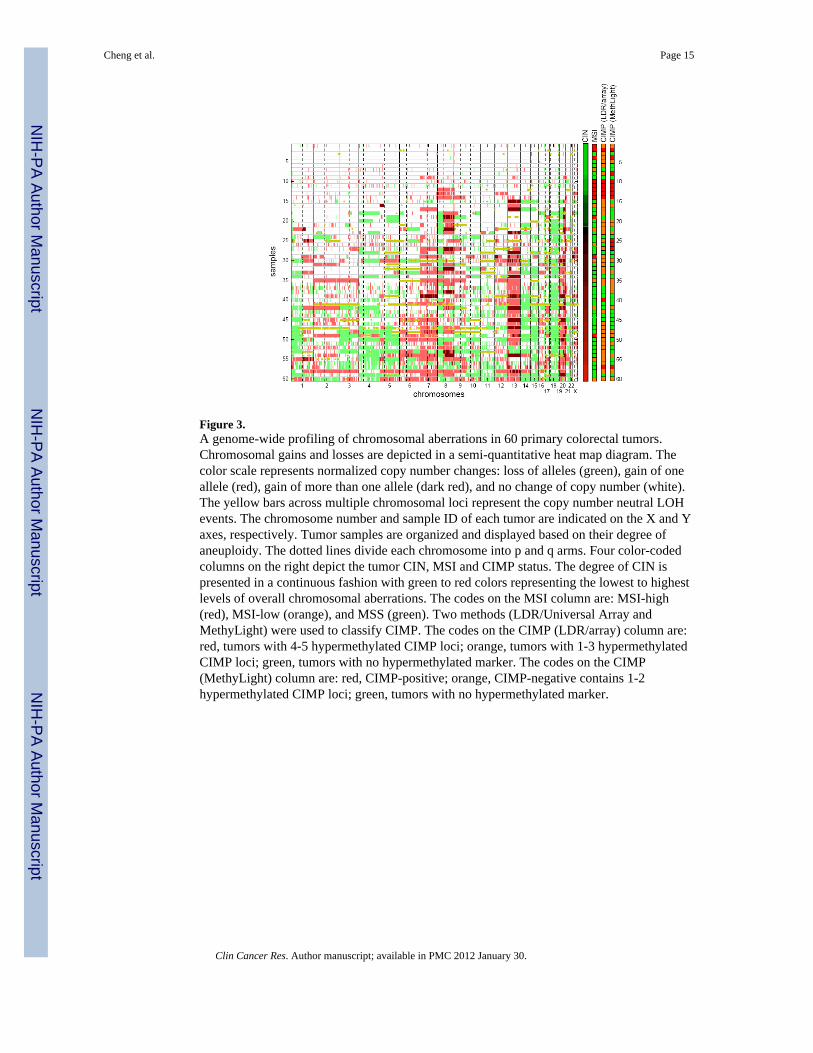
Figure 3.A genome-wide profiling of chromosomal aberrations in 60 primary colorectal tumors.Chromosomal gains and losses are depicted in a semi-quantitative heat map diagram. Thecolor scale represents normalized copy number changes: loss of alleles (green), gain of oneallele (red), gain of more than one allele (dark red), and no change of copy number (white).The yellow bars across multiple chromosomal loci represent the copy number neutral LOHevents. The chromosome number and sample ID of each tumor are indicated on the X and Yaxes, respectively. Tumor samples are organized and displayed based on their degree ofaneuploidy. The dotted lines divide each chromosome into p and q arms. Four color-codedcolumns on the right depict the tumor CIN, MSI and CIMP status. The degree of CIN ispresented in a continuous fashion with green to red colors representing the lowest to highestlevels of overall chromosomal aberrations. The codes on the MSI column are: MSI-high(red), MSI-low (orange), and MSS (green). Two methods (LDR/Universal Array andMethyLight) were used to classify CIMP. The codes on the CIMP (LDR/array) column are:red, tumors with 4-5 hypermethylated CIMP loci; orange, tumors with 1-3 hypermethylatedCIMP loci; green, tumors with no hypermethylated marker. The codes on the CIMP(MethyLight) column are: red, CIMP-positive; orange, CIMP-negative contains 1-2hypermethylated CIMP loci; green, tumors with no hypermethylated marker.
Cheng et al. Page 15
Clin Cancer Res. Author manuscript; available in PMC 2012 January 30.
NIH
-PA Author Manuscript
NIH
-PA Author Manuscript
NIH
-PA Author Manuscript
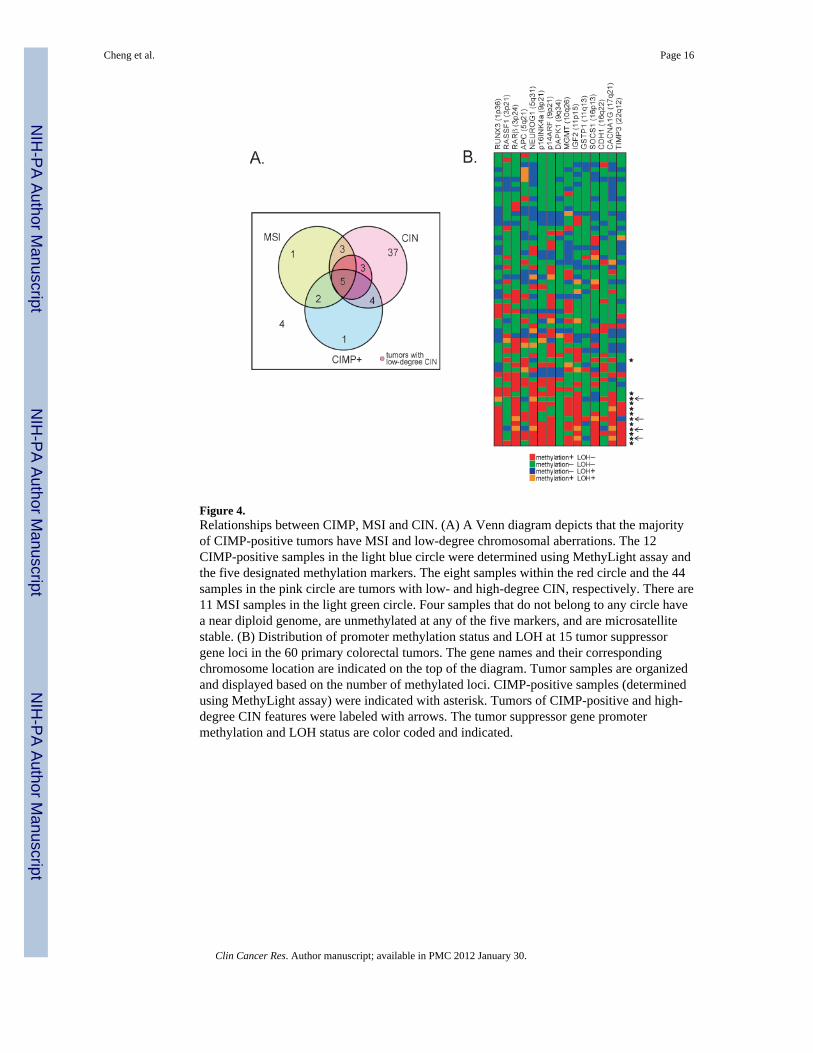
Figure 4.Relationships between CIMP, MSI and CIN. (A) A Venn diagram depicts that the majorityof CIMP-positive tumors have MSI and low-degree chromosomal aberrations. The 12CIMP-positive samples in the light blue circle were determined using MethyLight assay andthe five designated methylation markers. The eight samples within the red circle and the 44samples in the pink circle are tumors with low- and high-degree CIN, respectively. There are11 MSI samples in the light green circle. Four samples that do not belong to any circle havea near diploid genome, are unmethylated at any of the five markers, and are microsatellitestable. (B) Distribution of promoter methylation status and LOH at 15 tumor suppressorgene loci in the 60 primary colorectal tumors. The gene names and their correspondingchromosome location are indicated on the top of the diagram. Tumor samples are organizedand displayed based on the number of methylated loci. CIMP-positive samples (determinedusing MethyLight assay) were indicated with asterisk. Tumors of CIMP-positive and high-degree CIN features were labeled with arrows. The tumor suppressor gene promotermethylation and LOH status are color coded and indicated.
Cheng et al. Page 16
Clin Cancer Res. Author manuscript; available in PMC 2012 January 30.
NIH
-PA Author Manuscript
NIH
-PA Author Manuscript
NIH
-PA Author Manuscript
NIH
-PA Author Manuscript
NIH
-PA Author Manuscript
NIH
-PA Author Manuscript
Cheng et al. Page 17
Tabl
e 1
The
sign
ifica
nce
of tu
mor
-spe
cific
pro
mot
er h
yper
met
hyla
tion
Gen
ech
i-sq.
pG
ene
chi-s
q.p
MG
MT
44.6
920.
000
DA
PK1
3.46
30.
063
p14A
RF
42.9
240.
000
GST
P13.
463
0.06
3
RA
Rβ
35.1
830.
000
APC
3.35
20.
067
TIM
P311
.929
0.00
1R
ASS
F10.
228
0.63
3
p16I
NK
4a10
.106
0.00
1C
DH
10.
005
0.94
2
P-va
lues
hig
hlig
hted
in b
old
rem
ain
sign
ifica
nt a
t 5%
leve
l afte
r mul
tiple
test
ing
corr
ectio
n.
Clin Cancer Res. Author manuscript; available in PMC 2012 January 30.
NIH
-PA Author Manuscript
NIH
-PA Author Manuscript
NIH
-PA Author Manuscript
Cheng et al. Page 18
Tabl
e 2
The
corr
elat
ion
betw
een
CIM
P an
d ge
nder
, loc
atio
n, M
SI, K
RA
S, a
nd B
RA
F m
utat
ions
No.
of m
ethy
late
d lo
ci (C
IMP)
01
23
45
Tot
al N
o.P
valu
e
n%
Tot
al (p
rim
ary
CR
C)
4945
2525
89
161
Men
2623
1010
35
77(4
8%)
Wom
en23
2215
155
484
(52%
)0.
772
Dis
tal
3929
1716
43
108
(67%
)
Prox
imal
1016
89
46
53(3
3%)
0.07
5
KR
AS_
WT
3228
1513
65
99(6
3%)
KR
AS_
Mut
1616
1011
24
59(3
7%)
0.86
4
no in
fo1
10
10
03
MSI
-H8
124
55
438
(24%
)
MSS
4032
2119
35
120
(76%
)0.
075
no in
fo1
10
10
03
BR
AF_
WT
4244
2524
74
146
(94%
)
BR
AF_
Mut
40
00
15
10(6
%)
0.00
005
no in
fo3
10
10
05
MSI
-HB
RA
F_W
T8
124
54
235
(92%
)
BR
AF_
Mut
00
00
12
3(8
%)
0.02
2
MSS
BR
AF_
WT
3632
2119
33
114
(94%
)
BR
AF_
Mut
40
00
02
6(6
%)
0.03
Clin Cancer Res. Author manuscript; available in PMC 2012 January 30.