cowtn - archive of european integration
TRANSCRIPT

COWTNSTUDIIS
CffiMs$oil OF THE EUROEAil COMUNITIES
URESTORATE.GEilERAI FOR ECOilOTIIC ATD TI]IAilCIAL AFFAIRS
trfiililil3j$i['hb. i
ill
tir,f,tr!aI!f*:- -- I
NumberT March 1992
Spoin
Directorate-Generalfor Economic and Financial Affairs
. Co&y rEdbr erc ttc rtruft of intso.l rodyri. of to ooooonnc rinndo of tbc rcrpoctive nrcnrbcroouo!1l; tcy re rnrdc on 6o rcrpodHlity of lLc Dfuecton0c-Crenqal fa Econonic and EnercialAf,trn d6! Comrirdoo of lbc Eu'opcro Ooruruniticc.
IU4Il9I.EN Este doomto existe tambidn en Espar'lol

Table of Contents
Executive Summary . . . .1 Part IIChapter I
part I The Price Wage Formation Process andThe Economic and Financial Situation Labour Market Constraints . . . . . 25
inSpain ......3Chapter II
0. Introduction .... ... .3 CompetitivenessandExternalPerformancein the Catching-up Process . . 40
l. Supply-side performance and challenges . .3Chapter III
Z. problemsofstabilization . . . .7 PublicFinanceandFiscalReform . . . . . 53
3. The pursuit ofconvergence as Chapter IVEMU progresses . . . . ll Regime Applicable to Capital Movements . 66
4. Summary and conclusion . . . . .13 Chaptcr vTheFinancialSystem ....6t
StatisticalAnnex ....14Chapter VIThe Conduct of Monetary Policy in Spain . 77
Chapter VIIRegional Disequilibria: Unbalanced RegionalGrowth, Asymmetries and Consequences . 84
Table of Graphs and Tables
Part I
Graph 1:
Graph 2:
Graph 3:
Graph 4:
Graph 5:
Graph 6:
Graph 7:
Graph 8:
Graph 9:
Graph l0:
Graph 11:
Graph 12:
Graph 13:
Graph 14:
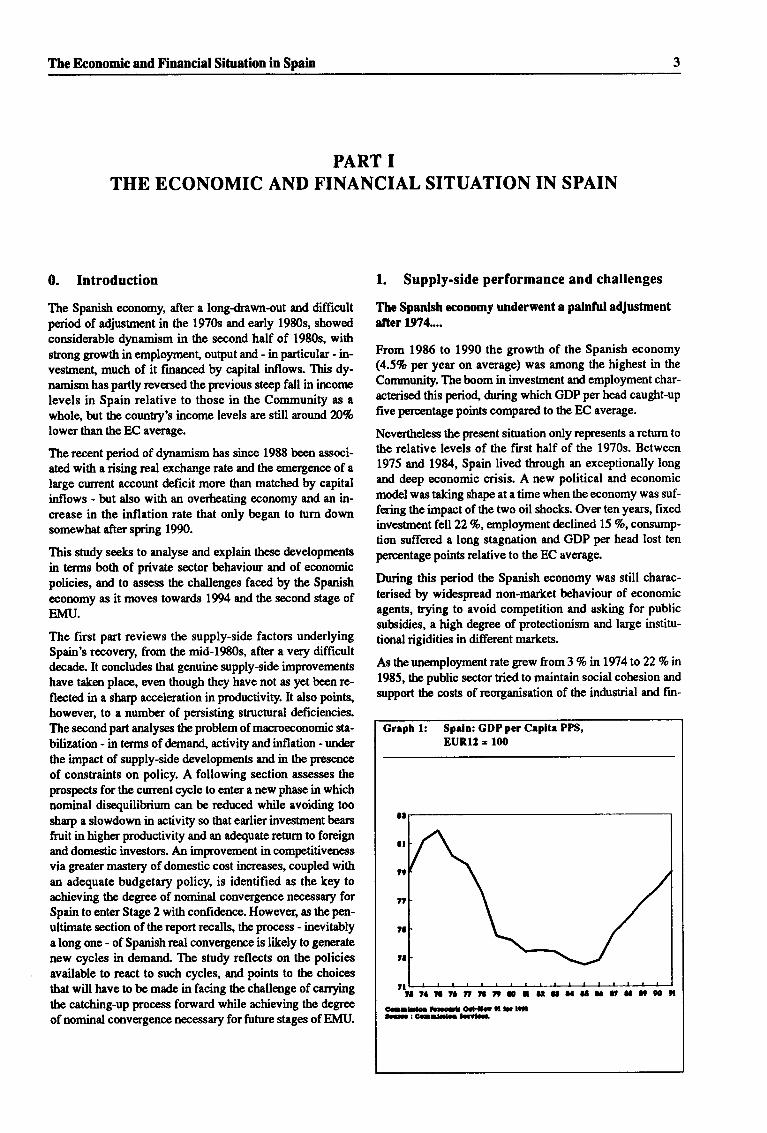
Spain: GDP per Capita PPS,EUR12=100 ....... 3
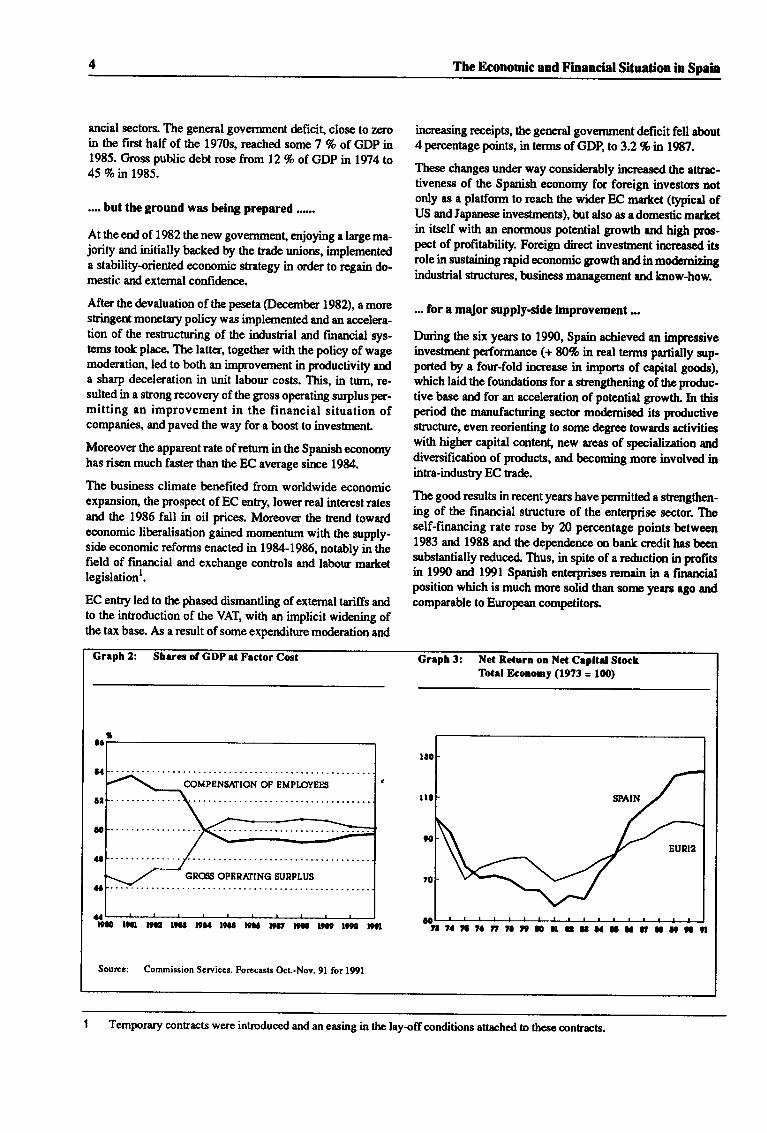
Shares of GDP at Factor Cost . . . 4
Net Return on Net Capital StockTotal Economy (1973 = 100) . . . 4
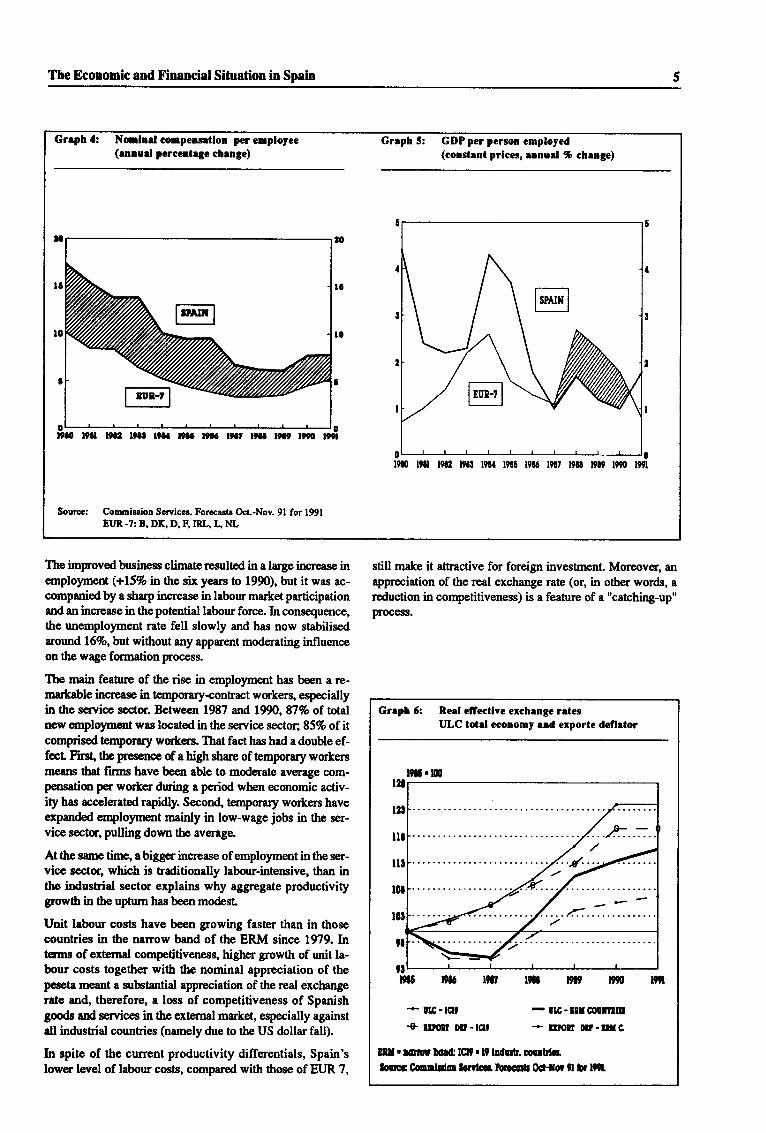
Nominal compensation peremployee ....5
GDPperpersonemployed ... . 5
Real effective exchange ratesULC total economy andexportdeflator ...... 5
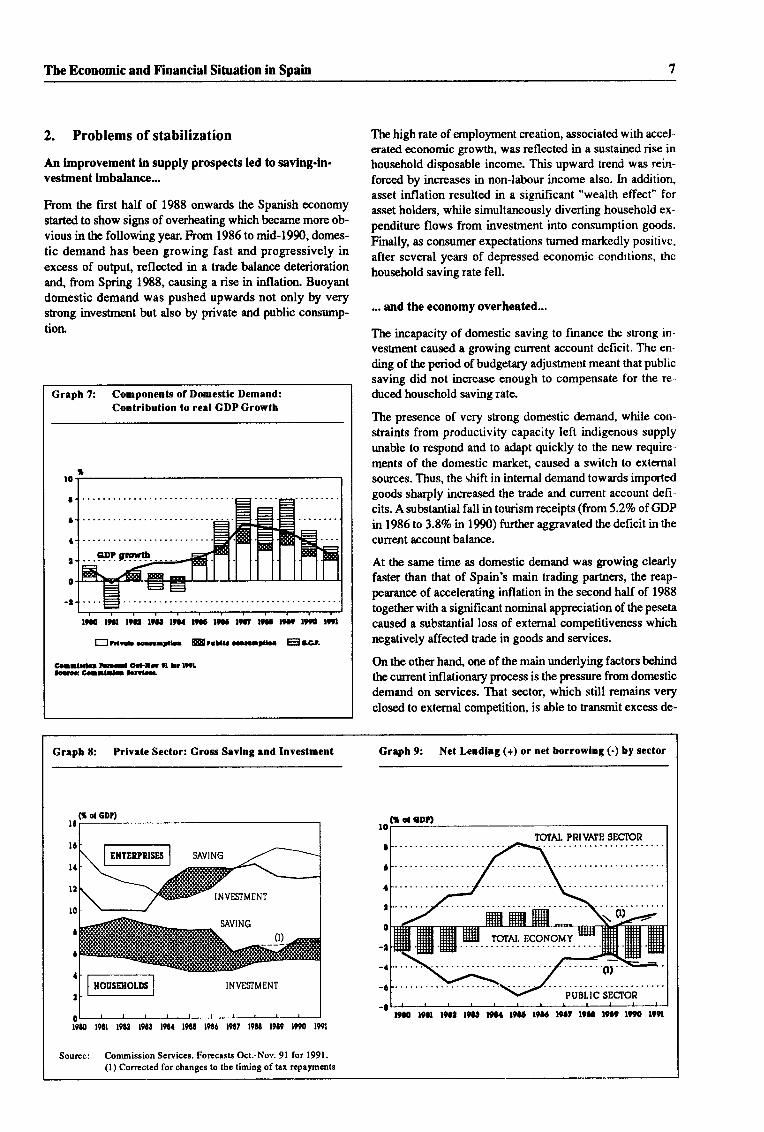
Components of Domestic Demand:Contribution to real GDP Growth 7
Private Sector: Gross Savingandlnvestment .. . . . .7
Net Lending (+) or net borrowing(-)bysector ... .....7
Real domestic demand & importsofgoods . . .. . 8
Inllationbysector .... 8
Contribution to the change inthe price deflator of total finaluses(%) ..... 8
Net lending or net borrowing ofgeneralgovernment ... 9
Bilateral spread between the Pesetaand the weakest ERM currency . .10
Statistical Annex
Table l: Final uses of goods and servicesand other key agregates of theSpanisheconomy ... . 14
Table 2: Final uses ofgoods and services 15
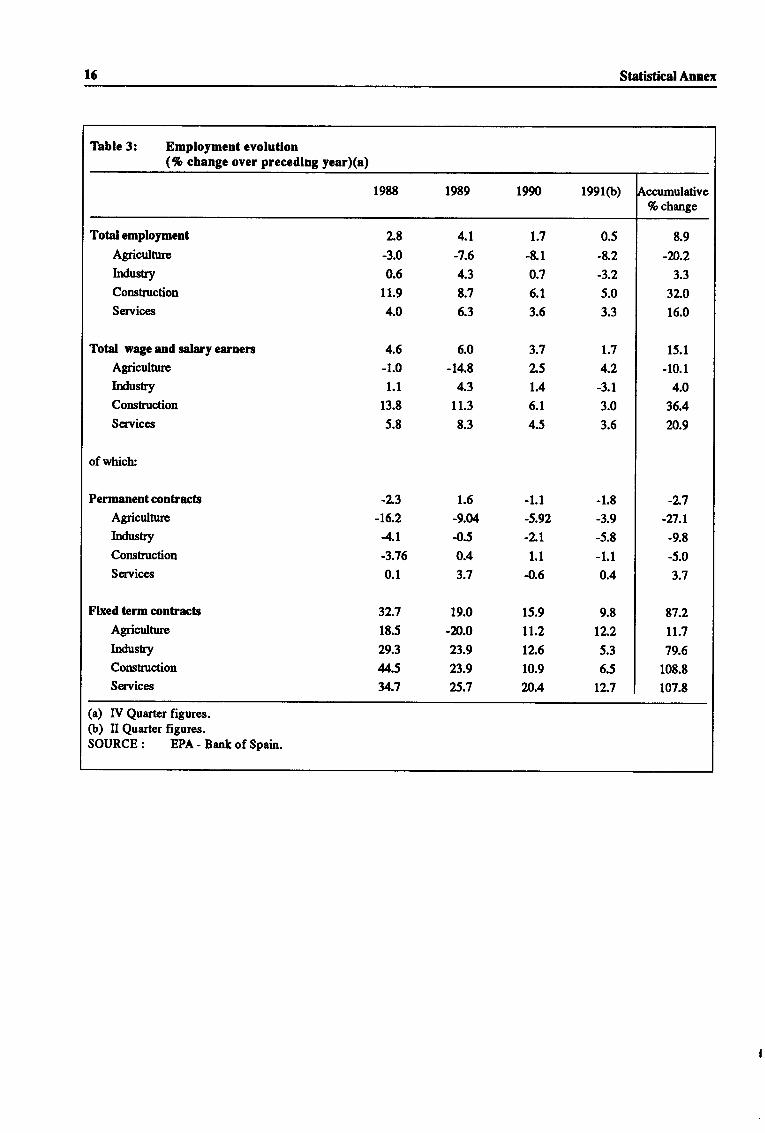
Table3: Employmentevolution . . . . . 16
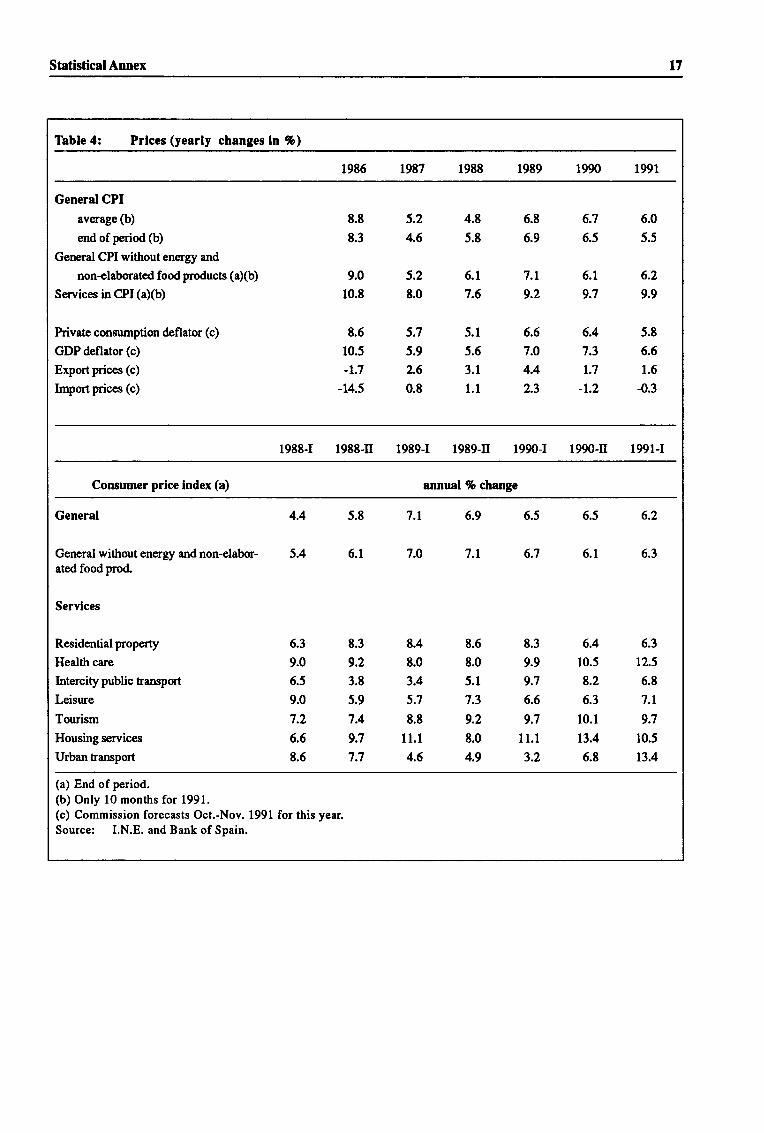
Table 4: Prices (yearly changes in %) . . l7
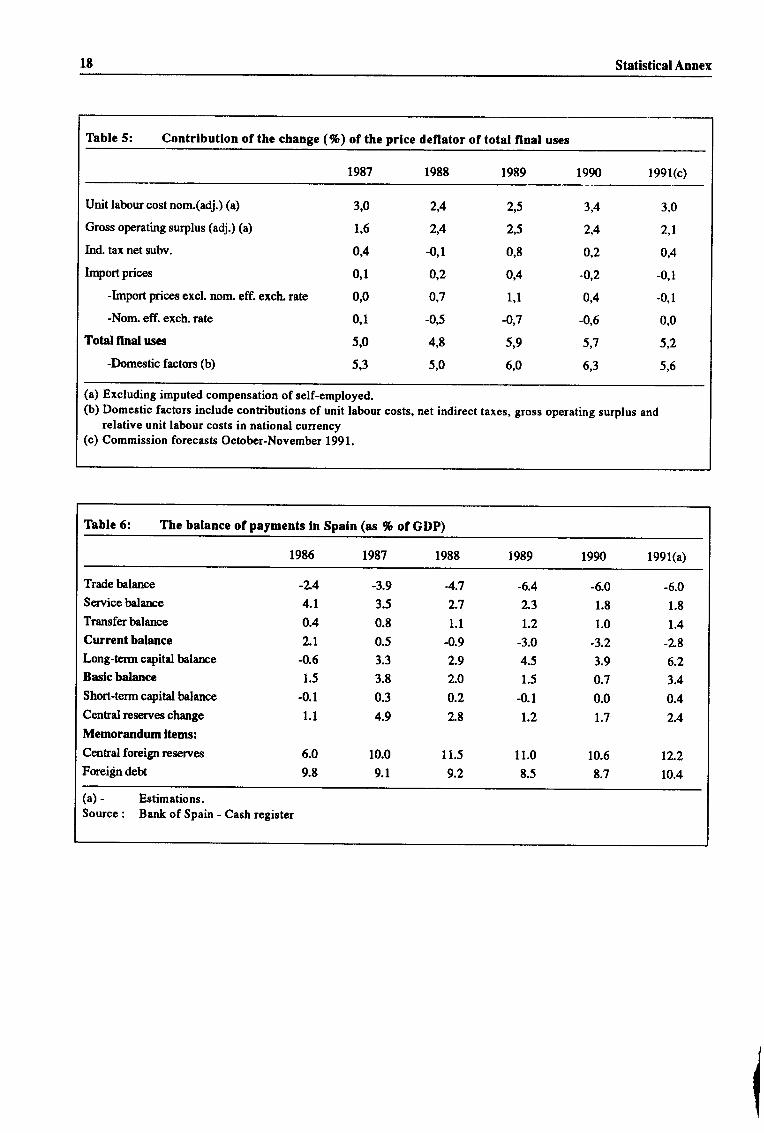
Table 5: Contribution of the change (%)of the price deflator of totalfinaluses . ... . 18
Table 6: The balance of payments in Spain(as%ofGDP) ......18
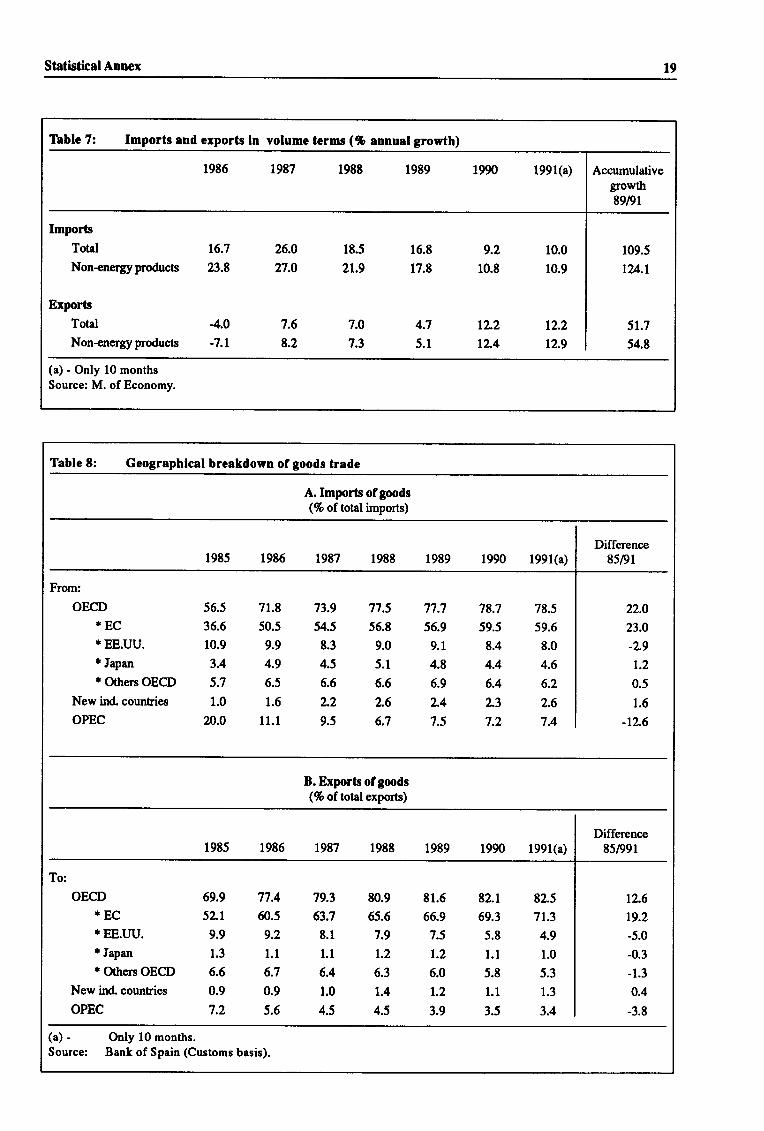
Table 7: Imports and exports in volumeterms (% annual growth) . . . . . 19
Table 8: Geographical breakdown of goodstrade ...... 19
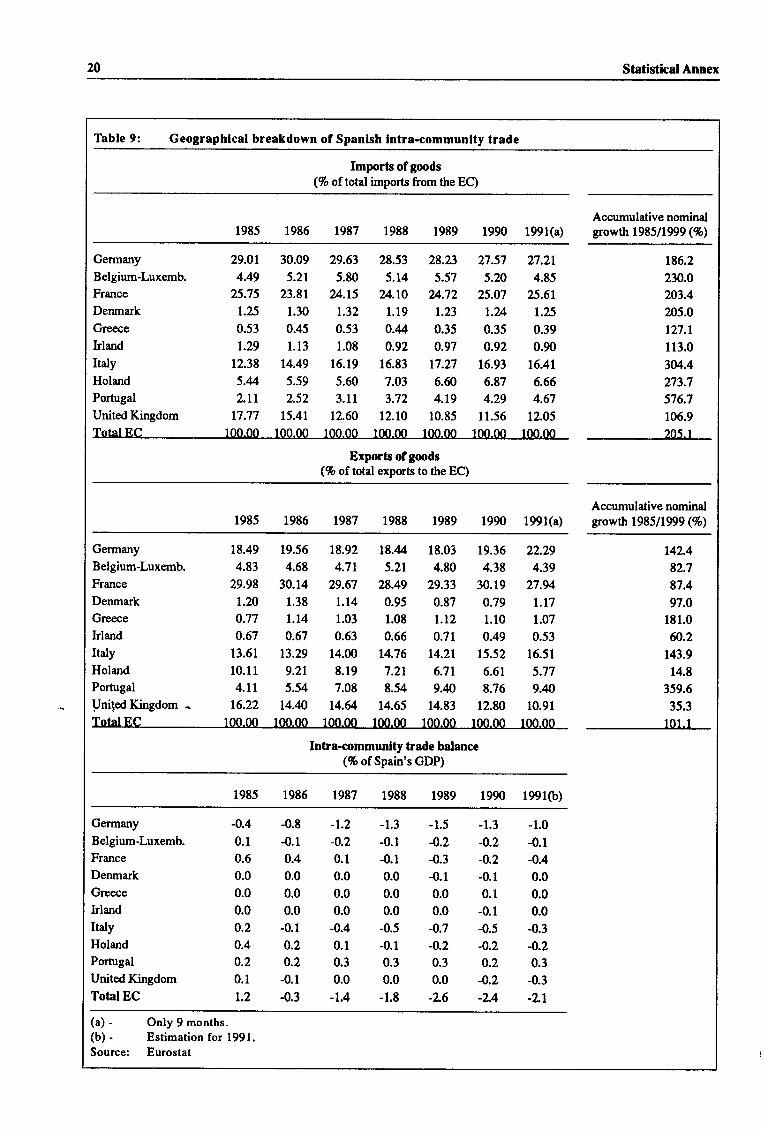
Table 9: Geographical breakdown ofSpanish intra-community trade . 20
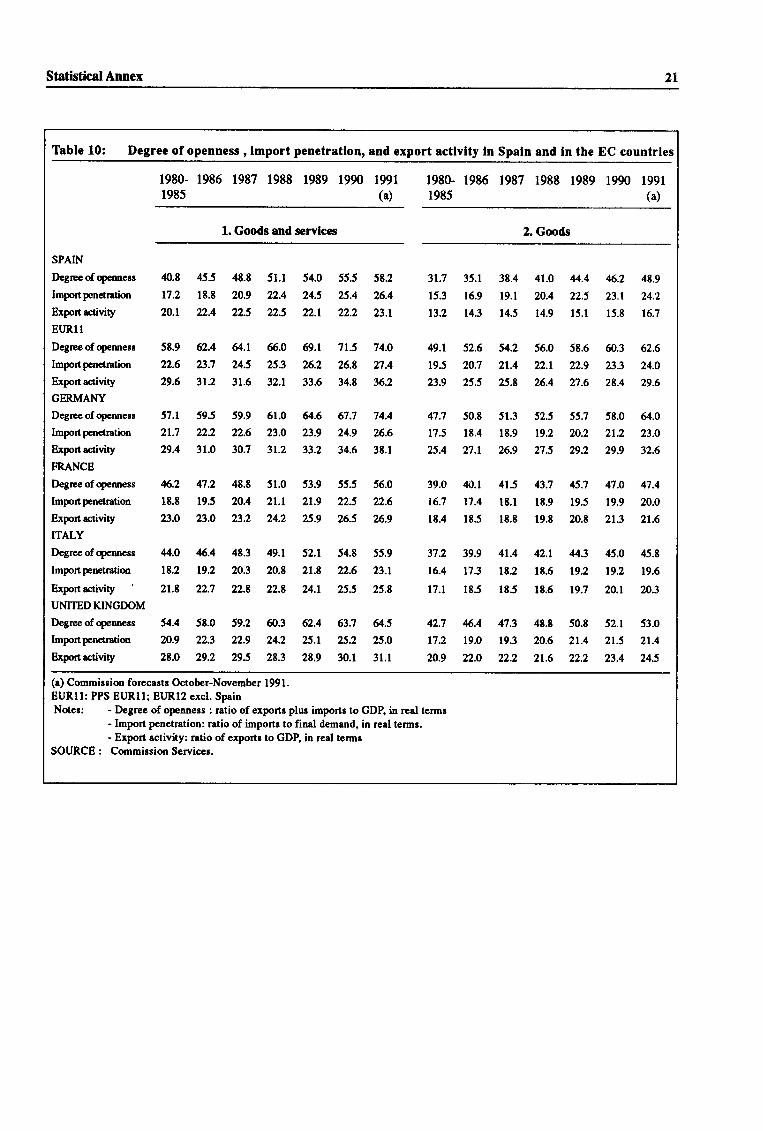
Table 10: Degree of openness , import penetra-tion, and export activity in Spainand in the EC countries . . . . . 2l
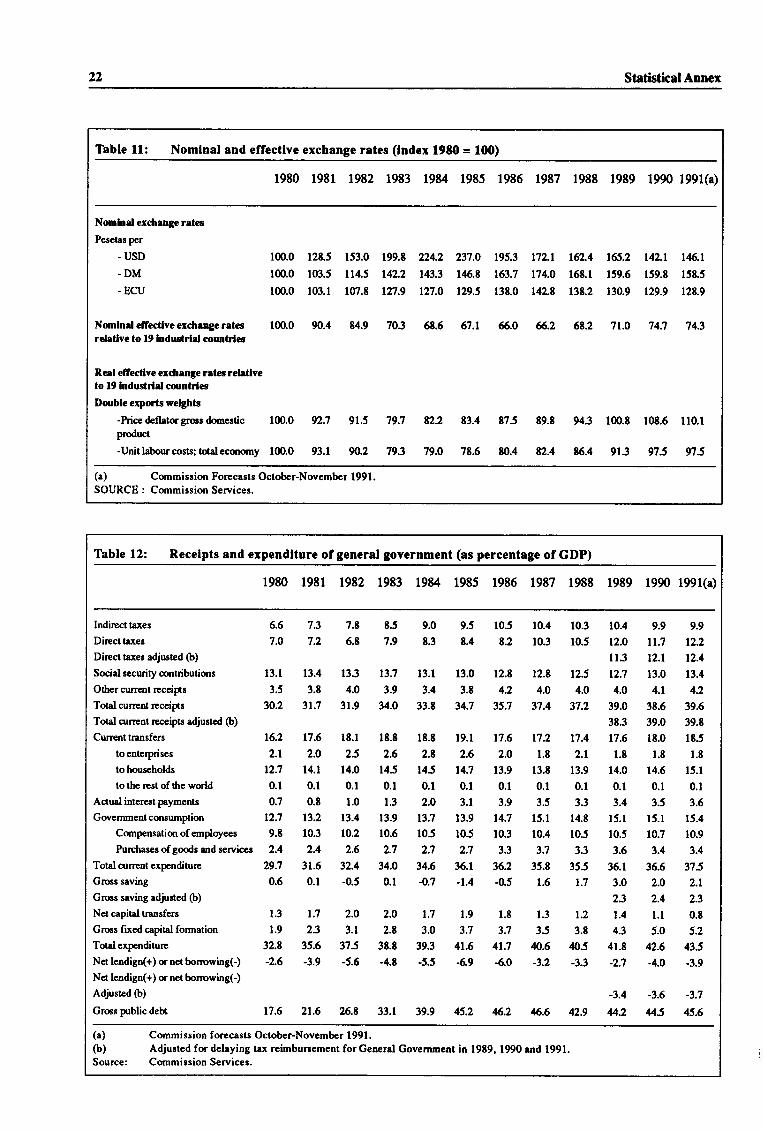
Table 11: Nominal and effective exchangerates (index 1980 = 100) . . . ., 22
Table 12: Receipts and expenditure of generalgovernment . . 22
Table 13: Monetary and credit indicators . 23
Table 14: Counterparts of money creation 23
Tablel5: Interestrates . . ..... U
Table 16:
Part II
Chapter I
Graph 1:
Graph 2:
Table 1:
Table 2:
Table 3:
Table 4:
Table 5:
Table 6:
Table 7:
Table 8:
Table 9:
Table 10:
Economic performance relative Table 12:to ELIR-7
Change in wages, prices andunemploymentrate .. . .32
Contribution to the change in theprice deflator of total finaluses(%) .....32
Recruitment under the employmentpromotion programmes (EPP)
Table 13:
Table 14:
Table 15:
Part-time employees as aproportion of total employees,1989 ......38
Persons in employment by profes-sionalstatus,l9S9 ...38
Concentration of family workingand self employment, by sector,1989 . . 38
Persons in employment, by profes-sional status an by age-group,1989 . . 39
Nominal and real unit labour costs(%averugegrowth) ... . 39
Contributions to the change ofthe price deflator of total finaluses(%) .... 39
The balance of payments in Spain(% of GDP)
Degree of openness , importpenetration, and export activity inSpain and in the EC countries . .
Product breakdown of non-energyimportsContrib. of non energy importsgrowth
Prod.breakdown of consumptionimportsContrib. of consumption importsgrowth
Spanish competitiviness between1985 - 1991
Nominal effective exchange rates
Inflation by sector(% averuge annual rate)
Invisible balance (% of GDP) . .
Tourismperformance .. ... .
24
Growth in totalemployment
and temporary
Temporary employment as aproportion of total wage-earners,total and by sector . . . .35
Employmentgrowth .. .35
Employers' social securitycontributions as a percentage oftotaltaxation .......35
Unemployment rates by age group,1989 . . . . . . .35
Changes in participation rates formen aged 55 and over.Spain, the Member States andinternational comparisons . . . . . 36
Principal characteristics of activityof those agedl4-24,1989 . . . . .36
Unfilled job vacancies and skillshortages . . . .36
Education and trainingInformation relates to educationand training experiences during thefour weeks preceding survey . . .37
Participation rates and levels ofeducation ....37
34
Table 16:
Table 17:
Chapter II
Table l:
Table 2:
Graph l:
Graph 2:
Table 3:
Graph 3:
Graph 4:
Table 4:
Graph 5:
4l
42
43
43
45
45
46
46
Table ll:
Graph 6:
Table 5:
Graph 7:
Table 6:
Saving and investment gap . . . .47
Current and capital accountbalances (% ofGDP) . . . . . . .47
Current account's permanent finance(% of GDP) . . .48
Net external financial position(December 1986 - September 1991,bn.$) ......48
Table 7: Sectorial breakdown of directforeigninvestment (%of total) . .50
Chapter III
Table 1: Government revenue andexpenditure (re % of GDP) . . . .54
Graph l: Net lending or net borrowing ofgeneral government cyclicalyadjusted .....55
Table 2: Increase in pensions, wages andincome tax allowances andthresholds (Tochange) . . . . . . .55
Table 3: Ovemrns on the state budget(non-financial payments) . . . . .56
Table 4: Breakdown of general governmentnet lending or net borrowing . . .57
Graph 2: Net lending or net borrowing ofgeneralgovernment ...57
Table 5: Financial assets and liabilities . .58
Table 6: Compliance with tax laws(Figures declared as a percentage oftheoretical tax base) . . .58
Graph 3: Fiscal pressureELIR-9=100 .......58
TableT: Structureoftaxes(%) . . . . . . .59
Table 8: Receipts and expenditure of generalgovernment . . .63
Table9: Tableofflows ......63
Central Government Debt(Distribution of outstanding debtaccording to the conditions oftheissue) ...... 63
Central Government Debt(Outstanding debt at the end oftheperiod) .. . 64
Public Debt of Central Government:Average residual life maturity ofoutstanding balances on3l December
Spanish banks' profitability ratios 70
Comparative importance of Spanishcredit institutions(measured by total assets) . . . . 7l
Structure of balance sheets ofbankinginstitutions ..71
Structural data for the stockexchangeinl9S9 ....72
New liabilities of non-financialenterprises and households . . . 73
New liabilities of non-financialenterprisesPublic issues through the stockmarkets .....73
Institutional Structure of theSpanish Stock Markets . . . . . . 75
Monetary and credit indicators . 80
Nominal short-term interest ratesdifferentials . . 8l
Bilateral spread between the Pesetaand the weakest erm currency . . 82
Table 10:
Table 1l:
Table 12:
Chapter Y
Table l:
Table 2:
Table 3:
Table 4:
Table 5:
Table 6:
Graph l:
Chapter VI
Table l:
Graph l:
Graph 2:
65
Chapter VII
Table I : GDP per head with respect to EC,inpps . .. . . .91
Table 2: Investment in manufacturing,1985-t987% .. .... .92
Table 3: Foreign and public investment, . .93
Table 4: Level and structure ofun-employment(IggO) ...94
Table 5: Population movements and activityrates . . . . . . .95
Table 6: Structure of regional employment 96
Increase in training places requiredfor adolescents aged 15-19(% of places available in l9E5) . 97
Distribution of the Fondo deCompensaci6n Interterritorial inObjectivelregions ... 98
Community Support Frameworks,MECU, 1989 prices . . 98
Community grants in the objective ICSBbyaxis . .. 99
Spain: Comunidades Autdnomas 100
Table 7 :
Table 8:
Table 9:
Table 10:
Figure l:

Executive Summary
EXECUTIVE SUMMARY
In the second half of the eighties, the Spanish economyachieved among the fastest rates of GDP and investmentgrowth within the Community. During this period, thecountry has made major progress in indusaial reorganisa-tion, inreforming and starting to open up the financial sector,and in liberalizing capital flows. It has also entered the ERM,albeit with wide margins
Foreiga capital inflows have been heavily encouraged by thetwin factors of strong perceived opportunities forreal invest-ment urd high rates of interesL That has been both necessaryand appropriate in a period of demand dynamism charac-teristic of an economy €ngaged, after a painful readjusbnentbetween the mid-70s and the mid-8Os, in a process of realconvergence. Nevertheless, the spurt in growth in recentyears has not yet restored the relative income level (vis-l-visEC parhers) of the early 1970s. But this strong real catching-up process caused inflationary pressures from the demandside which, taking account of the remaining rigidities in theeconomy, in due course have also become evident on thecosts side.
Despite genuine supply-side improvements a number ofsbuctural deficiencies persisl particularly in the labour mar-ket in the public finances and in an inadequately competitivestructure of many sectors, most notably services, irrcludingfinancial services.
Fast growth of output in Spain has engendered impressivegains in employment (very largely ternporary-conhact em-ployment) and an increase in participation rates. Nonethe-less, the uremploSrment rate, while well below the peak of229orcachd in 1985, is still at a level (around 16% ) muchhigher than in most other Community counhies. Moreover,rapid employment expansion has been associated with me-diocre growth in productivity. Inflation, which was below5% n L987, peaked at mqe thanT% last year and currentlyat around 5.5% rernains clearly out of line with inflation ratesin the original narrow-band ERM countriesr. A notable fea-ture of inflation performarrce in Spain has been the wide dis-parity between inflation in industrial goods (where inflationconvergense with narrow-band countries has already beenachieved) and services, where particularly high rates of in-crease in prices have been reconded recently.
At least part of the observed behaviow of relative inflation inse,rvices sectors in the recent past can probably be asoibed tomacroeconomic factors - a demand boom outstripping cur-rent domestic supply potential. Nonetheless, there is clearlyan underlying sbmctural problem in sen ices in Spain : inzuf-ficient competition combined with - or even created by - theregulatory public policies pursued in areas zuch as health,truxport and comrnunications has led to an inefficient allo-cation of rpsources in the economy as a whole and has there-by reduced ttrb volume of output and employment consistent
with any given rate of overall inllation. Thus structural fac-tors almost c€rtainly con&ibuted to the acceleration in over-all inflation in Spain in 1988p0 as output and employmentincreased faster than the short-term capacity ofthe economyto grow without shains.
Domestic demand was growing fast and progressively in ex-cess of output leading to a trade and current account balancedeterioration. Public savings did not increase enough to com-pensate for the reduced saving rate of the households, result-ing in insufficient domestic savings to finance the stronginvestrnent process.
The restrictive measures adopted in 1989 together with a fur-ttrer worsening in expectations in reaction to the Gulf crisisallowed a slowdown in domestic demand which halted thegrowth in the trade deficit and stabilized the inflation rate,despite the temporary effect of oil price increases.
Nevertheless, some confidence about moderation of dise-quilib,ria, combined with the optimism associated with thespecial events of 1992, could restore the economy to a tem-porary new expansionary path.
The main goal for the economic authorities has been andshould be to maintain investors confidence in prospects forthe economy. That means that improved economic efficiencyshould be fanslated into productivity, and external competi-tivity gains, to allow a non-inflationary and sustained path ofeconomic growtlr"
A policy of wage moderation would conkibute to avoidingthe risk of a re-emergence of overheating in the economy.But, an incomes policy will not be effective in restraining in-flation if the growth of aggregate demand is excessive. Inthis raspecl a slowdown inreal wage costs wouldreduce thepressure on demand tlrough a reduction in the real dispos-able incomes of households and would positively affect thecost formation process. In a dral labour market such as existsin Spain, where wages are set in the perrnanent segnrent ofthe market, an incomes policy p'resumably has a more in-stitutional aim : to ensure, whether by persuasion or by legalcompulsion, a &gree of wage moderation that the non-com-petitive structure of the labour market is unable to produce.But it carmot replace the required reform of the labou mar-ket
On ttre otlrer hand, a policy of global wage moderation mightprove to be ineffective in damping inflation since employerswould be more ready to widen profits by simply increasingprices in a context of booming demand. In this respect, theslowdown of demard in 1991 has forced some moderation
Monetary policy has faced significant constraints. Condi-tions of shong extemal confidence and high interrest rateshave encouraged substantial capital inflows and have createdthe well-known dilemma between allowing the peseta to ap-

Executive Summary
preciate at lhe expense ofpreserving exchange rate stability(near the top of the ERM wide band) or continuing redrcinginterest rates, with the risk of an undesired domestic demardexpansion As Stage 2 of EMU approaches, the possibility ofan independent Spanish monetary policy response would befurther limited" But, as long as full nominal convergence has
not been achieved, monetary policy, although subject to con-straints, should remain restrictive.
Therefore, a major contribution from budgetary policy mightbe required However, there would clearly be both practical
Iimitations and drawbacks to an active countercyclical use offiscd policy. What is more, the key iszue for fiscal policywill not only be its role as a demand stabilizer but rather itsimpact on the supply side through the implementation of taxreform (lowering corporation tax relief, reducing the directtax burden on households, limiting tax fraud and indirect taxharmonization) and the reshaping of public expenditure(lower current expenditwe and sustained public investment).
The Economic and Financial Situation in Spain
PART ITHE ECONOMIC AND FINANCIAL SITUATION IN SPAIN
0. Introduction
The Spanish economy, after a long*awn-out and difficultperiod of adjustment in the 1970s and erly 1980s, showed
considerable dynamism in the second half of 1980s, withshong growth in employment output url - in particular - in-vestment, much of it financed by capital inflows. This dy-namism has partly reversed the previous steep fall in incomelevels in Spain relative to those in the Community as a
wholg but the counEy's income levels are still around Z)%lower than the EC average.
The recent period of dpamism has since 1988 been associ-
ated with a rising real exchange rate and the emergence of alarge current account deficit more than matched by capitalinflows - but also with an overheating economy and an in-crease in the inllation rate that only began to turn dowrrsomewhat after spring 1990.
This study seeks to analyse and explain these developments
in terrns both of pnvate sector behaviour and of economicpolicies, and to assess the challenges faced by the Spanish
economy as it moves towards 194 and the second stage ofEMU.
The first part reviews the supply-side factors underlyingSpain's riecovery, from the mid-1980s, after a very difficultdecade. It concludes that genuine zupply-side improvernentshave taken place, wen though they have not as yet been re-flected in a sharp acceleration in productivity. It also points,however, to a number of persisting structural deficiencies.The second part analyses tbe problem of macroeconomic sta-
bilization - in terms of demand, activity and inflation - un&rthe impact of supply-side developmenls and in the presenoe
of conshaints on policy. A following section assesses theprospects for the current cycle to enter a new phase in whichnominal disequilib,rium can be reduced while avoiding toostrarp a slowdown in activity so that earlier investrnent bears
fruit in higher productivity and an adequate return to foreigrtand domestic investors. An improvement in competitivenessvia greater mastery of domastic cost increases, coupled withan adequate budgetary policy, is identified as the key toachieving the degree of nominal convelg€,lrce necessary forSpain to enter Stage 2 with confidence. However, as thepen-ultirnate section of the report recalls, the process - inevitablya long one - of Spanish real convergerrce is likely to generate
new cycles in demand. The study reflects on the policiesavailable to react to such cycles, and points to the choices
that will have to be made in facing the challenge of carryingthe catching-up process forward while achieving the degree
of nominal convergenoe necessary for future stages of EMU.
1. Supply-side performance and challenges
The Spanlsh economy underwent a palnful adJustmentafter 1!174....
From 1985 to 1990 the growth of the Spanish economy(4.5% per year on average) was among the highest in the
Community. Theboom in investrnent arrd employment char-acterised ttris period, &ring which GDP per head caught-upfive percentage points compared to the EC average.
Nevertheless the present situation only represents a retum tothe relative levels of the first half of the 1970s. Between1975 and 1984, Spain lived tlrrough an exceptionally longand deep economic crisis. A new political and economic
model was taking shape at a time when the economy was zuf-fering 0re impact of the two oil shocks. Over ten years, fixedinvestment fellzz%,ernployment declined 15 96, consump-tion zuffered a long stagnation and GDP per head lost ten
p€rcentage points relative to the EC average.
During this period the Spanish economy was still charac-
terised by widespread non-marlcet behaviour of economicagents, trying to avoid competition and asking for publiczubsidies, a high degree of protectionism and large institu-tional rigidities in different markets.
As theunemploymentrate grew from 3 % nl974to229on1985, ttre public sector tried to maintain social cotresion and
support the costs ofreorganisation ofthe industrial and fin-
Greph l: Spdn: GDP per Crpltr PPS,
EUR12 = lfll
C-rLl- lo-t OGI' tt I ltttlc:Cc.Slnlrlr
The Economic and Financial Situation in Spoin
ancial sectors. The general goverffnent deficit, close to zeroin the first half of the 1970s, reached some 7 % of GDP in1985. Gross public debt rose from 12 7o of GDP in 1974 to45 Vo in 1985.
.... but the ground was belng prepared ......
At the end of 1982 the new govemment, enjoying a large ma-jority and initia[y backed by the trade unions, implementeda stability-oriented economic strategy in order to regain do-mestit: and extemal confidence.
After the &valuation of ttre peseta @ecember 1982), a morestringent monetary policy was implemented and an accelera-tion of the restucturing of the industial and financial rys-tems took place. The latter, together with the policy of wagemoderation, led to both an improvernent in productivity arda sharp deceleration in unit labour costs. This, in turn, re-sulted in a strong rccovery of the gross operating surplus per-mitting an improvement in the financial situation ofcompanies, and paved the way for a boost to inveshenL
Moreover the apparent rate of retum in the Spanish economyhas risen much faster than the EC average sirpe 1984.
The business climate benefited from worldwide economicexpansiorl the prospect of EC entry, lower real inte,rest ratesand the 1986 fall in oil prices. Moreover the hend towardeconomic liberalisation gained momentum with the supply-side economic reforms enacted in 1984-1986, notably in thefield of frnancial and exchuge controls and labour ma*etlegislationl.
EC entry led to the phased dismantling of extemal tariffs antto the introduction of the VAT, with an implicit widening ofthe tax base. As a result of some expenditure moderation and
increasing receipts, the general government deficit fell about4 perrcentage points, in terms of GDB to 3.2 % in I 987.
These changes under way consi&rably incr€ased the attsrc-tiveness of the Spanish economy for foreign investors notonly as a platform to reach the wider EC martet (tlpical ofUS andlapanese investrrents), hrt also as adomestic mutetin itself with an enonnous potential growth rrd high proc-pect of profitability. Foreign direct investment hcreesed itsrole in sustaining rapid economic growth and in mo&mizingindusEial structures, business management rnd know-how.
.- for a mqfor supply-sldc lmprovement...
During the six years to 1990, Spain achieved an impressiveinvestrnent performance (+ N% in rcal terms partially sup-pofied by a four-fold increase in rmports of capital goods),which laid the foundatiors for a stnengthening of the produc-tive base and for an acceleration of potentid growth. In thisperiod the manufacturing sector mo&rnised its productivestructure, even reorienting to sorne degree towards activitieswith higher capital content new areas of specialization anddiversification of products, ant becoming more involved ininha-industry EC trade.
The good results in recent years have permitted a shengthen-ing of the financial structure of the enterprise sector. Theself-financing rate rose by 20 percentage points between1983 ant 1988 and the dependence on bank crrdit has beensubstantially rcduced" Thus, in spite of a re&rctim in p,rofitsin 1990 aod 1991 Spanish enterprises remain in a financialposition which is much more solid than sonre years ago andcomparable to European competitors
Grrph 2: Cost Greph 3: Net Retura ol Nct Cepltrl StocfTotr! Economy (1973 = 100)
Sourcc: Commiseion Scrviccs. For.crsts Oct.-Nov. 9l for l99l
,! ra rl ra n ra r9 0 ] E at aa r aa ,, lt !t t0 t8
Temporary conhacts were introduced and an easing in the lay-offconditions afirched to these contrrcts.
The Economic and f,inancial Situation in Spain
Greph 4: Noorlnd compensetlor per cmplorcc(ennud pcrcetrlrtc chenge)
Grrph 5: GDP per person employcd(constrnl prlces, rnnuel % chenge)
Sourcc: Comrnisrion Scfviccs. Forccarte Oct.-Nov. 9l for l99lEUR -7: B, DK, D, R IRL, l. NL
t9ll nt, t9a! l9a{ r9ac 1116 t9a, ltaa t9ac tr90 lr9r
lm Du Ft2 tgrt l9u t9r5 t9t6 t9t7 l9m l9r9 1990 ml
The improved btrsfupss climate resulted in a large irrrease inemplo5rment (+LSVo in the six years to 1990), but it was ac-companied by a sharp increase in laborn market participationand an increase in the potential Iabour force. In consequence,the unemplolm.ent rate fell slowly and has now stabilisedaround l6%o,ltut without any apparent moderating influenceon the wage formation process.
The main feature of the rise in employment has been a re-mutable increase in temporary-conhact workers, especiallyin the service sector. Between 1987 and L99O,UEo of totalnew employment was located in the sen ice sector; 85% of itcomprised ternporary worters. That fact has had a double ef-fect Fint, the presenoe of a high strare of temporary workersmeans that firms have been able to moderate average som-pensation per wor&er during a period wben economic activ-ity has accelerated rapidly. Second, t€mporary workers haveexpanded employrent mainly in low-wage jobs in the ser-vice sectm, pulling down the averaga
At the same time, abigger increase of emplo5nnent inthe ser-vice sector, which is traditionally labour-intensive, than inthe industrial sector explains why aggregate productivitygrowth in fie uptum has beenmodesl
Unit lsbour cosB have been growing faster than in thosecountries in the narow band of the ERM since 1979. Intemrs of external competitiveness, higher growth of unit la-bour costs together with tlre nominal appreciation of thepeseta meant a s$stantial appreciation of the real exchangente and, therefore, a loss of competitiveness of Spanishgoods aDd services in the extemal ma*et, especially againstell industial countries (namely due to the US dollar fall).
In spite of the current productivity differentials, Spain'slower level of labour costs, comparcd with those of EUR 7,
still make it attractive for foreign inveshenL Moreover, an
appreciation of the rcal exchange rate (or, in other words, a
rpduction in competitiveness) is a feature of a "catching-up"procesll.
Greph 6: Rcrl eJfectlve cxchuge retcsULC totrl cconorny end cxporte deflrtor
n$ l9t, l9!t l9t9 1090
* uE-lql+ Iltott Dlr-tqt
- uE-nlqrurml* II,Oll Dtt-ttlc
trII ' rcrr !od! IGl9.19 ladsrh. oarhl*touI$ Coonldou lcnbr, h]ld 0ctsXor 9l h l99L
DS.D
n9l
The Economic and Financial Situation in Spain
..... that stlll needs to be carrled further.
Although great efforts have been made to eliminile rir-idities, some important structural constraints still exist
. The need for investment in infrastructure and social ser-vices is still very high. Combined with this is a need for te-chnological innovation, mqnagement modernization andrationalization of thc size of firus to be maintained.
. The opening-up of the economy as a reult of Spain joinfuU
the EC has seen import penetration rise. The s lare of outputgoing for export hos remained at a low levelinspite of gains
inEC markets.
. The greater opening-up has not affected all prodrctive sec-tqrs to the same extenl The semice sector, except for tou-rism, remains quite closed. The lack of externalcompetition in the service sector allows the existence of awide divergence of product prices and inflation as betr*reen
tradeables and non-tradeables. The persistence of a highcore of inflation pressures fmm services affects the wholeof the economy through the indexation of salaries to a glo-bal measue of inflation
. The expansion in the number of temporary worfters since1985 has actually magnified the degree of. segmentatbn inthe labour market. The rigidities are mostly embed&d inthat part of the market where permanent workers predomi-nate; they explain why rwmitwlwages luve not respondedto comparalively high levels of urcmployment utd at thesame time, contribute to the persistence of that level ofunemployment. The principal features are : evidence ofmismatch the difficulty of new entrantrs especially youngworkers in penerating the permanent sector of the labourmarket, reduced job search, and the compression of regio-nal pay differentials.
. Fiom the regional side, the problems of finding a job in lowactivity regions, and the obstacles to formal employmentcreation in the private sector in those regions, are exacer-bated by the structure of collective bargaining. Nationalcollective bargaining tends to be conducted within Orc highactivity regions; the transmission of national wage settle-ments from high-activity to lower-activity regions leads toa comparatively low degree of dispersion in regional wage
differentials. But unlike experi€nce in some other Europeancountsies, a more cen&alized collective bargaining has notcontributed to sorne disciplinary effect in wages growth. Interms of output levels, therecent upswing in economic ac-tivity has failed to prrodrce a hend towards regional conver-genca The diversity of performance between backward andp'roqperous regions has not been corrected. This re,presents
a fiscal brnden and limits the potential market of the gro'wing regions
. Although a significantreduction has been achievd the ge-neral govemment deficithas persisted. Atthe same time, ra-gional administrations have also had increasinglyimbalanced accounts which have been ur additional obs-
tacle to roducing the overall deficiL As regrds expenditure,the possibility of exceeding budgetary limits, the high levelof subsidies to public enterprises and a lack of efficientcontrol over expenditures are the principal features that stillexisl On the revenues side, the extensive fiscal fraud andthe long delays in achieving a consolidated tax system are
the main structural problems.
. From the comparison of Spanishfinancial institutiors withthose in other countries, they seem to have had traditionallyhigh€r ttran average intermediation margins. The multipli-city of buks and overb,ranching involve diseconomies ofscale. This, combined with overstaffing, has maintained thecost of channelling rtsourc,as at a high level. However, the
intensification of banking competition has caused, since1990, a ubstantial decline in intermediation margins
. The role of lhe Spanish Stock Exclnage in charurelling pri-vate sector savings towards inveshnent projects is a modestone. Moreover, the low level of market capitalization (pri-mary market) and the very limited volume of ransactions(secondary market) denote a clear lack of development inthe Sponish bond market, with the exception of the publicdebt market organized by the Bank of Spain.
These factors taken together are both symptoms ard causes
of the persistent grp between rpd incomes in Spain and those
in the richer member countries of the Community.
The Economic and Financial Situation in Spain
2. Problems of stabilization
An lmprovement ln supply prospects led to savlng-ln-vestment lmbalancc...
hom the fust half of 1988 onwards the Spanish economystarted to show signs of overheating which became more ob-vious in the following year. From 1986 to mid-1990, domes-
tic demand has been growing fast and progressively inexcess of output, reflected in a trade balance deteriorationand, from Spring 1988, causing a rise in inflation. Buoyantdomestic demand was pushed upwards not only by n"ryshong investrnent but also by private and public consump-tion
The high rate of ernployment creation, associated with accel-
erated economic growth, was reflected in a sustained rise inhousehold disposable income. This upward trend was reirt-forced by increases in non-labour income also. In addition,asset inflation resulted in a significant "wealth effect" forasset holders, while simultaneously diverting household ex-
penditure flows from investment into consurnption goods.
Finally, as consumer expectations turned markedly positive,
after several years of depressed economic condrtions, the
household saving rate fell.
... and the eoonomy overheatcd...
The incapacity of domestic saving to ltnance the srong in'vestrnent caused a growing current account deficit. The en-
ding of ttrc period of budgetary adjustment meant that publicsaving did not hcrease enough to compensate for the re-duced household saving rate.
The p,resence of very sffong domestic demand, while con-straints from productivity capacity left indigenous supplyunable to respond and to adapt quickly to the new require-
ments of the domestic market, caused a switch to external
sources. Thus, the shift in internal demand towards importedgoods sharply increased the hade and current account defi-cits. A substantial fall in tourism receipts (fromi.2%o of GDP
in 1986 to 3.8Vo in 1990) turther aggravated the deficit in the
current account balance.
At the same time as domestic demand was growing clearlyfaster than that of Spain's main trading parfil€rs, the reap-peiranc€ of accelerating inflation in the second half of 1988
togetler with a significant nominal appreciation of the peseta
caused a zubstantial loss of external competitiveness whichnegatively affected trade in goods and services.
On the other han4 one of the main underlying factors behindthe current inflationary p,rocess is the pressure from domesticdemand on services. That sector, which still remains veryclosed to external competition, is able to transmit excess de-
Greph 7: Componenis of Domestic Demend:Coniributlon to reel GDP Growth
a
a
0
.,It.o t9ar l9aa Dat lraa 19.6 ltaa lta, ltaa ltat rtF t l
Erurtor.Errl.r EErruf e[filr Eccr.
cr.lrtO tid od-Ir tt ao lrllcC.[Lart.rle
Greph E: Prlvrte Sector: Gross Sevlng rnd Investment Greph 9: Nct Lcndlng (+) or net borrowlng (.) by sector
It
l6
(r c eDr)l0r-I
c
1
2
0
-a
-l
-c
-t
l2
t0
I
19e{l t9a l9c2 l9!! t9!{ l9C5 l9t0 t9t7 l9tt l9C9 1990 l99l
Sourcc: Commission Scruiccs. Forccasts Oct.-Nov. 9l for 1991.(l) Corrcctcd for changcs to thc timing of tax rcPlymmts
(I ol 6DP)
19|0 l9ll t9l2 rru l9L 19$ ltta l9l, r9aa ltlt rr90 r99l
The Economic and Financial Situation in Spain
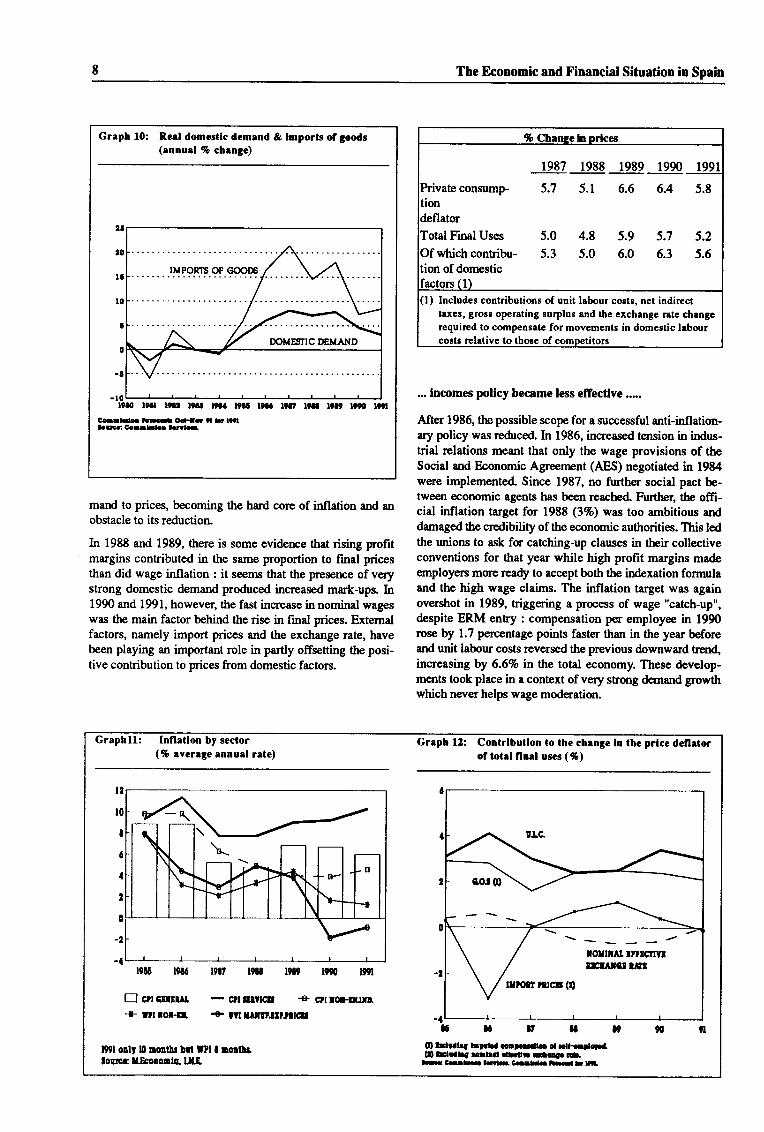
Greph l0: Reel domestlc demend & lmporls of goods(ennuel % chengc)
Co.llllc. lcroa G-tr i -! l'ltLGCcaaldcLrlc
-10' ' ' ' ' ' ' ' ' ' 'lrao t9a tta, t9at t9aa !t.. lraa t9tt ttaa t at lt90 t 1
mand to prices, becoming the hard core of inflation and anobstacle to its reduction.
In 1988 ard 1989, there is some eviderrce that rising prohtmargins contributed in the same proportion to final pricesthan did wage inflation : it seems that the presence of verystrong domestic demand produced increased mark-ups. In1990 and 1991, however, the fast increase in nominal wageswas the main factor behind the rise in frnal prices. Externalfactors, namely import prices and the exchange rate, havebeen playing an important role in partly offsetting the posi-tive contribution to prices from domestic factors.
.- lncomes pollcy became less effectlve..-.
After 1986, the possible scope for a zuccessful anti-inflation-ary policy was redrced. In 1986, increased tension in indus-trial relations meant that only the wage provisions of theSocial and Economic Agreernent (AES) negotiated in 1984were implemented" Since 1987, no further social pact be-tween economic agents has been reached Further, the offi-cial inflation target for 1988 (3Vo) was too ambitious anddamaged the credibility of tlre economic authorities. This ledthe unions to ask for catching-up clauses in their collectiveconventions for that year while high profit margins madeemployers more ready to accept both the indexation formulaand the high wage claims. The inflation target was againovershot in 1989, triggering a prrcess of wage "catch-up",despite ERM enEy : compensation per employee in 1990rose by 1.7 percentage points faster than in the year beforeand unit labour costs reversed the previous downward hendincreasing by 6.6Vo in the total economy. These develop-ments took place in a context of very strong demand growthwhich never helps wage moderation.
1987 1988 1989 1990
consump- 5.7 5.1 6.6 6.4 5.8
Final Uses 5.0 4.8 5.9 5.7 5.2
Of which contribu- 5.3 5.0 6.0 6.3 5.6tion of domestic
(l) Includes contributions of unit labour costs, net indirectt xes, gross operating surplus end the exchange rate changerequired lo comlrcnsste for movements in domestic labourcosts relative to those of comoeti
Graphll: Infletlon by scctor(% everege ennuel rete)
r9t5 l9t6 lgt l9tt t9t9 t990 l99t
E crrsrrrur - cnrtvrcr + crtrot*lJm-+ ra roi-Er. + m rillrrtrrrtclt
l90l ool, l0 Dollir Dlt l?l I rolthstocrce x.EcoooDlc LIE
Grrph 12: Contribullon to the chenge ln the prlce defletorof totrl flnel uscs (%)
O fdtallg lrDraa ca.r.t U- C xllr.rtrlfaO Erll.g rrlrC.rt Ur ctc!.. !!t
aa C-!h- l-te Cr.I bra I tt,
BO' q,
\-----torrru I'ltcttvlrf^f,eturt
The Economic and Financial Situation in Spain
... as flscal pollcy dld not respond ...
Uncertainty about the extent of overteating as well as abreakdom in the socid dialogug and tbe apparently com-fortable budgetary position achieved by 1988 (a primary bal-ance close to z€ro and a decline in Ore debUGDP ratio)resulted in a budget for 1989 that was clearly expansionary.
As a result domestic demand continued on an upward tendwith anannual growthrate above 8% in the finthalf of 1989.
During 1989, some restrictive measurcs were implenrntedin order to reduce the expansionary effects of the initial bud-geL These measuts (earlier payment deadlin€s as well as
higher advanced Payren$ of corporation taf and ircr€asesin wittrholding tax) augnrnted levenues in 1989. But sincethey were not accompmied by changes in income tax, theyimplied a reduction in revenue in 1990 and 1991.
In addition, after several annual rwisions to the saluies ofpublic worters and state pensions in line with official infla-tion targets which were lower than the acEal outtum for in-flation, the so-called "social debt" also had to be paid in1990.
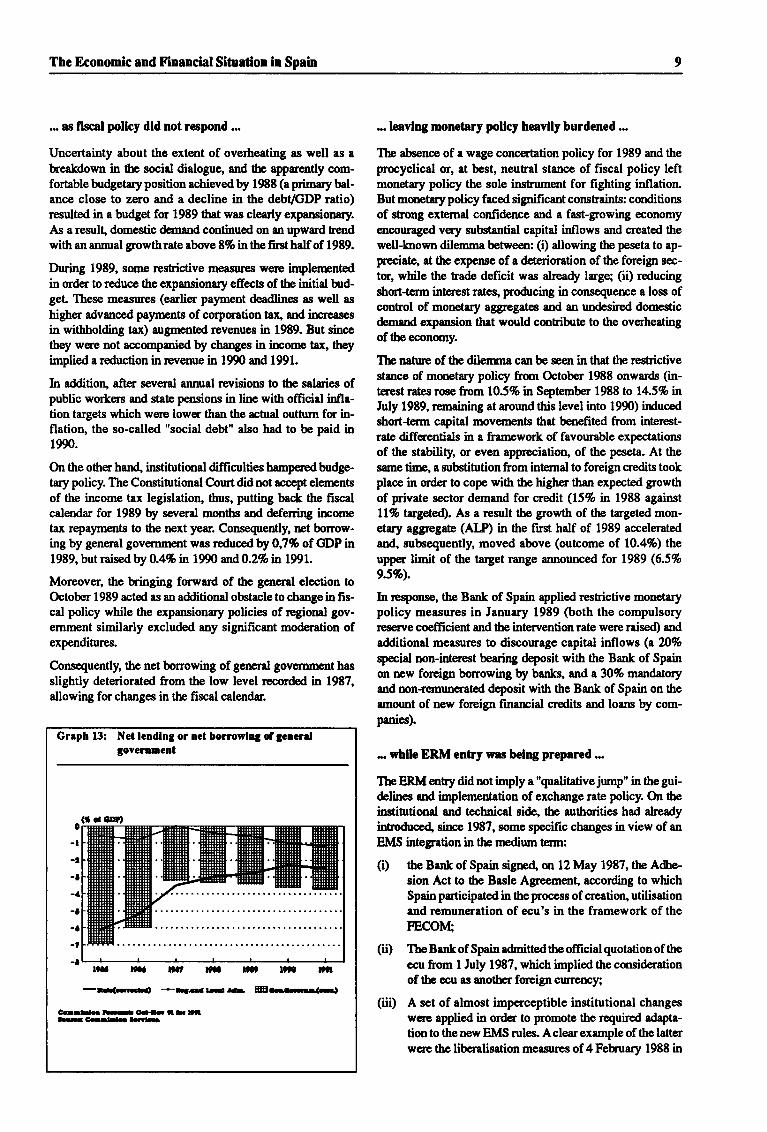
On the other hand" institutional difficulties hampered budge-tary policy. The Constitutional Courtdidnot accept elernentsof the income tax legislation, thus, putting back the fiscalcalendar for 1989 by several months and defenfury ircornetax repayments to the next year. Consequently, ret borrow-ing by general govemment was reduced by 0J% of GDP in1989,butraisedWO.4% in 1990 and0.2% in 1991.
Moreover, the b,ringing forward of the general election toOctober 1989 acted as ur additional obstacle to change in fis-cal policy while the expansionary policies of regional gov-emment similarly excluded any sigrrificant moderation ofexpenditures.
Consequently, the net borrowing of gemal govemmenthasslightly deteriorated from the low level rpcorded in 1987,allowing for changes in the fiscal calendr.
Grrph 13: Nct lendlng or net borrowhg of 3ocrdgovertrEctrt
l9aa rxa lt? rtaa l,, l'I rtr
-E(Eraa +-arat-r aar ffi.F-T--(cJ
Gart txrr-O.H,iltlitaG$rra-lclr
-. lcavlng monetary pollcy heavlly burdened ...
The absence of a wage concertation policy for 1989 and theprocyclical or, lt best, neutral stance of fiscal policy leftmonetary policy the sole instrument for fighting inflation.But monetry policy faced significant constraints: conditionsof strong external confidence and a fast-growing economyencouraged very zubstantial capital inllows and created thewell-lnown dilemma betweem: (i) allowing the peseta to ap-preciate, at the expcnse of a deterioretion of the fonaigr sec-
tor, while the trade deficit was alresdy large; (ii) reducing$ort-t€rm int€rest rates, pro&cirU in consequence a loss ofcontrol of monetary aggregates and an un&sired domesticdemurd exprnsion that would contribute to the overheatingof theecononry.
The nature of the dilenme can be seen in that the restsictivestance of monetary poliry frorr Octob€r 1988 onwards (in-t€rest rates rose from 105% in Septerrber 1988 to 14.5% nJuly 1989, remaining at arotmd this level into 1990) furtucedshort-term capital movements that benefited from interest-rate differentials in a framework of favourable expectations
of the stability, or even appreciation, of the peseta. At the
sanrc time, a substitution from internal to foreign credits tookplace in order to cope with the high€r than expected growthof private sector demand for credit (L5% ln 1988 againstLl% tzr;se[ed|). As a result the growth of the targeted mon-erary oggregate (ALP) in the first half of 1989 acceleratedand, zubsequently, moved above (outcome of 10.4%) theuppet limit of the target range ulnounced for 1989 (6.5%
9.5%).
In respmse, the Bank of Spain applied restrictive monetarypolicy measures in January 1989 @oth the compulsoryreserrre coefficient and the inte,nention rate were raised) utdadditional measures to discourage capital inflows (r ?i%qpecial non-interest bearing deaosit with the Bank of Spain
on new foreigrr borrowing by banks, and a 30% mandatoryand non-remunerated deposit with the Bank of Spain on theunount of new foreign finarrcial cr€dits and loans by com-panies).
-. whllc ERM cntry was beLry prepared...
TheERMentry6i6a61imFly a "qualitative jump" in thegui'delincs and imple,mentation of exchange rate policy. On the
institutional and t€chnical side, the authorities had alreadyintroduae4 since 1987, some specific changes in view of an
EMS integration in the npdium t€rtrl:
(0 the Bank of Spain sigred, on 12 May 1987, the Adhe-sion Act to the Basle Agreement according to whichSpain puticipated in the process of creation, utilisationand remuneration of ecu's in the framework of theFECOII4
(ii) The Bank of Spain afuitted the ofticial quotation of the
ecu from I July 1987, which implied thp considerationofthe ecu as another foreigrr currency;
(iii) A set of almost imperceptible institutional changes
wae applied in ord€r to promote ttrc required adapta-
tionto thenewEMS rules. Aclearexample of the latterwere the liberalisation measures of 4 Fehruary 1988 in
10 The Economic and Financial Situation in Spain
the exchange martet that supprassed the interventionistprocedures, theprominentrole sf ths f,ank sf Spain andthe zubstitution of the US dollar by tbp DM as the in-tervention currencll
... and constralnts were lncreaslng.
On the policy instnrment side, tb efficiency of monetar5rpolicy has been increasingly constrained since 1986 by ex-change-rate developments in combination with some lib-eralization of capital moyements. In particular, during1986-87 the monetary authorities se€m€d to be watching theDI\4&ta rate closely and from Feb,nrry 1988 to Iure 1989the peseta was already I "de facto" member of the systemwhen the Bank of Spain shadowed the ERM snd intervenedin the exchange markets accordingly. When the new ex-change market inte,lrention system was introduced in Fe-b,tuary 1988, the authorities decided to fix a central ratevis-tr-vis the DM with a +14% fluctuation bands. Officialststem€Nrts prompted the markets to produce, in effecl adownward realignnrnt of the pesefa in tbe months leadingup to official ERM entry.
It was thus peftaps in the period leading up to ERM entrythat monetary policy was most constsained. Inflationarypressures were building up in 1988 and tbe frnthalf of 1989.The initial inflation target for 1989 (of 3Vo) htd first to berevised to 5% and then abandoned. This situationcould havebeen counterbalanced through a policy of wage moderationand a morp restrictive fiscal policy. Considerations of short-te,nn stabilization would - in the absence of assistarrce frocrfiscal or other policies - have pointed to a tighter moretar5lpolicy that if maintaine4 would have inevitably induced asipificantly higher rate for the peseta" However, the auth-orities hadERMentry inmin{ ents5r at ahighratemightnothave been compatible with the medium-term needs of theSpanisheconmy.
A dilemma of this sort may imply that the concept of the"right" raie for entry is irrelevant Enrbracing ttre ERM disci-pline wi0r all its credibility advantages ratber implies tha! ina dynamic economy, any elrtry rate means accepiing policyimplications in otber areas.
The decision to enter the ERlvf, on 19 June 1989, according-ly ernphasized the need for a tighter stance of fiscal policiesand for additional support to monetary policy. As arcsult, inearly July 1989 the Governrrent and the Bank of Spain ap-proved additional restsictive fiscal and monetary measuresand intoduced a system of credl'f ceiliags for ewh individualbank Tbese measures proved to be effective in deceleratingdomestic d€mand in 1989 Q.8%) and though L99O (4.6%),and so the authorities lifted the credit ceilings on 1 Ianuuy
1991 and the mandatory deposit on foreigrr bo,rrowing inMuch.
Entry into the ERM immediately reduced short-term capitalmoverents of a speculative nature since the expectations offurther appreciation of the peseta were frustrated, but up-gradd tbe status of the currency vis-l-vis intemational in-vestms and attacted more permanent capital flows given thepreveiling high interest-rate diffe,rential. By the time of entry,inflation had already accelerated but demand pressures wene
dready at or near their peak Thereafter, the position of thep€seta near ttp top of the band undoubtedly contributed tocontaining, and ultimately reducing, the inflationary prass-ures already existing.
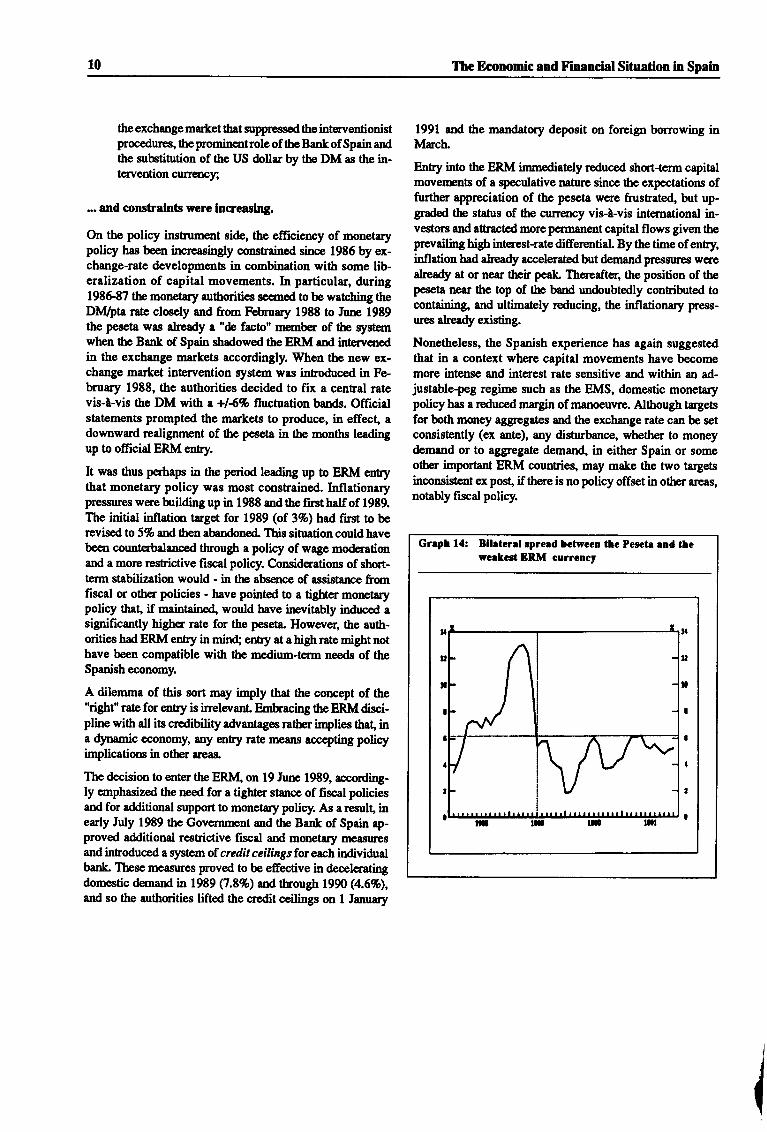
Nonetheless, the Spanish experience has again suggestedthat in s context where capital movements have becomemore intense and interest rate sensitive and within an ad-justable-peg regime such as the EMS, domestic monetarypolicy has a reduced margin of manoeuvre. Although targetsfor both mmey aggregates and the exchange rate can be setconsistently (ex ante), any disturbance, whether to moneydemand or to aggregate demand, in either Spain or someotber important ERM countries, may make the two targetsinconsistent ex post ifthere is no policy offset in otlrer areas,notably fiscal policy.
Grept l{: Blhtcrel spreed betreen the Pcsetr rnd lhewcrlcst ERM currency
,r
tt
!0
I
a
t
,
0
The Economic and Financial Situation in Spain ll
3. The pursuit of convergence as EMUprogresses
Nomlnd dlsequlllbrla are belng reduced ...
The restrictive measures adopted in 1989 started to ov€r-come the main disequilib,ria in the Spanish econmry in the
course of the following years. The Gulf Ctisis an4 conse-quently, a firther wors€ning in expectations also helped inthe acljusfirent Thuq the main feature of Spain's economicperformance in 1990 and 1991 was r slotvbwn in bmesticdemand which halted the growth in the hade deficit andslightty redrced the i$lation rate, despite the tempmary ef-fect of oil price increases.
The improved trend in the trade balance (from -6.3% of GDPin 1989 to -5.4% in 1991) was made possible by lowergrowth in the imports of capital and intermediate goods as
well as by tbe slowdown in domestic demand and the emer-ge,nce of extemal martets - Spanish trade has been positivelyaffected by Crerman unification'- which have raised exports.Nevertheless, the current account deficit remained above 37o
of GDP due, mainly, !o structural problems in the tourisnrsector.
Behind these trends remain serious imbalances whichtbreaten short-term prospects for the economy. Within do-mestic dernand equipment investment appea$ to be particu-larly sensitive to the restrictive measures and thedeterioration in expectations, while building investnent re-mains zupported primadly by public sector activigr and con-srmption growth in nondurable goodsrernains high"
The deceleration in domestic desrand has not been suffici€ntto dampen the hard core of inflation Services prices (+9.9%
in the twelve months to October 1991) are i&ntified as themain source of inflationary pressure. At the same time, lowerdemand as well as thereappearance of internal costpressureshas squeezed profitability, rasulting in a slowdown in invest-ment and in a deterioration in the previously favourable ern-ployment trend (employment grew only by 0,5% in thesecond half of 1990, and did not change in the frst half of199r).
.- but rlsks perslst both ln the short term and ln thelong term.
Some confidence about moderation of disequilibria, com-bined witr the optimism associatedwith the special events of192 - Spain will host the Olympic Games arrC the UniversalFair - couldrestore the economy to a temporary nqv expan-sionary palh. If, however, economic agents have not changedtheir previous patt€rns of behaviour, it will be very likely that
a further serious adjustment will be necessary theneafter.
The sharp increase in salaries in 1990, followed by insuffi-cient wage moderation in 1991, is carsing a shift in inflation-ary pressures from the demand side to the cost side. Despitea slowdown in economic growth, the improverrent in nomi-
nal convergence could be lower than reqired. The rise in in-direct taxes planned for January 1992 and January 1993
could delay further a rapid re&rction in the inflation rate.
The main goal for the economic authorities has been andshould be to maintain the internal and external confidence inprospects for the economy, avoiding a situation in which expost rehrnrs or investments re depressed. Improved econ-omic efficiency shouldbe &anslated in themedium term intoproductivity and external competitivity gains, to allow a
non-inflationary and sustained path of economic growth.
However, an improvenrnt in competitiveness would dlowextemal demand to more actively support domestic prodtc-tion" The required stability in the exchange rate after thepeseta's entry into the ERM means that competitivenessmust be maintained in the labour martet ttnough control ofthe treNrd of domestic unit labour co$s relative to competi-tqs.
Areduction in the inflation rate, transnritted to costs, wouldhelp the tradeable sectors of the Spurish economy to expandtheir $ale of extemal martets.
Thc crdibility of anti-inflationary policy has played an im-podant role in therecent prosperous period and it has been
reinforced by ERM entry. The efforts to follow a crediblepath towards nominal convergence with the more stablecountries has been a condition "sine qua non" for triggeringthe zuccessful catching-up process. Nevertheless, it is essen-
tial to ensure that the catching-up prcess is sustainablq i.e.consistent with nominal stability so as to avoid the risks of anirregular "stop-go" path in economic growth.
In any case, the catching-up already achieved by conzump-tion in drnable goods and investrnent in equipment, suggests
that a new shong recovery will not induce so high a growthrate in domestic demand and, consequently, the same level ofdisequilihia as experienced in the late 1980s.
Structural lmprovement ls stlll ncoessary:
As far as supp$-side policy is corrceme4 the flexibility ofthe diffenent martets fo,r factors of poduction in Spain has tobe firther enhance4 dong the lines suggested in earlier sec-
tions. Special attention should be paid to eliminating rig-idities in the permanent workless' segment of the labourma*et and !o inhoducing higher competition levels in the
service sector, namely, in transport, communications and
health care services" Moreover, other policies of a structuralnature should also be implemented in order to introducegreater price discipline in the non-tradeable sector of theeconomy.
The successfirl implenrentation of this policy would irrreasethe overall efriciency of the economic system paving the wayfor higher expected r€turns on real capital, encouraging in-vestment (which initially contributes to demand but not tosupply), and for more optimistic real income expectations,
2 Spanish exports of goods to Germany ro*by 23% in 1990 arrd399o in the first ten months of 1991.
t2 The Economic end Financial Situation in Spain
leading to redrced savings ratios. Thus, such supply-side im-provernents might also trigger a renewed demand boom.
Wage moderatlon ls deslrable.
A policy of wage moderation would conhibuteto aoidingthe risk ol a re-emergence of overheating ia the ecornmy,and help the convergence process as has been the case in anumber of other ERM countries. Such a policy could involveagreements, extending over otre to thee yean, and difreren-tiated according to sectoral andregional p,rodrctivity levelsA slowdown inreal wage costs would redrce the pressure ondemand though a rpduction in the real disposable incoresof households and would positively affect the cost formationProqess.
But, a policy of global wage moderation might prove to beineffective in damping inllation since employers would bemore ready to widen profits by sirnply increasing prices in acontext of booming demand. The slowdown of demand in1991 offers a good opportunity to pursue this moderationOne possibility worth considering could be that both em-ployers and employees should be ready to accept that a partof their revenues would be devoted to build up pensionsfunds and to finance training courses to cope with the labourmarket mismatches.
Monetary pollcy must be kept tlght ...
In 1991, the constraints on monetar5l policy have becomemore evident as very heavy net long-terur capital inflows(24.5 bn$ from January to September 1991) have tended tointerfere with the implernentation of the ligidity control inthe economy. The continuous stnength of the peseta in theERM and some moderation in inflationary pressur€s led to areduction in interest rates by between two and thee points inthe fust half of the year.
As Stage 2 approaches, the possibility of an independentSpanish monetary policy response would be further limitdby full capital liberalization' and a move to the narrow ERMband. Credibility of the stability-oriented Spanish economic
policy would however be rcinforced and the parity-grid ofthe pre-1991 period would be more credible for economicop€rators even in the presence of short-term prospects ofeconomic divergence vis-l-vis ERM counhies in t€rms ofdomestic demand growth, price-inflation and current ac-count widening. As long as full nominal convergence has notbeen achievd monetary pohcy, although subject to con-stsaints, should remain restrictive.
... medlum.term budgetary ecflon b necded and f,scalreform remalns lmportant
Amajor contribution from budgetary policy to counteract eperiod of nominal divergencc in output and price perfor-mance might be required. Howerrer, there would clearly beboth practical limitations and drawbacks to an activecountercyclical use of fiscal policy.
Eirst countencyclical changes in tax rates or experditures uelikely to be inimical to the zupply-sida Moreover, the pro-cess of closer monetary integration will force all membercounhies towards sonp form of (nef) tax competition Sec-ond" fiscal fire-tuning may become procyclical rather thanstabilizing since inadequacies in forecasting, the existenceof lags and uncertainty about the final impact of frscal policymay appear. Thir( the proce.ss of regionalisation inaugur-ated in the 1978 Constitution has led to some &gree of fiscalfederdism in which thp control of the central authorities overexpenditure magnitudes fm the public sector as a whole hasbeenredrced.
The key issue for fiscal policy will not only be its role as a
demand stabilizer but rather its imprct on the suppty sidethough : (i) the implementation of the tax reform wouldre-duce tax frau4 the deductions allowed to the corporation taxand the tax burden for households and would harmonize in-direct taxes with the EC; (ii) thereshaping of public expen-diture - narnely subsidies to corporations - to diminish theweight of cururt expenditure and to maintain public invest-ment so as to improve the supply-side of the economy.
3 Recently, economic authorities have announced the rernoval of the remaining capital movements rcstsictione before lanuaryL992.
The Economic and Ftnancial Situation in Spain l3
4. Summary and conclusion
Spain has in recent years enjoyed a period of strong growth,sparked mainly by the important stnrctural changes thatpreceded and accomprnied the country's accession to theCommunity.
Although this dynamism - reflected in particularly sfonggrowth of investment - can be expected to prodrce, event-udly, a sharp improvement in productivity and potential out-put its manifestation has so far beeir largely in an expansionof de,rnan( together with strong growth in employment, not-ably in services.
Demand in the Spanish economy ran atpad of shoil-termpotential, pmducing a real appreciation of the peseta and theemergence of a large curqrt-aecount deficit The very srb-.stantial catching-up in consumption, mainly for durablegoods, and investment which already occurrcd during thesecond half of tbe 1980s zuggests that growth in the next fewyean is likely to be le.ss hectic than experienced in the p€dodfollowing accession to the Community. In consequence, therisk of rc-emergence of disequilibria on the scale experi-enced in the late 1980s will be much less. What is more, thepersistence of existing imbalances and the requirements forentry to EMU preclude any possibility for expansionaryeconomic policies. So, while growth will remain above the
Community average (real GDP should expand at a rateslightly abve3Vo in 1992), the economy can now be said tohave entered a new phase in which real activity and employ-ment will expand at a more moderate pace. It might be ex-pected that recent reductions in both the current account&ficit and the inflation rate will be canied forwar4 this lat-ter after absorbing the effect of TVA increases. A pe,rnature
relaxation of policies combined with expectations linked tothe special events of 1992 could lead to an undesirable "stop-go" process, in tum putting long-terrr capital inflows at riskThe key to avoiding such an outcome lies in an improvementof competitiveness via greatermoderation of domestic costs,a process in which the expectations-shifting impact of theERM will play arola
In any evenf the spurt in growth in recent years has not yetrestored the relative income level (vis-i-vis EC parhers) ofthe early 1970s. This reflects both the accelerated growthmomenh,rm in the core Community countries and the nega-tive effect of remaining structural deficiencies in Spain.These persist in labour markets, in public financg in u in-adequately competitive stnrcture of many sectors, most not-ably senices, including financial services. Such stnrcturalimprovements would lead to an increase of productivity andcompetitiveness which, in turn, would permit the currentprocess of real and nominal convergence to be maintained.
14 Statisthal Annex
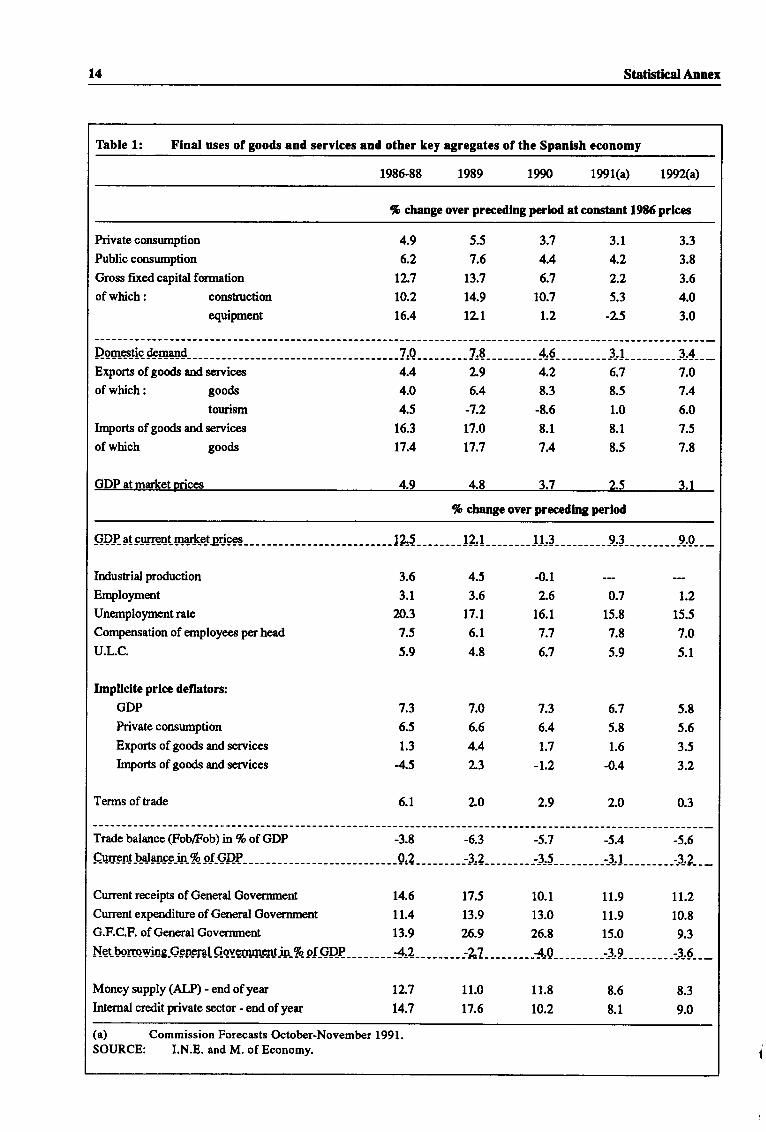
Thble 1: Flnal uses ofgoods and servlces and other key agregates ofthe Spanlsh economy
1985-88 1989 1990 1991(a) 1992(a)
% change over precedlng perlod at constant 1986 prlces
Private consumption
Public consumption
Gross fixed capital fcrnation
4.9
6.2
12.7
10.2
16.4
5.5
7.6
t3.7
14.9
tz-L
3.7
4.4
6.7
to.7
t.2
3.1
4.2
2.2
5.3
-2^5
3.3
3.8
3.6
4.0
3.0
of which: construction
equipment
Exports ofgoods and services
ofwhich: goods
tourism
Irnports of goods and se,lvices
of which goods
GDP atmartetoricqs
4.4 2.9
4.0 6.4
4.5 :7.2
4.2 6.7 7.0
8.3 8.5 7.4
6.0
7.516.3
17.4
4-9
17.0
17.7
4-8
-8.6
8.1
7.4
7-7
1.0
8.1
8.5 7.8
2-S q_1
% change over precedlng perlod
Industrial production
Employment
Unemploymentrate
Compensation of employees per head
u.L.c.
Impllclte prlcc deflators:
GDP
Private consurnption
Expods ofgoods and services
Irnports ofgoods and serrrices
Terms of trade
3.6
3.1
20.3
7.5
5.9
4.5
3.6
t7.t6.1
4.8
{.12.6
16.1
7.7
6.7
.i,15.8
7.8
5.9
-
t.,15.5
7.0
5.1
7.3
6.5
1.3
45
6.1
7.0
6.6
4.4
2.3
2.O
7.3
6.4
t.7
-1.2
2.9
6.7
5.8
1.6
-0.4
2.0
5.8
5.6
3.5
3.2
0.3
Trade balance (Fob/Fob) in % of GDP -3.8 -6.3 -5.7 -5.4 -5.6
Current receips of General Gover:unent
Current expenditure of General Govertrment
G.F.C.F. of General Governrnent
t4.6
11.4
17.5
t3.9
10.1
13.0
11.9 tt.z11.9 10.8
15.0 9.313.9 26.9 26.8
Net_bsr-o_w-Eg-Qpsal_9-ojy@srsrrt-r$_96-.o-f_QD_P_---- __-:!2__---_-__-27--------_{,0____---_-:-3_.9_____-___:3_.f___
Money zupply (ALP) - end of year
Intemal credit private sector - end of year
12.7
14.7
11.0
17.6
11.8
t0.2
8.5
8.1
8.3
9.0
(a) CommissionForecasteOctober-November1991.SOURCE: I.N.E. and M. of Economy.
Statistical Annex t5
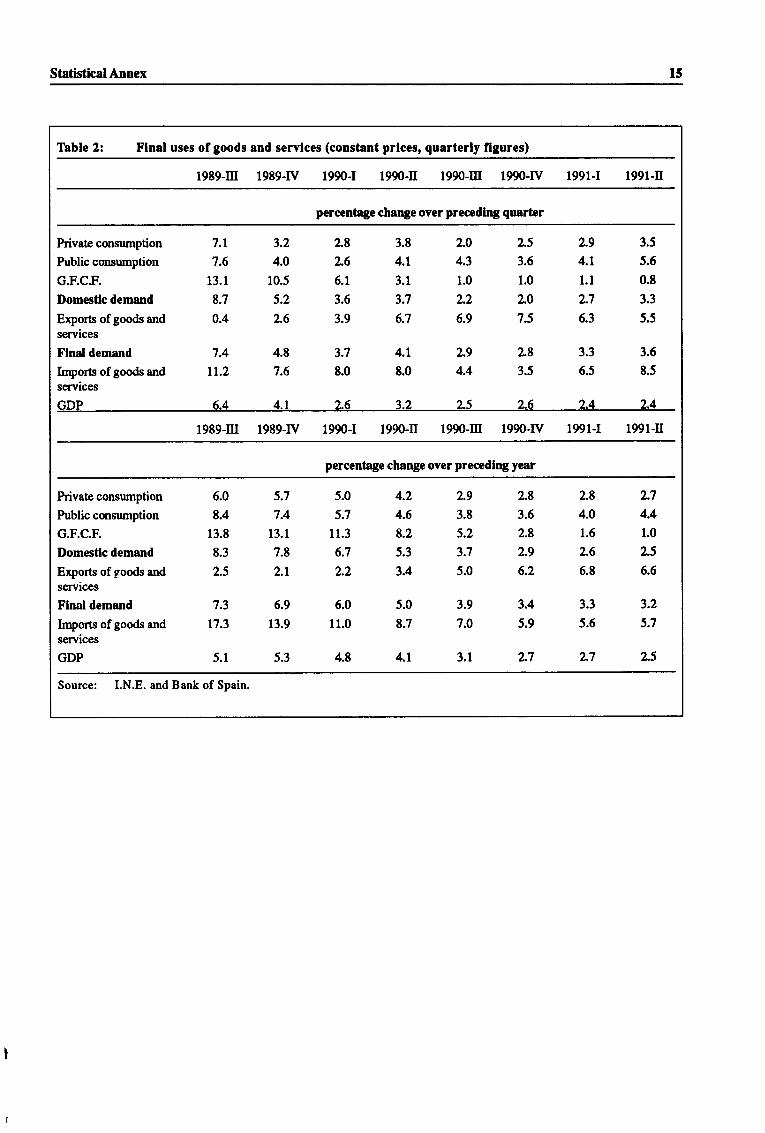
Table 2: Flnal uses ofgoods and servlces (constant prlces, quarterly flgures)
1989-m 1989-rV 1990-1 1990-tr r990-m 1990-rV 1991-1 1991-II
percentage change over precedlng quarter
Private consumption
Public consumption
G.F.C.F.
Domestlc demand
Exports ofgoods andserrrices
Flnal demand
Imports of goods andservices
7.1
7.6
13.1
8.7
0.4
7.4
tt.2
3.2
4.0
10.5
5.2
2.6
4.8
7.6
2.8
2.6
6.1
3.6
3.9
3.8
4.t3.1
3.7
6.7
2.0
4.3
1.0
2.2
6.9
2.5
3.6
1.0
2.0
7.5
2.9
4.1
1.1
2.7
6.3
3.5
5.5
0.8
3.3
5.5
3.7 4.1 2.9 2.8 3.3 3.6
8.0 8.0 4.4 3.5 6.5 8.5
cDP 6.4 4.1 2.6 3.2 2.5 2.6 2.4 2.4
1989-Itr 1989-rV 1990-1 1990-tr 1990-m 1990-W 1991-1 1991-tr
percentagc change ovcr preccdlng year
Private consumption
Public consumption
G.F.C.F.
Domesdc demand
Exports of goods andservices
Flnal demand
Imports ofgoods andservices
GDP
6.0
8.4
13.8
8.3
2.5
7.3
17.3
5.1
5.7
7.4
13.1
7.8
2.1
6.9
13.9
5.3
5.0
5.7
I 1.3
6.7
2.2
6.0
11.0
4.8
4.2
4.6
8.2
5.3
3.4
5.0
8.7
4.1
2.9
3.8
5.2
3.7
5.0
3.9
7.0
3.1
2.8
3.6
2.8
2.9
6.2
3.4
5.9
2.7
2.8
4.0
t.6
2.6
6.8
3.3
5.6
2.7
L74.4
1.0
2.5
6.6
3.2
5.7
2.5
Source: I.N.E. and Bank of Spain.
16 Statistical Annex
Thble 3:
Total employment
Agriculture
Lrdustry
Conshtction
Serrrices
Total wage and salaryearners
Agriculture
Industry
Construction
Serrrices
of which
Permanent contracts
Agriculture
Industry
Construction
Serrrices
Flxed term contracts
Agriculture
Industry
Construction
Services
Employment evolutlon(% change over precedlng year)(a)
2.8
-3.0
0.6
11.9
4.0
-L3-t6.2
4.t-3.76
0.1
32.7
18.5
29.3
4.534.7
4.L
-7.6
4.3
8.7
6.3
6.0
-14.8
4.3
11.3
8.3
1.6
-9.04
-0.5
0.4
3.7
19.0
-n.023.9
23.9
25.7
1.7
-&1
0.7
6.1
3.6
3.7
L5t.46.1
4.5
- 1.1
-5.92
-2-l
1.1
4.6
15.9
tt.212.6
10.9
2fi.4
15.1
-10.1
4.0
36.4
2n.9
-L7-n.t
-9.8
-5.0
3.7
87.2
tt.779.6
108.8
107.8
19elo)
0.5
-8.2
-3.2
5.0
3.3
-1.8
-3.9
-5.8
- 1.1
o.4
9.8
L2.2
5.3
6.5
t2.7
Tochange
8.9
-n.23.3
32.O
16.0
t.7
4.2
-3.1
3.0
3.6
4.6
-1.0
1.1
13.8
5.8
(a) IV Quarter figures.(b) tr Quarter figures.SOURCE : BPA - Bank of Spain.
Statistical Annex 17
Table 4: Prlces (yearly changes ln %)
1986 1987 1988 1989 1990 1991
General CPI
average (b)
end ofperiod (b)
General CPI without energy and
non+laborated food products (a)(b)
Services in CPI (aXb)
Private conzumption deflator (c)
GDP deflator (c)
Export prices (c)
Import prices (c)
8.8
t.3
9.0
10.8
8.5
10.5
-1.7
-14.5
5.2
4.6
5.2
8.0
5.7
5.9
2.6
0.8
4.8
5.8
6.1
7.6
5.1
5.6
3.1
1.1
6.8
6.9
7.t9.2
6.6
7.O
4.4
2.3
6.7
6.5
6.1
9.7
6.4
7.3
1.7
-1.2
6.0
5.5
6.2
9.9
5.8
6.6
1.6
-0.3
1988-1 1988-II 1989-1 1989-tr 1990-1 1990-tr 1991-I
Consumer price index (a) annual % change
General
General without energy and non-elabor-ated food prod.
Servlces
Residential property
Hedth care
Intercity public Eansport
Leiswe
Tourism
Housing services
Urban transport
4.4 5.8 7.1 6.9 5.5 6.5 6.2
5-4 5.1 7-O 7.1 6-7 6.1 6.3
6.3
9.0
5.5
9.0
7.2
6.6
8.5
8.3
9.2
3.8
5.9
7.4
9.7
7.7
8.4
8.0
3.4
5.7
8.8
I 1.1
4.6
8.6
8.0
5.1
7.3
9.2
8.0
4.9
8.3
9.9
9.7
6.6
9.7
1 1.1
3.2
6.4
10.5
8.2
6.3
10.1
13.4
6.8
6.3
12.5
6.8
7.1
9.7
10.5
13.4
(a) End ofperiod.(b) Only l0 months for 1991.(c) Commission forecasts Oct.-Nov. 1991 for this year.
Source: I.N.E. and Bank of Spain.
It Statistical Annex
Thble 5: Contrlbutlon of the change (%) oJ the prlce deflator of total flnal uses
1987 1988 1989 1990 1991(c)
Unit labour cost norn(adj.) (a)
Gross operating surplus (adj.) (a)
Ind tax net subv.
Import prices
-lnport prices excl. norn eff. exch. rate
-Nom. eff. exch. rate
Total flnal uses
-Domestic factors (b)
3,0
1,6
oA
0,1
0,0
0,1
5,0
5,3
2,4
2A
-0,1
0,2
0,7
-0,5
4,8
5,0
2,5
2,5
0,8
0,4
1,1
-0,7
5,9
6,0
3,4
2A
o,2
-0,2
0,4
-0,6
5,7
6,3
3,0
2,1
0,4
-0,1
-0,1
0,0
5,2
5,6
(a) Excluding imputed compensation of self-employed.(b) Domestic factors include contributions of unit labour costs, net indirect taxes, gross operating surplus and
relative unit labour costs in national currency(c) Commission forecasts October-November 1991.
Table 6: The balance of payments ln Spaln (as % of GDP)
1986 1987 1988 1989 1990 l99l(a)
Trade balance
Service balance
Transfer balance
Current balance
Long-terrr capital balance
Baslc balance
Short-term capital balarrce
Central reserves change
Memorandum ltems:
Cenhal foreip reserves
Foreign dett
-L44.1
0.4
2.1
-0.6
1.5
-0.1
1.1
5.0
9.8
-3.9
3.5
0.8
0.5
3.3
3.8
0.3
4.9
10.0
9.1
4.72.7
1.1
-0.9
2.9
2.O
0.2
2.8
11.5
9.2
-6.4
2.3
t.2-3.0
4.5
1.5
-0.1
t.2
11.0
8.5
-6.0
1.8
1.0
-3.2
3.9
o.7
0.0
t.7
10.6
8.7
-6.0
1.8
1.4
-L86.2
3.4
0.4
2.4
12.2
10.4
(a) - Estimations.Source : Bank of Spain - Cash register
Statistical Annex 19
Tbble 7: Imports and exports ln volume terms (% annual growth)
1986 t987 1988 1989
Imports
Total
Non+nergy products
Exports
Total
Non-energy products
16.7
23.8
26.0
27.0
18.5
21.9
16.8
17.8
4.7
5.1
9.2
10.8
tL212.4
1991(a)
10.0
10.9
12.2
t2.9
Accumulativegrowth89/91
109.5
124.r
7.6
8.2
7.0
7.3
(a) - Only 10 monthsSource: M. of Economy.
Table t: Geographlcal breakdown of goods trade
A.Imports of goods(% of total imports)
1986 1987 1990 1991(a)Difference
85/91
22.0
23.0
-L91.2
0.5
1.6
-t2.6
From:
OECD*EC* EE.IJU.* Japan* Others OECD
New ind. counties
OPEC
56.5
36.6
10.9
3.4
5.7
1.0
20.0
71.8
50.5
9.9
4.9
6.5
1.6
1 1.1
73.9
54.5
8.3
4.5
6.6
2.2
9.5
77.5
56.8
9.0
5.1
6.6
2.6
6.7
77.7
56.9
9.t4.8
6.9
2.4
7.5
78.7
59.5
8.4
4.4
6.4
2.3
7.2
78.5
59.6
8.0
4.6
6.2
2.6
7.4
B. Exports of gmds(% oftotal exports)
OECD*EC* EE.tru.* f.pan* Others OECD
New ird countries
OPEC
69.9
52.1
9.9
1.3
6.6
0.9
7.2
77.4
60.5
9.2
1.1
6.7
0.9
5.6
79.3
63.7
8.1
1.1
6.4
1.0
4.5
80.9
65.6
7.9
1.2
6.3
1.4
4.5
81.6
66.9
7.5
1.2
6.0
1.2
3.9
82.1
69.3
5.8
1.1
5.8
1.1
3.5
82.5
71.3
4.9
1.0
5.3
1.3
3.4
1990 1991(a)Differencc
8s/991
12.6
19.2
-5.0
-0.3
-1.3
0.4
-3.8
(a) - Only 10 months.Source: Bank of Spain (Customs basis).
2A Statistical Annex
Imports of gmds(/o of totalimports from the EC)
Table 9: Geographlcal breakdown of Spanlsh lntra-communlty trade
1985 1986 t987 1988 1989 1990 1991(a)Accumulative nominalgrowth 198511999 (%)
Germany
Belgium-Luxernb.
France
Denmark
Greece
hland
ItalyHolandPornrgal
UnitedKingdomTotal EC
29.01 30.09 29.63
4.49 5.21 5.80
25.75 23.81 '1.t51.25 1.30 1.32
0.53 0.45 0.53
1.29 1.13 1.08
12.38 14.49 15.19
5.4 5.59 5.60
z.tr 2.52 3.11
t7.77 15.41 t2.60100.00 I00.00 r00-00
28.53 28.23
5.14 5.57
u.to ,t.721.19 1.23
o.u 0.35
0.92 0.97
16.83 17.27
7.03 6.60
3;12 4.19
t2.to 10.85
100-oo rff)-00
27.57 27.2t5.20 4.85
25.07 25.61
t.u 1.25
0.35 0.39
0.92 0.90
16.93 16.41
6.87 6.66
4.29 4.67
11.56 t2.05IOO.OO lff)_ff)
t86.2230.O
203.4
205.0
tn.L113.0
3M.4273.7
576.7
105.9
205.r
Exports ofgoods(% of tolral exports to the EC)
1985 19871986 1988 1989 1990 1991(a)Accumulative nominalgrowth t9851199 (Vo)
Germany
Belgium-Luxemb.
France
Denmark
Greece
kland
19.56 18.92
4.68 4.71
30.14 29.67
1.38 t.t4l.t4 1.03
0.67 0.63
13.29 14.00
9.2t 8.19
5.54 7.08
14.4 t4.&100.00 100.m
t8.4 18.03 t9.365.2t 4.80 4.38
28.49 29.33 30.19
0.95 0.87 0.t91.08 t.rz 1.10
0.66 0.71 0.49
14.76 14.2t 15.52
7.21 6.7t 6.61
8.54 9.N 8.76
t4.65 14.83 12.80
1m.00 100.00 r00 00
142.4
82.7
87.4
97.O
181.0
fi.2143.9
14.8
3s9.6
35.3
101.1
Iraly 13.61
Holand 10.11
Portugal 4.llVnitdKingdom - 16.22
Total EC 100.00
18.49
4.83
29.98
1.20
o.77
0.67
22.29
4.39
27.94
t.t71.07
0.53
16.51
5.77
9.40
10.91
100-oo
Intra-communlty trade balance(% of Spain's GDP)
1985 1986 1987 1988 1989 1990 199r(b)
Germany
Belgium-Luxemb.
France
Denmark
Greece
klandItalyHolandPortugal
UnitedKingdom
Total EC
-0.4
0.1
0.6
0.0
0.0
0.0
0.2
0.4
0.2
0.1
1.2
-0.8
-0.1
0.4
0.0
0.0
0.0
-0.1
0.2
o.2
-0.1
-0.3
-t.2-0.2
0.1
0.0
0.0
0.0
-0.4
0.1
0.3
0.0
-1.4
-1.3
-0.1
-0.1
0.0
0.0
0.0
-0.5
-0.1
0.3
0.0
-1.E
-1.5
-0.2
-0.3
-0.1
0.0
0.0
-0.7
-0.2
0.3
0.0
-L6
-1.3 -1.0
-0.2 -0.1
-0.2 -0.4
-0.1 0.0
0.1 0.0
-0.1 0.0
-0.5 -0.3
-0.2 4.20.2 0.3
-o.2 -0.3
-L4 -2-l
(a)- Only9months.(b) - Estimation for 1991.Source: Eurostat
Statistical Annex 21
l. Goods and servlces 2. Goods
Tbble 10: Degrec of openness , lmport penetratlon, and export actlvlty ln Spaln and ln the EC countrles
1980- 1986 1987 1988 1989 1990 1991
1985 (a)1980- 1986 1987 19881985
1989 1990 1991(a)
SPAIN
Degrcc ofopenncsr
Import penctration
Export activity
EUR1I
Degree of qrenneu
Import penctration
Export acrivity
GERMANY
Degrce ofopennesr
Import penetration
Bxpotrctivity
FRANCE
Degree of qrnness
Import penetration
Export activity
ITALY
Degree ofopenness
Import penetration
ExportrtivityUNTIBDKINGDOM
Degree of openners
Import penetrrtior
Expotrtivity
40.8 45.5
17.2 l8.E
20.t 22.4
58.9 62.4
22.6 23.7
29.6 31.2
57.r 59.5
2t.7 22.2
29.4 31.0
6.2 47.2
18.8 19.5
23.O 23.0
u.o 6.418.2 19.2
21.8 22.7
54.4 5E.0
20.9 223
28.0 29.2
48.8 5l.l20.9 22.4
22.5 22.5
aJ 66.0
24.5 25.3
31.6 32.1
59.9 61.0
22.6 23.0
30.7 31.2
48.8 51.0
20.4 2t.t23.2 24.2
4t.3 49.1
20.t 20.8
22.t 22.t
59.2 60.3
22.9 24.2
29.5 28.3
54.0 55.5
24.5 25.4
22.1 22.2
69.1 1tS
26.2 26.8
33.6 34.E
il.6 67.7
23.9 24.9
33.2 34.6
539 55.5
21.9 225
25.9 265
52.1 54.8
21.8 22.6
24.1 25.5
62.4 63.7
25.t 25.2
289 30.r
31.7 35.1
15.3 16.9
13.2 t4.3
49.1 52.6
19.5 20.7
23.9 25.5
47.7 50.8
r7.5 lE.4
25.4 27.1
39.0 40.1
16.7 17.4
18.4 r8.5
37.2 39.9
16.4 17.3
t1.t 18.5
42.7 6.4t7.2 19.0
20.9 22.0
38.4 41.0
l9.l 20.4
t4.5 14.9
54.2 55.0
21.4 22.1
25.E 26.4
51.3 52.5
18.9 19.2
26.9 27.5
41.5 43.7
lE.l lE.9
r8.E l9.E
41.4 42.t
tE.z lt.6r8.5 lE.6
47.3 48.t
19.3 20.6
22.2 21.6
4.4 46.2 48.9
22.5 23.1 24.2
l5.l 15.8 16.7
58.6 fi.3 62.6
22.9 23.3 24.0
2'1"6 28.4 29.6
55.7 58.0 64.0
20.2 21.2 23.0
29.2 299 32.5
45.7 {t.O 47.4
19.5 19.9 20.0
20.E 21.3 21.6
443 45.0 45.E
19.2 19.2 19.6
19.7 20.1 20.3
50.8 52.t 53.0
21.4 21.5 21.4
22.2 23.4 24.5
58.2
26.4
23.t
74.0
27.4
36.2
74.4
26.6
38.1
56.0
22.6
26.9
55.9
23.1
25.8
64.5
25.0
3l.l
(a) Commisrion forecasr October-November 1991.EURII: PPS EURII; ELIRI2 excl. SpainNoteg: - Degrec of openners : ratio of erporto plus imports to GDB in real termr
- lmport penetration: ratio of imports to final demand, in real terms.- Erport activity: ratio of erports to GDB in real tcrms
SOURCE : CommimionServicer.
22 Statistical Annex
1980 1981 1982 1983 lg84 1985 1986 1987 1988 1989 1990 1991(a)
Table 11: Nomlnal and effectlve exchange rates (lndex 1980 = lfi))
Nmrlnd exdrenge rrtes
Pesetas per
- USD
.DM
. ECI,.I
100.0 12t.5 153.0 199.8 x24.2 237.0 195.3 172.t t62.4 t65.2 t42.t 146.1
100.0 103.5 114.5 l4L2 143.3 l,{6.8 t63.7 t74.0 l6t.l 159.6 159.t 158.5
100.0 103.1 107.t t27.9 t27.0 t29.5 138.0 t42.8 t3t.2 130.9 129.9 128.9
Nmrlnd clfecilveerdrrngeretes 100.0 90.4 t4.9 70.3 68.6 6l.1 66.0 6.2 68.2 71.0 74.7 74.3reletlve to 19 lndustrid countrles
Rcel effectlve exdrrngc retcs rclrtlveio 19 lndusarld countrles
Double cxporis welghts
-Price defl,atorgror doarestic 100.0 92.7 91.5 79.7 t2.2 t3.4 875 89.8 94.3 100.8 108.6 110.1prodrct
-Unitlabourcosts; totaleconomy lfl).0 93.1 n.2 793 79.0 78.6 80.4 t2.4 t6.4 91.3 975 975
(a) Cornmission Forecasts October-November 1991.SOURCE : Commission Services.
1980 1981 1982 1983 19M 1985 1986 1987 1988 1989 1990 1991(a)
Table 12: R.eceipts and expendlture of general govcrnment (as percentagc of GDP)
Indirect taxes
Dirccttaxes
Dircct taxer adjusted (b)
Social security onrributioos
Other current receipts
Totd currcnt receips
Total anrrcnt receipts adjusted (b)
Currenttransfers 16.2
toenterpris$ 2.1
to households 12.7
to the rest of the wonld 0.1
Acrual interest payments 0.7
Gorrenrmentconsumption 12.7
Canpensatiur of employees 9.E
Purchases of goods and serviccr 2.4
Total currcnt expendiOre 29.7
Grcs saving 0.5
Grcs saving adjusted (b)
Net capital transfers
Gross frxed capital formation
Total expenditurc
Na lendign(+) or net bonowing(-)
Na lendign(+) or net borrowing(-)
Adjusted @)
Grms prblic deb
6.6
7.0
l3.l3.5
30.2
1.3
1.9
32.8
-2.6
17.5
7.3 7.8
7.2 6.8
13.4 13.3
3.8 4.0
31.7 3r.9
t7.6 rt.l2.0 2.5
l4.l 14.0
0.1 0.1
0.8 1.0
13.2 r3.4
10.3 10.2
2.4 2.6
31.6 32.4
0.1 -0.5
r.7 2.O
2.3 3.1
35.6 37.5
-3.9 -5.6
21.6 26.8
8.5 9.0
7.9 8.3
13.7 l3.t3.9 3.4
34.0 33.t
18.8 18.E
2.6 2.8
t45 145
0.1 0.1
1.3 2.0
13.9 13.7
10.6 10.5
2.7 2.7
34.0 34.6
0.1 -0.7
2.0 t.7
2.t 3.0
38.8 39.3
-4.t -5.5
33.1 39.9
10.5
8.2
45.2 6.2
13.0 tz.t3.8 4.2
34.7 35.7
l9.l 17.6
2.6 2.0
t4J 13.9
0.r 0.1
3.1 3.9
13.9 t4.7
10.5 10.3
2.7 3.3
36.1 362-1.4 -0.5
1.9 1.8
3.7 3.7
41.6 41.7
-69 -60
10.4 10.3
10.3 10.5
12.8 t2.5
4.0 4.0
37.4 37.2
17.2 17.4
1.8 2.1
13.8 13.9
0.1 0.1
3.5 3.3
15.1 14.8
r0.4 10.5
3.7 3.3
35.r 355t.6 1.7
I.3 1.2
3.5 3.tn.6 ,()5
-3.2 -3.3
6.6 42.9
10.4 9.9 9.9
t2.0 ll.7 t2.2
ll.3 tz.t t2.4
12.7 13.0 13.4
4.0 4.1 4.2
39.0 38.6 39.6
38.3 39.0 39.8
t7.6 18.0 rts1.8 1.8 1.8
14.0 14.6 r5.l0.1 0.1 0.1
3.4 3.5 3.6
15.r 15.1 15.4
10.5 10.7 10.9
3.6 3.4 3.4
35.1 36.6 37.5
3.0 2.0 2.r
2.3 2.4 2.3
1.4 l.l 0.t4.3 5.0 5.2
41.8 42.6 43.5
-2.7 -4.0 -3.9
9.5
8.4
-3.4
u.2-3.6
445
-3.7
45.6
(a) CommissionforecastsOctober-Novcmberl99l.O) Adjusted for delaying tax reimbuncment for General Governmcnt in 19E9, 1990 and 1991.Source: CornmigsionScrvicer.
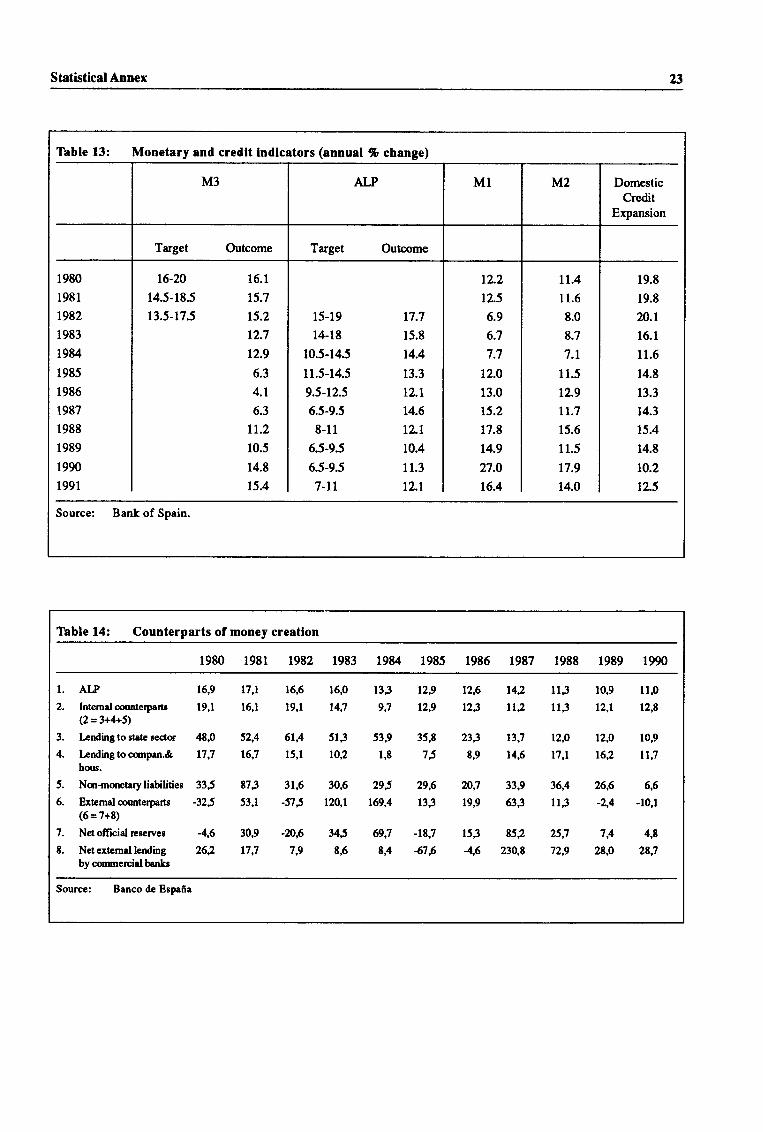
Statistical Annex 23
Table 13: Monetary and credlt lndlcators (annual % change)
Source: Bank of Spain.
M3 ALP MI M2 DomesticCredit
Expansion
Target Outcome Target Outcome
1980
1981
1982
19E3
tgu1985
1986
1987
1988
1989
1990
r99l
t6-20 16.1
14.5-18.5 15.7
13.5-17.5 t5.2
t2.7
t2.9
6.3
4.1
6.3
tt.210.5
14.8
15.4
15-19 r7.7
14-18 15.8
10.5-14.5 r4.4
11.5-14.5 13.3
9.5-12.5 rz.L
6.5-9.5 t4.6
8-11 tz.l6.5-9.5 r0.4
6.5-9.5 11.3
7-tL 12.1
12.2
12.5
6.9
6.7
7.7
t2.o
13.0
t5.2
17.8
14.9
27.0
16.4
Lt.4
11.6
E.0
E.7
'l.l11.5
12.9
tt.715.6
11.5
17.9
14.0
r9.8
19.8
20.1
r6.t11.6
14.8
13.3
14.3
15.4
14.8
r0.2
12.5
Thble 14: Counterparts of money creatlon
1980 1981 t982 1983 Lg8/. 1985 1986 1987 1988 1989 1990
1. ALP t6g2. Inlemalcoilerpanr 19,1
(2=3+4+5)
3. Lerding to rtete recor 48,0
4. I-endingtocmrpan.& llJhous.
5. No<noretaryliabilities 335
6. Bxrcmaloounterpartr -325(6 = 7+8)
7. Net omcid r€scrves -4,6
8. Na exrcmal lending 262by coomercial bankr
17,1 16,6
16,l t9.l
52A 6t,4
t6J r5,1
873 31,6
53,1 -575
30,9 -2f,6
t1:t 7g
16,0 t33t4J 9,7
513 53,9
102 1,8
30,5 295
t20l 169,4
345 69J
E,5 8.4
12,6 142
r23 tta
233 t3J89 t4S
20:t 339
19,9 633
153 8s24,6 23q8
r0,9 llpt2,t t2,8
tzp to,9
t62 llJ
26,6 6,6
-2,4 -10,1
7A 4,r
28,O 283
12,9
129
35J
75
29,6
t3,3
-t8J
4ts
lt311,3
t2,o
t7,l
36,4
113
2sJ729
Source: Banco de Eepafia
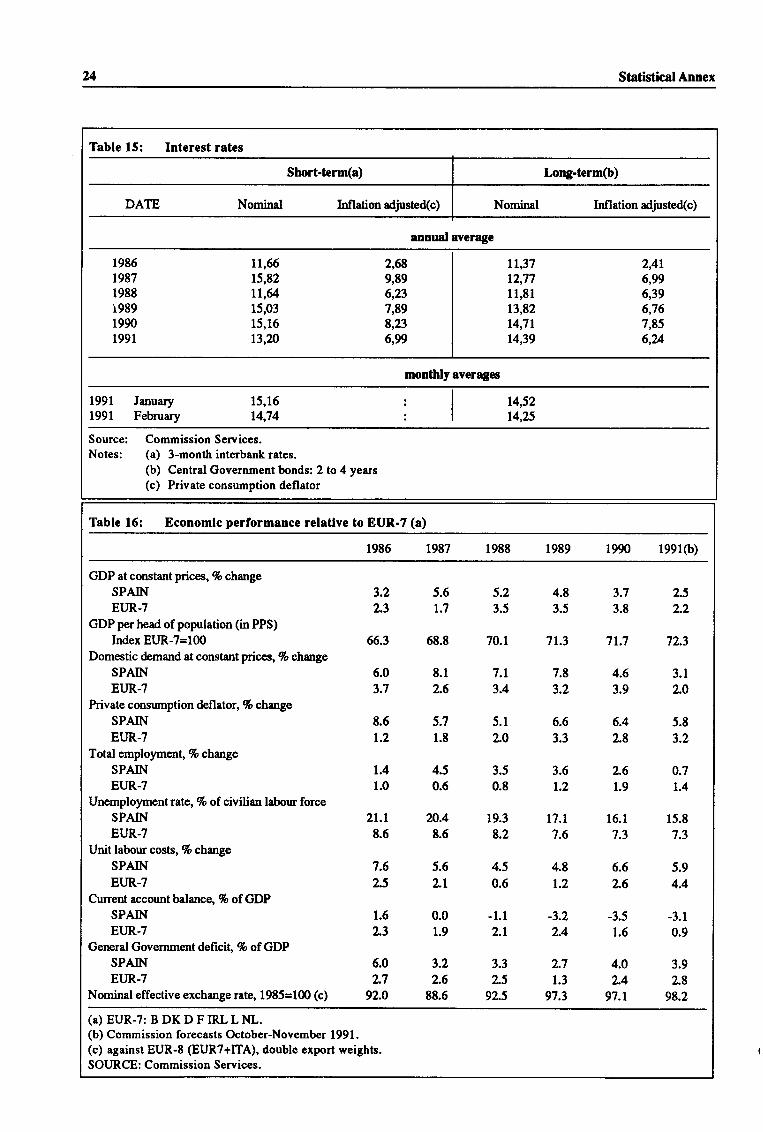
A Statistical Annex
Table 15: Interest rates
Short-term(a) Long-term(b)
Nominal Inflation adjusted(c) Nominal
annual averagc
Inflation adjusted(c)
198619871988i98919901991
11,6615,821,1,54
15,0315,1613,20
2,689,896,237,898,236,99
lL,3712,77I1,8113,8214,71
14,39
2,416,996,396,767,856,U
1991
1991
JanuaryFebnuary
15,1614,74
14,52t4,25
Source: CommissionServices.Notes: (a) 3-month interbank rates.
(b) Central Government bonds: 2 to 4 years(c) Private consumption deflator
Table 16: Economlc performance relatlve to EUR-7 (a)
1986 t987 1988 19E9 1990 19910)
GDP at constant prices, Vo changeSPAIN 3.2 5.6 5.2 4.8 3.7 2.5EIJR-7 2.3 1.7 3.5 3.5 3.8 2.2
GDP per head of population (in PPS)
Index EUR-7=100 66.3 68.8 70.1 71.3 71.7 72.3Domestic demand at constant prices, 96 change
SPAIN 6.0 8.1 7.1 7.8 4.6 3.1EUR-7 3.7 2.6 3.4 3.2 3.9 2.0
Private consumption defl ttor, 7o change
SPAIN 8.6 5.7 5.1 6.6 6.4 5.8EUR-7 1.2 1.8 2.0 3.3 2.8 3.2
Total employmenl % change
SPAIN 1.4 4.5 3.5 3.6 2.6 0.7Er.JR-7 1.0 0.6 0.8 1.2 1.9 1.4
Unemployment rate, 7o of civilian labour forceSPAIN zr.t 20.4 19.3 t1.t 16.1 15.8EUR-7 8.6 8.5 8.2 7.6 7.3 7.3
Unit labour costs,96 change
sPArN 7.6 5.6 4.5 4.8 6.6 5.9EUR-7 2.5 2.t 0.6 1.2 2^6 4.4
Current accountbalance % of GDPSPAIN 1.6 0.0 -t.l -3.2 -3.5 -3.1Er.JR-7 2.3 1.9 2.1 2.4 1.6 0.9
Gerpral Government defrcit"% of GDPSPAIN 6.0 3.2 3.3 2.7 4.0 3.9Er.rR-7 2.7 2.6 L5 1.3 2.4 2.8
Nominal effective exchangeratg 1985=1S 1s; 92.O 88.5 92.5 97.3 97.1 98.2
(a) EUR-7: B DK D F IRL L NL.(b) Commission forecasts October-November 1991.(c) against EUR-E (EUR7+ITA), double erport weights.SOURCE: Commission Services.
Price Wage f,'rmation Process and Labour Market 2S
PART IICHAPTER I
THE PRICE WAGE FORMATION PROCESSAND LABOUR MARKET CONSTRAINTS (*)
Contents
Intoduction . . . . . . .26 2. Rigidities in the labour market and wagedeterminationinSpain . .... 28
1. Theoretical framework on labour marketrigidities and the path of 2.1 The sources of rigidity in the permanentnominalwages ......26 sectorof thelabourmarket ... 28
1.1 The non-accelerating inllation rate of 2.2 The structure of collective bargaining . 30unemployment (the NAIRU) . . .26
2.3 The significance of the new temporaryl.2"Insider-outsider"andhysteresis.,,..26 employment.. ....30
1.3 The significance of the sfucture of 3. Recent performance of unemployment,collectivebargaining .......27 wagesandpricesinSpain ...31
4. Summary and conclusions . . . 33
(*)This chapter was mainly prepared by Robert BUSIIELL and Julia SALAVERRIA MONFORT of the NationalEconomies Directorate.
25 Price Wage Fmmetion hocess and Labour Market
Introduction
The remarkable feature of the recent histo,ry of the labornmarket has been the very high level of unemployme,nl Ratesof increase in nominal wages have neverttreless remainedwell above the average for the narrow-band Membet States.
Unemployment has more recently fallen from Ore very highlevels of the fint half of ttre last deca&, promoted by the in-troduction of temporary contracts and the expansion of the
Employment Promotion Prograrrmes. The expansion in em-ployment has been concentsated in lower-paid jobs in ser-vices, and has contributed to overall wage moderation duringa period of rapid economic expansion
The labour market nevertheless rpmains segmented into atemporary and a pe,ruranent sector. Wage growth began to ac-celerate much faster in 1988 and 1989, and the data suggestthat this acceleration was concentrated within pay settle-ments in the permanent sector. The Chapter investigates thereasons for this acceleration and attcmpts to explain why the
non-accelerating inflation rate of unemployment (theNAIRU) is particularly high in Spain compaed with the restof Europe. The principal explanations are to be found in therigidities in the permanent se€tor of the labour market, com-bined with the inappropriate levels of skills on offer fromamongst the unemployed"
1. Theoretical framework on labour marketrigidities and the path of nominal wages
1.1. The Non-Acceleratlng Infladon Rate ofUnemployment (the NAJRU)
The Non-Accelerating Inflation Rate of UnemploymentCII{E NAIRU) is a corrcept which embodies the identifica-tion of a behavioural relationship betrreen the rate of in-crease in nominal wages arrl the level of unemploymeirl Inits most basic form, the concept states that there is one levelof unenrployment at which workers are willing to accept thewage offers which are compatible with firms'pricing ambi-tions. Wage offers are made and negotiated within a frame-work of expectations about the rate of growth of nominalGDP. Wages are the dominant elenrent in production costsand exercice I strong influence over the rale of increase ofprices hices are an impodant influerpe upon workers'ex-pectations for the rate of incleas€ in nominal wages. Thelevel of unemploSrment which eventually exercices a con-straint upon the rate of increase in nominal wage.s is &ter-mined by structural features in the labour and productmarkets"
The current level of unemployment also comprises a cyclicalelement, so that the level of measured uremployment mayfind itself either above q below that equilibrium level whichis consistent with stable prices The cyclical element is theoutcome of the effect of various "shocks" which intrudeupon labour and product rnartets rnd which will require an
adjustment in the rate of growth of nominal wages . Thespeed and efficiency with which wages rcspond to cyclicdchanges in unemplo5rment will be stsongly inlluenced byvarious structural features ard institutions in thp labour mrr-keL The speed ud effrciency of adjustrrent also det€rmines
the time which is required for uremplo5ment to rehtm to theequilibrium level which is consistent with a stable path forpTlces.
The various shuctural features and institutions which deter-mine the level of unemployment which is consistent withstable prices, and which detersrine thc s@ of adjushe,ntof the rate of change of nominal wages to cyclical changes inunenrplo5nnent can be identified as follows.
. Misnutch, vhich implies that an important part of the avai-lable laboursupply is unathactive to employ given the stateof technology and Ore potential productivity of that labourin relation to the disnibution of nominal wages by occupa-tion, industry or region,
, Job search, where the unemployed (o,r potential employed)search le$s had for wodq perhaps because ure.mployrnentberpflrts have beconre more generous (the rescrvation wage
hasrisen) or because of discouragement unongst theunesrployedatttrc difficulties ofgaining access to wqtoreooessto better or permanent job oppotrnities,
. I*gislative feafires, where employment legislation (per-haps relating to hiring ad fidng procedures or the level ofemployer contributions to social funds) impose additionalcosts upon ernployment and discourage the use of labour,
. Union militancy, where worters in perrranent jobs or insectors containing particularly skilled wqhers arc able toexert important influenoe over the &veloprnent of employ-ment legislation and over the conduct of laborn rclationswithin the wider labour markeL
The combination and sbength of ttrese features elso deter-mines the ability of worters to resist a reduction in the netreal wage when 'shocks'appear. Primary examples of'shocks' include:
. Tates, where rising taxes (pertraps ernployee contributionsto Social Funds) lead to corryensating increases innominalwages urd a rise in overall costs of emploSment per workerbecause the path of nominal wages is uchangd
. Relative imprt pices. where the undedying td in theprice of imports is raised rplrtive to the price of final do-mestic ouput leading !o arise in the price of final domesticoutput relative to value-addd urd
. A pro&tctivity slowdovrn,whaethe tnendrate of growth ofproductivity turns down (for whatever reason) end thecoruqluenees fo,r wtge growth areresist€d Nominal wagassustain their previous pafh.
The effect of these structural features or imperfectiors is tostrift the relationship betweenreal wages and productivity infavour of real wages for those in wodc The following exem-ines the circumstances which eneble ttris shift to be achievedin practica
1.2. r'Insldcr.outslder" and hysteresls
The manner and circumsturces in which workers (unions)are atile !o impose upwad rnoyements in the real wage, orresist downward presules upon the real wage, has been thesubject of sophisticated analysis. The most convincing ex-planations are based upon developm€nts of the "insider-out-
Price Wage X'mmation kocess and Labour Market ?:l
sider" models of the labour market In these modelq unionsselect the wage by virtue of their "insi&r" power and firmschoose the number of worters they will employ. "Insid€rsu
will encouage therecruitnent of "outsiders" only fc as longas additional r€cruitmffit rddq to the marginal rcv€nue pro-duct of those in wort
'Outsid€rs' will be willing to enter wort povided the ex-pected marginal rev€nue product exceeds the reserrrationwage, measured by the level of out-of-work income. "In-siders" will exercise and maintain tbeir power by corutruct-ing nrles and codes which can be used to resbict access and
raise labour tumover costs for firms. Powermay very well be
exercised though tade unions, but this is not a necessary
condition. The possession of power may be zupported by the
complexity of production tecbniques inside the
enterprise (and tbp rssociated complexity of skills) or power
may be won by the ftrmation of informal coalitions unongthose with higher or professional skills.
The incentive to exclude "outside,rs" is enhanced if "out-siders" have lower o,rder skills and abilities corryared to "in-siders". "Insidersu will then pefer to maintain barriers toemplolment and captrne for thenrselves the additional rentfrom future increases in profits. The situation will be sustain-
able provided firms are willing to rrgotiate only with "in-siders". However, firms may be quite wi[ing to deal onlywith "insiders" because recruihent of "outsiders" has cer-
tain d*s of failure (choosing the wrong worters) and ttrcymay prefer to maintain good relations with the highly-skilled(and more productive) 'insiders".
The oulcome is consistent with behaviour which finds fimrsprefering to invest in labour-saving capital equipmentratherthan recnrit new wortery and being encouraged to do so by"insid€,rs" because tbe benefits for their "insid€r" ncvenueproduct (and subseguent real wages) are superior. The poten-
tial for "insid€r" behaviour will be fiuther enhanced where
fimrs re operating in oligopolistic ormonopolistic mar&ets,
because firms will then have fewer irce,ntives to resist thp
construction ofberriers to'insider" enFy and will be able topass on cost pressures in highq product pricesr. In fact, "in-siders" will have still fruther ircentives to enect barriers (and
capture economic rent) wbere product martets are subject torestricted competition because their bargaining shategy isalso srbject to fewer constraints.
Separate analpis has claimed !o find evidence of hyste,resis
in the labour markeL Hyste,resis might be seen to occtr when
the laborn martet establishes eErilibrium at a given level ofunemployment and then (ceteris paribus) maintains thatequilibrium level of unemploymlent into the future. How-ever, the equilib,rium level of unemployment which is estab-'
lished is in no sense unique and there are various (perhaps
numerous) levels of uncmployment which might be consist-ent with a sirnilar path of real wsges. History then matters
and the best explanation of current levels of urrmplo,4m€nt
is past levels of unanploymenL The implication is that rates
of changg rather than any particular level, of unemploymentinfluences real wages. The hysteresis proposition is at least
partly consistent with the "insider-outsider" model of tlp la-bourmarket
In the specific case of Spain, hysteresis could be said to begestating during the years before dernoctatisation when the
rate of technological adjustnent to changes in the structure
of demand and prices on world markets was delayed bypolicies for trade, industry and the labour market. The"shock" of the change in inflation r€gime at the beginning ofthe 1980s led to a widesp,read release of labour (and aban-
donment of capital) and a very fast rise in urrcmploymant.
The rise in urcmployment was so fast that th'e labour marketwas unable to cope with tbe required adjustment" Unemploy-ment was then locked in at the higher level by malfurrctionsin labour and product martets, and particularly by the effects
of inactivity upon the *ills of those displaced into unem-plolmenL One important implication of hysteresis is that the
effects of unemployment on job-seekers are cumulative and
skills and motivation &teriorate with duration of unemploy'rentspell.
The explanation for the failrne of real wages to respond to
the high Ievels of uremployment is nevertheless incomplete.
The important, remaining questions are why "outsiders" failto approach firms directly and why Otey do not set uP new
businesses in order to compete with the "insiders". Theanswer to the frst question might be that frms delegate a
compon€Nrt of screaning costs of new wor&ers to "insid€,rs",
and "insiders" have irrcentives to exclude mury of the new
applicants.
The answer to the second question may be that "outsiders"lack the required skills and knowledge for forming coalitionswith other "outsi&ns" and may be unable or unwilling to ac-
cept the risks inhe,rent in forming new enterprises. The rules,stmcture and gerrrosity of the unemployment benefit rystemmay offer strong disincentives. The creation of new enter-
prises, or the adoption of innovative worting pattcrns whichmight enable re,entry to wortg may be discouraged by ntlesand regulations and by co&s of conduct constuctod by "in-siders". One further poblem is that access to capital martets
for "outsiders" may be restricted because of collateral re-quirerents and the essociatedrisks attacbed to borrowing.
13. The slgnlllcancc of the structure of collecdvebarplnlng
Other reseuchhas adopted elerrents of both the "iruider-out-sider" and hysteresis proposals rnd asserted that institutionalfeatures in the bargainin! system l may lead to failures in the
adjustment of real wages to particular levels of uremploy-mnt ard that these failure.s may be durable" Spain appears to
have a rystem of collective bargaining which combines both
See, for example, Calmfors, L. md Driffill J. (1988). "Bugaining Stucture Corporatism and Mrroecommic Performurce",
Economic Policy,Number 5.
2t Price Wage Formation hocess and Labour Market
elements ofnational and decentralised bargaining 2. The ana-lysis zupposes that nominal wages are detemrined by rcfer-ence to labour market conditions in the regions, or locallabour markets, which are experiencing the most buoyantconditions. Nominal wage increases are then transmittedthroughout labour markets in low activity regions. The rig-idity of wage detennination is ernphasised by failures in la-bourmobility.
The inefficiencies imposedby the stmcture of collectivebar-gaining will be magnified by failunes in expectations regard-ing the future path of domestic demand and inflation.Inflation surprisas will be resisted in wage determination inthe high activity regions or labour markets and these willagain be transxnittd across all labour markets. Failure by tlremonetary authorities to implement the stated path for mon-etary and fiscal policy will encourage settlements which at-tempt to urticipate the path of inflation in the deterrrinationof real wages, thereby cultivating an inflationary attitude ineconomic life. The persistence of inflationary expectations(or the pre.sumption that growth in nominal incornes will ine-vitably be faster than predicted by offrcial projections) com-bined with inefficiencies in the hybrid system of collectivebargaining will also zubstantially delay the speed of adjust-ment of real wages to changes in the rate of growth of econ-omic activity.
2. Rigidities in the labour market and wagedetermination in Spain
2.1. The sources of rlgldlty ln the permanent sectorof the labour market
Various factors impede the speed and efficiency of adjust-ment in the case of Spain. Research evidencer zupport theprobability of pervasive mismatch in the labour marke!
. large inter-indrstry shifts of employment have taken placeduring ttre past two decades, but industry-specific unem-ployment rates (relating to individral job-seekers) appesto have persistd
. high pay differentials can be identified across occupationsand sectors, and an important part of these differentials re-mains after adjustments are ma& for the personal charac-teristics of those in worL
The adjustment for personal characteristics inctu&s facto,rssuch as correnhations of male or female workers by sector,corhparative investment in human capital, marital stafus andtenure of work contracL The size of residual differential bys€ctor appean particularly significant in banking and finan-cial serrrices. The prese.nce of important residual pay dif-
ferentials can be interp,reted in various ways. However, thepattern of differentials is suggestive of a labour marketwhere firms pay wage premia in order to retain scarce wor-kers. Wage premia for retention are surp'rising at a time whenlevels of unernployment have been particulady higlr.
The evidence from wage diffe,rentials can be supported byreference to statistical analysis which identifies wide dif-fsrences in the probability of entering and leaving unem-ployment across particular groups of labour marketparticipants. After adjustrnent for the characteristics of irdi-vidual job-seekers and sectoral composition by regioq thedifferences in entering and leaving unemployment are perpe-tuated. The statistical eviderce also suggests important wast-age of skills, so that duration of unemployment hasimportant consequences for rubsequent unernplo5ment ex-perienoe and dratiqr has cumulative conseguerpcs for thpspeed and probability ofre-entering work Certainly, the veryhigh levels of long-tenn rmemployrrent (as a propotion oftotal unemploynrent) would indicatepotential fo wastage ofskills amongst important parts of the labour supply. Theproblerns of re-entering wort have also contributed to de-clining participation (partly discouraged worker effects)amongst older workers, and led directly to the errcourage-ment of early retirement programmes.
The rational response to shortage of experienced workers(the requirement to pay wage prernia) is to educate ard trainyorurg workers, because young workers will have made theleast investrnent in human capital and should expcct to r€-ceive the lowest relative wage, The concentration of unem-plolm.ent (and long-term unemployment) unongst youngpeople suggests that fimu have been required to accornrno-date the inflexibilities within tbe p€rmanent sector of the la-bourmarket byreducing tlrerecruitnrent of new entrants (see
tables 6 and 8). The apparent cornpression of the overall paydistribution (and a narrowing of age-related pay differen-tials) negotiated though collective bargaining should be ex-pected to have contributed to a reduction in the nunrber ofentry-to-wort jobs for young peopla The compnession rp-pears to have been particularly emphatic duing the sbeng-Orcning of national collective bargaining drning the 1970's.The situation may have been made worse by ttre prioritygiven to thc negotiation of minimum wages though free col-lective bargaining. The cffect of this priority is to further in-cr€ase the employrrnt costs of new entrants to work and tore&rce the incentives for frms to offer training and educa-tion to those at the lower end of the pay disuibution.
lob search- Mismatch may be enhanced where labour mo-bility across areas, regions or bordsrs is reduced or wheremobility across occtpations within the same area orregion isconstrained The statistical evidence indicates a substantial
23
The collective bargaining system in Spain displays more ten&ncies towards entralised than &entsalisod bargaining.Vinals.J, et aI, "Spain and the'EC gla 1992' shock', in Unity with fliversiry in Funrpean Economy : the Communiry'sSouthern Frontier. editors C. Bliss and J. Braga de Mrcedo, Cambridge, 1990.
Price Wage Fonmation Process and Labour Market 29
fall in inter-regional mobility within Spain during the periodsince about 1g604. Crose-border migration has reversed dur-ing tlrc same period, and particularly after 1973. The majorexplanation for the decline in migration is the trend rise innational ard European unenrplolm.ent coinciding wi0t t}pfirst oil price "shock" in 1973. The effect of rising unemploy-ment (particulady on the scale experienced in Spain) is to in-fluence the perceptions of potential migrants about theprobability of re+mployment in the new region Tbe re+cr-ployment prospects of older workers will anyway be smaller,
and the expected rate of retum for ol&r workers will prob-
ably be modest in comparison to costs because of the shorterperiod during which older workers can expect to receiveearnings in the new job and region The irce.ntives for migra-tion are then low, particularly wher,e the skills of potential
migrants re inapproprirte for vacancies in tbe higher activ-ity rcgions c whene barriers to entry-in the sectors conc€n-
trated in those regions are substantiaP.
The rise in unemployrnent has also encouraged resort to the
informal sector, and has emphasized the attractions of re-6aining in close proximity to the family unit That is particu-
larly important in Spain urd in Southem Europe. The familyis also often the nucleus of informal worting in tourism and
agriculture (see tables 13,14 and 15). The capacity of thefamily to offer support may have been improved by the
household irrcorne effect of the rise in the number ard valueof pensiors which has rrise,n though the encourageurcnt ofearly retirement prograrilnes. It may also have been im-proved by special unemplolment berefit schemes, such as
that which exists for agricultural workers in Ardalucia and
Extrernadura The level of inter-regional mobility Sould be
influenced by the considerable differerces in regional hwseprices, itself an outcome of the correntration of economicactivity in certain key areas or cities. The inllexibilities of the
capital market leading to the conce.nhation of inveshentwithin those location, has had further implications for thefurrctioning of the labour martel The rigidity in the rcntcdhousing sectu has contributed to the problems cr€ated bydiffe,rences in regional house prices.
Furttrr evi&nce6 has zuggested that falling job serch maybe associated with improvements in the level of uremploy-ment benefits. The combination of comparatively high sever-
ance pay and improved unemployment benefits shouldcertainly be expccted to redrce job semh during the earlyweeks of unernploynenl although econoretric analysis has
found only snall effects arisrng from impoved levels of un-emplo5ment allowances. The disincentives to job search
may nevertheless be magrrified where public employm.ent
seric€s fail to impose a r6gime which creates a direct linkbetween the payment of allowances or grurts and the purstit
of formal wort. Evidence suggestsT that the claiming ofallowancies ard corpurrent working in the informal sector isrelatively common in some regions or sectors.
Legblativefeatures,tb favoured position of those in perma-nent and higher-skilled work is improved by employmentlegislatior" and particularly by legislation relating to sever-
ance pay. The tradition of high severance pay, determinedpartly by legal requirements but apparently enhancedtlnough collective bargaining, has redtced the incentives forfirms to recruit additional laborn and also reduced the poten-
tial for releasing labour during periods of downtum in the
rate of growth of economic activity. The adoption of earlyretirerent p,rogrammes (partly subsidised by government) to
atternpt to offset the effects of rising unernployment has at
the same timereduced labour zupply to the formal sector and
fintlrer improved the competitive position of those wo,rkingin pemranent jobs inside that sector. The adoption of eadyretirement fogrammes has reduced formal participation byolder worters in a labour market where participation is al-ready v€ry low by European standards (see tables 7 and 8).
The very low levels of part-time working in the labourmar-ket suggest a sipilicant rigidity imposed by employment
legislation, particularly when comparisons are made withwork patterns in other Member States. The alternative topart-time working is the use of existing workers on overtime,which is likely to be mqe costly because those already injobs have a preferential position in bidding fq the additionalwork. The low participation rat'e (across the whole labourforce) indicates substantial discouraged worker effects, lead-ing eitberto inactivity (and still lowercompetition inbiddingfor work) or to r€sqt to the informal sector. High sev€ran@
paympnts will have frrther effects on labour zupply, particu-larly where high severance payments are combined with the
inroduction of substantial improvements in unemployment
allowances.
Taxes onTbDs, employer contributions to the Social Fund
represent a high proportion of total government revenue
from taxation in Spain (see table 5). The levels of revenue
from 0ris form of taxation appear to have been particularlyhigh at the beginning of the 1980's. The proportion of taxa-
tion raised from employer conhihrtions has fallen in morerccent years but rcmains higher than many of the MemberStates and in comparison with countsies such as the UnitedStates and lapan. Some analysts t claim to have fourrl an im-portant correlation between the rise in the gap betweenwages ard labour costs and tbe rise in the NAIRU duing thepast decada It is dilficult to imagine th8t the level of taxqs
upon jobs in the formel labour market could explain zuch a
substantial rise in rmemploymenL However, the level of tax-
45
67I
Bentolila, S, ald IJ. Dolado, Mismatch and intemal migration in Spah 1962-1986, Burco de Esparlc 1990.
The evidenoe sugg€$ts ttrat significsnt differenes exist in ttre stsucture of industsy ard occupations rcrrss high-rctivity and
bw-artivity regions, although rcgiond wage differentials apeu to be compuatively low.
Bentolila, S, and OJ. Blancharrd, Spanish Unernploymurt, Bcornmic Policy- 10 APril 190.Muo. J, et d, Analisis de lu fuiciones & Vida y Trabalr en Espanc @ 1987.
Dolado, IJ., Malo de Molinq LL md Zabalza, A. (19t5), Spanish industsial unernployment ; some explanalory factg
Eomnics.53.
30 Price Wege Formetion koccss rnd Labour Market
ation upon jobs may well have enouraged rcsort to workingin ttrc informal sector. The level of taxes on jobs may dsohave magrrified the "shock" to employment of the churge ininflation r6girne at the beginning of the 1980's, encoruagingfirms to adopt strategies which would lead to a zubstitutionof labour in the long term.
2.2. The structure of collectlve bargelnlng.
The problems of enEy to wo,rt in lower-activity rcgions, andthe obstacles to formal ernployment creation in tbe privatesector in those regions, are exacerboted by the stnrcture ofcollective bargaining. Nationwide agreerrents were used (as
a fomr of partrership) to reduce the core rate of inflation du-ing the period of the 1970's but the reduction was achiwedat the expense of implanting important inefficiencies in thebargaining pr@ess, and in the labour market in generd, dur-ing the subsequent p€riod. National collective bargainingtends to be conducted within the high-activity regions rndthe uansmission of national wage settle,menls from high-ac-tivity to lower-activity regions is one of the factors in tbe lowresponse from nominal wage settlements to risingunemploy-ment in the wider labour markeL The structure of collectivebargaining has contributed to a corparatively low degree ofdispersion in regional wage differentials
One indicator of the remlting rigidity is that sectoral wagesappear to be closely associated with the aggregate industry(consumption) real wage ard appear to respond very little toown-soctor variations in pro&rctivity nend or gercral laboursupply conditions in that sector or indrstry 9. The researchflrndings suggest a system of collective bargaining where theprincipal influencqs upon nominal wage detennination bysector is not the level of sectoral or local unemploynrcnt butthe relative level of nominal wages in comparison with otherse€tors. The regional transurission of nominal wage settle-ments through the structure of collective bergaining is a par-ticularly important issue at a time when entry to theEuropean Community is encouraging hade unions to pursrepay increases which are consistent with a "catching-up" pro-cess in imitation of pay levels in other Menrber States. Theextent of the transmission process should be expected tohave important implications for levels of urcmployment inthe lowq-activity regions during the period of adjushre,nt tomembership of the Exchange-Rate Mechanisrn"
2.3. The slgnlllcance olthc new temporary employment
The irnportance of temporary wort in ernployment expan-sion is illuskated in table 2. During the period from 1987 to1989, the total growth in temporary employment was932,000 and this compares to an estirnated fall in permanentemployment during this period of 45,fiD. The growth intemporary ernployment during these y€ars appears to be im-portant across all sectors except agriculture but is particular-ly concentrated in services. Nevertheless, growth inpermanent ernployment is also important in serrrices whereas
falls in employment were evident in Industry and Construc-tion. Within the Services sector, growth in temporary em-ployment in Comrnerce and Hotels and "othe,rs" (probablygov€rnment agencies or public services) was particularlystrong. Cirowth was also strong in Construction
The irrreasing importarrce of tempcary employment in totalemployrnent is confrmed in table 3. Temporary e,lnplo5mrent
has incneased from 18.6% of total ernployment in 1987 (frnalquuter) to 31.5% of total erployment at the end of 1990.The data in the table also illustrate the dominance of tempor-ary employment in agriculture and construction and thegrowing importance of temporary employment throughoutservices. Ttr growth in Commerce and Hotels and in Trans-port and Communication is particularly notable. Temporaryemployrent in "In&rstry" recorded rapid growth during thetwo-year period, and the rate of growth was comparableacross all the sub-sectors of the industrlr sector.
The data in table 7 strows that the growth in temporary ern-plolmrent has coincided with an important expansion in thelabour force. The growth in population ased 25 ard over has
been particularly strong but the notable feature is a rapid ac-celeration in participation amorryst wornen aged 25-54. Theavailability of tunporary colrtract wort does not necessarilyexplain the rise in female participation. However, it seenrs
reasonable to suppose that there is some association becauseof the need to register at governrnent employme,nt offioes inorder to qualify for enfy to the Emplo,rnpnt Promotion Pro-grammes. Changes in the rules relating to unemploymentbenefits and pensions will also explain part of the rise in fe-male participation and ttrer€ has been an importurt change inattitudes about the extent to which women should participatein work outside the honre.
The other important trend is the fall in male participationrates, particularly surprising at a time when the rate ofgrowth in economic activity was rcaching very high levels(table 7). The fall is concentrated not only amongst olderwqkers hrt dso in the age-group 25-Y, although most ofthe effect will be apparcnt in the age-group of 45 years andover. The information in table 7 can be compared with table4, which drows that part-time employment has fdlen steeplyamongst males during 1988 and 1989. More surprisingly,part-time ernployment ernongst females has fallen dtuing aperiod when total employnrent growth was expanding rapid-ly.
Recruihent urder the Eurplo5rment Promotion hogrammes@PP) represented more than 50 per cent of totd hirings in1988 and 1989 (table l) and tempcary contracts were usedfor almost one-half of totd recruitment in the latter year.Part-time jobs represented 15 per cent of total recruitmentunder EFP in 1989, which is surprising in e labour marketwbere part-time worting is very low in comparison to mostof the other Member States (see table 12).
The economic eonsequenc€sr of the expursion of temporaryworking under EPP are diflicult to estimate without full
Vinals,I et al, op.cil 1990.
Price Wage f,'omation Process and LabourMarket 3l
waluation evi&nce, It ie certainly beneficial for those whohave been out of wort for a prolonged period to re-enter errployrrent and to improve their seerch credentials inthe labour market. However, the encouragement of an im-portant prt of t€mporary conbact wqk has been achieved
though spedsl incentives and these should be expected tohave costs:
. temporarJ/ contract working may have displaced other job-seekers c other forrns or sources of activity;
. tresoutrqss will have been diverted betwee,n sectols, and the
effecierry of that diversion is questionable;
. it is debatable wbether temporary contract wokers will findpermarrnt work at the end of contsact or whether they willsimply enter a prolonged penod of finther unemplo5menL
Employment Promotim hogranrnres do appear to have in-cluded a number of raining and apprenticeship schemes.
Howerrer, inforrnation nceds to be obtained on the exte,lrt towhich tbese are gauine net additions to appre,nticeship and
Eaining positions m wherher they are rcally positions whichwould have existed anyway. Tbe gality of haining deliverodalso needs to be investigate4 because this will determine the
extent of later employability and the potential for skillaugmentation in later career. Experience in other MemberStates suggests Out traidng positions errbedded in special
employment prograrnmes are subject to low quality out-comes and pom @ost-graduate) employability.
The temporary wqt sectu sneated by the Employnent Pro-mation Prugrammes, and by the wider legislative inaova-tbn, is unlikely to have many p€rm8nent benefits for thequality of labour supply. Many of the individuals puticipat-ing in the Programrnas e1 fosasfiring from the legislation,have few incentives to acquire new skills and edrcation be-csuse €ntry to the permanent sector of the labour mar*et (andsccess to higherquelity jobs) remains zubject to the sarne
barrierg vhich existod prror to the changes in temporarywork legislation" firms have few incentives !o offer substan-
tial tsaining and education in ryecific *ills because tempor-ary workers are likely to be replaced at tbe end of contractand would carry any acquired skills ardeducation away withthern
The introduction and &velopnrcnt of the Employment Pro-nption Pmgrarunes atd the wider easing of reslrictions onthe adoption of temporary contrrcts have enabled rec,ruit-
ment of low-cost labour with the use of conhacts which pro-vide much great€r flexibility for Fums. Ternporary contractscreated within EPP inclde financial incentives though dis-regards upon employer social security conbibutions as well.The recruitment provides enhanced flexibility be,cause tbe
tqnporary worters have been and ue employed mainly onslrort-term contracts ard the terms of tlre contract irclu& tlplegal right to much lower termiaalion palmcnts than for per-manent sector workers.
One of the effects of the Employment Promotion Pro-grommcs, and tlu wider legislative intovations, is that firmshave been able to redrce average compensation per workerduring a period when economic activity has acceleratedrapidly. The reason for this is that terrporary contracts have
opened up the possibility of recruiting workers into jobs
which are at the lower end of the skill-range and which willbe mostly suitable for young people and other lower-paidworkersi The availability of low-cost labour has also con-tibuted to the shength of the expansion in the economy.
Thc development of EPP, and the prumotion of temporary-conlract working, has made an important impact upon the
availability of lower-paid job opportunities and upon the de-gree of flexibility in employment structures. It has been par-ticulrly beneficial for very young job-seekers However, the
expansion in the stock of tenrporary workers since 1985 mayalso have contsibuted to segrnentation in the labour markeLTlv Enployment Promotion Progranme and the wider de-
regulation have inhoduced alternative routes into work butare unlikely to have had much effect upon the rigidity whichhas existed (and which persists) within that part of the mar-ket which contains perrnan€nt workers The major effect ofthese rigidities is to redrce competition for jobs in Op per-man€[t sector and to enable that sector to exert substantialpoc/€rs over the detemrination andrate of growth of nominalwages.
3. Recent performance of unemployment,wages and prices in Spain
During the last decade the evolution of nominal salaries was
chracterized by a growth rate mo&ration. The very high un-enrploynent rate played a role in the deceleration of nominalwage growth which was only reversed since 1989.
Despite the strarp fall in unemployment from 1986, the ex-pansion in temporary contracts working has had importantbenefits for wage moderation in nominal compensation peremployee of total economy.
Tbe associations between trends in wages, prices and unem-ployrrent are investigated in Graph 1 which provides thebackground to &e later analysis. The information in Graph 1
illustate.s the association between trerds in consumer prices
and the rate of increase in wages rrgotiated through collec-tive agreernentslo. Ho*"ro, it also shows that the rate of in-crease in wage settlements responded only temporarely tottle downward hend in coruiluner prices and began to moveahead of the bend in prices in 1987. The prfurcipal factor ap-peas to have been the rate of increase in earnings in "largefrms", which began to accelerate much more rapidly in 1989
rnd likely in 1990. The difference between basic wage settle-nrnts negotiated through collective agreements and the rate
of increase in average earnings leported for "larger firms"became much wider in 1989. The relative trends in pay data
10 tn gradr 1, tlre figuee of "collective agrements" and "mminal cornpensation per employee" talce into account the effoct ofthe safeguard clause (differancc betwoen outwn inflation and the expected figure) in the year of paymenl
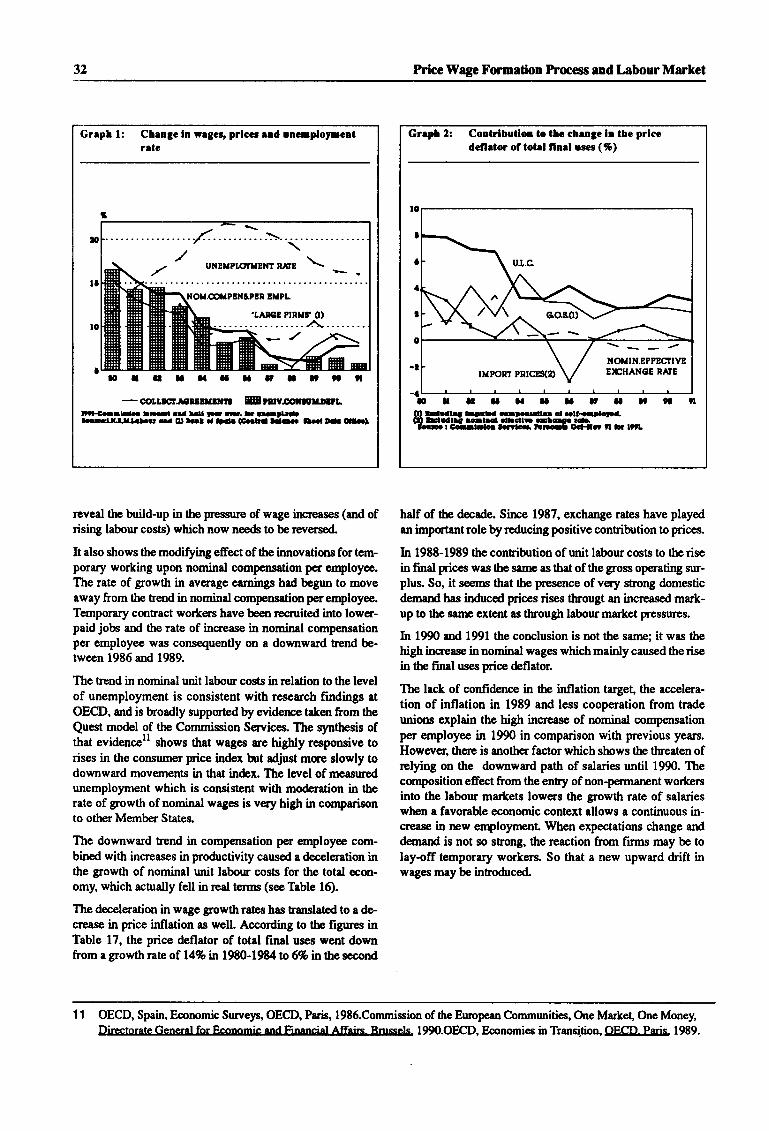
32 Price Wage Formation Process and Labour Market
Greph l: Chrngc ln vrgcr, prlccr ud rtrcuplormeElratc
rtIIaaaaaal,rl'i;
-@Luctrarrrrlnrt Eruvrorlgralrl
l'.tref,rllfc tnt Ea r.u Fr aE ar Ecrlraal-Elllan tc ra o) Dcl.a l.l. (cena Em D-l D.I cLl
reveal thc build-up in the pressure of wage increases (and ofrising labour costs) which now needs to be reversod"
It also shows the modi$ing etrect of the innovations for tem-porary working upm nominal compensation per employee.The rate of growth in average esmings had begun to moveaway from the hend in nomind compensationperemployee.Ternporary contract workers have been rpcruircd into lower-paid jobs ard the rate of increase in nominal compe,nsationper employee was consequently on a downward trend be-tween 1986 and 1989.
The hend in nominal unit labour costs inrelation to the levelof unemployment is consistent with research findings atOECD, and is broadly supported by evidence taken from the
Quest model of the Commission Services. The qrnthesis ofthat evidence" shows that wages are highly responsive torises in the consusrer price index but adjust mue slowly todownward mov€rnents in thrt in&x. The lerrel of measuredunemployment which is consistent with mo&ration in therate of growth of nominal wages is v€ry hiSh in comparisonto other Mernber Statesr.
The downward trend in compensation per ernployee com-bined with increases in pro&ctivity caused a deceleration inthe growth of nominal unit labour costs for the total econ-omy, which actually fell in red terms (see Table 16).
The deceleration in wage growth rates has hanslatod to a de-crease in price inflation as well. According to the figures inTable 17, the price deflator of total final uses went downfrom a growth rate of 14% M 1980-1984 to 6% in the second
half of tbe decade. Sirrce 1987, exchange rates have playedan impctant role by reducing positive contribution to prices.
In 1988-1989 the contribution ofunit labour costs to therisein final prices was the same as that of the gross operating sur-plus. So, it seems that the pres€nce of very strong domesticdernard has induced prices rises thougt an increased mart-up !o the sasrc extent as through labourmarket pressures.
In 1990 and 1991 the conclusion is not the sarne; it was thehigh incr€ase in nominal wages which mainly caused the risein the frnal uses price &flator.
The lack of confidence in the inflation target the accelera-tion of inflation in 1989 and less cooperation from tradeunions explain the high increase of nominal compensationper employee in 1990 in comparison with previous years.
However, there is another factor which shows the tlreaten ofrelying on the downward path of salaries until 1990. Thecomposition effect from the entry of non-permanent workersinto the labour markets lowcrs the growth rate of salarieswhen a favorable economic context allows a continuous in-qease in new employmenl When expectations change anddemard is not so strong, the reaction from firms may be tolay-off temporary workers So that a new upward drift inwages may be intso&ced"
1 1 OECD, Spain, Economic Surveys, OECD, Puis, l9S6.Commission of 0re European C.ommunities, One MarkeL One Money,
Grrph 2: Coltrlbuilor lo tlc chen3e ln thc prlccdc0etor ol totel flnel uccs (%)
\ / \--l
\ / NoMTN.EPPBoTYB
lxponr pnlctga \,/ E)GHANGE nArE
-aroIaaaaaaaaoaa
T)irpntnrafa Gancal far Eannamin onrl liiao*.iol Affoin Rrracalc I990.OECD, Economies in Transi.tion, OECD-Paris. 1989.
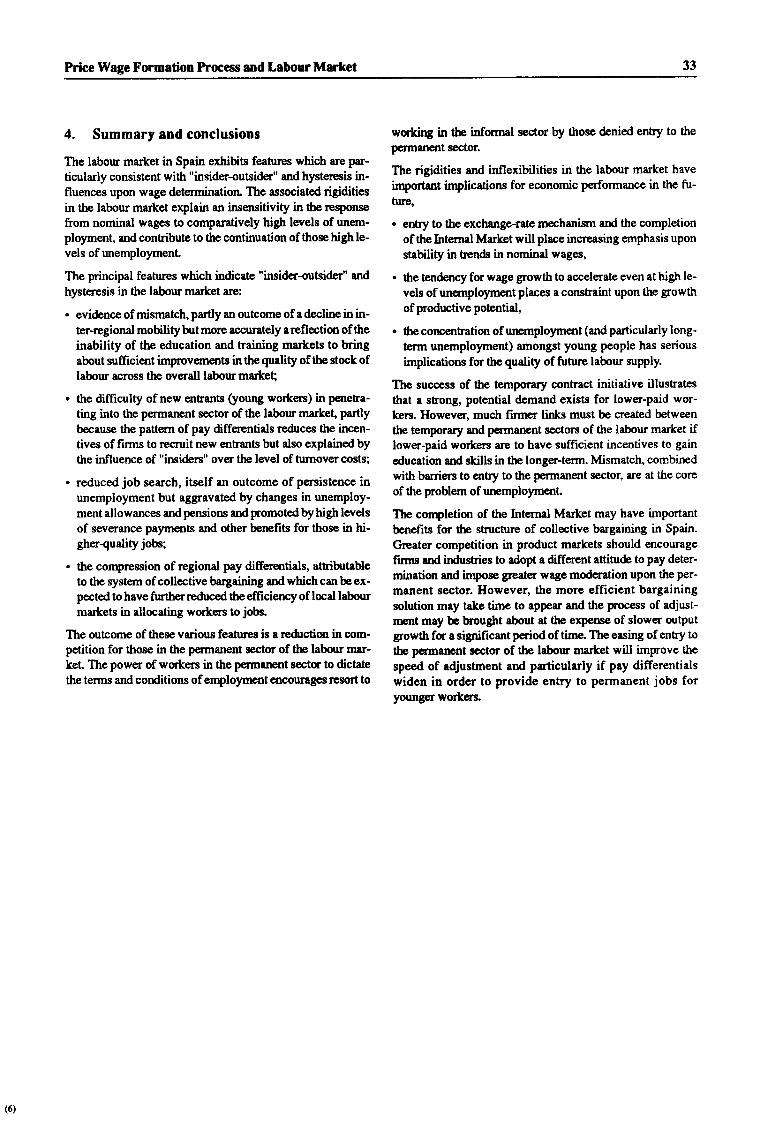
Price \ilage F'ormation Proccss and LabourMarket 33
4. Summary and conclusions
The labow market in Spain exhibits features which are par-ticularly consistent with "insider-outsider" and hysteresis in-fluences upon wage determination The associated rigiditiesin the labour market erplain an insensitivity in the response
from nominal wages to comparatively high lwels of unem-ploymeng and contribute to the continuation of those high le-vels of unemploymenl
The principal feahres which indicate "insider-outsider" and
hysteresis in the labour market are:
. evidence of mismatch, partly an outcome of a decline in in-ter-regional mobility but mole accurately areflection of theinability of the education and haining markets to bringabout zuffrcient improvements in the quality of the stock oflabour across the overall labourmarkef,
. the difficulty of new €ntrants (yoong workers) in pem.etra-
ting into the permanent sector of the labou marke( partlybecause the pattem of pay diffe,rentials redrces the incen-tives of fums to recmit new entrants but also explained bythe influence of "insiders' over the level of tumover costs;
. reduced job search, itself an outcome of persistence inunemployment but aggravated by changes in unemploy-ment allowances and pensions and promoted by high levelsof severance payments and other berpfits for those in hi-gherquality jobs;
. the compression of regional pay differentials, attributatfleto the syste,m of collective bargaining and which can be ex-p€cted to have fintherreduced theefficiency oflocal labourmarkets in allocating workers to jobs.
The outcome of these various feature is aredrction in com-petition for those in the permanent sector of tbe labour mar-keL The power of workers in the permarcnt sectu to dictatethe terms and conditions of employrnent encouragesrcsort to
working in the informal sector by those &nied entry to the
peflnanent sector.
The rigidities and inflexibilities in the labour malket have
hportant implications for economic performance in the fu-ture,
o entry to the exchange-rate mechanism ard the completionof thelntemal Ma*et will place increasing emphasis uponstability in bends in nominal wag€s,
. the tendency for wage growth to accelerate even at high le-vels of unanployment places a constraint upon the growth
of productive potential,
. the correntration of unemployment (and particulady long-term unemployment) amongst young people has serious
implications for the quality of future labour supply.
The success of the temporary contract initiative illustratesthat a strong, potential demand exists for lower-paid wor-kerc. However, much firmer links must be created between
the tempcary and permanent sectors of the labour market iflower-paid workers are to have sufficient incentives to gain
education and skills in the longer-term. Mismatch, combined
with baniers to entry to the permanent sector, are at the core
of theproblem of unemplo5rmenl
The completion of the Internal Market may have importantbenefits fo,r the stmchre of collective bargaining in Spain.(]reater competition in product markets should encourage
firms and industries to adopt a different attitude to pay deter-
mination and impose greater wage moderation upon the per-
manent sector. However, the more efficient bargainingsolution may take time to appear and the process of adjust-rnent may be hought about at the expense of slower outputgrowth fm a significant period of time. The easing of entry tothe permanent scctor of the labour market will improve the
speed of adjustment and particularly if pay differentialswiden in order to provide entry to permanent jobs foryounger worters
(6)
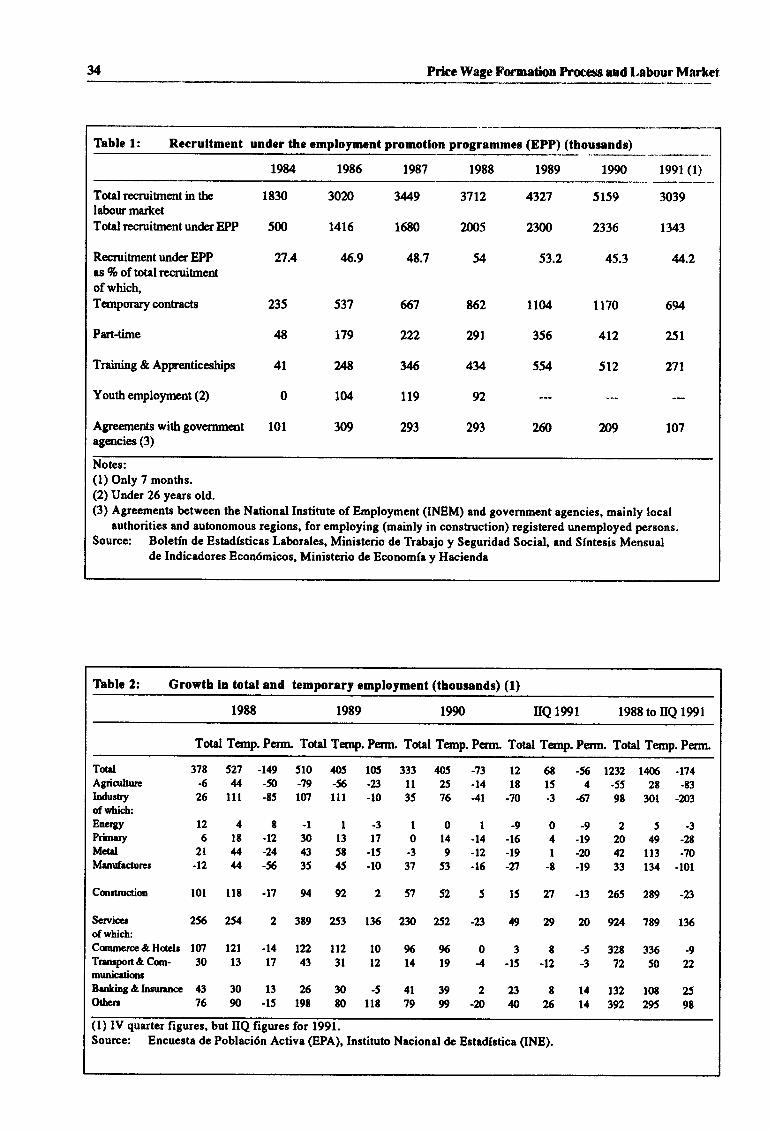
34 Price VYage Formation Proccss ond l,abourMarket
Thblc 1: Recrultment under the employment promotlon progremmer (EPP) (thousands)
1984 1985 1987 1988 1989 1990 1991 (1)
Total rocruitrnent in thelabour marketTotal recruitilpnt un&r EPP
Recrruitment under EPPas % of totalrecmitsnentof which,Te,nrporary contracts
Part-time
Training & Apprenticeships
Youth employment (2)
Agreements with govemmentagencies (3)
1830
500
n.4
235
48
4t
0
101
3020
t4t6
46.9
537
t79
28
1M
309
34/,9 3712
2,p5
54
t62
29r
434
92
293
$n
53.2
1104
356
554
2fi
1680
8.7
67
222
36
119
293
2300
5159 3039
2336 1343
45.3 4.2
1170
4r2
694
251
512 271
2D9 107
Notes:(1) Only 7 months.(2) Under 25 years old.(3) Agreements between the National [nstitute of Employment (INEM) and government agencies, mainly local
authorities and autonomous regions, for employing (mainly in construction) registered unemployed persons.Source: Boletin de Estad(sticas Laborales, Ministerio de Trabajo y Seguridad Social, and Sfntesis Mensual
de Indicadores Econ6micos, Ministerio de Economfa y Hacienda
Tbblc 2: Growth ln total and temporary employment (thousands) (f)
1988 1989 1990 IIQ 1991 1988 to trQ 1991
Total Te,rnp. Perm. Total Temp. Perm. Total Tenrp. Perm. Total Temp. Perm. Total Terrp. Perm.
Tot lAgriorltucIndurtryof which:EncrgyPdmaryMetdManrfectlrcr
Ccrrtructim
Scnricerof which:
t24t6 lt -t2
2t u -24-t2 u -s
-ll-313013t7043 5t -15 -335 45 -r0 37
0l-914 -t4 -16
9 -12 -19
53 -16 -n
52515
37t 527 -149 510 &5 lO5 333 405 -73 t2 68 -fi 1232 1406 -1744 U -50 :t9 -fi -23 n 25 -t4 lt 15 4 -55 28 -E3
26 ul -t5 107 lll -10 35 76 -41 -70 -3 61 98 301 -?f/3
0-925-34 -r9 20 49 -2t| -N 42 n3 -70-8 -19 ?3 t34 -l0l
n -13 265 289 -23l0l llt -r7 94 y2 2 57
Conmcrce&Huclr lVl l2l -14 ltl ll2 10 96Tranrpon&Con- 30 13 17 43 3l 12 l4municeriquBrnking&Inrunncc 43 30 13 26 30 -5Othcn 76 90 -15 I9t t0 ll8
Et6 254 2 3t9 E3 t36 230 252 -29 49 29 m y24 7t9 136
2
-m
96l9
t999
4l79
038-512t336-91 -15 -t2 -3 72 50 t2
23 8 l4 t32 r08 25,t0 2l; 14 392 295 98
(l) IV quarter figures, but IIQ figures for 1991.Source: Encuesta de Poblaci6n Activa (EPA), Instituto Nacional de Estadfstica (INE).
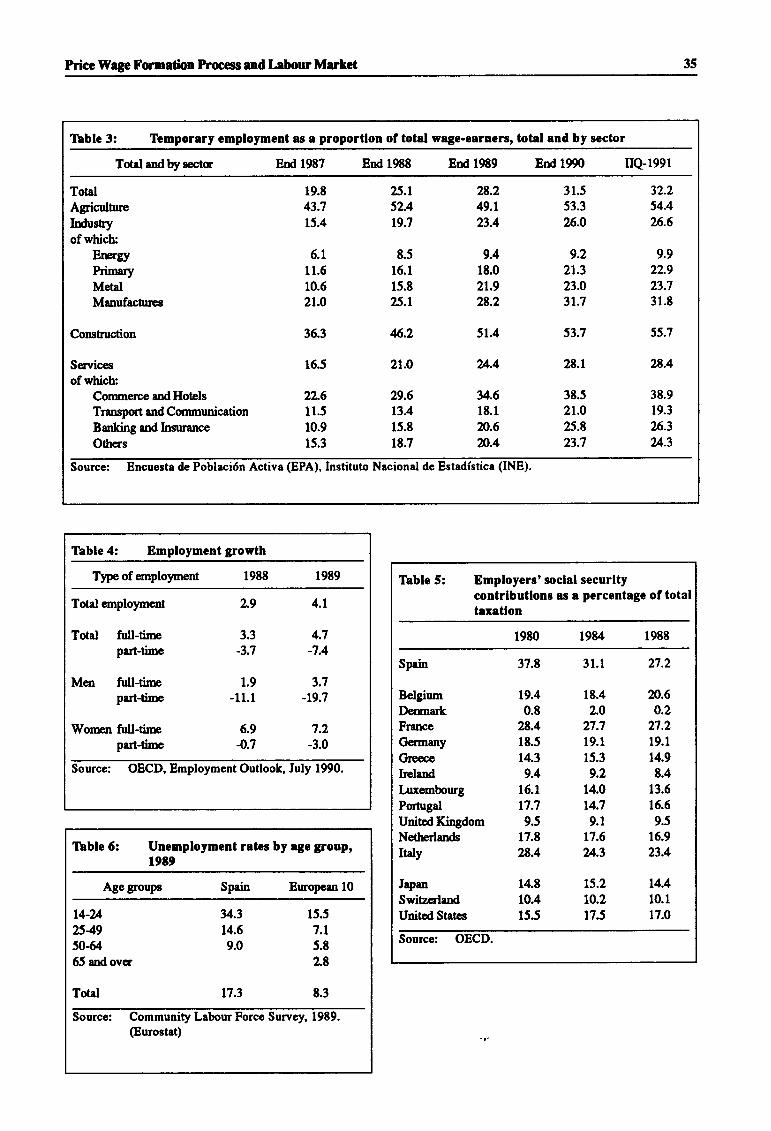
Price Wage Fmatftm Proccss snd L$our Markct 35
Ilable 3: Ibmporary employment es a proportlon ol total wage-carncrs, total end by sector
Total andby rccim Bnd 1987 End 1988 Erd 1989 Errt 1990 rlQ.1991
TotalAgricultureIndusryof which:
ErcrgryPdmryMetalManufactures
Construction
Serrricesof which:
19.8
43.7
15.4
25.t52.4
L9.7
8.5
16.1
15.8
25.1
28.249.1
23.4
9.418.0
21.928.2
31.553.326.0
32.254"4
26.6
6.1
11.6
10.6
2L.O
35.3
16.5
6.2 51.4
zt.o u.4
9.22r.323.031.7
53.7
28.1
38.5
2t.o25.823.7
9.922.923.731.8
55.7
28.4
ConrmerccandHotels 22.6 29.6 y.6Transpo,rt andCommunication 11.5 13.4 18.1
Banking and Insurance 10.9 15.8 20.6
Others 15.3 18.7 n.4
38.919.3
26.3
u.3
Source: Encuesta de Poblaci6n Activa (EPA), Instituto Nacionel de Estadfstica (INE).
Thble 4: Employmcnt growth
Tlpe of eurplo5mrent 1988 1989
Total ernployment L9 4.L
Total tull-tirc 3.3 4.7part-time -3.7 -7.4
Me,n full-tirrc 1.9 3.7part-time -11.1 -L9.7
Wonren full-titrp 6.9 7.2part-time 4.7 -3.0
Source: OECD, Employment Outlook, July 1990.
Table 5: Employers' soclal securltycontrlbutlons as e percentagc ol totaltaxetlon
1980 1984 1988
Spain
BelgiumDemarkFranceGermanyer€ecehelsndLuxembourgPortugalUnitedKingdomNetherlandsItdy
IapanSwitrcrlandUnited States
37.8
t9.40.8
28.418.5
14.3
9.416.1
17.7
9.5t7.t28.4
31.1
18.4
2.0n.719.1
15.3
9.214.0
t4.79.1
t7.6u.3
27.2
N.60.2
n.219.1
14.9
8.4t3.616.5
9.515.9
23.4
14.4
10.1
17.0
14.8 15.2
10.4 to.z15.5 t7.5
Source: OECD.
Tlablc 6: Unemployment rates by agc Srouprl9t9
Agegroups Spain Europcan 10
t4-24 34.3 15.5
2549 t4.6 7.1
50{4 9.0 5.865 and ovcr Lg
Total 17.3 8.3
Source: Community Labour Force Surven 19E9.
@urostat)
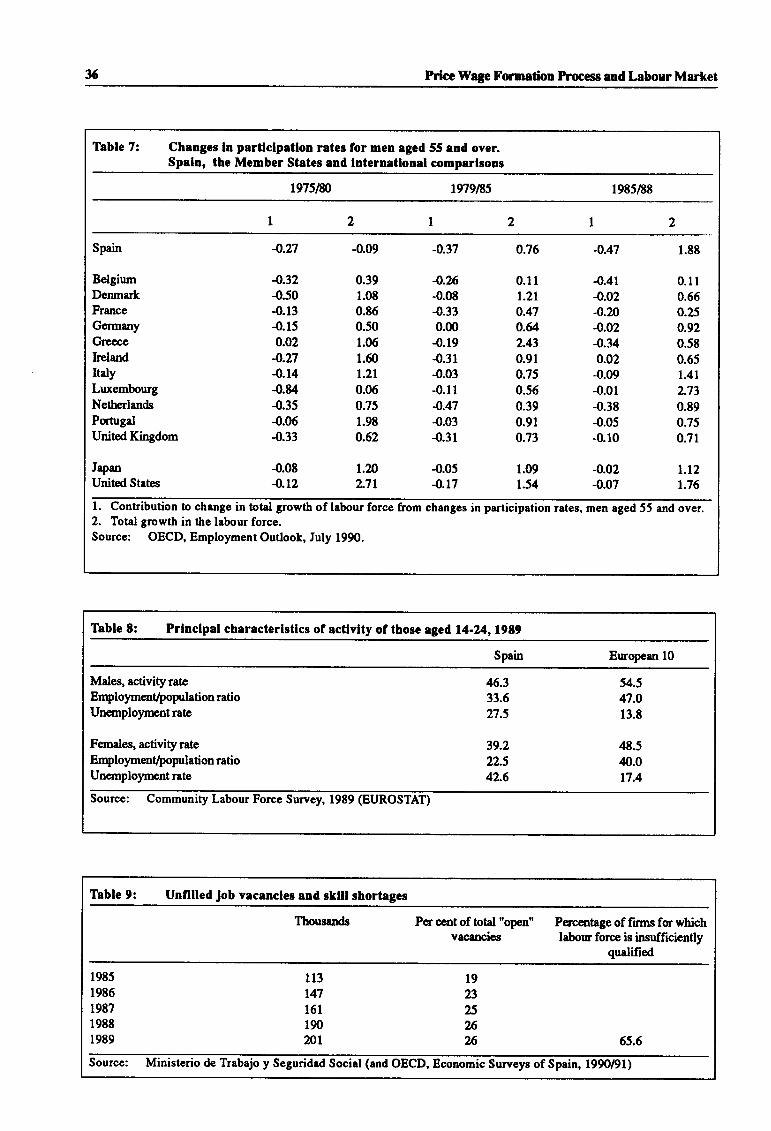
36 Price Wage Formation Process and Labour Market
Tbble 7: Changes ln partlclpetlon retes for men eged 55 and over.Spaln, the Member States and lnternetlonal comperlsons
r975l8/J tngE5 198s/88
Spain
BelgiumDenmarkFranceGermanyGrpece
helandItalyLuxembourgNetherlandsPqtugalUnitedKingdom
IapanUnited States
4.27
4.32-0.504.13-0.150.02-0.n-0.144.844.35-0.064.33
{.084.t2
{.09
0.391.080.860.501.05
1.50t.2t0.060.751.98
0.62
L2AL7t
-0.37
4.2r;-0.08{.330.m
-0.19-0.31
4.03-0.11
-0.47
-0.03
-0.31
-0.054.17
0.75
0.11
1.2r0.47o.&2.430.910.750.560.390.91
0.73
1.091.54
-0.47
4.41-0.02-o.24
-0.02-0.340.02
-0.09-0.01
-0.38-0.05{).10
1.88
0.11
0.560.250.920.580.65t.4r2.73
0.890.750.71
l.t21.76
-0.02{.07
l. Contribution to change in total growth of labour force from changes in participation rates, men aged 55 and over.2. Total growth in the labour force.Source: OECD, Employment Outlook, July 1990.
Tbble 8: Prlnclpal characterlstlcs of actlvlty of those agcd 14-24, 19t9
Spain European 10
Males, activity rateEmploymentft opulation ratioUnemployrentrate
Females, activityrateEmploymentft opulation ratioUneuployrnent rate
46.333.627.5
39.222.542.6
54.5
47.0
13.8
48.540.0t7.4
Source: Community Labour Force Survey, 1989 (EUROSTAT)
T[ble 9: Unfllled Job vacancles and sklll shortages
Thousands Per cent of totd "onen" Percentage of firms for whichvacancies labour force is insufficiently
qualified
l98s 1131986 t471987 1611988 190r9E9 201
19
23
25zrt26 65.6
Source: Ministerio de Trabajo y Seguridad Social (and OECD, Bconomic Surveyr of Spain, 1990/91)
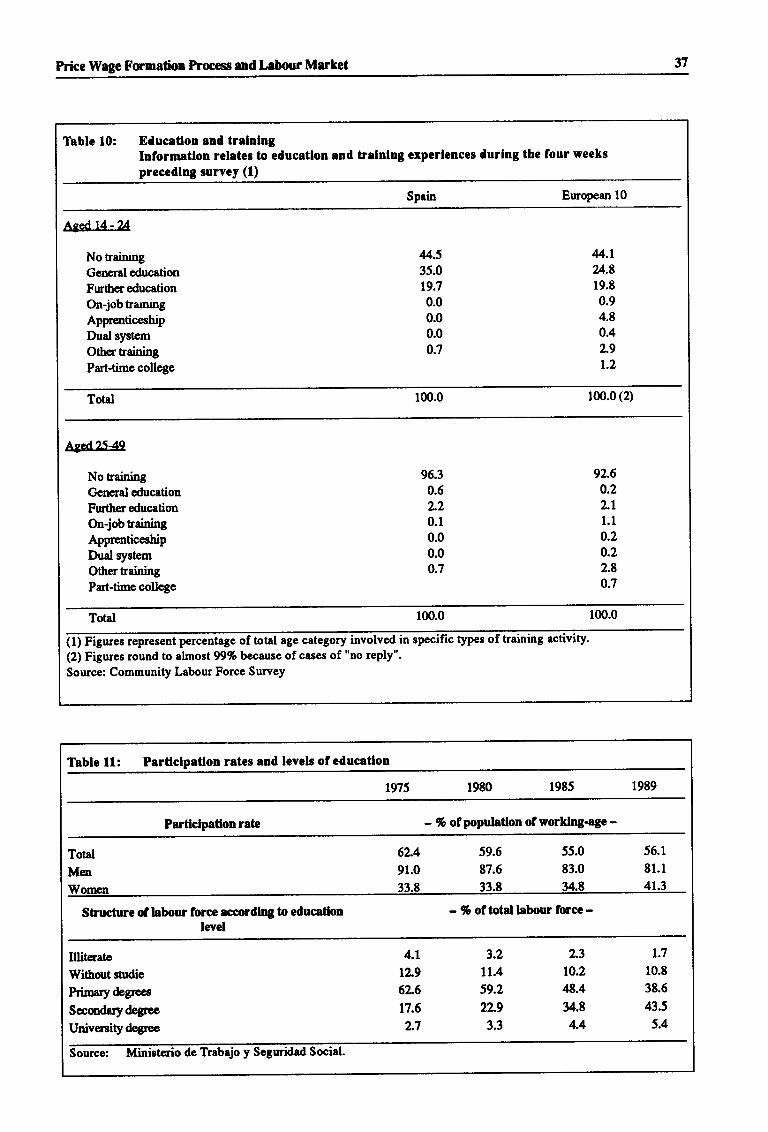
Price Wage Fmmatior Process rnd Labour Market 37
T[ble 10: Educaflon and trelnlngInformetlon relates to educatlon and tralnlng cxperlences durlng the four wecks
prccedlng survcy (1)
Spain Ernopean l0
Aged14-?/l
No fainingGercral educationFurther educationOn-jobtramingApprenticeshipDud rysrcmOther trainingPart-time college
u.535.0t9.70.00.00.00.7
4.1u.819.8
0.94.80.42.91.2
Total 1m.0 100.0 (2)
ASed 2{4q
No trainingGereral educetionFurther educationOn-jobtainingApprenticeshipDual system
OthertrainingPart-time college
96.30.62.20.1
0.00.0o.7
92.6o.22.t1.1
0.20.22.80.7
Total 100.0 100.0
@intageoftotal8gecstegoryinvolvedinspecifictypesoftrainingactivity.(2) Figures round to almost 997o because of cases of "no reply".Source: Community Labour Force Survey
Table 11: Pardclpatlon ratcs and lcvels ofeducatlon
1975 1980 1985 1989
Parflclpaflonrate - % ofpopulaflon ofworklng.age -
Total 62.4 59.6 55.0
Men 91.0 87.6 83.0
rrnmr 33.8 33.8 34.8
56.1
81.1
4t.3
Structure ollabour lorcr mrdlng to educatlonlevel
- % oltotal labour lorcc -
Illiterate
Withorts$diePrimary>esSccondarydegrce
University degree
4.1
r2,g6L617.6
2.7
3.2
11.4
59.2
2L93.3
2.3
to.28.434.8
4A
1.7
10.8
38.6
43.5
5.4
Source: Ministerio de Trobajo y Seguridad Sociel.
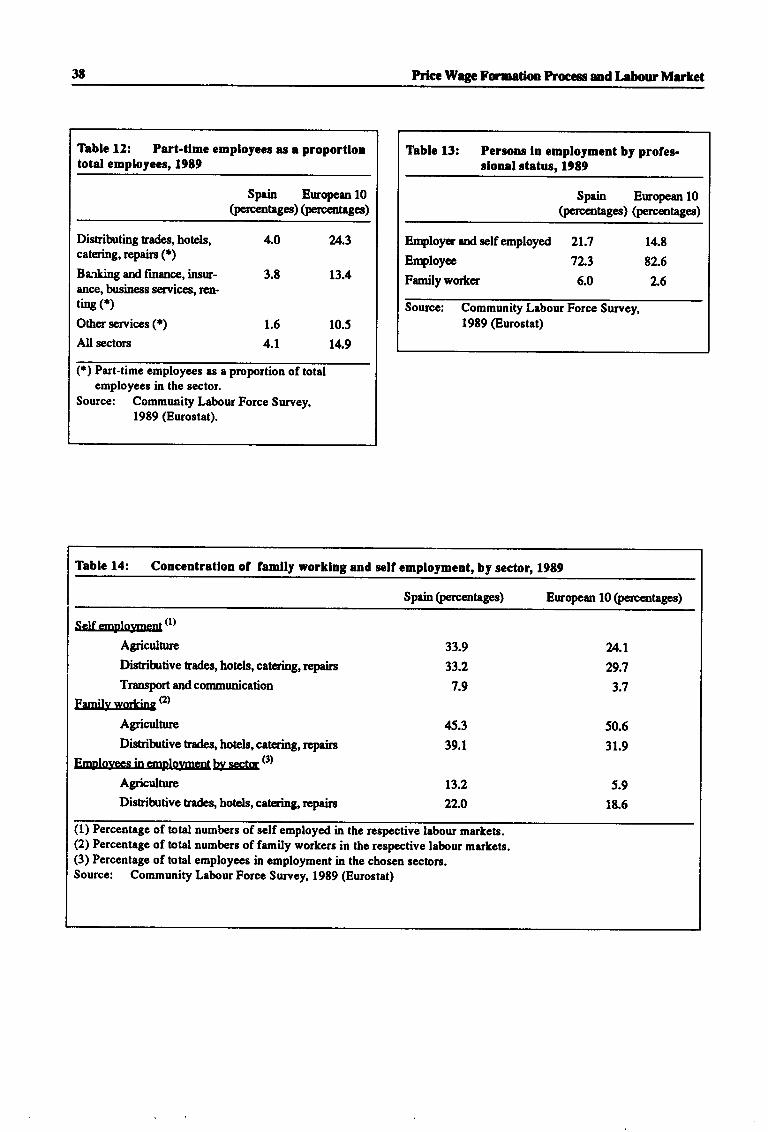
3t Pricc Wegc Fu'uetion Pnoccss and labourMarket
T[blc 12: Part.tlmc cmployees as e proportlontotal employeesr l9t9
Spain European 10(pencentages) (perccntages)
Disuibuting trades, hotels,catering, repairs (*)
Ba.rking ard finance, insur-ance, business serrrices, ren.trng (*)
Other serrrices (*)
All sectors
3.8
1.6
4.1
10.5
14.9
t3.4
(.) Parhtime employees as a proportion of totalemployees in the sector.
Source: Community Labour Force Survey,1989 (Eurostat).
llrblc 13: Pcrcons ln cmployment by profes.slonal stetus, 19t9
Spain European 10(perccntages) (percentages)
Employer and self e,mployed 21.7 14.8
Eryloyee 7L3 82.6
Familyworker 6.0 L6
Source: Community Labour Force Survey,1989 (Eurostat)
Table 14: concentratlon ol lamlly rorklng and scll cmployment, by sector, r9t9
Spain (perccntages) Euopeur 10 (percentages)
Sclt-oployssuttr)Agriculture
Distihrtive trades, hotels, catering, repain
Transport and communication
Family working e)
Agriculture
Distibutive tsades, hotels, catering, rcpairs
Employees in employment by secton (3)
Agriculture
Distributive tredeg hotels, crtering, repairs
33.9
33.2
7.9
45.3
39.1
t3.2
2L0
24.1
29.7
3.7
50.6
31.9
5.9
18.5
(1) Percentage of total numbers of self employed in the respective labour markets.(2) Percentage of total numbere of family workers in the respective labour markets.(3) Percentage of total employees in cmployment in the chosen sectors.Sourcc: Community Labour Force Surven 1989 @urostat)
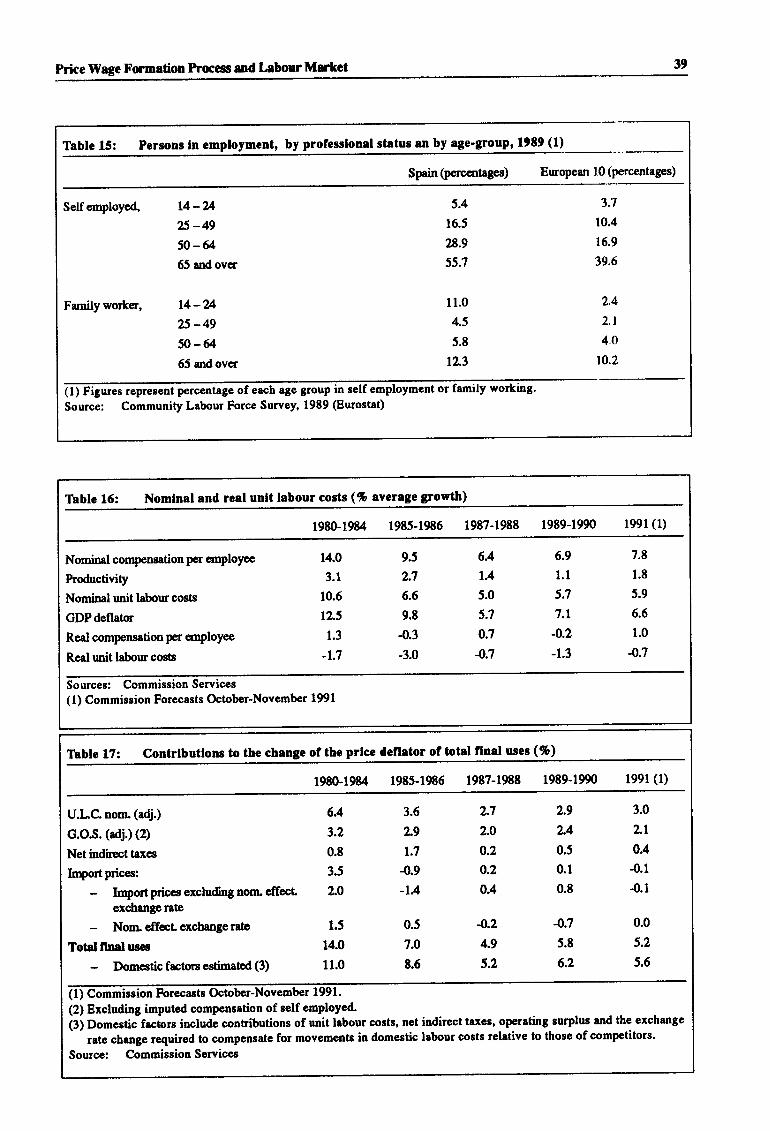
PriceWage tr'rmation kocess and LrbourMorlct 39
Tablc 15: Pcrsons ln cmployment, by prolcsslonal status an by age'group, l9t9 (l)
Spain (percentages) Ernopean l0 (percentages)
Self employed, t4-u25 -4950-6465 and over
t4-u25 -4950 -6455 and over
5.4
16.5
28.9
55.7
11.0
4.5
5.8
12.3
3.7
10.4
15.9
39.6
2.4
2.1
4.0
to.2
Family work€r,
mtgrlres represent percentage of eech 88e grouP in self employment or family working.
Source: Community Labour Force Surven 19t9 @urostat)
Tbblc 16: Nomlnal and reel unlt labour costs (% average growth)
1980-19&4 19E5-1986 1987-1988 1989-1990 1991 (1)
frlemind se6pensetion per employee
Productivity
Nominal unit labour costs
GDPdeflatc
Real compensation per emploYee
Reol rmit labour cosb
14.0
3.1
10.6
12.5
1.3
-1.7
9.5
2.7
6.6
9.8
4.3-3.0
6.4
1.4
5.0
5.7
0.7
-0.7
6.9
1.1
5.7
7.1
-0.2
-1.3
7.8
1.8
5.9
6.6
1.0
-0.7
Sourceg: Commiseion Services( l) Commisoion Forecasts October-November 1991
Thblc l7: contrtbuflons to the changc of thc prlcc defletor ol total flnal uscs (%)
1980-1984 1985-1985 1987-1988 1989-1990 1991 (1)
U.LC. nom. (adj.)
G.o.s. (adj.)(2)
Net indirect tares
Iryortprices:kryort priccs excluding nom. effecLexchangerate
Nom. effecl exchaoge ratc
Total flnd useo
Domestic factcs estimstod (3)
6.4
3.2
0.8
3.5
2.0
1.5
14.0
11.0
0.5
7.0
8.6
L72.O
0.2
0.2
0.4
4.24.9
5.2
2.9
L40.5
0.1
0.8
4.75.8
6.2
3.0
2.1
0.4
-0.1
-0.1
0.0
5.2
5.6
3.6
L91.7
4.9-1.4
(1) Commiseion Forecaste October-November 1991.
(2) Excluding imputed compeneation of eelf employcd.
igi po."rti" factors includi contsibutions of unit labour cortr, net indirect taxee, operating surplus and the exchange
rate change required to compensate for movements in domestic labour costr relativc to those of competitors.
Source: CommiesionServices
0 Cmpetitiveness and Extcrnal Performance
CHAPTER IICOMPETITIYENESS AND EXTERNAL PERFORMANCE
IN THE CATCHTNG-UP PROCESS (*)
Contents
l. Introduction .......41
2. The trade balance . . . .41
2.1. Trade performance since 1986 . . . . .41
2.2. Some explanatory factors . . . .42
2.3. Competitivenesseffects . . . . .4
3. Theinvisiblebalance .......45
4. The current account balance . . 46
5. Thecurrentaccountfinancing . . . . . 47
S.l.Overview ...47
5.2.Theexplanatoryfactors . . . . . 48
6. Threats and constraints from theexternalsector ...... 50
7. Summaryandconclusions ...51
SANCtilS I MARCO of the Monetary Directcare.Economies Directqate and Manuel(*) This chapter wasmainly preparedbyJulia SALAVERRIAMONTRI of the
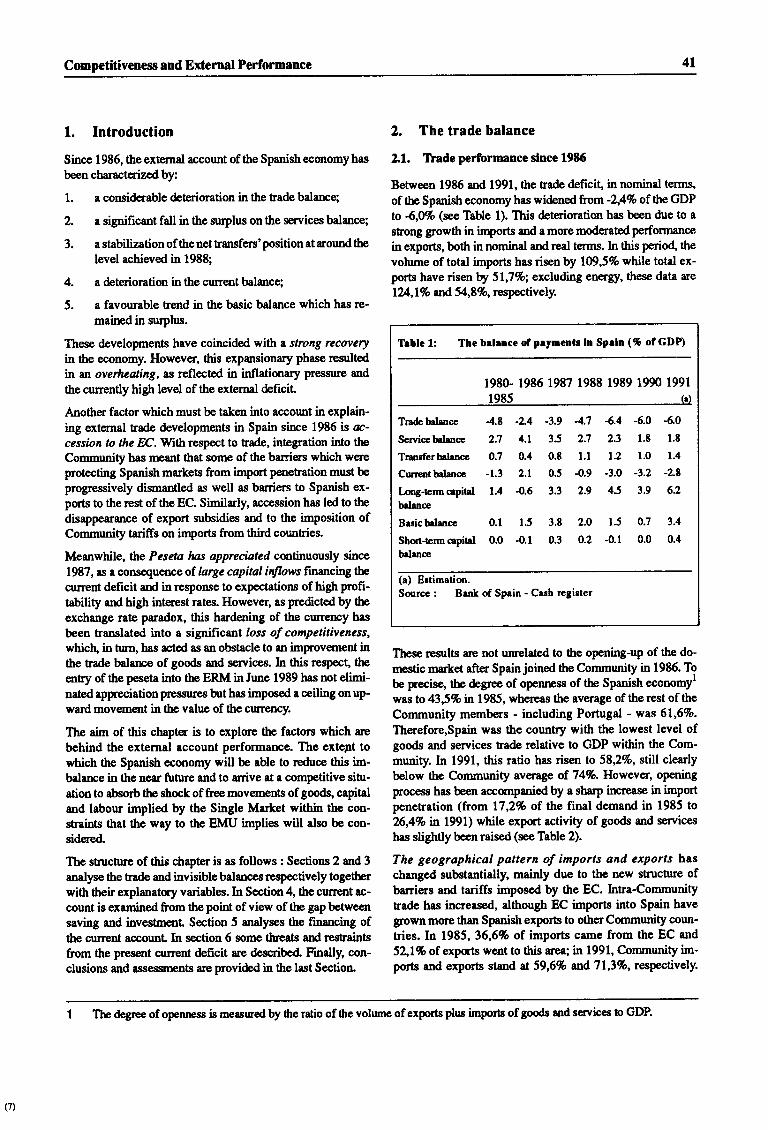
Competitiveness and External Performance 4l
1. Introduction
Since 1986, the external account of the Spanish economy has
been characterizdby:
1. a considerable deterioration in the trade balarrce;
2. a significant fall in the surplus on the senices balance;
3. a stabilization of thenet hansfers'positionat aroundthelevel achieved in 1988;
4. a deterioration in the current balance;
5. a favourable hend in the basic balance which has rc-mained in suplus.
These develop,nr.ents have coincided with a strong recoveryin the economy. However, this expansionary phase resultedit an overheating, as reflected in inllationary pressure and
the currently high level of the extemal def,rcil
Another factor which must be taken into account in explain-
ing extemal trade developments in Spain since 1986 is ac-cession to the EC. With respect to trade, integration into the
Cornmunity has rreant that some of the bariers which wereprotecting Spanish markets from import penetsation must be
progressively dismantled as well as barriers to Spanish ex-ports to the rest of the EC. Similady, accession has led to the
disappearance of export subsidies anl to the imposition ofCommunity tariffs on imports from third countries.
Meanwhile, the Peseta las appreciated continuously since
1987, as & consequence of. large capital inflows financing the
curent deficit and inresponse to expectations ofhigh proflt-
tability and high interest rates. However, as predicted by tbe
s1sfiange rate paradox, this hardening of the currerry has
been translated into a significant loss of competitiveness,whicb in tum, has acted as an obstacle to an improvernent inthe trade balance of goods and services. In this rcspect, the
entry of the peseta into the ERM in June 1989 has not elimi-nated appreciation pressures but has imposed a ceiling on up-ward movement in the value of the currency.
The aim of this chapter is to explore the factors which uebehind the external eccount performance. The extept towhich the Spanish oconomy will be able to reduce ttris im-balance in the near future and to arrive at a competitive situ-
ation to absorb the shock of free movements of goods, capitaland labour implied by the Single Mulret within the con-straints that the way to the EMU implies will also be con-sidered.
The structure of this chapter is as follows : Sections 2 and 3
analyse the tsade and invisible balances ralpectively togetherwith their explanatory variables. In Section 4 the current ac-
count is examined from the point of view of the gap betweensaving and inveshenl Section 5 analyses the financing ofthe current accounL In section 6 some theats and rcstraintsfrom the present current deficit are described Finally, con-clusions and asseswnts are provi&d in the last Section
2. The trade balance
Ll. Thadepcrforrnanccslnce 1985
Between 1986 and 1991, the trade deficit, in nomind terms,
of tbe Spanish economyhas widened from -2A%of theGDPto 4,Wo (see Table 1). This deterioration has been due to astrong growth in imports and a more moderated performance
in expo,rts, both in nominal and real terms. In ftis period, the
volume of total imports has risen W 109,5% while total ex-ports have risen by 5L,7%; excluding energlf, these data are
l24,1Eo and 54,896, respectively.
These rpsults arc not unnelated to the opening-up of the do-
mestic market after Spain joined the Community in 1986. To
be pnecise, th, d"Sr; of openrcss of the Spanish "conomyl
was to 43,596 in 1985, whereas the average of the rest of the
Community members - including Portugal - wts 6l,6%o.
Therefore,spain was the country with the lowest level ofgoods and services trade relative to GDP within the Com-
munity. In 1991, this ratio has risen to 58,2Vo, still clearly
below the Community av€rage of 74%. However, oPening
process has been aocunpanied by a sharp increase in importpenetration (fuom 17,2% of the final demand in 1985 to
26,4% in 1991) while export activity of goods and services
has slightly been raised (see Table 2).
The geographical pottern of imports and exports ha,s
changed substantially, mainly due to the new structure ofbariers and tariffs imposed by the EC. Intra-Communitytsade has increased, alttrough EC imports into Spain have
grown more thut Spanistr exports to other Community coun-
tries. In 1985,36,6qo of imports came from the EC and
52,19o of expqts went to this area; in 1991, Community im-ports and exports stand at 59,6% and7L3qo, respectively.
Trblc 1: The bdercc of, prymentr ln Speln (% of GDP)
1980- 1986 1987 1988 1989 1990 1991
1985 (r)
Tradebalencc -4.8
Servicc balance 2.7
Tnnrferbelancc O.7
Currentbalancc -1.3
Lnng-em capital 1.4
balanoe
Basicb.lrnc. 0.1
Short-term capitd 0.0
balencc
4.7 -6.4 -6.0 -6.0
2.7 2.3 1.8 l.tl.l t.2 1.0 1.4
-0.9 -3.0 -3.2 -2.t
2.9 4.5 3.9 62
2.0 1.5 0.7 3.4
0.2 -0.1 0.0 0.4
-2-4 -3.9
4.1 35
0.4 0.8
2.1 0.5
-0.5 3.3
1.5 3.8
-0.1 0.3
(a) Ertimation.Sorrcc : Bant of Spain - Carh rrgister
(?)
The degrec of openrcss is measured by the ratio of the volume of exports plue imports of goods and servic€s to GDP.
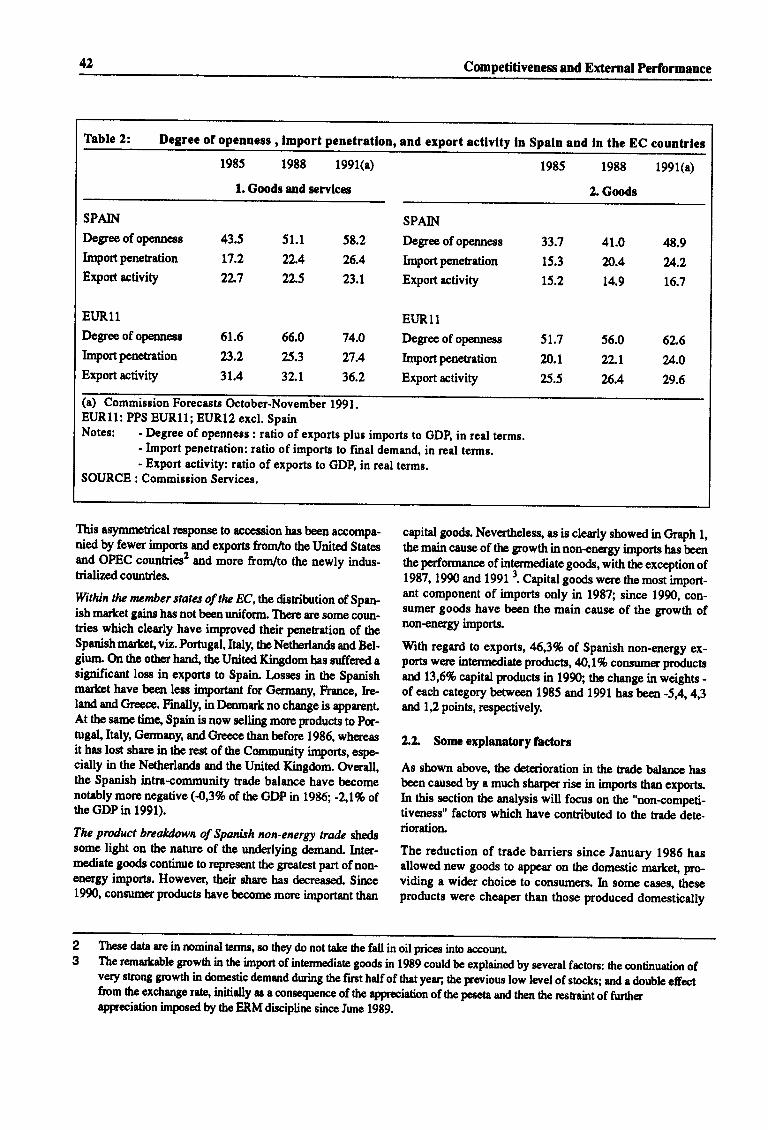
42 Competitivenes and Extcrnal Performance
Thble 2: Dcgrcc of openness , lmport penetratlon, and export acttvlty ln Spaln and ln the EC countrles
1985 1988 1991(a)
1. Goods and scrvlc€s
1985 1988 1991(a)
2. Gmds
SPAIN
Degee of openness
Inpo,rt penetration
Export activity
EUR11
Degree ofopenness 51.6 66.0
Importpenetration 23.2 25.3
Export activity 31,4 32,1
SPAIN
Degree ofopenness
Inrport penetration
Export activity
EI.JR11
74.0 Degee of openness
27.4 lnrportpenetration
36.2 Export activity
43.5
r7.2
22.7
58.2
26.4
23.1
33.7
15.3
15.2
41.0
20.4
14.9
56.0
22.1
26.4
48.9
u.216.7
62-6
u.o29.6
51.1
22.4
22.5
51.7
20.t
25.5
(a) Commisoion Forecaste October-November 1991.EuRll: PPS EUR11; EUR12 excl. SpainNotes: - Degree of openness : ratio of exports pluo imports to GDR in real terms.
- Import penetration: ratio of imports to final demand, in real termg.- Export activity: ratio of exports to GDR in real terms.
SOURCE : Commission Servicee.
This asynrmetrical response to accession has been accompa-nid by fewer imports and exports from/to the United Statesand OPEC counEies'and more from/to the newly indus-trialized cormtries.
withia tlu mentber states of tlv Ec,the disribution of spen-ish ma*et gains has not been uniforrn There are some coun-tries which clearly have improved their penetration of theSpanishmarkeg viz. Pornrgal,Italy, the Netherlands md Bel-giun On the otber han4 the United Kingdom has suffer€d asignificant loss in exports to Spain l,osses in ttre Spanishmar&et have besr less important for Germrny, France, he-land and Gree,ce. Fin"lly, in Dennrart no change is apparcnlAt thc same timg Spain is now selliag more products to por-tugal, Italy, Gennany, and Cireece than before 1986 wherersit has lost share in the rest of the Corrmunity irnports, espe-cially in the Netherlands and the Unitod Kingdom. Overall,the Spanish intra+ommunity tsode balance have becomenotsblymorenegative (4,3% of theGDPin 1gg6; -2,l7oof.the GDP in 1991).
The pruduct breadowa of Spanish non-energy trade shdssome light on the nature of the undedying demand. Inter-mediate goods continue to represmt the greatest part of non-energy imports. However, their strare has decreased Sfurce1990, consurner products have become more important than
capital goods. Nevertheless, as is cleady showed in Graph 1,the main cause of the growth in non-enerry imports has beenthe performance of intermediate goods, with the exception of1987, 1990 urd 1991 3. Capitat goods were the most import-ant component of imports only in 1987; since 1990, son-sumer goods have been the main cause of the growth ofnon-energy imports.
With regard to exports, 6,39o ot Spanish non-energy ex-po,rts wq'e int€rnEdilte prod,rcts, 40,196 consumer productsLtd 13,6% capital products in 1990; the change in weights -of each category between 1985 and 1991 has be€n -5,4, 4,3ald 1,2 points, respectively.
2.L Some explanatory lactors
As shown abovg the &terioration in the trade balrme hasbeen cused by a much sharper rise in imports than exports.In this section the analpis will focts on the "nonrompeti-tiyeness" factors which heve contributed to the trade dete-rioration
The reduction of trade barriers since January 1986 hasallowed new goods to appar on the domestic nrartet, pro-viding a wider choic€ to consum€rs. In some cases, theseproducts were cheaper than those produced domestically
23
These data are in nominal terms, eo they do not take 0re fall in oil prices into accounrThe reeirartable Srowth in the import of infermediate goods in 1989 could be explained by several factors: the continuation ofvery strrong growth in domegtic demand during ttre fust half of thatyear; the prerrious low level of stocls; ard a double efrectfiom ttre excfiange rate, initially as I oonsequenqe of 0re appreciation of the peseta and then the rcstaint of furlhcrappreciation imposed by the ERM discipline since June 1989.
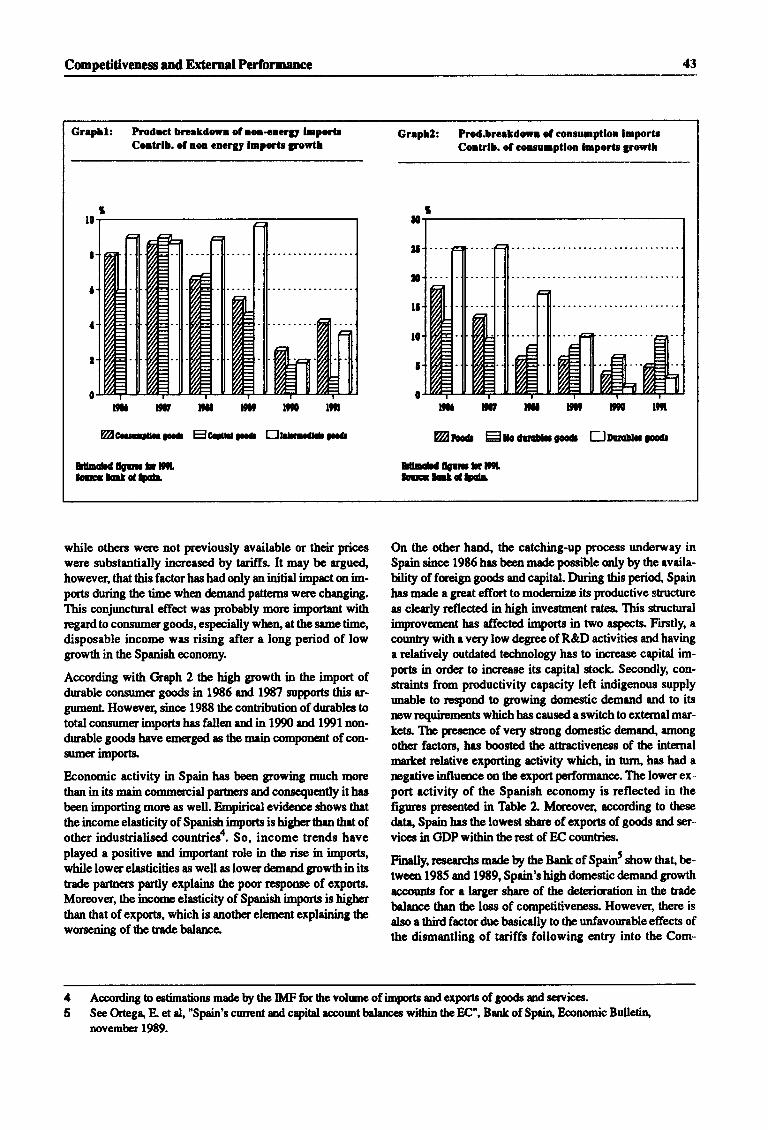
Competitiveness and Extcmal Performance 4t
Grrphl: Produc{ brcrkdwr of aor-orcrjr lnportrContrlb. ol nor cncr3Sl lnporlr 3rcrtl
Grrpl2: Prod.brcrtdovr of consumptlor lmportrCortrlb. of colrumptlm luporir grovti
naa ro@ws
E[noh![gurbl9i.lEClof Chdr
mnDromlEcarlrcr Efrrrrrrlo Ww Erocsotrcooo f]ouotroocr
Hrildn6rlhlltlocct.llCldt
mn
while others ww not previously available or their priceswere substantially increased by tariffs. It may bc argudhowever, that this factorhas had only an initial impact on im-puts during the time when &mandpatt€rns were changing.This conjunctural effect was p'robably mqe iryqtant withregardto conzumergoods, especially wheq at thesametime,disposable income was rising after a long period of lowgrowth in the Spanish oconomy.
According with Graph 2 the hieh growth in the import ofdurable qonsumer gmds in 1986 ard 1987 sppmts this ar-gumeDL Howwer, sinoe 1988 the contibution of duables !ototal consumer imports has fallen aDd in 1990 and 1991 non-durable goods have emerged as the main compomt of con-srmerimports
Economic activity in Spain has been growing much morpthan in its main commercial parturs rnd consequently it has
beenimportingmort as well. Empiricelevi&re Sows thettheincomeelasticity of Spanish iryorts is higherthan that ofother industrialised countriesa. So, income trends hrveplayed a positive and important role in tbe rise in imports,while lower elasticities as well as lower demand growth in itstrade partrers prtly explains the poor rcsponse of expo,rtsMoreover, the incre elasticity of SpaniS imports ishigh€rthan that of exports, which is another element expleining theworsening of the tradebalarce.
On the other hand, the catching-up prooess underway inSpain since 1986 has bcen made possible mly by the evaila-Ulity of foreign goods and capitil. During tttis perio( Spainhas made a great effut to modcmize its p,roductive stmctureas clerly reflected 6 high investment rates. This structuralimprovement has affected imports in two aspects. Fintly, a
country with a very low degree of R&D activities and havinga relatively outdated technology has to increese capital im-pmts in order to increase its capital stock Secondly, con-shaints from productivity capacity left indigenous supplyunable to re,spond to growing domestic demand and to itsrew requirc,ments which has cursed a switch to extemal mer-kets. Tb Feserce of very strong domestic dernan4 amongotber factus, hes boosted the attsactiveness of the internalma*et relative exporting activity which, in tun, has had arrgetive influerrcie on the expct performanoe. The lower ex-port activity of the Spanish cconomy is reflected in thefigrues presented in Table I Moreover, rccoding to thpse
dat, Spain has the lowe$ drre of exports of goods ard ser-
viccs in GDP within tbc rest of EC comtries.
Finally, researchs made by the Bank of Spain5 strow that, be-
tween 1985 and 1989, Spain's high donestic &mand growthaccounts for a lrger share of the deteriaation in the trade
bclance then the loss of cunpetitiveness. However, there isalso a third factordue basicdly to tbe unfavourable effects ofthe dism8ntling of tariffs following entry into the Com-
45
Aocording b estimations madc by tlp IMF for lte volume of imports and exports of goodt md services.
See Ortega E €t al, "Spain'e current urd capitrl account bslancc within the EC", Bank of Spain Economic Bullain,november 19t9.
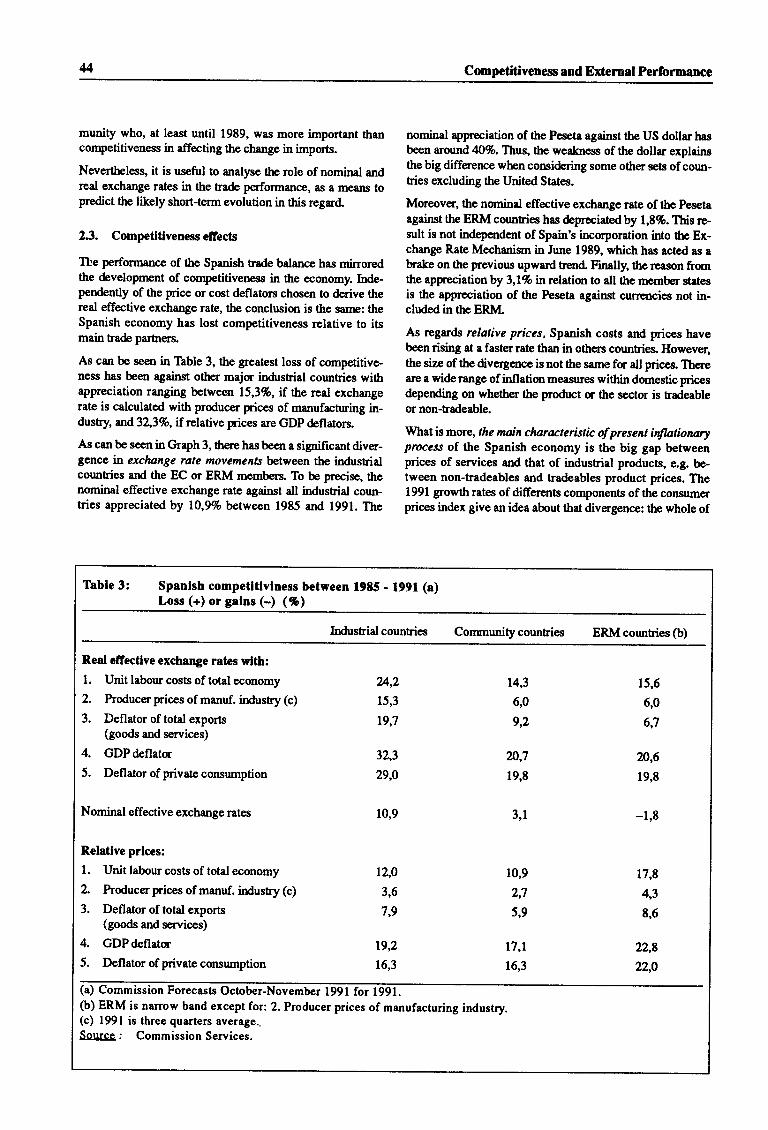
4 Competitiveness and External Performance
munity who, at least until 1989, was more important thancompetitiveness in affecting the change in imports.
Nevertheless, it is useful to analyse the role of nominal andreal exchange rates in the tra& performance, as a means topredict the likely short-term evolution in this regard.
23. Competltlvenesseffects
TL,e performance of the Spanish rade balance has mirroredthe development of competitiveness in the economy. Inde-pendently of the price or cost deflators chosen to derive thereal effective exchurge rate, the conclusion is the sarne: theSpanish economy has lost competitiveness relative to itsmain ha& partrers
As can be seen in Table 3, the greatest loss of competitive-ness has been against other major in&rstrial counhies withappreciation ranging between l5,3Eo, if the real exchangerate is calculated with producer prices of manufachring in-dusty, and 32,3Eo, if relative prices are GDP &flators.
As can be seen in Graph 3, there has been a sipificant diver-gence in exchange rote movemenir between the industsialcountries ard the EC or ERM members. To be precise, thenominal effective exchange rate against all industrial coun-tries appreciateAby lO,9% between 1985 and 1991. The
nominal appreciation of the Peseta against Ore US dollar hasbeen around 4096. Thus, the wealness of the dollar explainsthe big differerrce when consi&ring some other sets of coun-ties excluding the United States.
Moreover, the nominal effective exchange rate of the Pesetaagainst the ERM countries has &preciated W 1,8%. This re-zult is not independent of Spain's incorporation into the Ex-change Rate Mechanism in June 1989, which has acted as ab,rake on the previous upward trend" Finally, the reason fromthe appreciationby 3,1?o in relation to all the member statssis the appreciation of the Peseta againsl currencies not in-cluded in the ERlvI"
As regards relative prbes, Spanish costs and prices havebeenrising at a fasterrate than in others countries. However,the size of the divergence is not the same fc all prices. Thereare a widerange of inllation measures within domestic pricesdepending on whether the product c the sector is tradeableornon-tradeable.
What is more, the main characteristic of present i$lalionoryprocess of the Spanish economy is the big gap betweenprices of sen ices and that of industrial products, e.g. be-tween non-tradeables and tradeables product prices. The1991 growth rates of differents components of the consumerprices index give an idea about that divergence: the whole of
Thble 3: Spanlsh competltlvlncss betwccn 1985 - 1991 (a)Loss (+) or galns (-) (%)
krlustrial countries Conununity countries ERM countries (b)
Real effectlve exchange rates wlth:1. Unit labour costs of total economy
2. Producer prices of manuf. industry (c)
3. Deflator of total exports(goods and services)
4. GDPdeflator
5. Deflator of private consumption
Nominal effective exchange rates
R.elatlve prlces:
1. Unit labour costs of total economy
2. Producer p,rices of manuf. industry (c)
3. Deflator of totd exports(god and services)
4. GDPdeflator
5. Deflator of private consrunption
U,215,3
19,7
32,3
29,0
10,9
14,3
6,0
9,2
?.0,7
19,8
3,1
15,6
6,0
6,7
?n,6
l9,E
-1,8
12,o
3,6
7,9
19,2
16,3
10,9
2,7
5,9
17,L
16,3
17,8
4,3
8,6
22,8
22,0
(a) Commission Forecasts October-November l99l for 1991.(b) ERM is narrow band except for: 2. Producer prices of manufacturing industrlr.(c) 1991 is three quarters average..Source : Commission Services.
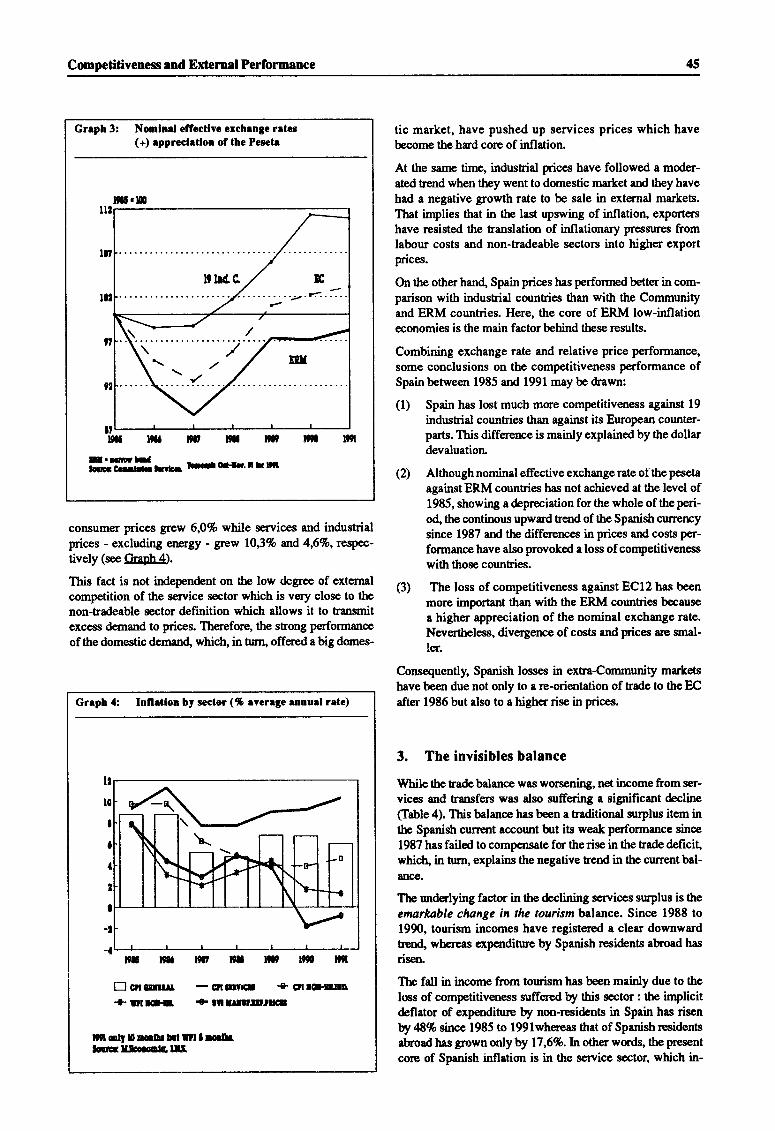
Cmpetitiveness rnd Extcmal Performance 45
Grrph 3: Nomlnel eflectlve erchenge retes(+) epprccletlon of the Pegetr
rta rt m rn
Hffi.Ht-.. hdetrr.irrln
l$l.S
consumer prices grew 6,07o while services and industrialprrces - excluding €rsgy - grew 10,37o urd 4,61o, rcsp€c-tively (see Graph A).
This fact is not independent on the low &gree of externalcompetition of the service secto,r which is very close to the
non-tradeable sector definition which allows it to transnritexcess deurand to prices. Therefore, the strong performance
of the domestic deman4 which, in turn, offered abig domes-
tic market, have pushed up services prices which havebecome the hard core of inflation.
At the sanre time, industrial prices have followed a moder-ated trend when they went to domestic martet and they have
had a negative growth rate to be sale in external markets.That implies that in the last upswing of inflation, export€rs
have resisted the translation of inflationary pressures fromlabour costs and non-tradeable sectors into higher export
Pnces.
On the other hand, Spain prices has perfornrcd better in com-parison with industrial countries than with the Communityand ERM countries. Here, the core of ERM low-inllationeconomies is the main factor behind tlrese rezults.
Combining exchange rate and relative price performance,
some conclusions on the competitiveness performance ofSpain between 1985 and 1991 may be drawn:
(1) Spain has lost much more competitiveness against 19
indusbial countries than against its European counter-parts. This diff€rerce is mainly explained by the dollardevaluation
(2) Although nominal effective exchange rate of the peseta
against ERM countries has not achieved at the level of1985, showing a depreciation for the whole of the peri-od, the continousupward trend of the Spanish cureneysince 1987 and ttp differerrces in prices and costs per-formance have also provoked a loss of competitivenesswith those counhies.
(3) The loss of competitiveness against ECl2 has been
more important than with the ERM countries because
a higher appreciation of the nominal exchange rate.Nevertheless, divergence ofcosts and prices are srnal-
ler.
Consequently, Spanish losses in exha{ommunity markets
have been due not only to a re-orientation of trade to the ECafter 1986 but also to a higher rise in prices.
3. The invisibles balance
While the trade balance was worsening, net income from ser-
vices rnd hansfers was also zuffering a sigrrificant &cline(Iable 4). This balance has been a traditional mrplus item inthe Spanish curr€nt account but its weak performance since
1987 has failed to comp€nsate fm the rise in the trade deficifwhich, in turn, explains the negative trend in the current bal-anqe.
The underlying factor in the &clining services surplus is the
enarkable clwnge in the tourism balance. Since 1988 to1990, tourism incomes have registered a clear downwardhen4 whereas expenditure by Spanish resi&nts abroad has
risen
The fall in income from towism has been mainly due to the
lms of competitiveness suffered by this sector : the implicitdeflator of expenditure by non-residents in Spain has risen
W 48% sincc 1985 to 1991whereas that of Spanish rpsidents
abroad tras grown only by 17,6%. In other wor&, the present
core of Spanish infl$ion is in the service soctor, which in-
Grrph rl: Inllrtlon by sector (% rvcrrgc ennuel rrle)
Iflo t9ta t9tr tcl rI' rs rtn caemur - orrrmr 's cnrc{uru* tillc{. + tltuntllt ffi!
ftol' lLdbhtmlullllGCIem!&lIA
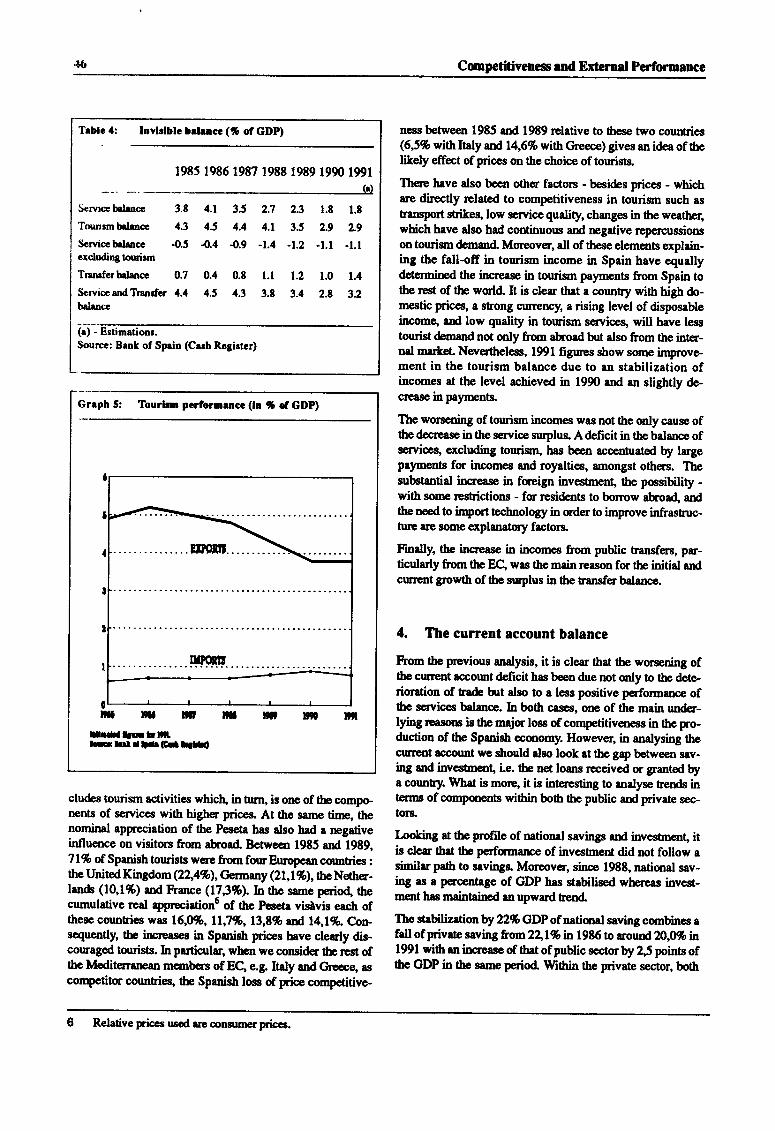
fi Cmpeti3ivcness end External Performame
Trble {: Invlslblc behlcc (% ol GDP)
1985 1e86 1987 1988 1989 19q) 1991(r)
Servrcc balancc 3.t 4.1 35 2.7 2.3 l.t t.tTounsm baLncc 4.3 45 1.4 4.1 35 2.9 2.9
Scrviccbdancc -0.5 -0.4 -0.9 -1.4 -1.2 -l.l -l.lexcluding tourirm
Tranrferbdencc 0.7 0.4 0.t l.l 1,2 1.0 1.4
Scrvicc rnd Tnndcr 4.4 4.5 4.3 3.t 3.4 2.t 12balance
(r) - Estimationr.Sourcc: Benk of Spria (Cuh Rcgirter)
cludes tourisrn activities whictU in turrU is one of the compo-nents of services with higher prica* At the same tirne, thenominal appreciation of the P€s€ta has dso bad a regativeinfluence on visitors from abroad Between 1985 and 1989,7 1% of Spanish tourists w€rc from four Europcan corntsies :the United King dom (22,49o),Crermany (21, I %), tbe Nether-lads (10,1%) and kance (17,3%).In the same peno( thecumulative real appneciuiono of lhe Peseta vislvis each ofthese countries was 16,0%, 11,7%, 13,t% rnd l4,lgo. C-on-sequently, tb ircreases in Spanifi prices have clerly dis-couraged tourists. In particular, when we consider tbe re.st ofihe Meditcrrarean rncmbcrs of EC, e.g. Italy rnd Greoce. ascornpetitor counEies, the Spanish loss of price competitive-
ness between 1985 and 1989 relative to these two countries(6J% withltaly andl4,6?owith Cireece) gives an idea of tbelikely effect of pnce.s on the choice of tourists.
There heve dso been other facton - besi&s prices - whichare directly related to competitiveness in tourisrn such as
tsansport strikes, low sen ice quality, changes in the weather,which have also had continuous and negative repercussionson tourim demand Moreover, all of these elements explain-ing the fell-off in tourism income in Spain have equallydeterrdned the incr€ase in tourisur pa,rments from Spain tothe rest of the world. It is clear that a country with high do-mestic prices, a strong currerrcy, a rising level of disposableincomg end low quality in tourism senices, will have lesstourist demrndnot only from abroad but also from the inter-nd mrrtet Nwertheless, 1991 figur€.s $ow sme improve-ment in thc tourism balance due to an stabilizetion ofincomes at the level achieved in 1990 and an slightly de-crease in peyrents.
The worsening of tourisrn incom€s was not the mly caur ofthe decre8se in the semice suplus. A defrcit in tbe balance ofservices, excluding tourism, hrs been accentuatod by largeps,rments fq incomes and royalties, amongst others. Thesubstantial increase in foreign investsnent, the possibility -with some re.strictions - fr residents to borrow abroaq andthe need to irnport technology in mder to improve infrastruc-tur€ arc some explanatmy factors.
Frn"lly, the increase in incomes from public transfers, pr-ticularly from the EC, wrs the main reason for the initial andcurrent growth of tbe surplus in the transfer balance.
4. The current account balance
From the previous analysis, it is clear that the worsening ofth cunent account &ficit has been due not only to tbe dete-rication of trade hlt dso to a less positive performance ofthe services balanoe. In both calrcs, one of the main under-lying reasom is the major loss of competitiveiress in the pro-duction of tbe Spanish ocmomy. Howwer, in analysing 0recur€nt eccount we Sould also look 8t the gsp between sav-ing and investurent, i.e. the net loans received or granted bya country. What is more, it is interesting to analyse beds interms of compqrents within bottr the public and privaie sec-tor&
Looking at the profilc ofnational savings rnd investnent, itis cler that tbe perfamame of inves&nent did not follow asimilar path to sevi4gs. Mueover, since 1988, national sav-ing as a percentage of GDP has strbilis€d wbereas invest-ment bas mainteined anupward hend.
Ihc steUlizationby22%GDP of natiural saving cornbines rfdl of private saving from 2\l% n 1 985 io round 2A,Uh n1991 with m increase of thet of public scctor by 2,5 points ofthe GDP in the same p€riod Within the privrte sector, both
Greph 5: Tourlrrn porformtrcc (h S of GDP)
BDom,
u?oll
raaniltIIr.faltrrf lli.lchrd|.arC-D!ta0
ti
6 Relative pices usod are consumerpricee.
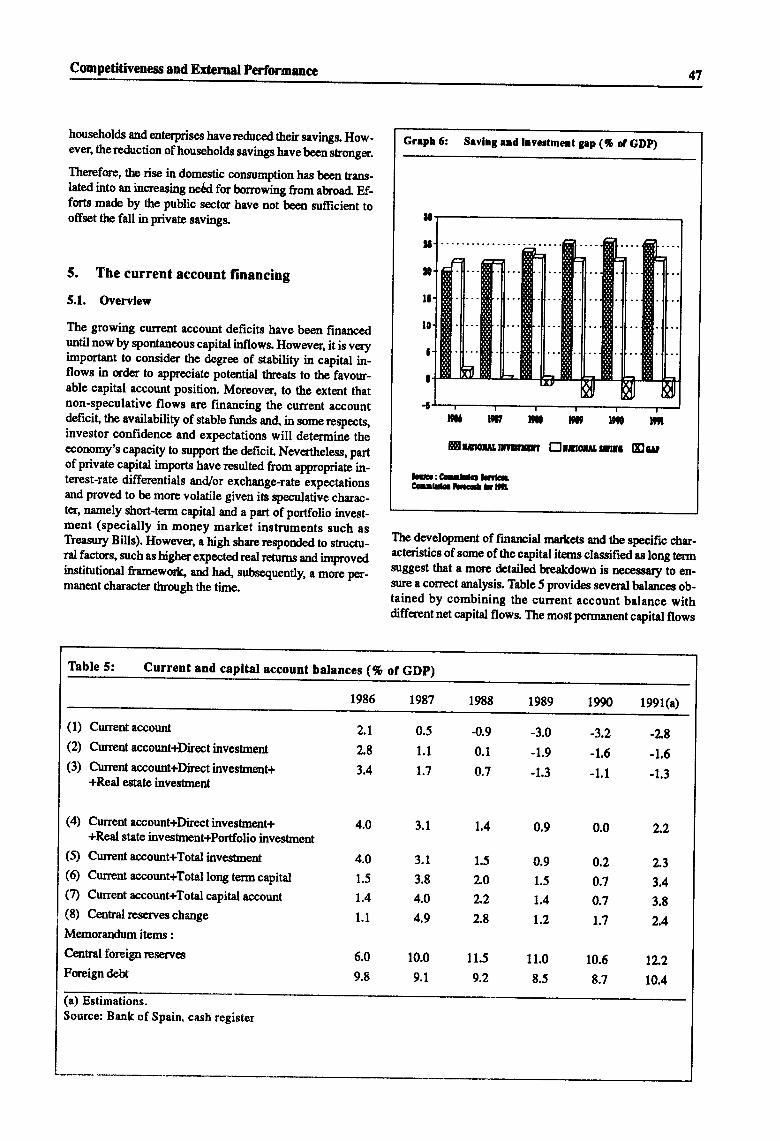
Competitiveness and External performrnce47
households and enterprises have redrced their savings. How-ever, there&rction of households savings havebeen sbonger.
Therefore, the rise in domestic conzumption has been tsans-lated into an increasing ne6d for burowing from ab,road. Ef_futs made by Ore public sector have not been sufficient tooffset the fall in private savings.
5. The current account financing
5.1. Overylew
The growing current account deficits have been financeduntil now by spontaneous capital inflows Howwer, it is veryimportant to consider the degroe of stability in capital in-flows in order to appreciale potential tlreats to firJfavour-able capital account position. Moreover, to the extent thatnon-speculative flows are financing the current account
feficit, the availability of stable fturds an4 in somerespects,investor confidence and expectations will determine the
tongmy's capacity to support the deficil Nevertheless, partof p,rivate capital impo,rts have resulted from appropriate. in-terest-rate differentials and/or exchange-rate expectationsand proved to be more volatile given its speculative charac_ter, namely short-term capital and a part of portfolio invest-ment (specially in money market instruments such asTreasury Bills). Howw€r, I high sharercqponded to s&uctu-
1l factors, such as higher expectedreal retums and imp,rovedinstitutional framewolt, and had, subsequently, a more per-manent character through the time.
The development of finarrcial merlcets and the specific char-acteristics of some of the capital iterns cla$ified as long termsuggest that a mqe detailed breakdown is necessar5l to en-sure a comect analysis. Table 5 prwides several balances ob-tained by combining the current account balance withdifferent net capital flows. The most permanent capital flows
Current and capltal account balances (% of GDp)
Grepl 6: Sevlng rnd tnvcr0mcnt $p (% o, GDp)
t0
u
T
It
te
Ha nl' DI n' rrErmurrnnnrur Efrnolunr
lcc.:C0!50hrlrl,CErblc.tiqtlt ,
lct
Ecp
1986 1987 1988 1989 1990 1991(a)
(1) Currentaccount
(2) Current account+Direct investment
(3) Current account+Direct invesfinent++Reel estate inveshent
(4) Current account+Direct invesfn€nt++Real state invesfnent+Portfolio invesfrnent
(5) Current account+Total investment
(Q Current account+Toial long term capital(7) Cunent account+Total capital account
(8) Centralreserveschange
lvlernorandum items :
Cenbal foreipreserrres
Foreign det*
2.1
2.8
3.4
4.0
4.0
1.5
1.4
1.1
6.0
9.8
0.5
1.1
t.7
3.1
3.t
3.8
4.0
4.9
10.0
9.1
{.90.1
0.7
1.4
1.5
2.0
2.2
L8
11.5
9.2
-3.0
-1.9
-1.3
0.9
0.9
1.5
1.4
1.2
11.0
8.5
-3.2
-1.6
- 1.1
0.0
0.2
0.7
0.7
t.7
10.6
8.7
2.2
2.3
3.4
3.8
2.4
12.2
10.4
-L8-1.6
-1.3
(a) Estimations.Source: Bank of Spain, cash register
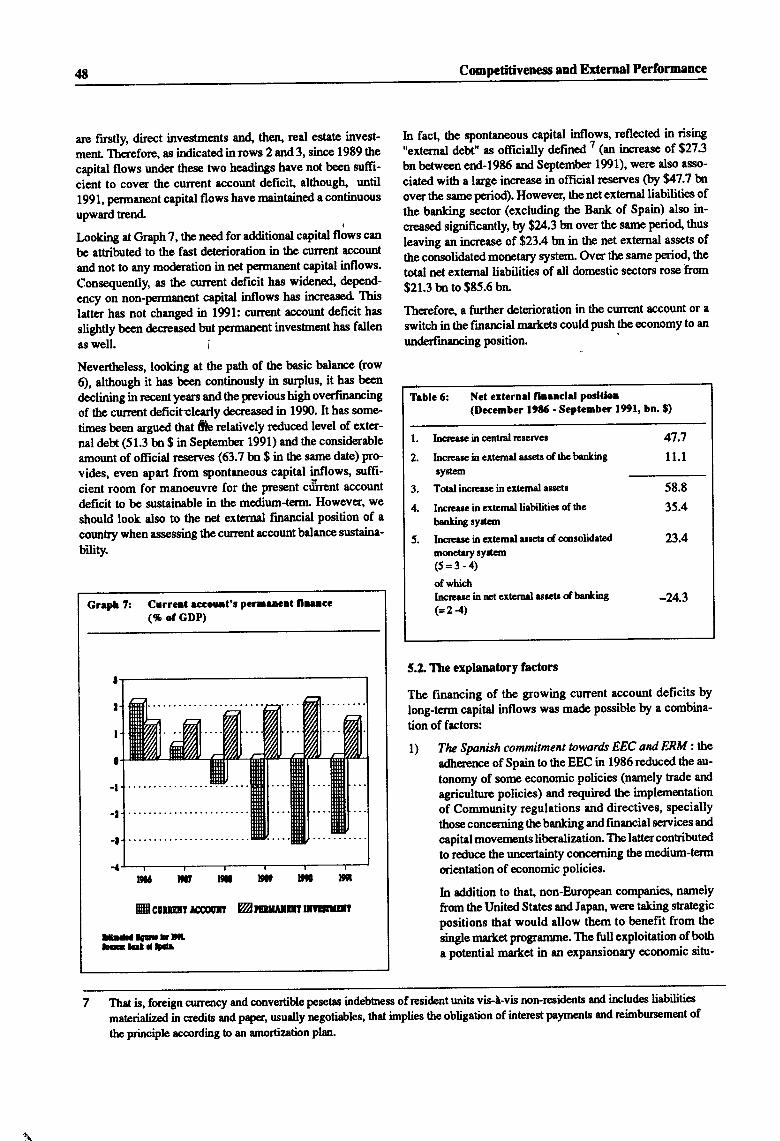
48 Cmpetitiveness end External Performance
arc frstly, direct investments an4 then' real estate invest-
menL Therefore, as indicated inrows 2 and 3, since 1989 the
capital flows under these two headings have not been sufFr-
cient to cover the curent account deficit althoug[ until1991, permarnnt capital flows have maintained a continuous
upward trend. ,
Looking at Graph 7, the rped for additional capital flows can
be atfibuted to the fast de.terioration in the current account
and not to any mo&ration in net P€mlarent capital ffiows.Consequently, as the current deficit has widene4 depend-
ency on non-p€rman€nt capital inflows has incr€ased" This
latter has not changed in 1991: cun€Nrt account deficit has
slightly been &creased but permanent investsnent has fdlenas well. ;
Nevertheless, looking at the path of the basic balance (row
6), although it has be€n continously in surplus, it has been
declining in recent years urd the previous high overfinarrcing
of the current deficitclearly &creased in 1990. It has some-
times been aryued that lhe relatively reduced level of exter-
nal detlt (51.3 bn $ in September 1991) and tlre considerable
amount of official resenes (63.7 bn $ in the same date) pro'vides, even apart from spontaneous capital inllowg zuffi-
cient room for manoeuvre for the present crlrrent account
deficit to be sustainable in the medium-terrn However, we
should look also to the net external financial position of a
country when assessing the current account balance sustaina-
bility.
Grrph 7: Currenl tccount't PcrDucrt llrencc(% ofGDP)
t
,
I
0
-t
-l
r{a rr ltfficuunrmurr
Urll.IG!!!hlrltLGbtllCr
ilrtrt
Z/wrllmurlrlttr,;t
In fact, the spontaneous capital inflows, reflected in rising
"extemal debt" as offrcially defined ' (an irrrease of $27.3
bn between erd-1985 and September 191), were also asso-
ciated with a large increase in official reserves (by $47.7 bn
over the same period). However, the net external liabilitie's ofthe banking sector (excluding the Burk of Spain) also in-creased sigrificantly, by $24.3 bn over the same period' thus
leaving an increase of $23.4 bn in the net external assets ofthe consolidated monetary system. Over the same penod' the
total net external liabilitie's of dl domestic sectors rose hom
$21.3 bn to $85.6 bn
Therefore, a furtlrer &terioration in the current account or a
switch in the financid markets could push the economy to an
underfmancing position.
5.2 The explanatorY factors
The financing of the growing curent account deficits by
long-term capital inflows was ma& possible by a combina-
tion of facton:
l) The Spanish commitment towards EEC ail ERlil :rheadhererrce of Spain to the EEC in 1985 reduced the au-
tonomy of some economic policies (namely trade ard
agriculture policies) and required the irnplementation
of Community regulations and directives, speciallythose conceming thebanking and financial services ard
capital movernents liberalization The latter conributedto reduce ttre uncertainty concerning the medium-terntqientation of economic Policies.
In addition to that, non-European companies, namely
from 0re United States and Japarl wene taking strategic
positions that would allow them to benefit from the
single market programme. The full exploitatim of both
a potential martet in an expansionary economic situ-
7 That is, foreign cunency and oonvertible pesetas indeb[ress of resi&nt units vis-]-vis non-resideots and irrcludes liabilities
materializ€d in credits and paper, usurlly negotiables, that implies the obligation of intercst payments and reimbursement of
the principle rcoording to an unortization plan.
T[blc 6: Net cxtcrnel flnlnclel poslllon(Deccrnber l9t5 . Septcmbor 1991, bn.0)
l. Inccare in ccntral rcrerver 47.7
2. Incrcarc in encmd emets of lhe banhing 1 1.1
3. Toral incrcare in cxtemd assets 58.8
4. Irrcrerrc in cxternrl liabilitier of the 35.4benkhg ryilcm
5. Ircrcarc in cx.tcmdarcets of cmsolidated 23.4mqrctarY syrtre(5=3-4)of whichIncrerrc in ret extcrnal esrc$ of banking -21.3(=24)
:{
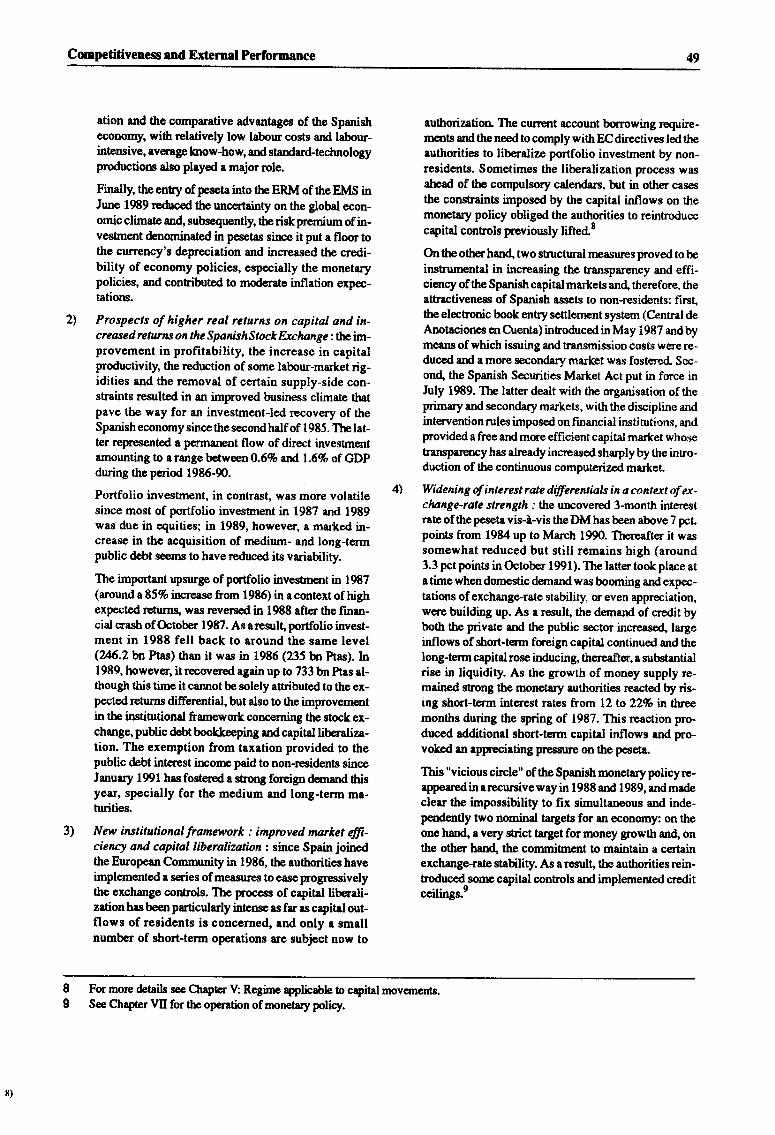
Competitiveness end External Performance 49
2)
ation and the comparative advantages of ttre Spanistreconomy, with relatively low labour costs ard labour-intensive, everage how-how, and standard{echnologyproductions also played a major role.
Finally, the enty of peseta into the ERM of rhe EMS inJune 1989 redrced the uncertainty on the global econ-omicclimate an4 subsequently, tberiskpremium of in-vestnent &nominated in pesetas sirce it put a floq tothe currency's depreciation and increased the credi-bility of economy policies, especially the monetarypolicies, and conbibtrted to moderate inflation expec-tations.
Prospects of higher reol returns on capital and in-creased returns on the Spanish$tock hchange : the im-provement in profitability, the increase in capitalproductivity, thp reduction of sorne labour-market rig-idities and the removal of certain supply-side con-straints resulted in an improved btrsiness climate thatpave the way for an investment-led r,ecovery of theSpanish economy since the second half of 1985. The lat-ter rcpresented a p€rmanent flow of direct investmentamounting to arange betw*n0.6?o ud l.6flo of GDPduring ttrc period 1986-90.
Portfolio investment, in contrast, was more volatilesince most of portfolio investnent in 1987 and 1989was due in equities; in 19E9, however, a marked in-crease in the acquisition of medium- and long-termpublic debt seerns to have reduced its variability.
The important upsurge of pctfolio investrnent in 1987(around a 857o increase from 1985) in acontext ofhighexpected retums, was reversed in 1988 after the finan-cial craslr of October 19t7. As aresult portfolio invest-ment in 1988 fell back to around the same level(246.2br,t Ptas) Oran it was in 1986 (235 bn Ptas). tr1989, however, it rocovered again up to 733 bn Ptas al-though this time it cannot be solely attributed to the ex-pectedretums diffe,rential, but also to the improvementin the institutional framework concerning the stock ex-churge, public debt bookkeeping and capital liberaliza-tion. The exemption from taxation provided to thepublic debt interest ircome paid to non-residents sinceJanuary 191 has fostered I strong fueign dernand thisyear, specially for the medium and long-term ma-turities
New institutional framework : impmved narket fii-ciency and capiul liberalization: since Spain joinedthe European Community in 1986, the authorities haveimplemented a series of measures to easeprogressivelythe exchange controls. The pocess of capital liberali-zationhasbeenputiculady intense as faras capital out-flows of residents is concerned, and only a smallnumber of short-term operations are subject now to
authorization The current account bo'rrowing require-ments and the need to comply with EC directives led theauthorities to lib€raliz€ portfolio investment by non-residents. Sometimes the liberalization process wasahead of tlrc compulsory calen&rs, but in other casesthe constraints imposed by the capital inflows on themorrtary policy obliged the authorities to reinhoducecapital ccrtrols previously lifted.E
Onthe otherhand" two structural rneasures p,roved to beinstrumental in increasing the transparency and effi-cienry of the Spanistr capital markets and, thereforc, theattractiveness of Spurish assets to non-residents: firslthe electronic book entry settlernent s.vstern (Central deAnotaciones en Cuenta) inhoduced in May 1987 urd bymeans of which issuing and transmission costs wercre-duced end a more secondar_v market was fostered Sec-ond, the Spanish Securities Market Act put in fmce inJuly 1989. The lafter dealt wi& the organisation of theprimaryand secondarymarkets, with the discipline andinten entionrules imposed onfinancial instinutions, andprovided a fuee andmore efficient capital market whosefansparency has alrcady increased sharply by the intro-duction of the continuous computerized martet.
4\ Widening of interest rate dfurentials in o context of ex-clange-rate strength.' the uncovercd 3-month intercstrate of the peseta vis-I-vis the DM has been above 7 pclpoints from 1984 up to March 1990. Thereafter it wassomewhat reduced but still remains high (around3.3 pct points in October 1991). The latter took place ata time when domestic demand was booming and expec-tations of exchange-rate stability, or even appreciation,were building up. As a re,sult, the demand of credit byboth the pnvate and the public sector increased largeinflows of short-term foreign capital continued and thelong-term capital rose inducing, thereafter, a subBtantialrise in liquidity. As the growth of money supply re-mained strong the mon€t8ry authorities reacted by ris-ing short-terrn int€rest rates from L2 to 22% in thleemonths during ttre spring of 1987. This reaction pro-duced additional short-term capital inflows and pro-voked an appneciating p,ressur,e on the peseta-
This "vicious circle" of the Spanish monetary policyre-appeaed in arecursive way in 1988 ard 1989, and madecleer the impossibility to flrx simultaneous and inde-pendently two nomind targets for aa econmry: on lheone hand, a very strict target for money growth an4 onthe other han( the commitrnent to maintain a certainexchange-rate stability. As a result the authorities rein-troduced sorre capital controls erd implemented creditceilingsg
3)
I9
For more &tails see Chspt€r V Regime applbable b capital movements.Soe Chapter YII for the operation of monetary policy.
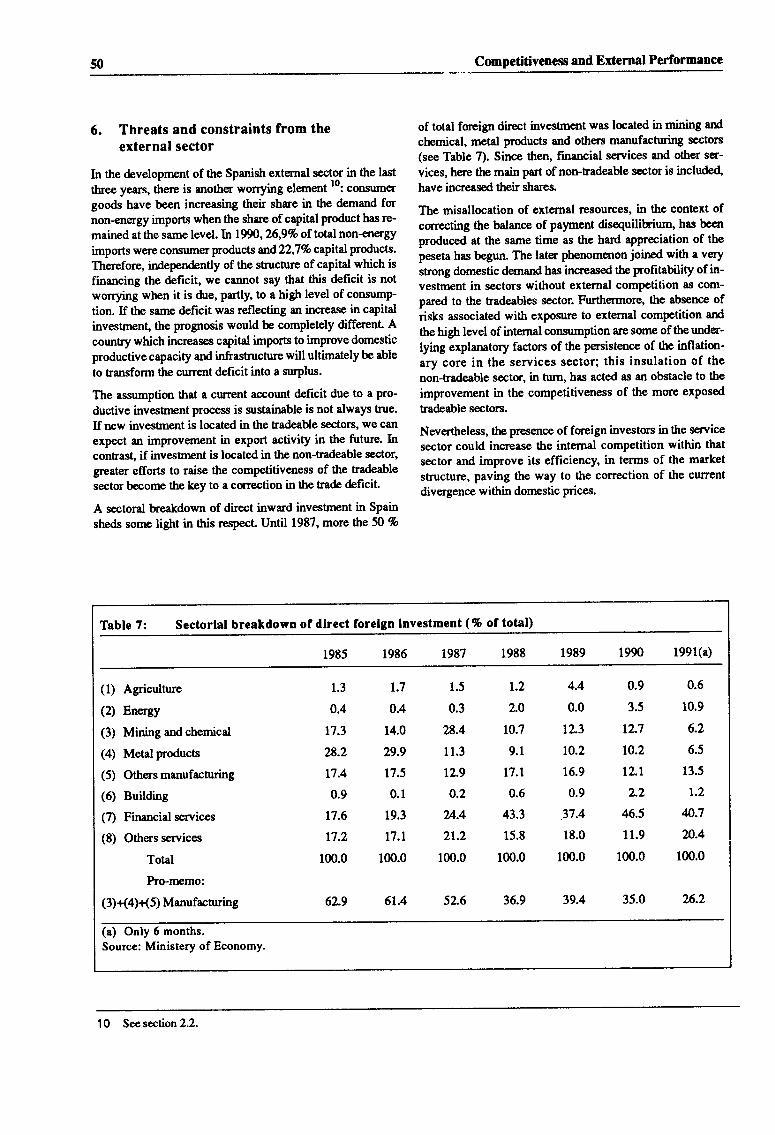
50 Competitiveness and External Performance
6. Threats and constraints from theexternal sector
In the developrnent of the Spanish extemal secto-r in the last
three years, tier,e is anotherworrying ele,lnent 10,
"on*-ergoods have been increasing their share in the demand fornon-energy imports when the share of capital product has re-
mained at the same level. In 19n,26,9qo of total non<nergyimports were consumer produ cts and22,77o capital prroducts.
Therefore, independently ofthe structure ofcapital which is
financing the deficit, we cannot say that this deficit is not
worrying when it is &re, partly, to a high level of consump-
tion. If the same deficit was reflecting an incrnease in capital
investrnen! the prognosis would be completely different Acountry which increase.s capital imports to improve domestic
productive capacity and infrastructure will ultimately be able
to transform tlre current deficit into a zurplus.
The assumption that a current account deficit due to a Pro-ductive investrnent process is zustainable is not always brue.
If new investrnent is located in the tradeable sectors, we can
exp€ct an improvement in export activity in the future. Incontrast, if investrnent is located in the non-tradeable sector'
greater efforts to raise the competitiveness of the tradeable
sector become the key to a cqrection in the ha& deficit
A sectoral b,reakdown of direct inwad investment in Spain
sheds sorne light in this respecL Until 1987, more the 50 %
of total foreign direct investment was located in mining anichemical, metal products and others murufachuing sectors
(see Table 7). Since then, finrncial seryices and other ser-
vices, hene the main part of non-tsadeable sector is includdhave inqeased their shares.
The misallocation of exte,mal resources, in the context ofcorrecting the balance of payrnent disequilitrium, has been
produced at the same time as the hard appreciation of the
peseta has begun. The later phenomenon joined with a very
strong domestic demand has increased ttre profitability of in-vestrnent in sectors without external competition as com-
pared to the tadeables sector. Furthermore, the absence ofrisks associated with exposure to external competition and
the high level of internal conzumption are some of the under-
lying explanatory factors of the persistence of the inflation-ary core in the services sector; this insulation of thcnon-hadeable sector, in tum, has acted as an obstacle to the
improvement in the competitiveness of the more exposed
tradeable sectots.
Nevertheless, the presence of foneign investors in the serrrice
sector could increase the internal competition within that
sector and improve its efficiency, in terms of the market
structure, paving the way to the correction of the culTent
divergence within domestic prices.
Table 7: Sectorlal breakdown of dlrect forelgn lnvestment (% of total)
1985 1986 1987 1988 1989 1990 l99l(a)
(1) Aericultue
(2) Energy
(3) Mining and chemical
(4) Metalproducts
(5) Others manufacturing
(6) Building
(7) Financial services
(8) Others services
Total
Pro-memo:
(3)+(4){5) Manufacturing
1.3
0.4
17.3
28.2
t7.4
0.9
17.5
17.2
100.0
62.9
t.7
0.4
14.0
29.9
t7.5
0.1
19.3
t7.llm.0
61.4
1.5
0.3
28.4
11.3
t2.9
o.2
u.421.2
100.0
52.6
t.2
2.0
t0.7
9.1
t7.l0.6
43.3
15.E
100.0
36.9
4.4
0.0
t2.3
to.2
16.9
0.9
.37.4
18.0
100.0
39.4
0.9 0.6
3.5 10.9
t2.7 6.2
LO.z 6.5
t2.t 13.5
2.2 1.2
6.5 N.7
11.9 ZO.4
100.0 100.0
35.0 26.2
(a) Only 6 months.Source: Ministery of Economy.
10 See section 2.2.
Competitiveness and External Performame 51
7. Summary and Conclusions
Since 1985, the Spanistr current account has been affectedby, firstly accession to the European Community an{ sec-ondly, therecovery in economic activity.
Both elements have caused a considerable deterioration inthe trade balance; this combined with a poor perfmmance onthe invisibles balance explain the widening deficits on thecurent account since 1989.
The adoption of the Community common external tadtr -which b'roke with the previous tradition of extensive protec-tionism against extemal competition - at a time when domes-
tic demand was growing more rapidly than its maincompetitor coun&ies, hasrczulted in a sipificant increase inimports which has not been matched @ export growth.
Moreover, a very high dourcstic demand growth resulted inthe reappearurce of accelerating inflation in the second halfof 1988. The ircrease in the interest rate to contsol inflationinduced large capital inflows and a consequent appreciationof thepeseta- The loss of external competitiveness as arcsultof combining botb rising prices and appreciating exchangerates, has negatively beea affecting goods and servicc.s ex-ports.
The current account deficit alsoreflects the incapacity ofdo-mestic saving to finance the investne,nt process.
Since 1986, the public sector has reduced its &ficit but thisreduction has been insufficient to compensate the gap be-tween saving and investment in the private sectu.
In this regard, increases in disposable income have beenhanslated into a growth in conzumption which, in turn" hasprovoked a higber share of corurumer goods in the total de-
mand for imports.
Foreigrr capital inflows are overfinancing the current accountdeficit
The Spanish e,conomy has become increasingly dependent
on qpeculative capital inflows attacted basica[y by high in-terest rates and a stsong curr€ncy. In this cmtext, the disci-pline implied by membership of the Exchange RateMechanisrn of the EMS since fure 1989 has enhanced the
attractiveness of Spanish intenest rate differentials as the riskoflosses ttnough a depreciation has beenreduoed.
However, liberalization of capital movernent will imply a
progressive narrowing of inte,rest rate differentials among
EC countries. Thus, the present attractiveness ofthe Spanistteconomy to speculative investment will not continue in the
long tenn On the other han4 long-term investors re morpsensitive to the structural conlitions of the economy which,
in turn, could be threatened by a persistent and growing cur-rent deficit among other disequilibria.
Consequently, grest€r efforts to cqrcct pres€ot unbalucqswouldberequird if ttre Spanish urthorities wish to consoli-
date the economy in advarrce of the Single Market and to fol-low the proc€ss towards Moretary Union.
. With regud to irnports , Woditlctive sectors have been moresensitive to tbe resEictive rneasures than connrmers. Importgrowth in 1990 was below that of previous years. This im-port bend is in line with the moderation of domestic de-
mand eqpecially in the second half of 1990. The easing indemand is a consequence of restrictive measures imple-mented by the authorities one year before and of the addi-tional deterioration of expectation due to the Gulf crisis.Nevertlreless, import growth is still high and coffiumer pro.ducts have increased tbeir *rare in non-energy imports
. From the export si& additional competitiveness improve-ments will be needed to correct the external deflrcil TheI 990 and 1 99 1 export figures suggest stronger growth com-pared with p,revious years. Domestic demand moderation,efforts to improve price competitiveness in tsadeable sec-
tors rnd the ernergence of extemal markets - Spanish trade
has been positively affected by German rmification - couldbe conhibuting to thisrecovery. However, thereallocationof resoruoes towards non-tradeable sectors might to have
reduced export capacity.
. Inflation convergence with the low inflation Europeancountries is a key issue to restore external equilibrium.Price and cost moderation is the only possibility for an eco-
nomy with guasi-fxed exchange rates and about to be in-tegrated into a large free market, to improvecompetitiveness. Arpduction in the inflation rate and costs
will help fte tradeable sectos to expand their share of ex-t€rnal mar&ets.
Consequently, this implie the maintenance of a moderate
growth in domestic demarrl so as to avoid further pressure
on import demand and prices. Other measures to encourage
dmrestic saving would also help to narrow the gap between
saving and investrnent while simultaneously reducing de-
mand for imported conzumption goods.
. Impruvement of thc credibility of the anti-inflationary po-Iicy within the ERM frrmework is also required to avoidany reversal of both speculative and permanent capitalflows. Even if no financial constsaints in the extemal sector
have emerged until now the prograssive widening of the
current account deficits might be considered as unsustaina-
bleby themarkets andleadto areversd of capital inflows.
The stability of capital inflows has to be assued by apPro-priate retums. Within the ERM fratpworlq both the change
in the pre.rent policy mix, allowing for a more stringent fis-cal policy and a less tight monetary policy, and the mode-ration of wage increase are required to preserrre domesticprice stability and exteinal competitiveness, otherwise, cur-rent account deficits will widenraising tbe qpectre of a srbsequent recession, expected retums on foreign investmentwill beredrcod arrt foreip investrrent will be tempted towithdraw.
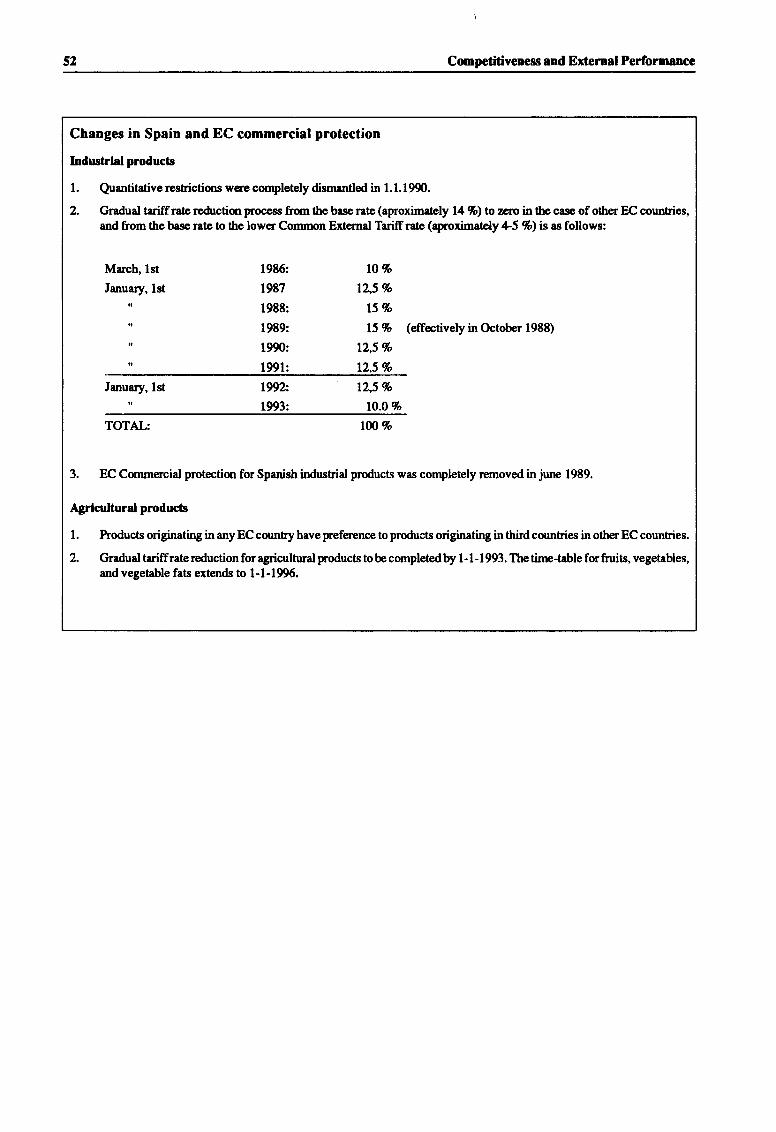
52
l
Competitiveness end Extcrnal Performance
Changes in Spain and EC commercial protection
Industrlal products
1. Quantitative restrictions were completely dismantled in 1.1.1990.
2. Gradual tariff rale re&ction process from the base rate (aproximately 14 %) fo zero in the case of other EC countsies,and from the base ra0e to the lower Common Extemal Tariffrate (aproximately +5 %) is as follows:
to%125%
t5%15 % (effectively in October 1988)
L2,5 EO
12.5 7o
19922
1993:
TOTAL: rN%
EC Commencial protection for Spanish industrid products was completely removed in jurp 1989.
Agrlcultural products
1. koducts originating in any EC country have prefe,rence to products originating in third countries in other EC countries.
2. Gradual tariffratereductionfc agricultural products tobe completedby 1-l-1993. The tinre-table forfruits, vegetables,and vegetable fats extends to 1-1-1996.
March, lstfanuary, lst
1986:
1987
1988:
1989:
1990:
1991:
fanuary, lst 12,5%
to.o%
Publfo Finance and Fiscal Reform 53
CHAPTER IIIPUBLIC FINANCE AND FISCAL REFORM (*)
Contents
Introduction ....54 5.1. Structureof thetaxsystem ... 58
l. Fiscal policy in the years of economic 5.2. Harmonization of indirect taxation . . . 59expansion . . .54
5.3. The reform of direct taxation . . 592. The control of public finances . . . . . . .56
,' 6. Deficit funding and public debt2.1. Budgetaryprocedure .......56 management ... ... 60
2.2. The scope for moderating expenditure . . 56 6. 1. Deficit funding . .,6 g. 60
3. Impact of budgetary decentralization on 6.2. Public debt management . . . . 6lthe general government deficit . . . . .57
7. Conclusions .. ....614. Taxevasion .......58
Statisticalappendix . ... . 635. Tax reform and harrronization . . . . . . .58
(*) This chapter was mainly prepared by Enrique LANGA MORA of the National Economies Directorate andManuel SANCHIS I MARCO of the Monetary Directorate.
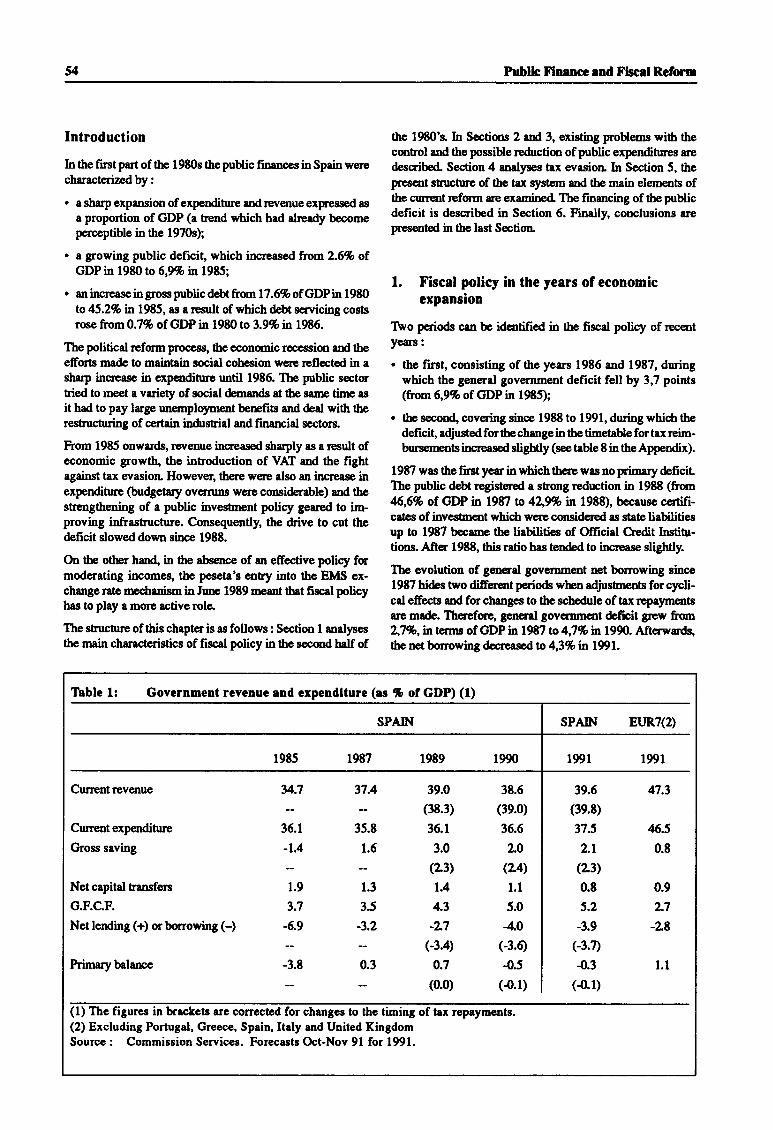
54 Pubtic Flnanoe ond Fbcal Refom
Introduction
In the fnst part of the 1980s the public frnances in Spain werecharacterized by :
. a sharp expansion of expenditw€ and revenue expressed as
a propo,rtion of GDP (a trend which had dready becomeperceptible in the 1970s);
. a growing public deficit which increased from 2.6% ofGDP in 1980 to 6,9% in 1985;
. an increase ingrosspublic debt fumltt7.6% ofGDPin 1980ro 45 .2% in 1 985, as a result of which debt servicing cosbrose from 0.7% of GDP in 1980 to 3.9% it 1986.
The political refum process, the economic rocession ard theefforts ma& 1s 6rintain social cohesion were rpflected in asharp increase in expenditure until 1986. The public sectctried to meet a vrriety of social demands at the sare time as
it had to pay large uneinployment berefits and deal with therestructuring of certain in&strial and financial sectors.
kom 1985 onwatds, rcrrenue increased sharply as arcsult ofeconomic gowth, the introduction of VAT and the fightagainst tax errasion However, there were also an increase inexpenditure (budgetary ov€rruns were consi&rable) and thestrengthening of a public inveshent poliry geared to im-proving infrastructrue. Consequently, the drive to ctt thedeficit slowed down since 1988.
On the other han4 in the abaence of an effective policy frmoderating incomeg tbe peseta's entry into the EMS ex-change rate mhenism in fure 1989 meant tbat fiscal policyhas to play 8 morc active role.
The stmcture of this chapter is as follows : Section 1 analysesthe main characteristics of fiscal policy in the second half of
the l9B0'$ In Sections 2 ^d
3, existing problems with thecontrol and the possible redrction of public expenditurcs arre
de,scribed" Section 4 analyses trx errasioL In Section 5, theples€nt structure of th tax rystern and the main elements ofthe curr€ntrpfonn re examined. The financing of thepublicdeficit is described in Section 6. Finally, conclusions arepresented in the last Section
1. Fiscal policy in the years of economicexpamion
1\ro periods can be identified in the fiscal policy of recenty€anr:
. tlre first, consisting of the years 1986 and 1987, duringwhich the general governrnent deficit fell by 3,7 points(fuom6,99o of GDPin 1985);
. tbe secon4 covering since 1988 to 1991, duing which thedeficif adjusted fo the chenge in the timetaHe for iax rcim-bursernents increased slightly (see table 8 in the Appendix).
1987 was the fint year in which there was no prirnary deficilThe public debt registered a stsong reduction in 1988 (frwr46,6?o of GDP in 1987 to 42,9% n 1988), because c€rtifi-cates of investment which werc cqridcred as stste liabilitiesup io 1987 became tbe liabilities of Offrciel Cledit Instiur-tions. After 1988, this ratio has ten&d to incr€ase slightly.
The evolution of generd goy€flrment net borrowing since19S/ hides two different periods when adjushents for cycli-cd effects and for changes to the schedule of tax repaymentsarp made. Thereforg generel government &frcit grew homz,1Eo,iaterff of GDPin l%7 to4,7% in 1990. Afterrrards,the net borrowing d€creased to 4,3Eo in 1991.
Tbble l: Govcrnment revenue and cxpendlture (as % of GDP) (1)
SPAIN
1985 1987 1989
SPAIN EUR(2)
1990 1991 1991
Currentrevenue
Current expenditure
Gross saving
Net capital &ansfers
G.F.C.F.
Net lending (+) c borrowing (-)
himary balance
34.7
36.1
-1.4
1.9
3.7
:'_''
37.4
35.8
1.6
1.3
3.5
39.0
(38.3)
35.1
3.0
(L3)IA4.3
-L7
G3.4)
0.7
(0.0)
38.5
(3e.0)
36.6
LO
(2-4)
1.1
5.0
4.0
c3.o{.5({.1)
39.6
(3e.8)
37.5
2.t(L3\0.8
5.2
-3.9
(-3.7)
{.3(4.1)
47.3
6.50.8
0.9
L7-28
1.10.3-3.8
(1) The figures in bracketc are corrected for changcs to the timing of trx repayments.(2) Ercluding Portugal, Greece, Spain, Italy and United KingdomSource : Commission Services. Forecasts Oct-Nov 9l for 1991.
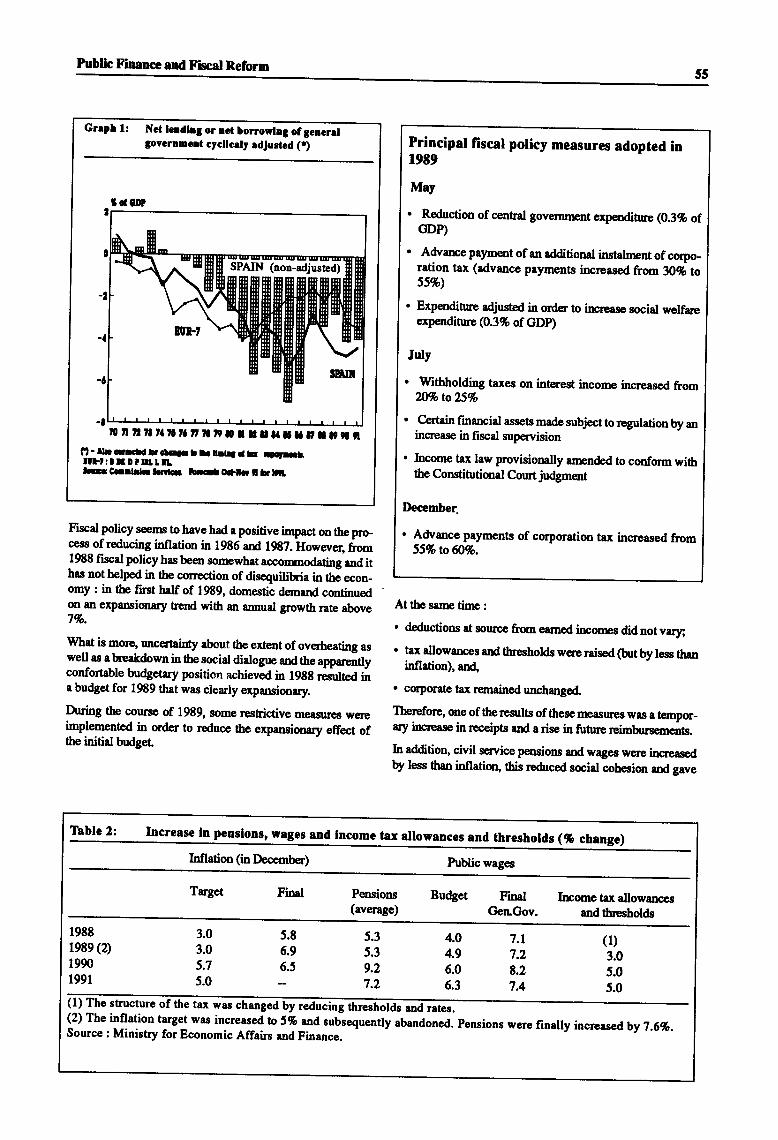
Pubtic Flnancc and Fbcal Reform55
Greph 1: Nct leldlo3 or rct borrcwlrg of gemnltovCrtrDetra cycllcrly edfoatod ()
nAnnrafrtct ,lr?I f !ttta5tatrLilrQ:Il-crc|. f OoG. f f. [rll i E rFrrrlnt rtlDtltttrLlcccr.t bt rilc, hdo.Frrihrtt
tdeD
Principal fiscal policy meallures adopted in19E9
May
. Reduction of cenbal goverrunent expenditne (O.3% otcDP)
. A&ance paJmetrt of an additional instalment of corpo_ration tax (advance payments increased ftom 3O% toss%)
. Expenditure adjusted in o,rd€r to increase social welfareexpenditure (0.3% of GDp)
Juty
. Withholding taxes on interest income incrreased from?fr%to?5%
. Certainfinancial assetsmade subject toregulationby anincrease in fiscal supervision
. Income tax law provisiona[y amended to conform withthe Constitutimal Court judgment
Dccembcr.
. Advance payments of corporation tax increased from55%tofi%.
Fiscal policy seerns to have had a positive impact on the p,ro-cess of reducing inflation in 1986 aDd l9g7. However, from1988 fiscal policy has bee,n sorewhat accomodating and ithas not helped in the correrction of disequilibria in the econ-omy : in tbe first half of 1989, domestic demand continuedon an expansionary herxl wittr an annual growth rate above7%.
S/hat is more, urcstainty about the extent of overteating aswell as abreakdownin thesocial dialogue andthe apparcntlyconfortable budgetary position achieved in lggg rcsulted ina budget for 1989 that was clearly expansionary.
During the course of 1989, some restrictive metsurss wercimplemented in ord€r to reduce the expansionary effect oftheinitial budger.
At thesame time:
' deductions at source frm earaed ircomes did not very;
. tax allowances rnd ttnesholds waeraised (butby less thaninflation), and,
. crporate tax rernained unchurged.
Tberefore, one of therczults of these measur€s was e temptr_ary iffi€sse in roceipts end a rise in future reimbursemens.
In addition, civil service pensions and wages were increased$l less than inftatiorl this redrced social cohesion and gave
Ibble 2: rncreasc ln penslons, wages and lncome tax allowanccs and thresholds (% change)
Iuflation (in December) Public wages
Target Final Pensions(average)
Budget FimlGenGov.
Income tax allowancesand thnesholds
1988
19re (2)
1990
1991
3.03.05.75.0
5.86.96.5
5.3
5.3
9.27.2
4.O
4.96.06.3
7.t7.28.27.4
(1)3.05.05.0
(1) The rtsucture of the tax *"s "t
t'L,*.T*t':.tffi-1iT:::1 t" 5?1yu subsequently abandoned. Pensions were finally increased by 7.6%.Source : Ministry for Economic Affairs and Finance.
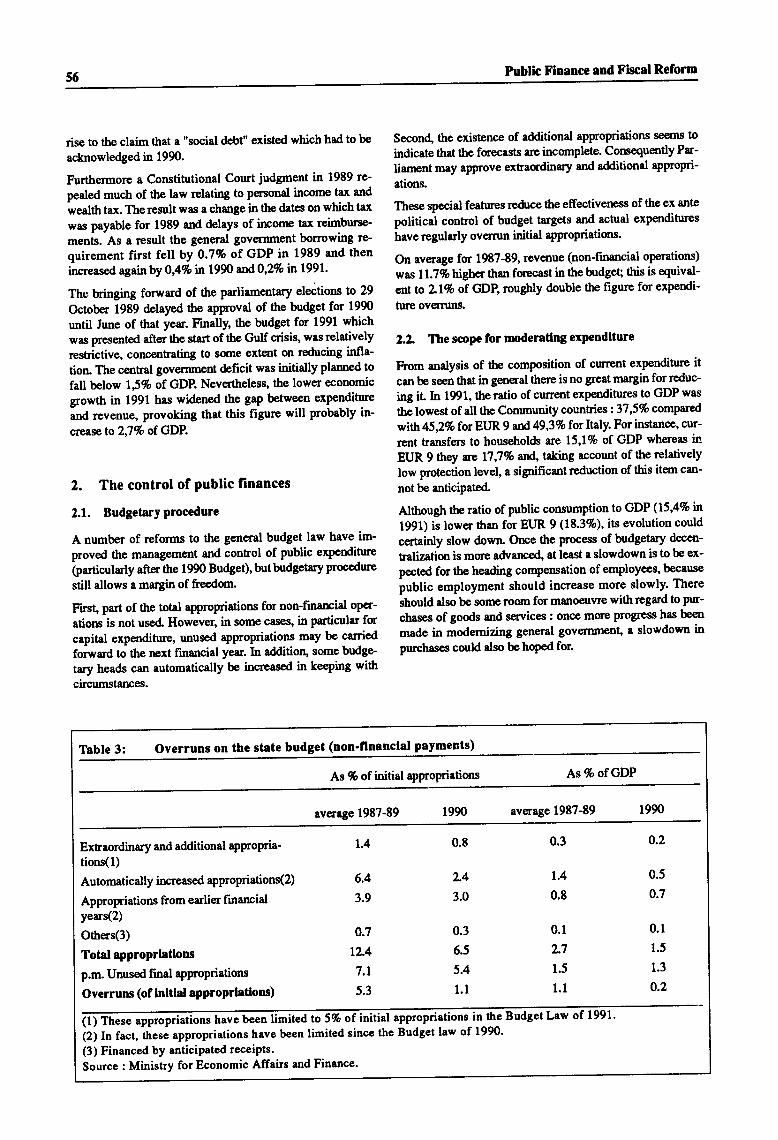
Public Finance and Flscal Reform56
rise to the claim that a "social debt" existed which had to be
acknowledged in 1990.
Furthermore a Constitutional Court judgment in 1989 re-
pealed much of the law ptxting to personal income tax and
wealth tax. Theresult was a change in tbe dates on which tax
was payable for 1989 and delays of irrcore tax reimburse-
ments. As a result the general govefl[nent borrowing re-
quirement first fell by 0.7% of GDP in 1989 and then
incre.as€d again by 0,4% in 1990 arrd0,z% in 1991'
The bringing forward of the padiamentary elections to 29
October 1989 delayed the approval of the budget for 1990
until June of that year. Finally, the budget for 1991 which
was p,resented after ttre start of the Gulf crisis, was relatively
restrictive, concentrating to some extent on reducing infla-
tion The cenEal gov€,mment deficit was initially planned to
fall below 15% of GDP. Nevertheless, the lower economic
growth in 1991 has widened the gap between expenditure
and revenue, provoking that this figure will probably in-
creaseto 2,'l%of.GDP.
2. The control of Public finances
2.1. Budgetaryprocedure
A number of reforms to the general budget law have im-
proved the management and control of public expenditure
1p.rti*toty "fter
the 1990 Budget)' butbudgetary p'rocedue
still allows a margin of freedom.
Firsl part of the total approprriations fo non-finarid oper-
ations is not used. However, in some cases, in particular for
capital expenditure, unused appropriations may be carried
forward to the rext financial year. In addition' some budge-
tary heads can automatically be increased in keeping with
circumstances.
Second, the existence of additional appropriations seems to
indicate that the forecasts are incomplete. Consequently Par-
lianrnt may sPProve extraordinary urd additional appropri-
ations.
These special featrnes redrce the effectiveness of the ex ante
political control of budget targets and actual expenditures
have regrrlerly overun initial approp'riations.
On average for 1987-89, reve,nue (non-financial operations)
was 11.?% higher than fsecast in the budget this is equival-
efi to 2.1% of GDB roughly double the figure for expendi-
ture overruns.
2.2. The scope for moderadng expendlture
From analysis of tlre composition of current expenditure itcan be seen that in general there is no great margin for reduc-
ing iL h 1991, the ratio of current expenditures to GDP was
thi lowest of all the Community countries :37,59o compared
with45,2%for EIJR 9 afr49,3% forltaly. Forinstance, cur-
rent transfers to households ate t5,l4o of GDP whereas in
Et R 9 they are 17,7% aurc,, taking account of the relatively
low protection level, a sipificant reduction of this iteur can-
not be anticipated.
Although tlr ratio of public consumption to GDP (15,4% n1991) is lower than for EllR 9 (18.37o), its evolution could
certainly slow down Orrce the Focess of budgetary decen-
tralization is more advarrce4 at least a slowdown is to be ex-
pected for the heading comPensation of employees, because
public employment should increase more slowly. There
should also be sonte room for manoeuvre with regard to pur-
cbases of goods and services : once mure progre$s has be€n
made in modemizing general Sovqnflrent" a slowdown in
purchases could also be hoped for.
T[ble 3: Overruns on the state budget (non'flnanclal payments)
As % of initial approPrietions As % of GDP
aversge 1987-89 1990 average 1987-89 1990
Extraordinary and additional aPProprra-
tion(1)
Automatically increased appropriation(2)
Appropriations from earlier financialyears(2)
Others(3)
Total approprlatlons
p.m. Unused final approPriations
Overruns (of lnttlal approprladons)
1.4
6.4
3.9
o.7
t2.4
7.t
5.3
0.E 0.3
t.4
0.8
0.1
2.7
1.5
1.1
0.2
0.5
0.7
0.1
1.5
1.3
o.2
2.4
3.0
0.3
6.5
5.4
1.1
ropriations in the Budget Law of 1991'
(2) In fact, these appropriations have been limited since the Budget law of 1990'
(3) Financed by enticipated receipts.
Source : Ministry for Economic Affairs and Finance'
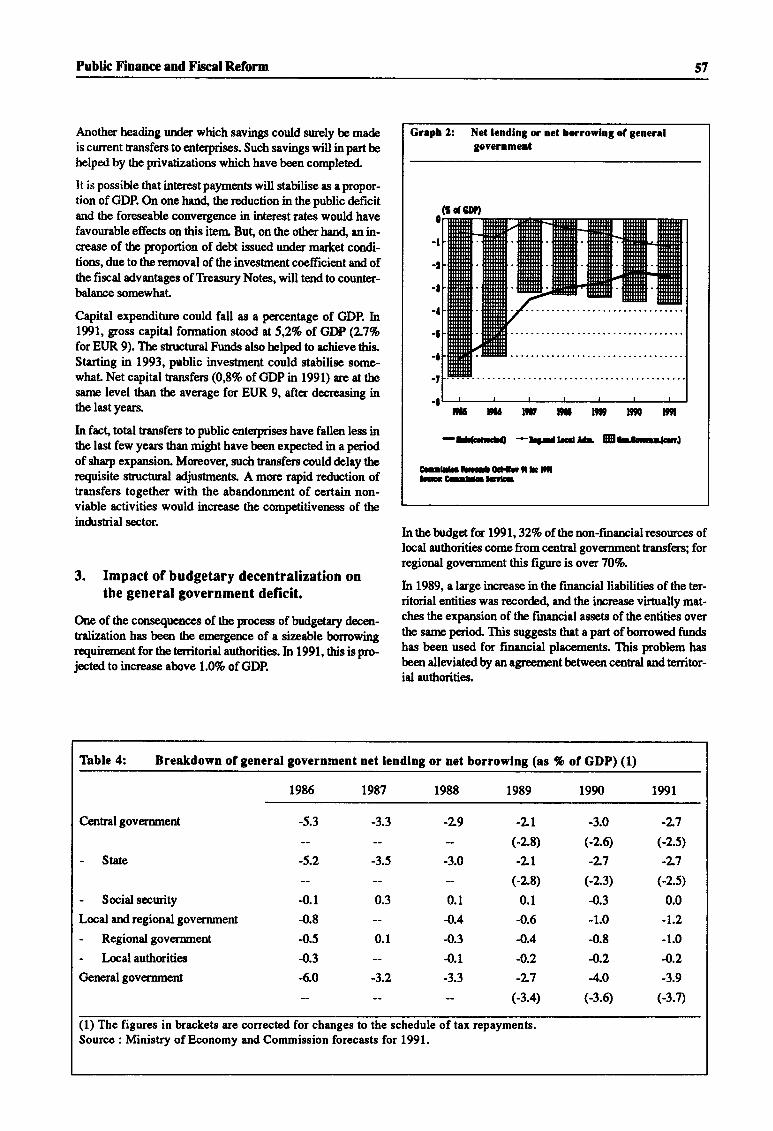
Public X'inance end Flxal R.eform 57
Another heading under which savings could surely be ma&is current transfers to enterprises. Such savings will in part behelpul by the privatizations which have been completed.
!t is possible that interastpayme,trts will stabilise as apropor-tion of GDP. On one hand, the reduction in the public deficitand the forpseable convelgence in interest rates would havefavourable effects on this iterr" But, on the other hand, an in-snease of the proportion of dett issued under market condi-tions, due to the removal of the investnent coeffrcient and ofthe fiscal advantages of Treasury Notes, will tend to counter-balance somewhal
Capital expenditure could fall as a p€rc€ntage of GDP. In1991, gross capi0al formation stood at 5,2Vo of GDP (?-7%
for EUR 9). The structural Funds also helped to achieve this.Starting in 1993, public investment could stabilise some-whal Net capital hansfers (0,87o of GDP in 1991) are at tbesarne level ttun tbe av€rage for EUR 9, after decreasing inthe last years.
In fact, total trursfers to public enterprises have fallen less inthe last few years than might have been expected in a periodof sharp expansion Moreover, such transfers could delay therequisite stsuctural adjustrnents A more rapid reduction oftransfers together with the abandonment of certain non-viable activities would increase the competitiveness of theindrstrial sector.
3. Impact of budgetary decentralization onthe general government deficit.
One of the consequences of the process ofbudgetary decen-tralization has be.en the emelgerrce of a sizeable bonowingrequirement for tbe territorid authorities. In 1991, this is pro-jected to incr€ase above 1.0% of GDP.
In the budger for l99L , 32% of the non-financial resources oflocal authorities come from central govemment transfers; forregional gov€rnment this figure is ovq7O7o.
h 1989, a large irrrease in the financial liabilities of the ter-ritorial entities was recorde4 and the ircrease virtually mat-ches the expansion of the financial assets ofthe entities overthe sanr period This suggests that a part of bonowed fundshas been used for financial placements. This problem has
been allerriated by an agroenrnt between central and territor-ial authorities.
Greph 2: Nct lcndlng or oet bomowlng of generelgovcrnment
tst I[a n tt lst lts rll
-I(ilrGlO +Ia,.raLsllr Ef.3rnr{cd
C..rl-h.c-0.H, tI ItiLc3C-drbtrrL.
o d€D!,
Table 4: Breakdown of general government net lendlng or net borrowlng (as Vo ol GDP) (1)
1986 t987 1988 1989 1990 1991
Cantralgovemment
- State
- Social security
Local and regional government
- Regional gov€rnment
- Local authorities
General government
-5.3
-5.2
".t-0.8
-0.5
-0.3
-6.0
-3.3
-3.5
0.,
0.1
i,
-L9
-3.0
0.1
-0.4
4.3{.1
t'
-2-L
Gz8)-2-l
(-2.8)
0.1
-0.6
-0.4
-0.2
-L7
G3.4)
-3.0
e.q-L7
(-2.3)
-0.3
-1.0
-0.8
-0.2
4.0
G3.O
-27
G2.s)
-L7(-2.s)
0.0
-t.2
-1.0
4.2-3.9
(-3.7)
(1) The figures in brackets are correctcd for changes to the schedule of tax repayments.Source : Ministry of Economy and Commission forecasts for 1991.
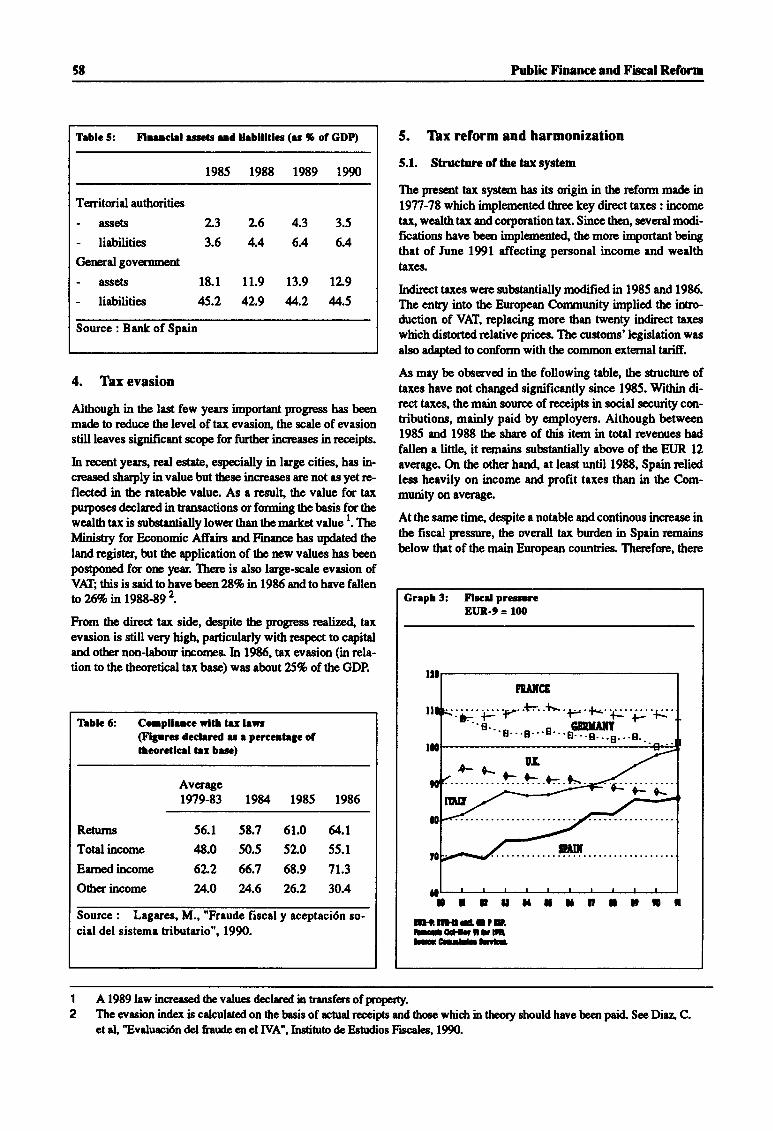
5t Public Finance and f,'lscal Reform
Trblc 5: Flmncld .rs.as .rd lleblllalcc (rr % ol GDP)
1985 1988 1989 1990
T€rritorid authcities
- assets L3 2.6 4.3 3.5
- liabilities 3.6 4.4 6.4 6.4
General government
- assets 18.1 11.9 13.9 12.9
- liabilities 45.2 4L9 4.2 45Source : Bank of Spain
4. Taxevasion
Although in the last few years impotant progr€ss has beenmade to roduce the level of tax wasion, the scale of evasionstill leaves significant scope for frfiher incrpases inreceipts.
In rcce,nt years, real estate, especially in lrge cities, has in-cressed sh.rply in value but tbese inqeases arc not as yet rc-flertd in the rateeble value. As a resull the value for taxpurposes declarpd in transactions or fuming the basis for thewealth tax is zubstantially lower rhen the martet value l. TheMinisty fq Economic Atrain and Finance has updated theland register, but the application of tbe new values has beenposQored for one yeu. Thae is also lrge-scale evasion ofVAf,; this is said 0o have brrlo,Z8% n 1985 and to have fdlento?,6% in 198&89 2.
From the direct tax side, daspite the p,rogrese rcalize4 taxevasion is still very high" particulady with respect to capitdand other non-labou ircorres. In 1985, trx evasion (in rela-tion to the theoretical tax base) was about 25% of the GDP.
5. Tbx reform and harmonization
5.1. Shuctureolthctaxsystem
The present tax s]rst€m has its origin in the reform made in9n-78 which implemented thee key direct taxes : incometax" wealth tax and corporation tax. Since then, serreral modi-fications have been implementd tbe more important beiagthat of June 1991 affecting personal income and wealthtiaxes.
Indirect taxes were subetantially modified in 1985 and 1986.The en&y into the European Community implied tbe intro-duction of Vr{T, replacing more than twenty indirect taxe.s
which distorted relative prices Tlr customs'legislation waselso adepted to conform with the common extemal tariff.
As may be observed in the following trble the sEucture oftaxes have not changed significantly since 1985. Within di-rect tlxes, the main sourpe of rpceipts in social secruity cm-tributions, mainly paid by employers. Although between1985 and 1988 tbe share of this item in total revenues had
fallen a little, it remains substantially above of thp EUR 12
average. On the other han( at least until 1988, Spain reliedless heavily on income and profit taxes than in the Com-munity on avemge.
At the same time, despite a notable and continous increase inthe fiscal pressurc, the overall tax bunden in Spain remainsbelow tbat of the main European countries. Therefme, there
Tlblc 6: Compllercc rlll trr lrvr@lgurcl dcclmd rr e pcrccrtr3c ol6corctlcel tu berc)
Average1979-83 19E4 1985 1986
Retums 55.1 58.7 61.0 g.lTotal income 48.0 50.5 52.0 55.1
Earned income 62.2 66.7 68.9 71.3
Otherincome 24.O U.6 26.2 30,4
Source : Lagares, M., "Fraude fiecal y aceptaci6n so-cial del sistema tsibutorio", 1990.
Gnpl 3: Flecd prccmoEUX.9 = 100
IlrOrrtaorotim+m{rlOlrr.Hoc|lriIlri,!-G..fbIrE
1
2A 1989 law increased the values declared in transfers ofproperty.The evasion index is calculated on 0re b$is of rctrrd receipts and thoce whidr in theory should have been paid. See Diaa C.et al, 'Evalurci6n del frau& en el IVA", Instituto deBsnrdios Fiscales, 1990.
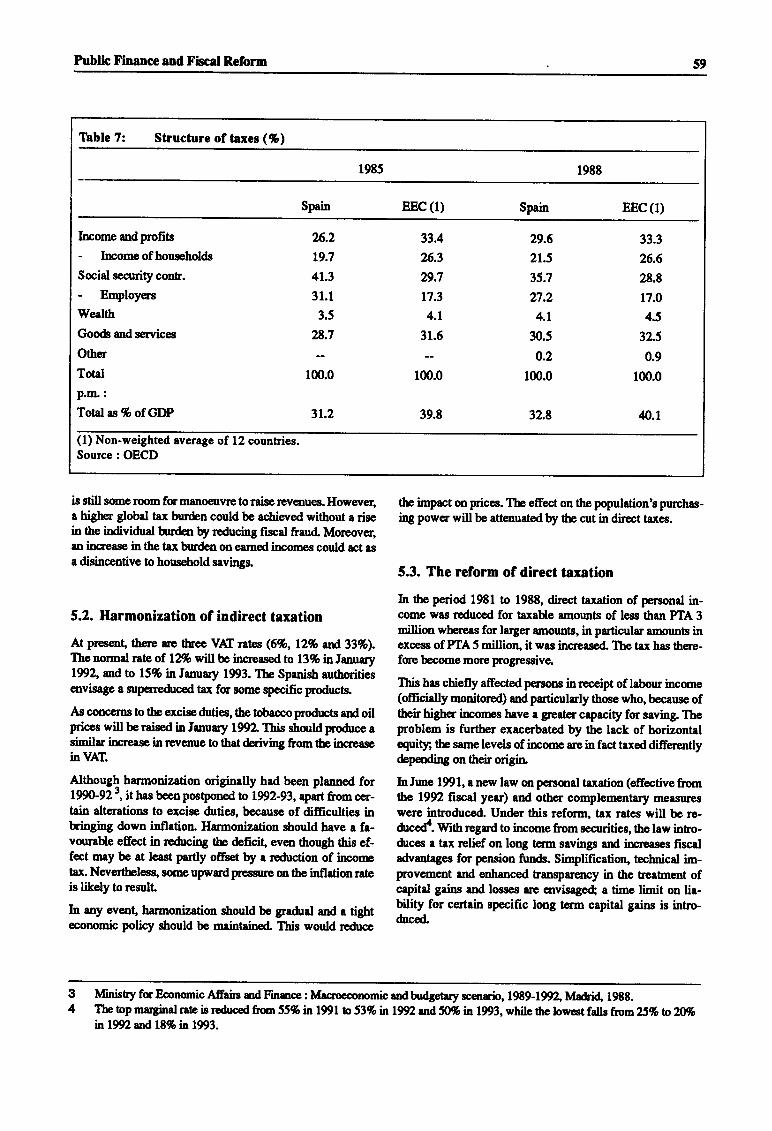
Public Finance and f iscal Reform 59
Thble 7: Structure of taxes (%)
1985 1988
Spain EEC (1) Spein EEc(1)
Income andprofits
- Incomeof hourholds
Social security conts.
- Employers
Wealth
Goods and serrricec
Other
Total
P.m.:Total as % of GDP
2i5.2
19.?
41.3
31.1
3.5
28.7
1m.0
31.2
33.4
2ti.3
29.7
17.3
4t31.5
100.0
39.8
29.6
21.5
35.7
n.24.1
30.5
0.2
100.0
32.8
33.3
26.6
28.8
t7.o
4.5
32.5
0.9
100.0
4.1
(1) Non-weighted average of 12 countries.Source: OECD
is still smeroom fcmanoeuvre toraisereveoues. However,a higher global tex burden could be achieved without a risein the individual hrden by reducing fiscal fraud. Moreover,an increase in the tex burden oneamedincmes could act rsa disincentive !o hous€hold savings.
5.2. Harmonization of indirect taxation
At presenf tbere ue thee VAf, nrtts (6%,12% crlrd-33%).The nqmal rate of 12% will be increased ta L3%infanuary1992, and to 15% in January 1993. The SpaniS aurboritiesenvisage a zuperre&rced tax fc sone specific products.
As consns io the excise duties, the tobscco Foducts lnd oilprices will be rtised in Ianuary 1992 This shorld prodrce asimilr ircrease in revelrue to that deriviug from the increasinVAL
Although harmonization originally had been planned forl99O-92 ', it has been postponed to t992-93, aprt from cer-tain alterations to excise dutiq:, because of difficulties inbringing down inflation. Hamronization should have a fa-vourable effect in redrcing tbe deficit, even though this ef-fect may be at least putly ofrset by a reduction of incoretax. Nevefihelesg some upwmd pressure m the inflation rateis likely to rcsull
h any evenl hannonization should be grefual and a tighteconomic policy strould be mlintained. Tbis would rcduce
the impact on prices. Tbe effect on the population's purchas-ing power will be atteiruated by ttr cut in direct taxes.
5.3. The reform of direct taxation
h flrc period 1981 to 1988, dir€ct trxation of personal in-coure wes r€duced fm taxable amounts of less than PTA 3million whereas for larger amounts, in particular amounb inexcess of PTA5 million" it was increased The tax has there-fce become more progressive.
This has chiefly affected persons in receipt of lebour income(offrcially monitored) and particululy those who, because oftbeir high€r incornes heve a greater capacity for saving. Theproblem is further exacerbated by the lack of horizontalquity; tlp same levels of ircorne are in fact taxed differen0ydependhg on their origin
Inlune 1991, e npw law on personal taxation (effective fromrhe 1992 fiscal year) and other complernentar5r mcasurr.swere inhoduced. Under this refcm, tax rates will be re-arcod. WitUregmd to incomefromsectrities, the law intro-6rces a tax relief on loqg term savingp ard increases fiscaladvantages for pension funds. Simplification, technical im-provement ard enhanced transpar€ncy in the heatnent ofcapital gains and losscs are qrvisag@ a time limit on lie-bility for c€rtein specific long term capital gains is intro-drc€d"
34
Ministsy fu Eoonomic Affairs md Finmoe: lrdacroeorrcmic andbudgetary sc€nrio, 1989-lW2,Madri4 19EE.The top marginal rate is reduced frorn 55% in 1991 b 53% n lWz afr *% in 1993, while the lowest falls ftrom 25 % ro 2A%in 1992 and 18% iD 1993.
50 Public Finance and Fiscal Reform
The main aim of these measures are to provide a tax incen-tive for household saving and to introduce a more neutraltreatment of the diffe,rent income sources. Although therela-tionship between personal saving and the tax burden is un-c€rtain in the Spanistr ca!p, one must at least examine fiscalconsiderations as one of the factors explaining the weaknessof the personal saving ratio.
In the run-up to the Single Ma*et, an additional problem isharmonization of the heahent of interest incomg at present
subject to t 259o witbholding tax : this rate should comedorn. A decree-law of 21 December 1990 provides anexernption from taxation on capital gains and interest incornederiving from govemment securities and paid to non-resi-dents. This teatrrent is extended to anykind of securities fqresidents in anotber Comrnunity country.
The reform of income tax also prcsuposes a refmm of co-poration tax, not only in order to achierre better technicalstructure and to avoid double taxation, but also to reduceevasion and incr€as€ neutrality when investn€ot &cisionsare taken. In addition, the difference between the tax ratewhich applies to companies (35%) and the top marginal ratewhich applies to household incores (55%) has carned dis-tortions, with companies being formed to avoid the need topay progressive personal taxation Ther€ erc two solutions tothis: either to increase the rate of corporation tar, or to re-duce the &ductions now allowed against it mainly on thegrounds of investnent arxtjob creation Spain is at the lowerend of the corporation tax range, so that tlrcre is some roomfor increasing ir
6. Deficit funding and public debtmanagement
6.1. Deftclttundlng
During 1983-1987, the Gove,mment diversified the source offinarrcing the public &ficit ard issued short-term TreasuryNotes @agar6s del Tesoro) and medium- and long-term gov-errunent bonds @onoc &l Estado and Obligaciones del Esta-
do). However, a high percentage of the financing schernes
was held though compulsory coefricients by the bankingsystem. In 1985 the Govemment rcdefind the cmrpulsoryinveshent coefficient (p,revailittg tt23% at that tirne) and apart of it (L0% at that time) had to be fulfrlled with TreasuryNotes (Pagar6s del Tesoro) at a price rrnilaterally lixed by theTreasury. This weakened the impact of tbe budget &ficit onthe liquidity of the banking syst€m but did not change thecoruiequenocs of a privileged financing of the &frcit
Since 1987 a progressive change in tbe system of deficitfunding based onthecoefficients and ttrcTreasuryNotes has
been inroduced
(i) The Treasury started to issue in lune 1987 a new instm-ment, Treasury Bills, a one-year public asset that, incontrast with the fornrrTreasury Notes, were issued at
market conditions, had no fiscal opacity and did nothave to be heldby thebanking rystem in order to reetany investsnent coefficientrequirementc Since Decem-
b€r 1991, the Treasury issues three-months TreasuryBills too.
(ii) The authorities introduced in May 1987 the ElectronicBookkeeping Sptern (Central de Anotaciones en Cuen-ta) of pnblic &bt in ttre Bank of Spain which improvedthe material basis anl the efficiency of the public debtmrrtefs and paved the way for a more orthodox financ-ing of public deficits.
(iii) The compulsory coefficients started to be gradually re-drced. The Govemment approvd (13.1.1989) a RoyalDecree setting up a timetable for a gradual phasing outof the investment coefficient, to be completed by3l December 1992.
(iv) km January 1992, the Treasury Notes held by thepub-'lic will not have fiscal opacity. Until this date, it ispossible to change these assets with other ones, namely"DeudaEspecial", which are iszued at six-yeartenn, at2% ntsestrute and offer opacity advantages at theirre-&mption
A further source of privileged funding for the authorities has
been via the Bmk of Spain system of reserve requircrnents,which has generated substantial profit transferred to theTreasury. The reserrre requirement coefficient was signifi-cantly changed in Feb,nrary 1984 to 18% fucn\ 7.75% in Au-gust 1983. The non-rernuneratod tranche of the coeffrcie,ntwas rpduced to 5% from 7.75Vo earher, and a new nemun-erated (at t 13.5% interest ratQ hanche of 13% was estab-lished.
In early March 1990, tlrere was a cash coefricient with twotranches, one of 9.5% with an average remuneration of7.75% afr a non-renrunerated we of 7 .5%; under this oldsystenL tbe present market value of bank reserves with the
Bank of Spain (a nominal amount of about 3.3 billion Ptas)would have begr around 1.4 billion Ptas, (the reserrre tsanchewas in effect a perpetual loan to the Bank of Spaur; applyurgthe 5 to 10 year bond rate, in the absence of a perpetual bordrate, the present value can be calculated). On 23 March 1990,the Bank of Spain implemented a majorreform in the rystenrof reserrre requirements, which:
(i) intsoduced a non-rernunerated minimum reserve coef-ficient of 5%;
(ii) hom 2 May 1990 the new remunerated trarrche (12%out of the total of l79o cefficiqrt) was zubstituted byCertificates of Deposit (CD) issued by the Bank ofSpain at a 6% interestrate. Thebanks havetohold theseCD's in their pordolio as non-negotiable assets but aleable to bansmit them with certain limits between creditinstitutions. The CD's will be progressively redeemedevery six months starting March 1993 and ending Sep-t€mbcr 2m0.
(ii| The stock of CD issued on 23 March and 3 April 1990amounted to 3.316 bn Ptas and was eguivalent to theaverage of the liabilities included in thereserve require-rents during Octob€r, November andDecember 1989andJrnury 1990.
Again taking the average of the 5 to 10 yerrs'public&bt issues afterMarch lW (13,75%) as the discount
Public Finance and Flscal Reform 6t
rate, and assuming that there is an extrs coupon in orderto assimilate the CD issued on 3 April 1990 with thoseon 23 March, the net present value of 3.3 16 bn Ptas canbe calculated * 2.023 bn Ptas (cf. Table 9). In otherwords, the change in the system of reserve requirernentshas increased the implicit market value of publio sectordebtby aroud ()0 billionPtas (this compares withex-plicit outstanding public sector &bt of 16.93 bn Ptasby end 1990) or about3.7%o of GDP.
(iv) The Treasury decided to intensify in 1989, but espe-cially in 1990, the issues of medium- and long-terrngovernmentbords (namely Bonos del Estado) in an at-tempt both !o cmpensate the smaller financing sternm-ing from the reduction of the coefficients and toimplernent a more orthodox deficit funding. Actually,the share of outstarding balances of government debtiszued under market conditions has increased from 67%in 1986 togL6% in 1990 (cf. Table 10). Although thebulk of public debt is still corpenhated on Sort-termpaper, that is, Treaury Notes @aga#s del Tesoro) andTreasury Bills (Letras del Tesoro). (cf. Table ll), in1991 the issue of medium and long-term debt has beenvery large, so thet it has ircreased its share in total debtin nearly ten points.
6.2. Publlc debt managcment
The issue of medium- and long-term public debt by theTreasury has been low since 1978 when the fiscal deficitstarted to grow rapidly. The authorities wtre rcluctant to ac-cept the increase in intercst ntes requircd by the marftet Asarezult, they used the dk€ct access to the Bank of Spain andrelied heavily on Sort-teino finarcing (namely in TreasuryNotes and Treasury Bills). In 1986, the expectations of a fallin interest rates created by the relatively accommodatingmonetary policy, indrced the Treasury to implement an ac-tive public debt policy. The autho,rities iszued a zubstantialamount of medium- and long-term government bonds
@onos &l Estado and Obligaciones del Estado) that werepredominantly taken up by the linucial institutions. Never-theless, the share of shct-term debt (0-2 years of residualmanuity) in the total rcmained very high in 1986. Dwing theperiod 1988-90 this rctive policy was reinforced but theshare continued to rise (84.5% in 1990) far beyond the levelsof other EC countries. The average residral life to manrityof iszues and outstanding balances of public &bt in Spainhrs been reduced re.lpectively from 2.6 yean ant 2.6 in 1986to 1.6 years and 1.4 in 1990 (cf. Table 12). As noticed before,in 1991 there has been a halt in this process, recording an in-crease in the maturity of the total debL
On thp other han( theprocess by means of which tbe publicdebt is ma*eted (namely sales of public sector paper und€rrepurchase agreements by tbe banking syst€Nn to thc public)implies tlre transformatisn sf thigh shre of liabilities issuedby the Treasury, irrexpective of their matrnity, into liabilitiesof the banking rystem which re mainly stut-term" In factthe financial institutions canbuypublic debt eith€r in thepri-mary mar&et m though the sales of these inshrments by tbeBank of Spain in its rcpurchase aSrecm€nt operations"
The financial institutions might hold these assets in theirportfolio, sell them to the public, r hand thsm ov€r tempo-rarily to non-banks under a repurchsse agreertenl The lattercase would constitute a liability for the bank concenrd andwould rrpresent (abstracting from eny possible offsetting ex-ternal flows) additional mon€y creation resulting from theurargements for financing of public debg in fact the tempor-ary rcpo trursfer by the financial institutions to the public ofany public asset, even long-temr issues, is included in theALP definition. As a result, the major role played by the handover of repo by the buks to the public has not favoured con-trol over donrcstic money cleation sirrce the public debt mar-ket does not directly relate the public wi0r the Treasury butwith the banking systenL
The 1990 budget adopted a new rule limiting strictly non-fin-ancial appropriation to the amount approved by ttre Parlia-ment and also introduced an end-yetr zeto limit for theincrcases in the balarrces of the Treasry borrowing from theBank of Spain. The previous regulation, the progressive de-cline of the investnent coefficient and the reduction of thereserve requireurents will lead the Treasury to have a highernecounle to the public debt markets and probably to a ration-alization of the public dett managernent policy.
7. Conclusions
. In 1986 and 1987, fiscal policy, assisted by a favourableeconomic situation" redrced the general govemment &Iicitfuom6,9?o of GDP in 1985 to3,2% in 1987. However, itcould be said that, in the context of the strong economicgrowth, it was not taken advantage enough of two years(1988 and 1989) fqestablistring a combination ofmoreba-lanced policies which would have improved the pace ofconv€,Igence. During these years, fiscal policy made vir-tually no contribution to the process ofreducing inflation,with monetar5r policy bearing the brunL Fiscal policy star-ted to be tightered in the second half of 1989, in keepingwith whet was ne€dd as a result of the peseta joining theEMS exchange rate mechanism in the middle of 1989.
. The fiscal policy which was followed from 1985 onwardswas base4 at least partly, on stpply-side policies.
On the public expenditure side, a grcat effort was made inthe field of public inve.stment to make the economy moreefficienl Apolicy ofprivatizing public enterprises was also
implemented.
On there.venue side, the introduction of VAf, simplified andremoved many distqtions in the old systern of indirect taxa-tion Rates of income tax aud corporation tax dedrctionswerc also rcduced. Certain rcasures limiting overqpendingby the State and the Treasury's direct acoess to the Bank ofSpain we,ne also approvod.
. Tlre elimination of tbe public &ficit continues to be me ofthe most important challenges for economic policy. How-ever this objective, that was prrcviously targetod for beingachierred in 1992, has now been postponed
62 Publh Financc and Fiscal Reform
With regad to budgetary procedure, it can be see,n that theinitial budgets, voted by Padiarcnt, are not a very effectiveinshrment from the point of view of limiting expenditure.Inreceirt years, actual expenditur€s hsye ov€rrun initial ap-propriations. The procedure should therefore be refomrcdin o,rd€r to evoid this and to ensure that the budget is im-plemented on figures cloe€r to those of the initial budgets.
It is also impctant to monitr effrciency withregard to ope-rating costs and the performanoe or usefulness of serrrices
and inveshent in ord€r to mod€nrize the management ofexpeirditue and to impove contol.
The fact that the qment account is in deficit also indicatesthe need to increase ilre ssyings ratio of the economy. Inview of the fall in the personal, and possibly the co,rporate,
savings ratio, the only valid option, at least in the short termis to inclease public saving. This imflies that the central go-vemment will have to make an additional effort (the ac-counts of autonomous bodies of State and the socialsecurity funds are generally more m less bolanced).
It is not proving easy to redrce, or even moderate, publicexpenditure, given that tb ratio of currcnt public experdi-ture to GDP is the lowest of the Community countries.However, ttrere is some room for manoeuvre, particularlyin public consumption" transfers to enterprises and capitalexpenditure (especially from 1993 onwards). This shouldmake it po*rible, in the medirm te,m, to increase social ex-penditure.
In view of tbe impact on thc territorial authorities'deficit,and since the prresent system of financing regional gov€rn-mentis aboutto cmr€ to anetr( anattempt shouldbemedeto extend the prirciple of 'fiscal co-resporuibility", whichwould enable regional govemmant to have direct controlover morp taxes than it does at presenL
Tax evasion is a problem which must be urgently solved"because it makes fiscel policy less effective, stands in theway of reducing the public deficit and erodcs social cohe-sion
. A comp,reheruive rpform of the system of tax collection isproving nqce$ery (the budget law for 1991 establishes a
"Tax Agerry", that will begin to wqk in 1992, in order tohing abort an improvanen$. Therpduction of the tax bur-den on households, could help to reduce income t&x eva-siort.
. Limiting tax fraud and indirect tax harmonization shouldhelp to redrce tlp deficit, even if income tax rates and em-ployers' social security contributions ale cut. Harmoniza-tion sbuld tate place gradually to prevent e surge in prices"
. To fully exploit tbe current opportunities it would be appro-priate fm the Treasury to keep on with th'e issues of publicdeh et looger term. The success of a public managementpolicy aiming at lengthening the average maturity of the
outsterding &bt and avoiding the high de$€e of monetarypolicy rcpercussions of public debt held by the non-banks(by means of repos) will depend on the willingness of theeutborities to offer the rchrns sought $l the markets, Thisimplies after-trx yields that conp€nsate investors for ex-pected inflation and future interest rates. Another possibi-lity world be that investqs become more used to holdingmedium- and long-term &bt in their portfolioe. That couldcontribute to irnprove the interest of the Spanish investorfor medium- rnd long-term assets ard, in any case, wouldfoster foreign capital inflows.
. Only tighter conbol ofpublic expendih,ue, the reform of thetrx systern ard more orthodox financing of the delicit willpave the way to a morc balanced combination of policies.
Budgetrrypolicy shouldbemuchmore active thanrccentlyin squeezing inflation out of the economy an{ in general,
in stabilizing demard These reforms, and moderation ofthe regional gov€rnrnont deficit wottld not only contributeto nominal conveqgerce - redrcing the public deficit and the
inllatimrate - but also to moe balarced growth, withpu-blic saving then being able to inq€ase. Any disadvantagas- withregardto real conveqgerrce - whichmiglrtresultfroma moe restrictive budgetry policy would be amply offsetby a reduction in the inflation rate and more balancedgrowth. Nminal stability is roquircd so as to avoid the risksof rn irrcgrlar "stop-go" path ineconomic growttr.
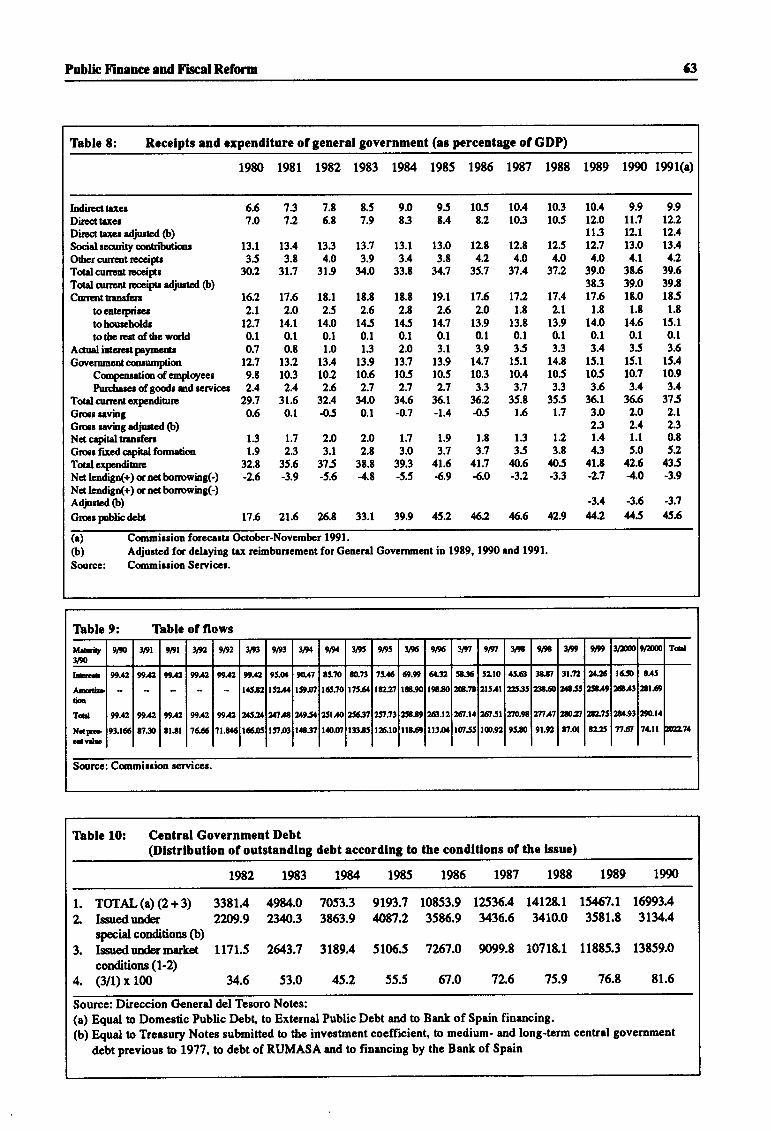
Public Finance end Fiscal Reform 63
1980 1981 1982 1983 t98/. 1985 1986 1987 1988 1989 1990 1991(a)
Table t: Rccelpts and cxpendlture ol general governmcnt (es perccntage ol GDP)
hdLrcntrxcrDireatrxcrDirccr rxcr adjurtcd (b)Socid rcctrity contributirnrOrhcr cumot rcceiparTotdcuErot tlceipalTotalcurrcnt rcccipB rdjutcd @)Cunatfroder'
tocolcrFircttohorretoldrtothc rcrtof thc wqld
ACuelircratprlmcmGorrerrment consumplion
6.67.0
r3.l35
30.2
16.2
2.tt2:l0.10.7
t2:l
7.3 7.t72 6.8
13.4 1333.t 4.0
3t.7 31.9
t7.6 l8.l2.0 2514.1 r4.00.1 0.1
0.t 1.0132 13.410.3 10.22.4 2.6
31.6 32.40.1 -0.5
1.7 2.02.3 3.1
35.6 315-3.9 -5.6
21.6 26.t
t .7 l3.l3.9 3.1
34.0 33.8
18.8 lt.t2.6 2.814.5 14.50.1 0.1
t3 2.O
13.9 13.7
10.6 r052:t 2J
34.0 t4.60.1 4.7
l9.l 17.62.6 2.014.7 13.90.1 0.1
3.1 3.913.9 t4.710.5 r032.7 3.3
36.1 362-1.4 4.5
1.9 1.8
3.7 3.741.6 4t.7-6.9 {.0
l2.t 1254.0 4.0
t7.4 172
17.2 17.41.8 2.t
13.8 r3.90.1 0.1
35 3.115.1 14.8
10.4 10.5
3J 3.335.8 95.51.6 tJ
10.4 9.9 9.9t2.o u.7 r2.2It3 tz.l 12.412.7 13.0 13.4
'1.0 4.1 4239.0 38.6 39.63t.3 39.0 39.8t?s 1t.0 1851.8 1.8 l.t
14.0 14.6 15.1
0.1 0.1 0.13.4 35 3.6l5.l t5.l t5.4105 to.1 r0.93.6 3.4 3.4
t6.t 366 t753.0 2.0 2.t2.3 2.4 2.31.4 l.l 0.t4.3 5.0 5.2
4l.t as 435-L7 -{.0 -3.9
-3.4 -3.6 -3.7
42 45 455,
10.4 10.310.3 roj
8.5 9.07.9 t3
95 1058.4 8.2
13.0 l2.t3.t 4.2343 35.7
1.3 t235 3.8
&.6 405-3.2 -3.3
2.0 1.7
2.8 3.038.E 39.3-{.t -5.5
Cmpenratioofemployecr 9.thrrchucr of goodr nd scrvicer 2,4
Torrlorrrcucxpndiurre 29.7Gruruving 0.6Gror mringedjurtcd@)Nacapitdtnndcn 13Grurfxedopitdfometion 1.9
Totalcxpcndiurre 32.8Nalcndigr(+)anctbonowiag(-) -L6Na lcndign(+) c nct bonowing(-)Adiurtcd (b)
Grurprblicdch 17.6 33.1 ,9.9 452 &2 6.6 429
(a) Cmmirion forccarlr October-Novcmbcr 1991.
O) Adjurted fc dchying tex rcimbunement for Gcncrel Government in 1989, 190 end 1991.
Sourcc: CmmiuiooScrviccr.
Thble 9: Thblc of flows
M.tdyunlfrld y)12
,,.t2
vt*,
t ttzn,g
v)t
$tlzflrl
9t
99J2
76.6
y)1,
99/,2
lirLa.l
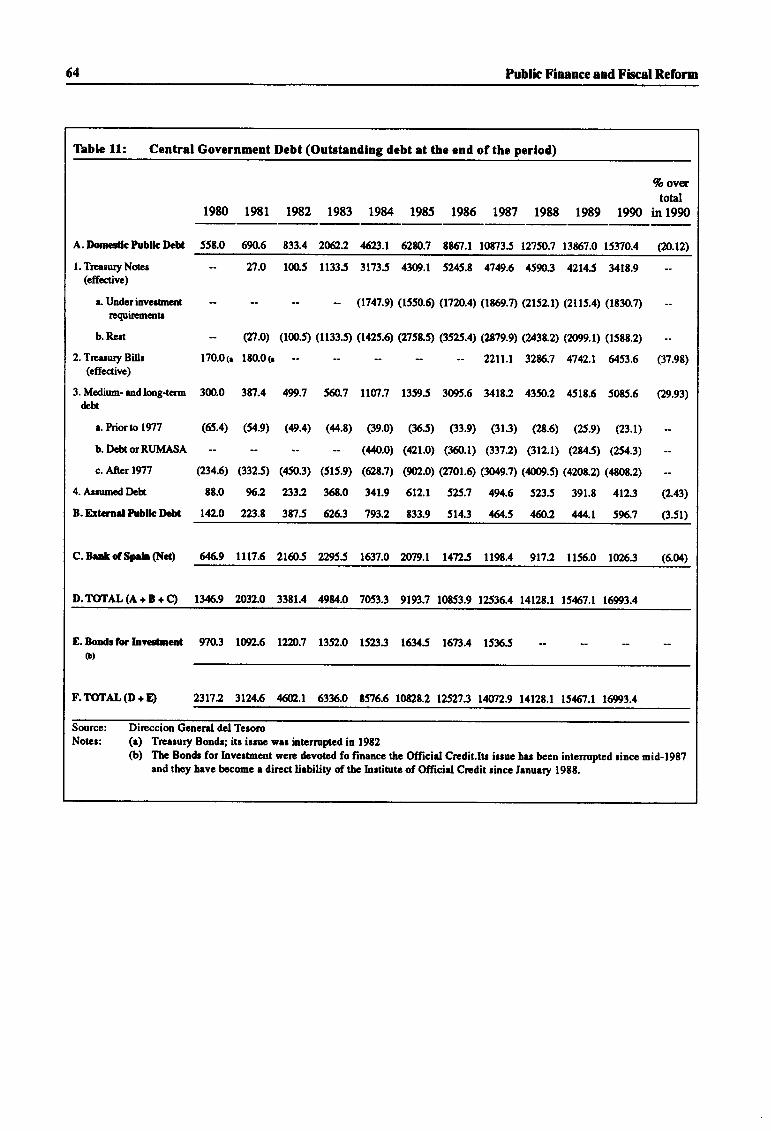
64 Public f inance and Fiscal Reform
1980 l9El
?o ovqtotal
1982 1983 Lg84. 1985 1986 1987 1988 1989 1990 in 1990
Tlble ll: Central Governmcnt Dcbt (Outstandlng dcbt et thc cnd of the perlod)
A. DomcClc Publlc Drbt
l. Trcasury Noter(effocrivc)
a. Undcrinvcrtmcnlrcquirtmano
b.Rert
2. Tresury Billr(effcctive)
3. Modium- and loog-tcrmdebt
a. Priorto l9I7
b. DcbtorRUMASA
c. After 1977
4. Arumod Dcta
B. Extcrnel hDlh DeDa
C. B.Dt of SprlD (Net)
558.0 690.6 833.4 262.2 6B.t 62gl..7 tt57.l 10rI35 ,,,50;t t3%7.0 153?0.4 (N.tz)
27.0 lms 11335 3t735 430,.1 5245.t {t49.6 45903 42t4.5 341r.9
(1747.9) (1550.0 07m.q (l$e.7) Qtsz.t) (2tts.4) (1830.7)
(2r.0) (100.5) (1133., (t42s.q Q158., (3s2s.4t Qr79.9) (u38.2) (2099.1) (1588.2)
l70.0rr 1t0.0<r 22ll.l 3286.J qAJ A$6 (37.93)
300.0 3fi.4 499.7 [email protected] flAt.1 1359.5 [email protected] 341t2 43fi.2 451r.6 5035.6 (D.93)
(65.4) (54.9) (4e.4) (44.8) (39.0) (365) (33.9) (313) (2r.6) (2s.e) Q3.r)
(440.0) (421.0) (W.t) (3372) (312.1) Q8/,s) (2s4.3) __
(234.6) Q325) (4503) (515.9) (62r.7) (m.0) (lt0,.q GO{9.7) (4009.t (42os.z) (,ts0s.2)
t8.0 96.2 233.2 36t.0 341.9 612.1 525.7 494.6 523.5 391.8 412.3 Q,43)
t4LO Xt3.8 3t7.5 6?t3 793.2 133.9 5t4.3 &.5 &0.2 444.1 596.7 (3.51)
6&9 1u7.6 2t6,.5 22955 t637.0 2ut9.t 14725 1198.4 917.2 1156.0 tV26.3 (6.04)
D.TOTAL(A+B+C) t345,.9 2032.0 33t1.4 4984.0 7053.3 9193.7 10853.9 12536.4 l4t28j 15467.1 169.3.4
E. BondslorlnvcstncoS 970.3 1W2.6 1220.7 1352.0 1523.3 16345 1613.4 15355(b)
F.TOTAL(D+D 2317.2 3t24.6 W2.t 63yi.O 8576.6 lor2r.2 t2527.3 t4ot2.9 l4l28.l 15467.1 t6993.4
Sorrce: Dircccion Genenl dcl TeroroNoEr: (e) Trearury Bondr; ir iruc ryu intcrroptcd in l9t2
(b) Thc Bon& for Innertment vcrc dcvotcd fo financc the Officid Credit.Itr itrue ber bcen intcmrptcd rincc mid-19t7ud thcy hevc bccome a dircct lirbility of thc Inrtitutc of Officiel Crcdit rince Irnurry l9tt.
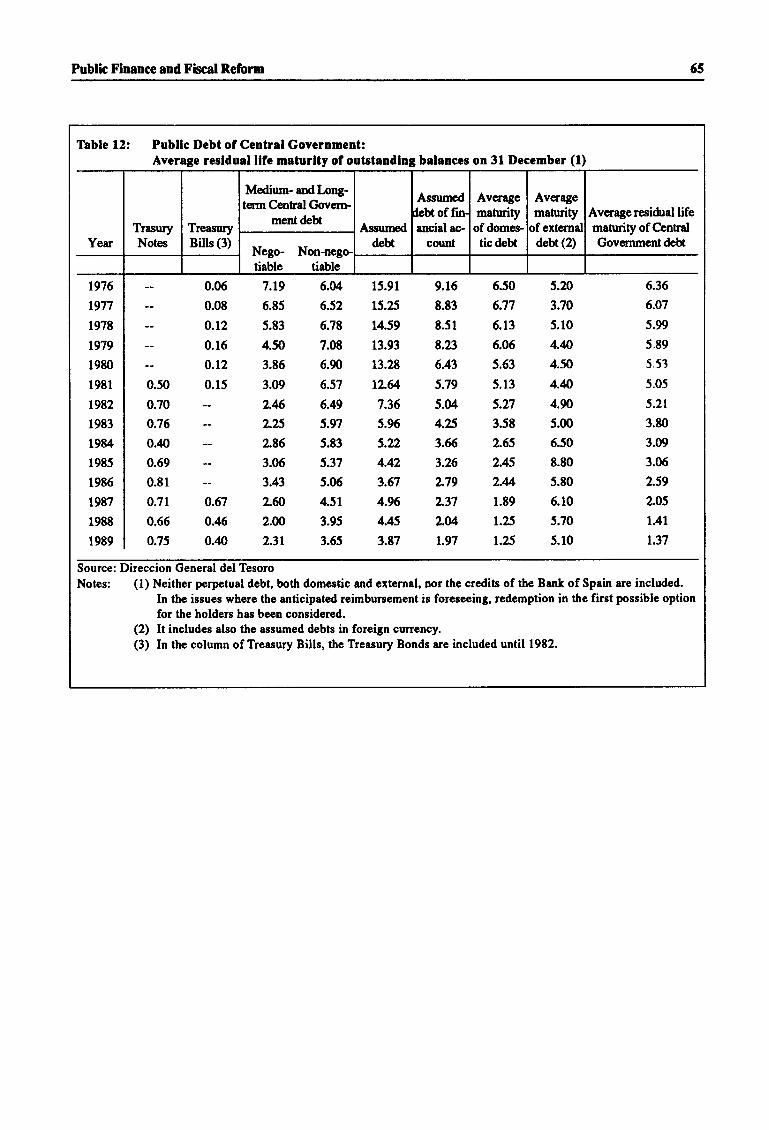
Public f inancu and Flscal Reform 55
Thble 12: Publlc Debt ol Ccntrel Government:Averagc resldual llle meturlty of outstandlng balances on 31 December (1)
Source: Direccion General del Tesoro
Notes: (1) Neither perpetual debt, both domestic and external, nor the credits of the Bank of Spain are included.In the issues where the anticipated reimbursement is foreseeing, redemption in the first possible optionfor the holders has been considered.
(2) tt includes also the assumed debts in foreign currency.(3) In the column ofTreasury Bills, the Treasury Bonds are included until 19E2.
YegrTrasuryNotes
TreasuryBills (3)
Medium- aodlnng-term Centsel Cov€rn-
mentdettAssumed
debt
Assumedlebt of financial ac-
count
Averagematurity
of domes-ticdebt
Averagematuityrf extemd
Averageresidral lifemahrritv of C-entral
Nego- Non-negotiable tiable
debt (2) Governmentdeh
1976
1977
1978
t979
1980
1981
1982
1983
1984
1985
1986
1987
1988
1989
o.ro
0.70
0.76
0.210
0.69
0.81
o.7t
0.55
0.75
0.06
0.08
o.L2
0.16
o.t2
0.15
7.19
6.85
5.83
4.50
3.85
3.@
2.6L25
2.86
3.06
3.43
2.@
2.@
2.31
6.04 15.91
6.52 15.25
5.78 14.59
7.08 13.93
6.m 8.286.s7 12.&
6.49 7.36
5.97 5.95
5.83 s.XL
5.37 4.42
5.05 3.67
4.51 4.96
3.95 4.45
3.55 3.87
9.16
8.83
8.51
8.23
6.43
5.79
5.04
4.25
3.66
t.26
2.79
2.37
LMr.97
5.50
6.77
6.13
6.05
5.63
5.r3
5.n3.58
2.65
2.45
2.U1.89
1.25
1.25
5.2n
3.70
5.10
4.N4.s0
4.fi4.n5.00
5.50
8.80
5.80
6.10
5.70
5.10
6.36
6.07
5.99
5.89
5.5i
5.05
5.21
3.80
3.09
3.06
2.59
LOs
1.41
1.37
-0.u,
0.46
0.40

66 Rcgimc Applicable to Capital Movemenb
CHAPTER IYREGIME APPLICABLE TO CAPITAL MOVEMENTS (*)
Contents
l. General assessment , , .67 may be incompatible with Communitylaw ..67
2. List of the provisions in the Spanishexchange control regulations which 3. Approaching time limits . . . . 67
Capital Movements Directorate

Regime Applicable to Capital Movements 67
L General assessment
Since its accession to theEuropean Community m 1 January1986, Spain has ma& zubstantial paogless towards the en-ding of existing exchange conEols, even acting well in ad-vance of the time limits laid down, and thus complying withits undertakings.
Despite this fact, some problerns still rernain : it is possiUethat some mles do not comply with Community law in forceregarding tbp freemoveme,nt of capital. Thenrles concernedare those relating to the admission to the domestic capitalmarket of foreign seorities where ttry are dealt in on a stockexchange and the admission to a foreing capital market offixed interest domestic securities where they are dealt in on astock exchrnge.
2. List of the provisions in the Spanishexchange control regulations which maybe incompatible with Community law
. trn Spain, the movement of capital is not governed by com-prehensive enacting terms, but by a number of differenttexts; sometirnes the rasponsibility for drafting erd imple-menting these texts lies with several govemment depart-ments.
. Some of these texts, in particular those rclating to direct in-vestments, investments in real estate and portfolio inves-tments, have been supplemented and amended to renderthem compatible with Community rules. Nevertheless, a
provision still remains which contravenes Council Direc-tive 88/361/EEC of ?A \tre 1988 for tbe irnplenrntationof Article 67 of the Treaty. The provision requires the sub-mission for prior authorizaton of Spanish direct inves-tments abroad (Royal Decree 2374186 of 7 November,Article 5(3)) which, because of their size, their nature ortheir financial chracteristics, may have &trimental conse-
quenoes for the national economy.
Directive 88/361/EEC establishes the obligation thatall direct investments abroad by Spanish residentsshall be unconditionally liberalized (tB of the Nomen-clature).
. Most personal capital move,ments and oper,atims such as
transfers in performance of insurance contracts, author'roydties, damages, etc., arereferred to in a specific text li-Ueratizing current invisible transfers (Ministerial Order of14 September 1989, s@uently developed by ttre DGTEResolution of 25 March 1985). Nevertbeless, the cur€ntsihrationposes the following problern : the list of operationsliberalized by the said DGTE Resolution, isnote;rhaustive
and those which are not explicitly mentionedremain subject to prior authorization. In particular, this is the case forcertian invisible tsansfers, which are considered to be capi-tal movements that are unconditionally liberalized undercommunity law (headings X, XI and XItr of the Nomencla-ture of Directive 88/36l/EEC).
. Under Spanidr rules, authorization is roquired for the ismeand placing on the domestic capital market of foreign se-
curities where they are dealt in or in the process of intro-duction to a stock exchange in a Member State.Authorizetion is also rcquired for tb issue ard placing ofdomestic fixed interest securities on a foreign capital mar-ket where they rre dedt in or in the process of introductionto a stock of exchange in a Member State.
In all the cases mentioned above, Directive 8V361/EEC es-
tablishes ur obligation for the unconditional liberalization ofthe capital moveme,lrts concerned (Annex IV, List tr, headingItr B of the Nomenclature).
3. Approaching time limits
Corurcil Directive 88/361/EEC for the full liberalization ofmovements of capital, which entcred into force on I July1990, sets a transitional period for Spain which will end on31 December 1992. At ttris date, all rcmaining resbictionswill have to be lifted" The restictions in question apply to thefollowing capital movernents :
. admission to the domestic (foreign) capital martet of fo-reigrr (domestic) securities not &alt in or in the process ofintroduction to a stockexchange in a Menrber State (AnnexIV, List ltr, heading Itr B of the Nornenclature);
. a&nission to the domestic capital nrartet of the units of fo-rcigrr collective invesnrent rurdertakings not subject to Di-rpctive 85/61I/EEC (Annex IV, List IIL heading IV B I ofthe Nomenclature);
. medium-terur and long-term financial loans and credits(Annex IV, List Itr, heading VItr A and B 2 and 3 of the No.menclature);
. the operations referrcd to in Annex IV, List IV; these arpgrrinly operations in securities dealt in on the money mar-ke( operations in current and deposit rccounts with finan-cial institutions and strort-term finarcial loans ard cr€dits.
The Minister of the Economy d€clarrcd in September 1991
that the Spanistr Govemrnent will eliminate, by the erd of1991, all remaining restrictions on the free movement ofcapital, well ahead of the deadline established in the CoucilDirective 88/361/EEC of 31 Decembcr 1992
68 The Financial Systcm
CHAPTER YTHE FINANCIAL SYSTEM (*)
Contents
1. The Credit Institutions . . . . . .69 2.2. The Stock Exchange and the financing ofthe private sector
1.1. The Spanish banking system . . .692.3. The modernization of the
1.2. Recent trends in the banking system . .69 Stock Exchange : . . . . 73
1.3. Operational costs andprofitability of 2.3.1. The general framework . . . . 73
creditinstitutions .. . .692.3.2.The institutional structure . . 73
1.4. The different types of credit institutionsand their relative positions . . . .70 2.3.3. Technical changes . . 74
2. TheStockExchange .......72 2.3.4.Otherdevelopments ......75
2.l.Principalcharacteristics .....73 3. Conclusions ....76
(*) This chapter was mainly prepared by Victor ANDRES MALDONADO of the Financial Engineeringand Capital Movements Directorate.
73
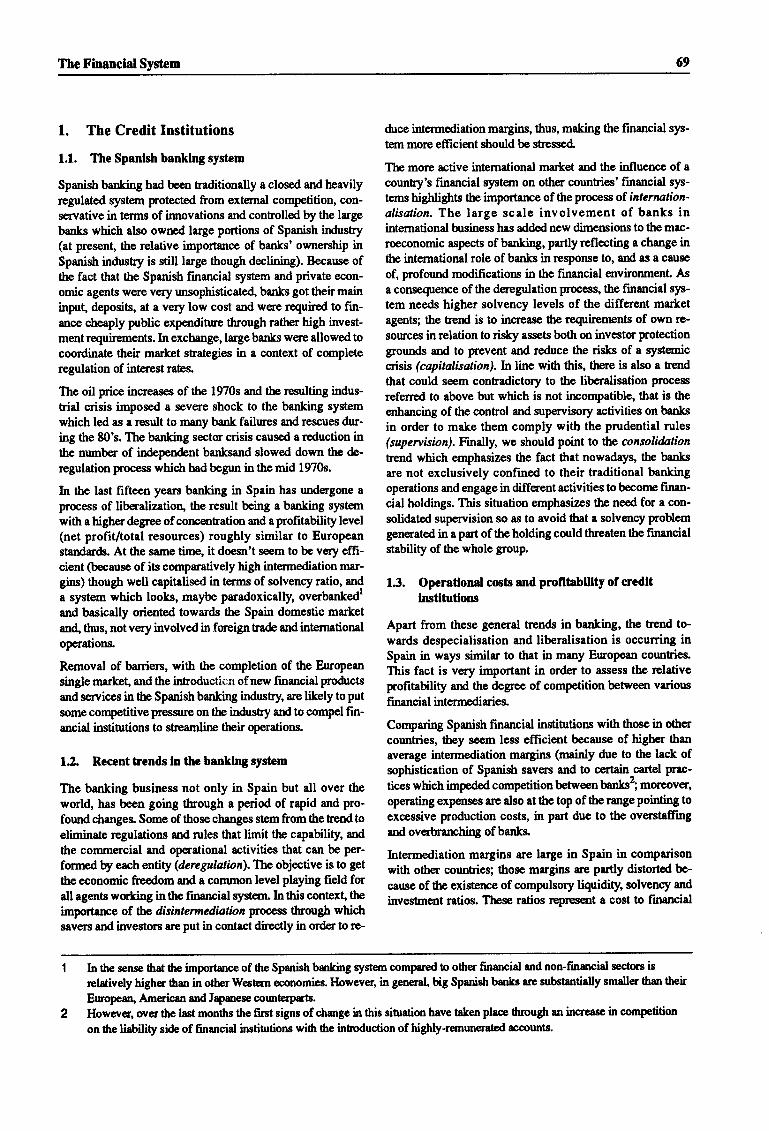
The Financial System 69
1. The Credit Institutions
1.1. The Spanlsh banklng system
Spanish banking had be€n haditionally a closed and heavilyregulated system protected from extemal competition, con-seryative in terms of innovations and controlled by the large
banks which also ownpd large portions of Spanish industry(at presenl the relative importance of banks' ownership inSpurish industry is still large though declining). Because ofthe fact that the Spanish financial system and private econ-omic agents were v€ry unsophisticatd banks got their maininpu! deposits, at a very low cost and were required to fin-ance cheaply public expenditure tbrough rather high invest-ment requirements. In exchange, large banks were allowed tocoordinate their market strategies in a context of completeregulation of intenest rates.
The oil price increases of the 190s and tb€ resulting indus-trial crisis imposed I severe shock to the banking system
which led as a result to many bank failures and rescues dur-ing the 80's. The banking sector crisis caused a rpduction inthe number of irdependent banksand slowed down the &-regulation process which had begun in the mid 1970s.
In the last fifteen years banking in Spain has undergone aprocess of liberalization" the rezult being a banking syst€m
with a higher degree of correntration and a profitability level(net profit/total resources) roughly similar to Europeanstandards. At the same time, it doesn't seem to be very efft-cient (because of its comparatively high intermediation mar-gins) though well capitalised in terrrs of solvency ratio, and
a system *hi"h looks, maybe paradoxically, overbankedland basically oriented towards the Spain domestic market
and, thus, not very involved in foreign tra& and internationaloperations
Removal of bariers, with the completion of the European
single martel and the inboducfrcn of new financial pro&ctsand services in the Spanish banking indusEy, are likely to putsomecompetitive pressre on tbe industry ard to compel fin-ancial institutions to sfireamlfup their operations.
12. Recent trends ln the banklng system
The banking business not only in Spain but all over theworl4 has been going through a period ofrapid and pro-found changes. Some of those changes stem from the hend to
eliminate regulations and rules that limit the capability, and
the commercial and operational activities that can be per-
formed by each entity (deregulatbn). The objective is to get
the economic freedom and a common level playing field forall agents wqking in the frnancial system. In this context the
importance of. tfu disintermediation process ttnough whichsavers and investors are put in contact directly in order to re-
drce intermediation margins, thus, making the financial sp-temmore efticient should be shessed.
The more active international market and the inlluence of acountr5l's financial system on other counhies'financial sys-
tems highlights the importance of the procect of. interration-alisation. The large scale involvement of banks ininternationd business has added new dimensions to the mac-roeconomic aspects of banking, partly reflecting a change inthe intemational role of banks in response to, and 8s a cause
of, profound modifications in the financial environmenL Asa consequerrce of the deregulation process, the financial sp-tem needs higher solvency levels of the different mar*etagents; the trerd is to inctease the requirernents of own re-sources inrelation to rislsy assets both on investo protectiongrounds and to prevent and reduce ttre risks of a systemic
c;risis (capitalisation).In line with this, there is also a trendthat could seem contradictory to ttre liberalisation process
rpferred to above but which is not irrcompatible, that is the
enhancing of the control and zupervisory activities on banks
in order to make them comply with the prudential rules(superrision). Finally, we should point to the consolifutiontrend which emphasizes the fact that nowadays, the banks
are not exclusively confined to their traditional bankingoperations and engage in different activities to beconre finan-cial holdings. This situation emphasizes the need for a con-
solidated supervision so as to avoid that a solvency problemgenerated in a part of the holding could ttneaten the financialstability of the whole group.
13. Opcratlonal costs and profttablllty of crcdltlnstltutlons
Apart from these general trends in banking, the hend to-wards despecialisation and liberalisation is occurring inSpain in ways similar to that iu many European countries.This fact is very important in order to assess the relativeprofitability ard the degree of competition between various
financial intermediades.
Comparing Spanish financial institutions with those in other
countries, they seem less efficient because of higher thanaverage intermediation margins (rnainly due to the lack ofsophistication of Spanish savers and to certain cartel prac-
tices which impeded competition between bonks2; mor€ov€r,
operating expe,nses are also at the top of the range pointing to
excessive production costs, in part due to the overstaffingand overbranchiag of banks.
Intermediation margins are large in Spain in comparisonwith other countries; those margins ale partly distorted be-
cause of the existerrce of compulsory liquidity, solvency and
investment ratios. These ratios represent I cost to firuncial
In the sense that the importance of the Spanish banking system compared to other financial md non-financid sectors is
relatively higher thm in otherWestern economies. Itrowever, in general, big Spanidt banks are substantially smaller than their
European, American and Japanese couterparts.Howeryer, over the last months the first signs of change in this sihration have taken place through an increase in competition
on the liability side of financial instihrtions with the inboduction of highly-remunerated rc@unts.
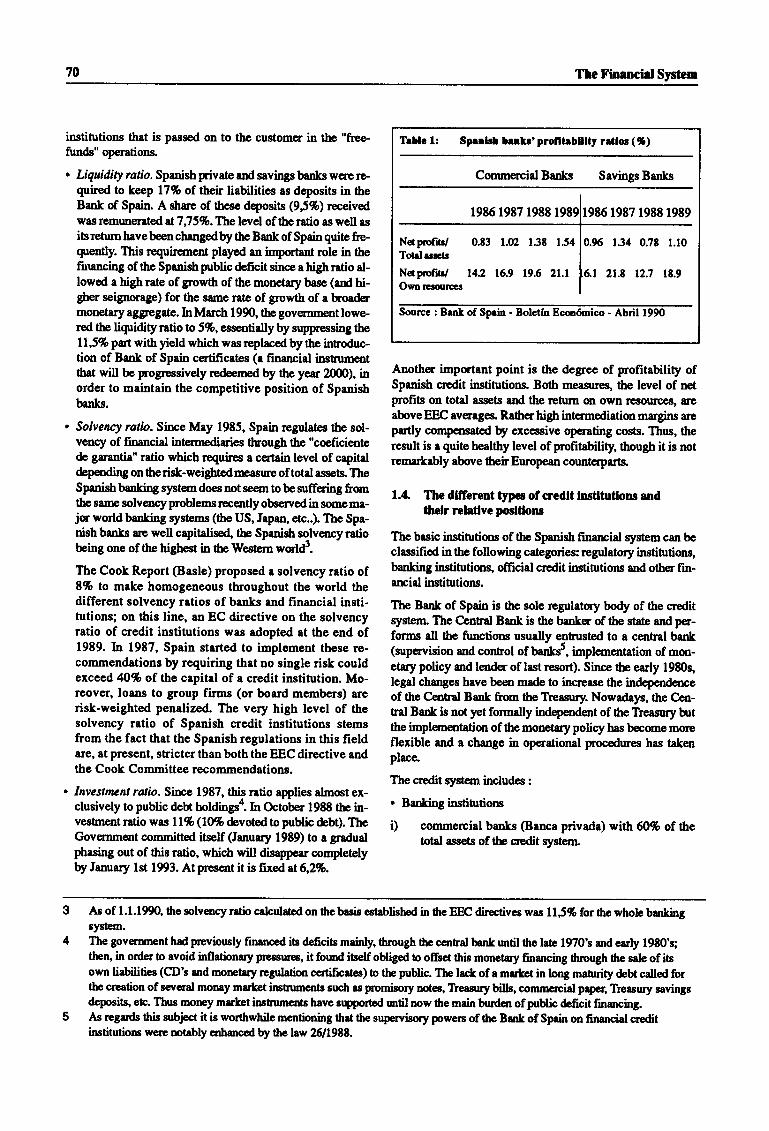
70 Thc Financiel System
instihrtions that is passcd on to tb customer in the "free-fuitds" operations.
. Liquidig ratia. Spanish pivate and savings bonks were re-quired to kerp l7% of their liabilities as deposits in theBank of Spain. A share of these deposits (95*) receivedwasremunerated Nt7:75%.Thelevel of theratio aswell as
its rctum have been changed by the Bank of Spain quite fre-quently. This requircrnent played an important role in tbfiruncing of the Spani$ prblic &ficit since a high ratio al-lowod a high rate of growth of the monetary base (and hi-gher seignorage) for the same rate of growth of a broadermonetary aggregate. InMarch 1990, tbe government lowe-red the liEridityratio to 5%, assentiallyby suppressing the11,5% put with yield which wasreplaced by tbe introduc-tion of Bank of Spain certificatet (a Frnancial instsumentthat will be progrcssively redeemed by the year 20(n), inorder to maintain the competitive position of Spanishbadrs.
. Solvency ralio. Sirce May 1985, Spain regulates the sol-vency of financial intermediuies though the "coeficientede garantia" ratio which requires a certain level of capital&pending on theri*-weightedreasure of totd assets TheSpanish bankfurg system does not seem to be suffering frqntbe same solvency problems lecently observed in some ma-jc world banking systems (the US, Japao etc..). The Spa-nish banks ue well capitalise4 the Spani$ so-lvency ratiobeing one of the highest in the West€rn wqld'.
The Cook Report @asle) proposed a solvency ratio of8% to make homogeneous throughout the world thedifferent solvency ratios of b&nks and financial insti-tutions; on this line, an EC directive on the solvencyratio of credit institutions wes adopted at the end of1989. In 1987, Spain started to implement these re-commendations by requiring that no single risk couldexceed 4O% of. the capital of e credit institution. Mo-reover, loans to group firms (or board members) arerisk-weighted penalized. The very high level of thesolvency ratio of Spanish credit institutions stemsfrom the fact that the Spanish regulations in this fieldere, at present, stricter than both the EEC directive andthe Cook Committee recommendations.
. Investtwnt ralio. Sirce 1987, this ratio applies almost ex-clusively to public debt holdingsl In Octoba 198t tbe in-veshrent ratio was l1% (10% devoted to public &bt). TheGovemment committed itself (Ienury 1989) to a grrdudphasing out of this ratio, which will disappear completelyby January lst 1993. At present it is fixed at 5,2%.
Another important point is the degree of profitability ofSpanish cr€dit institutions. Both measur€q the lerrel of netprofits on total assets and the retum m own nesouroes, ereabove EEC ev€reges. Rather high intermediation margins arepartly compensatod by excessive operating cosB. Thus, theremlt is I quite healthy level of profrtability, though it is notremarkably above their European count€rpefis.
1.4 The dlllerent typcs ofcredlt lnsdtuflons andthelr relrflve posltlons
The brsic instihrtions of the Spanish finarciel system can beclassifiod in the following categories: regulatory institutions,banking institutions, official credit institutions and other fin-arrcial institutions.
The Bank of Spain is tbe sole regrlatory body of the creditsystem. The C.entral Bank is the banker of the state and pcr-forms all the functiors usuallv entsusted to a central bank(superrrision and control of banks5, implernentation of mm-etary policy and lemder of last resort). Since the early 1980s,legal changes have been made to ins,eese the indcpendenceof the Cenbal Bank from tb Treasury Nowadays, the Cen-tral Bank is not yet formally independent of the Treasry butthe implerrentation of the monetar5r policy has bec(me morpflexible and a change in operational procedures has takenplaca
The credit sySem includes :
o f,enlring instiUtions
i) commercial lnnks @1ags privada) with 60% of thelotal assets of tbe oedit systern
Asof l.l.l90,thesolvencyratiocalculatedonthebasisestablishedinlheEECdiloctiveswas ll!%tortrewholeburkingsystem.
The government had previously finanoed itr deficits mainly, thmugh the cental bonk untit the late 190's and early l9t0's;then, in order b rvoid inflationary pressures, it found itself obliged to offset this monehry financing tfuough fie sale of itsown liabilities (CD's and monetary regulation certificates) b the public. Thp lact of a market in long mahrity debt called forthc creation of several monay market instsuments such os promisory notec, Treanry bills, commerci"l prp"r, Treasury savingsdeposits, etc. Thus morry martet instsunrenb have srryported rmtil now tlre main burden of public &ficil financhg.As rcgards this sublxt it is worlhwhile mentioning tlrot the supervisory powers of tlre Bank of Spain on financiat creditinstitutionc were mtably enhmcod by the lsw 261L9t8.
Trblc 1: Sprkl bertr'prolllrblllSy rrtlor (96)
Comarcrcial Benks Savings Banks
1986 1987 1988 1 1987 1988 1989
Naprof,rtdTotal errctr
Napmfitr/Osn rcrorrccr
0.83 l.(n 1.38 r54
142 16.9 19.5 2l.l
0.!6 1.34 0.7t l.to
I 2l.t r2.7 r8.9
Sourcc : Bank of Spain - Boletfn Ecoo6mico - Abril 1990
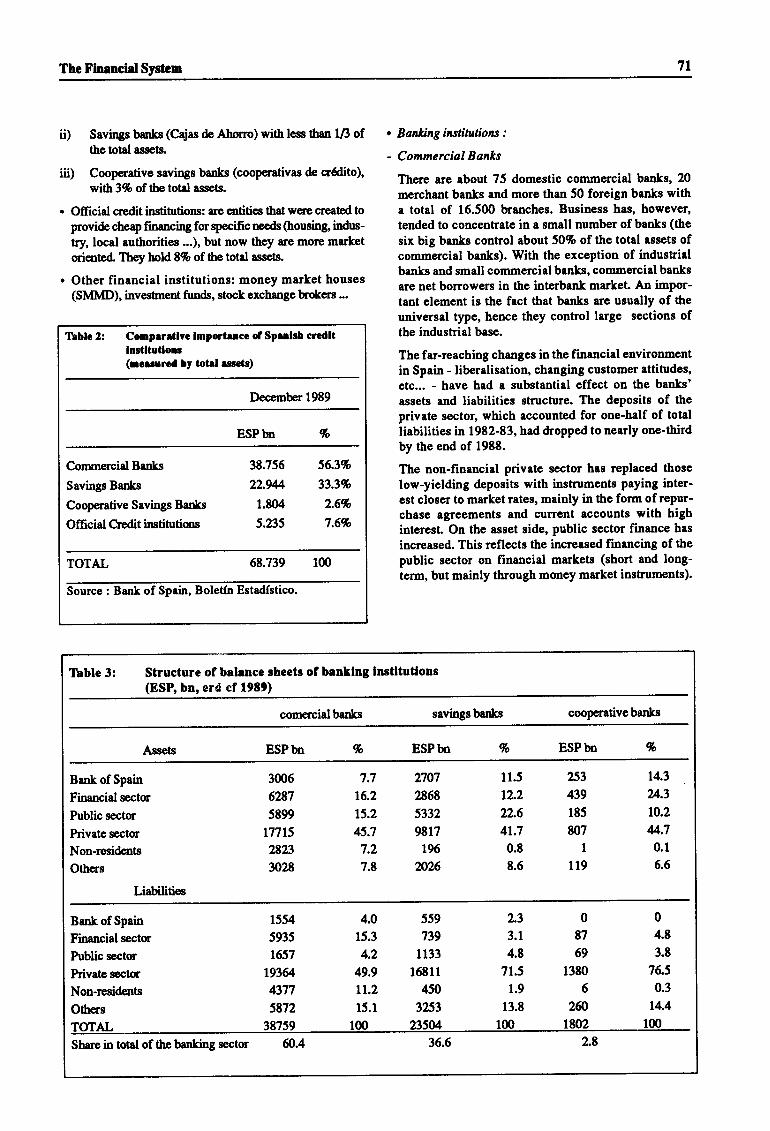
The Financial Systcm 7l
ii) Saviugs banks (Cajas & Ahorro) with less tlun 1/3 ofthe total assets.
iii) Cooperative savings banks (cooperativas ds Gr6dito),
with 3% of the totd asset$
. Official cr€dit institutions: are entities that were sreated toprovide cheap financing fc qpecific nceds (housing, indus-
try, local authorities ...), but now they are mote marketoriented They hold 8% of the total assets.
. Other financial institutions: money market houses(SMMD), investnent funds, stock exchange brokers ...
. Banking fustitutions :
- Commercial Banks
There are about 75 domestic comrnercial banks, 2I)
merchant banks and more than 50 foreign banks witha total of 16.500 b,ranches. Business has, however,tended to concentrate in a small number of banks (the
six big benks control about 50% of the total assets ofcommercial banks). With the exception of industrialbanks and small commercial banks, commercial banks
af,e net borrowers in the interbank markel An impor-tant element is the fact that banks are usually of the
universal type, hence they control large sections ofthe industrial bese.
The far-reaching changes in the financial environmentin Spain - liberalisation, changing customer attitudes,etc... - have had a substantial effect on the banks'assets and liabilities structure. The deposits of theprivate sector, which accounted for one-half of totalliabilities in 1982-83, had dropped to nearly one-thirdby the end of 1988.
The non-financial private sector has replaced those
low-yielding deposits with instnrments paying inter-est closer to market rates, mainly in the form of repur-chase agreements and current accounts with highinterest. On the asset side, public sector finence has
increased. This reflects the increased financing of thepublic sector on financial markets (short and long-term, but mainly through money market instruments).
Trblc 2: Comperetlvc luportucc of Speelel credltlnslltutlonc(ncerured by totrl eerctr)
December 1989
BSPbn %
Cornmercial Banks
Savings Banks
Cooperative Savings Banks
Offrcial C!,edit institutions
38.756 56.3%
22.W 33.3%
1.804 L6%
5.235 7.6%
TOTAL 68.739 1m
Source : Bank of Spain, Bole(n Estadfstico.
llablc 3: Structure of balancc shccts of banllng lnstltutlons(ESP, bn, crd cf 19t9)
comencialbanks savings banks cooperative banks
Assets ESPbn % ESPbn % ESPbn %
Burk of Spain
Financial sector
Public sector
Private sectuNon-residents
Others
3005
6287
5899
t77152823
3028
7.7
16.2
15.2
45.7
7.2
7.E
no72868
5332
9817
196
?n2ri
11.5
tL222.6
41.7
0.E
E.6
253
439
185
807
I119
14.3
24.3
10.2
u.70.1
6.6
Liabilities
Bank of Spain
Financial sectoPublic sectm
hivate sector
Non-residents
Others
1554
5935
1657
193il4377
5872
4.0
15.3
4.2
49.9
Lt.215.1
559
739
1133
15811
450
3?53
2.3
3.1
4.8
71.5
1.9
13.8
100
0
87
69
1380
6
zfi1802
0
4.8
3.8
76.5
0.3
14.4
1mT(]rAr- 38759 lm 2350/.
Share in total ofthe banking secto ffi.4 36.5 2.t
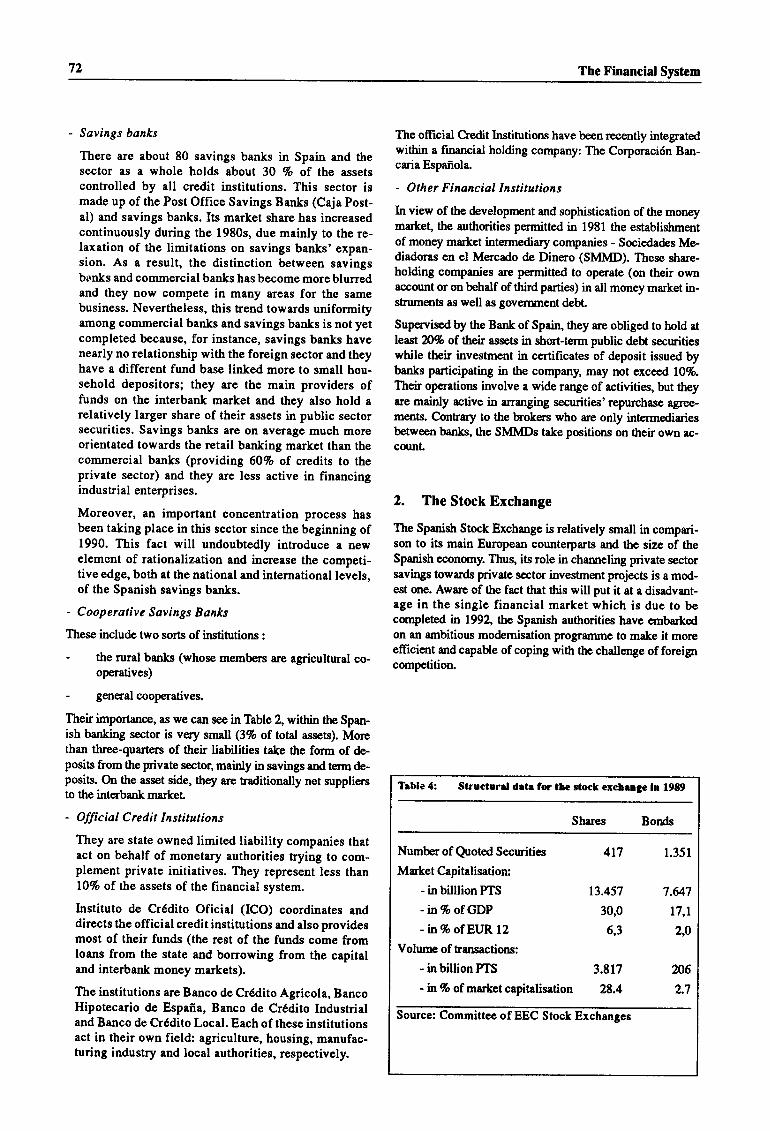
72 The Financial System
- Savings banks
There are about 80 savings banks in Spain and thesector as a whole holds about 30 % of the assetscontrolled by all credit institutions. This sector ismade up of the Post Office Savings Banks (Caja Post-al) and savings banks. Its market share has increasedcontinuously during the 1980s, due mainly to the re-laxation of the limitations on savings banks' expan-sion. As a result, the distiuction between savingsbirnks and commercial banks has become more blurredand they now compete in many areas for the samebusiness. Nevertheless, this trend towards uniformityamong commercial banks and savings banks is not yetcompleted because, for instance, savings banks havenearly no relationship with the foreign sector and theyhave a different fund base linked more to small hou-sehold depositors; they are the main providers offunds on the interbank market and they also hold arelatively larger share of their assets in public sectorsecurities. Savings banks are on average much moreorientated towards the retail banking market than thecommercial banks (providing 6O7o of credits to theprivate sector) and they are less active in financingindustrial enterprises.
Moreover, an important concentration process hasbeen taking place in this sector since the beginning of1990. This fact will undoubtedly introduce a newelement of rationalization and increase the competi-tive edge, both at the national and international levels,of the Spanish savings banks.
- Cooperative Savings Banks
These include two sorts of institutions :
- the rural banks (whose members are agricultural co-operatives)
- general cooperatives.
fireir importance, as we can see in Table 2, within the Span-ish banking sector is very small (3% of total assets). Morethan three-quarters of their liabilities take the form of de-posits from the private sector, mainly in savings and term de-posits. On the asset side, they are traditionally net zuppliersto the interbank rurkel
- Official Credit Institutions
They are state owned limited liability companies thatact on behalf of monetary authorities trying to com-plement private initiatives. They represent less thanl0% of. the assets of the financial system.
lnstituto de Cr6dito Oficial (ICO) coordinates anddirects the official credit institutions and also providesmost of their funds (the rest of the frrnds come fromloans from the state and borrowing from the capitaland interbank money markets).
The institutions are Banco de Crddito Agricola, BancoHipotecario de Espaffa, Banco de Cr6dito Industrialand Banco de Cr6dito Local. Each of these institutionsact in their own field: agriculture, housing, manufac-turing industry and local authorities, respectively.
The offrcial Credit Institutions have been recently integratedwithin a financial holding company: The Corpuaci6n Ban-caria Espafiola.
- Other Financial Institutions
In view of the development and sophistication of the moneymarket the authmities permitted in 1981 the establishmentof money market intermediary companies - Sociedades Me-diadoras en el Mercado de Dinero (SMMD). These share-holding companies are permitted to operate (on their ownaccount or on behalf of third parties) in all money market in-struments as well as government debl
Supervised by the Bank of Spain, they are obliged to hold atleast N% of their essets in short-term public debt securitieswhile their investment in certificates of deposit issued bybanks participating in the company, may not excerl lOVo.
Their operatiors involve a wide range of activities, but theyare mainly active in arrurging securities'repurchase agree-m€nts. Contrary to the brokers who are only intermediariesbetween banks, the SMMDs take positions on their own ac-counl
2. The Stock Exchange
The Spanistr Stock Exchange is relatively small in compari-son to its main European counterparts and the size of theSpanish economy. Thus, its role in channeling p,rivate sectorsavrngs towards pnvate sector invesknent projects is a mod-est one. Aware of the fact that this will put it at a disadvant-age in the single financial market which is due to becompleted n 1992" the Spanish authorities have embarkedon an ambitious modemisation programme to make it moreeffrcient and capable of coping with the challenge of foreigrcompetition.
Trble 4: Structuret dttr lor thc stocl exchrngc ln 1989
Shares Bords
Number of Qmoted Secwities
Market Capitalisation:
- inbilllionPTS
-in% of GDP
- in % of EllR 12
Volurne of trrnsactions:
- in billion PTS
- in % of market capitalisation
417
13.457
30,0
6,3
3.8r7
28.4
1.351
7.U7
l7,l2,0
206
2.7
Source: Committee of EEC Stock Exchanges
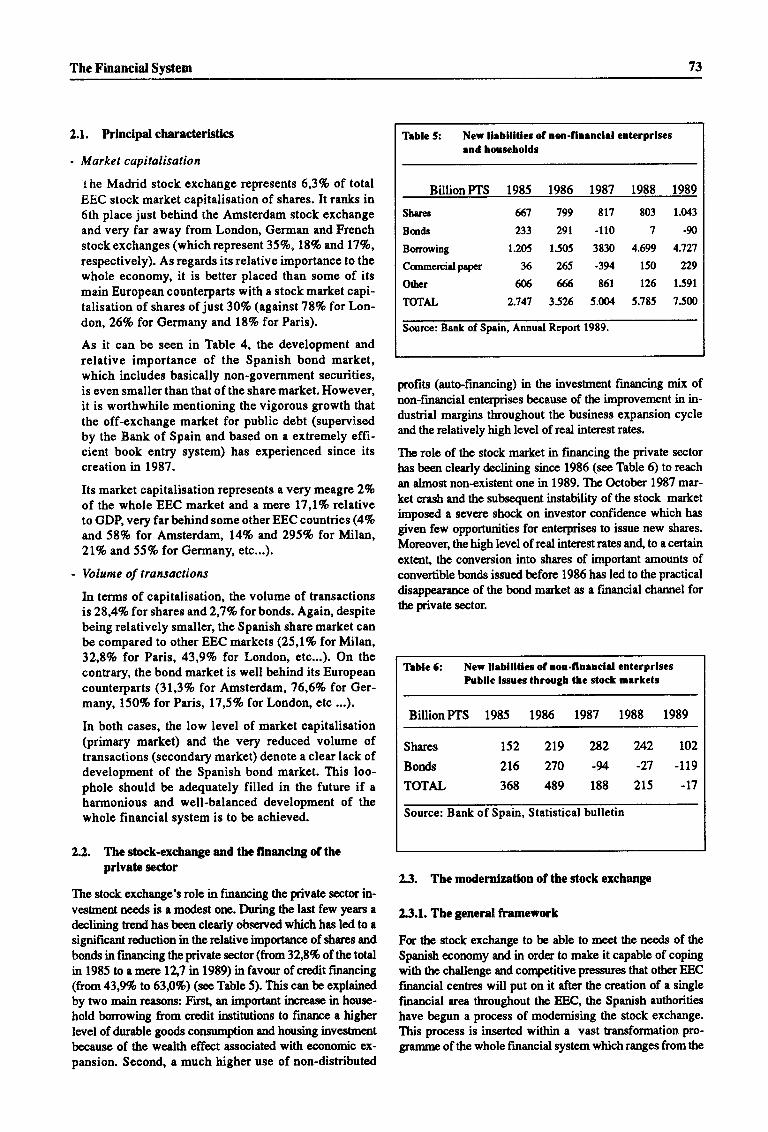
The Financial System 73
2.1, Prlnclpal characterlstlcs
- Market capitalisation
t he Madrid stock exchange represents 6,3% of totalEEC stock market capitalisation of shares. It ranks in6th place just behind the Amsterdam stock exchangeand very far away from London, German and Frenchstock exchanges (which represent 35%, 18% and l7%,respectively). As regards its relative importance to thewhole economy, it is better placed than some of itsmain European counterparts with a stock market capi-talisation of shares ofjust 307o (against 787o forLor.-don,267o for Germany and 18% for Paris).
As it can be seen in Table 4, the development andrelative importance of the Spanish bond market,which includes basically non-government securities,is even smaller than that of the share market. However,it is worthwhile mentioning the vigorous growth thatthe off-exchange market for public debt (supervisedby the Bank of Spain and based on a extremely effi-cient book entry system) has experienced since itscreation in 1987.
Its market capitalisation represents avery meagre 2%of the whole EEC market and a mere l7,l% rclativeto GDB very far behind some other EEC countries (4%and 58Vo for Amsterdrm, l47o utd' 295% for Milan,2LVo ud 55% for Germany, etc...).
- Volume of transactions
In terms of capitalisation, the volume of hansactionsis28,4%o for shares rnd2,7% forbonds. Again, despitebeing relatively smaller, the Spanish share market canbe compared to other EEC markets (25,1% for Milan,32,8% for Paris, 43,9% for London, etc...). On thecontrary, the bond market is well behind its Europeancounterparts (31,3?o for Amsterdam,76,6?o for Ger-many, 150% for Paris, L7,59o for London, etc ...).
In both cases, the low level of market capitalisation(primary market) and the very reduced volume oftransactions (secondary market) denote a clear lack ofdevelopment of the Spanish bond market. This loo-phole should be adequately filled in the future if a
harmonious and well-balanced development of thewhole financial system is to be achieved.
2.2. The stock-exchange end the flnanclng of theprlvate sec'tor
The stock sachnnge's role in finarcing the private sector in-ve.stnent needs is a modest orr. During the last few years a
declining hend has been clearly observed whioh has led to asignificant reduction in the relative importance of shses and
bonds in financing the private sector (from 32,8% of tlrc totslin 1985 to a m€rp l\7 n 1989) in favoru of credit financing(tuom43,99" to 63p%) (see Table 5). This can be explainedby two main reasons: Finf an impodant increase in house-
hold borrowing from cr€dit institutions to finame a high€rlevel of durable goods consumpion and housing investrnentbecause of the wealth effect associated with economic ex-pansion. Second, a much higher use of non-distributed
profits (auto-financing) in the investrnent financing mix ofnon-financial enterprises because of ttr imp,rovement in in-dustial margins tlnoughout the business expansion cycleand the relatively high level ofreal interest rates.
Thp role of the stock market in financing the private sector
has been clearly declining since 1986 (see Table 6) to reach
an dmost non-existent one in 1989. The October 1987 mar-
ket crash and the subsequent instability of the stock martetimposed a severe shock on investor confidence which hasgrven few opportunities for enterprises to issue new shares.
Moreover, the high level of real interest rates and, to a certain
exte,n! the conversion into shares of important amounts ofconvertible bonds issued before 1986 has led to the practical
disappearance of the bond market as a financial channel forthe private sector.
L3. The modernlzatlon of the stock exchange
13.1. The general framework
For the stock exchange to be able to meet the needs of the
Spanish economy and in order to make it capable of copingwith the challenge and competitive pressures that other EECfinancial centses will put on it after the creation of a singlefinancial area throughout the EEC, the Spanish authoritieshave begun a process of modernising the stock exchange.
This process is inserted within a vast transformation pro-gramme of the whole financial rystem which ranges from the
Ilblc 5: Ncw lhbllltleg of loo-fhenchl entcrprlscrrnd houscholds
BillionPTS 1985 1986 1987 1988 1989
Shares 67 799 El7 803 1.043
Bods 233 291 -ll0 7 -*Bonoring l.2OS 1505 3830 4.699 4.727
Ccnmercialpaper 36 265 -394 150 229
Othcr ffi ffi 861 126 1.591
TOTAL 2.747 3.526 5.m4 5.785 7.500
Sourcc: Bank of Spein, Annual Report 19t9.
Teblc 6: New llebllltles of noe-llnenclel cnlcrprlscsPubllc l$ues through thc stock mrrkets
BillionPTS 1985 1986 1987 1988 1989
Shares 152 219 282 U2 102
Bords 216 270 -94 -n -119
TOftAL 368 489 188 215 -17
Source: Bank of Spain, Statistical bulletin
74 The Financial System
functioning of the public dcbt martet, thecreetion of pensionfunds, andso oo.
Law2tlll988of 2S.7.198d costitutes the comerstore of thestockexchangereform, whichhas as a ge,neral objective thepromotion ard modernization of the Spanish stock mutets.In concrete terms, it aims eE
a) impoving theefriciency and secruity ofthe oper:ationalaspects of the martef by the introduction of a continu-ous market where tsansactions are handled throughCAIS (Computer Assisted Trading System), an elec-tsonic systcm replacing the physicel presense ofbre'kers on the trading floa.
b) promotingahigherdegreeofcompetitionbetweenmar-ket participants by liberalizing the access to mrrketmembership, thms abolishing the stocktrokers' monopoly and liberalizing int€rmediation fees and coumis-sions.
c) increasing the financial capactty and capital reguirre-ments of intermdiaries so as to allow them to developtheir own cmmercid networks, as well as to takeriskson theh own belalf.
d) establishing adequate channels to diffirse informationand imp,rove transparercy of the stockmartet by imple-menting tighterrules in this field.
e) upgrading the supervision of martet tradfuU ad int€r-mediaries by sefiing up a new public zupervisory andregulato,ry body: the Stock Exchange National Com-mission
232. Thc lnsdtudonal structurc
The law 2411988 modified the institutional structure ofSpanish stock martets. In Graph I the new institutimal ar-rangeme,nts can be seen:
a) The Slock Exchange National Commissiot: This is tbebody incharge of thercgulationandcontrol of both theprimary and secondary stock markets as well as thesupervision of all stock martet intermediaries.
b) Securitie.s agencies and companies8: Tlrey constitutethe only market intermediaries. They are subject to aminimum strpital requirement (750 millions pesetas fccompanies and 150 millions for agercies), solvencyra-tios and liquidity ratios. Securities companies can deal
m their owa belalf, &al on qedit with their clients ardengage in underwriting operations. Both companiesand agencies cen op€n branches thoughout Spain andabroa4 have acoess to int€rrnediaries on thepublic debtmart€t, deal in foreign curr€.rrcy operations, €ngage es
portrolio manegers and become depositaries of invest-rent funds. They are zubject to the zupervision of theStock Exchange Netional Commission in their stockmartet operations and of the Bank of Spain in their pub'lic debt ma*et and fmeign currency o,perations.
c) Govenring bodies of the Stock Exchrngesg : One gov-eming body exisb for eech of the four Spanish StockExchanges (Madri{ Barcelong Bilbao and Valerria).They are legal public companies whose shares areowned by those securities companies and agencieswhich uerrembers of the StockBxchangelo. Thegov-eming body of a Stock Exchange is in clrarge of the or-ganisation
"n6 luaslisning of the Stock Exchange,
authorising the admission to the official guotation ofany security and diffirsing any piece of news relatod tomartet treding and financial balarce sheets of issuersand menrbers of the Stock Exchanga
d) StockExchange Companyll: This Company is ownod(25%) by eachof the govenring bodies of the four StockExchanges It is in chalge of the functioning of Ore tr-terconnected Systemlz (or Continuous Market) bywhich the p,reviously isolated and independent StockExchanges of Barcelona, Bilbao, Madrid and Valenciabecome integrated in a singlemarter Though this sys-tem, a direct connction on a real timc basis is estab-Iished between the four Stock Exchanges so that asingle pdse is settled for the same security at each mo-rcnL As aresult, the liquidity of themartet fc any s€-
curity dealt with through the system is clearlyenhance4 sirrce all trading is concentrated in a singlemsrtet
e) ClearingandSettlementServicel3:Allactivitiesrelatedto ttr Clearing and Settlernent of trading canied out inany StockMar&et ue corcentrated in this service.
23.3. TGchnlcal Changes
Alurg with the new institutional stnrcturc, some irnpctanttechnical changes are undertry since thereform look place:
678I10
11
1213
It entued fully into force on 29.7.19t9.Comisi6n Nrional del Mercado de Valores (CNMV).Agercias y Sociedades & Valores.
Sociedadee Rectoras de las Bolsas de Valores.
The roess to a stock exchange merrbership is recerved to Securities Companies ard agencies. Flom 1993 onwards able toeither buy existing securities companics ard agencies or eetablish rcw ones, ard thus, will have frec rccess b sbclc martelmemberehip. Until 193 a transitbnal perbd is foreeeen during which limitatbns to buy already eetablished ompanies urdagencies re progreseively phascd ouLLa Sociedad de Bolsas.
Sistema de InErconexi6n Burs&il (SE).Servicio & C;ompensaci6n y Lfiuidrci6n de Valorres (SCLV).
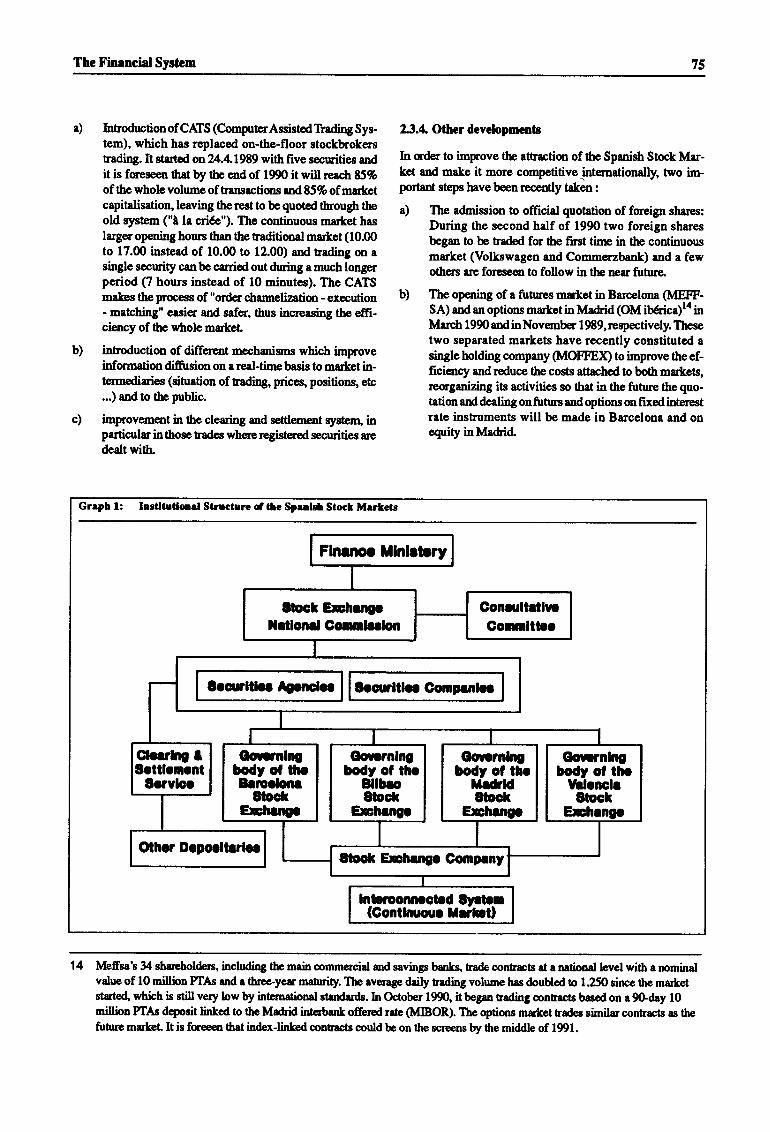
The Financial Systcm 75
a) Intsoduction of CATS (C-omprter Assistod Treding Sys-tem), which has replaced on-the-floor stockb,rokerstrading. It $arted on 24.41989 with frve securities andit is foneseen ttrat by the cnd of 1990 it will reach &i%of the wholevolume of tsansactions and 85% ofmar&etcapitalisation, leaving the rest !o be quotod though tbeold system ("1 la cti6e"). The continuous mertet haslargeropening hours thanthe traditimal martet (10.00to 17.00 instead of 10.00 to 12.00) and trading on asingle seonity canbe canied out druing a much longerperiod (7 hours instead of 10 minute.s). The CATSma&es the process of "orrder chamelization - execution- matching" ersi€r and sefer, thus increasing tbe effr-ciency of the whole marteL
introduction of different mochanisrns which improveinformation difrrsion on areal-timebasis 0o martet in-terrmediuies (sihration of tsading, prices, positions, etc...) andto theprblic.
improvement in the clearing and seltlement syster! inparticular in those tsadcs whereregistered securities uedealt with"
2"3.4 Other developments
In order to improve the attraction of the Spanistr Stock Mar-kel ad make it more competitive_intemationally, two im-portant steps have been recently taken :
a) The admission to offrcial quotation of foreign shares:
During the second half of 1990 two foreign sharesbegan to be trad€d for the first tim in the continuousmarket (Volkswagen and Commerzbank) and a fewothers are fqeseen to follow in the near future.
b) The opudng of a futrres market in Barcelona (IVGFF-SA) and an options mar*et in Madrid (OM ib&ica)I4 inMarch 1990 andinNovernber l989,respectively. Thesetwo separated markets have recently constituted Isingle holding company (MOFFEX) to improve the ef-ficiency rndreduce the costs attached io both martets,reqganizing its activities so that in the future the quo-tation and dealing onfuturs and options m fixed interestrate instruments will be mede in Barceloua and onequity inMa&id.
b)
c)
Grrph l: Irctltualoorl Strrcarrc d Oc Spubl Stocl Mertetr
Srqrltbr Agpncloo Sloultlo Gompenlo
Oonmlngbody ol thoBrroolonr
SbctEdrngr
Oourrnlngbody ol thr
Bllb08bd(
Echugo
€onrnlnebody ol tho
YrlcnclrStoat
F*hrngp
14 Meffsa'e 34 sharehol&rs, including the main commercid and savings banks, tsadc conbacb at a national bvel wi0r a mminalvalue of l0 millbn PIAs and a three-yerr manrity. The average &ily tsading volume has doubted b 1.250 since the marlretstste4 which is still very bw by intematbnal sturdards. In October 1990, it began tsading contsacts baoed on a 9Orday l0millbn PIAs deposit linked to 0re Madrid int€rbsnk offerpd rate (MIBOR). The options martet tsades similar contacts as thefuire markel It is foreeen 0r* index-linked oontsacte could be on the screne by the middle of 191.
76 The Financial Systcm
3. Conclusions
The Spanish banking system had been naditionally a closed
and heavily regulated s,,stem protected from extemal com-petition In the last fifteen yean it has undergore a process ofliberalisation, the result being a banking system with a
higher degree of concentration and a profitability levelroughly similar to European standards. Removal of borriers,with the completion of the European single muke( and the
introduction of new frnrncial products and services atre ex-pected to inq€ase cornpetitive Pressures in the sector (not
only from foreigrr banks but also between domestic financialinstihrtions). This is already taking place, although it willprobably be felt only in a moderate and progressive way insome segm€nts of the banking systqn (i.e. in ttre retailingsector, since the cost of either establishing a new, or buying
an already existing commercial branch network, could prove
so important a deterrent for the enEy of newcomers as a
legally binding limitation).
On the other han4 the Spanish stock exchuge is relativelysmall by comparison with its main European count€rParts
and 0re size of the Spanish economy. Thus its role in chan-
nelling pnvate sectc savings towards pnvate sector invest-
ment projects is a modest one. Aware of the fact that this willput it at a disadvantage in the future single financial marke(the Spani$ urthorities have embarked on an anrbitiousmod-e,nrization programme to make the stock martets mqp efri-cient and capable of coping with the challenge of foreigtcompetition It is expected that this Proce$s of reform willharrrest high rewards in the coming years. Nevertheless, this
does not mean that the Spanish stock martet will necessarily
inmease its weight inErnope to any substantid extenL
The Conduct of Monetary Policy in Spain 77
CHAPTER VITHE CONDUCT OF MONETARY pOLrCy rN SpArN (*)
Contents
1. Monetary targeting in Spain . . .78 2.2. Deficitfunding and the efficiency ofmonetarypolicy . .. . 80
l.l.Targets .....78
1.2. Instruments for monetary control . . . . . 78
2. Difficulties of monetary control . . . . .79 changing environment
2.1. Financial innovation and monetaryaggregates . . .79
2.3. The ERM constraint and capital flows . 81
3. Monetary targets and indicators in a
(*) This chapter was mainly prepared by Manuel SANCtilS I MARC0 of the Monetary Directorate.
7t The Conduct of Monetary Policy in Spain
l. Monetary targeting in Spain
l.l. Targets
The Bank of Spain began in 1971 to establish quantitativetargets for the rate of growth of the money supply, abandon-
ing the system of quantitative cr€dit controls appliod untilthen; the poliry of monetar5r control did not start to be p,n-sued in an effective manner until l!i[.ay 1973.
For several years, the target fr monetary growth has been
fixed in the form of a range of t1.5 to 12 percentage pointsaround the cenhal ratel. Tte target is evaluated at the end ofthe year, on the basis of monthly averages of daily figures.These are normally values observed for December (vari-ations over 12 months); however, when exceptional factorsare involvd the moving average for the last thee months ofthe year is considered
From 1973 to 1983, the intermediate target for nanelarypolicy was a growth rotc for M3 ur t standard definitionz. Inthe early 1980's there was a significant shift of frrnds awayfrom financial instnrments subject to res€rve requirementsand towards instuments which were not zubject to such re-quirements and could consequently offer higher retums. Atthe same time, increased taxation in&rced a shift from finan-cial assets subject to withholding tax towards assets free ofwithholding tax. Finally, a large number of financial innova-tions were also introdrced from 1983 onwards and a series ofnon-monetary but very liquid assets and with high return,representing a substitute for money, developed. In particular,the short-term non-monetar5/ liabilities of the banking sys-tem grew rapidly.
All these factors affected the stability, predictability and con-trollability of lv[}. The Spanish monetary authorities werethus led in 1984 to select, ul a new intermediate quantitativelurget" a broder aggregate, namely ALF q liquid assets inthe hands of the public, although M3 remained a closely-walched monetary indicatod. The new target variable was
selected on the basis of econqnetric evidcrce showing thatits relationship with nominal income was more stable and
therefore mre predictable than that of ltfi) - I prop€rq/ con-firmed b,y more recent ernpirical work The rew target how-ey€tr, has the particularity of being composed of liabilities ofboth the banking system and the Treasury (on particularTreasury Notes and repos and, since 1987, Treasury Bills);this has direct implications for the conduct of monelary pol-icy. Finally, the authorities announced in 1991 0re targetingof ALP and the close monitoring of a wider ALP that in-
cludes comme,rcial paper (credit ceilings - see pages E and 9below - had led to a disinterrnediation process ttrough theissue of comnrercial papers by companies; the lifting of ceil-ings in January l99l is producing reintermediation and aswelling of traditional ALP). The authorities consider moni-toring of an ag8legate even wider than ALP as a transitorystep before adopting a less b,road aggregate like M3, more inline with the curent process of harmonization of monetaryaggr€gates within EEC me,mber States.
1.2. Instruments for monetary control
Since 1973, monetary control has relied upon the existenceof reserve rcquirements applied to a majority of the instru-ments included in M3/ALP. The Bank also influences theevolution of the free reserves of the bu*ing systern by lend-ing and borrowing operations, and open market operations.
Since October 1978, therehasbeno single required reserve
ralro, common to all institutions4 and to all categories ofeligible liabilities. The dehnition of eligible liabilities is veryclose to the definition of M3/ALP. The Treasury Notes and
Bills holdings of the public and the temporal transfer of pub-lic assets (repos) by tlrc banking system to the public are nowthe main instuments not subject to the reserve requirementbut included in the monetary aggxegate ALP. The requiredreserves consist of deposits with the Bank of Spain andnotes.
The reserrre ratio was not changed betwee,n l97E and 1982,but has since been changed several times. The most import-ant changes were made in 1984 and 1990. In 1984, requiredreseryes x,ere increased very substantially and a remunerated
tranche was cr€st€d within thert" This replaced the systern ofspecial deposits previously used. When making this deci-sioru the urthorities took account of the consequerrces of the
reserve requirement on bank profitability and aligned therate of remureration on the money market rate, whereas pre-viously special deposits had beeir remunerated at a distinctlylowerrate.
On March 23, l9DO the Bank of Spains introdrced a majorreform of the reserve requirements system according towhich the coeffrcient was divided into two tsanches: (i) a
non-remunerated miniumum reserve tranche of 5%; nd(ii) a remunerated Eanche (increased tp to L2%) in forceuntil 2 May 1990, and substituted the,reafter by Certificare ofDeposits (CD) issued by the Bank of Spain at r6% interestrate. Tbe banks have to hold these CD's in their portfolio as
1
23
In 1988, however, the centsal point was abandoned.
That is, notes ard coins in the hands of the public plus sight, savings and tenn &posits.ALP is composed of M3 plus a series of liquid financial assets such as deposits linked with insurance operations, promissory
notes, mortgage bonds, endorsements of commercid paper, guaranteed corporate bonds, private md public paper forrepurchase agreements md Central Buk paper (certificates of monetary regulation) as well as Treasury Notes and Treasury
Bills sold to the public.The entire bank sector (including 0re savings banks) i8 subjoct to reserve requirements. They also apply to other finarrcial
institutions, such as credit cooperatives; howev€r, thie docs not corn€ within the frarnewort of monetary contsol but is theresult of the authorities' &termination not to give oomprative advmtages to certain institutions within the financial system.
See circular no Al9X) of Tl February 199O.
The Conductof Monetary Policy in Spain 79
non-negotiable assets but are able to transmit tbem, withincertain limits, betwe€n credit iostitutions. The CD's will beprogressively redeemed every six months starting23 March 1993 and eding Septernber 2000.
The control of money martet conditions has been tadition-ally exated through action on the liquidity of banks and thelevel of the minimum leserve requirements. More recently,however, the morptay strategy has shifted from the contsolof quantities to that of prices and the Iiquid assets of thebanking system has progressively lost its nature of in-strumental variable to be contsolled in ttre short-terrn NoEa-days any overshooting or undershooting of this variable doesnot trigger an authomatic reaction on behalf of the auth-oritie.s.
Since 19EE the monetrqr authorities have aimed at stabiliz-ing the ovemight interburk deposits rate around a fluctuationband previously established by them. To achieve the latterthe Bank of Spain has used two different instsuments:
(i) First, the haditional Iending instmnrents to the bankingsystem, that is, the daily auctions of Monetary Regula-tions Loans (in force from September 1977 until14 May, 1990) substituted since May 1990 (at I timewhen the reserye requirements was redefined urd re-duced) by the ten-day auctions of Certificates of De-posir of fire Bank of Spaiq and
(ii) Second the open-market operations with public assetsof the portfolio of the Bank of Spain, namely under re-purchase agreqnents, for both to inject and to mop upliquidity, that are called to become the main instrumentto regulate the liquidity of the financial interrrediariesin the futune.
2. Difficulties of monetary control
In spite of the imp,rovem€nts in the monetary instrumentsheld by the Banlc of Spain and the almost immediate availa-bility of information of some monetary aggregates (namelyALF), the way in which the Spanish monetary policy hasbeen implenrented in the last years has changed due to bothfinancial and macroeconomic factors. Moreover, tbe mon-etary financing of the deficits and the constraints imposed bythe exchange-rate policy have hindered the efficiency ofmonetary policy and money stock targets have been overshotsince 1987 (cfr. Table 1).
The traditional approach to monetary policy by means of in-direct control of the monetar5r aggregates has been increas-ingly affected by financial innovations and frnarrcial marftctintegration ard by changes in the financial behaviour of tbe
public and the banks. In view of the uncertain ard complexfinancial environment the authorities have had increasingtrecounre to flexibility, discretionality and judgement in im-plementing monetar5r policy. They have progressively aban-doned an approach to monetary contsol based on a two levelquantitative target and on a normative behaviour for the in-terventions of the authorities in the money and exchangema*ets.
2.1. Flnanclal lnnovatlon and monetary agregates
(i) A first elerrrcnt of uncertainty arises from the reducedcapacity of ALP (the b,road monetary aggregate, whichincludes holdings of liquid money-market instsumentsas well as the tsaditional cornponents of M3) to give in-formation about the evolution of nominal income andprices. Since 1987 it has become more difficult to dis-tinguish between two alternative interp,retations of anovershooting in ALP: an undesired evolution of nomi-nal expenditure - ttrat stroul4 therefore, be conected -* shnnges in the relative yields of AI-P and non-ALPassets, which should be accommodated
The development of ALP has been increasingly in-fluenced by changes in financial martets, namely from1987 onwards. Firsl the share of AlPcomposed of veryliquid and profitable non-money assets has increased.Secon4 the distinction between means of settlernentsand assets held for financial investrnent purposes hasbecome bluned as a result of financial innovation anda growing &gree of substitutability among a large num-ber of financial assets.
(ii) Moreover, credit conbols indrced a disinterrnediationprwess in 1989 and 1990 as companies have bee.n is-zuing commercial papers in large quuttities. As arezult,the authorities have been compelled to look closer theevolution of a wider ALP aggregate which, includesthose comnprcial papers, urd to set a tentative target forALP ard commercial paper for 1991.
iii) The stability of the rclation between the intermediatetarget (ALP) and the instrumental variable (bankliquidity) has also weakened Instability of the moneymultiplier has rezulted from the more frequent shifts inthe portfolio of the public in reaction to changes in theyield urd fiscal attributes of certain assets and also fromthe increasing capacity ofbank op€rators to hansformliabilities which are subject to the minimum reserve re-quirernent into thosewhich are excluded from that coef-frcient.
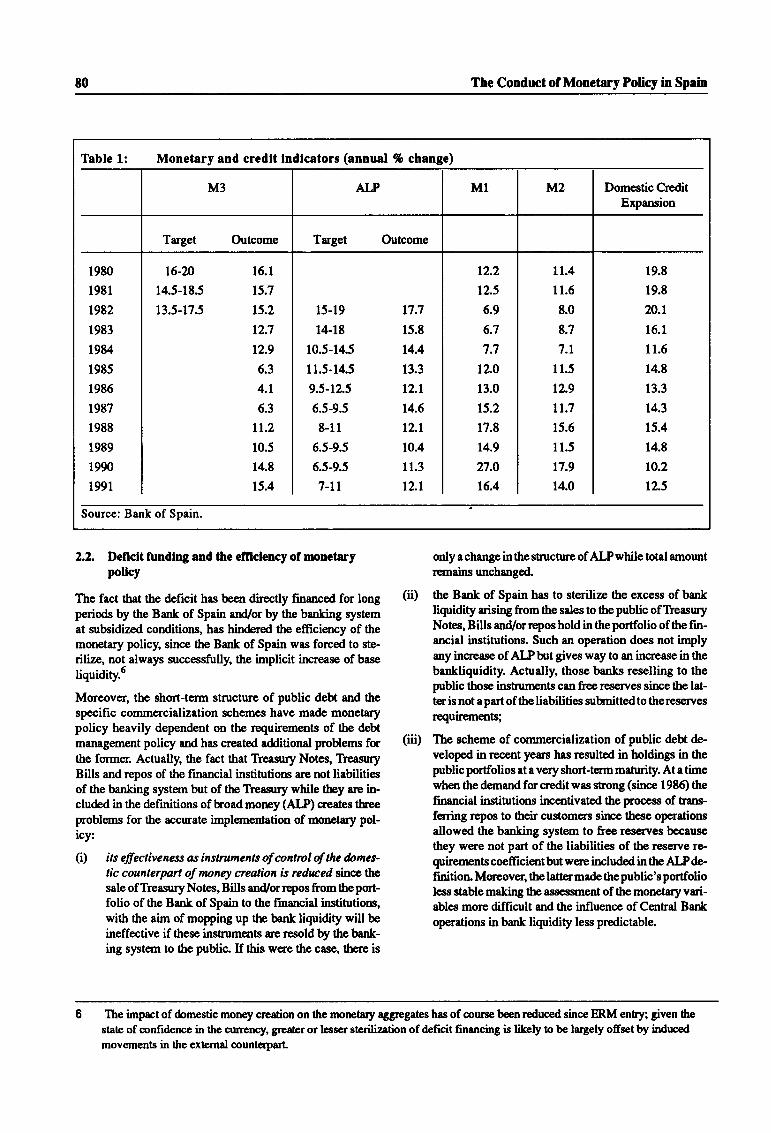
r0 The Conduct of Monetary Policy in Spain
Thble l: Monetary and credlt lndlcators (annual % change)
Source: Bank of Spain.
M3 ALP M1 M2 Domestic CreditExpansion
Target Outcome Target Outcome
1980
1981
t982
1983
1984
1985
19E6
1987
1988
1989
1990
1991
rc-2n 16.1
14.5-185 t5.7
13.5-175 r5.2
t2.7
t2.9
6.3
4.1
6.3
tt.210.5
14.8
15.4
15-19 17.7
14-18 15.8
10.5-145 14.4
11.5-145 13.3
9.5-12.5 t2^1
6.5-9.5 14.6
8-11 tz.t6.5-9.5 10.4
6.5-9.5 11.3
7-tr t2.t
12.2
12.5
6.9
6.7
7.7
t2.o
13.0
15.2
17.8
14.9
n.ot6.4
LL.4
11.6
8.0
8.7
7.1
11.5
t2.9
tt.715.6
11.5
t7.9
14.0
19.8
19.8
20.1
16.1
11.6
14.8
13.3
t4.3
15.4
14.8
t0.2
12.5
2.2. Deflclt fundlng and the efrlclency of rmnetarypollcy
The fact that the deficit has been directly financed for longperids by the Bank of Spain and/or by the buking systemat zubsidized conditions, has hinde,red the efficiency of themonetary policy, since the Bank of Spain was forced to ste-rilize, not always zuccessfully, the implicit irrrease of base
liquidity.5
Moreove,r, the short-temr structure of public debt and thespecific commercialization schemes have made monetarypolicy heavily dependent on the requirements of the de,bt
management policy and has creat€d additional problems forthe former. Actually, the fact that Treasury Notes, TreasuryBills and repos of the financial institutions are not liabilitiesof the banking system but of the Treasury while tbey are in-cluded in the definitions of hoadmoney (ALP) creates theeproblems for the accurate implernentation of monefary pol-icy:
(i) its effectiveness as instruments of contrul of the fumcs-lic counterpart of noaey creation is redrced since thesale of Treasury Notes, Bills and/qrepos from the port-folio of the Bank of Spain to the Frnancial institutions,with the aim of mopping up the bank liquidity will beineffective if these instruments are resold by ttrc bank-ing system to the public. If this were the case, ttrcre is
only a change in the structrne of AlJwhile total amountremains unchanged.
tlp Bank of Spain has to sterilize the excess of banlc
liquidity uising from the sales to thepublic ofTreasuryNotes, Bills and/orrepos hold in the portfolio of the fin-ancial institutions. Such an operation does not implyany increase of ALPbut givqs way to ur increase in thebankliquidity. Actually, those banks reselling to thepublic those instnurents can free reserves sirrce the lat-ter is not apart of the liabilitie.s subinittedto therreserves
requirernents;
The scheme of commercialization of public debt de-
veloped in recent years has resulted in holdings in thepublic portfolios at a very short-terrn maturity. At a timewhen the demand for credit was strong (since 198Q the
financial irutitutions irrcentivated the process of turs-ferring repos to their custom€rs sirrce these operationsallowed 1fus lankilg system to free reseryes becausethey were not part of the liabilities of the reserye re-
Erirernents coefticient but were included in the ALP de-finition Moreover, the latter made the public's portfolioless stablemaking the assessment of themonetaryvari-ables more difficult and the influence of Cenhal Bankoperations in bank liquidity less pedictable.
(ii)
(iii)
6 The imprct of domestic money creation on the monetary aggregates has of oourse been reduced since ERM entsyi gven thestate of confi&rrce in the cunency, grealer or lesser sterilization of defrcit financing is likely to be largely offset by indw€dmovements in the external counterpail
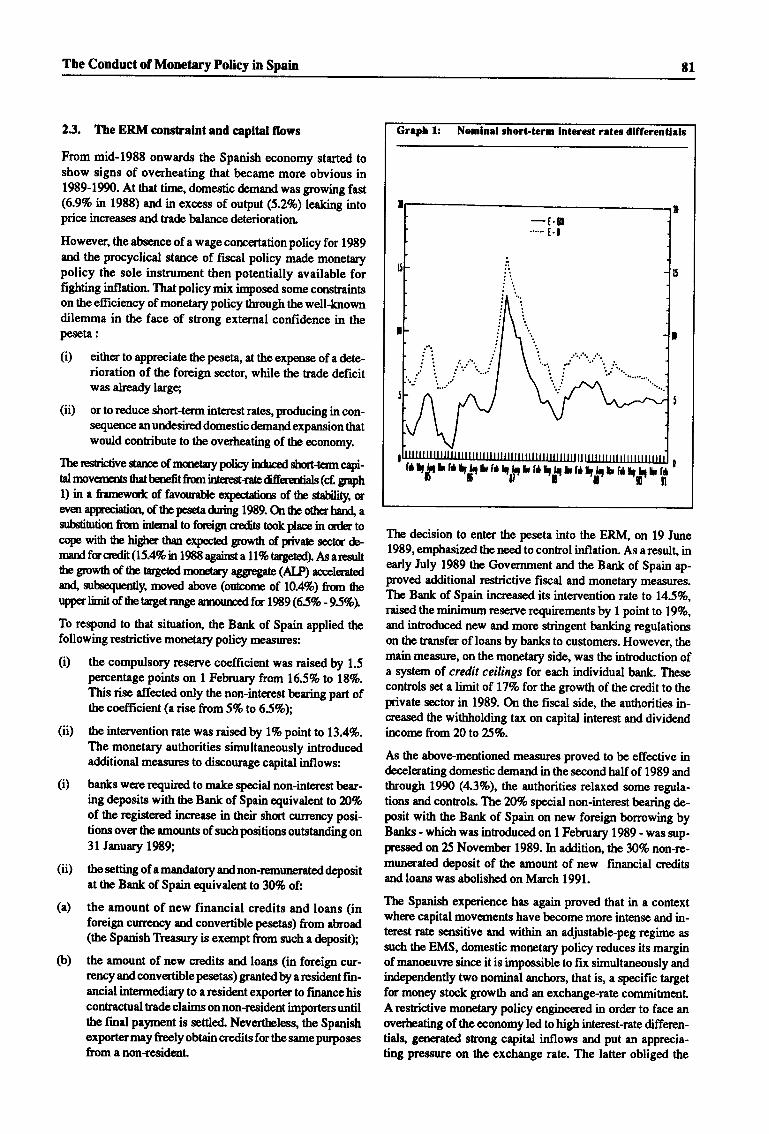
The Conduct of Monetary Policy in Spain 8l
23. The ERM conshalnt and capltal flows
From mid-1988 onwards the Spanish economy started toshow signs of overheating that became motre obvious in1989-1990. At that time, domestic &mand was growing fast(6.99o n 1988) arxf in excess of output (5.2%) leaking intoprice increases and trade balance deterioration
However, the absence of a wagecorrcertationpolicy for 1989and the procyclical stance of fiscal poliry made monetarypolicy the sole instnrment then potentially available forfighting inflation. That policy mix imposed some conshaintson the efficiency of monetary policy through the well-knowndilemma in the face of shong external confidence in thepeseta:
(i) eitherto appreciatethepeseta, attheexpense ofadete-rioration of the foreign sector, while the trade deficitwas already largg
(ii) or to rpduce short-terrn interest rates, producing in con-sequence an undesired domestic demand expansion thatwould contribute to the overheating of tbe economy.
The rcstictive starpe of rnmetry poliry indnd sbort-term capi-tal movenrrfs tnt benefi t frorn interestrafe ditrerentials (cf gtaph1) in a tanrwck of favorraHe expectaliqs of the $ability, aw€n apprreciatiorL of ttrc pesda dning 1989. On tlE oth€r 1un4 asnbstitutim ftom intemal to foreigr crodits tookplae in urder tocope witr tre high€r than opected grolvth of 1rivate sectr dernardfacredit (15.4%m 1988 against a 11% trgetod). As aresrlt6egrowth of ttre tagetodmorEtry eggregate (AtP) deratedand, sr@wntly, moved above (outconrc of 10.4%) from fteryperlimit of lhe tagetrange amourrced ta l%9 (65Vo -95%\
To respond to that situation, the Burk of Spain applied thefollowing restrictive monetary policy measures:
(i) the compulsory reserve coeffrcient was raised by 1.5pencentage points on 1 Feb,nrary ftom L6.5% to lB%.This rise affected only the non-intenest beuing part ofthe coefficient (arise from S%to 6.57o);
(iD the intervention rate was raised by l% pontto 13.4%.The monetary authorities simultaneously introducedadditional measunBs to discouage capital inflows:
(i) banks were required to make special non-interest bear-ing deposits with the Bank of Spain oquivaleiltoZi%of the registered increase in ttreir strort cunency posi-tions over the amurnts of suchpositions outstanding on31 January 1989;
(iD thesetting of amrndatory ardnon-renrunerateddepositat the Bank of Spain equivalent to30% of:
(a) the amount of new financial credits and loans (inforeigr curency and convertible pesetas) from ab,road(ttrc Spanish Treasury is exempt from such a deposit);
O) the amount of new credits and loans (in foreigp cur-renry and convertible pesetas) granted by a resident fin-ancial interrrediary to a rcsident exporter to finance hiscontractual trade claims on non-lesident importers untilthe final Pa,,ment is se$led" Nwertheless, the Spanistrexportermay freely obtain credits for the same purposesfrom anon-residenl
The decision to enter the peseta into the ERM, on 19 hme1989, emphasized the ne€d to conhol inflation. As aresult, ineady July 1989 the Govemment and the Bank of Spain ap-poved additional restrictive fiscal and monetary mea$ues.The Bank of Spain increased its intervention rate to 14.5%,raised the minimum reserve requirements by I potntto lgEo,and introduced new and more shingent banking regulationson the transfer of loans by burks to customers. However, themain measure, on the monetary side, was the inhoduction ofa systern of credit ceilings for each individual bank Theseconhols set a limit of l7?o for the growth of the credit to thepnvate sector in 1989. orl the fiscal side, the authorities in-creased the withholding tax on capital interest and dividendirrcome from 20 to25%.
As the above-mentioned measures proved to be effective indecelerating domestic dernand in the second half of 1989 andthrough Dn (4.3%), the authorities relaxed some regula-tions and controls. The2O4o special non-interest bearing de-posit with the Bank of Spain on new foreign borrowing byBanks - which was introduced on 1 Feb,ruary 1989 - was zup-pressed on 25 November 1989. h addition, the30% non-re-munerated deposit of the amount of new financial creditsand loans was abolished on March 1991.
The Spanish experience has again proved that in a contextwhene capital movernents have become more intense and in-t€nest rate sensitive arrt within an adjustable-peg regime as
zuch the EMS, domestic morrctary policy reduces its marginof manoeunre since it is impossible to fix simultaneously andindependently two nominal anchors, that is, a specific targetfor money stock growth and an exchange-rate commitmenlArestrictive monetary policy engineered in order to face anoverfieating of the economy led to high interest-rate differen-tials, generated strong capital inflows and put an apprecia-ting pressure on the exchange rate. The latter obliged the
Greph 1: short.tcrm lnterest retes dlfferentlrlc
rrfffiffir.*SilHr
-t.E..-. t- I
n
:'.il ":;l\ i
JY
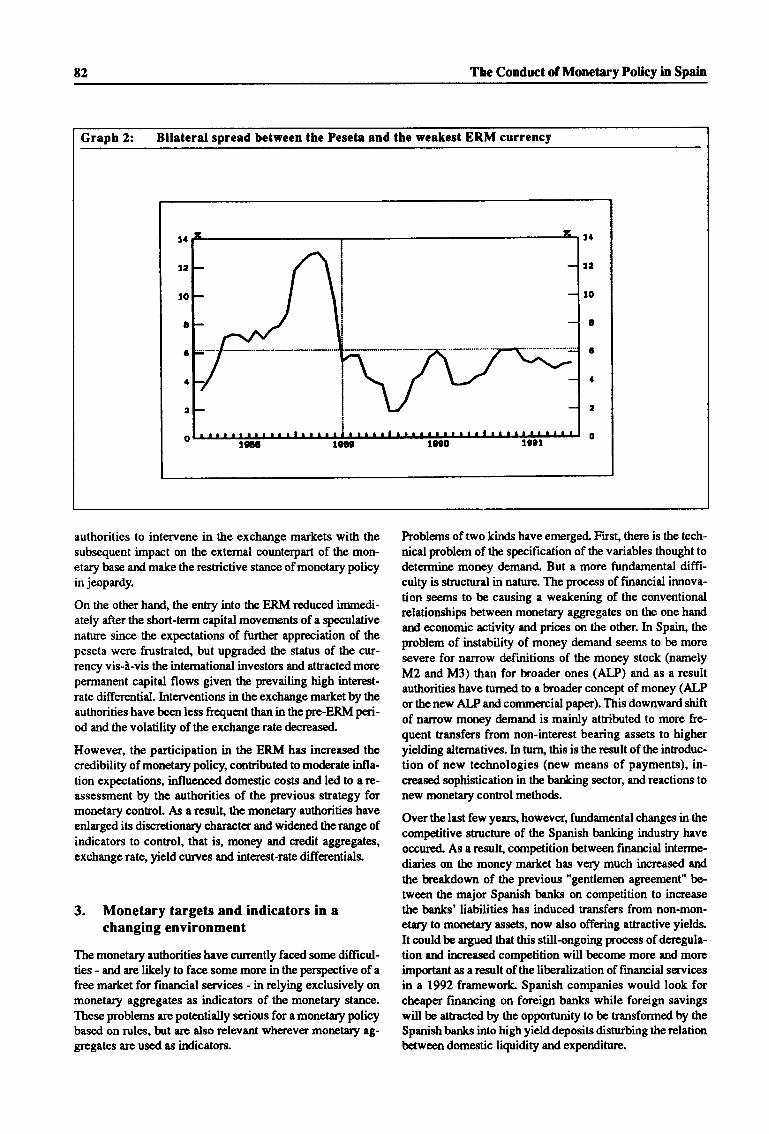
82 The Conduct of Monetary Policy in Spain
Graph 2: Bllateral spread between the Peseta and the weakest ERM currency
,1
72
,o
t
a
a
2
o
,{
12
t0
I
a
a
a
0
authorities to inte.rvene in the exchange markets with thesubsequent impact on the extemal counterpart of the mon-etary base and make the restrictive stance of monetary policyin jeopardy.
On the otlrer han( the entry into the ERM rpduced imnedi-ately after the short-term capital movements of a speculativenahrre since the expectations of further appreciation of thepeseta were frustrate4 but upgraded the status of the cur-rency vis-l-vis the intemational investors and athactedmorepermanent capital flows given the prevailing high interest-rate differential. Interventions in the exchange market by the
authorities have been less frequent than in tlre pre-ERM poi-od and the volatility of the exchange rate decreased"
However, the participation in the ERM has increased thecredibility of monetary policy, conribtrted to moderate infla-tion expectations, influenced domestic costs and led to a re-assessment by the authorities of the previous strategy formonetary control. As a result, the monetary authorities haveenlarged its discretionary character and widened therange ofindicators to control, that is, money and credit aggregates,
exchange rate, yield curves urd interest-rate differentials.
3. Monetary targets and indicators in achanging environment
The monetary authorities have currently faced some difficul-ties - and are likely to face some more in the perspective of afree market for financial serrrices - in relying exclusively onmonetary aggregates as indicators of the monetary stance.
These problems are potentidly serious for a monetary policybased on rules, but are also relevant wherever monetary ag-gregates are used as irdicators.
Problems of two kinds have emerged. First, there is the tech-nical problem of the specification of the variables thought todetermine money demand. But a more fundamental diffi-culty is stnrctural in nature. The process of financial innova-tion seems to be causing a weakening of the conventionalrelationships between monetary aggregates on the one handand economic activity and prices on the other. In Spain, the
problem of instability of money demand seems to be moresevere for narrow definitions of the money stock (namely
M2 and M3) than for bnoader ones (AI-P) and as a resultauthorities have tumed to a broader concept of money (ALPor the new ALP and commercial paper). This downward shiftof narrow money demand is mainly attributed to more fre-quent transfers from non-interest bearing assets to higheryielding dtematives. In tur.lr' this is the result of the inhoduc-tion of new technologies (new means of payments), in-oeased sophistication in the banking sector, and reactions tonew monetary control methods.
Over the last few years, however, fundamental changes in the
competitive structure of the Spanish banking industry have
occured. As a result competition between finarpial interme-diaries on the money market has very much increased and
the breakdown of the previous "gentlemen agreement" be-tween the major Spanish banks on competition to inoeasethe banks' liabilities has induced transfers from non-mon-etary to monetary assets, now also offering attractive yieldsIt couldbe argued that this still-ongoing process ofderegula-tion and hcreased competition will become more and moreimportant as a result of the liberalization of finarrcial servicesn a 1992 framework Spanistr companies would look forcheaper financing on foreign. banks while foreign savingswill be attracted by the opportunity to be hansformed by theSpanish bar*s into high yield deposits disturbing the relationbetween domestic liquidity and expenditure.
The Conduct of Monctary policy in Spain t3
Hgwever, drning Stage one of EMU, a new rank of prioritieswithin the current range of monetary indicato,rs and the tar_Sets might prove to be recessary. Even if the approach stillreinains flexible, pnori$ miSht be given to the estaHishingof the exchange rate as tbe intennediate vadable of mmetarypolicy. As a resul! tbe urthorities should be ready to allowfor tempo,rary overshooting of the monetry aggregate if aconflict betweeir domestic needs (ALpconbol) and externalrequirement (external rrte stability) emerges. ALp shouldplay a minm role compared with the past since the assess-ment of the monetary policy will have to be bssed in a wide
ruge of monetar5r indicatms (other money or credit aggre-gates, interest rates, yield curve movemenls) and real (com_modity priceq exchange rate behaviour).
In qdcr to pave tbe way fm a sccessful narrowing of thebsnds and to avoid prcssur€ fq a downward realignnrent ofthe peseta before the inception of Stage two, tbe reduction inint€rnal imbalances should continue by nrans of enhancedzupply-side mea!rutres, increased competition and by a me-dium-term frnarcial strategy aiming et budgetary consolida-tion.
t4 Regional Dlsequilibria
CHAPTER YIIREGIONAL DISEQUILIBRIA: UNBALANCED REGIONAL GROWTH'
ASYMMETRIES AND CONSEQUENCES (*)
1. Introduction .......85
2. Income disparities and growth in the
Spanishregions . ... .85
2.1. The Mediterranean region . . . .85
2.2. The declining industrial regions . . . . .86
2.3.Thebackwardregions . . . . . . .86
2.4. Otherregions . . . . . .86
3. Investmenttrends ....86
4. Labourmarket ......87
5. Regionalpolicies ....88
5.1. Motivation
5.2. National instruments . . .
5.3. Regional development strategy and
Community support
5.3.1. The regional Plans
5.3.2. The Community structural funds
5.3.3. The objective I CSF
6. Conclusions ....90
88
88
89
89
89
8q
(-)ftheEconomicEvaluationofCommunityPoliciesDirectorate.
Regional Disequilibria 85
1. Introduction
Wittr a population of 38.8 million and a teritory of 504,8(X)I(m2, Spain is among the EC's largest Member States, andSows a considerable degree of differentiation and qpecializ-ation among its regions.
The most common level of regional analysis in Ore EC is thatof NUTS II regions, which in Spain correspond to the 17
"Comunidades Aut6nomas" (see Figue l) plus the cities ofCeuta and Melilla. The Comunidades Aut6nomas play animportant role in the design and implementation of domesticand EC shuctural policies and statistical infomration is in-creasr4gly presented at that level. The definition of the Co-munidades Aut6nomas, during the regionalization process ofthe last decade, did not in general follow homogeneity orother economic criteria which should ideally be used in thedefinition of planning regions of a counEy. They are morethe outconp ofpolitical agreqnents and cultural and histori-cal links between theregions. Hencg while theregion of An-dalucia consists of 8 provinces with 98,616 squarekilomeres and a population of 7.9 million, Curtabria is onlyone povince with 5,03IGn2 and 0.3 million population
With that proviso in minda fint picture can be drawn bylooking at the dis&ibution of GDP per head among NUTS trregions of Spain, as in Table 1. The following main charac-teristics eme{ge:
. The distribution of GDP per head is less asymmetric inSpain than in other EC Memb€r States, as inticated by theuzual measures of dispersion. However, gven the overalllowerlevel of dwelopment Spain contains a largernumberof 'problenr'regions from Ore EC point of view.
. A clear rcgional dualisur is not presenl with ttre borderlinebetween the prosperous and the less developed regions notbeing as well defined as, for example, in Italy. There is,however, a general North-East / South-West gradienL
. The spatial stucture of the Spanistr economy does not Sowa clear unipolar or cenhre-to-periphery pattem as, for exam-ple, in France. Instea4 there are at least three 'poles' - Ma-dri4 Catalufla and the Pais Vasco @asque Country), whilethe geographic cenhe contains some of the countsy's poo-rest areas.
2. Income disparities and economic growthin the Spanish regions
As happened in most EC meurbers, the high growth period ofthe Spanish cconomy before 1973 was characterizrAby tconvergence of income levels between its regions. At thesarc tire, the catching-up process with respect to the rest ofEurope showed &n even mme marked advance; meazured in
terms of GDP per head in purchasing power standards, Spainas a whole progressed fuom 59Vo of EuR 12 in 1960 to 809oin 1975 (see Table l).
The years between 1973 and 1985 were a generally de-pressed period for the Spanish economy, with an averagegrowthrate of 2.39o. The manufacturing and building sectorshad a particularly bad performance. The crisis had a very un-equal inciderrce over the various regions of the country, dreto the diversity of their economic structures at the outsel Theindustrial North and North-East were particularly hit
In the recent upswing in economic activity from 1985 on-wards, a convergent hend inregional output levels, similar towhat happened in the 1960s, is so far not discemible. This isthe same trend observed in other EC regionsl, and it cannotbe said with certainty that growth has been generallystronger in the more backward regions or in the prosperousones. On the other hand, the regional disparities of the levelsof disposable incomes of households have h:en significantlyreduced since 1975, and are still decreasing2.
All the above-mentioned developments had important impli-cations, still to be fully realized, for the regional outlook andthe spatial distribution of economic activities in the country,which are now examined inmore detail.
Ll. The Medlterranean reglons
The main axis of growth which has emerged in recent yearsis the coastal stsip between Gerona arrC Murcia an4 to someextent, its p,rolongations towards Almeria and Malaga, andalong the Eb,ro valley. The economy of these regions wasmainly booste4 in recent years, by the growth of the mass
tourism industry, which had a strong multipli€r effect on therest of the economy; this multiplier effect was favoured bytbe hish degree of integration, or interdependence, betweenthe economic activities of the Medite.rranean axis. The exist-ence of a good communications infrastruchne (motorway)dso plays a role here. The location pattern alongside this axis(especially in tte Catalufla, Valerrcia and Murcia regions) isalso a rather balanced one, with a multipolar structure oflarge and int€rrnediate urban centres, favouring the creationof new economic activities without excessive pressure on theffiastucture and environnrental p,roblems.
Productive activities in the Mediterranean regions are moreexport-oriented than in the average of Spurish regions. Thatapplies not only to touism but also to its indrstrial sectorswith a consi&rable endogenous growth potential, ard the in-tensive and efficient segments of the agricultural sector.Therefore, this region is poised to benefit most from theopening of the Spanish economy and European integration.This seerns to be conftrmed by its recent performance, al-though the diffrcultie.s in the tourism sector may well haverrgative repe, cussions in some areas.
See e.g. EC Commission (1991) The rc8ions in the I QQOs: fourth lreriodic report on the social and economic situation and lhedevelopment of the reions of the Community
See for instarrce Quintana et al. (1991) "El daarrollo econ6mico espafiol y la Espaffa desigual de las autonomias", Papeles de
Economia Espafiol a, 45 :2-6t.
t6 Regionel Disequilibrh
2.2. The decllnlng lndustrld reglons
The stagnation years were particularly felt in the traditionalnorthem in&rstrial regions, which experienced an even molEsluggish growth than the rest of the economy Qess than 1%per year in tlre Basque CorurEy, about 1% in Astruias). Tbeseregions we,re heavily specialized in some basic industsialsectors like steel, coal, chernicals etc. Such patterns of spe-cializationreinainedunchanged fr a long time, and theirim-print on the economic structure of these regions(infrastructure, *ills, services) limits theircapacity to adsptlto thercquircments of modern activities.
As a result, there were strong emplolmnt losses until 1985,and in some cas€s an absolute decrease of orpul The lowinvestment rates and lack of creation of new ervrFloymentdenote the failure of these regions to cornpensate fm tbe de-cline of the traditional industrial s€ctors by the creation oftertiary or otber activities More rcce,ntly, there are signs oflecov€ry in some of these regions (e.g. Cantabria) but it istoo early to assess its long-t€rm significance.
23. The brkward reglons
Tbe taditimally lagging rcgrms (Casti[a-la-Mar]a, CaSilla-Le6n, Exterradra, eralcia ad Andahria) experkaped shrggiSgowthunlil 1985 in lirc wih bercst of 6e cortry md srfr€ro4inmdcasesr largearploynmtlm. Inthefqnyeusryto 1989
fuirgocft ratq 6oughoqsiderabb(above4%peryer) was Sillbelow tlp nalimal averagg whichcasb s@ do$S m ttrir pnoe-
pS of cahfrfutg rp m lhe nne devel@ rqim.In gffial, tbbadrwadrqim exhitit alowpoprlalimdensity(exoqpt fa Galicia), poor curmunicalim and o6er infrastrmlrqand arelaively stmg dcpqdre mlowgodrdivity agrknttrEHowever, within tds gtup of nryiqs, tse is cmsideralCe d[v€r-sity of irconr levels anddynmic perfcmare, mt always disEniHe at 6e NUIS tr kvel. Smr pr,wim within ealicia (IrCatfis), Casilla{,e6n (Valladoli4 Brqgc) and Adalwia (Sevil-
la) ae ideod in a better po.dtim lban hercst
2.4. Other reglons
Madrid constitutes a relatively small region, served by agood infrastnrcture and benefiting from its position as hometo the central governmenL Its irdustry rnd service sectorsunderwent an extensive restnrcturing process in the yers upto 1985, and it has since resumed a high growth rate whichallows it to remain near the top of the regional incomeleagua
The Baleares and Cansry tslands have both a large weight ofthe se,rrices sector (mainly related to tourism) and haveshown the highest growth rates in the 1985-1988 p€riod" In1989, howwer, they were strongly hit by tlre contraction ofthe tourist markel
3. Investment trends
The p,revious analysis in terms of GDP growth can be use-frrlly complemented by some more forward-looking irdica-tors of investrrent activities in the different regions. A hiShinvestmentratg though not suffrcient to ensure economic de-velopment is the main motor of regional growth and reflectsthe potential competitiveress of rcgions and their capacity toattsact new economic activities. Unfortunately, the,re are nocomplete data on gross fixed capital fomration by regiorqonly partial information concerning manufacnuing, foreiparrt public investnenl
Table 2 shows aregional b,neakdown of investnent in manu-facturing, eitlrer in new plants or expansion ofexisting oneslThis bneakdown is then compared with the regional shues ofindustrial value added The regions which stand orlt as par-ticularly dynamic in terms of manufacturing investnent ale:
. The Rioja, Navarra, Cataluf,a and Valencia regions, whichbelong to the already mentioned Ebro-Mediterraneanstrong growth axis.
. Tbe "re-conve,rsion" regions of Cantabria and Pais Vasco.This confirrns the beginning of recovery of these regions,checking what could otherwise be a widening of diver-gerrc6.
. The "backwrd" rcgions of Galicia and Andalucia, espe-cially in terms of new investnenl This is a positive deve-lopment as far as regiond convergence is concerned
On the negative side, the,re seems to be no surge of inve$-ment in the declining industsial region of Asturias, nor in thebackward Castillas and Extnemadura" This observation iscorrobcated by the fact that the pattcrn of Mustsial special-ization in the lagging rcgions (with a few exceptions) isdominated by sectors of medium and low demand growth.
Foreigll dhect invesEpnt in Spain has boomed since 19M,especially after the liberalization introduced in 1985. Arather unbalanced picture enrerges from the regional dis-tribution of that inveshrent (columns 1 anC 5 of Table 3).Cataluia, and to a lesser extent Arag6n, La Rioja ard Ma&idabsut very large slrares, while the lagging regions performrather badly. In general, the eastem rcgions (closer to Eu-rope) seem to have been favourod by foreign investors. Thefigures presented do not include foreigners' acquisition ofreal estatg which is strongly concentrated in the coast of fui-dalucia and other Mediterranesn regions. Its value is about50% of that of foreigr direct investment but, unlike the latter,it does not lead to an insnease inregional growth except per-haps through a dernand multiplier effecL
Public investnent, on the other hand (columns 2 td 6 ofTable 3) has a strong "equalizing" bias which attempts tocompensate the regions for their lack of competitiveness and
3 Ministerio & Economia y Hrcienda (190) El Crecimienio Re8ional Fspainol ante le Int Or"iott F*o** Chapter YII
Regionat Discquilibrh t7
economic capacity. The regions affected by indushial de-cline and the backward regions are rclatively favoured; thisis theresult of two factrs:
. Some 30% of public inveshent is allocated through theFundo de Compensacion Interterritorial @CI). The nrles ofallocation for the FCI rre based on the ircome per hea4 mi-gration flows, une,mplolment and surface area of eachrc-gion
. The EC stmctural fimds (columns 3 and ? of Table 3) rep-resent a significant part ofpublic investnent and develop-ment expenditure in Spain. Their allocation criteria(namely objectives 1, 2 and 5b) have a dominant regionalcomponenl
4. Labour market
The situation of global imbalance in the Spanish labourmar-ket can be surnrnarizcd by the national unernplo5nnent rate ofL6.L% n 1990 and by the fact tha! of the 17 regions, all butone have a level of unerrplolment well above the EC aver-age (see Table 4). This overall high level ofunernployurenfcan be athibuted to structural rigidities in the labour martefand its distribution among the regions is very unev€n, rang-ngfuom7.3% in Rioja !o 25.4% in Andalucia It is in generalthe lagging regrons which experience the highest urcmploy-mentrates: the averagerate for objective I regions (see sec-tion 5.3.2) is 18.7 % and for other rcgions 13.3%.
These figrnes zuggest that tbere are stuctural features of thelagging regions which further impair their adjushent toSocks afrecting the whole economy and which are a causefor corcem about the possibility of achieving a reduction inregional disprities Indee4 high regional unanployment isassociated with both the level and growth of regional GDp,through its negative effects upon local &murd and invest-menL
Regional unemploynent could be checked basically ttnoughthe reduction of labour costs or labow mobility. High unern-ployment rates should bring about a moderation in realwages in theregiur" That would enoourage the expansion ofemployment both though the attraction of new investnentand tbrough a change in the processes of local industry in fa-vour of a greater use of the available labour. Migration ofworters towards high-activity regions would contribute toreducing unemployment. At the same time, their incometransfers back to the regions of origin stimulate demandtbere.
Reduction of relative labour costs has been hindered by anumber of rigidities which affect the labour market in thecounty as a whole. Their impact upon the problemregions ismade worse by a rystem of national bargaining which wasreinfqced *tq 1977, resulting in a lower dispersion of rc-gional wages in recent years, as confirmed by empiricalstudies. It is also known that in lagging regions there is ashong tendency toresqt to informal wort, given thebarriersthat exist in the formal and permanent sectors and rural hadi-tions of family work and family support - favoure4 morp-ov€r, by better social benefits and early retirement sche,lnesBarriers to formal emploSrment have a particularly seriousimpact on the registered uremplo5rment rates among youngpeople, which reach over 40% in some regions. IndusEial de-clining regions such as Asturias, Cantabria and the paisVasco srffer from relatively high youttr ruremplo5rrent retesClable4).
The other mechanisrr which should respond to localized un-enployment and promote regional convergence is labour mi-gratioo Many Spanish regions, with high birttr rates, have inthe past supplied large numbers of worters bottr abroad andto other regions. These flows have however been on a declin-ing uend since around 1960. The decline was s&ongest in the1970s, mostly due to high unemployment in the receivingcountries and regions, which dissouraged potential emi-grants. At the begiDning of the 1 980s, the pace of adjusrnentand industrial re-conversion meant that a number of olderworkers lost their jobs, with little incentive to migrate tomor€ prosp€rous regions, where employment prospects werenot much better anyway. Furthermore, rigidities in the hous-ing market in Spain, especially in urban aneas, pose fulherobstacles to the mobility of workers. Migration flows havesince remained mod€rate, as Table 5 suggests and in linewith what has been obs€rved in other EC countries6 ud arenot expected to rcsume the prominent role they had in pastdecades. The continuing demographic Fpssur€ in some ofthe lagging regions (though not in all, as Table 5 also shows)and the still very low activity rates in European teiurs, thusimply tlnt jobc will have to be created in ttrose regions at afaster pace Oran in the resL
The failure of regional unerrployment to induce either an ad-justnent in local wages and labour demand, or equilibnatingout-migration flows is largely explained, mor€ov€r, by mis-match of skills of the labour force. Tbese reflect l) differentsectoral and professional sEuctures in low-activity and hiSh-activity regions and 2) the failure of the local education andEaining rystern to provide the types of labour required by ex-panding sectors.
56
The figures refer to fixed investment by 0re general government sector plus capital tsansfers to enterprises. To relate them toGDP drares (column 6) is rrct aperfect way of expressing the relation between the "supply and demand" of infrastructure.Infrastruc[ue needs of the regions depend on many factors, like for instance surfrce area and population.See Chapter 1 to this s[rdy.See EC Commission op. cit, page 29.
8t Regional Disequilibria
The fust aspect is illustratedby Table 5, whene it canbe seen
that agriculture still repnesents a large part of enrplolment inmost lagging regions. On the other han4 the service sectcand administrative and liberal professions are under-rep,re-
sented. Since it is known that the majority of the unernployed
in those regions come from agriculture, constnrction, or have
never worke4 the key to solving regional unemployment
seems to lie in an improvernent of *ills of the local labour
force.
A study canied out for the EC Commissio/ shows that the
participation rates of tbe corresponding age groups in educa-
tion or vocational training is much lower in lagging regions,
and estimated the number of additional aaining places rc-quired (Iable 7). These figures show a wi& variation in the
degree ofpreparedness oflocal training and e&rcation struc-
tures, especially in the case of objective I regions. In those
regions, a considerable effort is required to reach parity withthe national average, and even more if a target of two years
training were agreed.
5. Regional policies
5.1. Motlvatlon
ln recent yearq regional problems and policies have came
back high on the policy agenda of Spain, due to the consoli-
dation of the decentralization Process' tlre importarrce of the
Comunidadss Autonomas, EC membership and the rpformof the Community Structural Funds. Also, tbe rccent favour-
able economic environrnent and the persistence, in spite of ilof important regional disparities provide both more head-
room and motivation for these issues to be tackled" These
disparities are seerL not only as unacceptable from the politi-cal point of view, but a proble,rr that must be answered if the
present economic lccov€ry is to be zustained in a balanced
and durable way.
Puuing aside, for the present purpose, the questions of equity
and political cohesion between tbe regions of a country, the
link betrreen spatial agnnrretries and global economic per-
formance, as a guide forregional policy is not simple. Clear-
ly, space is not homogeneous and one cannot aim at a
uniform distribution of economic activities. There are, how-ever, some strictly economic argumeuts which plead in fa-vour of active regional policies to Promote a more evenly
distributed growth among the regions:
. The external effects of location decisions. Ofteq the bene-
fits of conglomeration are internalized by frms while itscosts are noL
. Regional unemployment. Without laboru mobility, effr-cient use of resources will also call for investment and
growth to be channelled to the regions where there is (hi-
ghest) unemployrenL
. The growth ugumenl Even with high overall growttt' ttrccontinuous restmcturing of the economy's sectot! (which
has inpractice aregional dimension) calls forpolicies to fa-cilitate adjustrrenl The existence of &pressed or backward
regions also represents a fiscd brnden, and limits the po-
tential marka of fte growing regions.
. The stabilizrtion rgtunenL This is based upon obeerved ri-gidities in the laboru markel The tendency for the unifor-mization of wages would bring demand-pull inflation inconcentration areas, and cost-push inflation in depressed
areas.
5.2. Natlonallnstruments
The modem instnrmenrc of regional policy in Spain origin-ated in the principles of local finance set by the 1977 Cm-stitution (establishing ttre FCI) and in the severe adjustment
problems faced by sonrc regions in the early 1980s (ttrc so-
called Zonas de Urgente Reindustrializacion). The ProsPectof EC membership brought the need to review and ration-alize theregional aid system inherited from the 1960s, lead-
ing to the 1985 I-ey de Incentivos Regionales.
Atpesent themain instruments of regional policy atnationallevel are:
. The 3- or 5-year Plans which are now elaborated in accord-
ance with the scope and objectives of the EC structural
funds. They follow a first generation of plans issued in1985, and encompass all the instruments, with domestic
and Community lesourtes, under medium-tersr sectoral or
regional stsategies. The most imPortant are the 1988-1993
Regional Developme,lrt Plan (corresponding to objective 1
of the Stmcnral Funds) and the Social and Regiond Re-
conversion Plan (objective 2).
. The investmentplan of thepublic sector, especially theFCI'which has just been reforrnedu. The new rules specify thet
ttre FCI applies now only to objective 1 Qagging) regions'
and the correspording investments are to be exclusively di-rected to regional developmenL Table 8 shows the shares
of the regions in FCI outlays, the total of which (around
30% of public investnent) is henceforth related to indica-
tors of the relative situation of these regiorx. In conrpctionwith the introduction in Spain of theEC structural frmds and
their zubsequent reinforcenrenL public investrnent has ac-
celerated shongly after 1985, from 3.0% of GDP in 1984
to an estimated 5.2%tnl9Y2.
. The regional incentives systenL This is far more selective
and geographically concentrated than the previous (up to
1985) regime. Government regional aids to private mves-
tment in 1990 amounted to 7 I 3 MECU, or about 25% of the
total investment in the 1575 projects supported. Thisamount does not include the expenditure of theregional go-
v€rnrnents or the EC.
R. Derenbach (190) "Human capital and related ffiashrcture endownrnents: investnent required in problem regions"' s0ldy
for the EC Commission.
Law n 29 I L99O of 26.12.1990.
Regional Disequitibria t9
5.3. Regional development strategy andEC support
53.1. The reglonal plans
The 1989-1993 Regional Development Plan was elaboratedin arelatively short timg in orderto comply with therequire-ments of the reform of the EC stuctural furds. It is neverthe-less zupportedby a substantial preparatory wck, arrlreflectsa national consensus, both technical and political, on thep,riorities and strategies of development for the lagging re-gions.
The plan explicitly sets the final objective that the GDp gapbetween ttre richer and poorer regions be progressively re-duced, and the two s&ategic priorites of boosting local em-ployrrent and improving the infrastructure erdowment of theIegging regions. Four types ofregions are distinguished ofwhich two are relevant fm the objectives of the Plan :
. The lagging regions of the Centse-West, North-West andSouth. Forthe firsttwq thedevelopment of theborderwithPortugal (Galicia, Castilla-I-eon, Exhemadura) is a priority,as well as the development of the small and medium urbnnc€ntnes and the articulation of the Douro ard Ebro valleys(CastillaJa-Mancha). As for the South (Murcia and Arrta-lusia) the main opportunity lies in the connexion with thedeveloped Mediteiranean axis, the development ardratio-nalisation of agriculture ard tourisrq and the creation of afew indrstrial poles
. The regions of intermediate level of development : Canta-bria and Valencia The fust needs to improve its transportlinks (namely towards France), while the second seeks abetterbalancebetweenits coastal and inland areas. Fqbothregions, support to prodrctive investsnent in in&rstry andserrrices is stresse4 as well as environmental conshaints.
Another group ofregions are those undergoing a process ofindustrial re-conversion (Basque Country and Asturias).These arc the marq though not exclusive, object of anotherPlan : the Regional and Social Re-conversion Plan. Thepriorities here are somewhat different from the previous :private investment in new activities, or modernization ofexisting ones, conrs fust with an emphasis on srnall and np-dium enterprise. Vocational training and other manpowermeasures also figure prominently.
The final group of regions are those with an autonomousgrowth capacity (Ma&i4 Rioja, Navarra" Aragort Catalufiaand Baleares). Structural problems in these regions are,naturally, much more limited ard localized.
53.2. The Communltystructural funds ln Spaln
After the 1988 reform of the EC stuctural funds Spain be-came the largest beneficiary of Community suppor! havingbeen allocated in 1990 a total of 2,826 million ECU. Most ofthe Spanish territory, a}nvt&z% of tbe populatioq fall wift-in the scope of me of the objectives of the Sbuctural Fundswith a regional scope, as follows :
. Objective 1 (agging legions) : the regions of Andaluci4Asturias, Castilla-Le6,n" Castilla-la-Mancha, Ceuta y Me-lilla, Comunidad Valenciana, Exhemadura, Galicia, Cana-
rias and Murcia, correspording to 57.8% of the county'spopulation"
. Objective 2 (industrial decline) : most of Pais Vasco andCantab,ria and parts of Arag6n, Catalufr4 Madrid, Navaraand La Rioja, amounting to 2L.8% of the population.
. Objective 5b (rural areas) : parts of Arag6n, Baleares, Can-tabria, Catalufi& Madrid, Navarra, La Rioja and Pais Vasco,ot 2.5% of the national population.
Table 9 sumnarizes, by Furd and Objective, the ECresour-ces allocated to Spain through the Community SupportFrameworks (CSF), which came into effect in 1989 and1990. Spain also benefits from Community initiative pro-grunmes (such as ENVIREG, INTERREG, STRIDE etc.)and the Community loan instuments (EIB, MC).
533. The obJectlve I CSF
Resource transfers under Objective I are by far the most im-portalxt, reaching 9,8 billion ECU (1989 pnces) for the 5-year period 1989 - 1993. In the Objective I regions, ttre CSFcan be regarded as having a macroeconomic impact, and willrcach about L4% of rcgonal GDPby 1992.lf one include-sthe Community initiatives and loan instnrments, this per-centage rises to som€ 2%.The*'wrpacts are obviously morefunportant in t€rms of investrnenf urd particularly public in-veshnent, of which 35.40,%, in objective I regions, are co-financedby ttreEC. If,moreover, one looks attheFCI, whichis the main finarcial instrument of domestic regional policy,its interventions on a per capita basis reach only half the im-portance of those of the combined EC funds.
The CSF for the objective 1 regions of Spain was adopted onthe 31.10.1989 on the basis of the Regional DevelopmentPlaq mentioned above"
The analysis of ttris Plan by the Commission services, withinthe spirit ofpartnership and taking into consideration theoverall financial constraints on the Community funds, led tothe &finition of 6 main axes of intervention in the CSF:
1. Improvingcommunications
2- Industry, crafts s€ctor arrC business services
3. Toruism
4. Agricultureandnraldevelopment
5. Infrastucture to support economic activity
6. Humanresources
Table 10 shows the b,reakdown of the objective I CSF bythese 6 axes" Axis 1, which consists of transport and com-munications infrastructure, cleady received a high priorityand gets the largest share of financing, followed by Axis 5.
The CSF has been hoken down into 11 regional sub-CSFsplus a multiregional one. The latter absorbs 60% of total fin-ancial resourpes, which may be as an emphasison the global and international articulation of the territory inline with Communit5r objectives, relative to purely local pro-jects The regional distribution of Commrurity finarrcing inthe CSF also shows a stronger "bias" in favou of regions
90 Regional Disequilibria
with the lowest income than thepattern of total public invest-
ments befqe the CSF, es can deasily seen from Table 3.9
6. Conclusions
In the 1950s and 1960s there was an overall high level ofgrowth and convergence of income levels of the Spanish re-gions However, neither in tbe p€riod of stagration between
1973 and 1985 nor in the more dynamic post-accession peri-
o4 has there been a clear tnend of convergence or diver-gerrca There is instead a diversity of situations within bothbackward and prosperous regions, and Spain's economic
geography shows a rather complex arxl changing pattern Al-though the ecommic centre of gravity of the country seems
to be changing to the South and to the East, this evolutioncannot be simply characterized in terms of two groups of de-
veloped and lagging regions, or even in terms of whole Co-
munidades Autonomas.
A bdanoed distribution of regional growth towards a more
decisive convetgencc of regional income levels would probably contibute to the achievement of the overall macroecon-
omic objectives of the Spanish authorities: to sustain the
present high levels of rcal GDP growth, without incuningexcessive int€mal and extemal imbalarrce.s that would jeopardize Spain's participation in ttre EMS and EMU.
In the post-1985 peno4 the failure to achieve greater real
conv€,lg€nce within Spanish regions cannot be put down to a
poor performance of tlre laggrng regions (which have been
catching up with respect to the rest of the EC), but to an even
better perfomrance of the most &veloped ones.
Tlvo dominant hends have been: the emerge,lroe of the Me'diterranean axis of growt[ and the decline of the industrial
Norttr. More recently, lxlme of the latt€r arcas have started to
recover. The whole East of the Peninsula seems set to
becorne economically dominant in the future.
The regimal distsibution of private investrnent in manufac-
turing, and in particular foreip direct investnent, docs not
se€,rr to be conuibuting as much as &sired to the rcdrctionof regional inequalitiess within the country, although the,rc
are no cmrprehensive data
The severity of unemplo5mnent problems in lagging regiorywhich can impair their catching-up prospects, is dte to pr-ticular rigidities of the labour marftet. Ttrere is evidence of a
considerable role played by labour skills mismalch. Migra-
tion flows frqn low to high activity regions are not likely tor€sume at the same scale as in the pasL This points to the
need for specific policies directed to irnprove the flexibilityand quality of labour in ttre.se regions, some of which con-
tinue to be affected by a higher than average irprease of the
labour fqce"
The prospects for the inlan4 Atlantic and border regions(with Pornrgal) deperd m their ability to diversify towards
new economic activities, generate new growth poles and im-prove communications with therest of the Peninsula. In this
r€spect, the EC with its Community Support Frameworts'and the Spanish instruments of ttre FCI and regional irrce,n-
tives policy point the right direction
See also CADMOS llggly Evaluation macro-&onomique du CCA loSa-1Q93 relative aux r68ions & I'objectif 1 en FsPaSne-
shrdy frnanced by the European Commission.
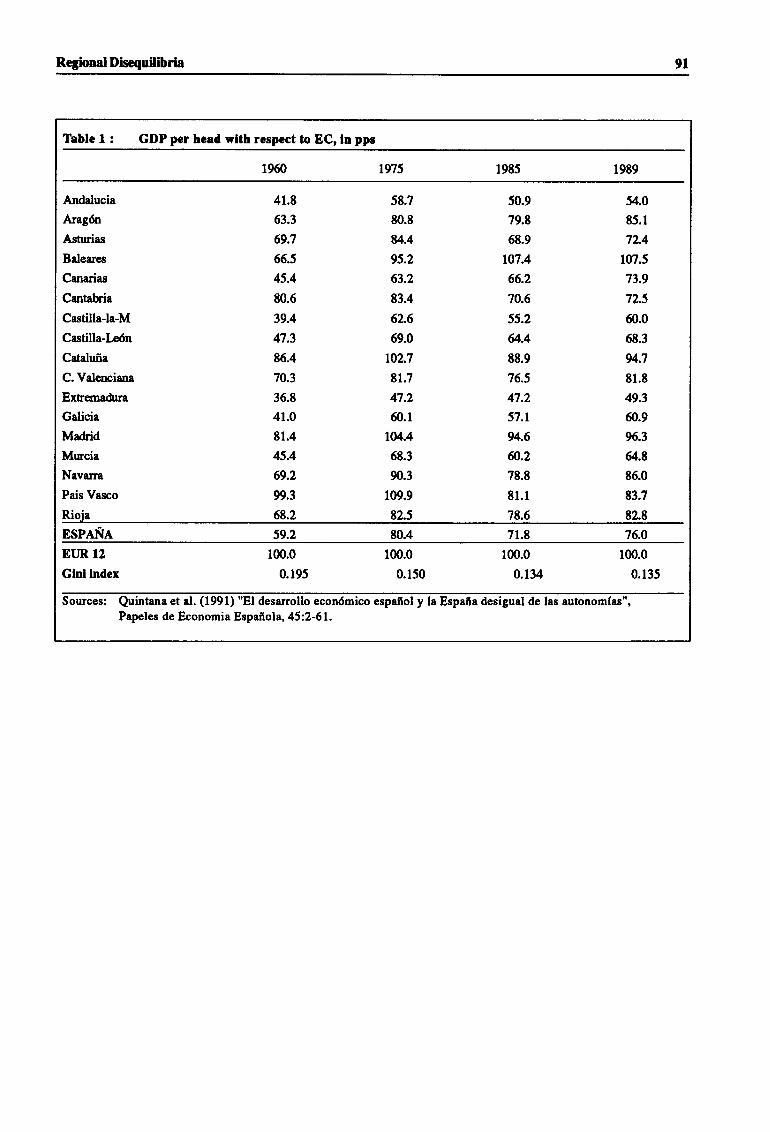
Regional Disequilibrir 9l
Table 1 : GDP pcr head wlth respect to ECr ln pps
1960 1975 1985 1989
Andalucia
Arag6n
Asturias
Baleares
Canarias
Cantabria
Castilla-la-M
Castilla-Le6n
Cataluffa
C. Valenciana
Extremadua
Galicia
Madrid
Murcia
Navarra
Pais Vssco
Rioja
41.8
53.3
69.7
66.5
45.4
80.6
39.4
47.3
86.4
70.3
36.8
41.0
81.4
45.4
69.2
99.3
68.2
58.7
80.8
u.495.2
53.2
83.4
62.6
69.0
t02.7
81.7
47.2
60.1
t0/..4
68.3
90.3
109.9
82.5
50.9
79.8
68.9
107.4
66.2
70.6
55.2
il.488.9
76.5
47.2
57.1
94.6
fi.278.8
81.1
78.6
54.0
85.1
72.4
107.5
73.9
72.5
60.0
68.3
94.7
81.8
49.3
50.9
96.3
64.8
86.0
83.7
82.8
ESPANA s9.2 80.4 7t.8 76.0
EUR 12
Glnl lndex
100.0
0.195
100.0
0.150
1m.0
0.134
100.0
0.135
Sources: Quintana et al. (1991) "El desarrollo econ6mico espafiol y la Espaf,a desigual de las autonomfas",Papeles de Economia Espafiola, 4522-61.
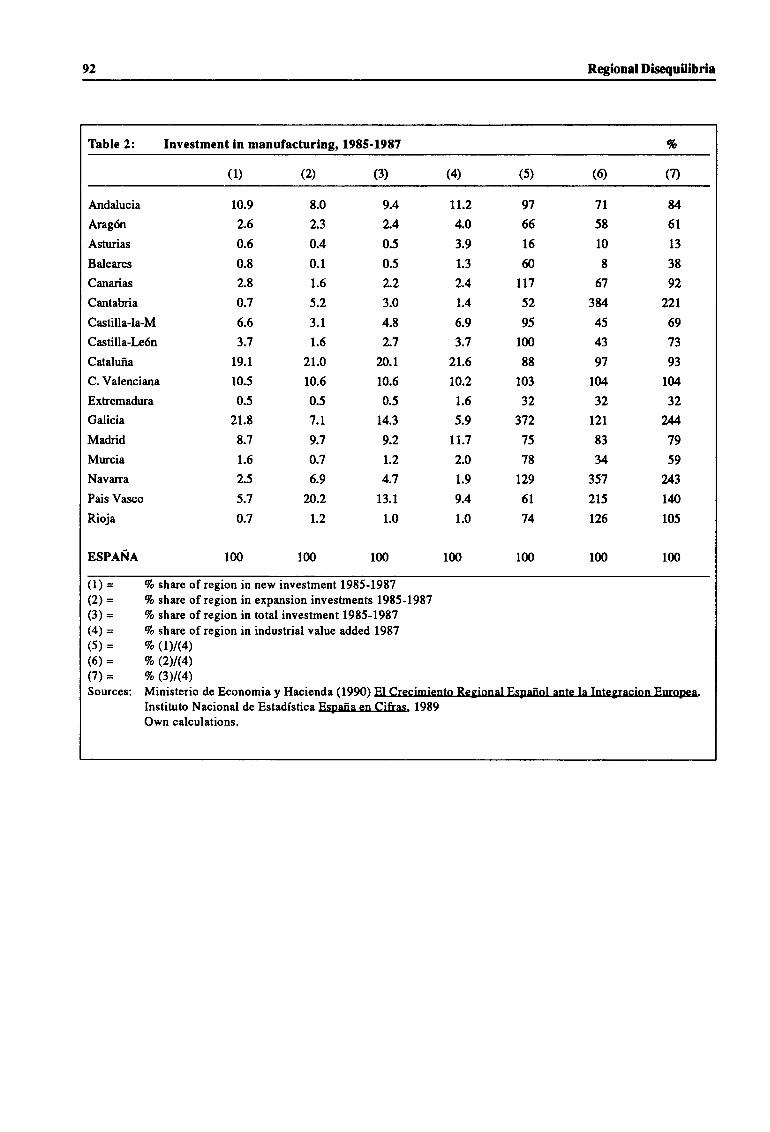
92 Regional Disequilibria
Table 2: Investment ln manufacturlng, 1985-19E7 %
(7\(o(s)(4)(3)(2)(1)
Andalucia
Arag6n
Asturias
Baleares
Canarias
Cantabria
Castilla-la-M
Castilla-I-e6n
Catalufia
C. Valenciana
Extremadura
Galicia
Madrid
Murcia
Navarra
Pais Vasco
Rioja
ESPANA
10.9
2.6
0.6
0.8
2.8
0.7
6.6
3.7
19.1
10.5
0.5
21.8
8.7
1.6
2.5
5.7
0.7
t00
8.0
2.3
0.4
0.1
1.6
5.2
3.1
1.6
2t.o
10.6
0.5
7.1
9.7
0.7
6.9
20.2
1.2
1m
9.4
2.4
0.5
0.5
2.2
3.0
4.8
2.7
20.1
10.5
0.5
14.3
9.2
1.2
4.7
13.1
1.0
100
tt.24.0
3.9
1.3
2.4
1.4
6.9
3.7
2t.6
to.2
1.5
5.9
tL.7
2.0
1.9
9.4
1.0
100
97
66
L6
60
LL7
52
95
100
88
103
32
372
75
78
r29
61
74
100
7t58
10
8
67
3U45
43
97
104
32
t2l83
34
357
215
126
100
u6t13
38
92
221
69
73
93
104
32
2479
59
243
IN105
100
(1) =(2) =(3) =(4) =(5) =(5) =(7) =Sources:
Vo shue of region in new investment 1985-19879o sharc of region in expansion investments 1985-19877o share of region in total investment 19E5-19E7Vo share of region in industrial value added 1987Eo (L)t(4)Eo (2)t(4)qo Q)l@)Ministerio de Economia y Hacienda (1990) FI Crecimiento ReSional Fspafrol ante la Tnte8racion Furopea.Instituto Nacional de Estadistica Espafia en Cifras, 1989Own calculations.
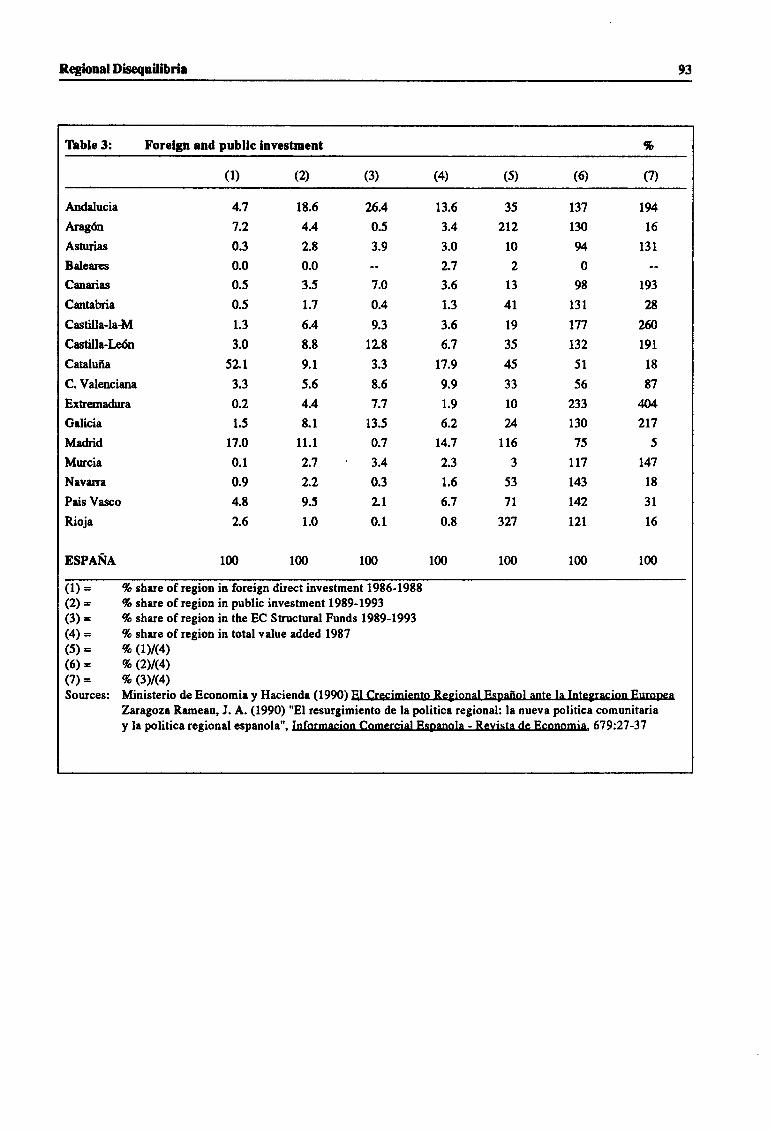
Regftmat Disequilibrir 93
Thble 3: Forelgn and publlc lnvestment %
(7)(o(5)(4)(3)(2)(l)
Andalucia
Arag6o
Asturias
Baleares
Canarias
Cantabria
CastillaJa-M
Crstilla-Le6n
Catalufla
C. Valenciana
Extresradra
Galicia
Madrid
Mrncia
Navarra
Pais Vasco
Rioja
ESPAITA
4.7
7.2
0.3
0.0
0.5
0.5
1.3
3.0
52^L
3.3
0.2
1.5
17.0
0.1
0.9
4.8
2.6
100
18.6
4.4
2.8
0.0
3.5
1.7
6.4
8.8
9.1
5.6
4.4
8.1
11.1
2.7
2.2
9.5
1.0
100
26.4
0.5
3.9
7.O
0.4
9.3
12.8
3.3
8.6
7.7
13.5
0.7
3.4
0.3
2.t
0.1
100
13.6
3.4
3.0
2.7
3.6
1.3
3.6
6.7
t7.9
9.9
1.9
6.2
t4.7
2.3
1.6
6.7
0.8
100
35
2r210
2
13
4tt935
45
33
10
u116
3
53
7t327
100
137
130
94
0
98
131
177
132
51
56
233
130
75
tl7t43
t42t2t
100
194
16
131
193
?s
260
191
18
87
M217
5
t47
18
3l16
1m
(l) =(2) =(3) =(4) =(5) =(6) =(7) =Sources:
% share ofregion in foreign direct investment 1985-198896 share ofregion in public investment 19E9-1993{o share ofregion in the EC Structurol Funds l9E9-19937o shte of region in total value added 1987Eo (t)l(4)% (z)t(d)Eo (3)t(4)Ministerio de Economia y Hacienda (1990) El Crecimiento Re8ional Fspafiol ante la [nteSracion Furopea
Zaragozr Rameau, J. A. (1990) "El resurgimiento de la politica regional: la nueva politica comunitariay la politica regional espanola", Informacion Comercial Fspanola - Revista de Fconomia, 679:27-37
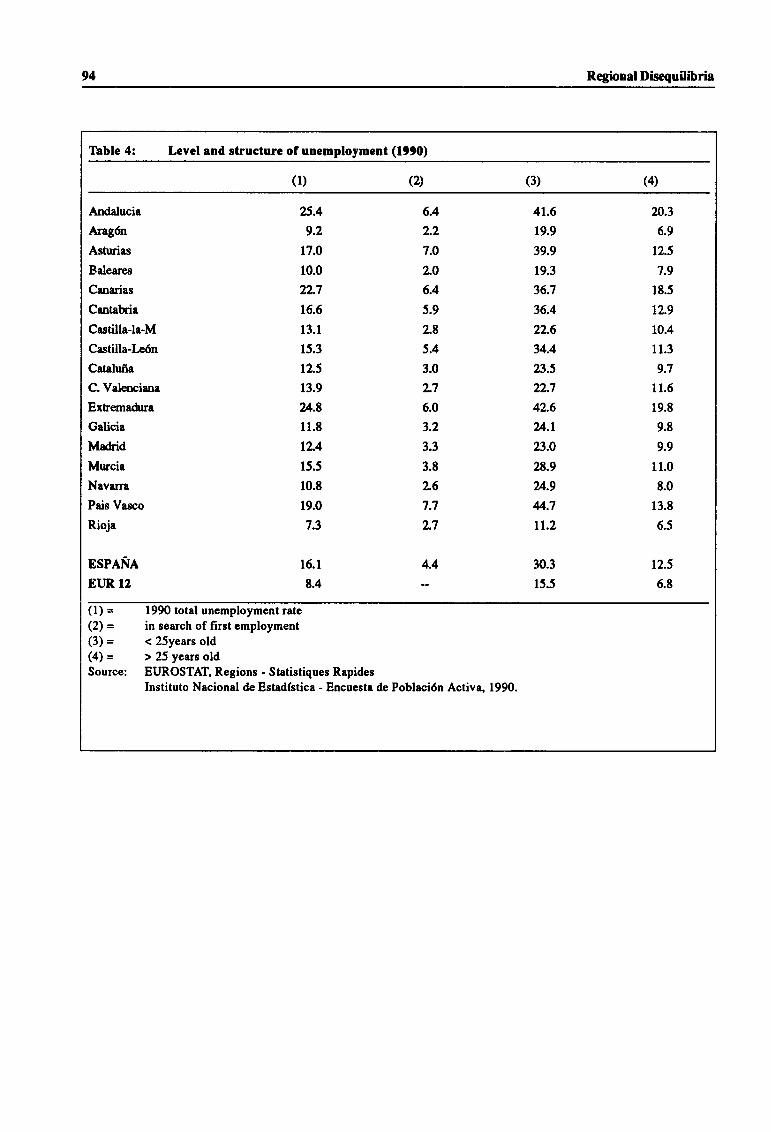
94 Regionat Disequilibria
Thble 4: Levcl and structurc of unemployment (1990)
(1) (2) (3) (4)
Andalucia
Ara86n
Asturias
Baleare.s
Canarias
Cantabria
Castilla-la-M
Castilla-Le6n
Cataluf,a
C. Valenciana
Extremadra
Galicia
Madrid
Mwcia
Navara
Pais Vasco
Rioja
ESPANA
EUR. 12
25.4
9.2
17.0
10.0
22.7
16.6
13.1
15.3
r2.5
13.9
u.811.8
tL415.5
10.8
19.0
7.3
15.1
8.4
6.4
2.2
7.0
2.0
6.4
5.9
2.8
5.4
3.0
L76.0
3.2
3.3
3.8
2.6
7.7
2.7
41.6
19.9
39.9
19.3
36.7
36.4
22.6
34.4
23.5
22.7
42.6
u.t23.0
28.9
24.9
4.7tt.2
30.3
15.5
20.3
6.9
12.5
7.9
18.5
t2.9
10.4
11.3
9.7
11.6
19.8
9.8
9.9
11.0
8.0
13.8
6.5
t2.5
6.8
4.4
(l) =(2) =(3) =(4) =Source:
1990 total unemployment ratein search of first employment< 25years old> 25 years oldEITROSTAT, Regions - Statistiques RapidesInstituto Nacional de Estadfstica - Encuesta de Poblaci6n Activa, 1990.
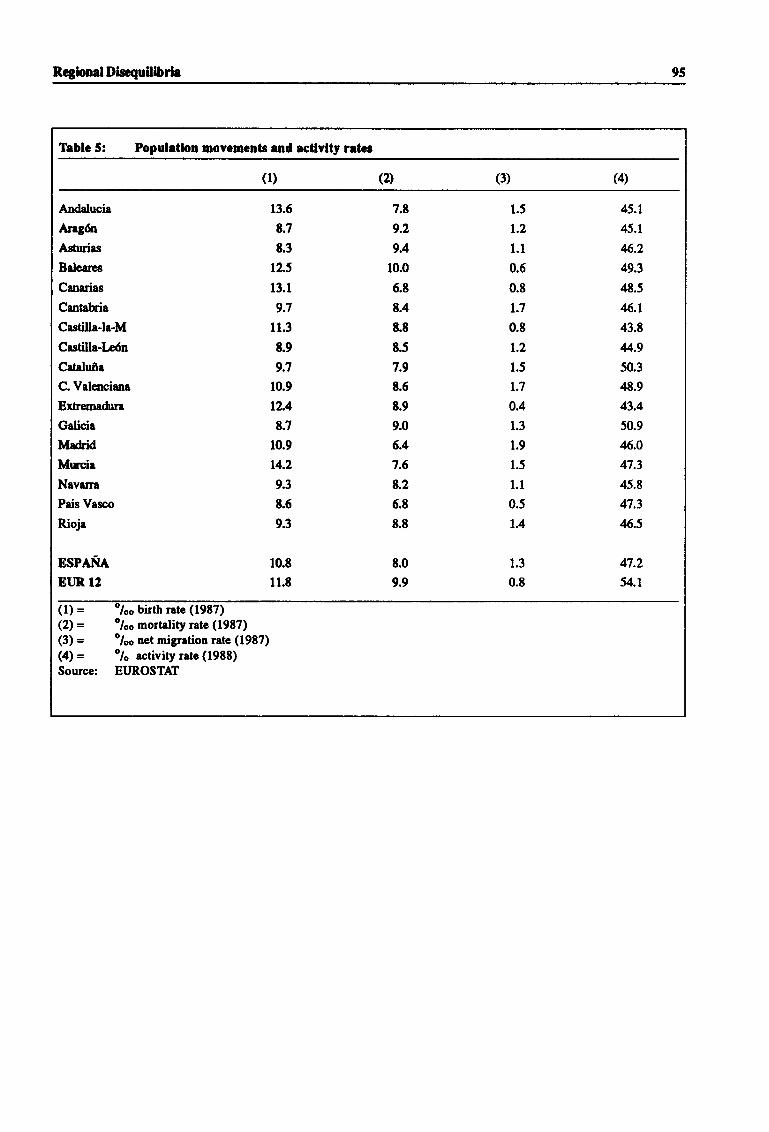
RcgbnalD&rcqutlibdr 95
Thblc 5: Populatbn movcmcntr rnd ectlvlty retcr
(1) (2) (3) (4)
Andalucia
Areg6n
As0rias
Baleares
Canarias
Cantabria
Castille-la-M
Castilla-Ledn
Catsluia
C. Valenciana
Extemadra
Galicia
Ma&id
Mrncie
Nrvarra
Pais Vasco
Rioja
ESPANA
Et R.12
13.6
8.7
8.3
rL'13.1
9.7
11.3
t.99.7
10.9
tL48.7
10.9
14.2
9.3
t.69.3
10.8
11.8
7.8
9.2
9.4
10.0
6.8
8.4
t.8t.5
7.9
E.6
8.9
9.0
6.4
7.6
8.2
6.8
8.8
8.0
9.9
1.5
1.2
1.1
0.6
0.8
t.7
0.8
1.2
1.5
1.7
0.4
1.3
1.9
1.5
1.1
0.5
t.4
1.3
0.E
45.1
45.1
6.249.3
48.5
4.143.8
4.950.3
48.9
43.4
50.9
46.0
47.3
45.8
47.3
46.5
47.2
54.1
(l) = /oo birth rate (19t7)(2) = o/oo mortality rate (1987)(3) = o/oo net migration rate (1987)(4) = o/o activity rate (1988)Source: EITROSTAI
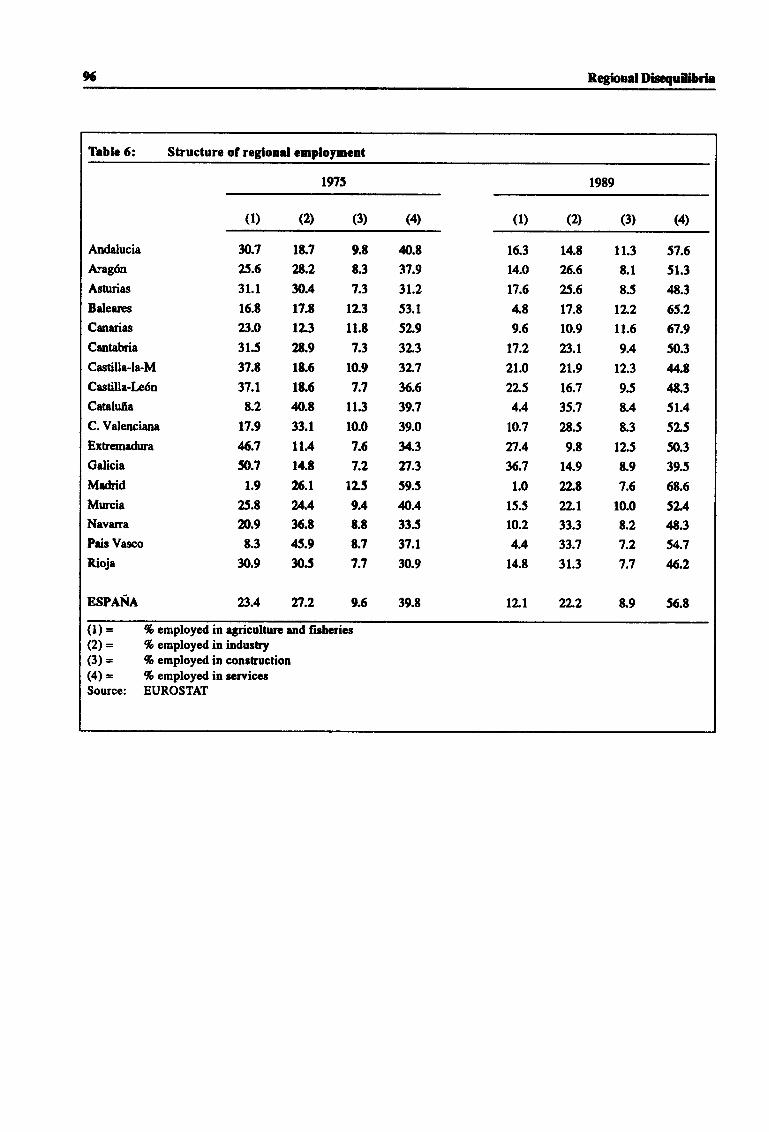
96 RegbnatDirrcquillbrb
l]sblc 6: Structure of reglonel cmployncnt
tn5 1989
(l) (2' (3) (4) (1) (2\ (3) (4)
Andalucia
Arag6n
Asturias
Bdeares
Canarias
Crntabria
Castille-le-M
Crstilla-I*6n
Cataluia
C. Valenciana
Extserradra
Galicie
Mr&idMurcia
Navarra
Peis Vasco
Rioja
ESPANA
n.725.6
3l.l16.t
23.0
31.5
37.t
37.r
E.2
t7.9
6.7fi.7
1.9
25.tm.9
t3:n.9
It72t.2
30.4
l7.ttL34.9l&6lt640.t33.1
ll.4ldt25.1
u.436.E
45.9
305
9.tt.37.3
t2,t1l.t7.1
10.9
7.7
ll.310.0
7.6
7.2
lz59.4
t.t8.7
7.7
40.t
37.9
31.2
53.1
5L9
|Lt32.7
36.6
39.7
39.0y.3n.359.5
0.433.5
37.1
30.9
39.8
16.3
14.0
t7.6
4.E
9.6
t7.2
2t.o
22.5
4.4
t0.7
n.436.7
1.0
15.5
to.2
4.4
14.t
tlt
14.E
26.6
25.6
17.8
10.9
23.1
21.9
16.7
35.7
28.5
9.8
14.9
tlg22.1
3t.3
3t.7
31.3
xt.2
11.3 57.6
E.l 51.3
E.5 48.3
t2.2 65.2
11.6 67,9
9.4 50.3
t2.3 4.89.5 4t.3
E.4 51.4
8.3 sLS
12.5 50.3
E.9 39.s
7.6 68.6
10.0 5L48.2 4t.3
7.2 54.7
7.7 6.2
23.4 n.2 9.5 8.9 56.8
(l) = % employed in agriculture rnd firhcrier(2) = % employed in indurtsy(3) = % employed in construction(4) = % employed in rcrviccrSource: EUROSTAI
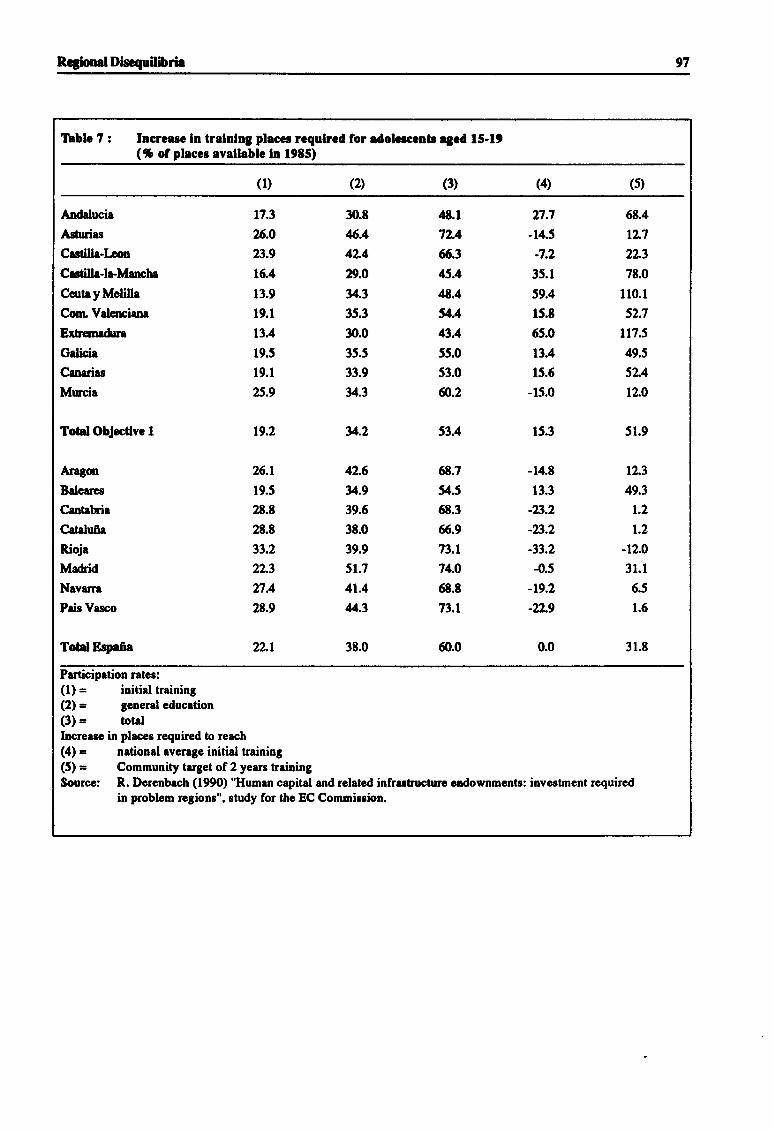
RcgtlnalDfttcquilibrir 97
frblc 7: fncrcosG ln trelnlng plrccs roqulrod for edolerconb rgcd 15-19(5 olplaces rvallablc h f985)
(t)(4)(3)(2\(1)
Andelucie
Astudrs
Crstillr-Lcm
Crcilh-lr-MrmbrCantryMelillrCom. Vcl€ocienr
Exbcmr&re
Gelhie
Cmarirg
Mucia
Total ObJcctlve I
Aregm
Belerres
Cantehie
Cst lufirRioje
Ma&id
Navarre
Pric Vrsco
Total Espofre
t7.3
26.0
23.9
t6.4
13.9
19.1
tt.419.5
19.1
25.9
19.2
26.t
19.5
2t.8
2t.8
3t.2
2L3
n.428.9
30.t
6.442.4
D.0v.335.3
30.0
35.5
33.9
v.3
v.2
4L6y.939.6
38.0
39.9
51.7
41.4
u.3
4tl72.4
6.345.4
8Ay.441.4
55.0
53.0
o.2
53.4
68.7
54.5
58.3
66.9
7t.l74.0
68.8
73.1
3s.l
59.4
15.8
65.0
15.3
-14.8
13.3
-23.2
-23.2
-33.2
4.5-t9.2
-22.9
68.4
tll2L3
78.0
110.1
52.7
lfi.549.5
5L4
tz.o
51.9
rL349.3
1.2
r.2
-t2.o
31.1
6.5
1.5
27.7
-14.5
:7.2
tlA15.5
-15.0
22.1 38.0 ().0 0.0 31.8
Participation rates:(l) = initial training(2)= general educetion(3) = iotrllncrersc in places reguirod to reach(4) = nrtional overlgc initial training(5) = Community trrget of 2 yeare treiningSourcc: R. Derenbrch (190) "Humm capital and related infrrrbucturc cndovnmente: investment required
in problem regionsn, study for the EC Commisrion.
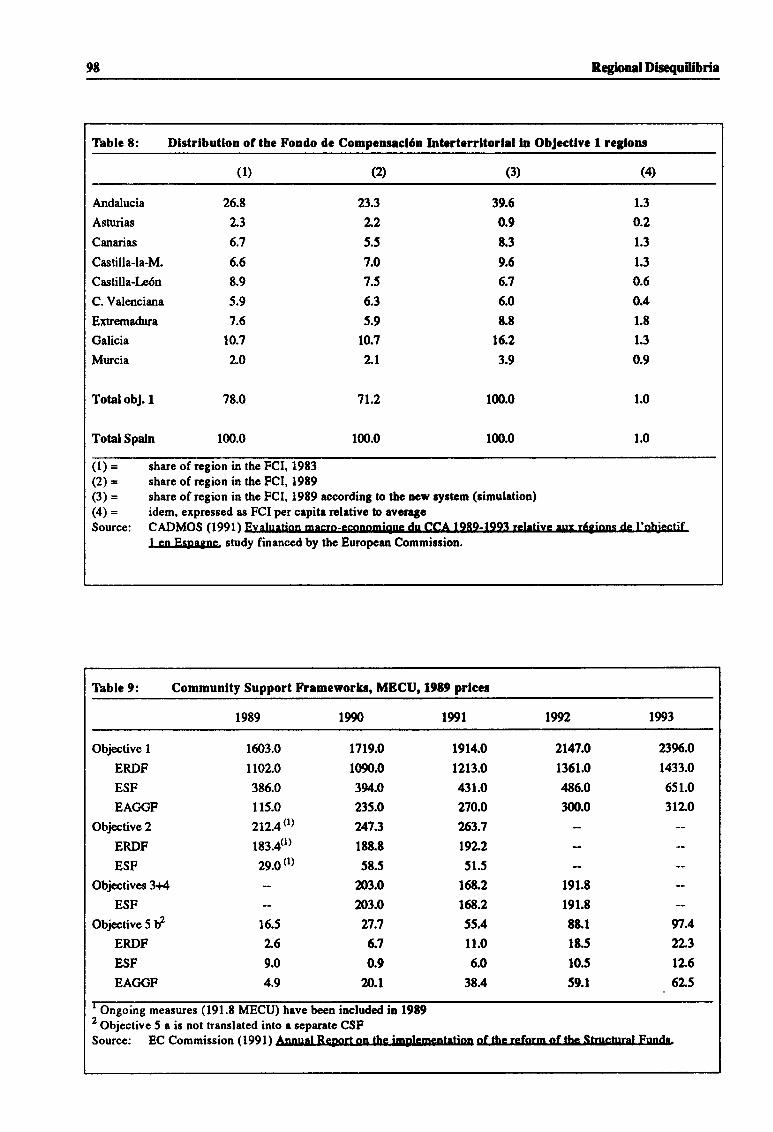
9t Regional Discquilibria
Table 8: Dlstrlbutlon of the Fondo dc Compcnsacl6n Intorterrltorlal ln ObJcctlvo I reglons
(1) (2> (3) (4)
Andalucia
Asturias
Canarias
Castilla-la-M.
Castilla-Le6n
C. Valenciana
Extrerna&ra
Galicia
Murcia
Total obJ. I
26.8
2.3
6.7
6.6
8.9
5.9
7.5
to.7
2.O
78.0
23.3
2.2
5.5
7.0
7.5
6.3
5.9
10.7
2^t
7t.2
100.0
39.6
0.9
t.3
9.6
6.7
6.0
t.8t6.2
3.9
100.0
100.0
1.3
o.2
1.3
1.3
0.6
0.4
1.8
1.3
0.9
1.0
1.0Total Spaln 100.0
(l) = share of region in the FCI, 1983(2) = share of region in the FCI, 19t9(3) = share ofregion in the FCI, 1989 according to the ncw ryetem (simuletion)(4) = idem, expressed as FCI per capita relative to svcsatcSource: CADMOS (1991) Evaluation mecro-eeonomiquc du CCA lQSQ-IQQ3 reletivc elrr r6tions de I'ohjectif
1 en Fspagne- study financed by the European Commirrion.
Table 9: Communlty Support Fromeworls, MECU, l9t9 prlccc
1989 1990 l99t t992 1993
Objective IERDF
ESF
EAGGF
Objective 2
ERDF
ESF
Objectives 3+4
ESF
Objective 5 fERDF
ESF
EAGGF
1603.0
1102.0
3E6.0
115.0
212.4tD
1E3.4(1)
1:0"'
16.5
L69.0
4.9
1719.0
1090.0
394.0
235.O
2{t.3188.8
58.5
203.0
n3.0n.7
6.7
0.9
n.t
1914.0
1213.0
431.0
no.o263.7
t92.2
51.5
168..2
t68.2
55.4
11.0
6.0
38.4
2147.0
1361.0
486.0
300.0
..191.8
191.8
88.1
rt.510.5
59.1
2196.0
1433.0
651.0
3lz0
--
97.4
aL3
tL66L5
' Ongoing measures (191.8 MECU) have been included in 19892 Objective 5 a is not translated into a separate CSFSource: EC Commission (1991) Annual ReDprt on ihe implcmentelion of thc reform of thc Stnrcturel Fundr.
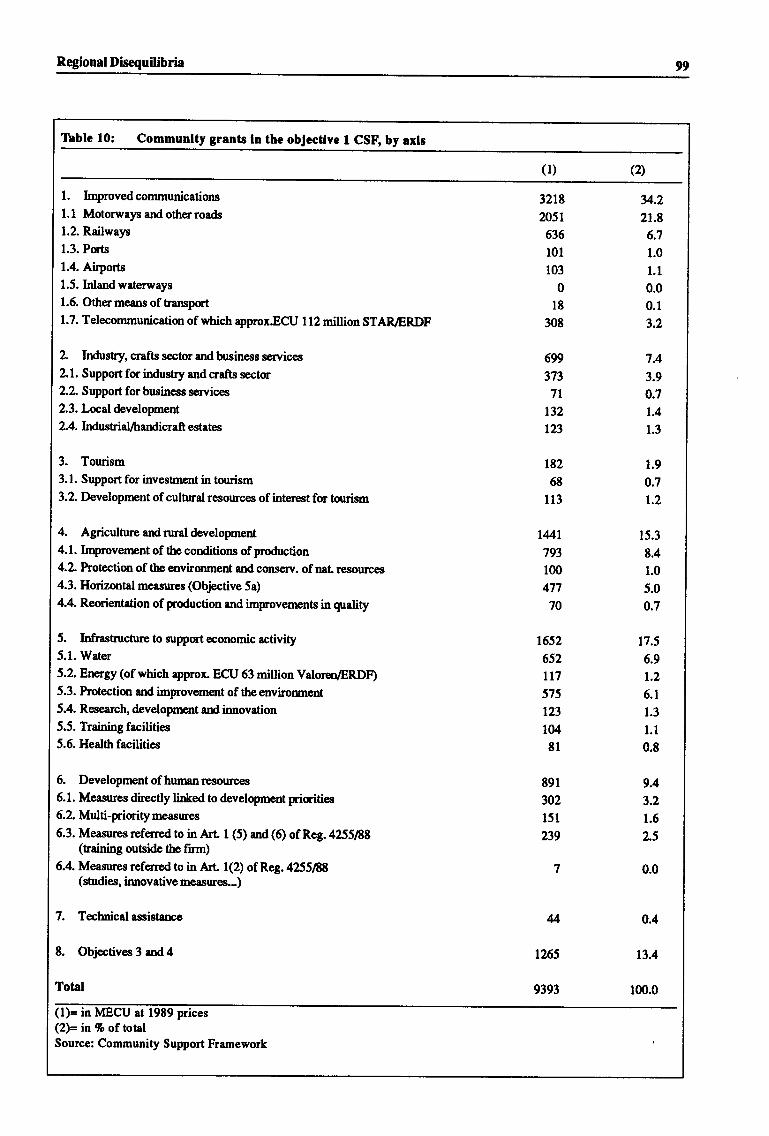
Regional Disequilibria 99
Thble 10: Communlty grants ln the obJcctlvc I CSF, by axls
(2)(l)
1. knprovedcommunications
1.1 Motorways ard other roads
1.2. Railways
1.3. Pqts1.4. Ai{ports
1.5. Lrlandwaterways1.5. Other means of transput1.7. Telecommunication of which approx.ECU 1 12 million STAR/ERDF
2. Industry, crafts secior and business services
2.1. Support for industy and crafts sector
2.2. Support for business s€rvices
2.3.Looil developrnent
2.4. Lrdustsialfhardicraft estates
3. Tourism
3.1. Support for investment in tourism3.2. Development of cultrnal resources of interest fc tourism
4. Agriculture and rural developnent4.1. Inrprovenrent of the corditions of production
4.1 Protection of the environment and cons€r.rr. of neL resources
4.3. Horizontal measures (Objective 5a)
4.4. Reorientation of production and improvements in quality
5. Infrastructure to support €conomic activity5.1. Waler5.2. Errrgy (of which approL ECLI 63 million Valoren/ERDF)5.3. Protection and improvenrant of theenvironment5.4. Re.search, development and innovation5.5. Training facilities5.6. Healttr facilities
6. Developnrcnt of humanresources
6.1. Meaures directly linked to developnent pricities6. 2. Multi-priority measure.s
6.3. Measures rcferred to in fut 1 (5) ard (6) of Reg.4255188(training outside the finn)
6.4. Measures referred to in Art 1(2) of Reg.425588(studies, innovative measures...)
7. Technicalassistarce
8. Objectives 3 and 4
Total
3218
2051
635
101
103
0
18
308
699
373
7L
132
123
t8268
l13
t4/.t793100
477
70
1652
652LL7
575
123
104
81
891
302
151
239
7
4
1265
9393
y.221.8
6.7
1.0
1.1
0.0
0.1
3.2
7.4
3.9
0.7
1.4
1.3
1.9
0.7
1.2
15.3
8.4
1.0
5.0
0.7
17.5
6.9
1.2
6.1
1.3
1.1
0.8
9.4
3.2
1.6
2.5
0.0
0.4
t3.4
1m.0
(l)= in MECU at 19E9 prices(2)= in % of totalSource: Community Support Framework
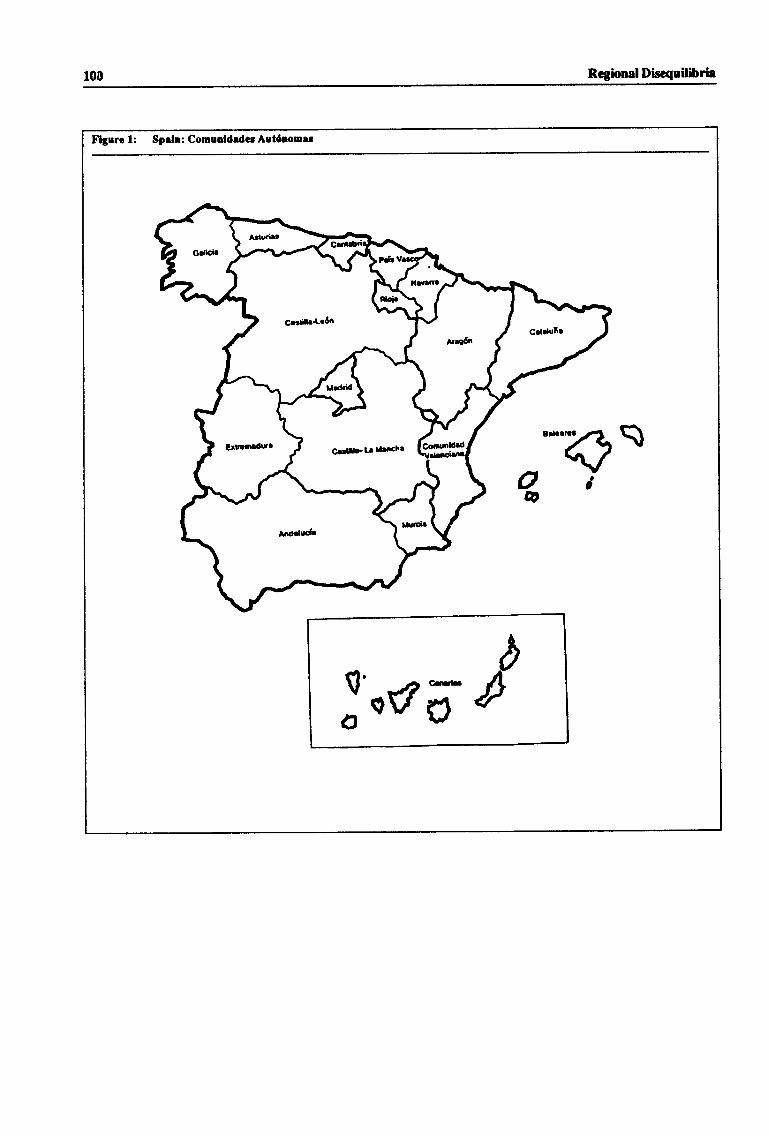
r00 R egional Disequitibrie
Flgure 1: Spelr: Conuoldedcs Artairorri
lofo i

EmlcPrpcrs rcr
Country Studlcr
Sec elrc Bconomio Pepcru No.79 (ItG Uribd Kinjdm), No.tl (Thc Ncthcrludr) end No.t2 @e[ium).No. I Thc Fcdcnl Republic of Gcrnmy (Scptcnbc 1990)
No. 2 Portugrl ( Feb,rurry l99l)
No. 3 Unitcd Kingdom (lulrch l99l)No. 4 Dcnmark (April 191)
No.5 Frrncc (ro0t 1991)
No. 6 kelrnd (Scptembcr l99l)No. ? Spein (March 1992)
102 EconomlcPrpcrc
Economic Paperst
The following papers have been issued. Copies may be obtained by applying to the address mentioned on the insidefront cover.
No. 1 EEC-DG II inflationary expectations. Survey based inflationary expectations for the EEC countries,by F. Papadia and V. Basano (May 1981).
No. 3 A review of the informal economy in the European Communitn by Adrian Smith (Iuly 1981).
No. 4 Problems of interdependence in a multipolar world, by Tommaso Padoa-Schioppe (August 1981).
No. 5 European Dimensions in the Adjustment Problems, by Michael Emerson (August 1981).
No. 6 The bilateral tsade linkages of the Eurolink Model : An analysis of foreign trade and competitiveness, byP. Ranuzzi (January 1982).
No. 7 United Kingdom, Medium term economic trends and problems, by D. Adams, S. Gillespie, M. Green andH. Worhnann (February 1982).
No. 8 Oi en est la thdorie macro6conomique, par E. Malinvaud (uin 1982).
No. 9 Marginal Employment Subsidies : An Effective Policy to Generate Employment, by Carl Chiarelle endAlfred Steinherr (November 1982).
No. 10 The Great Depression : A Repeat in the 1980s ?, by Alfred Steinherr (November 1982).
No. 1l Evolution et probllmes structurels de l'dconomie n6erlandaise, par D.C. Brcedveld, C. Depoortere,A. Finetti, Dr. ,.M.G. Pieters et C. Vanbelle (mars 1983).
No. 12 Macroeconomic prospects and policies for the European Communitn by Giorgio Basevi,Olivier Blanchard, Willem Buiter, Rudiger Dornbusch, and Richard Layard (April 1983).
No. 13 The supply of output equations in the EC-countries and the use of the stn'ey-based inflationaryexpectations, by Paul De Grauwe and Mustapha Nabli (May 19E3).
No. 14 Structural trends of financial systems and capital eccumulrtion : France, Germany, Italn by G. Nardozzi(May 1983).
No. 15 Monetary assets end inflation induced distorsions of the national rccounts - conceptual issues rndcorrection of sectoral income flows in 5 EEC countries, by Alex Cukiernran and forgen Mortensen(May 1983).
No. 16 Federal Republic of Germany. Medium-term economic trends and problcms, by F. Allgayer, S. Gillespie,M. Green and H. Worhnann (June 1983).
No. 17 The employment miracle in the US and stagnation emplo5ment in the EC, by M. Wegner (Iuly 1983).
No. 18 Productive Perfomance in West German Manufacturing Industry 1970-1980; A Farrell FrontierCharacterisation, by D. Todd (August 1983).
No. 19 Central-Bank Policy snd the Financing of Government Budget Deficits : A Cross-Country Comperison,by G. Demopoulos, G. Katsimbris and S. Miller (September 1983).
No. 20 Monetary assets and inflation induced distortions of the national accounts. The case of Belgium, byKen Lennan (October 1983).
I *Economic Papers" are written by the Staff of the Directorate-General for Economic rnd Financial Affairs, or byexperts working in association with them. The "Papers'are intended to increage awareness of the tcchnicrl workbeing done by the staff and to seek commentg and suggestions for the further anelyses. They may not bc quotedwithout authorisation. Views expressed reprcient exclusively the positions of the author and do not necessrrilycorrespond with those of the Commission of the European Communities. Comments and enguiries should beadressed to:The Directorate-General for Economic rnd Financial Affairs,Commission of the European Communities,200, rue de la Loi1049 Brussels, Belgium
Economic Papers
No. 21 Actifs financiers et distorsions des flux sectoriels dues I I'inflation : Ie cas de la France, par J.-p. Bach6(octobre 1983).
No. 22 Approche pragmatique pour une politique de plein emploi : les subventions I la cr6ation d'emplois,par A. Steinherr et B. Van Haeperen (octobre l9g3).
No. 23 Income Distrib_ution and Employment in the European Communities 1960-1982, by A. Steinherr(December 1983).
No. Z U.S. Deficits, the dollar and Europe, by O. Blanchard and R. Dornbusch @ecember 1983).
No. 25 Monetary Assets and inflation induced distortions of the national accounts. The case of the FederalRepublic of Germann by H. Wittelsberger (January l9t4).
No. 26 Actifs financiers et distorsions des flux sectoriels dues I I'inflation : le cas de I'Italie, par A. Reati(anvier 1984).
No. 27 Evolution et probldmes structurels de l'dconomie italienne, par Q. Ciardelli, F. Colesanti et X. Lannes(anvier 1984).
No. 28 International Co-operation in Macro-economic Policies, by J.E. Meade @ebruary 1984).
No. 29 The Growth of Public Expenditure in the EEC Countries 1950-1981 : Some Reflections, by Douglas Todd(December 1983).
No. 30 The integration of EEC qualitative consumer survey results in econometric modelling : an application tothe oonsumption function, by Peter praet (February l9g4).
No. 31 Report of the CEPS Macroeconomic Policy Group. EUROPE : The case for unsustainable growth,by R. Layard, G. Basevi, o. Blanchard, w. Buiter and R. Dornbusch (April l9g4).
No. 32 Total Factor Productivity Growth and the Productivity Slowdown in the West German Industrial Sector,1970-1981, by Douglas Todd (April 1984).
No. 33 An analytical Formulation and Evaluation of the Existing Shucture of Legal Reserve Requirements of theGreek Economy : An Llncommon Case, by G. Demopoulos (fune 19g4).
No. 34 Factor Productivity Growth in Four EEC Countries, 1960-1981, by Douglas Todd (Octob€r 19g4).
No. 35 Rate of profit, business cycles and capital accumulation in U.K. industry, 1959-1981, by Angelo Reati(November 1984).
No. 36 Report of the CEPS Macroeconomic Policy Group. Employment and Growth in Europe : A T*o-HandedApproach by P. Blanchard, R. Dornbusch, J. Drlze, H. Giersch, R. Layard and M. Monti (Iune 1985).
No. 37 Schemas for the construction of an *auxiliary econometric model" for the social security system,by A. Coppini and G. Laina (June 1985).
No. 38 Seasonal and Cyclical Variations in Relationship among Expectations, Plans and Realizations in BusinessTest Surveys , by H. Ktinig and M. Nerlove (July 1985).
No. 39 Analysis of the stabilisetion mechanisms of macroeconomic models : a comparison of the Eurolinkmodels by A. Bucher and V. Rossi (July 1985).
No. 40 Rate of profit, business cycles and capital accumuletion in West German industry, 1960-1981, by A. Reati(July 1985).
No. 41 Inflation induced redistributions via monetary assets in five European countries z 1974-1982,by A. Cukierman, K. Lennan and F. papadia (September l9g5).
No. 42 \York sharing : why ? How ? How not ..., by Jacques H. Drlze (December l9g5).
No. 43 Toward Understrnding Major Fluctuations of the Dollar by P. Armington (Ianuary 1986).
No. 44 Predictive value of firms'manpower expectations and policy implications, by G. Nerb (March 1986).
No. 45 Le taux de profit et ses composantes dans I'industrie frangaise de 1959 I 1981, par Angelo Reati(Mars 1986).
No. 46 Forecasting aggregate demand components with opinions surveys in the four main EC-Countries - Expe-rience with the BUSY model , by M. Biart and p. praet (May 19g6).
No. 47 Report of CEPS Macroeconomic Policy Group : Reducing Unemployment in Europe : The Role of CapitalFormation, by F. Modigliani, M. Monti, J. Drlze, H. Giersch and R. Layard (ruly i9g6).
103
r04 EconomicPeperr
No. 48 Evolution et probllmes structurels de l'6conomie frangaise, par X. Lannes, B. Philippe et P. Lenain(ao0t 1986).
No. 49 Long run implications of the increase in taxation and public debt for employment and economic growth inEurope by G. Tullio (August 19E6).
No. 50 Consumers Expectations and Aggregate Personal Savings by Daniel Weiserbs and Peter Simmons(November 1986).
No. 51 Do after tax interest affect private consumption and savings ? Empirical evidence for 8 industrialcountries : 1970-1983 by G. Tullio and Fr. Contesso (December 1986).
No. 52 Validity and limits of applied exchange rate models : a b,rief survey of some recent contributionsby G. Tirllio @ecember 1986).
No. 53 Monetary and Exchange Rate Policies for International Financial Stability : a Proposal byRonald I. McKinnon (November 1986).
No. 54 Internal and Extemal Liberalisation for Faster Growth by Herbert Giersch (Feb,ruary 1987).
No. 55 Regulation or Deregulation of the Labour Market : Policy Regimes for the Recruitment and Dismissal ofEmployees in the Industrialised Countries by Michael Emerson (June 1987).
No. 56 Causes of the development of the private ECU and the behaviour of its interest tates :
October 1982 - September 1985 by G. Tullio and Fr. Contesso (July 1987).
No. 5? Capital/Labour substitution and its impact on employment by Fabienne Ilzkovitz (September 1987).
No. 58 The Determinrnts of the German Official Discount Rate and of Liquidity Ratios during the classicel gold
standard : 1876-1913 by Andrea Sommariva and Giuseppe Tullio (September 1987).
No. 59 Profitabilitn real interest rates and fiscal crowding out in the OECD area 1950-1985 (An examinrtion ofthe crowding out hypothesis within a portfolio model) by Jorgen Mortensen (October 1987).
No. 60 The two-handed growth strategy for Europe : Autonomy though flexible cooperation by f. Drlze'Ch. \[yplosz, Ch. Bean, Fr. Giavazzi and H. Giersch (October 1987).
No. 61 Collusive Behaviour, R & D, and European Policy by Alexis facquemin (November 1987).
No. 62 Inflatioir adjusted government budget deficits and their impact on the business cycle : empirical evidence
for 8 industrial countries by G. Tullio (November 1987).
No. 63 Monetary Policy Coordination Within the EMS : Is There a Rule ? by M. Russo and G. Titllio(April 1988).
No. 64 Lc D€couplage de la Finance et de l'Economie - Contribution I I'Evaluation des Enjeux Europdens dans
la Rdvolution du Systlme Financier International par J.-Y. Haberer (Mai 1988).
No. 65 The completion of the internal market : results of macroeconomic model simulations by M. Catinat'E. Donni and A. Italianer (September 1988).
No. 65 Europe after the crash : economic policy in an era of adjustment by Charles Bean (September 1988).
No. 67 A Survey of the Economies of Scale by Cliff Pratten (October 1988).
No. 6E Economies of Scale and Inha-Community trade by Joachim Schwalbach (October 1988).
No. 69 Economies of Scale and the Integration of the European Economy : the Case of Italy by Rodolfo Helgand Pippo Ranci (October 1988).
No. 70 The Costs of Non-Europe - An assessment based on a formal Model of Imperfect Competition and
Economies of Scale by A. Smith and A. Venables (October 1988).
No. 7l Competition and Innovation by P.A. Geroski (October 1988).
No. 72 Commerce Inba-Branche - Performances des firmes et analyse des 6changes commerciaux dans laCommunaut€ europ6enne par le Centre d'Etudes Prospectives et d'Informations Internationales de Paris(octobre 1988).
No. ?3 Partial Equilib,rium Calculations of the Impact of Internal Market Barriers in the European Communityby Richard Cawley and Michael Davenport (October 1988).
No. 74 The exchange-rate question in Europe by Francesco Giav azzi (January I 989).
Eoonomic Prpers
No. 75 The QIIEST model (Version 1988) by Peter Bekx, Anne Bucher, Alexender ltalianer, Matthias Mors(March 1989).
No. 76' Burope's Prospects for the 1990s by Herbert Giersch (May 1989)
No. 77 1992, Hype or Hope : A review by Alexander Italianer (February 1990)
No. 78 Europeen labour markets : a long nrn view (CEPS Macroeconomic Policy Group 1989 Annual Report)by I.-P. Danthine, Ch. Bean, P. Bernholz and E. Malinvaud (February 1990)
No. 79 Counhy Studles - The United Kingdom by Tassos Belessiotis and Ralph Wilkinson (July 1990)
No. 80 See "Llnderstudlen" No. 1
No. 81 Country Studlcs - The Netherlands by Filip Keereman, Frangoise Moreau and Cyriel Vanbelle(Iuly 1990)
No. 82 Country Studlcc - Belgium by fohan Baras, Filip Keereman and Frangoise Moreau (Iuly 1990)
No. 83 Completion of the internal market : An application of Public Choice Theory by Manfred Teutemann(August 1990)
No. t4 Monetary and Fiscal Rules for Public Debt Sustainability by Marco Buti (September 1990)
No. 85 Arc we at the beginning of a new long term expansion induced by technological change?,by AngeloReati (August 1991)
No. 86 Labour Mobility, Fiscal Solidarity and the Exchange Rate Regime: a Parable of European Union andCohesion, by lorge Braga de Macedo (October 1991)
No. 87 The Economics of Policies to Stabilize or Reduce Greenhouse Gas Emissions: the Case of COz,by Mathias Mors (October 1991)
No. 88 The Adequacy and Allocation of World Savings, by Iavier Santilldn (December 1991)
No. 89 Microeconomics of Saving, by Barbara Kauffmann @ecember 1991)
No. 90 Exchange Rate Policy for Eastern Europe and a Peg to the ECU, by Michael Davenport (March 1992)
105