counterproductive effect of saccadic suppression during attention shifts
TRANSCRIPT
Counterproductive Effect of Saccadic Suppression duringAttention ShiftsAlexandre Zenon1*, Brian D. Corneil2,3, Andrea Alamia1, Nabil Filali-Sadouk1, Etienne Olivier1
1 Institute of Neuroscience, University of Louvain, Brussels, Belgium, 2Departments of Physiology & Pharmacology, Psychology, Western University, London, Ontario,
Canada, 3 Robarts Research Institute, London, Ontario, Canada
Abstract
During saccadic eye movements, the processing of visual information is transiently interrupted by a mechanism known as‘‘saccadic suppression’’ [1] that is thought to ensure perceptual stability [2]. If, as proposed in the premotor theory ofattention [3], covert shifts of attention rely on sub-threshold recruitment of oculomotor circuits, then saccadic suppressionshould also occur during covert shifts. In order to test this prediction, we designed two experiments in which participantshad to orient towards a cued letter, with or without saccades. We analyzed the time course of letter identification score inan ‘‘attention’’ task performed without saccades, using the saccadic latencies measured in the ‘‘saccade’’ task as a marker ofcovert saccadic preparation. Visual conditions were identical in all tasks. In the ‘‘attention’’ task, we found a drop inperceptual performance around the predicted onset time of saccades that were never performed. Importantly, this decreasein letter identification score cannot be explained by any known mechanism aligned on cue onset such as inhibition ofreturn, masking, or microsaccades. These results show that attentional allocation triggers the same suppression mechanismsas during saccades, which is relevant during eye movements but detrimental in the context of covert orienting.
Citation: Zenon A, Corneil BD, Alamia A, Filali-Sadouk N, Olivier E (2014) Counterproductive Effect of Saccadic Suppression during Attention Shifts. PLoS ONE 9(1):e86633. doi:10.1371/journal.pone.0086633
Editor: Joy J. Geng, University of California, Davis, United States of America
Received April 2, 2013; Accepted December 16, 2013; Published January 23, 2014
Copyright: � 2014 Zenon et al. This is an open-access article distributed under the terms of the Creative Commons Attribution License, which permitsunrestricted use, distribution, and reproduction in any medium, provided the original author and source are credited.
Funding: This study was funded by Innoviris. The funders had no role in study design, data collection and analysis, decision to publish, or preparation of themanuscript.
Competing Interests: The authors have declared that no competing interests exist.
* E-mail: [email protected]
Introduction
Visual exploration is performed mostly by moving the eyes and
head in order to place the image of objects of interest onto the
fovea, the most sensitive portion of the retina. But in addition to
this overt exploration mechanism, covert visual attention allows
the selection of relevant items in the visual environment, without
moving the eyes [4]. The influential premotor theory of attention
proposed, more than 30 years ago, that the implementation of
attentional shifts results from the covert programming of a saccade
which is not executed [3]. In agreement with this view, the same
brain structures have been shown to be responsible for overt and
covert exploration mechanisms [5–7]. However, divergence occurs
in these anatomical circuits at the level of neuronal subpopulations
[8,9] and the significance of these distinct circuits for behavior
remains an area of active investigation [10–16].
During saccadic eye movements, the image projected onto the
retina is shifted, inducing a blurring, or retinal slip. We are
unaware of this motion because the perception of the movement-
induced translation of the visual image is actively suppressed by
our visual system, allowing the maintenance of perceptual stability
[17]. This mechanism depends on a transient disruption of visual
processing around the saccade onset [1], called ‘‘saccadic
suppression’’ and is commonly thought to rely, at least partly
[18], on an efference copy signal originating from oculomotor
centers [2,19].
If covert attentional shifts are actually implemented through the
sub-threshold activation of saccadic control circuits, and if the
same circuits are also responsible for the production of the
efference copy signal that leads to saccadic suppression, then
saccadic suppression may accompany covert attentional shifts.
Evidence for this would constitute strong evidence for the
functional intertwining of circuits mediating saccades and covert
attention, and would suggest that the propagation of efference
copy signals can be divorced from actual saccade execution. We
attempted to test this prediction in the present study.
We asked each of the participants to perform a cued letter
discrimination task (the ‘‘attention’’ task), a cued saccade task (the
‘‘saccade’’ task) and a ‘‘dual’’ task including both the saccade and
letter discrimination tasks (see Figure 1). Participants were strongly
encouraged to orient attention and/or gaze to the cued location,
without waiting for the letter display. In each of these three
versions of the same task, performed in different blocks, the visual
stimulation was strictly identical.
Our approach relied on the following assumption: if covert
saccadic preparation occurs during the ‘‘attention’’ task, it will
follow the same time course as the one observed in the ‘‘saccade’’
task. If this assumption is true, saccadic latencies measured in the
‘‘saccade’’ task could be used as a marker of the time course of
saccadic preparation occurring in the ‘‘attention’’ task. Measuring
performance relative to the course of this covert saccadic
preparation would then allow us to reveal saccadic suppression.
The results of the present study, obtained in two different
experiments, provide evidence consistent with this assumption,
and demonstrate that saccadic suppression persists in the absence
of overt saccade execution.
PLOS ONE | www.plosone.org 1 January 2014 | Volume 9 | Issue 1 | e86633
Experiment 1
Materials and MethodsProcedure. The present study has been conducted in
accordance with the Declaration of Helsinki and has been
approved by the local ethics committee (‘‘Commission d’ethique
biomedicale hospitalo-facultaire de l’UCL’’). Subjects provided
their written informed consent prior to participating in the study,
following a procedure sanctioned by the ethics committee. Each
participant (n = 5, 3 females, ages 19–24) performed three different
versions of the same task: the ‘‘attention’’, the ‘‘saccade’’ and the
‘‘dual’’ tasks. The visual stimulation conditions were identical in
the three versions, the only difference being the responses given by
the subject. In the ‘‘attention’’ version, participants had to report
the identity of a cued letter by typing it on a computer keyboard.
In the ‘‘saccade’’ task, they had to perform a saccade to the cued
location as quickly as possible. In the ‘‘dual’’ task condition, they
had to perform a saccade and identify the cued letter in each trial.
In both the ‘‘saccade’’ and ‘‘dual’’ tasks, participants were
specifically instructed to orient their gaze to the cue as quickly
as possible and not to wait for the display of the target letter.
Each task version was performed in blocks of 40 trials repeated
3–5 times in each session and the order of these blocks was pseudo-
randomized. Each of the participants performed 5 or 6 sessions on
different days, leading to an average of 31196417 (mean6SD)
trials per subject. At the beginning of each session, a staircase
procedure was used to adjust the luminance of the letters in order
to reach a performance of 60% in the ‘‘attention’’ task ([20], and
see below).
Participants were seated in front of a 19’’ CRT screen, running
at 100 Hz, at a distance of 58 cm, with their head sitting on a chin
rest, in a dimly lighted room. Their eye movements were recorded
by means of an Eyelink� eye tracker placed below the screen [21].
Their arms were placed on pillows in order to maintain a
comfortable position when typing on the computer keyboard.
Stimuli. Our task is shown in Fig. 1A. The task began with a
1500–1700 ms display of a fixation point at the center of the
screen. The background luminance was at 2% of the maximal
luminance of the screen. The fixation point was followed by the
display of the cue for 20 ms. The cue was composed of 12 squares
1u wide located on a virtual circle at an eccentricity of 6u from the
fixation point. The target square, used to indicate the target
location, was always red (RGB: [100%, 2%, 2%]) whereas all the
other squares were either reddish ([24%, 2%, 2%]) or of the same
color as the background ([2%, 2%, 2%]). The first condition,
corresponding to the low salience condition, led to a relatively low
contrast of the target square with respect to the other squares,
whereas the target square was very conspicuous in the second
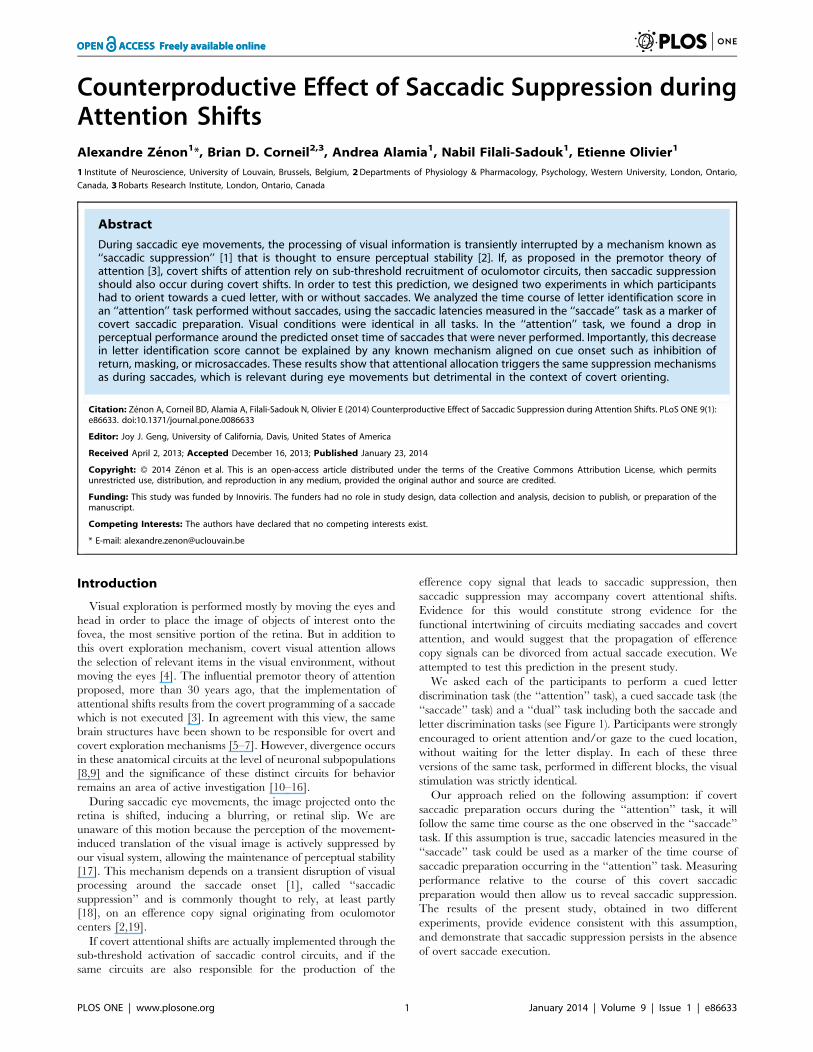
Figure 1. Task used in Experiment 1. A. Schematic depiction of the task. The delay between the cue onset and the target letter onset is called theCue-Target Onset Asynchrony (CTOA), whereas the delay between letter onset and saccade onset is called the Target-Saccade Onset Asynchrony(TSOA). TSOA equals the CTOA minus the saccade latency and is therefore highly correlated with CTOA. B. Saccadic latencies in the ‘‘saccade’’ taskversus the ‘‘dual’’ task: the 1 to 100 latency percentiles in the ‘‘saccade’’ task are plotted against the 1 to 100 latency percentiles in the ‘‘dual’’ task. Allsubjects but subject nu5 are close to the equivalency line (gray dotted line). In addition, subject nu5 had longer latencies than other subjects.doi:10.1371/journal.pone.0086633.g001
Saccadic Suppression during Attention Shifts
PLOS ONE | www.plosone.org 2 January 2014 | Volume 9 | Issue 1 | e86633
condition, corresponding to the high salience condition. In the
‘‘saccade’’ and ‘‘dual’’ task conditions, subjects had to perform a
saccade to the target cue as quickly as possible. Following the cue,
after a variable delay during which only the fixation point was
displayed, letters were displayed for 20 ms at the 12 locations
corresponding to the location of the squares displayed during the
cue epoch. The letter displayed at the location of the target square
was the letter that the participants were asked to report in the
‘‘attention’’ and the ‘‘dual’’ tasks. The delay between the offset of
the cue and the onset of the target, or cue-target onset asynchrony
(CTOA), was either 10, 40, 80, 120 or 160 ms.
The displayed letters were all different and were chosen
randomly in the Latin alphabet, except the letter M and X,
which were never used (as told to the participants at the beginning
of the experiment). Letters were followed by a series of 2 masks.
The first mask, displayed for 10 ms encompassed the whole screen
and consisted of Gaussian noise. The second mask consisted of the
superimposition of the letters M and X and the number ‘‘8’’,
displayed at each of the 12 locations where letters were displayed
and lasted until the subject typed the letter on the keyboard
(‘‘attention’’ and ‘‘dual’’ tasks) or for a maximum of 1000 ms.
The staircase procedure, performed at the beginning of each
session, used the same visual stimulation conditions. The CTOA
delay was always 120 ms and the salience of the cue was always
high. The luminance obtained through this staircase procedure
(31612% of the screen maximal luminance, mean6SD), leading
to a performance of the subject in the letter discrimination task of
around 60%, was used for the remaining of the session.
Microsaccade detection. We identified microsaccades using
a similar method as described by [22]. In all subjects, movement
amplitude was strongly correlated with movement velocity,
confirming the saccadic nature of the eye movements (‘‘main
sequence’’, all p values ,.0001). The amplitude ranged from
about.1 to 2 degrees.
Analysis. In order to assess the effect of Target-Saccade
Onset Asynchrony (TSOA) on performance in the ‘‘dual’’ task, we
first sorted all trials in increasing order of TSOA, then binned the
trials by groups of 20. We then fitted two different functions on
these performance data. One consisted of a logistic-transformed
linear regression with 3 parameters a, b and c: and was called the
‘‘attention fit’’ model. The other was the product of 2 such logistic-
transformed linear regressions , had 5 parameters a, b, c, d, and e,
and was called the ‘‘attention and suppression fit’’ model. The first
function is monotonic and was used to model only the effect of
attention being progressively allocated to the cue. This function
does not model the suppression effect which occurs close to
saccade onset. In contrast, the second function is not monotonic
and takes into account both the performance increase induced by
progressive attentional allocation and the later decrease observed
when the letter display was close to saccade onset.
For the ‘‘attention’’ task, TSOA values were estimated from the
latencies measured during the ‘‘saccade’’ task of the same session,
in the corresponding salience, CTOA and position condition,
leading to 4 trials per data point. We then binned the data in the
same way as with the ‘‘dual’’ task (20 trials per bin) and fitted the
two models described above.
Fitting was performed using a non-linear regression based using
least squares estimation (nlinfit in Matlab�). Residuals were
systematically inspected, ensuring the normality of their distribu-
tion and the absence of any systematic relation with fitted values.
Comparison between the two models was performed by comput-
ing the Bayes Factor on the basis of the proportion of variance
explained [23]. We also compared the ‘‘attention and suppres-
sion’’ model fitted on the ‘‘attention’’ performance data as
described above with the same analyses conducted on shuffled
TSOA data, repeated 1000 times (bootstrap method). This
comparison was made by looking at the distribution of the
difference in proportion of variance explained between the real
and shuffled data. A distribution of such differences significantly
larger than zero, as assessed by a Student t-test was considered as a
proof that the non-shuffled TSOA data provided more informa-
tion than the shuffled data, thus allowing to predict better the letter
discrimination performance. Analyses were performed both
subject-by-subject and on the 4-subject population altogether,
then including a subject random factor.
ResultsComparison of the performance in the ‘‘attention’’,
‘‘saccade’’ and ‘‘dual’’ tasks. In order to be able to use the
saccadic latencies measured in the ‘‘saccade’’ task as a potential
estimate of the covert saccadic preparation time in the ‘‘attention’’
task, we first had to make sure that these two tasks were performed
similarly. In order to demonstrate this, we compared 1) the
saccadic latencies in the ‘‘dual’’ and ‘‘saccade’’ tasks and 2) the
discrimination performance in the ‘‘dual’’ and ‘‘attention’’ tasks.
We tested each of the 5 subjects separately and found that only
one of them showed a significant difference in saccadic latency
distribution (log-transformed) between the ‘‘attention’’ and ‘‘sac-
cade’’ tasks, on the one hand, and the ‘‘dual’’ task, on the other
hand (subject nu5, see Fig. 1 B). We also tested for each subject
whether the effect of the different task conditions on performance
differed between the ‘‘dual’’ and the ‘‘attention’’ or ‘‘saccade’’
tasks (3-way ANOVA with Cue-Target Onset Asynchrony or
CTOA, salience and task version as independent variables and
either letter discrimination rate or log saccade latencies as
dependent variables). Here again, only subject nu5 showed a
significant interaction between the task factor and the other factors
(p,0.05). These idiosyncrasies can be partly explained by the lack
of compliance of subject nu5 to the instructions regarding the
necessity not to wait for the target appearance before making a
saccade. As a consequence, we did not include this subject in the
analyses described hereafter in this paper.
The 3-way ANOVA described above allowed us to assess also
the effect of CTOA on saccade latencies. We found that, in 2 of
the subjects, CTOA condition affected latencies significantly
(p,.05), with longer CTOAs leading to longer latencies. However,
this was true in both the ‘‘dual’’ and the ‘‘saccade’’ tasks
(TASK6CTOA interaction, all p values ..1). The fact that this
effect was also present in the ‘‘saccade’’ task indicates that it was
not due to the subjects waiting for the letter display to initiate the
saccade. Therefore, we expected this effect not to impact on our
results in the set of analyses described below.
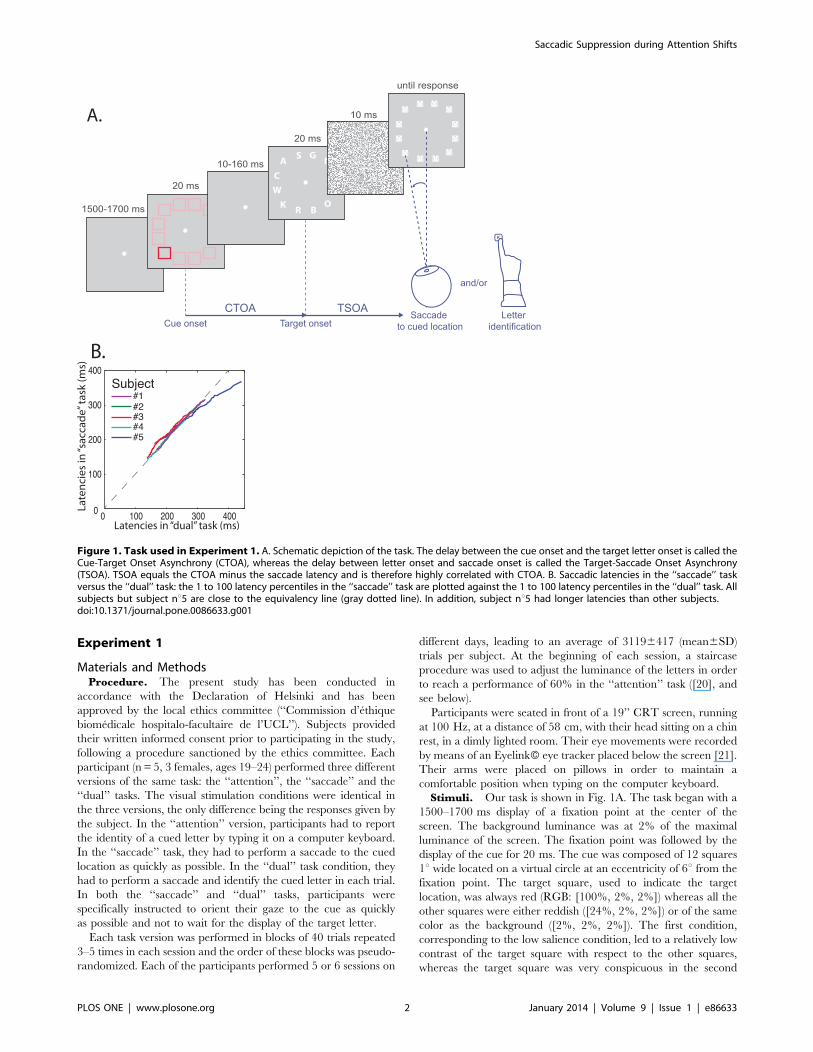
Time course of attentional allocation in the ‘‘dual’’
task. We found that performance was low for early CTOA
conditions and increased with larger CTOA values (see Figure 2),
indicating that, following cue onset, spatial attention was
progressively allocated to the cue. However, we were mostly
interested in the time course of attentional allocation as a function
of saccade onset. In order to investigate this particular aspect of
attentional time course, we looked at the letter discrimination
performance as a function of TSOA (see Fig. 1A). These analyses,
which were performed on data from the ‘‘dual’’ task requiring
both letter detection and an overt saccade, are illustrated in the left
half of Fig. 3. The position of each grey data point on the Y-axis
indicates the average performance in 20 trials and its position on
the abscissa corresponds to the average TSOA for these trials. We
compared 2 different models (see Methods) and found that, on the
4-subject population as a whole, the model accounting the best for
Saccadic Suppression during Attention Shifts
PLOS ONE | www.plosone.org 3 January 2014 | Volume 9 | Issue 1 | e86633
the data was the one taking account of the performance decrease
close to saccade onset (‘‘attention and suppression’’ model,
illustrated in red in Figure 3A, Bayes factors (BF) superior to
1010 when compared to the simpler ‘‘attention’’ model, shown in
green in Fig. 3D). The parameters corresponding to the increasing
and decreasing slopes of this function were both significantly
different from zero (see Methods, confidence interval (CI) for
parameters a: [0.0275 0.1290] and d: [20.0525 20.0254],
alpha = .05). This shows that discrimination performance changed
with TSOA in two ways. First, it increased as attention was
progressively allocated to the cue, at TSOAs going from low values
(corresponding to short CTOAs) to about 2100 ms (see Fig. 3A).
Second, it decreased as the target letter got displayed closer to the
time of saccadic onset, with TSOAs getting closer to zero.
We also performed the same analysis subject by subject. In each
subject, we also found that the ‘‘attention and suppression’’ model
was favored over the simpler ‘‘attention’’ model. We found very
strong evidence in one subject (BF equal to 3314), positive
evidence in 2 (BF equal to 6.15 and 14.92) and only weak evidence
in 1 (BF equal to 1.7). The fitted curves obtained are shown in red
(‘‘attention and suppression’’ model) and green (‘‘attention’’
model) in Figure 3B (subject #1).
Because TSOA and CTOA are strongly correlated with each
other (TSOA = CTOA-saccadic latency), it is difficult to determine
which of the two parameters influences perceptual performance
the most. In order to determine whether TSOA was really more
informative that CTOA to predict attention time course, we fitted
the ‘‘attention and suppression’’ model to the data after having
shuffled the saccade latencies. We performed this analysis 1000
times and compared the proportion of variance explained in each
of these fits with the proportion of variance explained with the
non-shuffled data. In each subject the proportion of variance
explained was superior in the non-shuffled data and this difference
was highly significant (Wilcoxon signed rank test, all p values
,.0001). The average of the 1000 fitted curves obtained on the
shuffled data for each subjects is shown in blue in Figure 3C.
Figure 2. Performance in letter discrimination as a function of CTOA condition for each subject in the ‘‘dual’’ task (left half of thefigure) and the ‘‘attention’’ task (right half of the figure). Each dot corresponds to a group of 2 blocks in the low (in green) or high (in blue)salience condition. The black curves indicate the means irrespective of salience condition.doi:10.1371/journal.pone.0086633.g002
Saccadic Suppression during Attention Shifts
PLOS ONE | www.plosone.org 4 January 2014 | Volume 9 | Issue 1 | e86633
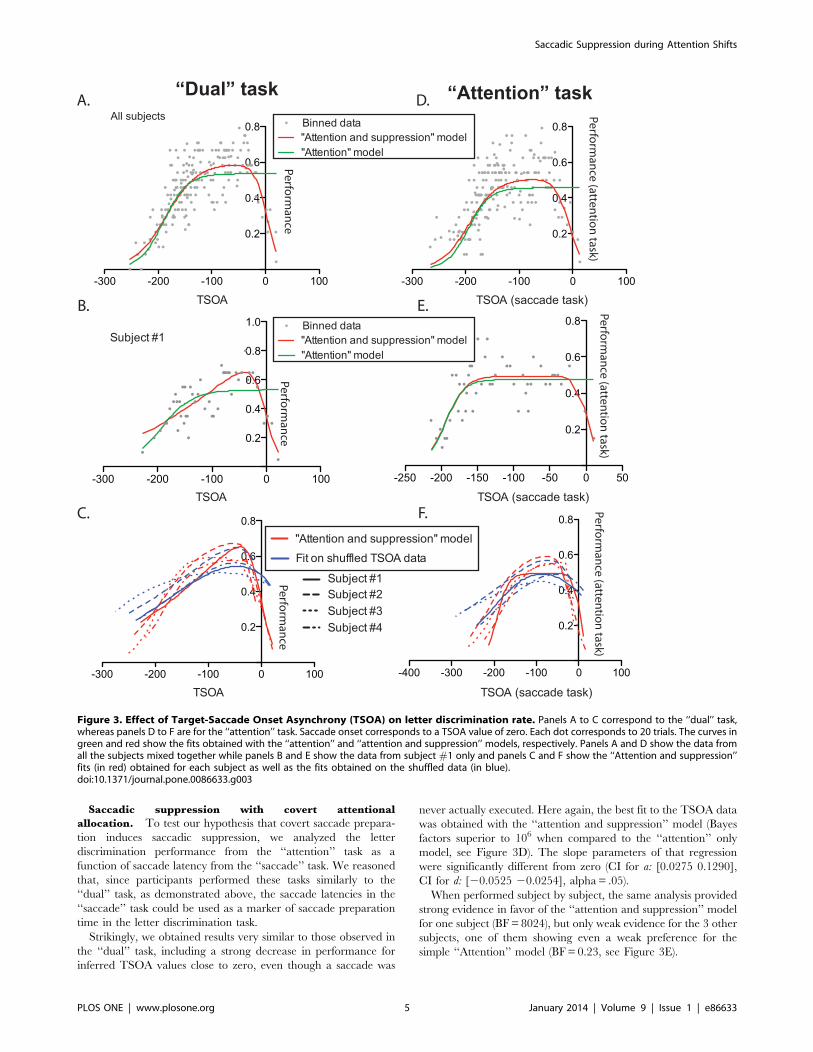
Saccadic suppression with covert attentional
allocation. To test our hypothesis that covert saccade prepara-
tion induces saccadic suppression, we analyzed the letter
discrimination performance from the ‘‘attention’’ task as a
function of saccade latency from the ‘‘saccade’’ task. We reasoned
that, since participants performed these tasks similarly to the
‘‘dual’’ task, as demonstrated above, the saccade latencies in the
‘‘saccade’’ task could be used as a marker of saccade preparation
time in the letter discrimination task.
Strikingly, we obtained results very similar to those observed in
the ‘‘dual’’ task, including a strong decrease in performance for
inferred TSOA values close to zero, even though a saccade was
never actually executed. Here again, the best fit to the TSOA data
was obtained with the ‘‘attention and suppression’’ model (Bayes
factors superior to 106 when compared to the ‘‘attention’’ only
model, see Figure 3D). The slope parameters of that regression
were significantly different from zero (CI for a: [0.0275 0.1290],
CI for d: [20.0525 20.0254], alpha = .05).
When performed subject by subject, the same analysis provided
strong evidence in favor of the ‘‘attention and suppression’’ model
for one subject (BF = 8024), but only weak evidence for the 3 other
subjects, one of them showing even a weak preference for the
simple ‘‘Attention’’ model (BF = 0.23, see Figure 3E).
Figure 3. Effect of Target-Saccade Onset Asynchrony (TSOA) on letter discrimination rate. Panels A to C correspond to the ‘‘dual’’ task,whereas panels D to F are for the ‘‘attention’’ task. Saccade onset corresponds to a TSOA value of zero. Each dot corresponds to 20 trials. The curves ingreen and red show the fits obtained with the ‘‘attention’’ and ‘‘attention and suppression’’ models, respectively. Panels A and D show the data fromall the subjects mixed together while panels B and E show the data from subject #1 only and panels C and F show the ‘‘Attention and suppression’’fits (in red) obtained for each subject as well as the fits obtained on the shuffled data (in blue).doi:10.1371/journal.pone.0086633.g003
Saccadic Suppression during Attention Shifts
PLOS ONE | www.plosone.org 5 January 2014 | Volume 9 | Issue 1 | e86633
In order to ensure that the saccade latency gathered in the
‘‘saccade’’ task really provided information that helped to take into
account the variance of the performance, we repeated the same
analysis as above but after shuffling the TSOA data within each
subject. The fit obtained from the average coefficients of these
1000 non-linear regressions are shown in blue in Figure 3F. A
Wilcoxon signed rank test confirmed that for each subject, these
distributions differed from zero (p,.0001), confirming that the
saccadic latencies obtained in the ‘‘saccade’’ task helped signifi-
cantly in predicting the performance time course during the
‘‘attention’’ task.
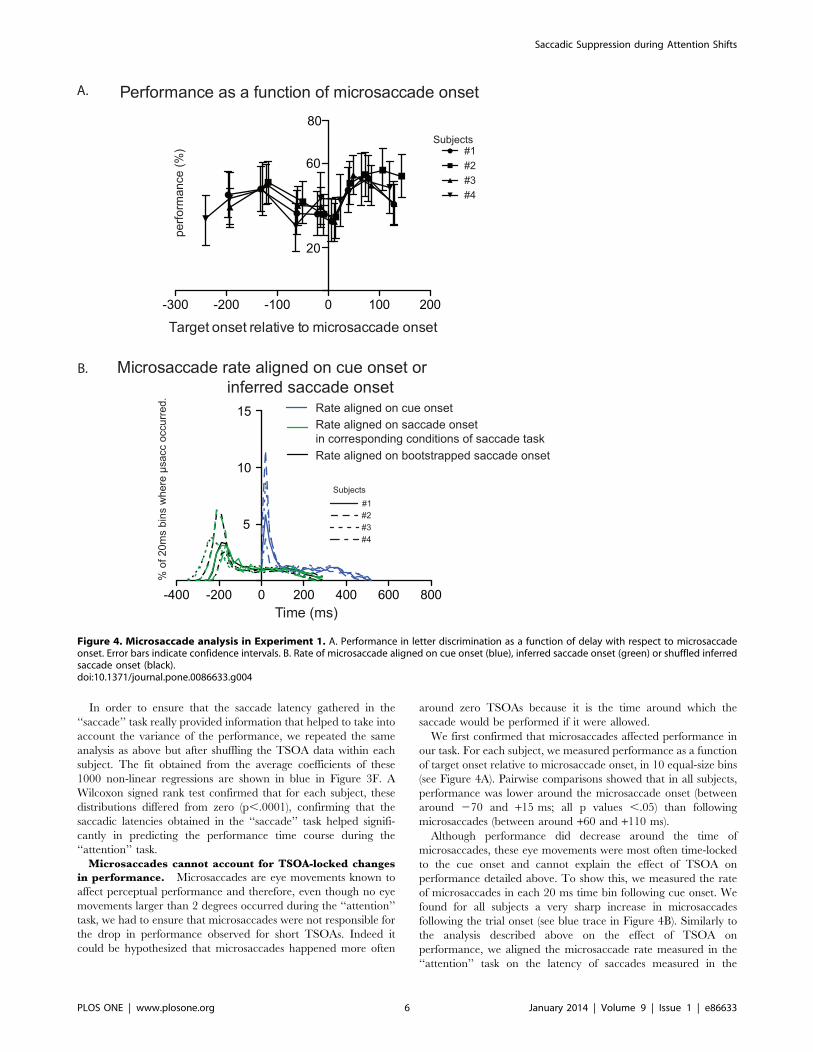
Microsaccades cannot account for TSOA-locked changes
in performance. Microsaccades are eye movements known to
affect perceptual performance and therefore, even though no eye
movements larger than 2 degrees occurred during the ‘‘attention’’
task, we had to ensure that microsaccades were not responsible for
the drop in performance observed for short TSOAs. Indeed it
could be hypothesized that microsaccades happened more often
around zero TSOAs because it is the time around which the
saccade would be performed if it were allowed.
We first confirmed that microsaccades affected performance in
our task. For each subject, we measured performance as a function
of target onset relative to microsaccade onset, in 10 equal-size bins
(see Figure 4A). Pairwise comparisons showed that in all subjects,
performance was lower around the microsaccade onset (between
around 270 and +15 ms; all p values ,.05) than following
microsaccades (between around +60 and +110 ms).
Although performance did decrease around the time of
microsaccades, these eye movements were most often time-locked
to the cue onset and cannot explain the effect of TSOA on
performance detailed above. To show this, we measured the rate
of microsaccades in each 20 ms time bin following cue onset. We
found for all subjects a very sharp increase in microsaccades
following the trial onset (see blue trace in Figure 4B). Similarly to
the analysis described above on the effect of TSOA on
performance, we aligned the microsaccade rate measured in the
‘‘attention’’ task on the latency of saccades measured in the
Figure 4. Microsaccade analysis in Experiment 1. A. Performance in letter discrimination as a function of delay with respect to microsaccadeonset. Error bars indicate confidence intervals. B. Rate of microsaccade aligned on cue onset (blue), inferred saccade onset (green) or shuffled inferredsaccade onset (black).doi:10.1371/journal.pone.0086633.g004
Saccadic Suppression during Attention Shifts
PLOS ONE | www.plosone.org 6 January 2014 | Volume 9 | Issue 1 | e86633
‘‘saccade’’ task (green trace in Figure 4B) or on the shuffled
latencies (black trace in Figure 4B). The striking similarity of the
green and black curves indicates that taking into account saccade
latency in the ‘‘saccade’’ task does not add any relevant
information and that microsaccade rate is affected by cue onset
rather than covert saccadic preparation.
Importantly, these results confirm that the drop in performance
observed for TSOAs close to zero cannot be explained by the
occurrence of an eye movement before or during the letter display.
Effect of TSOA within each CTOA condition. We have
described up to now the time course of perceptual performance
aligned on saccade onset (actual or inferred). However, as
mentioned above, we had to ensure that the effects of TSOA we
observed on perceptual performance were not caused by changes
in performance depending on the delay with respect to the onset of
the cue, i.e. as a function of CTOA (see Fig. 1A). Multiple
regressions are sometimes used to disentangle such correlated
explanatory variables. However, we didn’t apply this method to
our data because the correlations were too high (Variance
Inflation Factors ranged between 2.4 and 3.29, [44]), the effects
were not linear and the results of a multiple regression would not
necessarily help us in confirming or refuting the existence of a
saccadic suppression phenomenon.
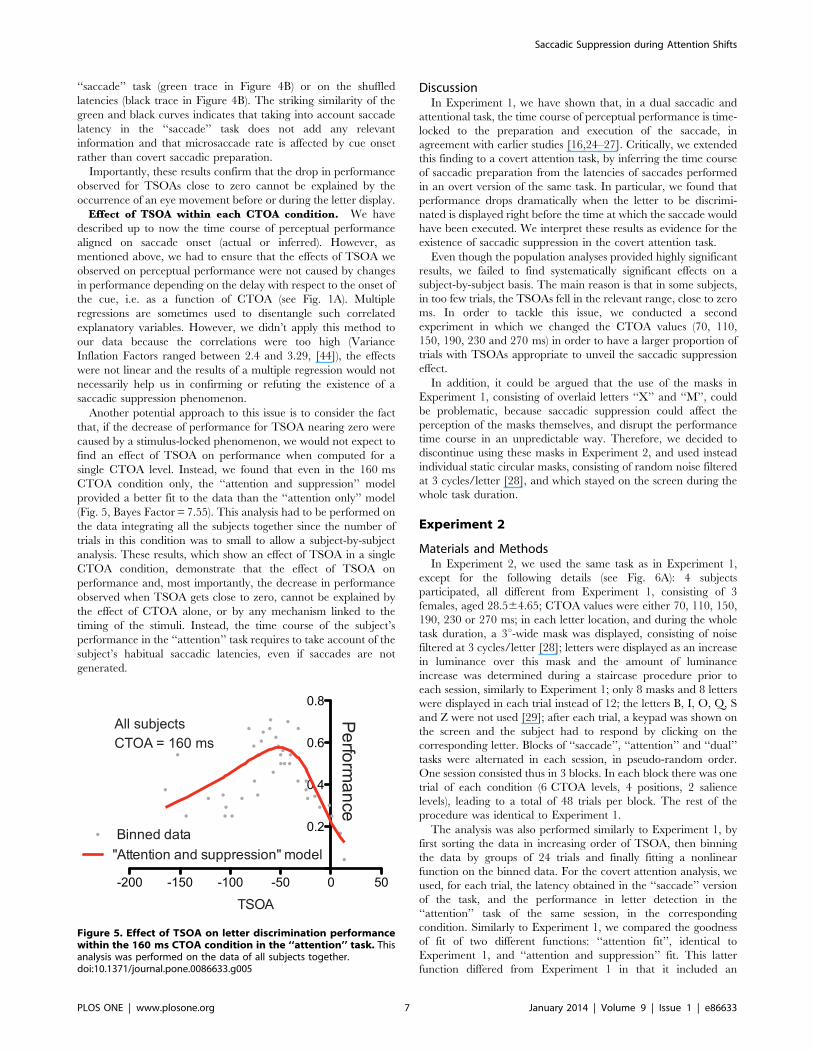
Another potential approach to this issue is to consider the fact
that, if the decrease of performance for TSOA nearing zero were
caused by a stimulus-locked phenomenon, we would not expect to
find an effect of TSOA on performance when computed for a
single CTOA level. Instead, we found that even in the 160 ms
CTOA condition only, the ‘‘attention and suppression’’ model
provided a better fit to the data than the ‘‘attention only’’ model
(Fig. 5, Bayes Factor = 7.55). This analysis had to be performed on
the data integrating all the subjects together since the number of
trials in this condition was to small to allow a subject-by-subject
analysis. These results, which show an effect of TSOA in a single
CTOA condition, demonstrate that the effect of TSOA on
performance and, most importantly, the decrease in performance
observed when TSOA gets close to zero, cannot be explained by
the effect of CTOA alone, or by any mechanism linked to the
timing of the stimuli. Instead, the time course of the subject’s
performance in the ‘‘attention’’ task requires to take account of the
subject’s habitual saccadic latencies, even if saccades are not
generated.
DiscussionIn Experiment 1, we have shown that, in a dual saccadic and
attentional task, the time course of perceptual performance is time-
locked to the preparation and execution of the saccade, in
agreement with earlier studies [16,24–27]. Critically, we extended
this finding to a covert attention task, by inferring the time course
of saccadic preparation from the latencies of saccades performed
in an overt version of the same task. In particular, we found that
performance drops dramatically when the letter to be discrimi-
nated is displayed right before the time at which the saccade would
have been executed. We interpret these results as evidence for the
existence of saccadic suppression in the covert attention task.
Even though the population analyses provided highly significant
results, we failed to find systematically significant effects on a
subject-by-subject basis. The main reason is that in some subjects,
in too few trials, the TSOAs fell in the relevant range, close to zero
ms. In order to tackle this issue, we conducted a second
experiment in which we changed the CTOA values (70, 110,
150, 190, 230 and 270 ms) in order to have a larger proportion of
trials with TSOAs appropriate to unveil the saccadic suppression
effect.
In addition, it could be argued that the use of the masks in
Experiment 1, consisting of overlaid letters ‘‘X’’ and ‘‘M’’, could
be problematic, because saccadic suppression could affect the
perception of the masks themselves, and disrupt the performance
time course in an unpredictable way. Therefore, we decided to
discontinue using these masks in Experiment 2, and used instead
individual static circular masks, consisting of random noise filtered
at 3 cycles/letter [28], and which stayed on the screen during the
whole task duration.
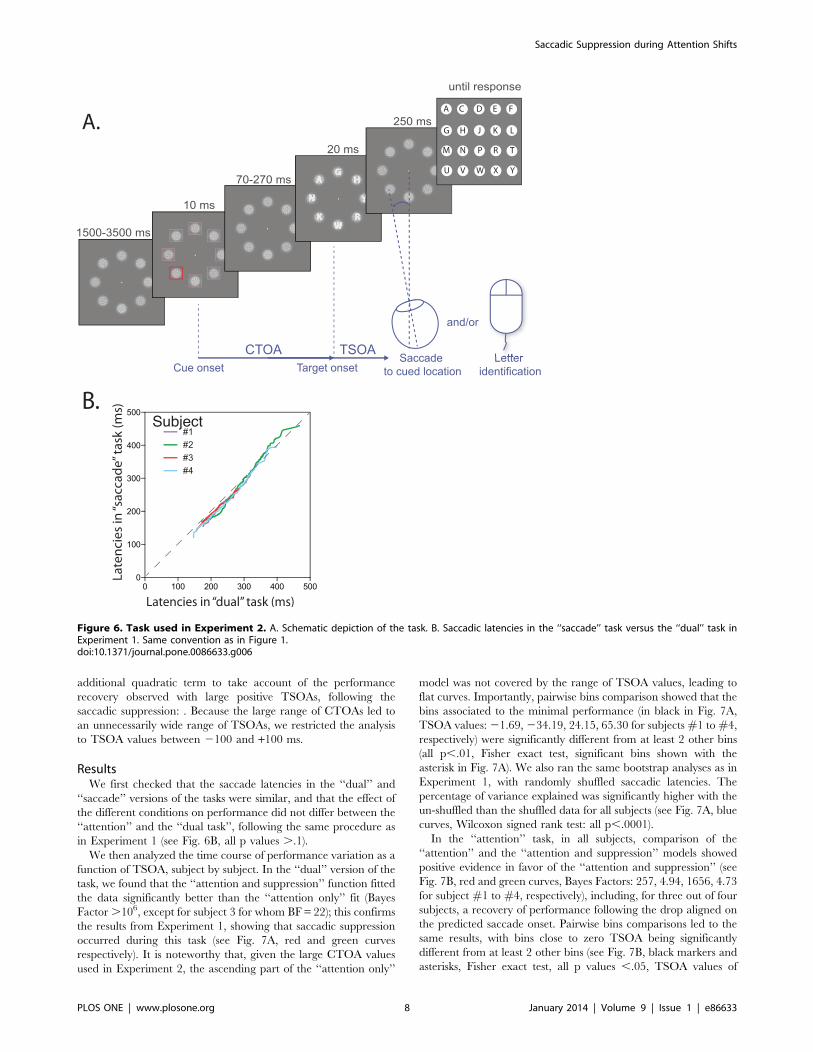
Experiment 2
Materials and MethodsIn Experiment 2, we used the same task as in Experiment 1,
except for the following details (see Fig. 6A): 4 subjects
participated, all different from Experiment 1, consisting of 3
females, aged 28.564.65; CTOA values were either 70, 110, 150,
190, 230 or 270 ms; in each letter location, and during the whole
task duration, a 3u-wide mask was displayed, consisting of noise
filtered at 3 cycles/letter [28]; letters were displayed as an increase
in luminance over this mask and the amount of luminance
increase was determined during a staircase procedure prior to
each session, similarly to Experiment 1; only 8 masks and 8 letters
were displayed in each trial instead of 12; the letters B, I, O, Q, S
and Z were not used [29]; after each trial, a keypad was shown on
the screen and the subject had to respond by clicking on the
corresponding letter. Blocks of ‘‘saccade’’, ‘‘attention’’ and ‘‘dual’’
tasks were alternated in each session, in pseudo-random order.
One session consisted thus in 3 blocks. In each block there was one
trial of each condition (6 CTOA levels, 4 positions, 2 salience
levels), leading to a total of 48 trials per block. The rest of the
procedure was identical to Experiment 1.
The analysis was also performed similarly to Experiment 1, by
first sorting the data in increasing order of TSOA, then binning
the data by groups of 24 trials and finally fitting a nonlinear
function on the binned data. For the covert attention analysis, we
used, for each trial, the latency obtained in the ‘‘saccade’’ version
of the task, and the performance in letter detection in the
‘‘attention’’ task of the same session, in the corresponding
condition. Similarly to Experiment 1, we compared the goodness
of fit of two different functions: ‘‘attention fit’’, identical to
Experiment 1, and ‘‘attention and suppression’’ fit. This latter
function differed from Experiment 1 in that it included an
Figure 5. Effect of TSOA on letter discrimination performancewithin the 160 ms CTOA condition in the ‘‘attention’’ task. Thisanalysis was performed on the data of all subjects together.doi:10.1371/journal.pone.0086633.g005
Saccadic Suppression during Attention Shifts
PLOS ONE | www.plosone.org 7 January 2014 | Volume 9 | Issue 1 | e86633
additional quadratic term to take account of the performance
recovery observed with large positive TSOAs, following the
saccadic suppression: . Because the large range of CTOAs led to
an unnecessarily wide range of TSOAs, we restricted the analysis
to TSOA values between 2100 and +100 ms.
ResultsWe first checked that the saccade latencies in the ‘‘dual’’ and
‘‘saccade’’ versions of the tasks were similar, and that the effect of
the different conditions on performance did not differ between the
‘‘attention’’ and the ‘‘dual task’’, following the same procedure as
in Experiment 1 (see Fig. 6B, all p values ..1).
We then analyzed the time course of performance variation as a
function of TSOA, subject by subject. In the ‘‘dual’’ version of the
task, we found that the ‘‘attention and suppression’’ function fitted
the data significantly better than the ‘‘attention only’’ fit (Bayes
Factor .106, except for subject 3 for whom BF = 22); this confirms
the results from Experiment 1, showing that saccadic suppression
occurred during this task (see Fig. 7A, red and green curves
respectively). It is noteworthy that, given the large CTOA values
used in Experiment 2, the ascending part of the ‘‘attention only’’
model was not covered by the range of TSOA values, leading to
flat curves. Importantly, pairwise bins comparison showed that the
bins associated to the minimal performance (in black in Fig. 7A,
TSOA values: 21.69, 234.19, 24.15, 65.30 for subjects #1 to #4,
respectively) were significantly different from at least 2 other bins
(all p,.01, Fisher exact test, significant bins shown with the
asterisk in Fig. 7A). We also ran the same bootstrap analyses as in
Experiment 1, with randomly shuffled saccadic latencies. The
percentage of variance explained was significantly higher with the
un-shuffled than the shuffled data for all subjects (see Fig. 7A, blue
curves, Wilcoxon signed rank test: all p,.0001).
In the ‘‘attention’’ task, in all subjects, comparison of the
‘‘attention’’ and the ‘‘attention and suppression’’ models showed
positive evidence in favor of the ‘‘attention and suppression’’ (see
Fig. 7B, red and green curves, Bayes Factors: 257, 4.94, 1656, 4.73
for subject #1 to #4, respectively), including, for three out of four
subjects, a recovery of performance following the drop aligned on
the predicted saccade onset. Pairwise bins comparisons led to the
same results, with bins close to zero TSOA being significantly
different from at least 2 other bins (see Fig. 7B, black markers and
asterisks, Fisher exact test, all p values ,.05, TSOA values of
Figure 6. Task used in Experiment 2. A. Schematic depiction of the task. B. Saccadic latencies in the ‘‘saccade’’ task versus the ‘‘dual’’ task inExperiment 1. Same convention as in Figure 1.doi:10.1371/journal.pone.0086633.g006
Saccadic Suppression during Attention Shifts
PLOS ONE | www.plosone.org 8 January 2014 | Volume 9 | Issue 1 | e86633
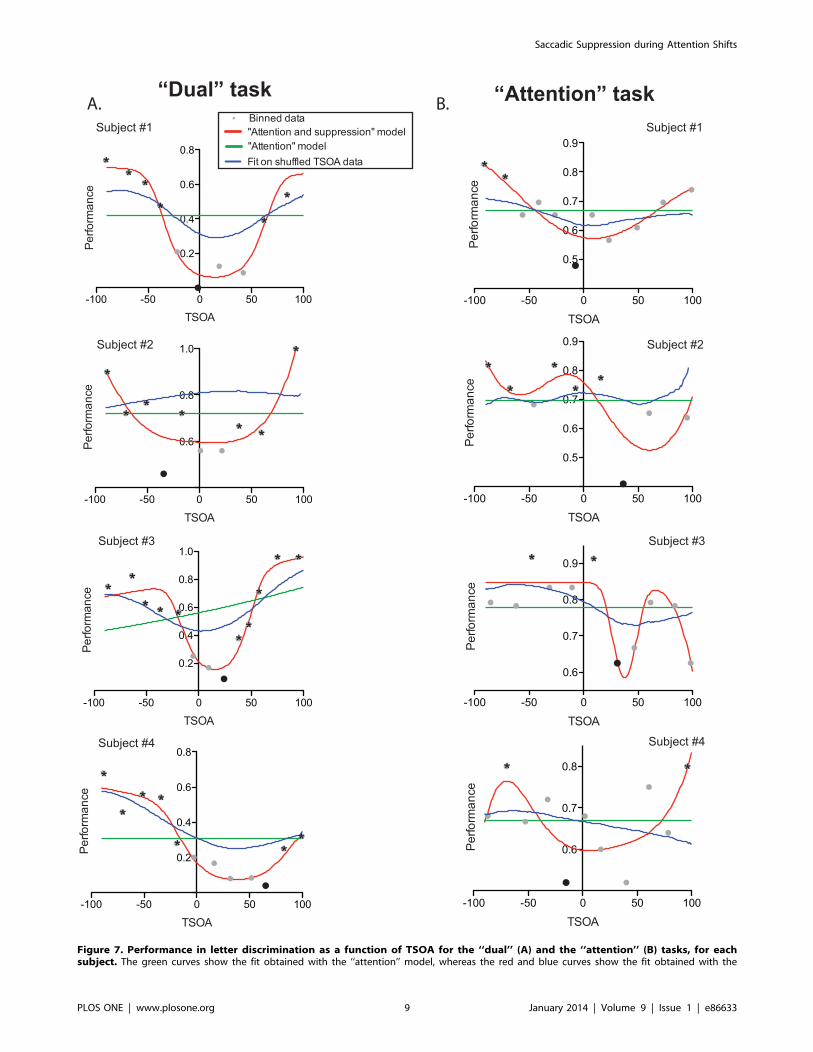
Figure 7. Performance in letter discrimination as a function of TSOA for the ‘‘dual’’ (A) and the ‘‘attention’’ (B) tasks, for eachsubject. The green curves show the fit obtained with the ‘‘attention’’ model, whereas the red and blue curves show the fit obtained with the
Saccadic Suppression during Attention Shifts
PLOS ONE | www.plosone.org 9 January 2014 | Volume 9 | Issue 1 | e86633
minimal bins: 27.46, 36.39, 30.91, 215.39). The comparison of
the fits obtained with the actual data and with the shuffled data
showed that the percentage of variance explained with the actual
data was significantly higher in all subjects (see Fig. 7B, blue
curves, Wilcoxon rank sum test: all p,.0001).
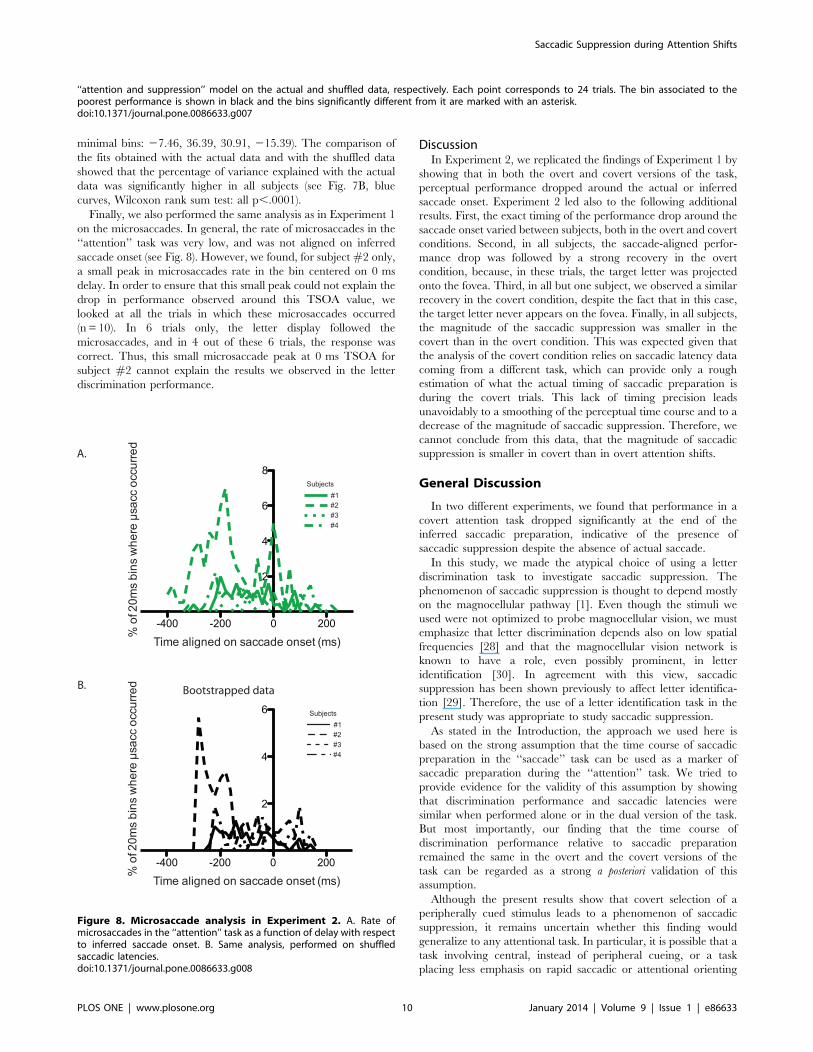
Finally, we also performed the same analysis as in Experiment 1
on the microsaccades. In general, the rate of microsaccades in the
‘‘attention’’ task was very low, and was not aligned on inferred
saccade onset (see Fig. 8). However, we found, for subject #2 only,
a small peak in microsaccades rate in the bin centered on 0 ms
delay. In order to ensure that this small peak could not explain the
drop in performance observed around this TSOA value, we
looked at all the trials in which these microsaccades occurred
(n = 10). In 6 trials only, the letter display followed the
microsaccades, and in 4 out of these 6 trials, the response was
correct. Thus, this small microsaccade peak at 0 ms TSOA for
subject #2 cannot explain the results we observed in the letter
discrimination performance.
DiscussionIn Experiment 2, we replicated the findings of Experiment 1 by
showing that in both the overt and covert versions of the task,
perceptual performance dropped around the actual or inferred
saccade onset. Experiment 2 led also to the following additional
results. First, the exact timing of the performance drop around the
saccade onset varied between subjects, both in the overt and covert
conditions. Second, in all subjects, the saccade-aligned perfor-
mance drop was followed by a strong recovery in the overt
condition, because, in these trials, the target letter was projected
onto the fovea. Third, in all but one subject, we observed a similar
recovery in the covert condition, despite the fact that in this case,
the target letter never appears on the fovea. Finally, in all subjects,
the magnitude of the saccadic suppression was smaller in the
covert than in the overt condition. This was expected given that
the analysis of the covert condition relies on saccadic latency data
coming from a different task, which can provide only a rough
estimation of what the actual timing of saccadic preparation is
during the covert trials. This lack of timing precision leads
unavoidably to a smoothing of the perceptual time course and to a
decrease of the magnitude of saccadic suppression. Therefore, we
cannot conclude from this data, that the magnitude of saccadic
suppression is smaller in covert than in overt attention shifts.
General Discussion
In two different experiments, we found that performance in a
covert attention task dropped significantly at the end of the
inferred saccadic preparation, indicative of the presence of
saccadic suppression despite the absence of actual saccade.
In this study, we made the atypical choice of using a letter
discrimination task to investigate saccadic suppression. The
phenomenon of saccadic suppression is thought to depend mostly
on the magnocellular pathway [1]. Even though the stimuli we
used were not optimized to probe magnocellular vision, we must
emphasize that letter discrimination depends also on low spatial
frequencies [28] and that the magnocellular vision network is
known to have a role, even possibly prominent, in letter
identification [30]. In agreement with this view, saccadic
suppression has been shown previously to affect letter identifica-
tion [29]. Therefore, the use of a letter identification task in the
present study was appropriate to study saccadic suppression.
As stated in the Introduction, the approach we used here is
based on the strong assumption that the time course of saccadic
preparation in the ‘‘saccade’’ task can be used as a marker of
saccadic preparation during the ‘‘attention’’ task. We tried to
provide evidence for the validity of this assumption by showing
that discrimination performance and saccadic latencies were
similar when performed alone or in the dual version of the task.
But most importantly, our finding that the time course of
discrimination performance relative to saccadic preparation
remained the same in the overt and the covert versions of the
task can be regarded as a strong a posteriori validation of this
assumption.
Although the present results show that covert selection of a
peripherally cued stimulus leads to a phenomenon of saccadic
suppression, it remains uncertain whether this finding would
generalize to any attentional task. In particular, it is possible that a
task involving central, instead of peripheral cueing, or a task
placing less emphasis on rapid saccadic or attentional orienting
‘‘attention and suppression’’ model on the actual and shuffled data, respectively. Each point corresponds to 24 trials. The bin associated to thepoorest performance is shown in black and the bins significantly different from it are marked with an asterisk.doi:10.1371/journal.pone.0086633.g007
Figure 8. Microsaccade analysis in Experiment 2. A. Rate ofmicrosaccades in the ‘‘attention’’ task as a function of delay with respectto inferred saccade onset. B. Same analysis, performed on shuffledsaccadic latencies.doi:10.1371/journal.pone.0086633.g008
Saccadic Suppression during Attention Shifts
PLOS ONE | www.plosone.org 10 January 2014 | Volume 9 | Issue 1 | e86633
would lead to different results. Indeed, tasks involving central cues
have been shown to lead to perceptual improvements around the
time of saccadic onset in dual tasks [12,25,31]. However, these
results were based on data having a lower temporal resolution than
the present study, and therefore might have failed to encompass
the time window where saccadic suppression occurs. Further work
will thus be needed to determine whether saccadic suppression in
covert orienting task is specific to peripheral cueing.
The present results have several important implications. First,
they show that instead of consisting of a monotonic increase of
perceptual performance, attentional allocation leads to a more
complex time course, with an initial increase followed by a later
decrease in performance. Crucially, this performance decrease
depends on the timing of the saccade preparation and not simply
on the delay following cue presentation. Therefore, all possible
alternative explanations of our results relying solely on stimulus-
locked phenomena, such as inhibition of return [32], the time
course of the sustained component of attention [33], or visual
masking [34,35] can be ruled out. In fact, it is possible that some of
these stimulus-locked phenomena may be partly caused by the
saccadic suppression mechanisms observed in the present study.
Testing this intriguing possibility would require different experi-
ments involving non-informative cues in addition to informative
ones, longer delays following cue onset and the assessment of
reaction times in addition to accuracy.
A second significant consequence of the present results is that
they show that saccadic suppression does not depend on processes
related to the execution of the saccade, but are already triggered
during saccadic preparation. This is especially relevant in the
context of another ongoing debate regarding the role of backward
masking in saccadic suppression [18,36–38,43]. The observation
of a comparable effect of saccadic suppression in the presence or
absence of actual saccade execution shows that, at least in the
present task, the efference copy signal is the most significant drive
of the saccadic suppression and that backward masking plays only
a minor role.
Finally, the third important implication of the present study is
with regard to the interaction of the brain circuits involved in the
control of eye movements and covert attention. Whereas the
existence of an overlap between these brain structures is no longer
questioned [11], most of the debate is now focused on the stage at
which these circuits diverge at the level of neuron subpopulations
and on the precise role these circuits play in behavior
[8,9,13,14,39,40]. The present results imply that the neurons
involved in relaying the efference copy signal of the saccadic
program [19] are also activated during covert attentional shifts.
This is especially interesting because, in this particular case, their
activation leads to a disruption of visual performance that is
counterproductive in the context of covert orienting. This further
suggests that covert attentional allocation relies on the recruitment
of a neural circuit for which eye movement control, and not covert
selection, is the primary function. Interesting candidates are the
subcortical circuits involving the Superior Colliculus (SC). Recent
findings have shown that the SC, in addition to its well-known
function in eye movement control, plays a causal role in visual
selection, independently of the attention-related modulations
observed in visual cortex [41,42]. The SC is also thought to relay
the efference copy signals involved in saccadic suppression,
through its pulvino-cortical connections [2]. The present results
suggest that visual selection and saccadic suppression mechanisms
engage a common set of neurons within the SC-pulvino-cortical
circuit, and that their activation during attentional allocation could
send automatic saccadic suppression signals to visual cortex.
Acknowledgments
We thank Richard Krauzlis and David Irwin for helpful comments on the
manuscript. This work was performed at the Institute of Neuroscience of
the Universite catholique de Louvain (Brussels, Belgium).
Author Contributions
Conceived and designed the experiments: AZ. Performed the experiments:
NF AA AZ. Analyzed the data: AZ. Wrote the paper: AZ BC EO AA.
References
1. Burr DC, Morrone MC, Ross J (1994) Selective suppression of the
magnocellular visual pathway during saccadic eye movements. Nature 371:
511–513. doi:10.1038/371511a0.
2. Wurtz RH, Joiner WM, Berman RA (2011) Neuronal mechanisms for visual
stability: progress and problems. Philosophical Transactions of the Royal Society
B: Biological Sciences 366: 492–503. doi:10.1098/rstb.2010.0186.
3. Rizzolatti G, Riggio L, Dascola I (1987) Reorienting attention across the
horizontal and vertical meridians: Evidence in favor of a premotor theory of
attention. Neuropsychologia.
4. Posner MI, Snyder CR, Davidson BJ (1980) Attention and the detection of
signals. Journal of Experimental Psychology: General 109: 160–174.
doi:10.1037/0096-3445.109.2.160.
5. Bisley JW, Goldberg ME (2003) Neuronal activity in the lateral intraparietal area
and spatial attention. Science 299: 81–86. doi:10.1126/science.1077395.
6. Schafer RJ, Moore T (2011) Selective attention from voluntary control of
neurons in prefrontal cortex. Science 332: 1568–1571. doi:10.1126/sci-
ence.1199892.
7. Lovejoy LP, Krauzlis RJ (2010) Inactivation of primate superior colliculus
impairs covert selection of signals for perceptual judgments. Nature Neurosci-
ence 13: 261–266. doi:10.1038/nn.2470.
8. Pouget P, Stepniewska I, Crowder EA, Leslie MW, Emeric EE, et al. (2009)
Visual and motor connectivity and the distribution of calcium-binding proteins
in macaque frontal eye field: implications for saccade target selection. Front
Neuroanat 3: 2. doi:10.3389/neuro.05.002.2009.
9. Gregoriou GG, Gotts SJ, Desimone R (2012) Cell-type-specific synchronization
of neural activity in FEF with V4 during attention. Neuron 73: 581–594.
doi:10.1016/j.neuron.2011.12.019.
10. Juan C-H, Shorter-Jacobi SM, Schall JD (2004) Dissociation of spatial attention
and saccade preparation. Proc Natl Acad Sci USA 101: 15541–15544.
doi:10.1073/pnas.0403507101.
11. Smith DT, Schenk T (2012) The Premotor theory of attention: Time to move
on? Neuropsychologia. doi:10.1016/j.neuropsychologia.2012.01.025.
12. Blangero A, Khan A, Salemme R, Deubel H (2010) Pre-saccadic perceptual
facilitation can occur without covert orienting of attention 10.1016/j.cor-
tex.2009.06.014 : Cortex | ScienceDirect.com. CORTEX.
13. Juan C-H, Muggleton NG, Tzeng OJL, Hung DL, Cowey A, et al. (2008)
Segregation of visual selection and saccades in human frontal eye fields. Cerebral
Cortex 18: 2410–2415. doi:10.1093/cercor/bhn001.
14. Corneil BD, Elsley JK, Nagy B, Cushing SL (2010) Motor output evoked by
subsaccadic stimulation of primate frontal eye fields. Proceedings of the National
Academy of Sciences 107: 6070–6075. doi:10.1073/pnas.0911902107.
15. Craighero L (2005) The neurobiology of attention. Elsevier. Itti L, Geraint R,
John T, editors Neurobiology of attention. 1 pp.
16. Filali-Sadouk N, Castet E, Olivier E, Zenon A (2010) Similar effect of cueing
conditions on attentional and saccadic temporal dynamics. J Vis 10: 21.1–.13.
doi:10.1167/10.4.21.
17. Watson TL, Krekelberg B (2009) The relationship between saccadic suppression
and perceptual stability. Curr Biol 19: 1040–1043. doi:10.1016/
j.cub.2009.04.052.
18. Ibbotson M (2009) Visual Perception: Saccadic Omission – Suppression or
Temporal Masking? 10.1016/j.cub.2009.05.010 : Current Biology | Science-
Direct.com. Current Biology.
19. Ross J, Morrone MC, Goldberg ME (2001) Changes in visual perception at the
time of saccades 10.1016/S0166–2236(00)01685–4 : Trends in Neurosciences |
ScienceDirect.com. Trends in Neurosciences.
20. Zenon A, Hamed SB, Duhamel J-R, Olivier E (2009) Attentional guidance relies
on a winner-take-all mechanism. Vision Res 49: 1522–1531. doi:10.1016/
j.visres.2009.03.010.
21. Cornelissen FW, Peters EM, Palmer J (2002) The Eyelink Toolbox: eye tracking
with MATLAB and the Psychophysics Toolbox. Behav Res Methods Instrum
Comput 34: 613–617.
22. Hafed ZM, Lovejoy LP, Krauzlis RJ (2011) Modulation of microsaccades in
monkey during a covert visual attention task. Journal of Neuroscience 31:
15219–15230. doi:10.1523/JNEUROSCI.3106-11.2011.
Saccadic Suppression during Attention Shifts
PLOS ONE | www.plosone.org 11 January 2014 | Volume 9 | Issue 1 | e86633
23. Wagenmakers E-J (2007) A practical solution to the pervasive problems of p
values. Psychon Bull Rev 14: 779–804.24. Deubel H, Schneider WX (1996) Saccade target selection and object
recognition: evidence for a common attentional mechanism. Vision Res 36:
1827–1837.25. Deubel H (2008) The time course of presaccadic attention shifts. Psychol Res 72:
630–640. doi:10.1007/s00426-008-0165-3.26. Montagnini A, Castet E (2007) Spatiotemporal dynamics of visual attention
during saccade preparation: Independence and coupling between attention and
movement planning. J Vis 7: 8–8. doi:10.1167/7.14.8.27. Castet E, Jeanjean S, Montagnini A, Laugier D, Masson GS (2006) Dynamics of
attentional deployment during saccadic programming. J Vis 6: 196–212.doi:10.1167/6.3.2.
28. Solomon JA, Pelli DG (1994) The visual filter mediating letter identification.Nature 369: 395–397. doi:10.1038/369395a0.
29. Schutz AC, Braun DI, Gegenfurtner KR (2009) Object recognition during
foveating eye movements. Vision Res 49: 2241–2253. doi:10.1016/j.visres.2009.05.022.
30. Chase C (2003) Can the magnocellular pathway read? Evidence from studies ofcolor. Vision Res 43: 1211–1222. doi:10.1016/S0042-6989(03)00085-3.
31. Micallef-Roll J, Rihet P, Hasbroucq T, Possamaı C, Blin O (2001) Levodopa-
induced Drowsiness in Healthy Volunteers: Results of a Choice Reaction TimeTest Combined with a Subjective Evaluation of Sedation. Clin Neuropharmacol
24: 91.32. Klein R (2000) Inhibition of return. Trends in Cognitive Sciences.
33. Nakayama K, Mackeben M (1989) Sustained and transient components of focalvisual attention. Vision Res 29: 1631–1647.
34. Averbach E, Sperling G (1961) Short-Term Storage of information in Vision.
Information theory: 196–211.35. Kahneman D (1968) Method, findings, and theory in studies of visual masking.
Psychol Bull 70: 404–425.
36. Bremmer F, Kubischik M, Hoffmann K-P, Krekelberg B (2009) Neuraldynamics of saccadic suppression. Journal of Neuroscience 29: 12374–12383.
doi:10.1523/JNEUROSCI.2908-09.2009.37. Knoll J, Binda P, Morrone MC, Bremmer F (2011) Spatiotemporal profile of
peri-saccadic contrast sensitivity. J Vis 11. doi:10.1167/11.14.15.
38. Castet E, Jeanjean S, Masson GS (2002) Motion perception of saccade-inducedretinal translation. Proc Natl Acad Sci USA 99: 15159–15163. doi:10.1073/
pnas.232377199.39. Anderson JC, Kennedy H, Martin KAC (2011) Pathways of attention: synaptic
relationships of frontal eye field to V4, lateral intraparietal cortex, and area 46 inmacaque monkey. Journal of Neuroscience 31: 10872–10881. doi:10.1523/
JNEUROSCI.0622-11.2011.
40. Noudoost B, Moore T (2011) Control of visual cortical signals by prefrontaldopamine. Nature 474: 372–375. doi:10.1038/nature09995.
41. Zenon A, Krauzlis RJ (2012) Attention deficits without cortical neuronal deficits.Nature 489: 434–437. doi:10.1038/nature11497.
42. Krauzlis R, Lovejoy LP, Zenon A (2013) Superior Colliculus and Visual Spatial
Attention. Annu Rev Neurosci. doi:doi: 10.1146/annurev-neuro-062012-170249.
43. Diamond MR, Ross J, Morrone MC (2000). Extraretinal control of saccadicsuppression. Journal of Neuroscience 20(9): 3449–3455.
44. Allison PD (1999). Multiple Regression: A Primer. Thousand Oaks, CA: PineForge Press.
Saccadic Suppression during Attention Shifts
PLOS ONE | www.plosone.org 12 January 2014 | Volume 9 | Issue 1 | e86633