corrosion protection properties of cerium layers formed on tinplate
TRANSCRIPT
Corrosion Science 46 (2004) 563–578
www.elsevier.com/locate/corsci
Corrosion protection properties of ceriumlayers formed on tinplate
N. Mora a, E. Cano a, J.L. Polo b, J.M. Puente c,J.M. Bastidas a,*
a CENIM-National Centre for Metallurgical Research, CSIC, Avda. Gregorio del Amo 8,
E-28040 Madrid, Spainb School of Industrial Engineering, University of Castilla-La Mancha, Avda. Carlos III s/n,
E-45071 Toledo, Spainc ACERALIA, P.O. Box 90, E-33480 Aviles, Asturias, Spain
Received 10 June 2002; accepted 3 July 2003
Abstract
Corrosion protection properties of cerium-passivated, unpassivated and chromium-passi-
vated tinplates in contact with a 0.1 M citric-citrate buffer solution were studied using po-
larisation (DC) and electrochemical impedance spectroscopy (EIS) methods. The morphology
and composition of the passive layer were studied using scanning electron microscopy (SEM),
energy dispersive X-ray (EDX), and X-ray photoelectron spectroscopy (XPS) in conjunction
with argon-ion sputtering. Cerium-passivated tinplate showed similar corrosion properties to
chromium-passivated tinplate in DC measurements, while the latter yielded the best corrosion
resistance results in EIS measurements. SEM and EDX illustrated spherical particles with
iron, cerium and tin contributions. XPS measurements indicated that the cerium-rich coating
was a hydrated oxide with a composition of cerium(III): Ce(OH)3 and cerium(IV): CeO2 and
Ce(OH)4.
� 2003 Elsevier Ltd. All rights reserved.
Keywords: Tinplate; Cerium- and chromium-passivation; Corrosion properties
* Corresponding author. Tel.: +34-91-553-8900; fax: +34-91-534-7425.
E-mail address: [email protected] (J.M. Bastidas).
0010-938X/$ - see front matter � 2003 Elsevier Ltd. All rights reserved.
doi:10.1016/S0010-938X(03)00171-9
564 N. Mora et al. / Corrosion Science 46 (2004) 563–578
1. Introduction
Tinplate is a non-homogeneous material with a stratified structure, basically con-
sisting of a thin sheet of carbon steel coated with pure tin on both faces. Despite the
increasing use of new alternative materials in the canning industry, such as aluminium
and chromated steel sheet, tinplate continues to be used in more than 80% of cases.In order to stabilise the tinplate surface it is important to apply a passivation
treatment during its manufacturing and before lacquering. The general aim of the
passivation treatment is: (i) to prevent tin oxide growth on the surface, as excessive
oxide can cause discolouring during prolonged storage and in stoving operations
associated with lacquering and printing, especially in the curing of the lacquer; (ii) to
prevent the appearance of sulphide staining by sulphur contained in certain canned
foods; (iii) to improve lacquer adhesion to the metal substrate; and (iv) to improve
corrosion resistance after lacquering [1].Passivation treatments are commonly used in tinplate protection systems in the
canning industry. The application of these treatments is a relatively simple process.
Code 311 (3.5–9.0 mg/m2) is the most widely used and consists of a process of ca-
thodic treatment in a solution of sodium dichromate, while code 300 (1.0–3.0 mg/m2)
is a simple chemical dip treatment in a sodium dichromate solution. However, the
recent recognition that chromium in hexavalent state is both highly toxic and car-
cinogenic has led to a search for alternative non-toxic passivation treatments [2].
Rare earth elements have been proposed as a good alternative for hexavalentchromium, especially in the case of cerium and praseodymium which have two
higher oxidation states and are reasonably abundant [3]. In the case of aluminium
and aluminium alloys, the corrosion protection mechanism afforded by cerium
incorporated in the surface oxide is believed to involve a decrease in the rate of
cathodic oxygen reduction by the precipitation of trivalent cerium hydroxide
(Ce(OH)3) at regions of high pH [4], to form a complex hydrated cerium oxide layer
on the metallic surface [5].
Cerium ions can be used in one of two ways: (i) they can be added to an aqueousenvironment in low concentrations (100–1000 ppm); or (ii) they can be incorporated in
the passive oxide film on metal surfaces to form a protective conversion coating [6–8].
The aim of this work is to characterise a chromium-free passivation treatment of
tinplate based on cerium nitrate. The corrosion properties and composition of the
passive layer were studied using DC polarisation and electrochemical impedance
spectroscopy (EIS). The surface morphology, microstructure and composition of the
coatings were investigated using scanning electron microscopy (SEM), energy dis-
persive X-ray (EDX) and X-ray photoelectron spectroscopy (XPS). The results forcerium-passivated tinplate were compared with unpassivated and conventional
chromium-passivated tinplates.
2. Experimental
Tinplate specimens with a tin coating weight of 2.8 g/m2 on each face were studied
using three types of passivation treatments: (i) the original tinplate specimens were
N. Mora et al. / Corrosion Science 46 (2004) 563–578 565
galvanostatically polarised in an aerated solution of 10,000 ppm cerium(III) nitrate
hexahydrate (Ce(NO3)3 Æ 6H2O) using a cathodic current density of 1 · 10�3 A/cm2
for 30 s, (ii) the original tinplate specimens were tested as-received, without passi-
vation treatment; and (iii) a conventional passivation treatment with a total chro-
mium coating weight of �5.5 mg/m2 (code 311) was performed by the manufacturer
on the original tinplate specimens. Passivation treatment (iii) was tested as referenceand for comparative purposes. The specimens were of the same batch, of comparable
surface roughness, and were all in the reflowed condition.
Three electrochemical tests were conducted using a 0.1 M citric-citrate buffer
test model solution at pH 4.3, commonly used in tinplate food packaging studies:
(i) potentiodynamic polarisation curves were plotted from )1.0 VSCE to +0.5 VSCE
at a polarisation scan rate of 0.4 mV/s; (ii) linear polarisation resistance (Rp) was
applied using an interval of ±20 mV from the rest potential (Ecorr); and (iii) EIS
measurements were performed in the frequency range from 1 · 104 to 1 · 10�3 Hzwith a logarithmic sweeping frequency of 5 steps/decade. EIS involved the im-
position of a 10 mV amplitude sine-wave and the measurements were carried out
at the Ecorr.
For electrochemical tests a Solartron 1250 Frequency Response Analyser and an
EG&G PARC 273A potentiostat/galvanostat controlled by a computer were used.
All the measurements were conducted with a conventional glass cell in citric-citrate
buffer solutions, purged with purified nitrogen to simulate anaerobic conditions
found inside cans for 1 h prior to the experiments and throughout their duration.A platinum gauze of large surface area (4 · 9 cm2) was the counter electrode and
a saturated calomel electrode (SCE) was the reference.
XPS experiments were conducted to characterise the passive films formed
using cerium nitrate. The spectra were obtained with a VG Microtech electron
spectrometer, model MT 500, using an Mg Ka1:2 anode X-ray source (hm ¼1253:6 eV) with a primary beam energy of 15 kV and an electron current of
20 mA. The pressure in the analysis cabinet was maintained at 1 · 10�9 Torr
throughout the measurements. The regions of interest were C 1s, O 1s, Sn 3d5=2
and Ce 3d. The binding energy (BE) scale of the spectrophotometer was peri-
odically calibrated using Ag 3d5=2 (368.3 eV, BE) and Au 4f7=2 (84.0 eV, BE)
substrates. The full width at half-maximum (FWHM) obtained for the Ag 3d5=2
line is 0.9 eV. A Shirley background subtraction was made to obtain the XPS
signal intensity. The concentration of each element was estimated by measuring
the respective peak area in the high-resolution XPS spectrum and using ele-
mental sensitivity factors.
The specimens were analysed by means of argon-ion sputtering on the originalsurface and after 30, 90 and 390 s argon-ion sputtering was carried out with a pri-
mary beam energy of 5 kV and an ion density of 1 lA/cm2, recording the corre-
sponding XPS spectrum for each sputtering cycle.
SEM (secondary electrons) and EDX techniques were performed using a JEOL
JXA-840 equipment with a Link AN 10000 system for the EDX analysis. This latter
was carried out on the whole surface area shown in the SEM images and at the same
voltage (15 kV).
566 N. Mora et al. / Corrosion Science 46 (2004) 563–578
3. Results and discussion
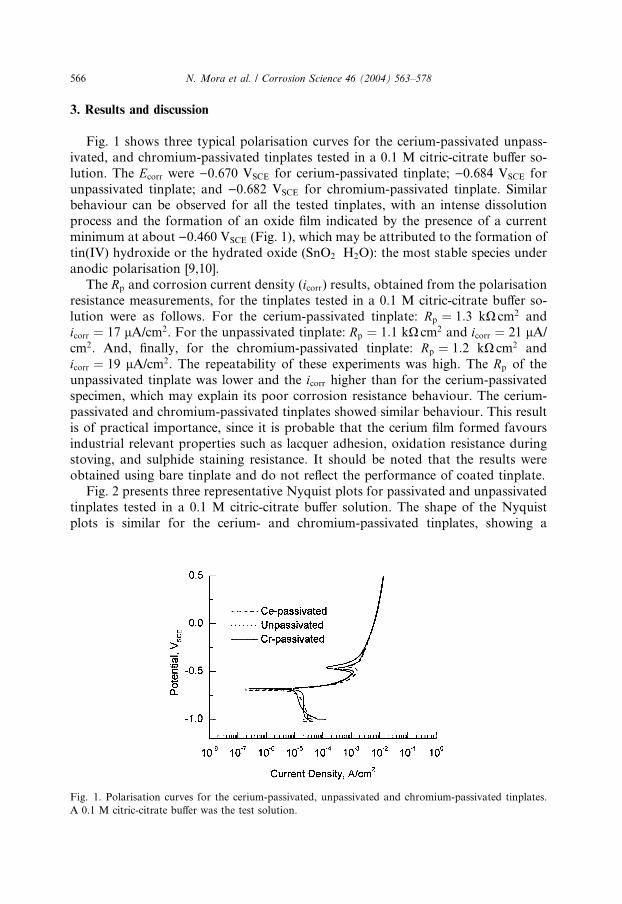
Fig. 1 shows three typical polarisation curves for the cerium-passivated unpass-
ivated, and chromium-passivated tinplates tested in a 0.1 M citric-citrate buffer so-
lution. The Ecorr were )0.670 VSCE for cerium-passivated tinplate; )0.684 VSCE for
unpassivated tinplate; and )0.682 VSCE for chromium-passivated tinplate. Similarbehaviour can be observed for all the tested tinplates, with an intense dissolution
process and the formation of an oxide film indicated by the presence of a current
minimum at about )0.460 VSCE (Fig. 1), which may be attributed to the formation of
tin(IV) hydroxide or the hydrated oxide (SnO2 ÆH2O): the most stable species under
anodic polarisation [9,10].
The Rp and corrosion current density (icorr) results, obtained from the polarisation
resistance measurements, for the tinplates tested in a 0.1 M citric-citrate buffer so-
lution were as follows. For the cerium-passivated tinplate: Rp ¼ 1:3 kX cm2 andicorr ¼ 17 lA/cm2. For the unpassivated tinplate: Rp ¼ 1:1 kX cm2 and icorr ¼ 21 lA/
cm2. And, finally, for the chromium-passivated tinplate: Rp ¼ 1:2 kX cm2 and
icorr ¼ 19 lA/cm2. The repeatability of these experiments was high. The Rp of the
unpassivated tinplate was lower and the icorr higher than for the cerium-passivated
specimen, which may explain its poor corrosion resistance behaviour. The cerium-
passivated and chromium-passivated tinplates showed similar behaviour. This result
is of practical importance, since it is probable that the cerium film formed favours
industrial relevant properties such as lacquer adhesion, oxidation resistance duringstoving, and sulphide staining resistance. It should be noted that the results were
obtained using bare tinplate and do not reflect the performance of coated tinplate.
Fig. 2 presents three representative Nyquist plots for passivated and unpassivated
tinplates tested in a 0.1 M citric-citrate buffer solution. The shape of the Nyquist
plots is similar for the cerium- and chromium-passivated tinplates, showing a
Fig. 1. Polarisation curves for the cerium-passivated, unpassivated and chromium-passivated tinplates.
A 0.1 M citric-citrate buffer was the test solution.
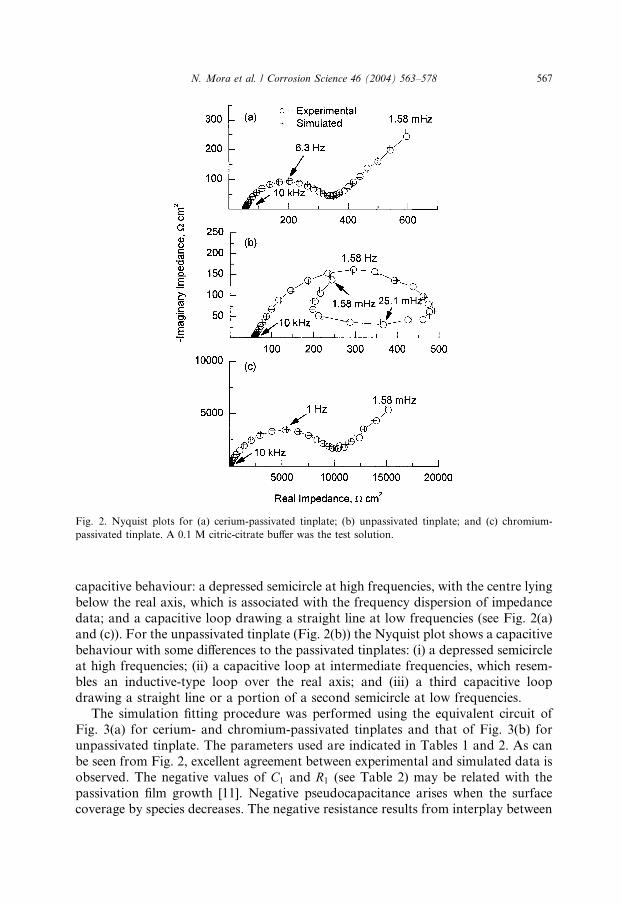
Fig. 2. Nyquist plots for (a) cerium-passivated tinplate; (b) unpassivated tinplate; and (c) chromium-
passivated tinplate. A 0.1 M citric-citrate buffer was the test solution.
N. Mora et al. / Corrosion Science 46 (2004) 563–578 567
capacitive behaviour: a depressed semicircle at high frequencies, with the centre lying
below the real axis, which is associated with the frequency dispersion of impedance
data; and a capacitive loop drawing a straight line at low frequencies (see Fig. 2(a)
and (c)). For the unpassivated tinplate (Fig. 2(b)) the Nyquist plot shows a capacitive
behaviour with some differences to the passivated tinplates: (i) a depressed semicircle
at high frequencies; (ii) a capacitive loop at intermediate frequencies, which resem-bles an inductive-type loop over the real axis; and (iii) a third capacitive loop
drawing a straight line or a portion of a second semicircle at low frequencies.
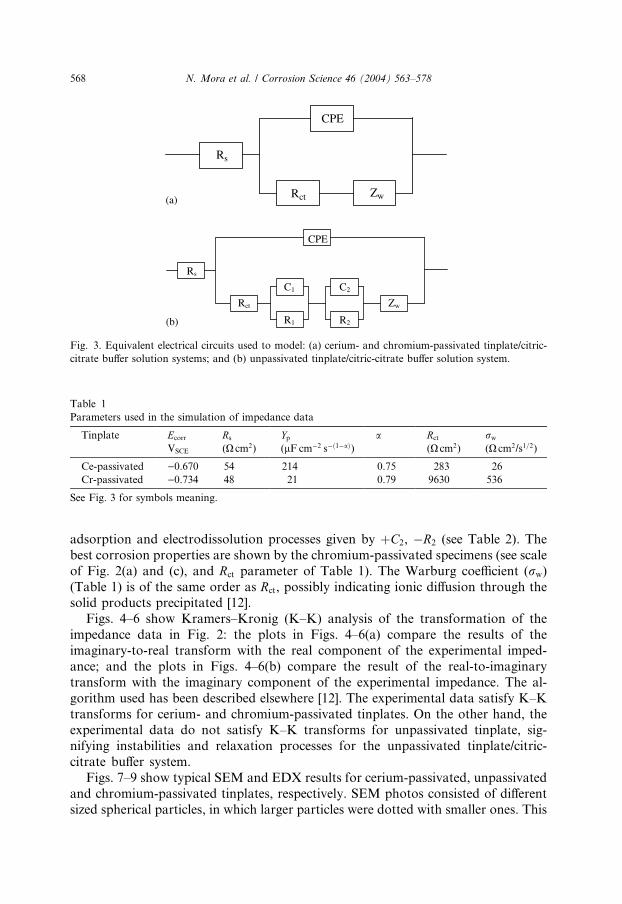
The simulation fitting procedure was performed using the equivalent circuit of
Fig. 3(a) for cerium- and chromium-passivated tinplates and that of Fig. 3(b) for
unpassivated tinplate. The parameters used are indicated in Tables 1 and 2. As can
be seen from Fig. 2, excellent agreement between experimental and simulated data is
observed. The negative values of C1 and R1 (see Table 2) may be related with the
passivation film growth [11]. Negative pseudocapacitance arises when the surfacecoverage by species decreases. The negative resistance results from interplay between
CPE
ZwRct
Rs
Rs
ZwRct
C1
R1
C2
R2
CPE
(a)
(b)
Fig. 3. Equivalent electrical circuits used to model: (a) cerium- and chromium-passivated tinplate/citric-
citrate buffer solution systems; and (b) unpassivated tinplate/citric-citrate buffer solution system.
Table 1
Parameters used in the simulation of impedance data
Tinplate Ecorr
VSCE
Rs
(X cm2)
Yp(lF cm�2 s�ð1�aÞ)
a Rct
(X cm2)
rw
(X cm2/s1=2)
Ce-passivated )0.670 54 214 0.75 283 26
Cr-passivated )0.734 48 21 0.79 9630 536
See Fig. 3 for symbols meaning.
568 N. Mora et al. / Corrosion Science 46 (2004) 563–578
adsorption and electrodissolution processes given by þC2, �R2 (see Table 2). The
best corrosion properties are shown by the chromium-passivated specimens (see scale
of Fig. 2(a) and (c), and Rct parameter of Table 1). The Warburg coefficient (rw)
(Table 1) is of the same order as Rct, possibly indicating ionic diffusion through thesolid products precipitated [12].
Figs. 4–6 show Kramers–Kronig (K–K) analysis of the transformation of the
impedance data in Fig. 2: the plots in Figs. 4–6(a) compare the results of the
imaginary-to-real transform with the real component of the experimental imped-
ance; and the plots in Figs. 4–6(b) compare the result of the real-to-imaginary
transform with the imaginary component of the experimental impedance. The al-
gorithm used has been described elsewhere [12]. The experimental data satisfy K–K
transforms for cerium- and chromium-passivated tinplates. On the other hand, theexperimental data do not satisfy K–K transforms for unpassivated tinplate, sig-
nifying instabilities and relaxation processes for the unpassivated tinplate/citric-
citrate buffer system.
Figs. 7–9 show typical SEM and EDX results for cerium-passivated, unpassivated
and chromium-passivated tinplates, respectively. SEM photos consisted of different
sized spherical particles, in which larger particles were dotted with smaller ones. This
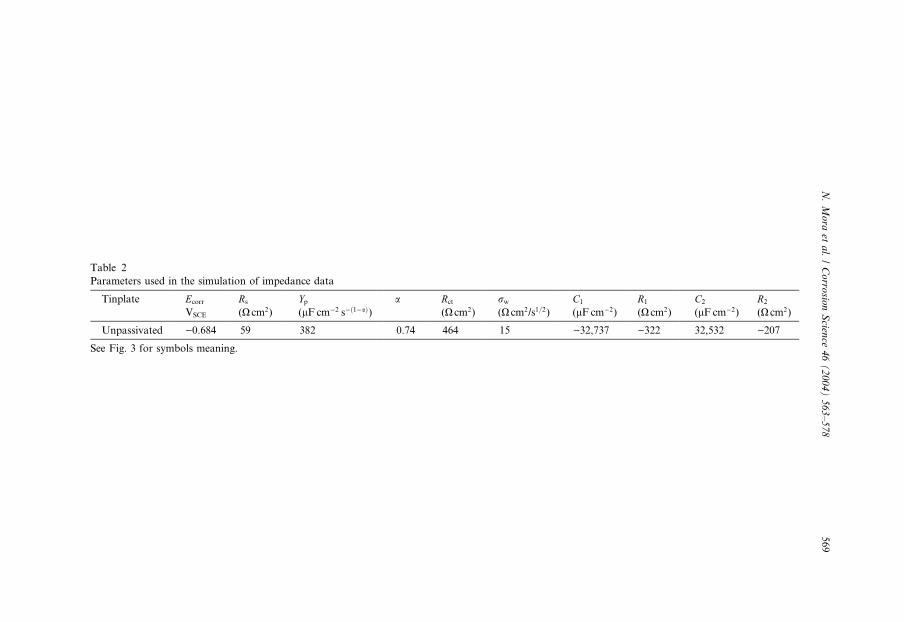
Table 2
Parameters used in the simulation of impedance data
Tinplate Ecorr
VSCE
Rs
(X cm2)
Yp(lF cm�2 s�ð1�aÞ)
a Rct
(X cm2)
rw
(X cm2/s1=2)
C1
(lF cm�2)
R1
(X cm2)
C2
(lF cm�2)
R2
(X cm2)
Unpassivated )0.684 59 382 0.74 464 15 )32,737 )322 32,532 )207
See Fig. 3 for symbols meaning.
N.Mora
etal./Corro
sionScien
ce46(2004)563–578
569
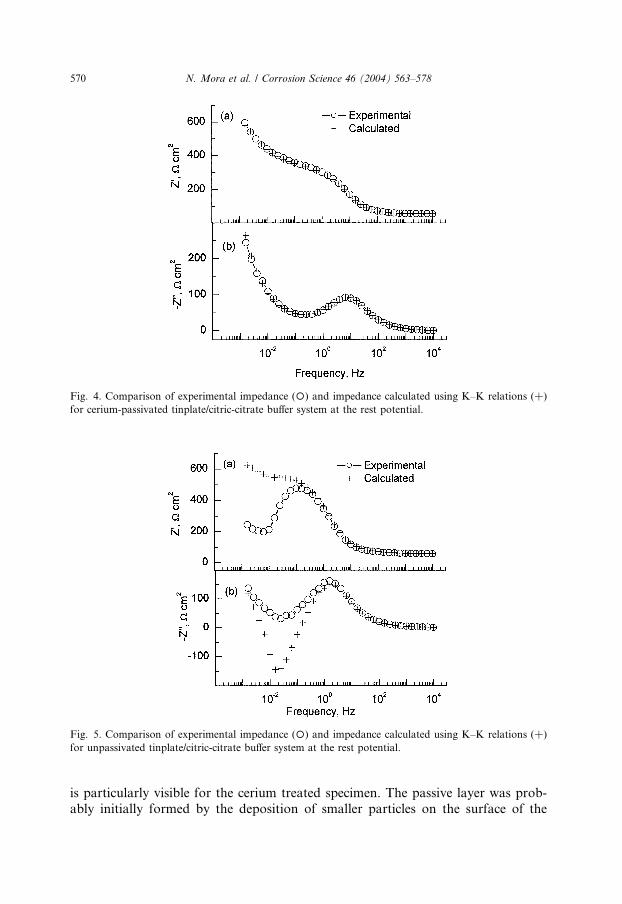
Fig. 4. Comparison of experimental impedance (�) and impedance calculated using K–K relations (þ)
for cerium-passivated tinplate/citric-citrate buffer system at the rest potential.
Fig. 5. Comparison of experimental impedance (�) and impedance calculated using K–K relations (þ)
for unpassivated tinplate/citric-citrate buffer system at the rest potential.
570 N. Mora et al. / Corrosion Science 46 (2004) 563–578
is particularly visible for the cerium treated specimen. The passive layer was prob-
ably initially formed by the deposition of smaller particles on the surface of the
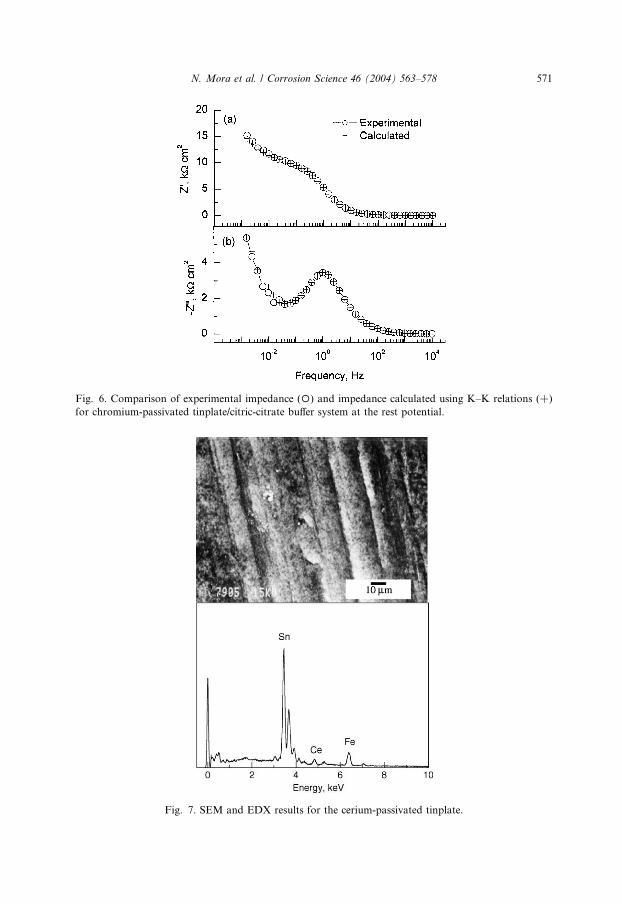
Fig. 6. Comparison of experimental impedance (�) and impedance calculated using K–K relations (þ)
for chromium-passivated tinplate/citric-citrate buffer system at the rest potential.
Fig. 7. SEM and EDX results for the cerium-passivated tinplate.
N. Mora et al. / Corrosion Science 46 (2004) 563–578 571
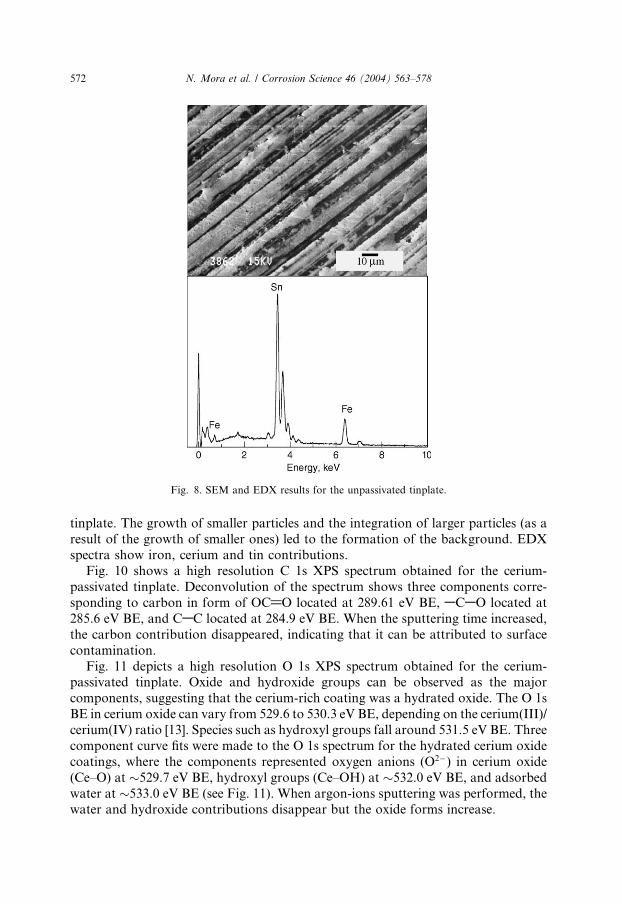
Fig. 8. SEM and EDX results for the unpassivated tinplate.
572 N. Mora et al. / Corrosion Science 46 (2004) 563–578
tinplate. The growth of smaller particles and the integration of larger particles (as a
result of the growth of smaller ones) led to the formation of the background. EDXspectra show iron, cerium and tin contributions.
Fig. 10 shows a high resolution C 1s XPS spectrum obtained for the cerium-
passivated tinplate. Deconvolution of the spectrum shows three components corre-
sponding to carbon in form of OC@O located at 289.61 eV BE, ACAO located at
285.6 eV BE, and CAC located at 284.9 eV BE. When the sputtering time increased,
the carbon contribution disappeared, indicating that it can be attributed to surface
contamination.
Fig. 11 depicts a high resolution O 1s XPS spectrum obtained for the cerium-passivated tinplate. Oxide and hydroxide groups can be observed as the major
components, suggesting that the cerium-rich coating was a hydrated oxide. The O 1s
BE in cerium oxide can vary from 529.6 to 530.3 eV BE, depending on the cerium(III)/
cerium(IV) ratio [13]. Species such as hydroxyl groups fall around 531.5 eV BE. Three
component curve fits were made to the O 1s spectrum for the hydrated cerium oxide
coatings, where the components represented oxygen anions (O2�) in cerium oxide
(Ce–O) at �529.7 eV BE, hydroxyl groups (Ce–OH) at �532.0 eV BE, and adsorbed
water at �533.0 eV BE (see Fig. 11). When argon-ions sputtering was performed, thewater and hydroxide contributions disappear but the oxide forms increase.
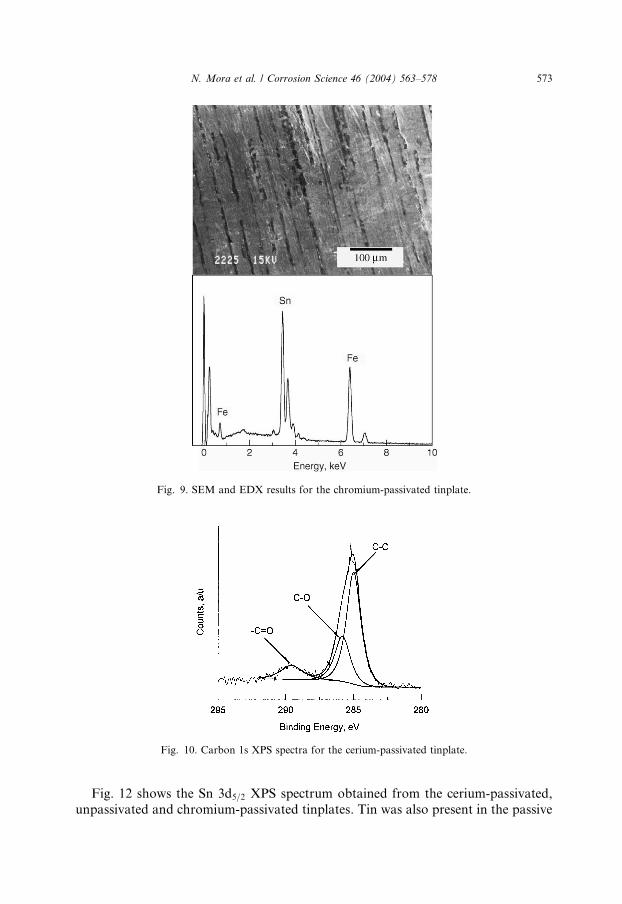
Fig. 10. Carbon 1s XPS spectra for the cerium-passivated tinplate.
Fig. 9. SEM and EDX results for the chromium-passivated tinplate.
N. Mora et al. / Corrosion Science 46 (2004) 563–578 573
Fig. 12 shows the Sn 3d5=2 XPS spectrum obtained from the cerium-passivated,
unpassivated and chromium-passivated tinplates. Tin was also present in the passive
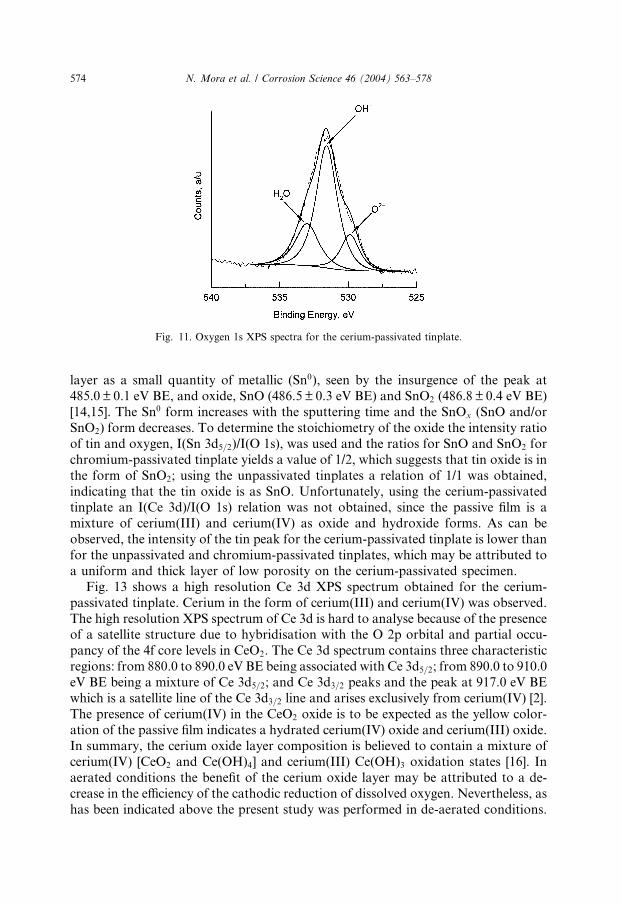
Fig. 11. Oxygen 1s XPS spectra for the cerium-passivated tinplate.
574 N. Mora et al. / Corrosion Science 46 (2004) 563–578
layer as a small quantity of metallic (Sn0), seen by the insurgence of the peak at
485.0 ± 0.1 eV BE, and oxide, SnO (486.5± 0.3 eV BE) and SnO2 (486.8 ± 0.4 eV BE)
[14,15]. The Sn0 form increases with the sputtering time and the SnOx (SnO and/or
SnO2) form decreases. To determine the stoichiometry of the oxide the intensity ratio
of tin and oxygen, I(Sn 3d5=2)/I(O 1s), was used and the ratios for SnO and SnO2 for
chromium-passivated tinplate yields a value of 1/2, which suggests that tin oxide is in
the form of SnO2; using the unpassivated tinplates a relation of 1/1 was obtained,
indicating that the tin oxide is as SnO. Unfortunately, using the cerium-passivatedtinplate an I(Ce 3d)/I(O 1s) relation was not obtained, since the passive film is a
mixture of cerium(III) and cerium(IV) as oxide and hydroxide forms. As can be
observed, the intensity of the tin peak for the cerium-passivated tinplate is lower than
for the unpassivated and chromium-passivated tinplates, which may be attributed to
a uniform and thick layer of low porosity on the cerium-passivated specimen.
Fig. 13 shows a high resolution Ce 3d XPS spectrum obtained for the cerium-
passivated tinplate. Cerium in the form of cerium(III) and cerium(IV) was observed.
The high resolution XPS spectrum of Ce 3d is hard to analyse because of the presenceof a satellite structure due to hybridisation with the O 2p orbital and partial occu-
pancy of the 4f core levels in CeO2. The Ce 3d spectrum contains three characteristic
regions: from 880.0 to 890.0 eV BE being associated with Ce 3d5=2; from 890.0 to 910.0
eV BE being a mixture of Ce 3d5=2; and Ce 3d3=2 peaks and the peak at 917.0 eV BE
which is a satellite line of the Ce 3d3=2 line and arises exclusively from cerium(IV) [2].
The presence of cerium(IV) in the CeO2 oxide is to be expected as the yellow color-
ation of the passive film indicates a hydrated cerium(IV) oxide and cerium(III) oxide.
In summary, the cerium oxide layer composition is believed to contain a mixture ofcerium(IV) [CeO2 and Ce(OH)4] and cerium(III) Ce(OH)3 oxidation states [16]. In
aerated conditions the benefit of the cerium oxide layer may be attributed to a de-
crease in the efficiency of the cathodic reduction of dissolved oxygen. Nevertheless, as
has been indicated above the present study was performed in de-aerated conditions.
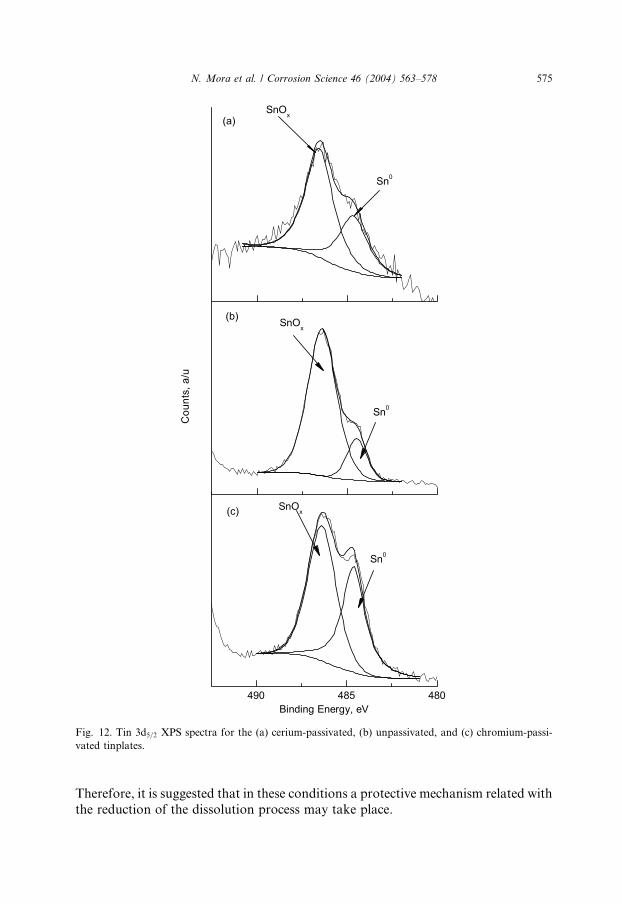
Fig. 12. Tin 3d5=2 XPS spectra for the (a) cerium-passivated, (b) unpassivated, and (c) chromium-passi-
vated tinplates.
N. Mora et al. / Corrosion Science 46 (2004) 563–578 575
Therefore, it is suggested that in these conditions a protective mechanism related with
the reduction of the dissolution process may take place.
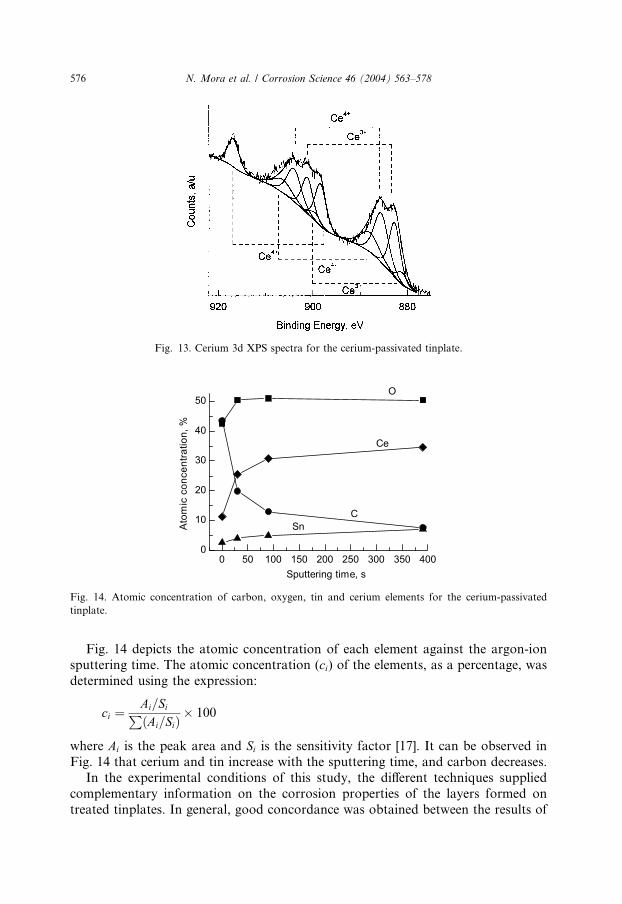
Fig. 13. Cerium 3d XPS spectra for the cerium-passivated tinplate.
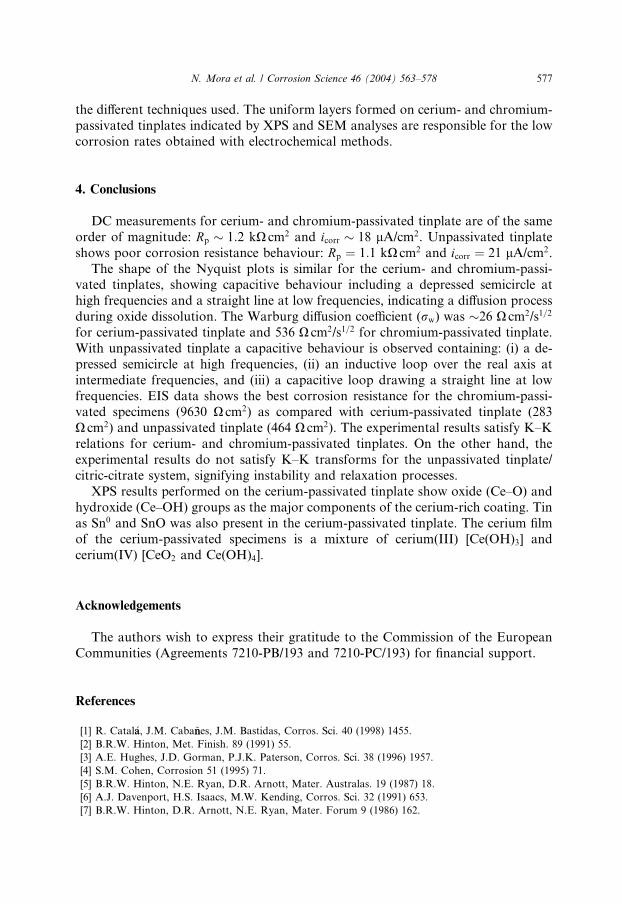
Fig. 14. Atomic concentration of carbon, oxygen, tin and cerium elements for the cerium-passivated
tinplate.
576 N. Mora et al. / Corrosion Science 46 (2004) 563–578
Fig. 14 depicts the atomic concentration of each element against the argon-ionsputtering time. The atomic concentration (ci) of the elements, as a percentage, was
determined using the expression:
ci ¼Ai=SiPðAi=SiÞ
� 100
where Ai is the peak area and Si is the sensitivity factor [17]. It can be observed in
Fig. 14 that cerium and tin increase with the sputtering time, and carbon decreases.In the experimental conditions of this study, the different techniques supplied
complementary information on the corrosion properties of the layers formed on
treated tinplates. In general, good concordance was obtained between the results of
N. Mora et al. / Corrosion Science 46 (2004) 563–578 577
the different techniques used. The uniform layers formed on cerium- and chromium-
passivated tinplates indicated by XPS and SEM analyses are responsible for the low
corrosion rates obtained with electrochemical methods.
4. Conclusions
DC measurements for cerium- and chromium-passivated tinplate are of the same
order of magnitude: Rp � 1:2 kX cm2 and icorr � 18 lA/cm2. Unpassivated tinplate
shows poor corrosion resistance behaviour: Rp ¼ 1:1 kX cm2 and icorr ¼ 21 lA/cm2.
The shape of the Nyquist plots is similar for the cerium- and chromium-passi-vated tinplates, showing capacitive behaviour including a depressed semicircle at
high frequencies and a straight line at low frequencies, indicating a diffusion process
during oxide dissolution. The Warburg diffusion coefficient (rw) was �26 X cm2/s1=2
for cerium-passivated tinplate and 536 X cm2/s1=2 for chromium-passivated tinplate.
With unpassivated tinplate a capacitive behaviour is observed containing: (i) a de-
pressed semicircle at high frequencies, (ii) an inductive loop over the real axis at
intermediate frequencies, and (iii) a capacitive loop drawing a straight line at low
frequencies. EIS data shows the best corrosion resistance for the chromium-passi-vated specimens (9630 X cm2) as compared with cerium-passivated tinplate (283
X cm2) and unpassivated tinplate (464 X cm2). The experimental results satisfy K–K
relations for cerium- and chromium-passivated tinplates. On the other hand, the
experimental results do not satisfy K–K transforms for the unpassivated tinplate/
citric-citrate system, signifying instability and relaxation processes.
XPS results performed on the cerium-passivated tinplate show oxide (Ce–O) and
hydroxide (Ce–OH) groups as the major components of the cerium-rich coating. Tin
as Sn0 and SnO was also present in the cerium-passivated tinplate. The cerium filmof the cerium-passivated specimens is a mixture of cerium(III) [Ce(OH)3] and
cerium(IV) [CeO2 and Ce(OH)4].
Acknowledgements
The authors wish to express their gratitude to the Commission of the European
Communities (Agreements 7210-PB/193 and 7210-PC/193) for financial support.
References
[1] R. Catal�aa, J.M. Caba~nnes, J.M. Bastidas, Corros. Sci. 40 (1998) 1455.
[2] B.R.W. Hinton, Met. Finish. 89 (1991) 55.
[3] A.E. Hughes, J.D. Gorman, P.J.K. Paterson, Corros. Sci. 38 (1996) 1957.
[4] S.M. Cohen, Corrosion 51 (1995) 71.
[5] B.R.W. Hinton, N.E. Ryan, D.R. Arnott, Mater. Australas. 19 (1987) 18.
[6] A.J. Davenport, H.S. Isaacs, M.W. Kending, Corros. Sci. 32 (1991) 653.
[7] B.R.W. Hinton, D.R. Arnott, N.E. Ryan, Mater. Forum 9 (1986) 162.
578 N. Mora et al. / Corrosion Science 46 (2004) 563–578
[8] A.E. Hughes, R.J. Taylor, B.R.W. Hinton, L. Wilson, Surf. Interface Anal. 23 (1995) 540.
[9] S.D. Kapusta, N. Hackerman, Electrochim. Acta 25 (1980) 1625.
[10] C.M.V.B. Almeida, T. Rab�ooczkay, B.F. Giannetti, J. Appl. Electrochem. 29 (1999) 123.
[11] R.F.A. Jargelius-Petterson, B.G. Pound, J. Electrochem. Soc. 145 (1998) 1462.
[12] J.M. Bastidas, J.L. Polo, C.L. Torres, E. Cano, Corros. Sci. 43 (2001) 269.
[13] D.R. Arnott, N.E. Ryan, B.R.W. Hinton, B.A. Sexton, A.E. Hughes, Appl. Surf. Sci. 22/23 (1985)
236.
[14] T.Y. Kim, Y.S. Jin, K.Y. Kim, Surf. Coat. Tech. 99 (1998) 319.
[15] E. Paparazzo, G. Fierro, G.M. Ingo, N. Zacchetti, Surf. Interface Anal. 12 (1988) 438.
[16] D. Briggs, M.P. Seah, Practical Surface Analysis by Auger and X-ray Photoelectron Spectroscopy,
second ed., John Wiley, New York, 1990, p. 615, 637.
[17] Y. Xingwen, C. Chunan, Y. Zhiming, Z. Derui, Y. Zhongda, Corros. Sci. 43 (2001) 1283.