correlation between mirna-targeted-gene promoter methylation and mirna regulation of target genes
TRANSCRIPT
F1000Research
Open Peer Review
, Whitehead Institute forWenqian Hu
Biomedical Research USA
, Institut Europeen de ChimieDenis Dupuy
et Biologie France
, Norwegian University ofPål Sætrom
Science and Technology Norway
Discuss this article
(0)Comments
3
2
1
RESEARCH ARTICLE
Correlation between miRNA-targeted-gene promoter methylation and miRNA regulation of target genes [v3; ref status:
approved 1, not approved 2, http://f1000r.es/1o9]Y-h TaguchiDepartment of Physics, Chuo University, Tokyo, Japan
Abstract miRNA regulation of target genes and promoter methylation areBackground
known to be the primary mechanisms underlying the epigenetic regulation ofgene expression. However, how these two processes cooperatively regulategene expression has not been extensively studied.
Gene expression and promoter methylation profiles of 270 distinctMethodshuman cell lines were obtained from Gene Expression Omnibus. -values thatPdescribe both miRNA-targeted-gene promoter methylation and miRNAregulation of target genes were computed using the MiRaGE method proposedrecently by the author.
Significant changes in promoter methylation were associated withResultsmiRNA targeting. It was also found that miRNA-targeted-gene promoterhypomethylation was related to differential target gene expression; the geneswith miRNA-targeted-gene promoter hypomethylation were downregulatedduring cell senescence and upregulated during cellular differentiation. Promoterhypomethylation was especially enhanced for genes targeted by miR-548miRNAs, which are non-conserved, primate-specific miRNAs that are typicallyexpressed at lower levels than the frequently investigated conserved miRNAs.miRNA-targeted-gene promoter methylation may also be related to the seedregion features of miRNA.
It was found that promoter methylation was correlated to miRNAConclusionstargeting. Furthermore, miRNA-targeted-gene promoter hypomethylation wasespecially enhanced in promoters of genes targeted by miRNAs that are notstrongly expressed (e.g., miR-548 miRNAs) and was suggested to be highlyrelated to some seed region features of miRNAs.
Referee Status:
Invited Referees
version 3published11 Sep 2013
version 2published27 Mar 2013
version 1published23 Jan 2013
1 2 3
report
report
report
report
23 Jan 2013, :21 (doi: )First published: 2 10.12688/f1000research.2-21.v1 27 Mar 2013, :21 (doi: )Second version: 2 10.12688/f1000research.2-21.v2
11 Sep 2013, :21 (doi: )Latest published: 2 10.12688/f1000research.2-21.v3
v3
Page 1 of 34
F1000Research 2013, 2:21 Last updated: 05 MAR 2015

F1000Research
Y-h Taguchi ( )Corresponding author: [email protected] Taguchi Yh. How to cite this article: Correlation between miRNA-targeted-gene promoter methylation and miRNA regulation of target
2013, :21 (doi: )genes [v3; ref status: approved 1, not approved 2, ]http://f1000r.es/1o9 F1000Research 2 10.12688/f1000research.2-21.v3 © 2013 Taguchi Yh. This is an open access article distributed under the terms of the , whichCopyright: Creative Commons Attribution Licence
permits unrestricted use, distribution, and reproduction in any medium, provided the original work is properly cited. Data associated with the articleare available under the terms of the (CC0 1.0 Public domain dedication).Creative Commons Zero "No rights reserved" data waiver
This study was supported by KAKENHI (23300357).Grant information:The funders had no role in study design, data collection and analysis, decision to publish, or preparation of the manuscript.
Competing interests: No competing interests were disclosed.
23 Jan 2013, :21 (doi: ) First published: 2 10.12688/f1000research.2-21.v1
Page 2 of 34
F1000Research 2013, 2:21 Last updated: 05 MAR 2015
between promoter methylation and miRNA regulation of target genes has not been thoroughly investigated. One likely reason for this is that the regulation of gene expression by promoter methylation is a form of pre-transcriptional control, whereas miRNA regulation of target genes is a form of post-transcriptional control, with the former tak-ing place inside the nucleus and the latter outside the nucleus (cy-toplasm). Thus, these two mechanisms are separated by both time and space, and as a result, there have not been plausible biological reasons to suspect that promoter methylation and miRNA-mediated gene regulation operate in concert.
However, Su et al.11 recently found that miRNAs have a tendency to target genes with hypomethylated promoters. To my knowledge, their study was the first report suggesting coregulation of gene expression by promoter methylation and miRNAs. In addition, Sinha et al. reported that gene promoters with high CpG content were more often targeted by miRNAs12. Saito and Sætrom also dis-cussed the relationships between miRNA-mediated gene regulation and various features of target genes, but they did not consider the methylation status of target gene promoters13. Although the study of Su et al. represents the first evidence of a direct link between promot-er methylation and miRNA regulation, the biological significance of their findings is not clear. In this study, I report that promoter methylation is associated with miRNA-targeting; that is, the amount of methylation observed at a given gene promoter is dependent on whether that gene is also a target of miRNA regulation. Further-more, miRNA-targeted-gene promoter methylation is also related to how miRNAs regulate target gene expression. In particular, I reveal that miR-548 miRNAs target genes are associated with highly hypo-methylated promoters. Finally, the data presented here indicate that miRNA-targeted-gene promoter methylation is related to the seed region features of miRNAs.
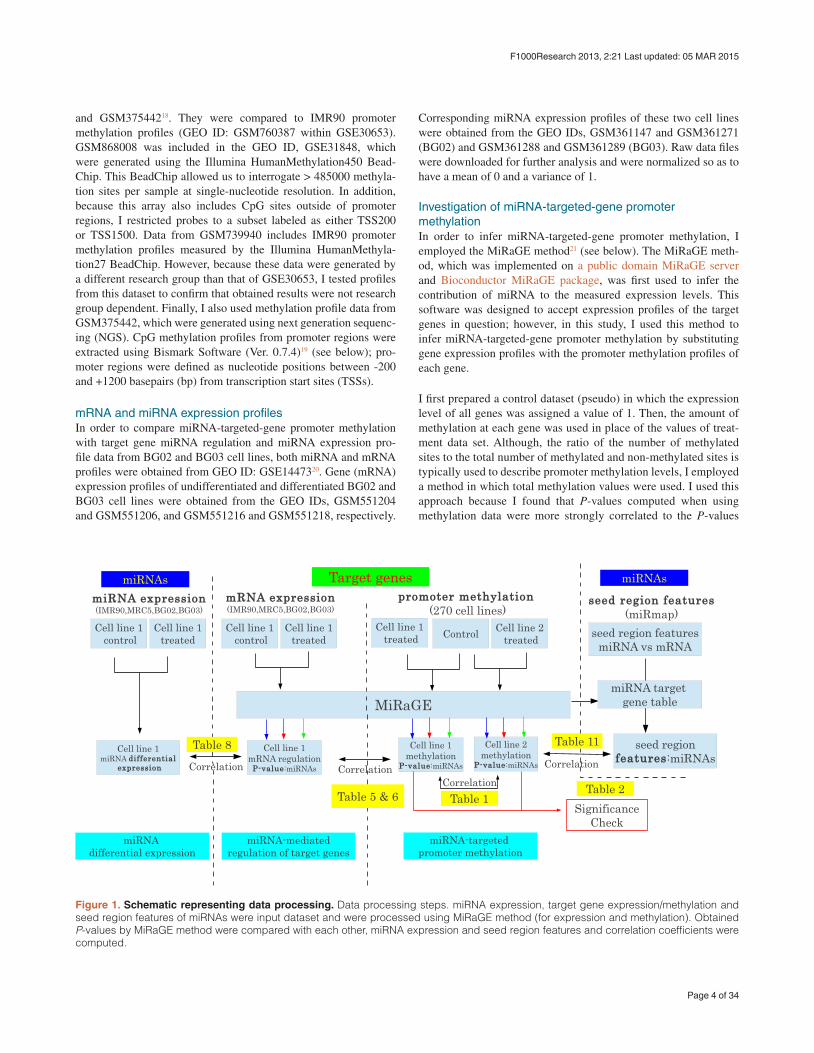
MethodsAn overview of the pipeline used for data processing is presented in Figure 1.
Promoter methylation profilesIn this study, I used publically available promoter methylation pro-files from various resources obtained from GEO ID: GSE3065314. This included 283 human promoter methylation profiles for dis-tinct cell lines, ranging from hESC to various somatic samples, measured using the HumanMethylation27 BeadChip (Il-lumina), which provides an efficient approach for surveying genome-wide DNA methylation profiles. The HumanMethylation27 panel tar-gets CpG sites located within proximal promoter regions of tran-scription start sites (TSS). Thus, it was suitable for the purpose of this study. Promoter methylation profiles (GEO ID: GSE30653) also included data from both IMR90 and MRC5 cell lines, which were used to investigate relationships between promoter meth-ylation and previously reported miRNA regulation and miRNA expression profile data15,16. Promoter methylation profiles in both BG02 and BG03 were also included in this study, and were com-pared to miRNA regulation and miRNA expression profile data (see below).
Additional promoter methylation profiles in IMR90 cell lines were obtained from GEO IDs, GSM86800814, GSM73994017,
Changes from Version 2
Abstract modified: The word “affected” was removed as the purpose of this paper is simply reporting correlations, not causalities.A figure to illustrate analyses: A figure to illustrate analyses was added (Fig. 1).A figure to show data trends: In order to show data trends, the comparison of distribution of promoter methylation between miRNA-targeted genes and non-miRNA-targeted genes was added (additional file 7).A figure to visualize correlation: In order to visualize correlations between miRNA-mediated regulation of target genes and miRNA-targeted promoter methylation, scatter plots were added (additional file 8).Correlation between miRNA-targeted promoter methylation and seed region features: In order to illustrate a newly identified relation between miRNA-targeted promoter methylation and seed region features, many materials were added: Table 11, Figures 2 and 3, additional file 9, sections “Correlation between seed region features and miRNA-targeted-gene promoter methylation” and “miRNA-targeted-gene promoter methylation is correlated to miRNA seed region features”.Treatment of shared miRNA seed sequences: a section “Treatment of shared miRNA seed sequences” and an Appendix “Treatment of miRNAs sharing same seed sequence for P-values computation”, Figures S1 and S2, and Table S1 were added in order to explain why shared miRNA seed sequences were not considered.Fig. 1 in Ver. 2 is now renumbered as Fig. 4, due to the above mentioned material additions.
See referee responses
IntroductionThe epigenetic regulation of gene expression1 has recently attracted the interests of many researchers. Epigenetic modifications regulate gene expression without modifying DNA sequences. Examples in-clude promoter methylation2, histone modification3, the binding of transcription factors to gene promoter regions4, and miRNA regula-tion of target genes5.
Promoter methylation and miRNA regulation of target genes are particularly important in the epigenetic regulation of gene expres-sion. Promoter methylation is relatively stable, long term, and in some cases, heritable. It is generally believed that genes with hyper-methylated promoters are repressed. In addition, there is mounting evidence that DNA methylation is involved in the development and progression of certain disease states. For example, aberrant meth-ylation in cancer is frequently observed6, and the distinct patterns of promoter methylation between monozygotic (MZ) twin pairs have also been found to result in different health conditions7. In contrast to DNA methylation, miRNA regulation of target genes is more flexible and can change even during cellular differentiation8. miRNA expression is often tissue-specific, and similar to DNA methylation, miRNA expression has been linked to human disease9. Thus, although miRNA-directed gene regulation is thought to result in subtle changes, it is generally believed that miRNAs are involved in many important biological processes ranging from cell division to aging.
Although DNA methylation of miRNA promoters has been studied extensively (e.g., with respect to tumor formation10), the relationship
Page 3 of 34
F1000Research 2013, 2:21 Last updated: 05 MAR 2015
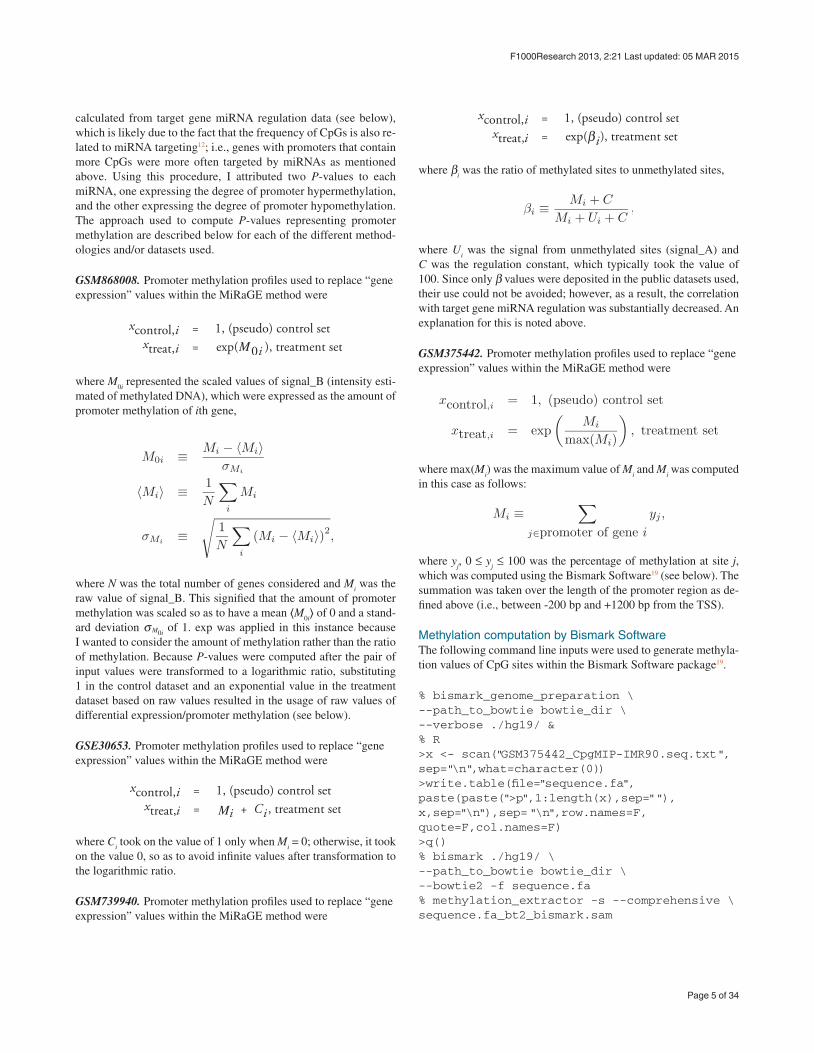
and GSM37544218. They were compared to IMR90 promoter methylation profiles (GEO ID: GSM760387 within GSE30653). GSM868008 was included in the GEO ID, GSE31848, which were generated using the Illumina HumanMethylation450 Bead-Chip. This BeadChip allowed us to interrogate > 485000 methyla-tion sites per sample at single-nucleotide resolution. In addition, because this array also includes CpG sites outside of promoter regions, I restricted probes to a subset labeled as either TSS200 or TSS1500. Data from GSM739940 includes IMR90 promoter methylation profiles measured by the Illumina HumanMethyla-tion27 BeadChip. However, because these data were generated by a different research group than that of GSE30653, I tested profiles from this dataset to confirm that obtained results were not research group dependent. Finally, I also used methylation profile data from GSM375442, which were generated using next generation sequenc-ing (NGS). CpG methylation profiles from promoter regions were extracted using Bismark Software (Ver. 0.7.4)19 (see below); pro-moter regions were defined as nucleotide positions between -200 and +1200 basepairs (bp) from transcription start sites (TSSs).
mRNA and miRNA expression profilesIn order to compare miRNA-targeted-gene promoter methylation with target gene miRNA regulation and miRNA expression pro-file data from BG02 and BG03 cell lines, both miRNA and mRNA profiles were obtained from GEO ID: GSE1447320. Gene (mRNA) expression profiles of undifferentiated and differentiated BG02 and BG03 cell lines were obtained from the GEO IDs, GSM551204 and GSM551206, and GSM551216 and GSM551218, respectively.
Corresponding miRNA expression profiles of these two cell lines were obtained from the GEO IDs, GSM361147 and GSM361271 (BG02) and GSM361288 and GSM361289 (BG03). Raw data files were downloaded for further analysis and were normalized so as to have a mean of 0 and a variance of 1.
Investigation of miRNA-targeted-gene promoter methylationIn order to infer miRNA-targeted-gene promoter methylation, I employed the MiRaGE method21 (see below). The MiRaGE meth-od, which was implemented on a public domain MiRaGE server and Bioconductor MiRaGE package, was first used to infer the contribution of miRNA to the measured expression levels. This software was designed to accept expression profiles of the target genes in question; however, in this study, I used this method to infer miRNA-targeted-gene promoter methylation by substituting gene expression profiles with the promoter methylation profiles of each gene.
I first prepared a control dataset (pseudo) in which the expression level of all genes was assigned a value of 1. Then, the amount of methylation at each gene was used in place of the values of treat-ment data set. Although, the ratio of the number of methylated sites to the total number of methylated and non-methylated sites is typically used to describe promoter methylation levels, I employed a method in which total methylation values were used. I used this approach because I found that P-values computed when using methylation data were more strongly correlated to the P-values
Figure 1. Schematic representing data processing. Data processing steps. miRNA expression, target gene expression/methylation and seed region features of miRNAs were input dataset and were processed using MiRaGE method (for expression and methylation). Obtained P-values by MiRaGE method were compared with each other, miRNA expression and seed region features and correlation coefficients were computed.
Page 4 of 34
F1000Research 2013, 2:21 Last updated: 05 MAR 2015
calculated from target gene miRNA regulation data (see below), which is likely due to the fact that the frequency of CpGs is also re-lated to miRNA targeting12; i.e., genes with promoters that contain more CpGs were more often targeted by miRNAs as mentioned above. Using this procedure, I attributed two P-values to each miRNA, one expressing the degree of promoter hypermethylation, and the other expressing the degree of promoter hypomethylation. The approach used to compute P-values representing promoter methylation are described below for each of the different method-ologies and/or datasets used.
GSM868008. Promoter methylation profiles used to replace “gene expression” values within the MiRaGE method were
M
where M0i represented the scaled values of signal_B (intensity esti-
mated of methylated DNA), which were expressed as the amount of promoter methylation of ith gene,
where N was the total number of genes considered and Mi was the
raw value of signal_B. This signified that the amount of promoter methylation was scaled so as to have a mean ⟨M
0i⟩ of 0 and a stand-
ard deviation σ M0i of 1. exp was applied in this instance because
I wanted to consider the amount of methylation rather than the ratio of methylation. Because P-values were computed after the pair of input values were transformed to a logarithmic ratio, substituting 1 in the control dataset and an exponential value in the treatment dataset based on raw values resulted in the usage of raw values of differential expression/promoter methylation (see below).
GSE30653. Promoter methylation profiles used to replace “gene expression” values within the MiRaGE method were
M
where Ci took on the value of 1 only when M
i = 0; otherwise, it took
on the value 0, so as to avoid infinite values after transformation to the logarithmic ratio.
GSM739940. Promoter methylation profiles used to replace “gene expression” values within the MiRaGE method were
where βi was the ratio of methylated sites to unmethylated sites,
where Ui was the signal from unmethylated sites (signal_A) and
C was the regulation constant, which typically took the value of 100. Since only β values were deposited in the public datasets used, their use could not be avoided; however, as a result, the correlation with target gene miRNA regulation was substantially decreased. An explanation for this is noted above.
GSM375442. Promoter methylation profiles used to replace “gene expression” values within the MiRaGE method were
where max(Mi) was the maximum value of M
i and M
i was computed
in this case as follows:
where yj, 0 ≤ y
j ≤ 100 was the percentage of methylation at site j,
which was computed using the Bismark Software19 (see below). The summation was taken over the length of the promoter region as de-fined above (i.e., between -200 bp and +1200 bp from the TSS).
Methylation computation by Bismark SoftwareThe following command line inputs were used to generate methyla-tion values of CpG sites within the Bismark Software package19.
% bismark_genome_preparation \ --path_to_bowtie bowtie_dir \--verbose ./hg19/ & % R>x <- scan(“GSM375442_CpgMIP-IMR90.seq.txt“,sep=“\n“,what=character(0))>write.table(file=“sequence.fa“,paste(paste(“>p“,1:length(x),sep=““),x,sep=“\n“),sep=“\n“,row.names=F, quote=F,col.names=F)>q()% bismark ./hg19/ \ --path_to_bowtie bowtie_dir \--bowtie2 -f sequence.fa% methylation_extractor -s --comprehensive \ sequence.fa_bt2_bismark.sam
Page 5 of 34
F1000Research 2013, 2:21 Last updated: 05 MAR 2015
% genome_methylation_bismark2bedGraph_v3.pl \ CpG_content_sequence.fa_bt2_bismark.sam.txt \ > sequence.fa_bt2_bismark.sam.bed
where bowtie_dir is the directory where bowtie2 is installed. In this study R22 was used, but scripts executed by R can also be performed using other alternative languages. GSM375442_Cpg-MIP-IMR90.seq.txt is a file downloaded from GEO and sequence.fa_bt2_bismark.sam.bed includes methyla-tion percentages of each CpG site, y
j, which was explained above.
Inference of miRNA-targeted-gene promoter methylation/miRNA regulation of target genes using the MiRaGE methodThe inference of miRNA-targeted-gene promoter methylation/miRNA regulation of target genes was carried out using the MiRaGE method, which has been described previously21.
Although the MiRaGE method is typically used for datasets with two experimental conditions, each of which contains more than one replicate, I used this method for instances in which each con-dition consisted of only a single replicate. In each case, I based the analysis on the premise that for a given gene i, there were a pair of gene expression datasets or promoter methylation profile datasets, which were measured under a control condition x
control,i
and a treatment condition xtreat,i
. From this, I computed the loga-rithmic ratio
In such an example, when a difference between raw values is fa-vorable, exponential values exp(x
i) can be used instead of x
i, in
which case, I got
When computing P-values that rejected the null hypothesis, by us-ing the alternative hypothesis that ∆x
is of the target genes of the
miRNA m are less (greater) than those that are off-target but form a target of other miRNAs, I computed
where P[A < (>) B] represented P-values computed by statistical tests when sets A and B were compared. The tests implemented within the MiRaGE Server/package are the t-test, Wilcoxon rank sum test, and Kolmogorov-Smironov test.
Thus, determining whether A < (>)B depends on the selected sta-tistical test used. I used G
m to represent the set of genes targeted by
miRNA m and G′m as the intersection of the set of off-target genes of miRNA m and the set of target genes of all other miRNAs. It should be noted that genes that were not the targets of any miRNAs were totally excluded from the analysis; however, all miRNAs were considered and no exclusions based on conservation were applied.
When inferring promoter methylation, xcontrol,i
= 1 and xtreat,i
were used to represent the amount of promoter methylation. When infer-ring miRNA regulation of target genes during cell senescence in IMR90 and MRC5 cell lines, x
control,i was used to represent gene ex-
pression of young cell lines and xtreat,i
was used to represent gene ex-pression in senescent cell lines. When inferring regulation of target genes during differentiation in BG02 and BG03 cell lines, x
control,i
was used to represent gene expression in undifferentiated cell lines and x
treat,i for gene expression in differentiated cell lines.
Correlation between miRNA-targeted-gene promoter methylation and miRNA regulation of target genesI used two types of P-values: P<(>) m:methy, which corresponded to the miRNA-targeted-gene promoter methylation; and P<(>) m:regul, which cor-responded to the miRNA regulation of target genes of miRNA m. When P<(>) m:methy[regul] was small enough, the target genes of miRNA m were significantly hypermethylated or hypomethylated and thus downregulated or upregulated. In order to see if these two types of P-values were correlated, I computed various correlation coefficients:
and accompanied P-values to reject null hypothesis that ρ = 0 by using the alternative hypothesis that ρ ≠ 0. I used ρ[a, b] as the Pear-son’s correlation coefficients between a and b and rank(x
m) as the
rank order of xm among {x
m}. Pm:z where z ∈ {methyl, regul} was
either P<m, P>
m, 1 – P<m or 1 – P>
m. Thus, there were 4 × 4 = 16 possible combinations of Pm:methy and Pm:regul. ρs of the Kolmogorov-Smirnov test and ρ
logPearsons for all tests changed when P<(>) was replaced with
1 – P>(<) because P<(>) ≠ 1 – P>(<) for the Kolmogorov-Smirnov test and log(P<(>)) ≠ log(1 – P>(<)) for all tests. Thus, optimal combinations of the maximum absolute correlation coefficients were employed.
The reciprocal relationship between miRNA regulation of target genes and miRNA expression during differentiation in BG02 and BG03In contrast to the cell senescence study15 in which miRNA expres-sion was investigated by NGS, only microarray measurements were available for differentiation in BG02 and BG03 cell lines. Due to issues related to the accuracy and quality of microarray data and the relatively low levels of miRNA expression, very few miRNAs were found to be differentially expressed between undifferentiated and differentiated cell lines. Thus, miRNAs that were differentially expressed between undifferentiated and differentiated cell lines were selected based on two criteria before being subjected to fur-ther analyses:
• Absolute differential expression | xdiff,i
– xundiff,i
|> ∆xc, where x
diff,i
and xundiff,i
were the normalized expression of gene i of differenti-ated and undifferentiated cell lines, respectively. ∆x
c was set as
the threshold value that could be used to select genes associated with significant differential expression during differentiation.
Page 6 of 34
F1000Research 2013, 2:21 Last updated: 05 MAR 2015
• For this method, genes were considered to be significantly upreg-ulated or downregulated based on an adjusted P-value threshold (P < 0.05) by using the BH criterion23. Here, P-values were com-puted using a t-test between two sets of probe values attributed to gene i.
After ∆xc was suitably selected, the correlation coefficient between
differential expression xdiff,i
– xundiff,i
and log (P<m:regul) were computed.
Positive values were taken to indicate a reciprocal relationship be-tween miRNA expression and miRNA-mediated regulation of target genes; smaller P<
m:regul were assumed to signify that target genes were upregulated (and vice versa). Thus, a reciprocal relationship required that miRNA were downregulated, i.e., x
diff,i – x
undiff,i < (>)0, which
should result in a positive correlation between xdiff,i
– xundiff,i
and log (P<
m:regul). Since miRNA names in GSE14473 were old (miRBase, release 9.1), they were converted to miRNA names used in the pre-sent version of the MiRaGE software package (miRBase release 18) using the miRConverter implemented in miRSystem24.
Ranking of miRNAs having target genes with miRNA-targeted-hypomethylated promotersmiRNAs were ranked based on P>
m in each of the 283 samples in GSE30653, after excluding 12 control samples. Each miRNA was ranked within each sample, and then, the cumulative rank was de-termined for all 270 samples.
Ranking of miRNA regulation of target genesmiRNAs were ranked based on P-values for either downregulation during cell senescence (IMR90 and MRC5) or upregulation dur-ing differentiation (BG02 and BG03) for each statistical test. Then, each miRNA was ranked based on the order summed up over three statistical tests.
Comparison of promoter methylation between miRNA-target genes and miRNA-non-target genesI compared promoter methylation between miRNA-target genes and miRNA-non-target genes for each of the 270 samples in GSE30653, excluding 12 control samples. Statistical tests used were the two-sided t-test, Wilcoxon rank sum test, and Kolmogorov-Smirnov test, result-ing in 270 P-values for each test.
P-value computation for miRNA-targeted-gene promoter methylation after random permutationIn order to see if P-values for miRNA-targeted-gene promoter methylation, P
>m, changed after random gene permutation, gene
IDs were randomly permuted for each of the 270 samples. Then, the number of significant miRNAs whose target gene promoter was significantly hypomethylated (P-values computed with t-test and corrected using the BH criterion23 were less than 0.05) was counted. The numbers were averaged over one hundred independent random permutations.
Significance of correlation between miRNA-targeted-gene promoter methylation and miRNA-mediated regulation of target genes after random gene permutationIn order to see if the correlation between miRNA-targeted-gene pro-moter methylation and miRNA-mediated regulation of target genes
changed after random gene permutation while conserving the corre-lation between promoter methylation and gene expression, promoter methylation and gene expression profiles needed to be permuted simultaneously. However, because gene expression and promoter methylation were measured by distinct microarrays, the number of probes attributed to each gene in some cases differed between the microarray used for gene expression measurement and promoter methylation. Also, multiple CpG sites may be attributed to each gene, while gene expression is unique to each gene. In order to overcome this difficulty, multiple probes or CpG sites were first grouped based on overlapping RefSeq mRNA IDs. RefSeq gene IDs were then shuf-fled and P-values were computed using MiRaGE, which employs a t-test for both miRNA-targeted-gene promoter methylation and miRNA-mediated regulation of target genes, before and after ran-dom permutation. The methylation data sets used were GSM868008 (for IMR90 cell line) and GSE30653 (for MRC5, BG02 and BG03). ρPearson were computed with Pm:methy = P<
m and Pm:regul = P<m. Gene ex-
pression profiles reported previously for both IMR90 cell lines and MRC5 cell lines were used15. The maximum and minimum values of ρPearsons among 100 independent random permutations are presented. The geometric average for over 100 random permutations of P-values attributed to ρPearson was also computed. In addition, P-values associ-ated with ρPearson before random permutation was estimated based on 100 random permutation ensembles assuming a normal distribution. The normality of the distribution of correlation coefficients from 100 random permutations was checked using both the Shapiro-Wilk nor-mality test and the Kolmogorov-Smirnov test (no significant differ-ences from a normal distribution were detected).
Correlation between seed region features and miRNA-targeted-gene promoter methylationmiRNA seed region features were downloaded from miRmap25. Ac-cording to the target gene table of miRNA26, seed region features attributed to each miRNA were obtained as averages over target genes. Correlations were computed in each cell line between seed region features and P >
m:methy computed by t-test. The distributions over all cell lines are presented.
P-values that represent the significance of differences in seed re-gion features between sets of miRNAs (i.e., miRNA-548 miRNAs or let-7 miRNAs) were computed using the Wilcoxon rank sum test. Corresponding binary logarithmic ratios were also computed.
Results and discussionSignificant promoter hypomethylation of miRNA target genesBased on the inference of data produced using the MiRaGE method21 (see Methods), the promoters of genes that are targets of 70–90% of human miRNAs were significantly hypomethylated, de-pendent on the statistical tests used, and the definition of promoter methylation levels: the β-value or the amount of methylation (see Table 1 and Additional files 1 to 6). This finding was consistent with conclusions made by Su et al.11, who stated that miRNAs had a ten-dency to target genes with hypomethylated promoters. Given that promoter methylation patterns do not change drastically between certain cell types, the amount of miRNA-targeted-gene promoter methylation is also highly cell-type-independent. Mean correlation
Page 7 of 34
F1000Research 2013, 2:21 Last updated: 05 MAR 2015
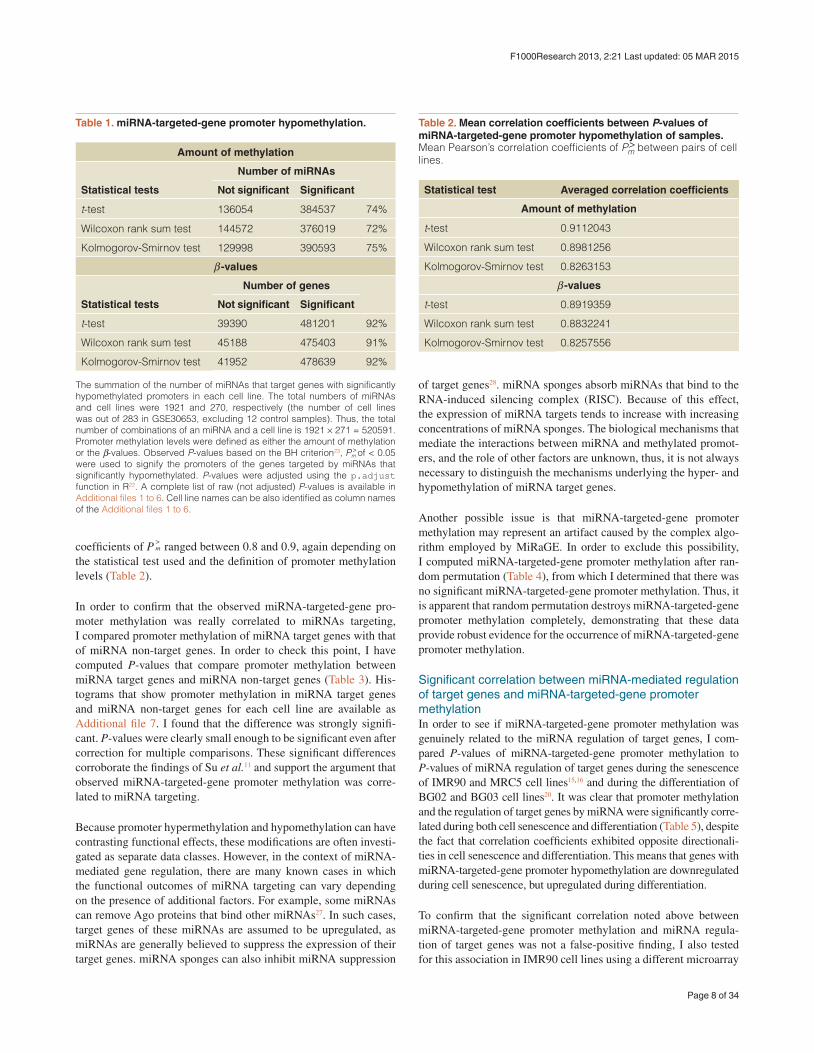
coefficients of P >m ranged between 0.8 and 0.9, again depending on
the statistical test used and the definition of promoter methylation levels (Table 2).
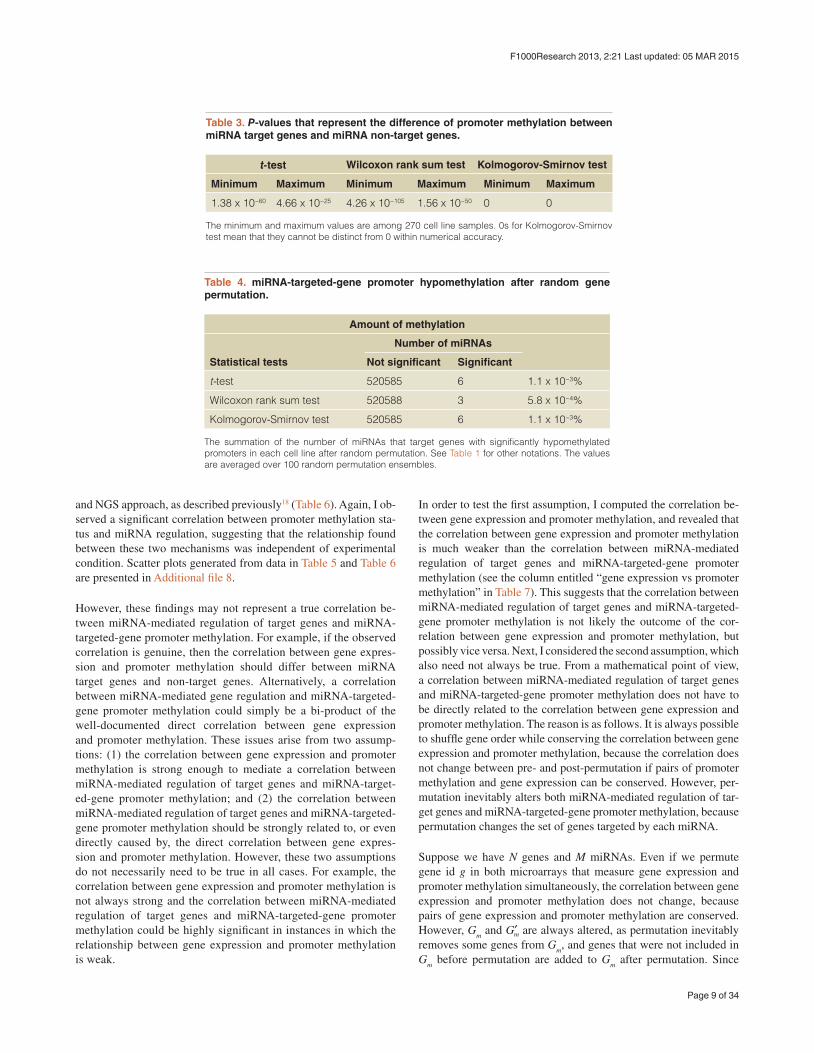
In order to confirm that the observed miRNA-targeted-gene pro-moter methylation was really correlated to miRNAs targeting, I compared promoter methylation of miRNA target genes with that of miRNA non-target genes. In order to check this point, I have computed P-values that compare promoter methylation between miRNA target genes and miRNA non-target genes (Table 3). His-tograms that show promoter methylation in miRNA target genes and miRNA non-target genes for each cell line are available as Additional file 7. I found that the difference was strongly signifi-cant. P-values were clearly small enough to be significant even after correction for multiple comparisons. These significant differences corroborate the findings of Su et al.11 and support the argument that observed miRNA-targeted-gene promoter methylation was corre-lated to miRNA targeting.
Because promoter hypermethylation and hypomethylation can have contrasting functional effects, these modifications are often investi-gated as separate data classes. However, in the context of miRNA-mediated gene regulation, there are many known cases in which the functional outcomes of miRNA targeting can vary depending on the presence of additional factors. For example, some miRNAs can remove Ago proteins that bind other miRNAs27. In such cases, target genes of these miRNAs are assumed to be upregulated, as miRNAs are generally believed to suppress the expression of their target genes. miRNA sponges can also inhibit miRNA suppression
of target genes28. miRNA sponges absorb miRNAs that bind to the RNA-induced silencing complex (RISC). Because of this effect, the expression of miRNA targets tends to increase with increasing concentrations of miRNA sponges. The biological mechanisms that mediate the interactions between miRNA and methylated promot-ers, and the role of other factors are unknown, thus, it is not always necessary to distinguish the mechanisms underlying the hyper- and hypomethylation of miRNA target genes.
Another possible issue is that miRNA-targeted-gene promoter methylation may represent an artifact caused by the complex algo-rithm employed by MiRaGE. In order to exclude this possibility, I computed miRNA-targeted-gene promoter methylation after ran-dom permutation (Table 4), from which I determined that there was no significant miRNA-targeted-gene promoter methylation. Thus, it is apparent that random permutation destroys miRNA-targeted-gene promoter methylation completely, demonstrating that these data provide robust evidence for the occurrence of miRNA-targeted-gene promoter methylation.
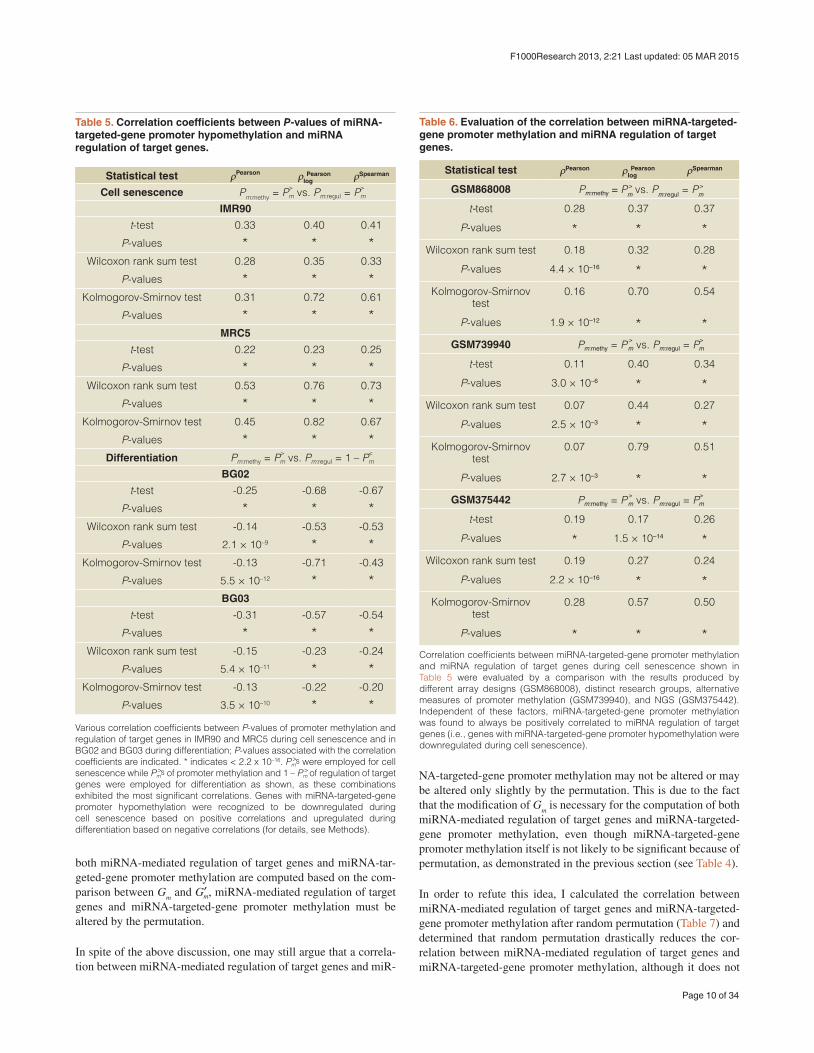
Significant correlation between miRNA-mediated regulation of target genes and miRNA-targeted-gene promoter methylationIn order to see if miRNA-targeted-gene promoter methylation was genuinely related to the miRNA regulation of target genes, I com-pared P-values of miRNA-targeted-gene promoter methylation to P-values of miRNA regulation of target genes during the senescence of IMR90 and MRC5 cell lines15,16 and during the differentiation of BG02 and BG03 cell lines20. It was clear that promoter methylation and the regulation of target genes by miRNA were significantly corre-lated during both cell senescence and differentiation (Table 5), despite the fact that correlation coefficients exhibited opposite directionali-ties in cell senescence and differentiation. This means that genes with miRNA-targeted-gene promoter hypomethylation are downregulated during cell senescence, but upregulated during differentiation.
To confirm that the significant correlation noted above between miRNA-targeted-gene promoter methylation and miRNA regula-tion of target genes was not a false-positive finding, I also tested for this association in IMR90 cell lines using a different microarray
Table 1. miRNA-targeted-gene promoter hypomethylation.
Amount of methylation
Number of miRNAs
Statistical tests Not significant Significant
t-test 136054 384537 74%
Wilcoxon rank sum test 144572 376019 72%
Kolmogorov-Smirnov test 129998 390593 75%
β -values
Number of genes
Statistical tests Not significant Significant
t-test 39390 481201 92%
Wilcoxon rank sum test 45188 475403 91%
Kolmogorov-Smirnov test 41952 478639 92%
The summation of the number of miRNAs that target genes with significantly hypomethylated promoters in each cell line. The total numbers of miRNAs and cell lines were 1921 and 270, respectively (the number of cell lines was out of 283 in GSE30653, excluding 12 control samples). Thus, the total number of combinations of an miRNA and a cell line is 1921 × 271 = 520591. Promoter methylation levels were defined as either the amount of methylation or the β-values. Observed P-values based on the BH criterion23, P >m of < 0.05 were used to signify the promoters of the genes targeted by miRNAs that significantly hypomethylated. P-values were adjusted using the p.adjust function in R22. A complete list of raw (not adjusted) P-values is available in Additional files 1 to 6. Cell line names can be also identified as column names of the Additional files 1 to 6.
Table 2. Mean correlation coefficients between P-values of miRNA-targeted-gene promoter hypomethylation of samples. Mean Pearson’s correlation coefficients of P>
m between pairs of cell lines.
Statistical test Averaged correlation coefficients
Amount of methylation
t-test 0.9112043
Wilcoxon rank sum test 0.8981256
Kolmogorov-Smirnov test 0.8263153
β -values
t-test 0.8919359
Wilcoxon rank sum test 0.8832241
Kolmogorov-Smirnov test 0.8257556
Page 8 of 34
F1000Research 2013, 2:21 Last updated: 05 MAR 2015
and NGS approach, as described previously18 (Table 6). Again, I ob-served a significant correlation between promoter methylation sta-tus and miRNA regulation, suggesting that the relationship found between these two mechanisms was independent of experimental condition. Scatter plots generated from data in Table 5 and Table 6 are presented in Additional file 8.
However, these findings may not represent a true correlation be-tween miRNA-mediated regulation of target genes and miRNA-targeted-gene promoter methylation. For example, if the observed correlation is genuine, then the correlation between gene expres-sion and promoter methylation should differ between miRNA target genes and non-target genes. Alternatively, a correlation between miRNA-mediated gene regulation and miRNA-targeted-gene promoter methylation could simply be a bi-product of the well-documented direct correlation between gene expression and promoter methylation. These issues arise from two assump-tions: (1) the correlation between gene expression and promoter methylation is strong enough to mediate a correlation between miRNA-mediated regulation of target genes and miRNA-target-ed-gene promoter methylation; and (2) the correlation between miRNA-mediated regulation of target genes and miRNA-targeted-gene promoter methylation should be strongly related to, or even directly caused by, the direct correlation between gene expres-sion and promoter methylation. However, these two assumptions do not necessarily need to be true in all cases. For example, the correlation between gene expression and promoter methylation is not always strong and the correlation between miRNA-mediated regulation of target genes and miRNA-targeted-gene promoter methylation could be highly significant in instances in which the relationship between gene expression and promoter methylation is weak.
In order to test the first assumption, I computed the correlation be-tween gene expression and promoter methylation, and revealed that the correlation between gene expression and promoter methylation is much weaker than the correlation between miRNA-mediated regulation of target genes and miRNA-targeted-gene promoter methylation (see the column entitled “gene expression vs promoter methylation” in Table 7). This suggests that the correlation between miRNA-mediated regulation of target genes and miRNA-targeted-gene promoter methylation is not likely the outcome of the cor-relation between gene expression and promoter methylation, but possibly vice versa. Next, I considered the second assumption, which also need not always be true. From a mathematical point of view, a correlation between miRNA-mediated regulation of target genes and miRNA-targeted-gene promoter methylation does not have to be directly related to the correlation between gene expression and promoter methylation. The reason is as follows. It is always possible to shuffle gene order while conserving the correlation between gene expression and promoter methylation, because the correlation does not change between pre- and post-permutation if pairs of promoter methylation and gene expression can be conserved. However, per-mutation inevitably alters both miRNA-mediated regulation of tar-get genes and miRNA-targeted-gene promoter methylation, because permutation changes the set of genes targeted by each miRNA.
Suppose we have N genes and M miRNAs. Even if we permute gene id g in both microarrays that measure gene expression and promoter methylation simultaneously, the correlation between gene expression and promoter methylation does not change, because pairs of gene expression and promoter methylation are conserved. However, G
m and G′m are always altered, as permutation inevitably
removes some genes from Gm, and genes that were not included in
Gm before permutation are added to G
m after permutation. Since
Table 3. P-values that represent the difference of promoter methylation between miRNA target genes and miRNA non-target genes.
t-test Wilcoxon rank sum test Kolmogorov-Smirnov test
Minimum Maximum Minimum Maximum Minimum Maximum
1.38 x 10−60 4.66 x 10⁻²⁵ 4.26 x 10−105 1.56 x 10−50 0 0
The minimum and maximum values are among 270 cell line samples. 0s for Kolmogorov-Smirnov test mean that they cannot be distinct from 0 within numerical accuracy.
Table 4. miRNA-targeted-gene promoter hypomethylation after random gene permutation.
Amount of methylation
Number of miRNAs
Statistical tests Not significant Significant
t-test 520585 6 1.1 x 10⁻³%
Wilcoxon rank sum test 520588 3 5.8 x 10⁻⁴%
Kolmogorov-Smirnov test 520585 6 1.1 x 10⁻³%
The summation of the number of miRNAs that target genes with significantly hypomethylated promoters in each cell line after random permutation. See Table 1 for other notations. The values are averaged over 100 random permutation ensembles.
Page 9 of 34
F1000Research 2013, 2:21 Last updated: 05 MAR 2015
NA-targeted-gene promoter methylation may not be altered or may be altered only slightly by the permutation. This is due to the fact that the modification of G
m is necessary for the computation of both
miRNA-mediated regulation of target genes and miRNA-targeted-gene promoter methylation, even though miRNA-targeted-gene promoter methylation itself is not likely to be significant because of permutation, as demonstrated in the previous section (see Table 4).
In order to refute this idea, I calculated the correlation between miRNA-mediated regulation of target genes and miRNA-targeted-gene promoter methylation after random permutation (Table 7) and determined that random permutation drastically reduces the cor-relation between miRNA-mediated regulation of target genes and miRNA-targeted-gene promoter methylation, although it does not
Table 6. Evaluation of the correlation between miRNA-targeted-gene promoter methylation and miRNA regulation of target genes.
Statistical test ŠPearson ŠlogPearson ŠSpearman
GSM868008 Pm:methy = Pm> vs. Pm:regul = Pm
>
t-test 0.28 0.37 0.37
P-values * * *Wilcoxon rank sum test 0.18 0.32 0.28
P-values 4.4 × 10⁻¹⁶ * *Kolmogorov-Smirnov
test0.16 0.70 0.54
P-values 1.9 × 10⁻¹² * *GSM739940 Pm:methy = P >
m vs. Pm:regul = P>m
t-test 0.11 0.40 0.34
P-values 3.0 × 10⁻⁶ * *Wilcoxon rank sum test 0.07 0.44 0.27
P-values 2.5 × 10⁻³ * *Kolmogorov-Smirnov
test0.07 0.79 0.51
P-values 2.7 × 10⁻³ * *GSM375442 Pm:methy = P >
m vs. Pm:regul = P>m
t-test 0.19 0.17 0.26
P-values * 1.5 × 10⁻¹⁴ *Wilcoxon rank sum test 0.19 0.27 0.24
P-values 2.2 × 10⁻¹⁶ * *Kolmogorov-Smirnov
test0.28 0.57 0.50
P-values * * *Correlation coefficients between miRNA-targeted-gene promoter methylation and miRNA regulation of target genes during cell senescence shown in Table 5 were evaluated by a comparison with the results produced by different array designs (GSM868008), distinct research groups, alternative measures of promoter methylation (GSM739940), and NGS (GSM375442). Independent of these factors, miRNA-targeted-gene promoter methylation was found to always be positively correlated to miRNA regulation of target genes (i.e., genes with miRNA-targeted-gene promoter hypomethylation were downregulated during cell senescence).
both miRNA-mediated regulation of target genes and miRNA-tar-geted-gene promoter methylation are computed based on the com-parison between G
m and G′m, miRNA-mediated regulation of target
genes and miRNA-targeted-gene promoter methylation must be altered by the permutation.
In spite of the above discussion, one may still argue that a correla-tion between miRNA-mediated regulation of target genes and miR-
Table 5. Correlation coefficients between P-values of miRNA-targeted-gene promoter hypomethylation and miRNA regulation of target genes.
Statistical test ŠPearson ŠlogPearson ŠSpearman
Cell senescence Pm:methy = P>m vs. Pm:regul = P>
m
IMR90
t-test 0.33 0.40 0.41
P-values * * *Wilcoxon rank sum test 0.28 0.35 0.33
P-values * * *Kolmogorov-Smirnov test 0.31 0.72 0.61
P-values * * *MRC5
t-test 0.22 0.23 0.25
P-values * * *Wilcoxon rank sum test 0.53 0.76 0.73
P-values * * *Kolmogorov-Smirnov test 0.45 0.82 0.67
P-values * * *Differentiation Pm:methy = P>
m vs. Pm:regul = 1 – P<m
BG02
t-test -0.25 -0.68 -0.67
P-values * * *Wilcoxon rank sum test -0.14 -0.53 -0.53
P-values 2.1 × 10⁻⁹ * *Kolmogorov-Smirnov test -0.13 -0.71 -0.43
P-values 5.5 × 10⁻¹² * *BG03
t-test -0.31 -0.57 -0.54
P-values * * *Wilcoxon rank sum test -0.15 -0.23 -0.24
P-values 5.4 × 10⁻¹¹ * *Kolmogorov-Smirnov test -0.13 -0.22 -0.20
P-values 3.5 × 10⁻¹⁰ * *Various correlation coefficients between P-values of promoter methylation and regulation of target genes in IMR90 and MRC5 during cell senescence and in BG02 and BG03 during differentiation; P-values associated with the correlation coefficients are indicated. * indicates < 2.2 x 10⁻¹⁶. P >ms were employed for cell senescence while P >ms of promoter methylation and 1 – P >m of regulation of target genes were employed for differentiation as shown, as these combinations exhibited the most significant correlations. Genes with miRNA-targeted-gene promoter hypomethylation were recognized to be downregulated during cell senescence based on positive correlations and upregulated during differentiation based on negative correlations (for details, see Methods).
Page 10 of 34
F1000Research 2013, 2:21 Last updated: 05 MAR 2015
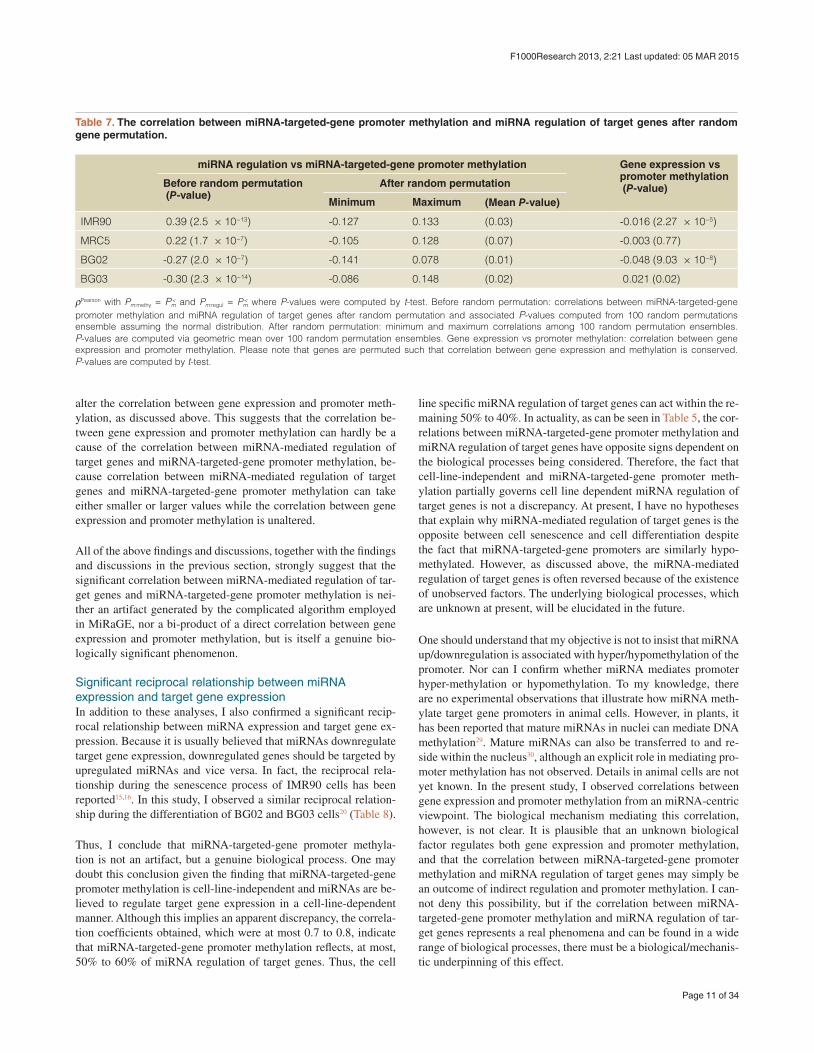
alter the correlation between gene expression and promoter meth-ylation, as discussed above. This suggests that the correlation be-tween gene expression and promoter methylation can hardly be a cause of the correlation between miRNA-mediated regulation of target genes and miRNA-targeted-gene promoter methylation, be-cause correlation between miRNA-mediated regulation of target genes and miRNA-targeted-gene promoter methylation can take either smaller or larger values while the correlation between gene expression and promoter methylation is unaltered.
All of the above findings and discussions, together with the findings and discussions in the previous section, strongly suggest that the significant correlation between miRNA-mediated regulation of tar-get genes and miRNA-targeted-gene promoter methylation is nei-ther an artifact generated by the complicated algorithm employed in MiRaGE, nor a bi-product of a direct correlation between gene expression and promoter methylation, but is itself a genuine bio-logically significant phenomenon.
Significant reciprocal relationship between miRNA expression and target gene expressionIn addition to these analyses, I also confirmed a significant recip-rocal relationship between miRNA expression and target gene ex-pression. Because it is usually believed that miRNAs downregulate target gene expression, downregulated genes should be targeted by upregulated miRNAs and vice versa. In fact, the reciprocal rela-tionship during the senescence process of IMR90 cells has been reported15,16. In this study, I observed a similar reciprocal relation-ship during the differentiation of BG02 and BG03 cells20 (Table 8).
Thus, I conclude that miRNA-targeted-gene promoter methyla-tion is not an artifact, but a genuine biological process. One may doubt this conclusion given the finding that miRNA-targeted-gene promoter methylation is cell-line-independent and miRNAs are be-lieved to regulate target gene expression in a cell-line-dependent manner. Although this implies an apparent discrepancy, the correla-tion coefficients obtained, which were at most 0.7 to 0.8, indicate that miRNA-targeted-gene promoter methylation reflects, at most, 50% to 60% of miRNA regulation of target genes. Thus, the cell
line specific miRNA regulation of target genes can act within the re-maining 50% to 40%. In actuality, as can be seen in Table 5, the cor-relations between miRNA-targeted-gene promoter methylation and miRNA regulation of target genes have opposite signs dependent on the biological processes being considered. Therefore, the fact that cell-line-independent and miRNA-targeted-gene promoter meth-ylation partially governs cell line dependent miRNA regulation of target genes is not a discrepancy. At present, I have no hypotheses that explain why miRNA-mediated regulation of target genes is the opposite between cell senescence and cell differentiation despite the fact that miRNA-targeted-gene promoters are similarly hypo-methylated. However, as discussed above, the miRNA-mediated regulation of target genes is often reversed because of the existence of unobserved factors. The underlying biological processes, which are unknown at present, will be elucidated in the future.
One should understand that my objective is not to insist that miRNA up/downregulation is associated with hyper/hypomethylation of the promoter. Nor can I confirm whether miRNA mediates promoter hyper-methylation or hypomethylation. To my knowledge, there are no experimental observations that illustrate how miRNA meth-ylate target gene promoters in animal cells. However, in plants, it has been reported that mature miRNAs in nuclei can mediate DNA methylation29. Mature miRNAs can also be transferred to and re-side within the nucleus30, although an explicit role in mediating pro-moter methylation has not observed. Details in animal cells are not yet known. In the present study, I observed correlations between gene expression and promoter methylation from an miRNA-centric viewpoint. The biological mechanism mediating this correlation, however, is not clear. It is plausible that an unknown biological factor regulates both gene expression and promoter methylation, and that the correlation between miRNA-targeted-gene promoter methylation and miRNA regulation of target genes may simply be an outcome of indirect regulation and promoter methylation. I can-not deny this possibility, but if the correlation between miRNA-targeted-gene promoter methylation and miRNA regulation of tar-get genes represents a real phenomena and can be found in a wide range of biological processes, there must be a biological/mechanis-tic underpinning of this effect.
Table 7. The correlation between miRNA-targeted-gene promoter methylation and miRNA regulation of target genes after random gene permutation.
miRNA regulation vs miRNA-targeted-gene promoter methylation Gene expression vs promoter methylation (P-value)Before random permutation
(P-value)After random permutation
Minimum Maximum (Mean P-value)
IMR90 0.39 (2.5 × 10⁻¹³) -0.127 0.133 (0.03) -0.016 (2.27 × 10⁻⁵)
MRC5 0.22 (1.7 × 10⁻⁷) -0.105 0.128 (0.07) -0.003 (0.77)
BG02 -0.27 (2.0 × 10⁻⁷) -0.141 0.078 (0.01) -0.048 (9.03 × 10⁻⁸)
BG03 -0.30 (2.3 × 10⁻¹⁴) -0.086 0.148 (0.02) 0.021 (0.02)
ρPearson with Pm:methy = Pm< and Pm:regul = Pm
< where P-values were computed by t-test. Before random permutation: correlations between miRNA-targeted-gene promoter methylation and miRNA regulation of target genes after random permutation and associated P-values computed from 100 random permutations ensemble assuming the normal distribution. After random permutation: minimum and maximum correlations among 100 random permutation ensembles. P-values are computed via geometric mean over 100 random permutation ensembles. Gene expression vs promoter methylation: correlation between gene expression and promoter methylation. Please note that genes are permuted such that correlation between gene expression and methylation is conserved. P-values are computed by t-test.
Page 11 of 34
F1000Research 2013, 2:21 Last updated: 05 MAR 2015
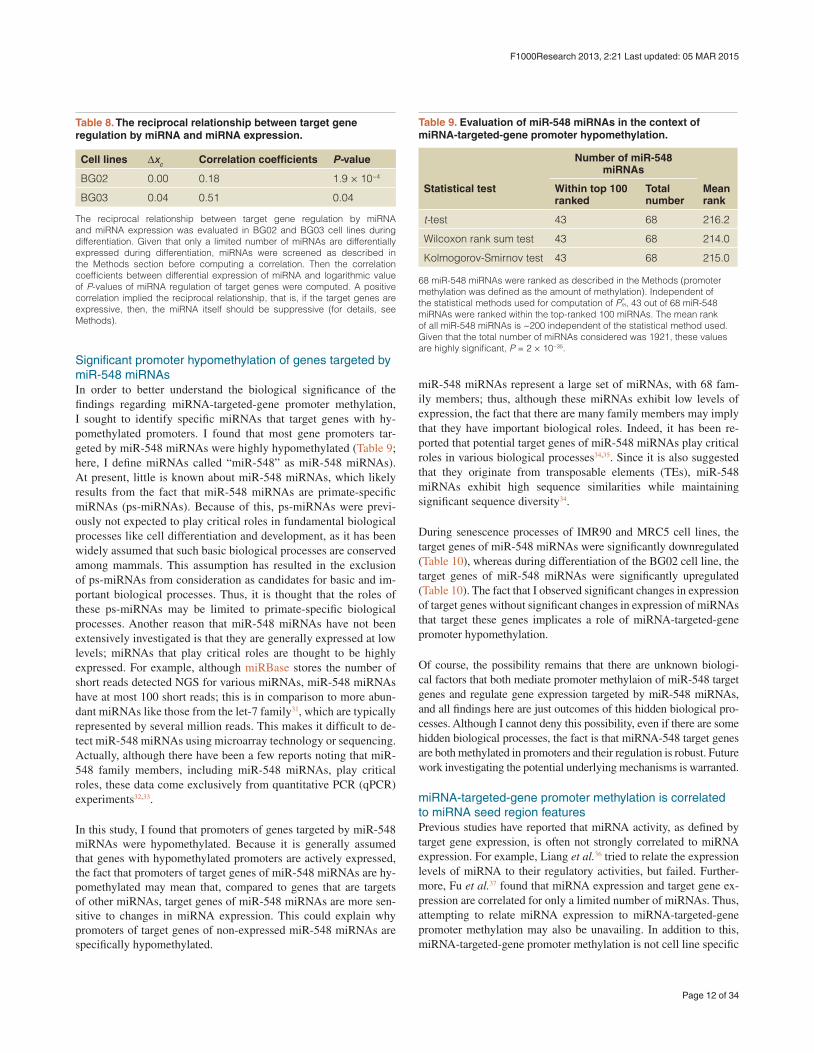
Significant promoter hypomethylation of genes targeted by miR-548 miRNAsIn order to better understand the biological significance of the findings regarding miRNA-targeted-gene promoter methylation, I sought to identify specific miRNAs that target genes with hy-pomethylated promoters. I found that most gene promoters tar-geted by miR-548 miRNAs were highly hypomethylated (Table 9; here, I define miRNAs called “miR-548” as miR-548 miRNAs). At present, little is known about miR-548 miRNAs, which likely results from the fact that miR-548 miRNAs are primate-specific miRNAs (ps-miRNAs). Because of this, ps-miRNAs were previ-ously not expected to play critical roles in fundamental biological processes like cell differentiation and development, as it has been widely assumed that such basic biological processes are conserved among mammals. This assumption has resulted in the exclusion of ps-miRNAs from consideration as candidates for basic and im-portant biological processes. Thus, it is thought that the roles of these ps-miRNAs may be limited to primate-specific biological processes. Another reason that miR-548 miRNAs have not been extensively investigated is that they are generally expressed at low levels; miRNAs that play critical roles are thought to be highly expressed. For example, although miRBase stores the number of short reads detected NGS for various miRNAs, miR-548 miRNAs have at most 100 short reads; this is in comparison to more abun-dant miRNAs like those from the let-7 family31, which are typically represented by several million reads. This makes it difficult to de-tect miR-548 miRNAs using microarray technology or sequencing. Actually, although there have been a few reports noting that miR-548 family members, including miR-548 miRNAs, play critical roles, these data come exclusively from quantitative PCR (qPCR) experiments32,33.
In this study, I found that promoters of genes targeted by miR-548 miRNAs were hypomethylated. Because it is generally assumed that genes with hypomethylated promoters are actively expressed, the fact that promoters of target genes of miR-548 miRNAs are hy-pomethylated may mean that, compared to genes that are targets of other miRNAs, target genes of miR-548 miRNAs are more sen-sitive to changes in miRNA expression. This could explain why promoters of target genes of non-expressed miR-548 miRNAs are specifically hypomethylated.
miR-548 miRNAs represent a large set of miRNAs, with 68 fam-ily members; thus, although these miRNAs exhibit low levels of expression, the fact that there are many family members may imply that they have important biological roles. Indeed, it has been re-ported that potential target genes of miR-548 miRNAs play critical roles in various biological processes34,35. Since it is also suggested that they originate from transposable elements (TEs), miR-548 miRNAs exhibit high sequence similarities while maintaining significant sequence diversity34.
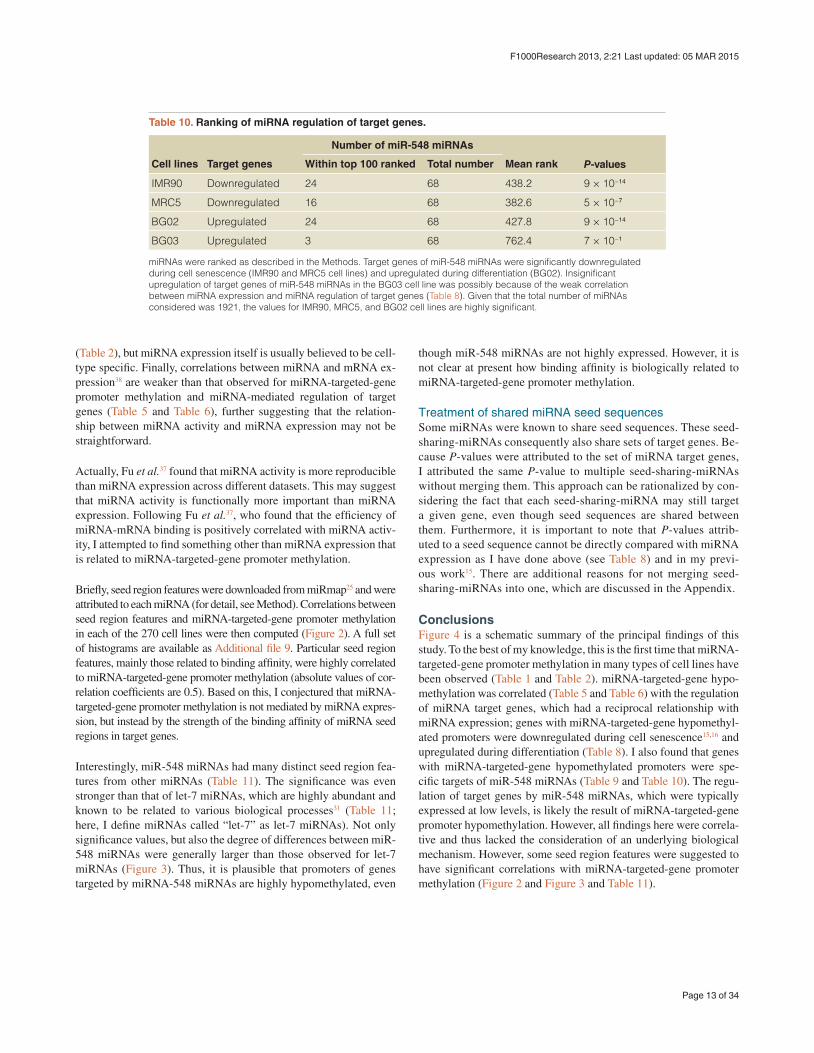
During senescence processes of IMR90 and MRC5 cell lines, the target genes of miR-548 miRNAs were significantly downregulated (Table 10), whereas during differentiation of the BG02 cell line, the target genes of miR-548 miRNAs were significantly upregulated (Table 10). The fact that I observed significant changes in expression of target genes without significant changes in expression of miRNAs that target these genes implicates a role of miRNA-targeted-gene promoter hypomethylation.
Of course, the possibility remains that there are unknown biologi-cal factors that both mediate promoter methylaion of miR-548 target genes and regulate gene expression targeted by miR-548 miRNAs, and all findings here are just outcomes of this hidden biological pro-cesses. Although I cannot deny this possibility, even if there are some hidden biological processes, the fact is that miRNA-548 target genes are both methylated in promoters and their regulation is robust. Future work investigating the potential underlying mechanisms is warranted.
miRNA-targeted-gene promoter methylation is correlated to miRNA seed region featuresPrevious studies have reported that miRNA activity, as defined by target gene expression, is often not strongly correlated to miRNA expression. For example, Liang et al.36 tried to relate the expression levels of miRNA to their regulatory activities, but failed. Further-more, Fu et al.37 found that miRNA expression and target gene ex-pression are correlated for only a limited number of miRNAs. Thus, attempting to relate miRNA expression to miRNA-targeted-gene promoter methylation may also be unavailing. In addition to this, miRNA-targeted-gene promoter methylation is not cell line specific
Table 8. The reciprocal relationship between target gene regulation by miRNA and miRNA expression.
Cell lines ∆xc Correlation coefficients P-value
BG02 0.00 0.18 1.9 × 10⁻⁴
BG03 0.04 0.51 0.04
The reciprocal relationship between target gene regulation by miRNA and miRNA expression was evaluated in BG02 and BG03 cell lines during differentiation. Given that only a limited number of miRNAs are differentially expressed during differentiation, miRNAs were screened as described in the Methods section before computing a correlation. Then the correlation coefficients between differential expression of miRNA and logarithmic value of P-values of miRNA regulation of target genes were computed. A positive correlation implied the reciprocal relationship, that is, if the target genes are expressive, then, the miRNA itself should be suppressive (for details, see Methods).
Table 9. Evaluation of miR-548 miRNAs in the context of miRNA-targeted-gene promoter hypomethylation.
Number of miR-548 miRNAs
Statistical test Within top 100 ranked
Total number
Mean rank
t-test 43 68 216.2
Wilcoxon rank sum test 43 68 214.0
Kolmogorov-Smirnov test 43 68 215.0
68 miR-548 miRNAs were ranked as described in the Methods (promoter methylation was defined as the amount of methylation). Independent of the statistical methods used for computation of P
>m, 43 out of 68 miR-548
miRNAs were ranked within the top-ranked 100 miRNAs. The mean rank of all miR-548 miRNAs is ~200 independent of the statistical method used. Given that the total number of miRNAs considered was 1921, these values are highly significant, P = 2 × 10⁻³⁵.
Page 12 of 34
F1000Research 2013, 2:21 Last updated: 05 MAR 2015
(Table 2), but miRNA expression itself is usually believed to be cell-type specific. Finally, correlations between miRNA and mRNA ex-pression38 are weaker than that observed for miRNA-targeted-gene promoter methylation and miRNA-mediated regulation of target genes (Table 5 and Table 6), further suggesting that the relation-ship between miRNA activity and miRNA expression may not be straightforward.
Actually, Fu et al.37 found that miRNA activity is more reproducible than miRNA expression across different datasets. This may suggest that miRNA activity is functionally more important than miRNA expression. Following Fu et al.37, who found that the efficiency of miRNA-mRNA binding is positively correlated with miRNA activ-ity, I attempted to find something other than miRNA expression that is related to miRNA-targeted-gene promoter methylation.
Briefly, seed region features were downloaded from miRmap25 and were attributed to each miRNA (for detail, see Method). Correlations between seed region features and miRNA-targeted-gene promoter methylation in each of the 270 cell lines were then computed (Figure 2). A full set of histograms are available as Additional file 9. Particular seed region features, mainly those related to binding affinity, were highly correlated to miRNA-targeted-gene promoter methylation (absolute values of cor-relation coefficients are 0.5). Based on this, I conjectured that miRNA-targeted-gene promoter methylation is not mediated by miRNA expres-sion, but instead by the strength of the binding affinity of miRNA seed regions in target genes.
Interestingly, miR-548 miRNAs had many distinct seed region fea-tures from other miRNAs (Table 11). The significance was even stronger than that of let-7 miRNAs, which are highly abundant and known to be related to various biological processes31 (Table 11; here, I define miRNAs called “let-7” as let-7 miRNAs). Not only significance values, but also the degree of differences between miR-548 miRNAs were generally larger than those observed for let-7 miRNAs (Figure 3). Thus, it is plausible that promoters of genes targeted by miRNA-548 miRNAs are highly hypomethylated, even
though miR-548 miRNAs are not highly expressed. However, it is not clear at present how binding affinity is biologically related to miRNA-targeted-gene promoter methylation.
Treatment of shared miRNA seed sequencesSome miRNAs were known to share seed sequences. These seed-sharing-miRNAs consequently also share sets of target genes. Be-cause P-values were attributed to the set of miRNA target genes, I attributed the same P-value to multiple seed-sharing-miRNAs without merging them. This approach can be rationalized by con-sidering the fact that each seed-sharing-miRNA may still target a given gene, even though seed sequences are shared between them. Furthermore, it is important to note that P-values attrib-uted to a seed sequence cannot be directly compared with miRNA expression as I have done above (see Table 8) and in my previ-ous work15. There are additional reasons for not merging seed-sharing-miRNAs into one, which are discussed in the Appendix.
ConclusionsFigure 4 is a schematic summary of the principal findings of this study. To the best of my knowledge, this is the first time that miRNA-targeted-gene promoter methylation in many types of cell lines have been observed (Table 1 and Table 2). miRNA-targeted-gene hypo-methylation was correlated (Table 5 and Table 6) with the regulation of miRNA target genes, which had a reciprocal relationship with miRNA expression; genes with miRNA-targeted-gene hypomethyl-ated promoters were downregulated during cell senescence15,16 and upregulated during differentiation (Table 8). I also found that genes with miRNA-targeted-gene hypomethylated promoters were spe-cific targets of miR-548 miRNAs (Table 9 and Table 10). The regu-lation of target genes by miR-548 miRNAs, which were typically expressed at low levels, is likely the result of miRNA-targeted-gene promoter hypomethylation. However, all findings here were correla-tive and thus lacked the consideration of an underlying biological mechanism. However, some seed region features were suggested to have significant correlations with miRNA-targeted-gene promoter methylation (Figure 2 and Figure 3 and Table 11).
Table 10. Ranking of miRNA regulation of target genes.
Number of miR-548 miRNAs
Cell lines Target genes Within top 100 ranked Total number Mean rank P-values
IMR90 Downregulated 24 68 438.2 9 × 10⁻¹⁴
MRC5 Downregulated 16 68 382.6 5 × 10⁻⁷
BG02 Upregulated 24 68 427.8 9 × 10⁻¹⁴
BG03 Upregulated 3 68 762.4 7 × 10⁻¹
miRNAs were ranked as described in the Methods. Target genes of miR-548 miRNAs were significantly downregulated during cell senescence (IMR90 and MRC5 cell lines) and upregulated during differentiation (BG02). Insignificant upregulation of target genes of miR-548 miRNAs in the BG03 cell line was possibly because of the weak correlation between miRNA expression and miRNA regulation of target genes (Table 8). Given that the total number of miRNAs considered was 1921, the values for IMR90, MRC5, and BG02 cell lines are highly significant.
Page 13 of 34
F1000Research 2013, 2:21 Last updated: 05 MAR 2015
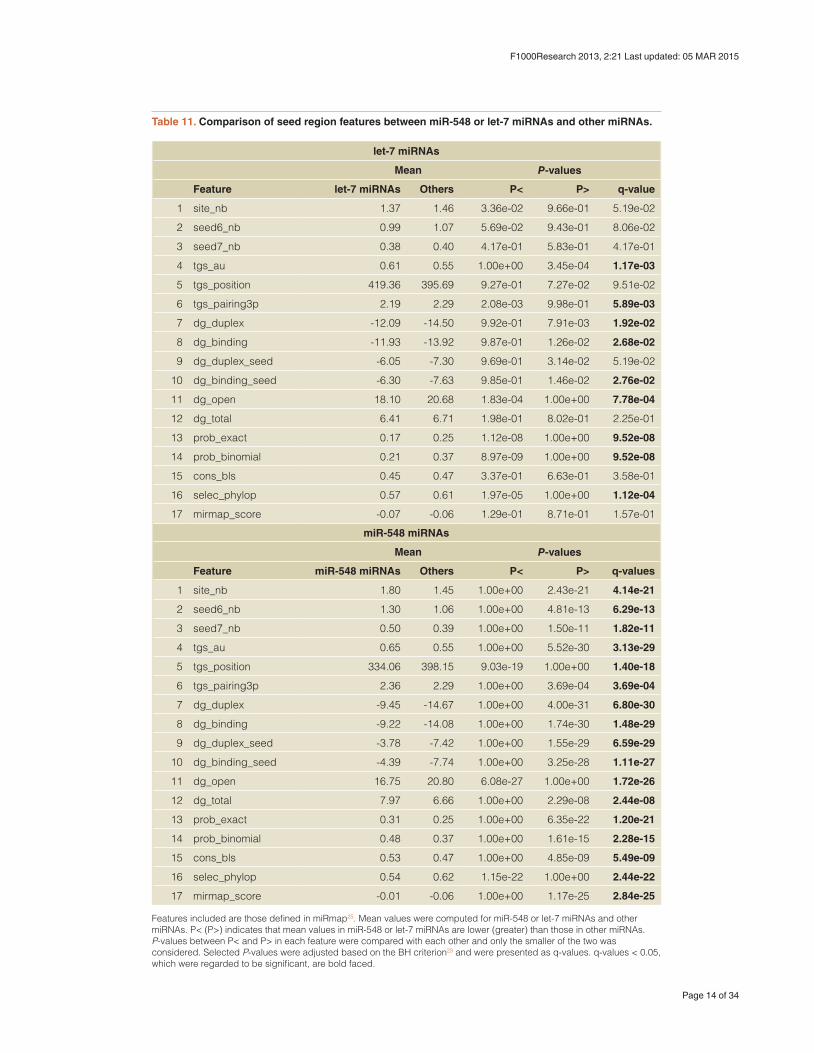
Table 11. Comparison of seed region features between miR-548 or let-7 miRNAs and other miRNAs.
let-7 miRNAs
Mean P-values
Feature let-7 miRNAs Others P< P> q-value
1 site_nb 1.37 1.46 3.36e-02 9.66e-01 5.19e-02
2 seed6_nb 0.99 1.07 5.69e-02 9.43e-01 8.06e-02
3 seed7_nb 0.38 0.40 4.17e-01 5.83e-01 4.17e-01
4 tgs_au 0.61 0.55 1.00e+00 3.45e-04 1.17e-03
5 tgs_position 419.36 395.69 9.27e-01 7.27e-02 9.51e-02
6 tgs_pairing3p 2.19 2.29 2.08e-03 9.98e-01 5.89e-03
7 dg_duplex -12.09 -14.50 9.92e-01 7.91e-03 1.92e-02
8 dg_binding -11.93 -13.92 9.87e-01 1.26e-02 2.68e-02
9 dg_duplex_seed -6.05 -7.30 9.69e-01 3.14e-02 5.19e-02
10 dg_binding_seed -6.30 -7.63 9.85e-01 1.46e-02 2.76e-02
11 dg_open 18.10 20.68 1.83e-04 1.00e+00 7.78e-04
12 dg_total 6.41 6.71 1.98e-01 8.02e-01 2.25e-01
13 prob_exact 0.17 0.25 1.12e-08 1.00e+00 9.52e-08
14 prob_binomial 0.21 0.37 8.97e-09 1.00e+00 9.52e-08
15 cons_bls 0.45 0.47 3.37e-01 6.63e-01 3.58e-01
16 selec_phylop 0.57 0.61 1.97e-05 1.00e+00 1.12e-04
17 mirmap_score -0.07 -0.06 1.29e-01 8.71e-01 1.57e-01
miR-548 miRNAs
Mean P-values
Feature miR-548 miRNAs Others P< P> q-values
1 site_nb 1.80 1.45 1.00e+00 2.43e-21 4.14e-21
2 seed6_nb 1.30 1.06 1.00e+00 4.81e-13 6.29e-13
3 seed7_nb 0.50 0.39 1.00e+00 1.50e-11 1.82e-11
4 tgs_au 0.65 0.55 1.00e+00 5.52e-30 3.13e-29
5 tgs_position 334.06 398.15 9.03e-19 1.00e+00 1.40e-18
6 tgs_pairing3p 2.36 2.29 1.00e+00 3.69e-04 3.69e-04
7 dg_duplex -9.45 -14.67 1.00e+00 4.00e-31 6.80e-30
8 dg_binding -9.22 -14.08 1.00e+00 1.74e-30 1.48e-29
9 dg_duplex_seed -3.78 -7.42 1.00e+00 1.55e-29 6.59e-29
10 dg_binding_seed -4.39 -7.74 1.00e+00 3.25e-28 1.11e-27
11 dg_open 16.75 20.80 6.08e-27 1.00e+00 1.72e-26
12 dg_total 7.97 6.66 1.00e+00 2.29e-08 2.44e-08
13 prob_exact 0.31 0.25 1.00e+00 6.35e-22 1.20e-21
14 prob_binomial 0.48 0.37 1.00e+00 1.61e-15 2.28e-15
15 cons_bls 0.53 0.47 1.00e+00 4.85e-09 5.49e-09
16 selec_phylop 0.54 0.62 1.15e-22 1.00e+00 2.44e-22
17 mirmap_score -0.01 -0.06 1.00e+00 1.17e-25 2.84e-25
Features included are those defined in miRmap25. Mean values were computed for miR-548 or let-7 miRNAs and other miRNAs. P< (P>) indicates that mean values in miR-548 or let-7 miRNAs are lower (greater) than those in other miRNAs. P-values between P< and P> in each feature were compared with each other and only the smaller of the two was considered. Selected P-values were adjusted based on the BH criterion23 and were presented as q-values. q-values < 0.05, which were regarded to be significant, are bold faced.
Page 14 of 34
F1000Research 2013, 2:21 Last updated: 05 MAR 2015
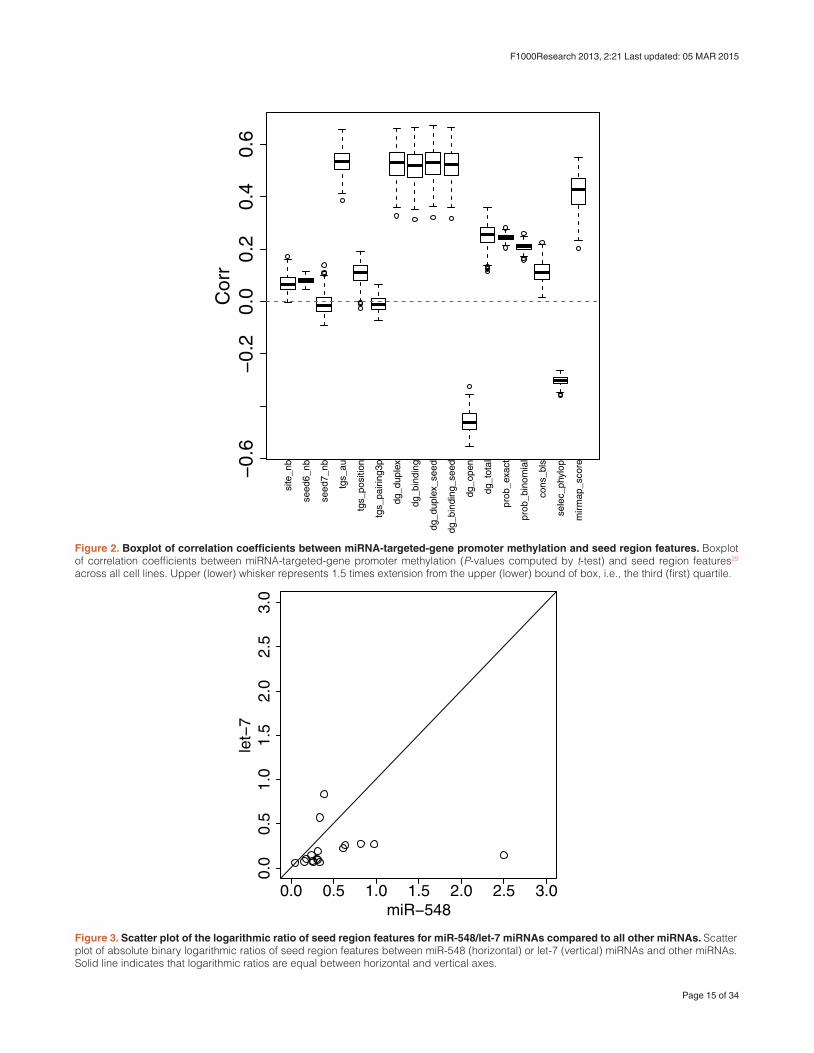
Figure 2. Boxplot of correlation coefficients between miRNA-targeted-gene promoter methylation and seed region features. Boxplot of correlation coefficients between miRNA-targeted-gene promoter methylation (P-values computed by t-test) and seed region features25 across all cell lines. Upper (lower) whisker represents 1.5 times extension from the upper (lower) bound of box, i.e., the third (first) quartile.
Figure 3. Scatter plot of the logarithmic ratio of seed region features for miR-548/let-7 miRNAs compared to all other miRNAs. Scatter plot of absolute binary logarithmic ratios of seed region features between miR-548 (horizontal) or let-7 (vertical) miRNAs and other miRNAs. Solid line indicates that logarithmic ratios are equal between horizontal and vertical axes.
0.0 0.5 1.0 1.5 2.0 2.5 3.0
0.0
0.5
1.0
1.5
2.0
2.5
3.0
miR−548
let−
7−
0.6
−0.
20.
00.
20.
40.
6C
orr
site
_nb
seed
6_nb
seed
7_nb
tgs_
au
tgs_
posi
tion
tgs_
pairi
ng3p
dg_d
uple
x
dg_b
indi
ng
dg_d
uple
x_se
ed
dg_b
indi
ng_s
eed
dg_o
pen
dg_t
otal
prob
_exa
ct
prob
_bin
omia
l
cons
_bls
sele
c_ph
ylop
mir
map
_sco
re
Page 15 of 34
F1000Research 2013, 2:21 Last updated: 05 MAR 2015
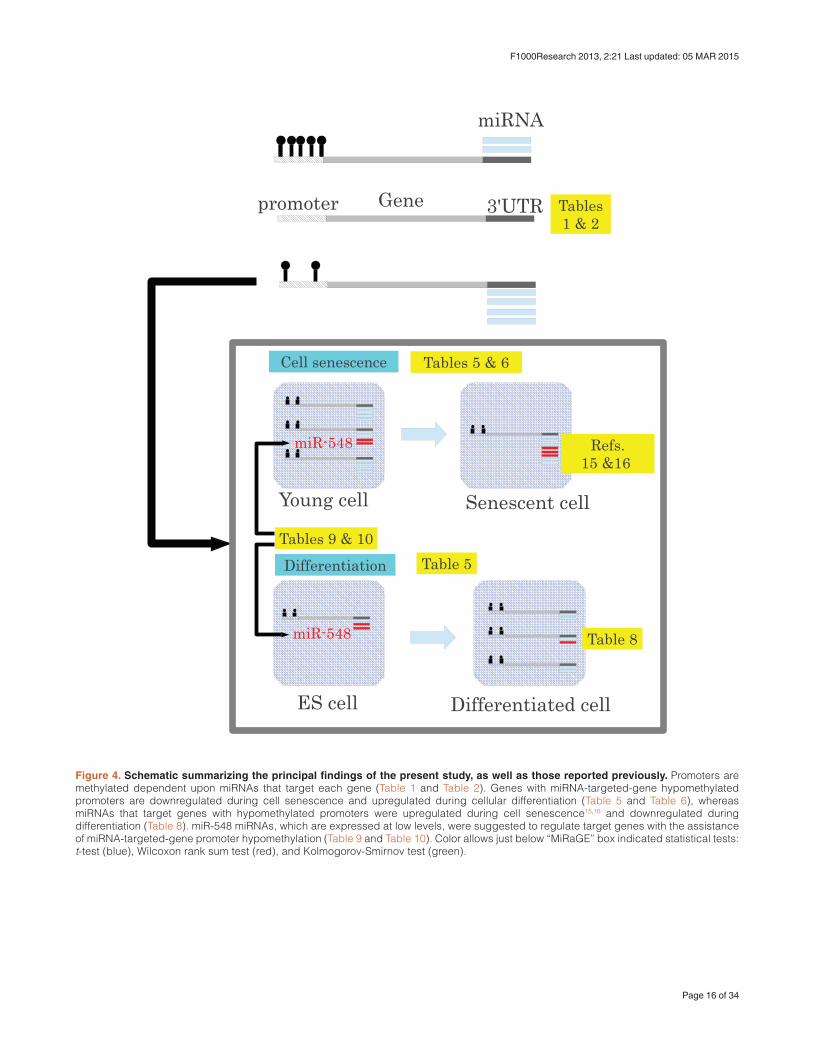
Figure 4. Schematic summarizing the principal findings of the present study, as well as those reported previously. Promoters are methylated dependent upon miRNAs that target each gene (Table 1 and Table 2). Genes with miRNA-targeted-gene hypomethylated promoters are downregulated during cell senescence and upregulated during cellular differentiation (Table 5 and Table 6), whereas miRNAs that target genes with hypomethylated promoters were upregulated during cell senescence15,16 and downregulated during differentiation (Table 8). miR-548 miRNAs, which are expressed at low levels, were suggested to regulate target genes with the assistance of miRNA-targeted-gene promoter hypomethylation (Table 9 and Table 10). Color allows just below “MiRaGE” box indicated statistical tests: t-test (blue), Wilcoxon rank sum test (red), and Kolmogorov-Smirnov test (green).
Page 16 of 34
F1000Research 2013, 2:21 Last updated: 05 MAR 2015
Author contributionsConceived and designed the experiments: YHT. Analyzed the data: YHT. Wrote the paper: YHT.
Competing interestsNo competing interests were disclosed.
Grant informationThis study was supported by KAKENHI (23300357).
The funders had no role in study design, data collection and analy-sis, decision to publish, or preparation of the manuscript.
AcknowledgementsThe author thanks the anonymous reviewer16 who suggested the in-vestigation of promoter methylation of miRNA target genes.
miRNAs sharing the same seed sequence (seed-sharing-miRNAs) were often unified when miRNA-mediated regulation of target genes was computed based on target gene expression. Although it is apparently reasonable, seed-sharing-miRNAs were not unified in this study. The reasons other than mentioned in the main text were as follows.
The first reason is related to multiple comparison correction of P-values . In Figure S1(a), I illustrate the interaction between seed-sharing-miRNAs and target genes. No matter which gene expres-sion or promoter methylation is considered, arrows indicate that miRNAs target genes; there are two genes, g
1 and g
2, that are tar-
geted by two miRNAs, m1 and m
2, that share the same seed se-
quence. Thus, both m1 and m
2 target both g
1 and g
2. Alternatively,
in Figure S1(b), although two miRNAs, m1 and m
2, do not share the
same seed sequence (non-seed-sharing-miRNAs), m1 and m
2 target
g2 while g
1 is targeted by only m
1.
When activity of each miRNA is estimated from the target genes expression or promoter methylation, individual contribution of miRNA m
i to gene g
j, ∆
mi,gj, cannot be known. Only measurable ob-
servations are summation of contributions,
∆ ∆g m gi
j i j= ∑ , ,
where summation is taken over miRNAs i that target gj. Thus I have
to define activity of miRNA mi as
Appendix: Treatment of miRNAs sharing same seed sequence for P-values computation
∆ ∆ ∆m g m gijj
i j i j= = ∑∑∑ , ,
where summation of j is taken over genes targeted by miRNA mi.
This definition is clearly overestimated, since true activity should be
∆ ∆ ∆∼m m g
jmi i j i
= <∑ , ,
where I assumed that each contributions are positive.
In Figure S1(a), apparent total contributions of miRNAs are
∆ ∆ ∆ ∆ ∆ ∆ ∆m g g g m g m g m g m1 1 2 1 1 1 2 2 1 2 2= + = + + +, , , ,
∆ ∆ ∆ ∆ ∆ ∆ ∆m g g g m g m g m g m2 1 2 1 1 1 2 2 1 2 2= + = + + +, , , ,
while true total contributions of miRNAs are
∆ ∆ ∆∼
m g m g m1 1 1 2 1= +, ,
∆ ∆ ∆∼
m g m g m2 1 2 2 2= +, ,
Page 17 of 34
F1000Research 2013, 2:21 Last updated: 05 MAR 2015
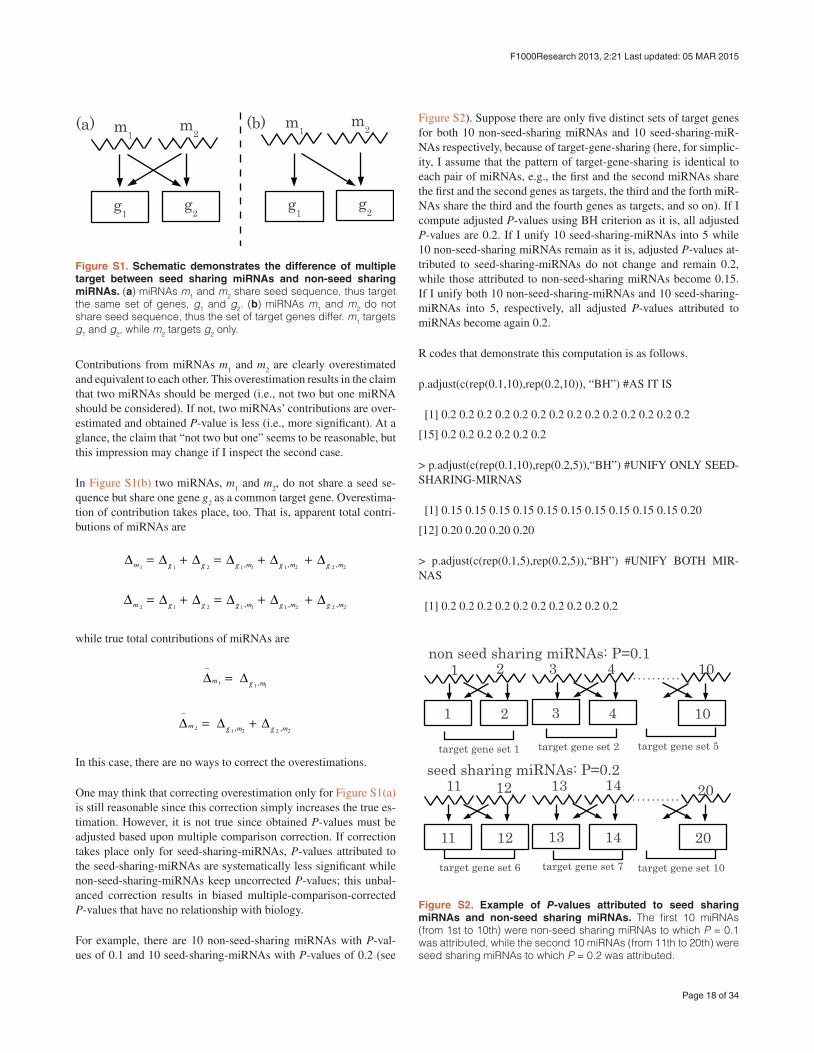
Figure S2). Suppose there are only five distinct sets of target genes for both 10 non-seed-sharing miRNAs and 10 seed-sharing-miR-NAs respectively, because of target-gene-sharing (here, for simplic-ity, I assume that the pattern of target-gene-sharing is identical to each pair of miRNAs, e.g., the first and the second miRNAs share the first and the second genes as targets, the third and the forth miR-NAs share the third and the fourth genes as targets, and so on). If I compute adjusted P-values using BH criterion as it is, all adjusted P-values are 0.2. If I unify 10 seed-sharing-miRNAs into 5 while 10 non-seed-sharing miRNAs remain as it is, adjusted P-values at-tributed to seed-sharing-miRNAs do not change and remain 0.2, while those attributed to non-seed-sharing miRNAs become 0.15. If I unify both 10 non-seed-sharing-miRNAs and 10 seed-sharing-miRNAs into 5, respectively, all adjusted P-values attributed to miRNAs become again 0.2.
R codes that demonstrate this computation is as follows.
p.adjust(c(rep(0.1,10),rep(0.2,10)), “BH”) #AS IT IS
[1] 0.2 0.2 0.2 0.2 0.2 0.2 0.2 0.2 0.2 0.2 0.2 0.2 0.2 0.2
[15] 0.2 0.2 0.2 0.2 0.2 0.2
> p.adjust(c(rep(0.1,10),rep(0.2,5)),“BH”) #UNIFY ONLY SEED-SHARING-MIRNAS
[1] 0.15 0.15 0.15 0.15 0.15 0.15 0.15 0.15 0.15 0.15 0.20
[12] 0.20 0.20 0.20 0.20
> p.adjust(c(rep(0.1,5),rep(0.2,5)),“BH”) #UNIFY BOTH MIR-NAS
[1] 0.2 0.2 0.2 0.2 0.2 0.2 0.2 0.2 0.2 0.2
Contributions from miRNAs m1 and m
2 are clearly overestimated
and equivalent to each other. This overestimation results in the claim that two miRNAs should be merged (i.e., not two but one miRNA should be considered). If not, two miRNAs’ contributions are over-estimated and obtained P-value is less (i.e., more significant). At a glance, the claim that “not two but one” seems to be reasonable, but this impression may change if I inspect the second case.
In Figure S1(b) two miRNAs, m1 and m
2, do not share a seed se-
quence but share one gene g2 as a common target gene. Overestima-
tion of contribution takes place, too. That is, apparent total contri-butions of miRNAs are
∆ ∆ ∆ ∆ ∆ ∆m g g g m g m g m1 1 2 1 1 1 2 2 2= + = + +, , ,
∆ ∆ ∆ ∆ ∆ ∆m g g g m g m g m2 1 2 1 1 1 2 2 2= + = + +, , ,
while true total contributions of miRNAs are
∆ ∆∼
m g m1 1 1= ,
∆ ∆ ∆∼
m g m g m2 1 2 2 2= +, ,
In this case, there are no ways to correct the overestimations.
One may think that correcting overestimation only for Figure S1(a) is still reasonable since this correction simply increases the true es-timation. However, it is not true since obtained P-values must be adjusted based upon multiple comparison correction. If correction takes place only for seed-sharing-miRNAs, P-values attributed to the seed-sharing-miRNAs are systematically less significant while non-seed-sharing-miRNAs keep uncorrected P-values; this unbal-anced correction results in biased multiple-comparison-corrected P-values that have no relationship with biology.
For example, there are 10 non-seed-sharing miRNAs with P-val-ues of 0.1 and 10 seed-sharing-miRNAs with P-values of 0.2 (see
Figure S1. Schematic demonstrates the difference of multiple target between seed sharing miRNAs and non-seed sharing miRNAs. (a) miRNAs m1 and m2 share seed sequence, thus target the same set of genes, g1 and g2. (b) miRNAs m1 and m2 do not share seed sequence, thus the set of target genes differ. m1 targets g1 and g2, while m2 targets g2 only.
Figure S2. Example of P-values attributed to seed sharing miRNAs and non-seed sharing miRNAs. The first 10 miRNAs (from 1st to 10th) were non-seed sharing miRNAs to which P = 0.1 was attributed, while the second 10 miRNAs (from 11th to 20th) were seed sharing miRNAs to which P = 0.2 was attributed.
Page 18 of 34
F1000Research 2013, 2:21 Last updated: 05 MAR 2015

Table S1. Recomputation of miRNA-targeted-gene promoter hypomethylation after seed sharing miRNAs were merged.
Amount of methylation
Number of miRNAs
Statistical tests Not significant Significant
t-test 115229 305634 72%
Wilcoxon rank sum test 121910 298953 71%
Kolmogorov-Smirnov test 110975 309888 74%
For upper half of Table 1, miRNA-targeted-gene promoter hypomethylation was recomputed after seed sharing miRNAs were merged into one.
This possibility of biased correction made me decide not to correct P-values only for seed-sharing-miRNAs.
The Table S1 shows the results that correspond to upper half of Table 1, with merging seed-sharing-miRNAs into one, and the sec-ond reason why I did not merge seed-sharing-miRNAs.
The ratios (percentages) of the number of miRNAs with signifi-cant P-values to the total number of miRNAs differ very little from those in Table 1 independent of the employed statistical tests. This is mainly because I am interested, in this particular study, not in individual miRNA but in the ratios of miRNAs with significant P-values.
Since merging seed-sharing-miRNAs may twist results and does not affect the results so much in this present study, I decided not to merge seed-sharing-miRNAs into one.
Additional Files
Additional file 1 — Full list of P-values from the analysis of miRNA-targeted-gene promoter hypomethylation: t-test
1 Data File
http://dx.doi.org/10.6084/m9.figshare.106265
Additional file 2 — Full list of P-values from the analysis of miRNA-targeted-gene promoter hypomethylation: Wilcoxon rank sum test
1 Data File
http://dx.doi.org/10.6084/m9.figshare.106266
Additional file 3 — Full list of P-values from the analysis of miRNA-targeted-gene promoter hypomethylation: Kolmogorov-Smirnov test
1 Data File
http://dx.doi.org/10.6084/m9.figshare.106267
Additional file 4 — Full list of P-values from the analysis of miRNA-targeted-gene promoter hypomethylation: t-test
1 Data File
http://dx.doi.org/10.6084/m9.figshare.106268
Additional file 6 — Full list of P-values from the analysis of miRNA-targeted-gene promoter hypomethylation: Kolmogorov-Smirnov test
1 Data File
http://dx.doi.org/10.6084/m9.figshare.106270
Additional file 7 — Histograms that show promoter methylation in miRNA target genes and miRNA non-target genes
1 Data File
http://dx.doi.org/10.6084/m9.figshare.775365
Additional file 8 — Scatter plots that correspond to Tables 5 and 6
1 Data File
http://dx.doi.org/10.6084/m9.figshare.775366
Additional file 9 — Histogram of correlation coefficients between miRNA-targeted-gene promoter methylation and seed region features
1 Data File
http://dx.doi.org/10.6084/m9.figshare.775367
Additional file 5 — Full list of P-values from the analysis of miRNA-targeted-gene promoter hypomethylation: Wilcoxon rank sum test
1 Data File
http://dx.doi.org/10.6084/m9.figshare.106269
Page 19 of 34
F1000Research 2013, 2:21 Last updated: 05 MAR 2015
1. Golbabapour S, Abdulla MA, Hajrezaei M: A concise review on epigenetic regulation: insight into molecular mechanisms. Int J Mol Sci. 2011; 12(12): 8661–8694. PubMed Abstract | Publisher Full Text | Free Full Text
2. Suzuki MM, Bird A: DNA methylation landscapes: provocative insights from epigenomics. Nat Rev Genet. 2008; 9(6): 465–476. PubMed Abstract | Publisher Full Text
3. Bartova E, Krejci J, Harnicarova A, et al.: Histone modifications and nuclear architecture: a review. J Histochem Cytochem. 2008; 56(8): 711–721. PubMed Abstract | Publisher Full Text | Free Full Text
4. Pabo CO, Sauer RT: Transcription factors: structural families and principles of DNA recognition. Annu Rev Biochem. 1992; 61: 1053–1095. PubMed Abstract | Publisher Full Text
5. He L, Hannon GJ: MicroRNAs: small RNAs with a big role in gene regulation. Nat Rev Genet. 2004; 5(7): 522–531. PubMed Abstract | Publisher Full Text
6. Das PM, Singal R: DNA methylation and cancer. J Clin Oncol. 2004; 22(22): 4632–4642. PubMed Abstract | Publisher Full Text
7. Boks MP, Derks EM, Weisenberger DJ, et al.: The relationship of DNA methylation with age gender and genotype in twins and healthy controls. PLoS One. 2009; 4(8): e6767. PubMed Abstract | Publisher Full Text | Free Full Text
8. Berardi E, Pues M, Thorrez L, et al.: miRNAs in ESC differentiation. Am J Physiol Heart Circ Physiol. 2012; 303(8): H931–939. PubMed Abstract | Publisher Full Text
9. Etheridge A, Lee I, Hood L, et al.: Extracellular microRNA: A new source of biomarkers. Mutat Res. 2011; 717(1–2): 85–90. PubMed Abstract | Publisher Full Text | Free Full Text
10. Lopez-Serra P, Esteller M: DNA methylation-associated silencing of tumor-suppressor microRNAs in cancer. Oncogene. 2012; 31(13): 1609–1622. PubMed Abstract | Publisher Full Text | Free Full Text
11. Su Z, Xia J, Zhao Z: Functional complementation between transcriptional methylation regulation and post-transcriptional microRNA regulation in the human genome. BMC Genomics. 2011; 12(Suppl 5): S15. PubMed Abstract | Publisher Full Text | Free Full Text
12. Sinha S, Adler AS, Field Y, et al.: Systematic functional characterization of cis-regulatory motifs in human core promoters. Genome Res. 2008; 18(3): 477–488. PubMed Abstract | Publisher Full Text | Free Full Text
13. Saito T, Sætrom P: Target gene expression levels and competition between transfected and endogenous microRNAs are strong confounding factors in microRNA high-throughput experiments. Silence. 2012; 3: 3. PubMed Abstract | Publisher Full Text | Free Full Text
14. Nazor KL, Altun G, Lynch C, et al.: Recurrent variations in DNA methylation in human pluripotent stem cells and their differentiated derivatives. Cell Stem Cell. 2012, 10(5): 620–634. PubMed Abstract | Publisher Full Text | Free Full Text
15. Taguchi YH: Inference of Target Gene Regulation via miRNAs during Cell Senescence by Using the MiRaGE Server. Aging Dis. 2012; 3(4): 301–306. PubMed Abstract | Free Full Text
16. Taguchi YH: Inference of target gene regulation via miRNAs during cell cenescence by using the MiRaGE Server. In Emerging Intelligent Computing Technology and Applications. Edited by Huang DS, Gupta P, Zhang X, Premaratne P, Springer: Heidelberg 2012; 441–446. Publisher Full Text
17. Ohm JE, Mali P, Van Neste L, et al.: Cancer-related epigenome changes associated with reprogramming to induced pluripotent stem cells. Cancer Res. 2010; 70(19): 7662–7673. PubMed Abstract | Publisher Full Text | Free Full Text
18. Deng J, Shoemaker R, Xie B, et al.: Targeted bisulfite sequencing reveals changes in DNA methylation associated with nuclear reprogramming. Nat Biotechnol. 2009; 27(4): 353–360. PubMed Abstract | Publisher Full Text | Free Full Text
19. Krueger F, Andrews SR: Bismark: a flexible aligner and methylation caller for Bisulfite-Seq applications. Bioinformatics. 2011; 27(11): 1571–1572. PubMed Abstract | Publisher Full Text | Free Full Text
20. Stadler B, Ivanovska I, Mehta K, et al.: Characterization of microRNAs involved in embryonic stem cell states. Stem Cells Dev. 2010; 19(7): 935–950. PubMed Abstract | Publisher Full Text | Free Full Text
21. Yoshizawa M, Taguchi YH, Yasuda J: Inference of gene regulation via miRNAs during ES cell differentiation using MiRaGE method. Int J Mol Sci. 2011; 12(12): 9265–9276. PubMed Abstract | Publisher Full Text | Free Full Text
22. R Core Team: R: A Language and Environment for Statistical Computing. R Foundation for Statistical Computing, Vienna, Austria 2012, [ISBN 3-900051-07-0]. Reference Source
23. Benjamini Y, Hochberg Y: Controlling the false discovery rate: a practical and powerful approach to multiple testing. J R Stat Soc B. 1995; 289–300. Reference Source
24. Lu TP, Lee CY, Tsai MH, et al.: miRSystem: An Integrated System for Characterizing Enriched Functions and Pathways of MicroRNA Targets. PLoS One. 2012; 7(8): e42390. PubMed Abstract | Publisher Full Text | Free Full Text
25. Vejnar CE, Blum M, Zdobnov EM: miRmap web:comprehensive microRNA target prediction online. Nucleic Acids Res. 2013; 41(Web Server issue): W165–168. PubMed Abstract | Publisher Full Text | Free Full Text
26. MiRaGE Package. Reference Source
27. Shahab SW, Matyunina LV, Hill CG, et al.: The effects of MicroRNA transfections on global patterns of gene expression in ovarian cancer cells are functionally coordinated. BMC Med Genomics. 2012; 5: 33. PubMed Abstract | Publisher Full Text | Free Full Text
28. Ebert MS, Neilson JR, Sharp PA: MicroRNA sponges: competitive inhibitors of small RNAs in mammalian cells. Nat Methods. 2007; 4(9): 721–726. PubMed Abstract | Publisher Full Text
29. Khraiwesh B, Arif MA, Seumel GI, et al.: Transcriptional control of gene expression by microRNAs. Cell. 2010; 140(1): 111–122. PubMed Abstract | Publisher Full Text
30. Nishi K, Nishi A, Nagasawa T, et al.: Human TNRC6A is an Argonaute-navigator protein for microRNA-mediated gene silencing in the nucleus. RNA. 2013; 19(1): 17–35. PubMed Abstract | Publisher Full Text | Free Full Text
31. Bussing I, Slack FJ, Grosshans H: let-7 microRNAs in development, stem cells and cancer. Trends Mol Med. 2008; 14(9): 400–409. PubMed Abstract | Publisher Full Text
32. Marasa BS, Srikantan S, Martindale JL, et al.: MicroRNA profiling in human diploid fibroblasts uncovers miR-519 role in replicative senescence. Aging (Albany NY). 2010; 2(6): 333–343. PubMed Abstract | Free Full Text
33. Yang C, Wang C, Chen X, et al.: Identification of seven serum microRNAs from a genome-wide serum microRNA expression profile as potential noninvasive biomarkers for malignant astrocytomas. Int J Cancer. 2013; 132(1): 116–27. PubMed Abstract | Publisher Full Text
34. Lin S, Cheung WK, Chen S, et al.: Computational identification and characterization of primate-specific microRNAs in human genome. Comput Biol Chem. 2010; 34(4): 232–241. PubMed Abstract | Publisher Full Text
35. Liang T, Guo L, Liu C: Genome-wide analysis of mir-548 gene family reveals evolutionary and functional implications. J Biomed Biotechnol. 2012; 2012: 679563. PubMed Abstract | Publisher Full Text | Free Full Text
36. Liang Z, Zhou H, Zheng H, et al.: Expression levels of microRNAs are not associated with their regulatory activities. Biol Direct. 2011; 6: 43. PubMed Abstract | Publisher Full Text | Free Full Text
37. Fu X, Xue C, Huang Y, et al.: The activity and expression of microRNAs in prostate cancers. Mol Biosyst. 2010; 6(12): 2561–2572. PubMed Abstract | Publisher Full Text
38. Le HS, Bar-Joseph Z: Integrating sequence, expression and interaction data to determine condition-specific miRNA regulation. Bioinformatics. 2013; 29(13): i89–i97. PubMed Abstract | Publisher Full Text | Free Full Text
References
Page 20 of 34
F1000Research 2013, 2:21 Last updated: 05 MAR 2015
F1000Research
Open Peer Review
Current Referee Status:
Version 2
18 June 2013Referee Report
doi:10.5256/f1000research.1268.r1002
Pål SætromDepartment of Cancer Research and Molecular Medicine, Norwegian University of Science andTechnology, Trondheim, Norway
Although this article’s topic is interesting, I found that its contents were confusing and inaccessible. I alsohave some reservations regarding the methods.
The abstract is misleading.The author states in the abstract: “It was found that promoter methylation was affected by miRNA
I find this statement very misleading, as the author has not shown that miRNA targeting has antargeting.“effect on promoter methylation. What the authors’ results do suggest is that the promoters of genes thatare predicted to be miRNA targets tend to be hypomethylated compared to promoters of genes predictednot to be miRNA targets. Although this correlation is an interesting observation in itself (also previouslymade by ), the author provides no compelling evidence for miRNA targeting and regulationSu ., 2011et albeing the cause of (or even influence) the genes’ reduced promoter methylation. Specifically, the authorneither demonstrates that loss (or increase) of miRNA regulation in general nor that loss (or increase) ofregulation by specific miRNAs affects promoter methylation status. Instead, the author’s results indicatethat predicted miRNA regulation apparently can have both a positive and negative correlation withpromoter methylation status (Table 5 and Table 7). Consequently, the author’s current results onlysupport that predicted miRNA targets tend to have hypomethylated promoters in the specific cell linesused in the author’s study.
There are no figures to illustrate analyses, show data trends, and visualize correlations.The author consistently presents his results as correlation coefficients and p-values. These values areimportant, but also hide important aspects of the data, such as the magnitude of a significant differenceand the trend of or the number of observations contributing to a significant correlation. To make his resultsmore accessible, the author should at least create a figure that compares the distributions of promotermethylation for miRNA target and non-target genes (Table 3). Moreover, some of the author’s analyses,such as the correlations of p-values in Tables 5-6, are fairly complex. A figure that shows the underlyingdata and illustrates the different steps in the analyses would make the results more accessible.
The analyses apparently ignore miRNA expression.Presumably, a miRNA has to be expressed to have a role in gene regulation – whether that role ispost-transcriptional or otherwise. It is unclear, however, whether the author takes miRNA expression intoaccount in his analyses. For example, in Table 1, the author has apparently included all 1921 maturemiRNAs from miRBase 18.0 in his analyses, but I doubt that all of these are expressed in all the 271 celllines. One reason for including all miRNAs may be that the author has no data on which miRNAs areexpressed in the different cell lines. Nevertheless, as many of the miRNAs will likely not be expressed in agiven cell line, a large fraction of the 520,591 combinations tested appear irrelevant. Similarly, for theanalyses presented in Table 5, where the author does have data on the miRNAs that are expressed, theauthor provides no information on the miRNAs actually used in the analysis. Finally, in the last result
Page 21 of 34
F1000Research 2013, 2:21 Last updated: 05 MAR 2015
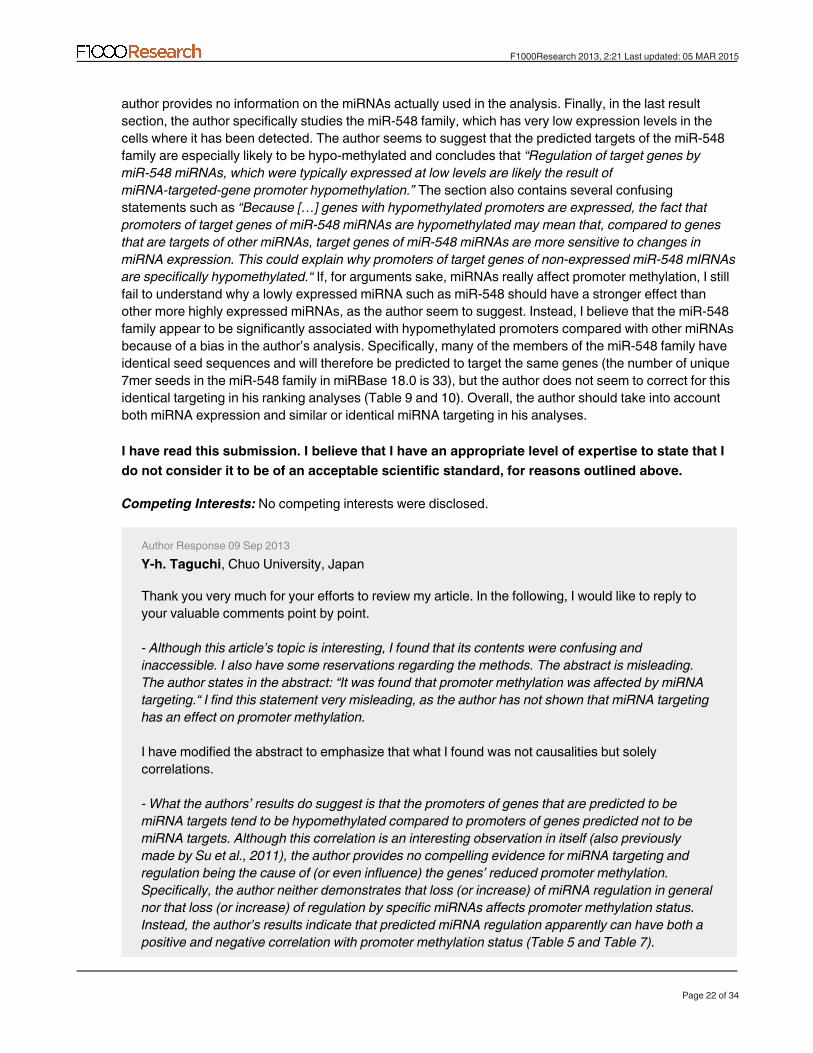
F1000Research
analyses presented in Table 5, where the author does have data on the miRNAs that are expressed, theauthor provides no information on the miRNAs actually used in the analysis. Finally, in the last resultsection, the author specifically studies the miR-548 family, which has very low expression levels in thecells where it has been detected. The author seems to suggest that the predicted targets of the miR-548family are especially likely to be hypo-methylated and concludes that “Regulation of target genes bymiR-548 miRNAs, which were typically expressed at low levels are likely the result of
The section also contains several confusingmiRNA-targeted-gene promoter hypomethylation.”statements such as “Because […] genes with hypomethylated promoters are expressed, the fact thatpromoters of target genes of miR-548 miRNAs are hypomethylated may mean that, compared to genesthat are targets of other miRNAs, target genes of miR-548 miRNAs are more sensitive to changes inmiRNA expression. This could explain why promoters of target genes of non-expressed miR-548 mIRNAs
If, for arguments sake, miRNAs really affect promoter methylation, I stillare specifically hypomethylated.“fail to understand why a lowly expressed miRNA such as miR-548 should have a stronger effect thanother more highly expressed miRNAs, as the author seem to suggest. Instead, I believe that the miR-548family appear to be significantly associated with hypomethylated promoters compared with other miRNAsbecause of a bias in the author’s analysis. Specifically, many of the members of the miR-548 family haveidentical seed sequences and will therefore be predicted to target the same genes (the number of unique7mer seeds in the miR-548 family in miRBase 18.0 is 33), but the author does not seem to correct for thisidentical targeting in his ranking analyses (Table 9 and 10). Overall, the author should take into accountboth miRNA expression and similar or identical miRNA targeting in his analyses.
I have read this submission. I believe that I have an appropriate level of expertise to state that Ido not consider it to be of an acceptable scientific standard, for reasons outlined above.
No competing interests were disclosed.Competing Interests:
Author Response 09 Sep 2013, Chuo University, JapanY-h. Taguchi
Thank you very much for your efforts to review my article. In the following, I would like to reply toyour valuable comments point by point.
- Although this article’s topic is interesting, I found that its contents were confusing and inaccessible. I also have some reservations regarding the methods. The abstract is misleading.
The author states in the abstract: “It was found that promoter methylation was affected by miRNAtargeting.“ I find this statement very misleading, as the author has not shown that miRNA targetinghas an effect on promoter methylation.
I have modified the abstract to emphasize that what I found was not causalities but solelycorrelations.
- What the authors’ results do suggest is that the promoters of genes that are predicted to bemiRNA targets tend to be hypomethylated compared to promoters of genes predicted not to bemiRNA targets. Although this correlation is an interesting observation in itself (also previouslymade by Su et al., 2011), the author provides no compelling evidence for miRNA targeting andregulation being the cause of (or even influence) the genes’ reduced promoter methylation.Specifically, the author neither demonstrates that loss (or increase) of miRNA regulation in generalnor that loss (or increase) of regulation by specific miRNAs affects promoter methylation status.Instead, the author’s results indicate that predicted miRNA regulation apparently can have both apositive and negative correlation with promoter methylation status (Table 5 and Table 7).Consequently, the author’s current results only support that predicted miRNA targets tend to have
Page 22 of 34
F1000Research 2013, 2:21 Last updated: 05 MAR 2015
F1000Research
Consequently, the author’s current results only support that predicted miRNA targets tend to havehypomethylated promoters in the specific cell lines used in the author’s study.
I have recently published a paper that demonstrates miRNA-targeted-promoter methylation can befound also in human brain [ ]. Thus, I believe that miRNA-targeted-promoterPMID: 23725297methylation is observed not only in the specific cell lines, but also in other biological situations.
- There are no figures to illustrate analyses, show data trends, and visualize correlations.
I have added additional file 8 that shows the scatter plots corresponding to Tables 5 and 6.
- The author consistently presents his results as correlation coefficients and p-values. Thesevalues are important, but also hide important aspects of the data, such as the magnitude of asignificant difference and the trend of or the number of observations contributing to a significantcorrelation. To make his results more accessible, the author should at least create a figure thatcompares the distributions of promoter methylation for miRNA target and non-target genes (Table3).
I have added additional file 8 in order to fulfill the reviewer's requirements.
- Moreover, some of the author’s analyses, such as the correlations of p-values in Tables 5-6, arefairly complex. A figure that shows the underlying data and illustrates the different steps in theanalyses would make the results more accessible.
I have added Fig. 1 in order to fulfill the reviewer's requirements.
- The analyses apparently ignore miRNA expression. Presumably, a miRNA has to be expressedto have a role in gene regulation – whether that role is post-transcriptional or otherwise. It isunclear, however, whether the author takes miRNA expression into account in his analyses. Forexample, in Table 1, the author has apparently included all 1921 mature miRNAs from miRBase18.0 in his analyses, but I doubt that all of these are expressed in all the 271 cell lines. One reasonfor including all miRNAs may be that the author has no data on which miRNAs are expressed in thedifferent cell lines. Nevertheless, as many of the miRNAs will likely not be expressed in a given cellline, a large fraction of the 520,591 combinations tested appear irrelevant. Similarly, for theanalyses presented in Table 5, where the author does have data on the miRNAs that areexpressed, the author provides no information on the miRNAs actually used in the analysis.
In Tables 1 and 5, I have considered all miRNAs in miRBase whether they are expressed or not. Ithink that the amount of miRNA expression is not always a primary factor with regards to thecontrol of miRNA regulation for the target genes. References 36 and 37 in the article support thispoint. In addition to this, instead of the miRNA expression, I demonstrated thatmiRNA-targeted-gene promoter methylation is related to seed region features (see Fig. 2,additional file 9, and section “miRNA-targeted-genes promoter methylation is correlated to miRNAseed region features”). Although I do not intend to insist that miRNA seed region features cancontrol miRNA-targeted-gene promoter methylation, I think that the amount of miRNA expressiondoes not always have to be the only factor which controls the miRNA-regulation of target genes.
- Finally, in the last result section, the author specifically studies the miR-548 family, which has verylow expression levels in the cells where it has been detected. The author seems to suggest that the
predicted targets of the miR-548 family are especially likely to be hypo-methylated and concludes
Page 23 of 34
F1000Research 2013, 2:21 Last updated: 05 MAR 2015
F1000Research
predicted targets of the miR-548 family are especially likely to be hypo-methylated and concludesthat “Regulation of target genes by miR-548 miRNAs, which were typically expressed at low levelsare likely the result of miRNA-targeted-gene promoter hypomethylation.” The section also containsseveral confusing statements such as “Because […] genes with hypomethylated promoters areexpressed, the fact that promoters of target genes of miR-548 miRNAs are hypomethylated maymean that, compared to genes that are targets of other miRNAs, target genes of miR-548 miRNAsare more sensitive to changes in miRNA expression. This could explain why promoters of targetgenes of non-expressed miR-548 mIRNAs are specifically hypomethylated.“ If, for argumentssake, miRNAs really affect promoter methylation, I still fail to understand why a lowly expressedmiRNA such as miR-548 should have a stronger effect than other more highly expressed miRNAs,as the author seem to suggest. Instead, I believe that the miR-548 family appear to be significantlyassociated with hypomethylated promoters compared with other miRNAs because of a bias in theauthor’s analysis.
As mentioned above, I do not think that the amount of miRNA expression is always the only factorwhich controls miRNA-regulation of target genes. Apparently, miR-548 target genes have moredistinct seed region features than other miRNAs. I think that this may be the reason why lowamounts of miR-548 expression can be related to miRNA-targeted-gene promoter methylation(see Fig. 3, Table 11, and section “miRNA-targeted-genes promoter methylation is correlated tomiRNA seed region features”).
- Specifically, many of the members of the miR-548 family have identical seed sequences and willtherefore be predicted to target the same genes (the number of unique 7mer seeds in the miR-548family in miRBase 18.0 is 33), but the author does not seem to correct for this identical targeting inhis ranking analyses (Table 9 and 10). Overall, the author should take into account both miRNAexpression and similar or identical miRNA targeting in his analyses.
I do not think that merging seed-sharing-miRNAs into one is always the only correct way to predictmiRNA regulation of target genes. Please see the newly added section “Treatment of sharedmiRNA seed sequences” and Appendix. In addition to this, my MiRaGE method - which does notmerge seed-sharing-miRNAs into one - was applied to many biological processes, and I found thatit works reasonably well (see References 15, 16, and 21 from the article).
I would like to thank the reviewer, whose comments have greatly improved the quality of this paper.I would be glad if the present version is approved by the reviewer.
No competing interests were disclosed.Competing Interests:
14 May 2013Referee Report
doi:10.5256/f1000research.1268.r949
Denis DupuyInstitut Europeen de Chimie et Biologie, Pessac, France
I had initially understood that the title of this study could be: "Correlation between promoter methylationWhich in simpler terms could mean that miRNA targeted genesand miRNA regulation of target genes."
tend to have more hypomethylated promoters (or hypermethylated maybe) than expected by chance.
Page 24 of 34
F1000Research 2013, 2:21 Last updated: 05 MAR 2015
F1000Research
In the current form it is still unclear to me how the data actually support this conclusion.
The lack of illustration makes the article hard to follow, the author present the results of statistical testswithout providing a clear description of what effect he is actually evaluating. And on further reading itseems that the objective of this study is largely incomprehensible to me.
The first question comes in the datset compilation: how was it done and what were the criteria used toaccept or reject data used in the study?
A figure representing the process of dataset generation would be welcome.
The author states: “I tested profiles from this dataset to confirm that obtained results were not” How was this done? It is well known that biological experiments onresearch group dependent.
a genome scale are inherently noisy so results even within the same group will not be the exact replicateof one another. What was considered acceptable to create a dataset compendium? Was anynormalization applied? Was there an a posteriori check that the independent sets were behaving in thesame way as the compendium? If not, would the same conclusion have been obtained by analyzing themseparately? Is only part of the data driving the conclusion and can it be explained by the different celllines?
Elsewhere, the author states “It should be noted that genes that were not the targets of any” which makes me think that I totally missed the initialmiRNAs were totally excluded from the analysis
point of this work as I thought the objective was to test the hypothesis that promoter methylation statuswas related to miRNA targeting of the produced messenger. In this, genes that are not targets of miRNAwould be useful as a control group.
Even if the author is trying to demonstrate a relationship between the amount of miRNA regulation andmethylation, non-target genes would be an essential control.
The second question arises from the choice of the values used for methylation. The author states:“I employed a method in which total methylation values were used(..) because I found that P-values
to the P-values calculatedcomputed when using methylation data were more strongly correlatedfrom target gene miRNA regulation data, which is likely due to the fact that the frequency of CpGs is also
” related to miRNA targeting
and later:
“βi was the ratio of methylated sites to unmethylated sites, (...) were deposited in the public datasetsused, their use could not be avoided; however, as a result, the correlation with target gene miRNA
”regulation was substantially decreased. An explanation for this is noted above.
“Obtaining a better P-value”, is not an acceptable rationale for changing the way the methylation of apromoter is “typically represented”.
The reason why the association between CpG island associated genes and miRNA targeting explains thedifference in P-values between using total methylation values and proportion of methylated sites, is notobvious. It hints at a different behavior between CpG and non CpG promoters, would it not then makesense to process them separately?
Page 25 of 34
F1000Research 2013, 2:21 Last updated: 05 MAR 2015
F1000Research
It seems that the two ways of representing the data mean very different things and that decision couldgreatly affect the conclusions that can be extracted from the results. If I understand correctly, with theabsolute number method a promoter with 2/3 methylated sites would be counted the same as a 2/10 yetin one case one could consider the first to be 66% methylated and the other 20%. The implication of thischoice on the results of the study should be discussed more thoroughly.
In table 1, if the top part is indeed calculated with ratio and bottom with absolute, what were the thresholdsto be counted as hypomethylated in each case?
What does the “number of miRNA” actually represent? The author indicates that he multiplied the numberof miRNA (1971) by the number of cell lines included (271). What does this product represent in theend? Why were the datapoints not aggregated by promoter and/or miRNA in the context of this study?
Table 3 for example is symptomatic of how the lack of illustration makes the article hard to follow: “P-values that represent the difference of promoter methylation between miRNA target genes and
” The P-value doesn't represent a “difference in promoter methylation”, itmiRNA non-target genes.evaluates the likelihood of the observation happening by chance given the dataset distribution. But whatis the observation here? Are promoters of genes targeted by miRNA 60% methylated vs 58% for thenon targeted? (is it 10 vs 87?)
Are we considering a very slight effect with a very strong statistical significance or a very obvious strongeffect for which the statistical test is not even needed to be convinced of the solidity of the result?
Moreover, just below that table the author explains why he doesn't discriminate between hypo andhypermethylation of promoters. That makes table 3 very puzzling; is this P-value evaluating the likelihoodof miRNA targeted gene promoters to be significantly BOTH over and/or under methylated relative tonon-targeted genes?
Table 4 has been added as a response to my previous comment however it seems to bring furtherquestion as to what “miRNA-targeted-gene promoter methylation” really means. My first comment is thatthis control should not constitute a separate table but an additional entry in the original table. Secondly,there are many ways to generate random shuffling of the data that will destroy the “signal”, however for arandom shuffling to be a valid control of the biological significance of the observation, the randomizationshould be performed in a way that preserves at least part of the actual data structure. For example, if oneworks on a scale free distribution and discovers biological associations within this distribution, one wouldnot generate a shuffled set as control that would have a gaussian distribution but instead would have topreserve the scale-free distribution. In this case, no details are provided regarding what steps have beentaken to ensure that the randomization preserved any of the original data structure.
It is hard to believe what part of the data structure is conserved in this randomization when in the actualdata between 72% to 92% of the >500,000 items studied are found to be significant (Table 1) and only 3to 6 /500,000 have that characteristic in Table 4.
Similarly, in Table 5 “ ” it is unclear what the numbersCorrelation coefficients between P-values(..)actually represent. I am familiar with measuring the P-value of a correlation coefficient through multiplerandomly shuffled distributions to insure the significance of the observed correlation. But it is unclear tome what a correlation between P-values actually represents since they could well be associated withopposite effects.
Page 26 of 34
F1000Research 2013, 2:21 Last updated: 05 MAR 2015
F1000Research
Finally, Figure 1 that should bear the take home message doesn't provide a better idea of what theconclusions of the paper are: the top part shows two genes targeted by different numbers of miRNAhaving different levels of methylation. From this it seems that the correlation found is actually between theamount of regulatory miRNA and hypomethylation, but how this was derived from table 1 and 2 is totallyunclear. What happens in the boxed part of the figure is even more confusing as it shows a young cell,with 3 (expressed?) genes, becoming a senescent cell, expressing only one with methylation unchangedeven though the amount of mir-548 targeting is represented higher.
Meanwhile, the opposite is the case for the differentiation scheme. All the represented promoters (?) inthe box seem to be hypomethylated regardless of the number of miRNA targeting the correspondingmRNA in total opposition to what the study seems to claim.
I think overall the methodology and lack of illustrations obfuscate the point for readers. Non-specialistsand specialists alike will find it hard to follow the author’s reasoning for want of clarity in the methodsused. A scientific paper should strive to present the data in a way that can convince experts of the fieldand also explain to non specialists how the observed results lead to the presented conclusions. I feel thaton both accounts this manuscript is not reaching these goals.
I have read this submission. I believe that I have an appropriate level of expertise to state that Ido not consider it to be of an acceptable scientific standard, for reasons outlined above.
No competing interests were disclosed.Competing Interests:
Author Response 16 May 2013, Chuo University, JapanY-h. Taguchi
Dear Denis,
Thank you very much for your efforts to review my paper. Here I respond to you point by point. Ifthese responses resolve disagreements between us and then if you can approve my manuscript, Iwill be happy. Alternatively, you may suggest how to revise my manuscript such that you canapprove it.
>I had initially understood that the title of this study could be: "Correlation between promotermethylation and miRNA regulation of target genes." Which in simpler terms could mean thatmiRNA targeted genes tend to have more hypomethylated promoters (or hypermethylated maybe)than expected by chance. >In the current form it is still unclear to me how the data actually supportthis conclusion.
Unfortunately, I did not intend to conclude that “miRNA targeted genes tend to have morehypomethylated promoters (or hypermethylated maybe) than expected by chance”, but tried toconclude that “a set of genes targeted by a miRNA A is differently hypo/hypermethylated than a setof genes not targeted by the miRNA A but targeted by any other miRNAs”. These two are verydifferent.
>The lack of illustration makes the article hard to follow, the author present the results of statisticaltests without providing a clear description of what effect he is actually evaluating. And on furtherreading it seems that the objective of this study is largely incomprehensible to me.
Page 27 of 34
F1000Research 2013, 2:21 Last updated: 05 MAR 2015
F1000Research
reading it seems that the objective of this study is largely incomprehensible to me.
What I have evaluated is, as mentioned in the main text;1.) “a set of genes targeted by a miRNA A is differently hypo/hypermethylated than a set of genesnot targeted by the miRNA A but targeted by any other miRNAs” 2.) “the correlation of P-values between miRNA-targeting-promoter methylation (in the sensedenoted in 1.) and miRNA-mediated regulation of target genes”. I also defined these two usingequations, more exactly. I would be glad if you can mention in which point you are not sure.
>The first question comes in the dataset compilation: how was it done and what were the criteriaused to accept or reject data used in the study? >A figure representing the process of datasetgeneration would be welcome.
As I have mentioned in the Methods section (mRNA and miRNA expression profiles), what I havedone is to just make mean and variance, zero and one, respectively. I have never done any othertreatments. Thus, I assumed that no detailed explanations were required. If I was not correct,please advise me about how to to prepare suitable figures.
>The author states: “I tested profiles from this dataset to confirm that obtained results were notresearch group dependent.” How was this done? It is well known that biological experiments on agenome scale are inherently noisy so results even within the same group will not be the exactreplicate of one another. What was considered acceptable to create a dataset compendium? Wasany normalization applied? Was there an a posteriori check that the independent sets werebehaving in the same way as the compendium? If not, would the same conclusion have beenobtained by analyzing them separately? Is only part of the data driving the conclusion and can it beexplained by the different cell lines?
I have compared one experiment with another experiment, only using the correlation coefficients ofP-values. Almost all analyses were performed in P-value based. As you pointed out, raw valueslike gene expression and promoter methylation are hard to compare between differentexperiments. All success in this study is achieved by the employment of P-value basedapproaches.
>Elsewhere, the author states “It should be noted that genes that were not the targets of anymiRNAs were totally excluded from the analysis” which makes me think that I totally missed theinitial point of this work as I thought the objective was to test the hypothesis that promotermethylation status was related to miRNA targeting of the produced messenger. In this, genes thatare not targets of miRNA would be useful as a control group.>Even if the author is trying to demonstrate a relationship between the amount of miRNA regulationand methylation, non-target genes would be an essential control.
As I have mentioned above, the purpose of this study was to compare promoter methylationbetween genes targeted by different miRNAs. Thus, non-target genes cannot be any controls inthis context. However, since you require me to clearly point this out, I show this in Table 3.
>The second question arises from the choice of the values used for methylation. The author states:“I employed a method in which total methylation values were used(..) because I found that P-valuescomputed when using methylation data were more strongly correlated to the P-values calculatedfrom target gene miRNA regulation data, which is likely due to the fact that the frequency of CpGs
is also related to miRNA targeting”
Page 28 of 34
F1000Research 2013, 2:21 Last updated: 05 MAR 2015
F1000Research
is also related to miRNA targeting” >and later: >“βi was the ratio of methylated sites to unmethylated sites, (...) were deposited in the publicdatasets used, their use could not be avoided; however, as a result, the correlation with targetgene miRNA regulation was substantially decreased. An explanation for this is noted above.” >“Obtaining a better P-value”, is not an acceptable rationale for changing the way the methylationof a promoter is “typically represented”.
I did not insist that “Obtaining a better P-value” is the criterion to choose which definition ofmethylation should be employed. I wrote that better correlation of P-values betweenmiRNA-targeting-specific promoter methylation and miRNA regulation of target genes is thecriterion to choose which definition of methylation should be employed.
>The reason why the association between CpG island associated genes and miRNA targetingexplains the difference in P-values between using total methylation values and proportion ofmethylated sites, is not obvious. It hints at a different behavior between CpG and non CpGpromoters, would it not then make sense to process them separately?
As I have mentioned in the manuscript, there are some differences. However, the correlationbetween P-values for miRNA-targeting-specific promoter methylation and P-values formiRNA-mediated regulation of target genes is significant. In fact, for GSM739940, I had to employβ-values, but the correlation is still significant (see Table 6). Thus, I think that selection of valuesthat represent promoter methylation to be investigated is not essential for the purpose of thismanuscript. If you think that you need more evaluations, please advise me about what kind ofevaluation is useful for you to be satisfied.
>It seems that the two ways of representing the data mean very different things and that decisioncould greatly affect the conclusions that can be extracted from the results. If I understand correctly,with the absolute number method a promoter with 2/3 methylated sites would be counted the sameas a 2/10 yet in one case one could consider the first to be 66% methylated and the other 20%.The implication of this choice on the results of the study should be discussed more thoroughly.
As I have written in the above, since both ratio and amount of methylation work more or less well, Ido not think that “decision could greatly affect the conclusions”. However, if you can suggest somekind of additional evaluations, I am happy to perform this so as to fulfill your requirements.
>In table 1, if the top part is indeed calculated with ratio and bottom with absolute, what were thethresholds to be counted as hypomethylated in each case?
As I have written in the text, I employed P-values to check if the promoters arehyper/hypomethylated. Threshold of P-values is, as denoted in the manuscript, P<0.05 afteradjusted based on BH criterion.
>What does the “number of miRNA” actually represent? The author indicates that he multiplied thenumber of miRNA (1971) by the number of cell lines included (271). What does this productrepresent in the end? Why were the datapoints not aggregated by promoter and/or miRNA in thecontext of this study?
As I have written in the manuscript, P-values are attributed not to each gene but to each miRNA.
Thus, in the framework of the present study, it is impossible to attribute P-values to each promoter.
Page 29 of 34
F1000Research 2013, 2:21 Last updated: 05 MAR 2015

F1000Research
Thus, in the framework of the present study, it is impossible to attribute P-values to each promoter.Also, P-values are attributed to miRNAs in each cell line, because each cell line has a differentpattern of promoter methylation. Thus, in some cell lines a miRNA's target genes' promoters aresignificantly hyper/hypomethylated, while they may not be in other cell lines. Thus, to each miRNA,the number of P-values attributed is the number of cell line. Thus, I get the number of cell linestimes number of miRNAs P-values in total.
>Table 3 for example is symptomatic of how the lack of illustration makes the article hard to follow:“P-values that represent the difference of promoter methylation between miRNA target genes andmiRNA non-target genes.” The P-value doesn't represent a “difference in promoter methylation”, itevaluates the likelihood of the observation happening by chance given the dataset distribution. Butwhat is the observation here? Are promoters of genes targeted by miRNA 60% methylated vs 58%for the non targeted? (is it 10 vs 87?)
It depends upon the statistical test employed, since I used three statistical tests. For the t-test, yourexpectation is more or less true, since the t-test compares mean values between two sets(although I used amount of methylation, not ratio, as denoted in the text) . For other tests, otherstatistical values are used in order to check significant difference.
>Are we considering a very slight effect with a very strong statistical significance or a very obviousstrong effect for which the statistical test is not even needed to be convinced of the solidity of theresult?
As I have written in the above, the essence of this study is to consider the correlation of P-values.This is the only useful variable to compare different experiments. Thus, I cannot answer yourquestion. Using only P-values, I cannot distinguish between two cases:“a very slight effect with avery strong statistical significance” and “a very obvious strong effect for which the statistical test isnot even needed to be convinced of the solidity of the result”, but considering other variables makethe comparison between the different experiments impossible, as you suggested in the above.However, as I have mentioned in the above, employment of P-value based analyses is essential toderive conclusions in this paper.
>Moreover, just below that table the author explains why he doesn't discriminate between hypoand hypermethylation of promoters. That makes table 3 very puzzling; is this P-value evaluating thelikelihood of miRNA targeted gene promoters to be significantly BOTH over and/or undermethylated relative to non-targeted genes?
Yes, I did not distinguish between these two cases. However, if you wish, it is not difficult toinvestigate it if I used a one-sided test.
>Table 4 has been added as a response to my previous comment however it seems to bringfurther question as to what “miRNA-targeted-gene promoter methylation” really means. My firstcomment is that this control should not constitute a separate table but an additional entry in theoriginal table.
I am not sure what kind of information you need. Please advise me what to do.
>Secondly, there are many ways to generate random shuffling of the data that will destroy the“signal”, however for a random shuffling to be a valid control of the biological significance of the
observation, the randomization should be performed in a way that preserves at least part of the
Page 30 of 34
F1000Research 2013, 2:21 Last updated: 05 MAR 2015
F1000Research
observation, the randomization should be performed in a way that preserves at least part of theactual data structure. For example, if one works on a scale free distribution and discoversbiological associations within this distribution, one would not generate a shuffled set as control thatwould have a gaussian distribution but instead would have to preserve the scale-free distribution.In this case, no details are provided regarding what steps have been taken to ensure that therandomization preserved any of the original data structure.
P-values are computed based upon the comparison of promoter methylation between genestargeted by a miRNA A and genes not targeted by the miRNA A but targeted by any other miRNAs.Permutation was performed simply between these two sets. In this occasion, what should beconserved? I did not find anything to be conserved on this occasion. I would be happy if you cansuggest it.
>It is hard to believe what part of the data structure is conserved in this randomization when in theactual data between 72% to 92% of the >500,000 items studied are found to be significant (Table1) and only 3 to 6 /500,000 have that characteristic in Table 4.
I do not think that permutation can conserve anything. I would be glad if you can suggest what tobe conserved.
>Similarly, in Table 5 “Correlation coefficients between P-values(..)” it is unclear what the numbersactually represent. I am familiar with measuring the P-value of a correlation coefficient throughmultiple randomly shuffled distributions to insure the significance of the observed correlation. But itis unclear to me what a correlation between P-values actually represents since they could well beassociated with opposite effects.
Since I used one-sided tests as denoted in the manuscript, P-values can distinguish betweenopposite effects.
>Finally, Figure 1 that should bear the take home message doesn't provide a better idea of whatthe conclusions of the paper are: the top part shows two genes targeted by different numbers ofmiRNA having different levels of methylation. From this it seems that the correlation found isactually between the amount of regulatory miRNA and hypomethylation, but how this was derivedfrom table 1 and 2 is totally unclear. What happens in the boxed part of the figure is even moreconfusing as it shows a young cell, with 3 (expressed?) genes, becoming a senescent cell,expressing only one with methylation unchanged even though the amount of mir-548 targeting isrepresented higher. >Meanwhile, the opposite is the case for the differentiation scheme. All the represented promoters(?) in the box seem to be hypomethylated regardless of the number of miRNA targeting thecorresponding mRNA in total opposition to what the study seems to claim.
Figure 1 is just an illustration about what “can” happen. Since I investigated only P-values, I cannotstrictly decide what has happened exactly. There are no ways to derive Figure 1 from Table 1 and2 directly. I think that it helps readers to imagine what is the example of what happened in the cell.If you think that it is not suitable, I will remove it.
>I think overall the methodology and lack of illustrations obfuscate the point for readers.Non-specialists and specialists alike will find it hard to follow the author’s reasoning for want ofclarity in the methods used. A scientific paper should strive to present the data in a way that can
convince experts of the field and also explain to non specialists how the observed results lead to
Page 31 of 34
F1000Research 2013, 2:21 Last updated: 05 MAR 2015
F1000Research
convince experts of the field and also explain to non specialists how the observed results lead tothe presented conclusions. I feel that on both accounts this manuscript is not reaching thesegoals.
I hope that reading my responses, you can approve my manuscript as it is or suggest ways torevise my manuscript so as to fulfill your requirements. I believe that what I have found isworthwhile publishing, thus it is better to be indexed by your approval.
Yours, Tag. Prof. Y-h. Taguchi, Department of Physics, Chuo University, Tokyo 112-8551, Japan
No competing interests were disclosed.Competing Interests:
Version 1
06 February 2013Referee Report
doi:10.5256/f1000research.1183.r751
Denis DupuyInstitut Europeen de Chimie et Biologie, Pessac, France
I find that the often-used term of ‘miRNA-targeting-specific promoter methylation’ (sic) should be replacedby a less confusing expression, e.g. ‘miRNA-targeted-gene promoter methylation’, as ‘targeting’ and‘specific’ are redundant and confuse the point. Specifically, the grammatical construction would seem toindicate that there are hypomethylated promoter specific targeting miRNAs (title of a subsection) whichdoesn't seem to be what the author means. Otherwise, the term ‘specific’ could also lead to believe thatthere is a dedicated mechanism for demethylation of these subset of (miRNA targeted) promoters thatwould be distinct from other methylation pathways. As there is no way to know if it is the case or whetherthere is a unique activity biased toward genes submitted to post transcriptional regulation.
Moreover, the use of both: ‘miRNA-targeting-specific promoter hypomethylation’ and‘miRNA-targeting-specific promoter methylation’ adds to the confusion as these should indicate oppositetrends or mechanisms.
The author states that; ‘[MiRaGE] was designed to infer the differential expression of miRNA target genesbetween two experimental conditions based on the expression profiles of the target genes in question’,this is not exactly right: as stated on the MiRaGE page, ‘MiRaGE method is the method used to infer geneexpression regulation via miRNA based upon target gene expression.’ Thus, it doesn't infer theexpression of target genes! It infers the contribution of miRNA to the expression levels. So bymeasuredreplacing the expression levels by the methylation status of the promoter the author is trying to uncover alink between miRNA expression and the methylation of their target genes.
I feel that a much needed control would be required to see how the correlation between methylation statusand miRNA target gene expression differs from the correlation between non-targeted genes with similarexpression levels.
Another potentially damning issue is raised in Table 3: ‘It was clear that promoter methylation and miRNA
Page 32 of 34
F1000Research 2013, 2:21 Last updated: 05 MAR 2015
F1000Research
Another potentially damning issue is raised in Table 3: ‘It was clear that promoter methylation and miRNAregulation of target genes were significantly correlated during both cell senescence and differentiation’.Another way to interpret this would be that the expression level of those genes is correlated with themethylation level of their promoter (which is well reported in the literature), this could be considered analternative explanation to the modification of expression levels observed in those genes (i.e. not throughmiRNA regulation but through chromatin remodeling). This should warrant the use of a control set ofnon-miRNA targeted genes to check if the promoter methylation is truly ‘specific’ of miRNA targeting.
More troubling is this statement: ‘correlation coefficients exhibited opposite directionalities in cellsenescence and differentiation. This means that genes with miRNA-targeting-specific promoterhypomethylation are downregulated during cell senescence, but upregulated during differentiation’. Itseems that there should be a more in depth discrimination between genes that are up- or downregulatedin different conditions. Is the point of this paper to indicate that miRNA downregulation is associated withhypomethylation of the promoter? If so, how do you interpret an inverted correlation in different conditionsin this framework? It would seem that the expression of the ‘miRNA target genes’ is more correlated tothe status of their promoter than to the presence of the miRNA.The author states that this inverse correlation ‘is not a discrepancy’ but it is actually highlighting thediscrepancy that has to be explained rather than brushed off.
Similarly the following statement by the author doesn't seem to be so obvious to me: ‘0.7 to 0.8, indicate that miRNA-targeting-specific promoter methylation governs at most 50% to 60% ofmiRNA regulation of target genes. Thus, cell line specific miRNA regulation of target genes can act withinthe remaining 50% to 40%.’ An alternate explanation could be that the methylation doesn't govern theexpression status of the genes but reflects it partially (i.e. a degraded messenger could trigger anunknown pathway that would lead the modification of the promoter methylation and stabilize thedownregulation at the genomic level.
A similar logical leap is made further down in the text: ‘The fact that I observed significant changes inexpression of target genes without significant changes in expression of miRNAs that target these genesimplicates a role miRNA-targeting-specific promoter hypomethylation.’ It could also mean that thesegenes are regulated transcriptionally without the intervention of miR-548 miRNAs, there are probablyother gene groups that are differently expressed in these cell lines.
I have read this submission. I believe that I have an appropriate level of expertise to confirm thatit is of an acceptable scientific standard, however I have significant reservations, as outlinedabove.
No competing interests were disclosed.Competing Interests:
04 February 2013Referee Report
doi:10.5256/f1000research.1183.r748
Wenqian HuCenter for RNA Molecular Biology, Whitehead Institute for Biomedical Research, Cambridge, MA, USA
This paper reports interesting correlations between the regulation of genes by miRNAs and the
Page 33 of 34
F1000Research 2013, 2:21 Last updated: 05 MAR 2015
F1000Research
This paper reports interesting correlations between the regulation of genes by miRNAs and themethylation status of the miRNA target genes. Although the two processes occur in two differentcompartments of the cell, these correlations suggest that there may be some potential connections inthese two regulatory events of gene expression.
I have read this submission. I believe that I have an appropriate level of expertise to confirm thatit is of an acceptable scientific standard.
No competing interests were disclosed.Competing Interests:
Page 34 of 34
F1000Research 2013, 2:21 Last updated: 05 MAR 2015