conversion of biomass derived carbohydrate to value added
TRANSCRIPT
Conversion of biomass derived carbohydrate to value added chemicals by liquid-phase
thermochemical and biochemical processing
by
Tapas Chandra Acharjee
A dissertation submitted to the Graduate Faculty of
Auburn University
in partial fulfillment of the
requirements for the Degree of
Doctor of Philosophy
Auburn, Alabama
August 05, 2017
Keywords: Levulinic acid, lactic acid, glucose, paper mill sludge, chlorine dioxide, fermentation
Copyright 2017 by Tapas Chandra Acharjee
Approved by
Yoon Y Lee, Chair, Professor of Department of Chemical Engineering
Zhihua Jiang, Co-Chair, Assistant Professor of Department of Chemical Engineering
Thomas Hanley, Professor of Department of Chemical Engineering
Alan E David, Assistant Professor of Department of Chemical Engineering
Maobing Tu, Associate Professor of Department of Biomedical, Chemical, and
Environmental Engineering, University of Cincinnati
ii
Abstract
Levulinic and lactic acid are considered as highly versatile chemicals with a potential to
be building-block for the synthesis of various upgraded chemicals. The main objective of this
study is to develop novel strategies for efficient production of these two chemicals by liquid-
phase processing of biomass-derived carbohydrates. In that event, the kinetic aspect of
homogeneous acid catalyzed levulinic acid (LA) production from glucose in aqueous media was
investigated at first. The experimental data collected from batch reactor over the following range
of conditions: 150-200 °C, sulfuric acid concentrations of 1-5 (wt. %) and initial glucose
concentrations of 5-15 (wt. %) were fitted to a kinetic model. The model has shown a good
agreement with experimental data. The kinetic model derived here was further used to model
continuous reactor system. The model suggests that high temperature and shorter reaction times
are required to maximize hydroxymethylfurfural (HMF), an intermediate in the process. It also
predicts low temperature and longer reaction times are essential to maximize LA yield. We also
developed an optimum temperature profile for the levulinic acid production from glucose. This
study thus can serve as a useful tool for optimal design and operation of acid catalyzed LA
production from glucose.
Literature information suggests catalytic conversion of glucose to LA involves multi-step
complex reaction sequence. The known reaction pathway includes glucosefructose
HMFLA and various side-reactions. Each of these reactions are independent, thus behave
differently depending on the type of acid catalyst. Specifically, Lewis-acid has much higher
iii
selectivity for the first reaction (glucosefructose) whereas Brønsted-acid favors the latter
reactions. For this reason, we have prepared a series of solid Lewis acid catalysts by Solid State
Ion Exchange method (SSIE) and tested them for glucose to fructose isomerization. We also
tested these catalysts together with a commercial solid acid catalyst (Amberlyst-15) to produce
LA from glucose as Amberlyst-15 was found to be very effective for the production of LA from
fructose in aqueous media. Among the Lewis solid acid catalysts tested, a large-pore zeolite that
contains tin (Sn-Beta) is able to isomerize glucose to fructose in aqueous media with high
activity and selectivity. The dual-catalyst system, Sn-beta and Amberlyst -15, has improved the
yield of LA due to enhanced isomerization of glucose to fructose by Sn-Beta. Although, Sn-beta
zeolite catalyst loses its activity during the course of the reaction, it can be fully regenerated by
calcination. Ambelyst-15 also suffers from deactivation. The deactivation is primarily due to
humin deposit on the surface of the catalyst.
The 2nd part of the dissertation deals with the bioconversion of lignocellulosic biomass. The one
of the main objective of this task is to investigate the technical feasibility of one-step
bioconversion of cellulosic mixed feedstock into lactic acid through simultaneous
saccharification and co-fermentation (SSCF). On that ground, hemp hurd, an industrial
byproduct, was investigated as a complementary feedstock to paper mill sludge for lactic acid
production via SSCF. The feedstock mixture was processed by Cellic C-Tec2 enzyme and
Lactobacillus pentosus (ATCC-8041). The mixing ratio plays an important role in the production
of lactic acid as the pH of the product titer depends on the sufficient supply of sludge to maintain
at optimum level. Calcium carbonate, which retain as a fraction of ash in sludge react with lactic
acid producing calcium lactate as final product. The final lactic acid concentration was obtained
iv
66 g/L, which corresponds lactic acid yield 0.82 g/g-sugar, under 12 % solid loading at mixing
ratio of sludge: hemp hurd =80:20.
In the final section, the efficacy of chlorine dioxide (ClO2) as a secondary pretreatment reagent
was investigated. Lignin is believed to be a major hindrance to bioconversion as it surrounds
carbohydrates (cellulose and hemicellulose) making it highly recalcitrant to enzymes and
microorganisms. ClO2, a selective bleaching agent, have been used in pulp and paper industry to
remove lignin very effectively. Here, two different types of two-step pretreatment process,
alkaline followed by ClO2 and dilute acid followed by ClO2 were evaluated as a measure of
enzymatic deconstruction of biomass to monomeric sugars. The effectiveness of the secondary
treatment (ClO2) is highly sensitive to the primary treatment reagent whether it is alkali or acidic.
Thus, alkaline followed by ClO2 improve glucan digestibility significantly and in some cases,
xylan digestibility as well. On the contrary, dilute acid followed by ClO2 has shown negative
effect on enzymatic hydrolysis. Lignin quantity, lignin distribution, lignin structure of the treated
feedstocks and lignin, which depend on the primary treatment reactions mechanism, were found
to be the major parameters affecting the overall efficiency of the process.
In summary, the work of this dissertation provides first-hand knowledge regarding the technical
feasibility for the acid catalyzed production of LA from glucose and biochemical production of
lactic acid from mixed feedstocks.
v
Acknowledgments
I would like to express my thanks to the people who helped me in my journey in Auburn
University. First of all, I would like to express my sincere gratitude to Dr. Yoon Y. Lee, my
advisor, for his guidance, patience, enthusiasm, encouragement and total support that continually
inspired me to reach out to new fields. I would like to thank Dr. Zhihua Jiang, my co-adviser, for
providing the invaluable guidance and support throughout my research. I would also like to
thank Dr. Thomas Hanley, Dr. Aland David, and Dr. Maobing Tu for their valuable guidance
during the course of this investigation. I would like to thank Dr. Yi Wang for agreeing to be an
external reader. Special thanks to Dr.Venkata Ramesh Pallapolu, Dr. Suan Shi and Dr. Wenjian
Guan for their constant helps, supports and suggestions. I would like to thanks Tae Hyun Kim
for providing LMMA and ELLA treated corn stover. I would also like to thanks Dr. Shaima
Nahreen, Dr. Joyanta Goswami, Dr. Alexander Haywood, Dr. Shahadat Hussain, Dr. MariAnne
Sullivan, David Roe, Mahesh Parit, Shounak Dutta and Nirmal Mitra for their help during
experiment. I want to thank Novozymes, North America, Franklinton, NC for providing C-Tec2
enzyme, Boise Paper Company, Jackson, AL for providing the paper mill sludges and Pure
Vision Technology Inc., Fort Lupton, CO for providing hemp hurd.
Finally, I gratefully acknowledge the financial support provided by Alabama Center for Paper
and Renewable Resources Engineering, AkzoNobel Pulp & Performance chemicals, and
Georgia-Pacific, Atlanta.

vi
To my late Father and
Mother, Brothers & Sisters
vii
Table of Contents
Abstract ....................................................................................................................................... ii
Acknowledgments....................................................................................................................... v
Table of Contents ....................................................................................................................... vi
List of Tables ........................................................................................................................... xiv
List of Figures .......................................................................................................................... xvi
CHAPTER 1 .................................................................................................................................. 1
Introduction ..................................................................................................................................................... 1
1.1 Background ........................................................................................................................... 1
1.2 Biomass as a renewable source of carbon............................................................................. 3
1.2.1 Cellulose ........................................................................................................................ 3
1.2.2 Hemicellulose ................................................................................................................ 4
1.2.3 Lignin ............................................................................................................................. 4
1.3 Strategies of biomass conversion .......................................................................................... 5
1.4 Conversion via platform molecules ...................................................................................... 9
1.5 Conversion of biomass to HMF ............................................................................................ 9
1.5.1 Catalytic conversions in aqueous media ...................................................................... 10
1.5.2 Combined glucose to fructose isomerization and fructose to HMF strategy ............... 11
1.5.3 Combined base and Brønsted acid systems ................................................................. 11
viii
1.5.4 Combined enzymatic and Brønsted acid catalysts systems………………………......12
1.5.5 Combined Lewis acid and Brønsted acid systems ....................................................... 12
1.6 Conversion of biomass to LA ............................................................................................. 13
1.6.1 Homogeneous acid catalysts ........................................................................................ 13
1.6.2 Heterogeneous acid catalysts ....................................................................................... 15
1.6.3 Industrial production of LA from biomass .................................................................. 15
1.6.4 Mechanistic studies of LA production ......................................................................... 17
1.6.5 LA derivatives .............................................................................................................. 19
1.7 Conversion of biomass to lactic acid .................................................................................. 19
1.8 Pretreatment ........................................................................................................................ 22
1.8.1 Thermochemical pretreatment ..................................................................................... 22
1.8.2 Acidic pretreatment ...................................................................................................... 23
1.8.3 Alkaline pretreatment................................................................................................... 23
1.8.4 Hydrothermal pretreatment .......................................................................................... 24
1.8.5 Oxidizing reagents pretreatment .................................................................................. 24
1.9 Enzymatic hydrolysis .......................................................................................................... 25
1.10 Fermentation ..................................................................................................................... 27
1.11 Research overview ............................................................................................................ 30
CHAPTER 2 ................................................................................................................................ 31
Sulfuric acid catalyzed conversion of glucose to levulinic acid in aqueous media: kinetics
and reaction engineering to maximize yields. ...................................................................................... 31
2.1 Abstract ............................................................................................................................... 31
2.2 Introduction ......................................................................................................................... 32
ix
2.3 Materials and Methods ........................................................................................................ 34
2.3.1 Chemicals and reagents................................................................................................ 34
2.3.2 Experimental procedure ............................................................................................... 34
2.3.3 Analytical method ........................................................................................................ 35
2.4 Kinetic Modeling ................................................................................................................ 36
2.4.1 Calculations procedure................................................................................................. 37
2.4.2 Optimum temperature profile ...................................................................................... 39
2.5 Results and Discussion: ...................................................................................................... 39
2.5.1 Effect of process variable on the HMF decomposition to LA in acid medium ........... 39
2.5.2 Kinetic model for HMF decomposition to LA: ........................................................... 42
2.5.2.1 Modeling results.................................................................................................... 42
2.5.3 Kinetic model for glucose conversion to LA ............................................................... 43
2.5.3.1 Modeling results.................................................................................................... 43
2.5.4 Reactor design for production of HMF and LA........................................................... 55
2.5.5 Optimum temperature profile ...................................................................................... 59
2.6 Conclusion .......................................................................................................................... 62
CHAPTER 3 ................................................................................................................................ 63
Production of levulinic acid from glucose by dual solid-acid catalysts........................................ 63
3.1 Abstract ............................................................................................................................... 63
3.2 Introduction ......................................................................................................................... 64
3.3 Materials and Method ......................................................................................................... 66
3.3.1 Chemicals and reagents................................................................................................ 66
x
3.3.2 Catalyst preparation ..................................................................................................... 67
3.3.3 Catalyst characterization .............................................................................................. 67
3.3.4 Catalytic reaction procedure ........................................................................................ 68
3.3.5 Catalyst stability test .................................................................................................... 68
3.3.6 Product analysis ........................................................................................................... 69
3.4 Results and Discussions ...................................................................................................... 70
3.4.1 Glucose isomerization to fructose by Lewis acid catalyst ........................................... 72
3.4.1.1 Characterization of Lewis acids ............................................................................ 72
3.4.1.2 Catalyst screening for glucose isomerization reaction .......................................... 73
3.4.1.3 Sn-beta for glucose isomerization reaction ........................................................... 74
3.4.2 Production of LA from glucose with solid acid catalysts ............................................ 76
3.4.3 Catalyst stability test .................................................................................................... 81
3.5 Conclusions ......................................................................................................................... 87
CHAPTER 4 ................................................................................................................................ 88
Simultaneous saccharification and co-fermentation of paper mill sludge mixed with hemp
hurd for the production of lactic acid .................................................................................................... 88
4.1 Abstract ............................................................................................................................... 88
4.2 Introduction ......................................................................................................................... 89
4.3 Materials and Methods ........................................................................................................ 91
4.3.1 Feedstock and reagents ................................................................................................ 91
4.3.2 Enzymes and microorganism ....................................................................................... 91
4.3.3 Culture maintenance and inoculum preparation .......................................................... 92
4.3.4 Enzymatic hydrolysis ................................................................................................... 92
xi
4.3.5 Simultaneous Saccharification and Co-Fermentation (SSCF) ..................................... 92
4.3.6 Analytical method ........................................................................................................ 93
4.4 Results ................................................................................................................................. 94
4.4.1 Composition ................................................................................................................. 94
4.4.2 Enzymatic hydrolysis of hemp hurd ............................................................................ 94
4.4.3 SSCF of sludge and hemp hurd ................................................................................... 96
4.4.4 SSCF of the mixture of sludge and hemp hurd ............................................................ 98
4.4.4.1 Effect of mixing ratio on SSCF ............................................................................ 98
4.4.4.2 Effect of enzyme loading on SSCF ..................................................................... 106
4.5 Discussions ....................................................................................................................... 109
4.5.1 Effect of process variables on lactic acid production ................................................ 109
4.5.2 Effect of process variables on glucose release and consumption .............................. 111
4.5.3 Effect of process variables on xylose release and consumption ................................ 112
4.5.4 Effect of process variables on acetic acid generation ................................................ 113
4.5.5 Effect of enzyme loading on SSCF ............................................................................ 113
4.6 Conclusions ....................................................................................................................... 114
CHAPTER 5 .............................................................................................................................. 116
Chlorine dioxide as a secondary pretreatment reagent for herbaceous biomass ................... 116
5.1 Abstract ............................................................................................................................. 116
5.2 Introduction ....................................................................................................................... 117
5.3 Materials and Methods ...................................................................................................... 119
5.3.1 Feedstock and reagents .............................................................................................. 119
5.3.2 Experimental procedure for pretreatment .................................................................. 119
xii
5.3.3 Enzymatic hydrolysis ................................................................................................. 120
5.3.4 Composition analysis ................................................................................................. 120
5.3.5 FTIR and SEM analysis ............................................................................................. 121
5.3.6 Biomass crystallinity .................................................................................................. 121
5.3.7 Nitrogen porosimetry ................................................................................................. 122
5.4 Results ............................................................................................................................... 122
5.4.1 Effect of ClO2 on aqueous ammonia treated corn stover ........................................... 122
5.4.2 Effect of ClO2 on H2SO4 treated corn stover ............................................................. 128
5.4.3 Effect of ClO2 on NaOH treated poplar ..................................................................... 129
5.5 Discussions ....................................................................................................................... 131
5.5.1 Lignin reaction under alkaline conditions at the primary stage ................................. 131
5.5.2 Lignin reaction with ClO2 at the secondary stage ..................................................... 131
5.5.3 Effect of lignin modification on enzymatic hydrolysis.............................................. 133
5.5.4 Effect of lignin distribution on enzymatic hydrolysis................................................ 135
5.5.5 Other factors that are being altered during ClO2 pretreatment. ................................. 139
5.6 Conclusion ........................................................................................................................ 142
CHAPTER 6 .............................................................................................................................. 143
Conclusions and Recommendations for Further Research ........................................................... 143
6.1.1 Develop a generalized kinetic model of sulfuric acid catalyzed levulinic acid
production from hexose sugar ............................................................................................. 143
6.1.2 Levulinic acid production from cellulose .................................................................. 144
6.1.3 Effect of alkali or acid on ClO2 treated biomass ........................................................ 145
xiii
6.1.4 Lactic acid production of different feedstocks........................................................... 145
References………………………………………………………………………………………146
xiv
List of Tables
Table 1-1 Overview of acid catalyzed production method for LA .............................................. 14
Table 1-2 Overview of SSF production method for lactic acid ................................................... 22
Table 2-1 Estimated kinetic parameter for acid catalyzed HMF decomposition to LA ............... 43
Table 2-2 Estimated first order rate constant at three initial glucose concentration. .................... 47
Table 2-3 Estimated first order rate constant at three temperatures. ........................................... 50
Table 2-4 Estimated rate constant at three acid concentrations. ................................................... 51
Table 2-5 Estimated kinetic parameter for acid catalyzed glucose decomposition to HMF at
different initial glucose concentration. ......................................................................................... 53
Table 2-6 Estimated kinetic parameter for acid catalyzed glucose decomposition to LA used for
model............................................................................................................................................. 54
Table 2-7 Isothermal optimum temperature vs other isothermal conditions. ............................... 59
Table 3-1 Production of LA from hexoses. ................................................................................. 71
Table 3-2 Physicochemical properties of the catalysts. ............................................................... 73
Table 3-3 Glucose isomerization to fructose using Sn-beta. ....................................................... 75
Table 3-4 Glucose transformation to LA using solid acids.. ........................................................ 77
Table 4-1 Composition of paper mill sludge and hemp hurd ...................................................... 94
Table 4-2 Enzymatic digestibility data of sludge and hemp hurd ................................................ 95
Table 4-3 Net amount of lactic acid generated from sludge, hemp hurd and mixture ............... 109
Table 5-1 Effect of ClO2 as a secondary pretreatment reagent on corn stover treated by aqueous
ammonia.. .................................................................................................................................... 127
xv
Table 5-2 Effect of ClO2 as a secondary pretreatment reagent in which feedstocks were treated
with either low-moisture anhydrous ammonia (LMAA) or extremely low-liquid ammonia
(ELLA).. ...................................................................................................................................... 128
Table 5-3 Effect of ClO2 as a secondary pretreatment reagent on H2SO4 treated corn stover. .. 129
Table 5-4 Effect of ClO2 as a secondary pretreatment reagent on NaOH treated corn poplar.. . 130
Table 5-5 Changes in surface area and pore volume of corn stover ........................................... 139
xvi
List of Figures
Figure 1-1 Structure of lignocellulose ........................................................................................... 5
Figure 1-2 Overview of the processing of crude feedstocks to refined products in a sustainable
biorefinery. ...................................................................................................................................... 6
Figure 1-3 Top value-added chemicals from glucose. .................................................................... 7
Figure 1-4 Diagram of approximate reaction conditions for the catalytic processing of petroleum
versus biomass-derived carbohydrates . ......................................................................................... 8
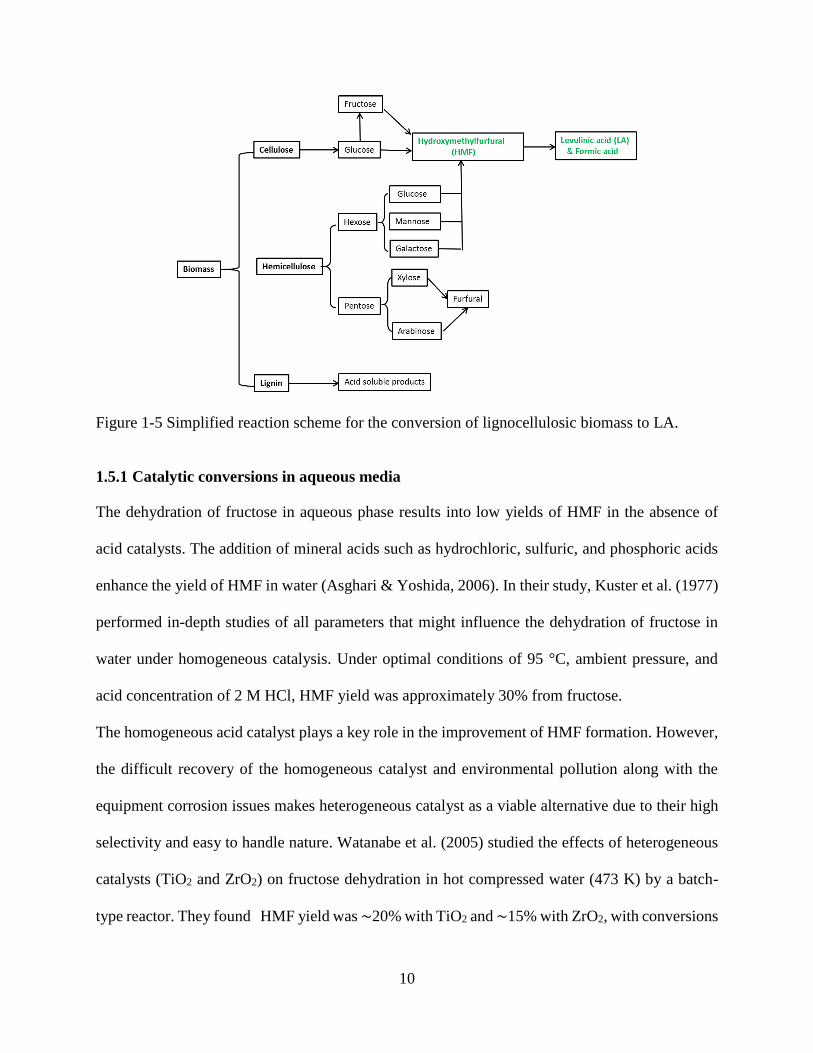
Figure 1-5 Simplified reaction scheme for the conversion of lignocellulosic biomass to LA. .... 10
Figure 1-6 Continuous production of LA by the Biofine technology . ....................................... 16
Figure 1-7 Transformation of LA . .............................................................................................. 19
Figure 1-8 Metabolic pathways for lactic acid production from various sugars by LAB.. ......... 21
Figure 1-9 Current view on fungal enzymatic degradation of cellulose. ..................................... 26
Figure 1-10 Various Modes of hydrolysis and fermentation ........................................................ 29
Figure 2-1 Effect of temperature on HMF conversion to LA. ...................................................... 40
Figure 2-2 Effect of temperature on LA production from HMF.. ................................................ 40
Figure 2-3 Effect of acid concentration on HMF conversion to LA............................................. 41
Figure 2-4 Effect of acid concentration on LA production from HMF. ....................................... 41
Figure 2-5 Data fitting for LA production at different initial concentration of glucose . ............ 44
Figure 2-6 Effect of initial concentration on glucose conversion.. ............................................... 45
Figure 2-7 Effect of initial glucose concentration on HMF yield.. .............................................. 46
Figure 2-8 Effect of initial glucose concentration on LA yield.. ................................................ 46
xvii
Figure 2-9 Effect of temperature on glucose conversion. ............................................................. 48
Figure 2-10 Effect of temperature on HMF production................................................................ 48
Figure 2-11 Effect of temperature on LA production. .................................................................. 49
Figure 2-12 Effect of temperature on rate constant. ..................................................................... 50
Figure 2-13 Effect of acid concentration on glucose conversion.. ............................................... 51
Figure 2-14 Effect of acid concentration on HMF yield............................................................... 52
Figure 2-15 Effect of acid concentration on LA yield.. ................................................................ 52
Figure 2-16 Continuous reactor modelling for HMF yield in a single continuous reactor........... 56
Figure 2-17 Continuous reactor modelling for LA yield in a single continuous reactor.. ............ 57
Figure 2-18 Contour plot for continuous reactor modelling for HMF yield in a single continuous
reactor. .......................................................................................................................................... 58
Figure 2-19 Contour plot for continuous reactor modelling for LA yield in a single continuous
reactor. .......................................................................................................................................... 58
Figure 2-20 Optimum temperature profile for LA yield in a single batch reactor. ................... 60
Figure 2-21 Glucose conversion profile based on optimum temperature profile and isothermal
optimum temperature in a single batch reactor. ........................................................................... 60
Figure 2-22 HMF yield profile based on optimum temperature profile and isothermal optimum
temperature in a single batch reactor. .......................................................................................... 61
Figure 2-23 LA yield profile based on optimum temperature profile and isothermal optimum
temperature in a single batch reactor. .......................................................................................... 61
Figure 3-1 XRD Pattern of a) zeolite beta, b) dealuminated zeolite beta, c) Sn-beta, d) V-beta, e)
La-beta and, f) Fe-beta. ................................................................................................................. 72
Figure 3-2 Glucose isomerization to fructose using solid acids. ............................................... 74
xviii
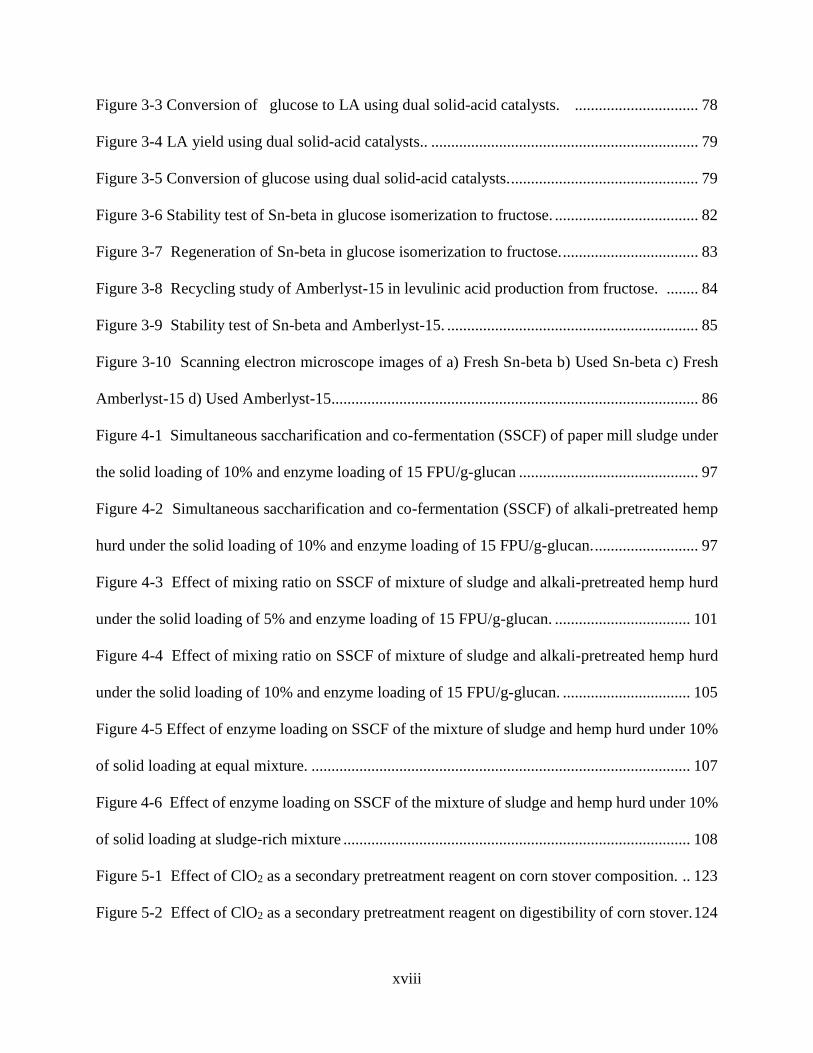
Figure 3-3 Conversion of glucose to LA using dual solid-acid catalysts. ............................... 78
Figure 3-4 LA yield using dual solid-acid catalysts.. ................................................................... 79
Figure 3-5 Conversion of glucose using dual solid-acid catalysts. ............................................... 79
Figure 3-6 Stability test of Sn-beta in glucose isomerization to fructose. .................................... 82
Figure 3-7 Regeneration of Sn-beta in glucose isomerization to fructose. .................................. 83
Figure 3-8 Recycling study of Amberlyst-15 in levulinic acid production from fructose. ........ 84
Figure 3-9 Stability test of Sn-beta and Amberlyst-15. ............................................................... 85
Figure 3-10 Scanning electron microscope images of a) Fresh Sn-beta b) Used Sn-beta c) Fresh
Amberlyst-15 d) Used Amberlyst-15............................................................................................ 86
Figure 4-1 Simultaneous saccharification and co-fermentation (SSCF) of paper mill sludge under
the solid loading of 10% and enzyme loading of 15 FPU/g-glucan ............................................. 97
Figure 4-2 Simultaneous saccharification and co-fermentation (SSCF) of alkali-pretreated hemp
hurd under the solid loading of 10% and enzyme loading of 15 FPU/g-glucan. .......................... 97
Figure 4-3 Effect of mixing ratio on SSCF of mixture of sludge and alkali-pretreated hemp hurd
under the solid loading of 5% and enzyme loading of 15 FPU/g-glucan. .................................. 101
Figure 4-4 Effect of mixing ratio on SSCF of mixture of sludge and alkali-pretreated hemp hurd
under the solid loading of 10% and enzyme loading of 15 FPU/g-glucan. ................................ 105
Figure 4-5 Effect of enzyme loading on SSCF of the mixture of sludge and hemp hurd under 10%
of solid loading at equal mixture. ............................................................................................... 107
Figure 4-6 Effect of enzyme loading on SSCF of the mixture of sludge and hemp hurd under 10%
of solid loading at sludge-rich mixture ....................................................................................... 108
Figure 5-1 Effect of ClO2 as a secondary pretreatment reagent on corn stover composition. .. 123
Figure 5-2 Effect of ClO2 as a secondary pretreatment reagent on digestibility of corn stover. 124
xix
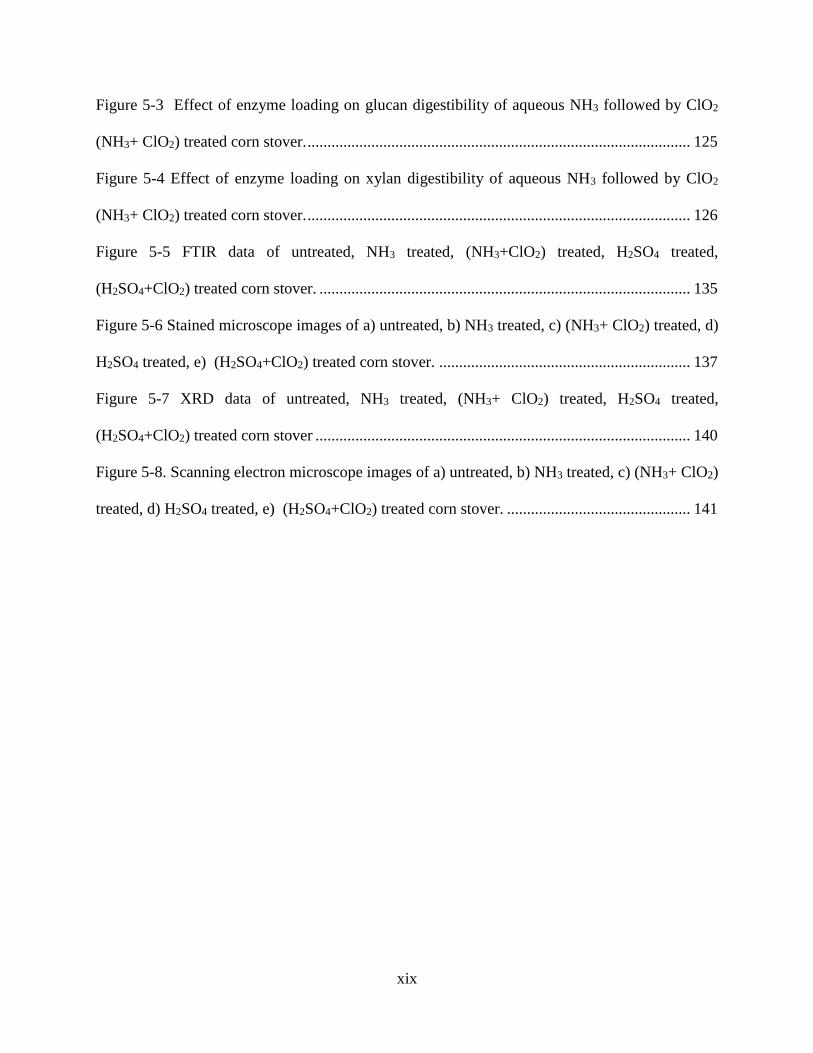
Figure 5-3 Effect of enzyme loading on glucan digestibility of aqueous NH3 followed by ClO2
(NH3+ ClO2) treated corn stover. ................................................................................................ 125
Figure 5-4 Effect of enzyme loading on xylan digestibility of aqueous NH3 followed by ClO2
(NH3+ ClO2) treated corn stover. ................................................................................................ 126
Figure 5-5 FTIR data of untreated, NH3 treated, (NH3+ClO2) treated, H2SO4 treated,
(H2SO4+ClO2) treated corn stover. ............................................................................................. 135
Figure 5-6 Stained microscope images of a) untreated, b) NH3 treated, c) (NH3+ ClO2) treated, d)
H2SO4 treated, e) (H2SO4+ClO2) treated corn stover. ............................................................... 137
Figure 5-7 XRD data of untreated, NH3 treated, (NH3+ ClO2) treated, H2SO4 treated,
(H2SO4+ClO2) treated corn stover .............................................................................................. 140
Figure 5-8. Scanning electron microscope images of a) untreated, b) NH3 treated, c) (NH3+ ClO2)
treated, d) H2SO4 treated, e) (H2SO4+ClO2) treated corn stover. .............................................. 141
xx
List of Scheme
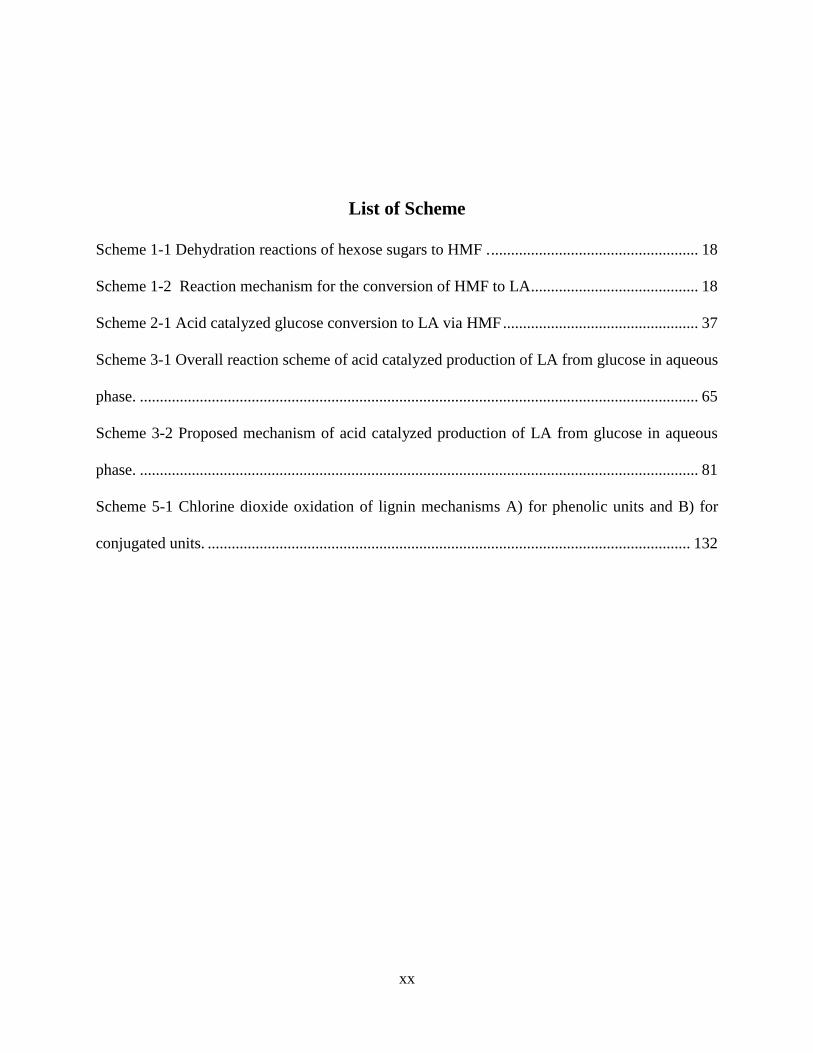
Scheme 1-1 Dehydration reactions of hexose sugars to HMF . .................................................... 18
Scheme 1-2 Reaction mechanism for the conversion of HMF to LA .......................................... 18
Scheme 2-1 Acid catalyzed glucose conversion to LA via HMF ................................................. 37
Scheme 3-1 Overall reaction scheme of acid catalyzed production of LA from glucose in aqueous
phase. ............................................................................................................................................ 65
Scheme 3-2 Proposed mechanism of acid catalyzed production of LA from glucose in aqueous
phase. ............................................................................................................................................ 81
Scheme 5-1 Chlorine dioxide oxidation of lignin mechanisms A) for phenolic units and B) for
conjugated units. ......................................................................................................................... 132
1
Chapter 1
Introduction
1.1 Background
The production of fuels and chemicals from biomass is not a new concept. Apart from providing
food, feed and energy, biomass was an important source of valuable products such as medicinal
drugs and flavors and fragrances throughout recorded history (Gallezot, 2012). In this context,
cellulose, ethanol, methanol and other biomass-derived chemicals have been in use since 1800 to
make paint, glue adhesive and solvents (Demirbas, 2006). In the 19th century, the discovery of
fossil petroleum created an inexpensive liquid fuel source that helped industrialize the world and
improved living standards (Huber et al., 2006). Thus bio-based chemicals have been suffered a
severe economic competition from much cheaper products synthesized by conventional routes
from hydrocarbons for more than 100 years (Gallezot, 2012). Today, fossil fuels such as coal, oil,
and natural gas provide more than three quarters of the world’s energy. However, the worldwide
reserves of petroleum are estimated to be depleted in less than 50 years at the present rate of
consumption (Demirbas, 2007). Moreover, it is projected that the world energy consumption and
petroleum demand will increase more than 30% over the next two decades due to the rapidly
expanding worldwide population, particularly in emerging countries (Wang et al., 2014). A serious
drawback of energy production from petroleum-derived fuels is significant carbon dioxide
emission, which is a principle contributor to global warming and the problems related to climate
change (Yu et al., 2008b). In addition, “World energy markets continue to be vulnerable to
2
disruptions precipitated by events ranging from geo-political strife to natural disasters” according
to the World Energy Outlook (2014). Currently, the growing demand for petroleum resource
combined with declining petroleum supplies by emerging economies, and political and
environmental concerns about fossil fuels have stimulated a worldwide initiative to develop
economical and energy-efficient processes for the sustainable production of fuels and chemicals.
Therefore, renewable energy have been recognized as an important part of any strategy to address
the environmental issues related to fossil fuels, to reduce our reliance on unstable countries to
supply oil, and to increase sustainable development(Yu et al., 2008b). In addition, some other
factors push the current move of the chemical industry to substitute a growing part of fossil
feedstock by renewable carbon.
Instead of duplicating existing petroleum derived commodity, the chemistry of renewable sources
opens an opportunity to develop a new portfolio of products that have no equivalence among those
presently manufactured by classical synthesis routes from hydrocarbons (Gallezot, 2012).
Organization like Europe’s SusChem or U.S. Department of Energy (US DOE) have actively
promoted the usage of renewable resources to produce new products to uphold the competition
among the chemical industries in global market due to market potentiality of bio based bulk
chemicals (Gallezot, 2012). Taking all these considerations into account, biomass exists as a
unique and promising candidate, with potential for improved sustainability and biodegradability
relative to its petroleum counterpart (Wang et al., 2014). Hence, experts have predicted that 20%
of transportation fuel and 25% of chemicals will be produced from biomass by 2030 (US DOE,
2002).
To achieve these goals, the U.S. Department of Agriculture (USDA) and the U.S. Department of
Energy (US DOE) estimated that the U.S. could sustainably produce 1.3 billion dry tons of biomass
3
per year using its agricultural (72% of total) and forest (28% of total) resources and still meet its
food, feed, and export demands (Huber et al., 2006). Currently the fermentation of starches
(primarily from corn grain or sugar cane) to ethanol and the transesterification of fatty acids from
soy, canola, and other natural oils to biodiesel are the two major chemical pathways to produce
biofuels commercially (Acharjee, 2010). These processes have limited capacity to fulfill these
goals; technology development for processing more abundant lignocellulosic biomass for fuels
and materials will be critical.
1.2 Biomass as a renewable source of carbon
Lignocellulosic material such as agricultural residues (e.g., wheat straw, sugarcane bagasse, corn
stover), forest products (hardwood and softwood), and dedicated energy crops (switch grass, salix)
can be used for the production of alternative transportation fuels and chemicals. The three main
components of lignocellulose are cellulose, hemicellulose and lignin (Figure 1-1), with the relative
proportions of the three dependent their species of origin. The cell wall of lignocellulosic biomass
is a composite material of crystalline cellulose fibrils bound by non-crystalline hemicellulose and
surrounded by a matrix of hemicellulose and lignin (Rubin, 2008). All three components can be
used to produce different value-added products depending on their end use.
1.2.1 Cellulose
Cellulose, the major structural components of lignocellulosic biomass, acts as the natural
framework in the form of cellulose microfibrils. It is the polymer of glucose monomer bonded
with β (1→4) glycosidic linkages and the degree of polymerization (DP) of higher plants lies in
the range of 7,000-14,000 in the secondary wall and 500-6000 in the primary wall approximately
(Gupta, 2010). Indeed, long glucose polymer chains are stuck together with inter and intra
4
hydrogen bonds and van der Waals interactions, creating a resistant microfibrils network (Rubin,
2008).
1.2.2 Hemicellulose
Hemicellulose, the second most abundant component of lignocellulose, is a polymer of several
simple sugars such as five carbon sugars (usually xylose and arabinose) and six carbon sugars
(galactose, glucose, and mannose) (Rubin, 2008). Softwood hemicellulose is composed of a
backbone of β-1, 4 linked mannose and glucose units in roughly a 3:1 ratio (Lai, 2010). Acetyl
groups occur on the C2 or C3 carbon of roughly every third backbone unit. In contrast, hardwood
hemicellulose is primarily consisted of xylans (15-30%), where many of its xylose units are
acetylated at their C2 or C3 carbons (Lai, 2010). Due to its branched nature, hemicellulose is
amorphous and thus relatively easy to hydrolyze to its monomer compared to cellulose.
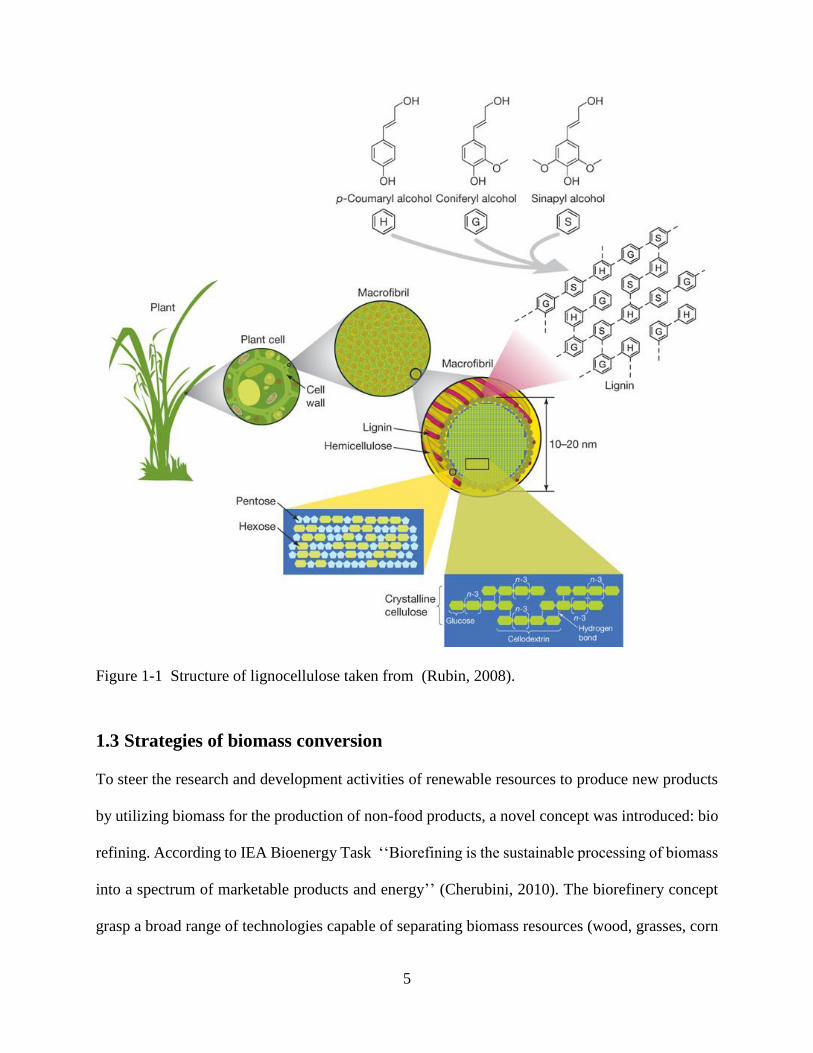
1.2.3 Lignin
Lignin is a three-dimensional, highly branched, polyphenolic substance which plays a critical role
in giving structural rigidity to hold plant fibers together. It is composed of three major phenolic
components, namely p-coumaryl alcohol (H), coniferyl alcohol (G) and sinapyl alcohol (S) (Rubin,
2008). Lignin is synthesized by polymerization of these components and their ratio within the
polymer varies between different plants, wood tissues and cell wall layers. In general, softwood
lignin is formed from coniferyl alcohol where as hardwood lignin has both coniferyl and sinapyl
alcohol as monomer units (Huber et al., 2006).
5
Figure 1-1 Structure of lignocellulose taken from (Rubin, 2008).
1.3 Strategies of biomass conversion
To steer the research and development activities of renewable resources to produce new products
by utilizing biomass for the production of non-food products, a novel concept was introduced: bio
refining. According to IEA Bioenergy Task ‘‘Biorefining is the sustainable processing of biomass
into a spectrum of marketable products and energy’’ (Cherubini, 2010). The biorefinery concept
grasp a broad range of technologies capable of separating biomass resources (wood, grasses, corn
6
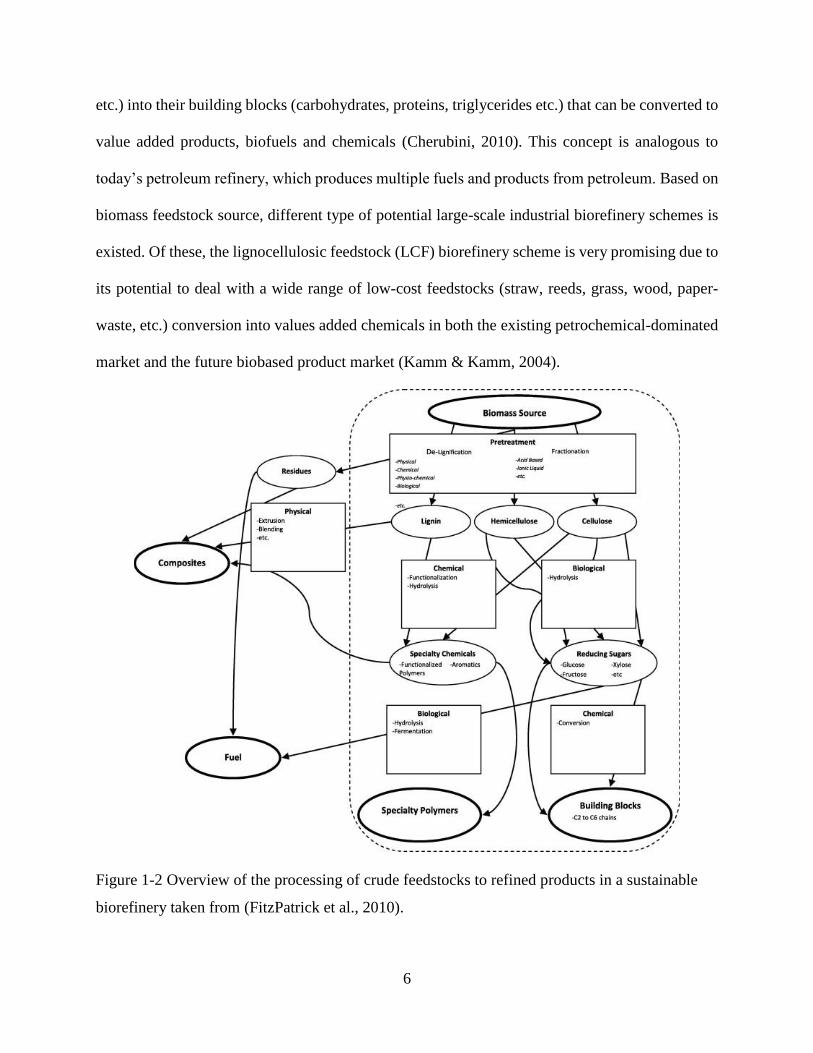
etc.) into their building blocks (carbohydrates, proteins, triglycerides etc.) that can be converted to
value added products, biofuels and chemicals (Cherubini, 2010). This concept is analogous to
today’s petroleum refinery, which produces multiple fuels and products from petroleum. Based on
biomass feedstock source, different type of potential large-scale industrial biorefinery schemes is
existed. Of these, the lignocellulosic feedstock (LCF) biorefinery scheme is very promising due to
its potential to deal with a wide range of low-cost feedstocks (straw, reeds, grass, wood, paper-
waste, etc.) conversion into values added chemicals in both the existing petrochemical-dominated
market and the future biobased product market (Kamm & Kamm, 2004).
Figure 1-2 Overview of the processing of crude feedstocks to refined products in a sustainable
biorefinery taken from (FitzPatrick et al., 2010).
7
Figure 1-2 illustrates the conversion of biomass into bioproducts and/or energy which involves a
series of interconnected feed streams, processes, and chemical. The future success of biorefineries
will require fundamental understanding of underlying process mechanism as well as understanding
of the types of processes best suited for converting the various chemical moieties into biomass-
derived constituents (Gallezot, 2012). There are two kinds of strategies on this regard. The target-
driven approach considers searching of the most efficient synthetic routes to produce a given
chemical starting from well-identified platform molecules by process analysis methodology. In
contrast, process-driven approach deals biomass conversion by one or more catalytic processes
(hydrogenation, hydrogenolysis, oxidation, etc.) yielding a variety of fuels and chemical
intermediates ( Gallezot, 2012; Bozell & Petersen, 2010).
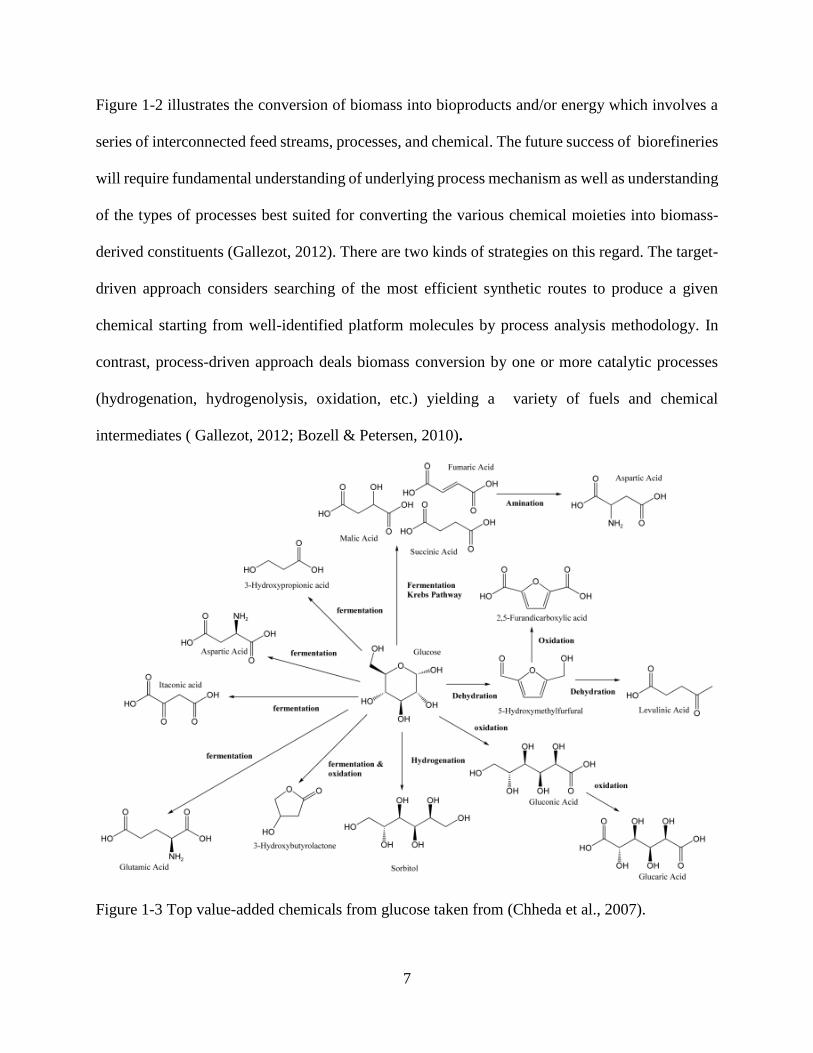
Figure 1-3 Top value-added chemicals from glucose taken from (Chheda et al., 2007).
8
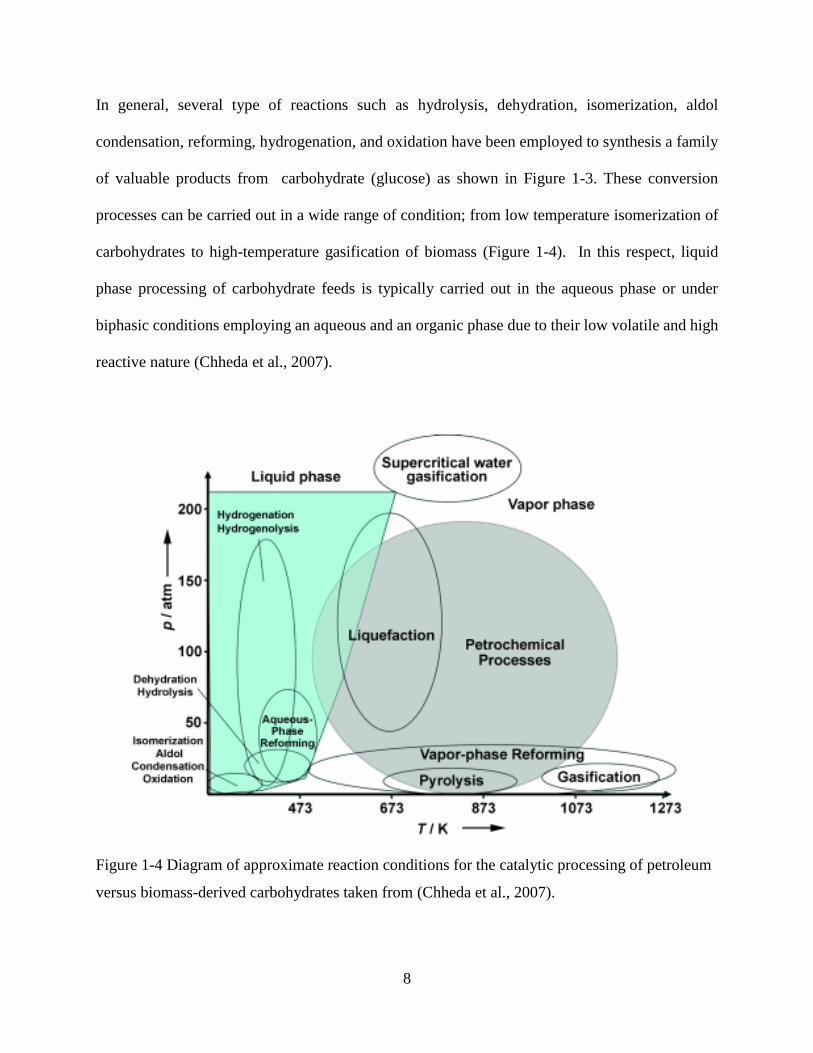
In general, several type of reactions such as hydrolysis, dehydration, isomerization, aldol
condensation, reforming, hydrogenation, and oxidation have been employed to synthesis a family
of valuable products from carbohydrate (glucose) as shown in Figure 1-3. These conversion
processes can be carried out in a wide range of condition; from low temperature isomerization of
carbohydrates to high-temperature gasification of biomass (Figure 1-4). In this respect, liquid
phase processing of carbohydrate feeds is typically carried out in the aqueous phase or under
biphasic conditions employing an aqueous and an organic phase due to their low volatile and high
reactive nature (Chheda et al., 2007).
Figure 1-4 Diagram of approximate reaction conditions for the catalytic processing of petroleum
versus biomass-derived carbohydrates taken from (Chheda et al., 2007).
9
1.4 Conversion via platform molecules
In 2004, National Renewable energy Laboratory (NREL) and Pacific Northwest National
Laboratory (PNNL) conducted a detailed study to identify valuable sugar-based building blocks
for lignocellulosic biomass (Werpy and Petersen, 2004). The aim of the research was to figure out
those green intermediate that could best substitute for the eight fundamental petroleum- based
building blocks still meeting the existing demand of chemical products but shifting reliance from
oil to biomass (Roman-Leshkov, 2008). A list of chemicals was obtained by evaluating the
potential markets of the building blocks and their derivatives and the complexity of the synthetic
pathways. Lactic acid and levulinic acid (LA) were one of the top-thirty green building blocks;
both can be produced from lignocellulosic biomass (Werpy and Petersen, 2004). In addition, HMF,
an intermediate in the process of LA production, also ranked as one of the thirty chemicals. In this
study we focus mainly selective conversions of biomass or biomass-derived feedstocks (especially
sugars) at low temperatures (typically lower than 600 K) and in the liquid phase.
1.5 Conversion of biomass to HMF
HMF consists of a furan ring, containing both aldehyde and alcohol functional groups which makes
it very reactive. The thermal dehydration of hexoses in acid media leads to the formation of two
important basic nonpetroleum chemicals: HMF arising from dehydration of hexoses, and LA
arising from hydration of HMF as seen in Figure 1-5. The dehydration process is more efficient
and selective to HMF when started from ketohexoses than from aldohexoses (Corma et al., 2007).
10
Figure 1-5 Simplified reaction scheme for the conversion of lignocellulosic biomass to LA.
1.5.1 Catalytic conversions in aqueous media
The dehydration of fructose in aqueous phase results into low yields of HMF in the absence of
acid catalysts. The addition of mineral acids such as hydrochloric, sulfuric, and phosphoric acids
enhance the yield of HMF in water (Asghari & Yoshida, 2006). In their study, Kuster et al. (1977)
performed in-depth studies of all parameters that might influence the dehydration of fructose in
water under homogeneous catalysis. Under optimal conditions of 95 °C, ambient pressure, and
acid concentration of 2 M HCl, HMF yield was approximately 30% from fructose.
The homogeneous acid catalyst plays a key role in the improvement of HMF formation. However,
the difficult recovery of the homogeneous catalyst and environmental pollution along with the
equipment corrosion issues makes heterogeneous catalyst as a viable alternative due to their high
selectivity and easy to handle nature. Watanabe et al. (2005) studied the effects of heterogeneous
catalysts (TiO2 and ZrO2) on fructose dehydration in hot compressed water (473 K) by a batch-
type reactor. They found HMF yield was ∼20% with TiO2 and ∼15% with ZrO2, with conversions
11
being 90–100% for each case from fructose at 200 °C, 25 bar Ar, and a 5 minute reaction. Although
aqueous processes are very convenient from an ecological point of view, low HMF selectivity due
to LA and humins formation limit the practical application of simple aqueous system.
1.5.2 Combined glucose to fructose isomerization and fructose to HMF strategy
It is obvious that the dehydration process is more efficient and selective to HMF when started from
ketohexoses (fructose) than from aldohexoses (glucose). The aldohexose (glucose) enolyzes to a
very low degree and the enolization is a determining step of the HMF formation from glucose. In
this respect, glucose isomerization is a crucial step in the efficient production of valuable chemical
intermediates, such as HMF and LA, from biomass. Therefore, combination of glucose
isomerization catalyst with a fructose dehydration catalyst in either a “one-pot” or “two step”
configuration could be promising approach.
1.5.3 Combined base and Brønsted acid systems
Glucose–fructose isomerization, known as the Lobry-deBruyn–van Ekenstein transformation,
catalyzed by a base. Takagaki et al. (2009) designed a strategy for the selective HMF formation
from glucose over solid acid and base catalysts via a one-pot reaction under mild conditions. Their
strategy involves separating HMF synthesis from glucose into two reactions, (1) isomerization of
glucose into fructose catalyzed by solid base and (2) dehydration of fructose into HMF by solid
acid. After initial catalyst screening for the activity of the two individual steps, Mg–Al hydrotalcite
and Amberlyst-15 were chosen as the solid base and acid, respectively. To minimize the mutual
interaction of an acid–base pair, DMF, an organic aprotic solvent was selected as the media for
this “one-pot” transformation. The combination of the base and acid catalysts was demonstrated
to be effective, achieving glucose conversion of 73% with selectivity towards HMF of 58%.
12
1.5.4 Combined enzymatic and Brønsted acid catalysts systems
The preferred industrial isomerization method involves the use of an immobilized enzyme (xylose
isomerase) at 333 K that produces an equilibrium mixture of 42% (wt∕wt) fructose, 50% (wt∕wt)
glucose, and 8% (wt∕wt) other saccharides (Moliner et al., 2010). Huang et al. (2010) used borate-
assisted isomerase to shift equilibrium, which leads to higher fructose yield (87.8%). Once fructose
was separated from the isomerase, the resulting sugar mixtures were dehydrated in water–butanol
media by dilute HCl to produce HMF (63.3% yield). Simeonov et al. (2013) developed a new
catalytic system featuring the integration of enzymatic and acid catalysis for the selective
conversion of glucose into HMF. In their process, they used sweetzyme® for the isomerization
reaction and HNO3 for the subsequent dehydration in wet tetraethylammonium bromide (TEAB)
media. They were able to increase HMF yield up to 90 %. Since the enzymatic isomerization
requires a significantly longer time and chemo-catalytic dehydration is a relatively rapid reaction,
the throughput difference can represent a challenge in integrating the two steps in spite of the
effectiveness of this approach in obtaining the highest reported HMF yields.
1.5.5 Combined Lewis acid and Brønsted acid systems
The combined Lewis and Brønsted acid catalyst systems have several advantages over combined
chemo-enzymatic approach and acid-base approach. The Lewis and Brønsted acid catalyst system
can be easily integrated into “one-step” process in an aqueous media while the chemo-enzymatic
approach requires two-step process. Moreover, this process doesn’t have “mutual interaction”
which creates a problem for acid-base approach. It is known that Lewis acid has much higher
selectivity for the glucose to fructose isomerization and Brønsted acid favors the dehydration of
fructose in aqueous media. Recently, Moliner et al. (2010) reported on a tin-containing zeolite (tin
in the framework of a pure-silica analog of zeolite beta, denoted Sn-beta) that was shown to be
13
active material over a wide temperature range (343– 413 K) for the isomerization. In another study,
the same group reported that the combination of Sn-Beta with acid catalysts gave high yield of
HMF from carbohydrates such as glucose, cellobiose, and starch in their “one-pot” biphasic
reactor system. They were able to enhance HMF selectivity as high as 72 mol % at 79% glucose
conversion with reaction conditions of: water– tetrahydrofuran (THF) biphasic system, catalysis
by a combination of Sn-beta and HCl, reaction temperature of 180 °C, and reaction time of 70 min
(Nikolla et al., 2011).
Amongst all the catalyst/reaction systems reviewed, a combined Lewis acid-catalyzed
isomerization and subsequent Brønsted acid-catalyzed dehydration that converts glucose to HMF
in an aqueous–organic biphasic system seems particularly promising.
1.6 Conversion of biomass to LA
LA (gamma-ketovaleric acid), a short-chain fatty acid, is one of the top-twelve building blocks
which can be produced from lignocellulosic biomass using an acid catalyst. The conversion of a
typical lignocellulosic biomass to LA is shown in Figure 1-5.
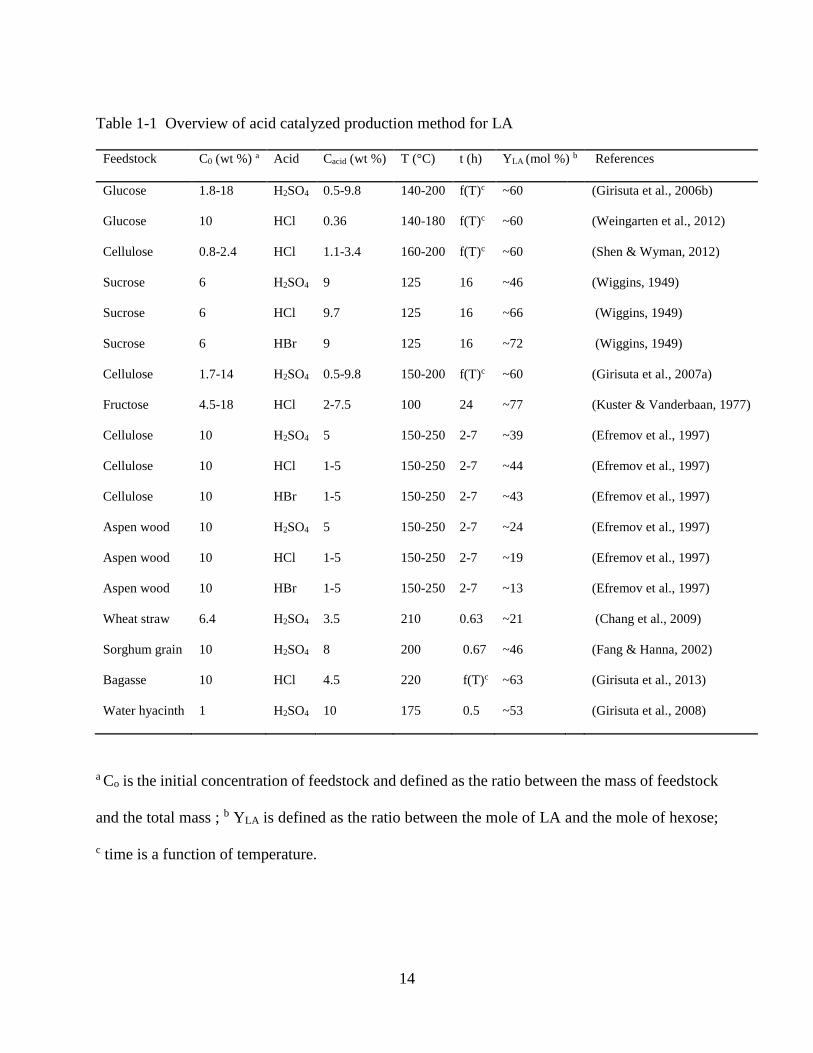
1.6.1 Homogeneous acid catalysts
The most common method to produce LA is the acid catalyzed hydrolysis of hexose sugars or
carbohydrates. Traditionally, strong inorganic acids such as HCl and H2SO4 have been used as
catalysts to produce LA from glucose (Girisuta et al., 2006b). Other carbohydrate-containing
feedstocks including cellulose (Girisuta et al., 2007b) , corn starch (Cha & Hanna, 2002), water
hyacinth plant (Girisuta et al., 2008), sugarcane bagasse (Girisuta et al., 2013), and pine (Rivas et
al., 2013) have also been used. Table 1-1 gives an overview of LA synthesis using various types
of feedstock and acid catalysts.
14
Table 1-1 Overview of acid catalyzed production method for LA
Feedstock C0 (wt %) a Acid Cacid (wt %) T (°C) t (h) YLA (mol %) b References
Glucose 1.8-18 H2SO4 0.5-9.8 140-200 f(T)c ~60 (Girisuta et al., 2006b)
Glucose 10 HCl 0.36 140-180 f(T)c ~60 (Weingarten et al., 2012)
Cellulose 0.8-2.4 HCl 1.1-3.4 160-200 f(T)c ~60 (Shen & Wyman, 2012)
Sucrose 6 H2SO4 9 125 16 ~46 (Wiggins, 1949)
Sucrose 6 HCl 9.7 125 16 ~66 (Wiggins, 1949)
Sucrose 6 HBr 9 125 16 ~72 (Wiggins, 1949)
Cellulose 1.7-14 H2SO4 0.5-9.8 150-200 f(T)c ~60 (Girisuta et al., 2007a)
Fructose 4.5-18 HCl 2-7.5 100 24 ~77 (Kuster & Vanderbaan, 1977)
Cellulose 10 H2SO4 5 150-250 2-7 ~39 (Efremov et al., 1997)
Cellulose 10 HCl 1-5 150-250 2-7 ~44 (Efremov et al., 1997)
Cellulose 10 HBr 1-5 150-250 2-7 ~43 (Efremov et al., 1997)
Aspen wood 10 H2SO4 5 150-250 2-7 ~24 (Efremov et al., 1997)
Aspen wood 10 HCl 1-5 150-250 2-7 ~19 (Efremov et al., 1997)
Aspen wood 10 HBr 1-5 150-250 2-7 ~13 (Efremov et al., 1997)
Wheat straw 6.4 H2SO4 3.5 210 0.63 ~21 (Chang et al., 2009)
Sorghum grain 10 H2SO4 8 200 0.67 ~46 (Fang & Hanna, 2002)
Bagasse 10 HCl 4.5 220 f(T)c ~63 (Girisuta et al., 2013)
Water hyacinth 1 H2SO4 10 175 0.5 ~53 (Girisuta et al., 2008)
a Co is the initial concentration of feedstock and defined as the ratio between the mass of feedstock
and the total mass ; b YLA is defined as the ratio between the mole of LA and the mole of hexose;
c time is a function of temperature.
15
1.6.2 Heterogeneous acid catalysts
A wealth of research have been conducted on conversion of lignocellulosic biomass to LA using
homogeneous catalysts , but relatively few address heterogeneous catalyst in the process of LA
production from soluble sugars. The difficulty in recovery of the homogeneous catalyst and
disposal problem along with equipment corrosion issues make heterogeneous catalyst a viable
option.
Heterogeneous acid catalysts such as faujasite (LZY and HY) and mordenite (MFI) type zeolites
have been used previously for the synthesis of LA from fructose, glucose and cellulose (Jow et al.,
1987; Lourvanij & Rorrer, 1993; Zeng et al., 2010). Recently, chromium chloride was found to be
effective for the conversion of cellulose to LA, affording yield of 67 mol % (Peng et al., 2010).
However, catalyst stability was found to be a concern, as atomic absorption spectrometry data
show that significant amounts of chromium ions were found in the liquid product due to the
leaching of metal ions from the solid to the solution or to partial dissolution of the solid. Acidic
ion-exchange resins such as perfluorosulfonic acid-based catalysts (Nafion) and styrene-based
sulfonic acids (Amberlyst) have been found to be effective for a wide range of acid-catalyzed
reactions. Lucht and co-workers used Nafion SAC-13 to produce LA from cellulose and obtained
a relatively low yield of LA (Hegner et al., 2010; Potvin et al., 2011). However, they were able to
increase the yield of LA five-fold from 14% in aqueous medium to 72% in 25% NaCl solution.
Weingarten et al. used Amberlyst-70 to produce LA from glucose and found the maximum yield
to be 33% in aqueous media (Weingarten et al., 2012).
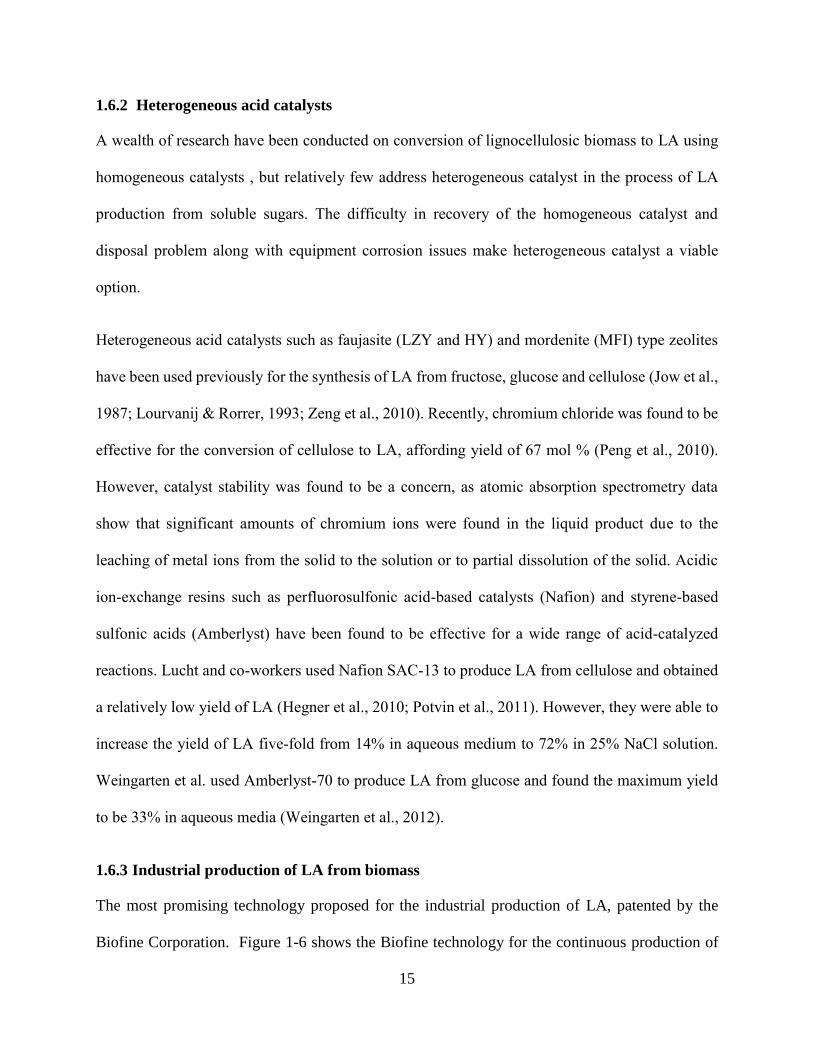
1.6.3 Industrial production of LA from biomass
The most promising technology proposed for the industrial production of LA, patented by the
Biofine Corporation. Figure 1-6 shows the Biofine technology for the continuous production of
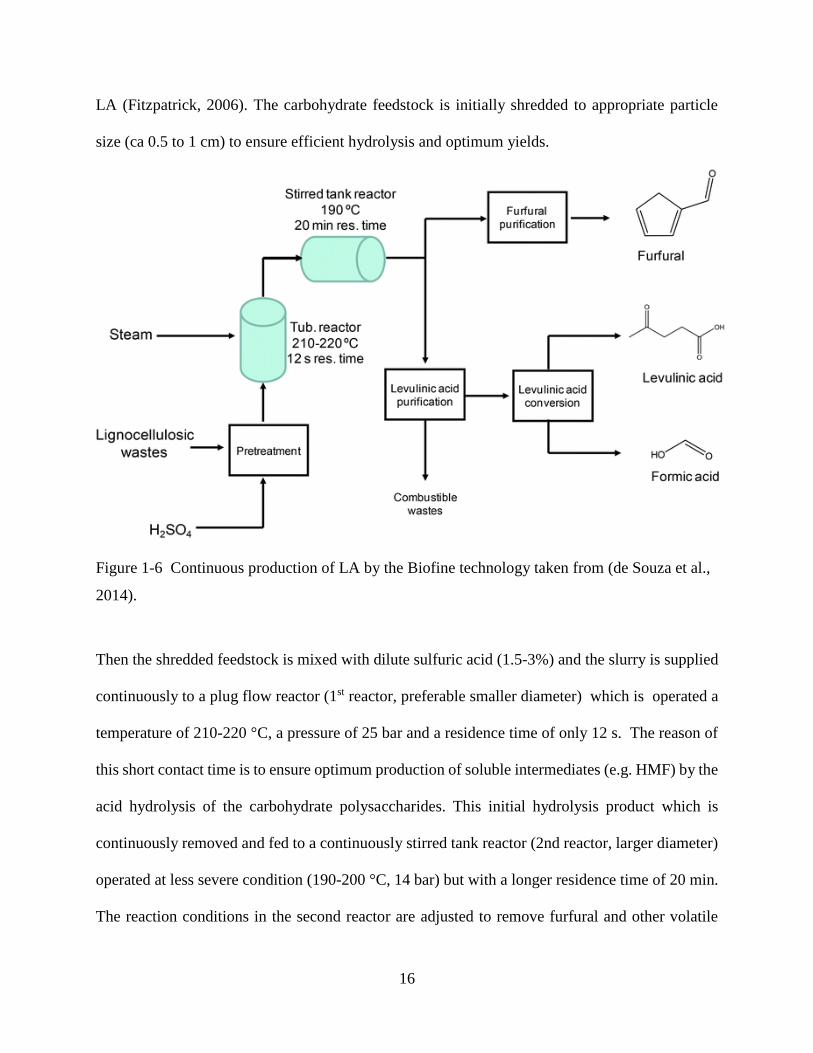
16
LA (Fitzpatrick, 2006). The carbohydrate feedstock is initially shredded to appropriate particle
size (ca 0.5 to 1 cm) to ensure efficient hydrolysis and optimum yields.
Figure 1-6 Continuous production of LA by the Biofine technology taken from (de Souza et al.,
2014).
Then the shredded feedstock is mixed with dilute sulfuric acid (1.5-3%) and the slurry is supplied
continuously to a plug flow reactor (1st reactor, preferable smaller diameter) which is operated a
temperature of 210-220 °C, a pressure of 25 bar and a residence time of only 12 s. The reason of
this short contact time is to ensure optimum production of soluble intermediates (e.g. HMF) by the
acid hydrolysis of the carbohydrate polysaccharides. This initial hydrolysis product which is
continuously removed and fed to a continuously stirred tank reactor (2nd reactor, larger diameter)
operated at less severe condition (190-200 °C, 14 bar) but with a longer residence time of 20 min.
The reaction conditions in the second reactor are adjusted to remove furfural and other volatile
17
products while the tarry mixture of LA and residues are passed to a gravity separator. After passing
the dehydration unit, solid byproducts are removed from the LA solution in a filter-press unit and
collected as combustible wastes. Then the crude 75% LA product can be purified up to a purity of
98%. This commercial process claims to achieve LA yields of 70-80% of the theoretical maximum
from cellulosic feedstock in its two-reactor system by the conversion of approximately 50% hexose
sugars to LA, with 20% being converted to formic acid and 30% to tars (Fitzpatrick, 1997; Hayes
et al., 2006).
1.6.4 Mechanistic studies of LA production
The acid catalyzed degradation of hexoses into LA has been extensively studied. However, only a
limited amount of information is available on the underlying reaction mechanism. The aqueous
phase production of LA from hexoses involves isomerization, dehydration, fragmentation,
reversion, and condensation steps. The available information implies that hexose sugars initially
dehydrate to form the intermediate product HMF, which is subsequently hydrated to give the final
product LA. Two schools of thought were proposed with regard to the HMF formation from C6
carbohydrate in literature (Scheme 1-1). One pathway postulates that the isomerization of glucose
into fructose is the primary reaction pathway together with a small amount of mannose (Choudhary
et al., 2013; Moliner et al., 2010). Then fructose is converted to HMF by dehydration and
subsequently hydrolyzes to form levulinic and formic acids. The Other theory suggests that the
dehydration of glucose does not involve the isomerization of glucose to fructose as the first step
of the reaction. According to this theory, glucose can be converted into HMF through cyclization
of 3-deoxyglucosone (3-DG) intermediate formed from the open-ring form of glucose
(Chidambaram & Bell, 2010; Locas & Yaylayan, 2008). The relatively low conversion of glucose
to HMF is observed due to low propensity of glucose to exists in open ring form as well as many
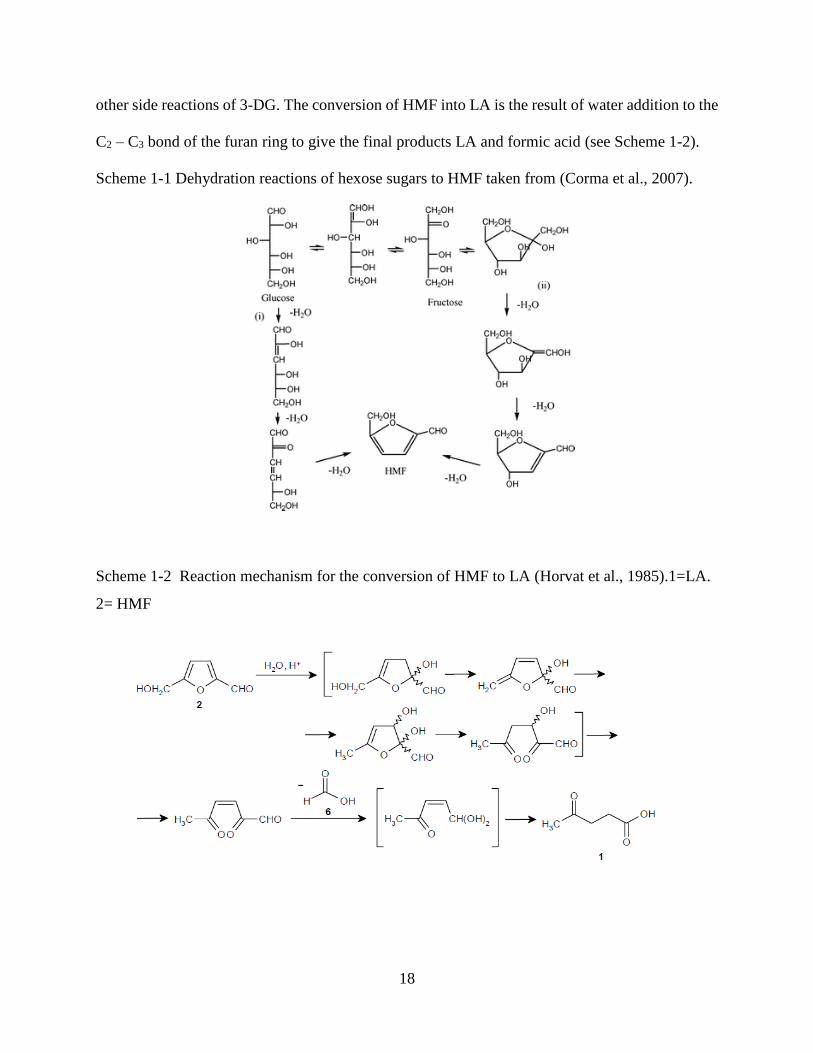
18
other side reactions of 3-DG. The conversion of HMF into LA is the result of water addition to the
C2 – C3 bond of the furan ring to give the final products LA and formic acid (see Scheme 1-2).
Scheme 1-1 Dehydration reactions of hexose sugars to HMF taken from (Corma et al., 2007).
Scheme 1-2 Reaction mechanism for the conversion of HMF to LA (Horvat et al., 1985).1=LA.
2= HMF
19
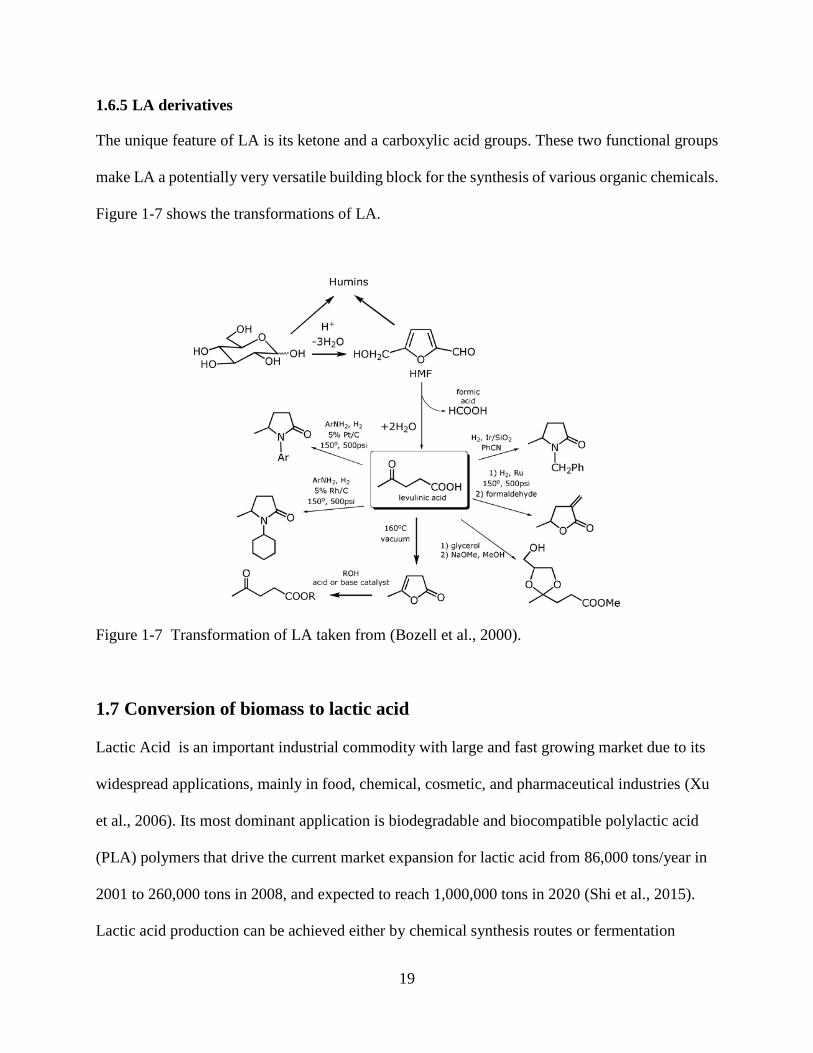
1.6.5 LA derivatives
The unique feature of LA is its ketone and a carboxylic acid groups. These two functional groups
make LA a potentially very versatile building block for the synthesis of various organic chemicals.
Figure 1-7 shows the transformations of LA.
Figure 1-7 Transformation of LA taken from (Bozell et al., 2000).
1.7 Conversion of biomass to lactic acid
Lactic Acid is an important industrial commodity with large and fast growing market due to its
widespread applications, mainly in food, chemical, cosmetic, and pharmaceutical industries (Xu
et al., 2006). Its most dominant application is biodegradable and biocompatible polylactic acid
(PLA) polymers that drive the current market expansion for lactic acid from 86,000 tons/year in
2001 to 260,000 tons in 2008, and expected to reach 1,000,000 tons in 2020 (Shi et al., 2015).
Lactic acid production can be achieved either by chemical synthesis routes or fermentation
20
routes (Abdel-Rahman et al., 2013). Currently, most lactic acid is produced by microbial
fermentation of carbohydrates due to low temperature, low energy consumption, and high
product specificity as it produces a desired stereoisomer, optically pure L-(+)- or D-(−)-lactic
acid when the appropriate microorganism is selected as the lactic acid producer (John et al.,
2007). The fermentative production cost of lactic acid is dependent on many factors such as the
nutrients, nitrogen sources, downstream recovery and purification process, and raw material cost
(Garde et al., 2002; Parajo et al., 1997; Rhee et al., 2016; van der Pol et al., 2016). Most of the
fermentation relies on starch-derived glucose or sucrose as feedstock (Shi et al., 2015) and the
main obstacle for the fermentative production of lactic acid is the high cost of feedstocks (Abdel-
Rahman et al., 2013). Therefore, lignocellulosic feedstocks are promising for lactic acid
production. However, the biochemical conversion of lignocellulosic feedstock requires several
processing steps to convert structural carbohydrates to monomeric sugars, e.g., glucose, xylose,
arabinose, and mannose. These monomeric sugars can be fermented to lactic acid through
different types of microorganisms (Abdel-Rahman et al., 2013).
Simultaneous saccharification and fermentation (SSF) has been considered as an efficient
bioconversion strategy in lactic acid production due to reduced reactor volume, rapid processing
time, less enzyme loading, reduced feedback inhibition, enhanced rate of hydrolysis, and
increased productivity and higher lactic acid yields (Abdel-Rahman et al., 2011; Sun & Cheng,
2002; Tsai & Moon, 1998). In order to maximize yield and productivity, a large number of
studies have investigated lactic acid fermentation by Lactobacillus (LAB) from lignocellulosic
feedstocks in the field of microbial technology (Abdel-Rahman et al., 2011; Bustos et al., 2005;
Monteagudo et al., 1997; Zhu et al., 2007). Under anaerobic conditions, Lactobacillus pentosus
produce lactic acid by metabolizing hexose (glucose) via Embden–Meryerhof–Parnas (EMP)
21
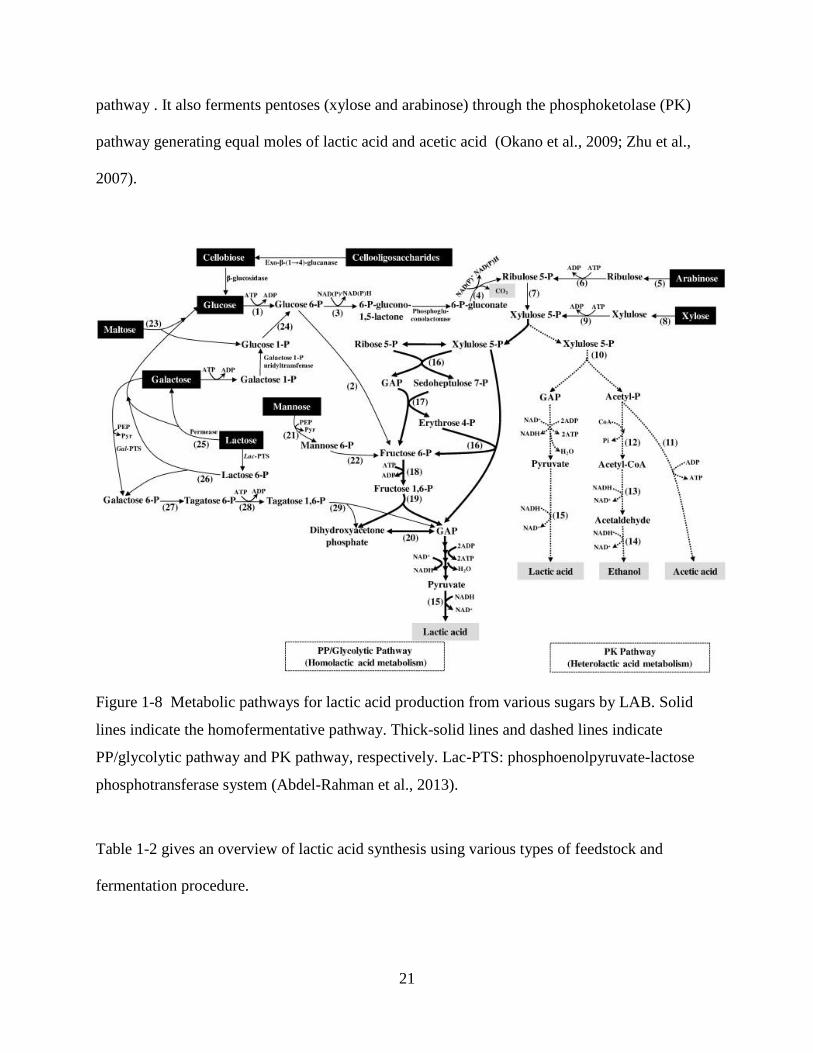
pathway . It also ferments pentoses (xylose and arabinose) through the phosphoketolase (PK)
pathway generating equal moles of lactic acid and acetic acid (Okano et al., 2009; Zhu et al.,
2007).
Figure 1-8 Metabolic pathways for lactic acid production from various sugars by LAB. Solid
lines indicate the homofermentative pathway. Thick-solid lines and dashed lines indicate
PP/glycolytic pathway and PK pathway, respectively. Lac-PTS: phosphoenolpyruvate-lactose
phosphotransferase system (Abdel-Rahman et al., 2013).
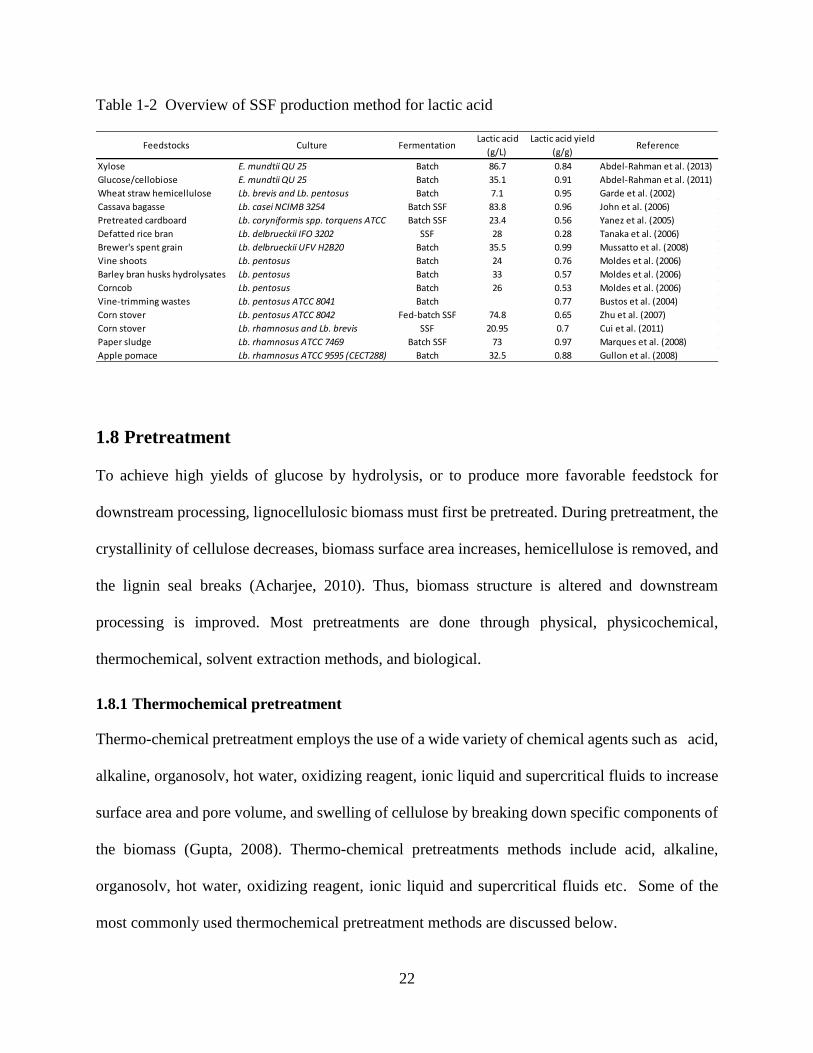
Table 1-2 gives an overview of lactic acid synthesis using various types of feedstock and
fermentation procedure.
22
Table 1-2 Overview of SSF production method for lactic acid
1.8 Pretreatment
To achieve high yields of glucose by hydrolysis, or to produce more favorable feedstock for
downstream processing, lignocellulosic biomass must first be pretreated. During pretreatment, the
crystallinity of cellulose decreases, biomass surface area increases, hemicellulose is removed, and
the lignin seal breaks (Acharjee, 2010). Thus, biomass structure is altered and downstream
processing is improved. Most pretreatments are done through physical, physicochemical,
thermochemical, solvent extraction methods, and biological.
1.8.1 Thermochemical pretreatment
Thermo-chemical pretreatment employs the use of a wide variety of chemical agents such as acid,
alkaline, organosolv, hot water, oxidizing reagent, ionic liquid and supercritical fluids to increase
surface area and pore volume, and swelling of cellulose by breaking down specific components of
the biomass (Gupta, 2008). Thermo-chemical pretreatments methods include acid, alkaline,
organosolv, hot water, oxidizing reagent, ionic liquid and supercritical fluids etc. Some of the
most commonly used thermochemical pretreatment methods are discussed below.
Feedstocks Culture Fermentation Lactic acid
(g/L)
Lactic acid yield
(g/g)Reference
Xylose E. mundtii QU 25 Batch 86.7 0.84 Abdel-Rahman et al. (2013)
Glucose/cellobiose E. mundtii QU 25 Batch 35.1 0.91 Abdel-Rahman et al. (2011)
Wheat straw hemicellulose Lb. brevis and Lb. pentosus Batch 7.1 0.95 Garde et al. (2002)
Cassava bagasse Lb. casei NCIMB 3254 Batch SSF 83.8 0.96 John et al. (2006)
Pretreated cardboard Lb. coryniformis spp. torquens ATCC 25600Batch SSF 23.4 0.56 Yanez et al. (2005)
Defatted rice bran Lb. delbrueckii IFO 3202 SSF 28 0.28 Tanaka et al. (2006)
Brewer's spent grain Lb. delbrueckii UFV H2B20 Batch 35.5 0.99 Mussatto et al. (2008)
Vine shoots Lb. pentosus Batch 24 0.76 Moldes et al. (2006)
Barley bran husks hydrolysates Lb. pentosus Batch 33 0.57 Moldes et al. (2006)
Corncob Lb. pentosus Batch 26 0.53 Moldes et al. (2006)
Vine-trimming wastes Lb. pentosus ATCC 8041 Batch 0.77 Bustos et al. (2004)
Corn stover Lb. pentosus ATCC 8042 Fed-batch SSF 74.8 0.65 Zhu et al. (2007)
Corn stover Lb. rhamnosus and Lb. brevis SSF 20.95 0.7 Cui et al. (2011)
Paper sludge Lb. rhamnosus ATCC 7469 Batch SSF 73 0.97 Marques et al. (2008)
Apple pomace Lb. rhamnosus ATCC 9595 (CECT288) Batch 32.5 0.88 Gullon et al. (2008)
23
1.8.2 Acidic pretreatment
Different acidic reagents such as dilute sulfuric acid dilute nitric acid dilute hydrochloric acid, and
dilute phosphoric acid have been used for the pretreatment process for a long time (Pallapolu,
2014). The method fractionates majority of hemicelluloses (75-90%). Two approaches for dilute
acid pretreatment are followed. In one approach, high temperature (more than 160 °C) in a
continuous flow reactor with low solid loading is used; while in another approach, low temperature
batch process is used with high solids loading. Among the dilute acids, dilute sulfuric acid (0.5-
1.5%) above 160 °C was found to be most suitable for the industrial application due to the dilute
acid pretreatment process solubilizes the hemicellulose component of biomass into liquid stream,
while leaving most of the cellulose fraction intact in the solid part (Gupta, 2008; Kothari, 2012).
The major disadvantage of the process is the removal of acids or neutralization which yields a
large amount of gypsum before next step of enzymatic hydrolysis. The disadvantages of the dilute
acid process include high investment in equipment associated with acid corrosion, and high
inhibitor content which makes fermentation very difficult.
1.8.3 Alkaline pretreatment
Among the various thermochemical pretreatments, alkali pretreatment is most widely used to
enhance enzymatic hydrolysis of lignocellulose. During alkaline pretreatment, the lignin is
degraded predominantly by cleavage of lignin-hemicellulose bonds, and delignification brings
about changes in the structure of cellulose, whose DP and crystallinity decrease and accessible
surface area increases, thus making the biomass more susceptible to enzymatic hydrolysis (Gupta,
2008; Kothari, 2012; Pallapolu, 2014; Kang, 2011). The main reagents used for alkali pretreatment
are sodium hydroxide, ammonia, ethylene diamine and calcium hydroxide.
24
1.8.4 Hydrothermal pretreatment
In this pretreatment, biomass is treated in hot compressed water, resulting in three products,
including gases, aqueous chemicals, and a solid fuel (Acharjee, 2010). The temperature is in the
range of 200–260°C, and the pressures are up at least the water saturation pressure. It is considered
as an environmentally benign, nontoxic and inexpensive reagent.
1.8.5 Oxidizing reagents pretreatment
Lignin is believed to be a major hindrance as it surrounds carbohydrates (cellulose and
hemicellulose) making it highly recalcitrant especially for bioconversion. Therefore,
delignification is an important step for successful liquid phase processing of carbohydrate feeds.
Oxidative delignification has primarily been applied for pulping and bleaching. Its application in
biomass pretreatment is relatively new. Oxidation increases the positive valance state of a
molecule by removal of one or more electrons from an atom or ion. Oxidizing agents, including
ozone, hydrogen peroxide, hypochlorite, chlorine dioxide, sodium chloride, and peracetic acid
have been used for the chemical treatment of biomass (Chapman, 2003). A recent laboratory
investigation by Siqueira et al. (2013) explored use of an aqueous solution of acetic acid and
sodium chlorite for delignification of biomass and reported that more than 90% delignification was
achieved for corn stover and other feedstocks. Yu et al. (2011) applied alkaline pretreatment
followed by sodium chlorite or ozone delignification for softwood and hardwood. They observed
both delignification methods improved enzymatic hydrolysis especially for softwood, while
pretreatment alone was effective for hardwood (da Costa Correia et al., 2013; Yu et al., 2011).They
reported 87% enzymatic hydrolysis yield after treating cashew apple bagasse with alkaline
hydrogen peroxide. A recent laboratory investigation by Sannigrahi et al. (2012) explored the use
of an aqueous solution of ethanol and chlorine dioxide mixture for ethanol production from sweet
25
gum. They achieved 87% ethanol yield with sweet gum treated using 60% ethanol solution with
1.1% chlorine dioxide, liquid/solid ratio 7, 75 °C, 3 hours.
In the process of chlorine dioxide based bleaching of pulp, most of the chlorine dioxide is reduced
to chloride ion (Cl-). Rest of them is either reduced to organically linked chlorine or oxidized to
chlorate (Kolar et al., 1983). Initially, chlorine dioxide reacts with phenolic and non-phenolic
compounds through one-electron transfer reaction to form chlorite ion and a radical phenolic or
non-phenolic intermediate. Then the radical intermediate is further oxidized by chlorine dioxide
that results in the formation of variety of oxidation products and hypochlorous acid (HOCl). The
hypochlorous acid and its equilibrium partner, chlorine, are the initiators of several side reactions
along with chlorite. These side reactions eventually generate different type of free radicals which
cause chlorate formation, chlorite oxidation and finally produce chloride ion and organic chlorine
by chlorination (Svenson et al., 2006). As evidenced in literature, most of the pretreatment studies
were done using sodium chlorite under acidic conditions.
1.9 Enzymatic hydrolysis
The main advantages of enzymatic degradation of lignocellulose into fermentable sugars are
higher sugar yields, lower energy input and lower level of inhibitory products (Guan, 2016). Due
to complex nature of heterogeneous system, enzymatic hydrolysis is known to be affected by both
enzyme and substrate related factors. The factors that affect the enzymatic hydrolysis of
lignocellulosic biomass include substrate characteristics such as chemical composition, porosity,
pore size, degree of crystallinity and polymerization, accessible surface area, surface charge, etc.
and enzyme-related factors including specific activity, nonspecific binding, end-products
inhibition, reaction conditions (pH, temperature and speed), etc.
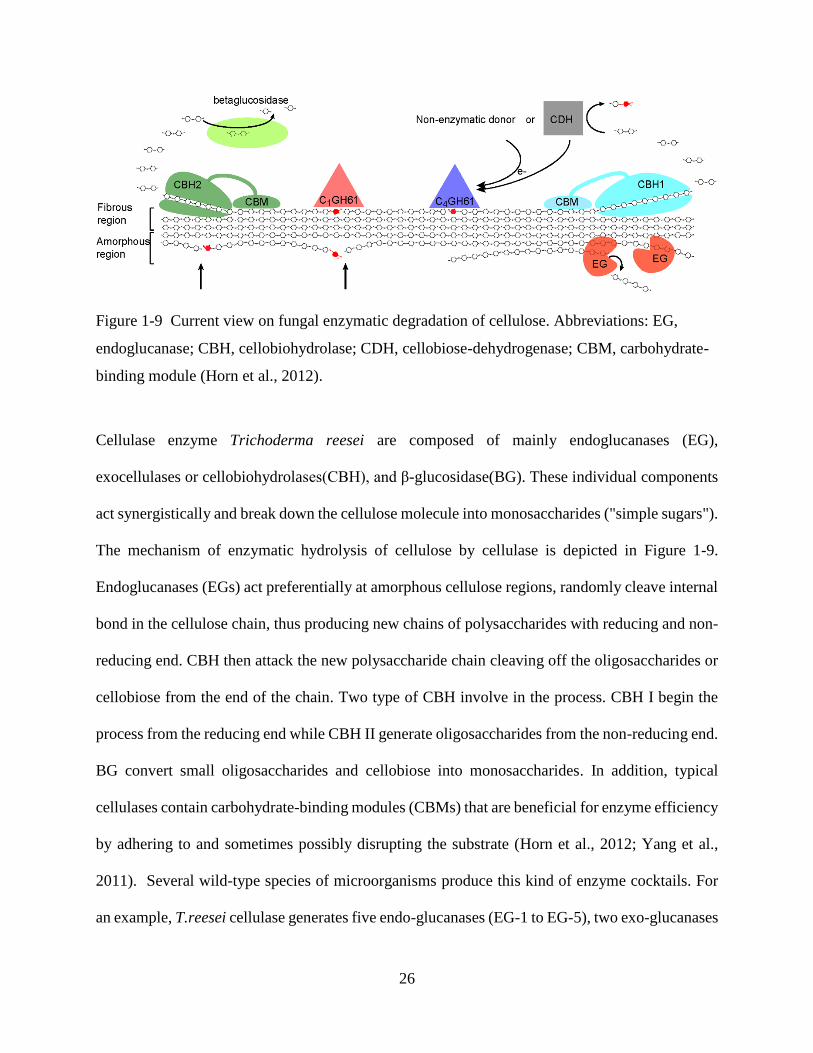
26
Figure 1-9 Current view on fungal enzymatic degradation of cellulose. Abbreviations: EG,
endoglucanase; CBH, cellobiohydrolase; CDH, cellobiose-dehydrogenase; CBM, carbohydrate-
binding module (Horn et al., 2012).
Cellulase enzyme Trichoderma reesei are composed of mainly endoglucanases (EG),
exocellulases or cellobiohydrolases(CBH), and β-glucosidase(BG). These individual components
act synergistically and break down the cellulose molecule into monosaccharides ("simple sugars").
The mechanism of enzymatic hydrolysis of cellulose by cellulase is depicted in Figure 1-9.
Endoglucanases (EGs) act preferentially at amorphous cellulose regions, randomly cleave internal
bond in the cellulose chain, thus producing new chains of polysaccharides with reducing and non-
reducing end. CBH then attack the new polysaccharide chain cleaving off the oligosaccharides or
cellobiose from the end of the chain. Two type of CBH involve in the process. CBH I begin the
process from the reducing end while CBH II generate oligosaccharides from the non-reducing end.
BG convert small oligosaccharides and cellobiose into monosaccharides. In addition, typical
cellulases contain carbohydrate-binding modules (CBMs) that are beneficial for enzyme efficiency
by adhering to and sometimes possibly disrupting the substrate (Horn et al., 2012; Yang et al.,
2011). Several wild-type species of microorganisms produce this kind of enzyme cocktails. For
an example, T.reesei cellulase generates five endo-glucanases (EG-1 to EG-5), two exo-glucanases
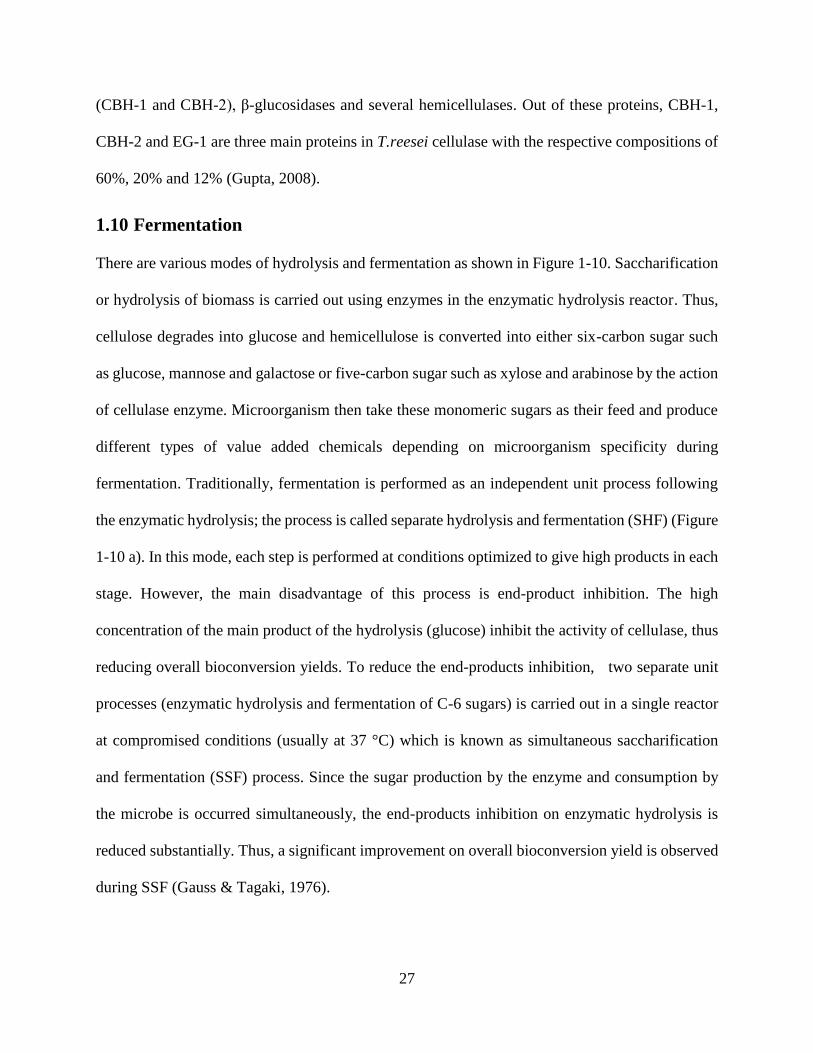
27
(CBH-1 and CBH-2), β-glucosidases and several hemicellulases. Out of these proteins, CBH-1,
CBH-2 and EG-1 are three main proteins in T.reesei cellulase with the respective compositions of
60%, 20% and 12% (Gupta, 2008).
1.10 Fermentation
There are various modes of hydrolysis and fermentation as shown in Figure 1-10. Saccharification
or hydrolysis of biomass is carried out using enzymes in the enzymatic hydrolysis reactor. Thus,
cellulose degrades into glucose and hemicellulose is converted into either six-carbon sugar such
as glucose, mannose and galactose or five-carbon sugar such as xylose and arabinose by the action
of cellulase enzyme. Microorganism then take these monomeric sugars as their feed and produce
different types of value added chemicals depending on microorganism specificity during
fermentation. Traditionally, fermentation is performed as an independent unit process following
the enzymatic hydrolysis; the process is called separate hydrolysis and fermentation (SHF) (Figure
1-10 a). In this mode, each step is performed at conditions optimized to give high products in each
stage. However, the main disadvantage of this process is end-product inhibition. The high
concentration of the main product of the hydrolysis (glucose) inhibit the activity of cellulase, thus
reducing overall bioconversion yields. To reduce the end-products inhibition, two separate unit
processes (enzymatic hydrolysis and fermentation of C-6 sugars) is carried out in a single reactor
at compromised conditions (usually at 37 °C) which is known as simultaneous saccharification
and fermentation (SSF) process. Since the sugar production by the enzyme and consumption by
the microbe is occurred simultaneously, the end-products inhibition on enzymatic hydrolysis is
reduced substantially. Thus, a significant improvement on overall bioconversion yield is observed
during SSF (Gauss & Tagaki, 1976).
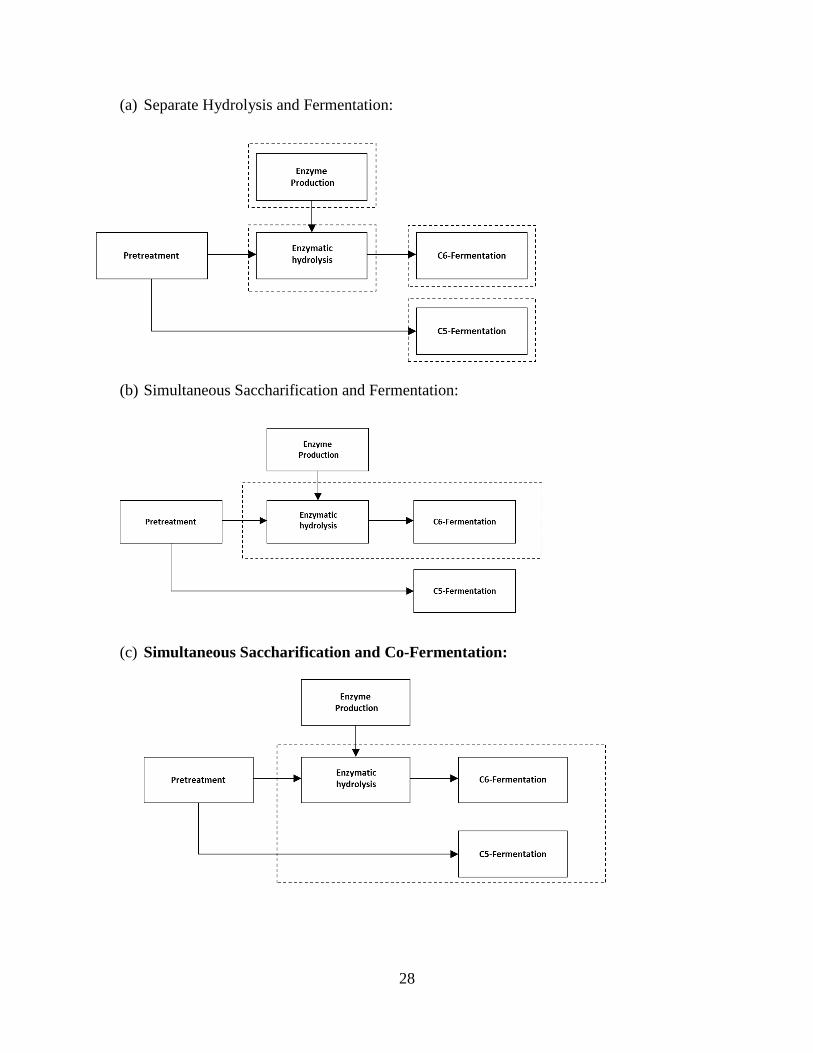
28
(a) Separate Hydrolysis and Fermentation:
(b) Simultaneous Saccharification and Fermentation:
(c) Simultaneous Saccharification and Co-Fermentation:
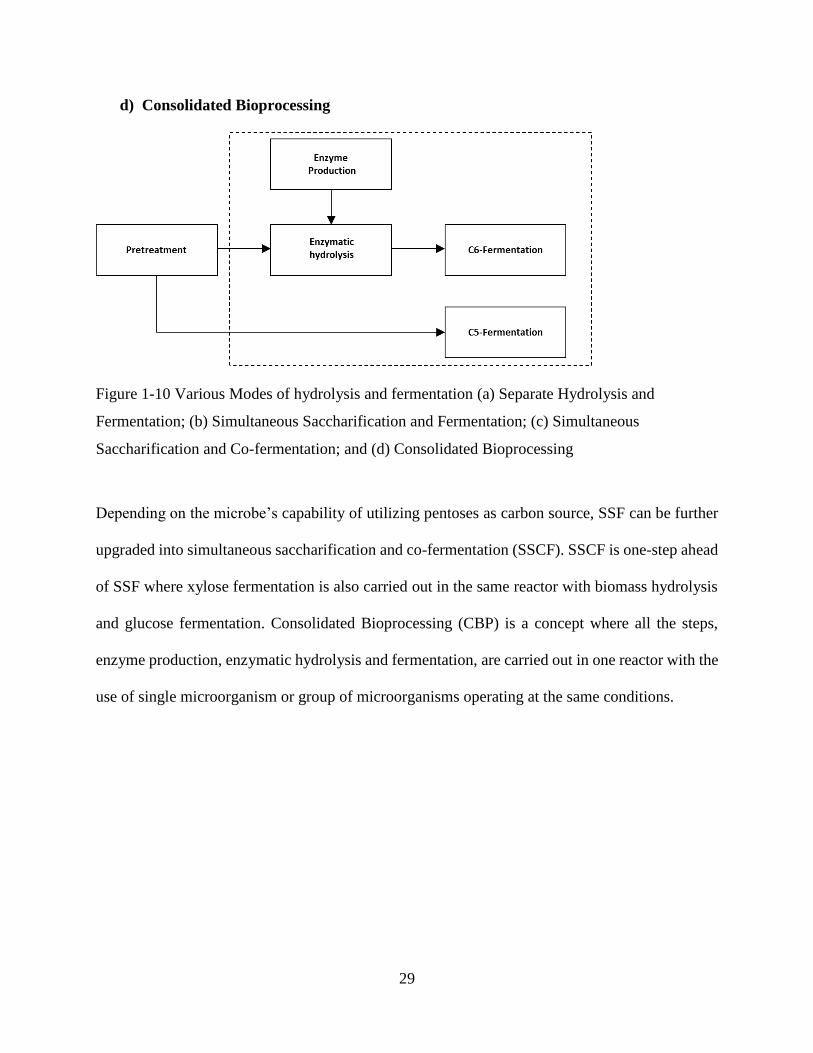
29
d) Consolidated Bioprocessing
Figure 1-10 Various Modes of hydrolysis and fermentation (a) Separate Hydrolysis and
Fermentation; (b) Simultaneous Saccharification and Fermentation; (c) Simultaneous
Saccharification and Co-fermentation; and (d) Consolidated Bioprocessing
Depending on the microbe’s capability of utilizing pentoses as carbon source, SSF can be further
upgraded into simultaneous saccharification and co-fermentation (SSCF). SSCF is one-step ahead
of SSF where xylose fermentation is also carried out in the same reactor with biomass hydrolysis
and glucose fermentation. Consolidated Bioprocessing (CBP) is a concept where all the steps,
enzyme production, enzymatic hydrolysis and fermentation, are carried out in one reactor with the
use of single microorganism or group of microorganisms operating at the same conditions.
30
1.11 Research overview
The main objective of this study is to develop an efficient thermochemical strategy for the
production of LA and a biochemical strategy for lactic acid by liquid-phase processing of biomass-
derived carbohydrates.
Chapter 2 provides the details of the kinetic aspects of homogeneous acid catalyzed LA production
from glucose in aqueous media. Chapter 3 describes the synthesis of LA from glucose using dual
solid-acid catalysts. Chapter 4 demonstrates how cellulosic feedstock mixture can be converted
into lactic acid efficiently. Chapter 5 establishes chlorine dioxide as a secondary pretreatment
reagent in enhancement of enzymatic hydrolysis. Finally, Chapter 6 summaries the main
conclusions drawn from this study and the direction of future research based on the current study.
31
Chapter 2
Sulfuric acid catalyzed conversion of glucose to levulinic acid in
aqueous media: kinetics and reaction engineering to maximize
yields.
2.1 Abstract
Levulinic acid (LA) is considered as a highly versatile chemical having the potential to be building-
block for the synthesis of various chemicals from biomass. In this study, we have developed a
kinetic model of homogeneous acid (H2SO4) catalyzed hydrolysis of glucose to LA in aqueous
media. The model shows good agreement with experimental data using a batch reactor over the
following range of conditions: 150-200 °C, sulfuric acid concentrations of 1-5 (wt. %) and initial
glucose concentrations of 5-15 (wt. %). Reaction temperature and acid concentration were found
to be the main factors affecting LA yield. The effect of these parameters were further investigated
in detail, from which kinetics models and associated kinetics constant were determined. The model
suggests that high temperature and shorter reaction times favor the yield of hydroxymethylfurfural
(HMF), an intermediate in the process. It also predicts low temperature and longer reaction times
favor LA yield from HMF. We also developed an optimum temperature profile for the LA
production from glucose.
32
2.2 Introduction
The production of biomass derived fuels and chemicals have been the central focus of last couple
of years to meet energy requirement and to make basic chemicals (Yan et al., 2009; Yu et al.,
2008a). As mentioned before, a list of top twelve chemicals was obtained by evaluating the
potential markets of the building blocks and their derivatives and the complexity of the synthetic
pathways ( Girisuta et al., 2007b; Werpy and Petersen, 2004). Levulinic acid (LA) is one of the
top-twelve building blocks which can be produced from lignocellulosic biomass using an acid
catalyst (Girisuta et al., 2007b). LA (gamma-ketovaleric acid), is a short-chain fatty acid, provide
potentially important platforms for production of liquid fuels and chemicals(Shen & Wyman,
2012) . The unique feature of LA is its ketone and a carboxylic acid groups. These two functional
groups make it a potentially very versatile building block for the synthesis of various organic
chemicals (Girisuta et al., 2007b)
The most common method to produce LA is the acid catalyzed hydrolysis of hexose sugars or
carbohydrates. Traditionally, homogeneous catalysts such as HCl and H2SO4 have been used to
synthesis LA from glucose (Girisuta et al., 2006b), cellulose, (Girisuta et al., 2007b), normal corn
starch (Cha & Hanna, 2002), water hyacinth plant (Girisuta et al., 2008), sugarcane bagasse
(Girisuta et al., 2013) and Pine (Rivas et al., 2013). Developed by Biofine incorporation, one of
the commercial process claims to achieve LA yields of 70-80% of the theoretical maximum from
cellulosic feed stock in its two reactor system by the conversion of approximately 50% hexose
sugars to LA, with 20% being converted to formic acid and 30% to tars (Fitzpatrick, 1997; Hayes
et al., 2006) using wood as a raw material and H2SO4 as an acid catalyst.
Numerous kinetic studies on the decomposition of sugars/carbohydrate to produce LA and formic
acid have been reported (Girisuta et al., 2006b). Nevertheless, a few kinetics studies incorporated
33
undesired byproduct formation steps to enhance accuracy of their models(Girisuta et al., 2006b;
Weingarten et al., 2012; Shen & Wyman, 2012). A direct comparison of the kinetics parameters
reported by researchers is rather meaningless as these parameters vary substantially depending on
reaction conditions, substrates, and acid catalyst. However, it is noteworthy that there should be a
consensus agreement to maximize the selectivity and yield of HMF and LA among the studies.
However, a wide discrepancy in the optimum parameters selection to maximize yield and
selectivity are observed among these studies. For example, some authors suggest that low
temperature and long residence time are essential to maximize the HMF yield (Chang et al., 2006;
Girisuta et al., 2006a).Others claim that high temperature and short residence time are essential to
maximize the HMF yield (Weingarten et al., 2012). In the same study, Weingarten et al. (2012)
found glucose to HMF demonstrate a near first order dependence to the acid concentration whereas
glucose to humins exhibit a near third order dependence. This indicates that higher acid
concentrations will have a negative effect on the selectivity of glucose to HMF formation. On the
contrary, some authors claim that higher acid concentrations will have a positive effect on the
selectivity of glucose to HMF formation (Chang et al., 2006). A different conclusion was deduced
by Girisuta et al. (2006a) as they found the selectivity of this reaction is independent on the acid
concentration. Similarly, some others viewed low temperature and long residence time is favorable
for the production of LA yield from HMF whereas the selectivity of the reaction is independent on
the acid concentration ( Weingarten et al., 2012 ; Shen & Wyman, 2012). Conversely, Girisuta et
al., (2006b) suggest, reaction should be carried out at high temperatures to achieve higher rate
since the selectivity of the reaction is independent on the temperature and at high acid
concentrations as higher acid concentrations will have a positive effect on the selectivity of the
reaction. These discrepancy to urge a detailed understanding of acid catalyzed reactions involved
34
in the production of LA which will provide a new insight into interplays among the various
reaction steps that can help for the successful design of an optimal hydrolysis process (Girisuta et
al., 2006b; Weingarten et al., 2012; Shen & Wyman, 2012). The objective of this study is to
develop a kinetic model for the acid catalyzed glucose decomposition to LA by fitting kinetic data
collected in a batch reactor system and optimize the process using obtained kinetic parameters.
Here we report, the kinetics of acid catalyzed glucose decomposition to LA by fitting kinetic data
collected in a batch reactor system. A series of experiments were carried out at 150, 175 and 200
°C using sulfuric acid concentrations of 1, 3 and 5 (wt. %) with initial glucose concentrations of
5,10 and 15 (wt. %). The concentrations of glucose, HMF and LA were determined at different
reaction times to develop the kinetic model. We also develop optimum temperature profile for the
aqueous phase production of LA from glucose by homogeneous acid catalyst.
2.3 Materials and Methods
2.3.1 Chemicals and reagents
Hydroxemethylfurfural (HMF) was obtained from Fisher Scientific Inc. (Cincinnati, Ohio).
Glucose, sulfuric acid, formic acid and LA were purchased from VWR (Radnor, PA). All
chemicals used in this study were of analytical grade and used without purification.
2.3.2 Experimental procedure
The reactions were carried out in tubular acid resistant alloy-400 Monel reactors, which are
composed of 63% nickel and 28-34% copper with outer diameter (OD) 0.375 inch, inside diameter
(ID) 0.305 inch and length 4 inch. Approximately 3 ml of reaction mixture was poured into every
reactor and then the sealed reactors were placed in a constant-temperature oven that was initially
set to 250 °C to reduce the heating time. The temperature was monitored with a J- type
35
thermocouple probe. To track the temperature profile, a reactor (filled with water) was connected
with a thermocouple, which is attached to a computer to record the real-time data. This reactor
with all others reactors (containing reaction mixture) were simultaneously placed in the oven. The
inside temperature of the reactors containing reactor mixture is assumed to be same as the reactor
containing water equipped with thermocouple. When the internal reactor temperature approached
to near of target temperature, oven temperature was then reset to desired values and it took 4-7
minutes to reach aimed value depending on required temperature. At the point, when the
temperature reached within 5 °C of the target value of desired temperature, time counting was
started i.e. this time being defined as time zero (t=0). At different reaction time, the reactor were
removed from the oven and submerged in ice water to cool it to room temperature as soon as
possible to stop the reaction. After the reactor reached room temperature, the reaction mixture was
taken out of the reactor and centrifuged. Then the particle-free solution was analyzed using high-
pressure liquid chromatography (HPLC).
2.3.3 Analytical method
The concentrations of liquid samples were determined using an HPLC system consisting
of a AcuFlow Series III pump (LabX, Midland, ON, Canada), Alcott 708 autosampler (LabX,
Midland, ON, Canada), a Bio-Rad HPX-87H column (Hercules, CA) , a refractive index detector
(Shodex, NY) and PeakSimple Chromatography Data Systems(Torrance, CA). The aqueous
solution of 0.005 M sulfuric acid was selected as mobile phase and the flow rate was set to 0.55
ml/min. The column was operated at 85 °C. The analysis for a sample was completed within 40
minutes.
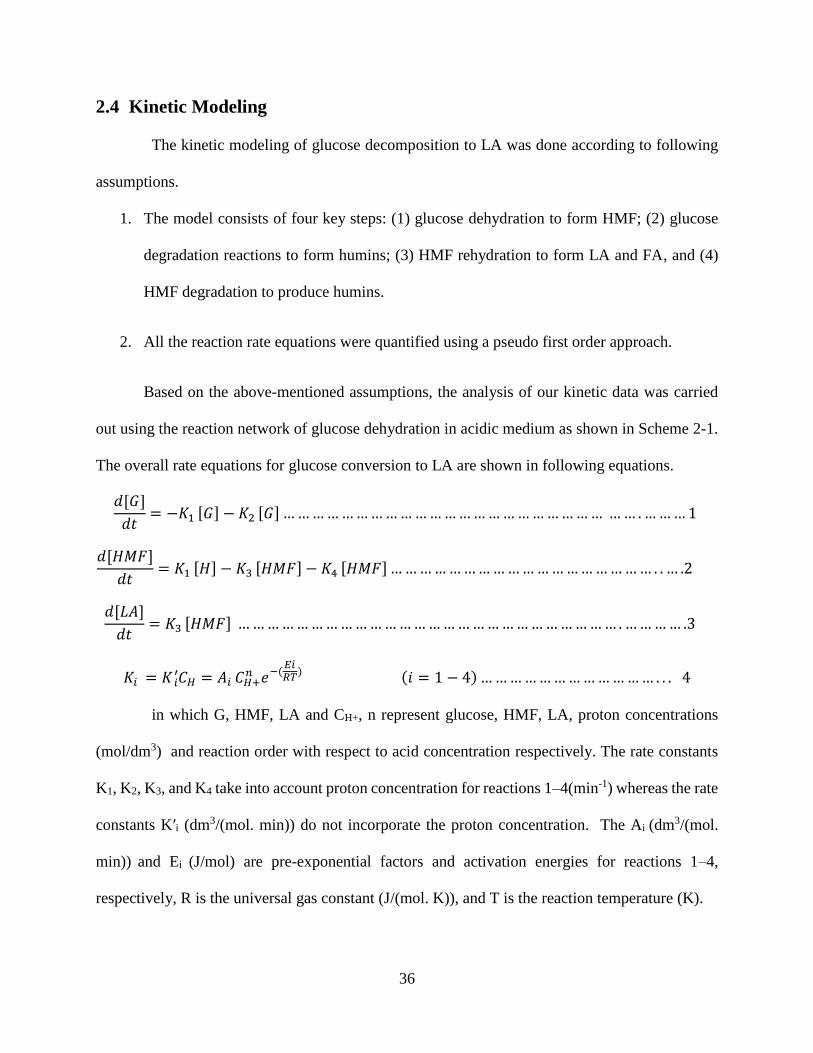
36
2.4 Kinetic Modeling
The kinetic modeling of glucose decomposition to LA was done according to following
assumptions.
1. The model consists of four key steps: (1) glucose dehydration to form HMF; (2) glucose
degradation reactions to form humins; (3) HMF rehydration to form LA and FA, and (4)
HMF degradation to produce humins.
2. All the reaction rate equations were quantified using a pseudo first order approach.
Based on the above-mentioned assumptions, the analysis of our kinetic data was carried
out using the reaction network of glucose dehydration in acidic medium as shown in Scheme 2-1.
The overall rate equations for glucose conversion to LA are shown in following equations.
𝑑[𝐺]
𝑑𝑡= −𝐾1 [𝐺] − 𝐾2 [𝐺] … … … … … … … … … … … … … … … … … … … … … … … … . … … … 1
𝑑[𝐻𝑀𝐹]
𝑑𝑡= 𝐾1 [𝐻] − 𝐾3 [𝐻𝑀𝐹] − 𝐾4 [𝐻𝑀𝐹] … … … … … … … … … … … … … … … … … … . . … .2
𝑑[𝐿𝐴]
𝑑𝑡= 𝐾3 [𝐻𝑀𝐹] … … … … … … … … … … … … … … … … … … … … … … … … … … . … … … … .3
𝐾𝑖 = 𝐾 𝐶𝑖′
𝐻 = 𝐴𝑖 𝐶𝐻+𝑛 𝑒−(
𝐸𝑖𝑅𝑇
) (𝑖 = 1 − 4) … … … … … … … … … … … … . . . 4
in which G, HMF, LA and CH+, n represent glucose, HMF, LA, proton concentrations
(mol/dm3) and reaction order with respect to acid concentration respectively. The rate constants
K1, K2, K3, and K4 take into account proton concentration for reactions 1–4(min-1) whereas the rate
constants K′i (dm3/(mol. min)) do not incorporate the proton concentration. The Ai (dm3/(mol.
min)) and Ei (J/mol) are pre-exponential factors and activation energies for reactions 1–4,
respectively, R is the universal gas constant (J/(mol. K)), and T is the reaction temperature (K).
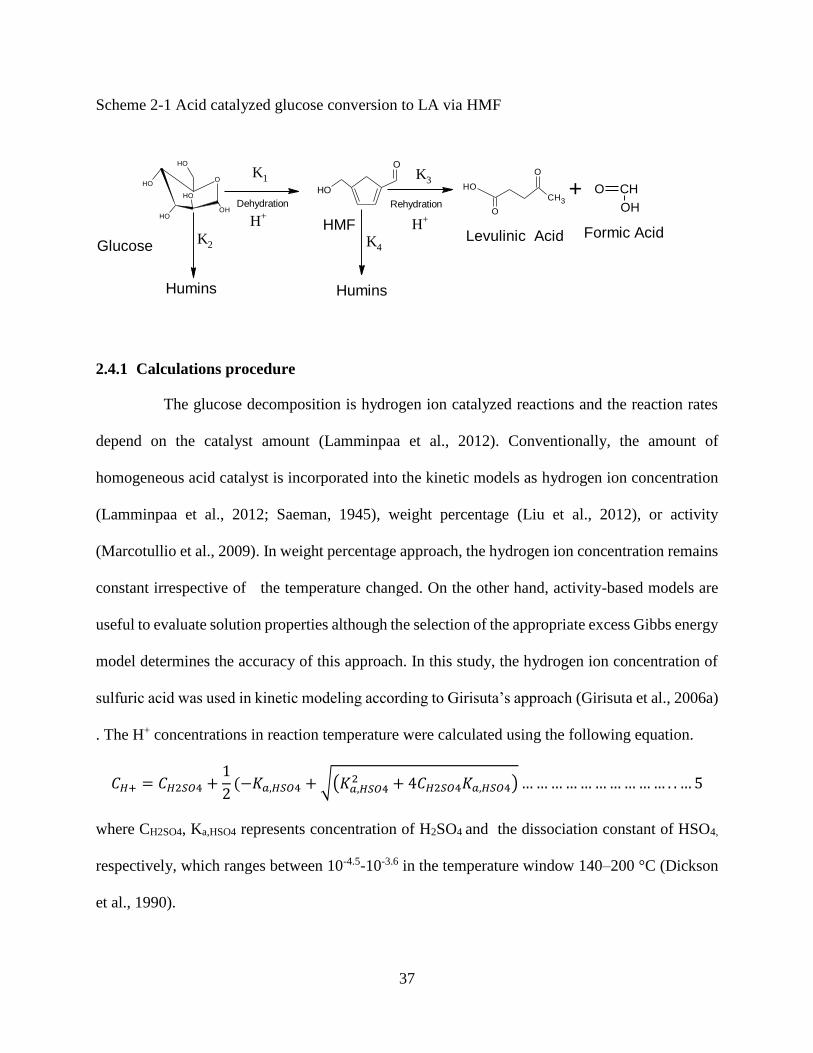
37
Scheme 2-1 Acid catalyzed glucose conversion to LA via HMF
2.4.1 Calculations procedure
The glucose decomposition is hydrogen ion catalyzed reactions and the reaction rates
depend on the catalyst amount (Lamminpaa et al., 2012). Conventionally, the amount of
homogeneous acid catalyst is incorporated into the kinetic models as hydrogen ion concentration
(Lamminpaa et al., 2012; Saeman, 1945), weight percentage (Liu et al., 2012), or activity
(Marcotullio et al., 2009). In weight percentage approach, the hydrogen ion concentration remains
constant irrespective of the temperature changed. On the other hand, activity-based models are
useful to evaluate solution properties although the selection of the appropriate excess Gibbs energy
model determines the accuracy of this approach. In this study, the hydrogen ion concentration of
sulfuric acid was used in kinetic modeling according to Girisuta’s approach (Girisuta et al., 2006a)
. The H+ concentrations in reaction temperature were calculated using the following equation.
𝐶𝐻+ = 𝐶𝐻2𝑆𝑂4 +1
2(−𝐾𝑎,𝐻𝑆𝑂4 + √(𝐾𝑎,𝐻𝑆𝑂4
2 + 4𝐶𝐻2𝑆𝑂4𝐾𝑎,𝐻𝑆𝑂4) … … … … … … … … … … . . … 5
where CH2SO4, Ka,HSO4 represents concentration of H2SO4 and the dissociation constant of HSO4,
respectively, which ranges between 10-4.5-10-3.6 in the temperature window 140–200 °C (Dickson
et al., 1990).
OH
OH
O
OH
OH
OH O
OH OH
O
O
CH3+
Humins Humins
H+
Glucose
HMFLevulinic Acid Formic Acid
Dehydration Rehydration
H+
K1 K3
K2 K4
O CH
OH
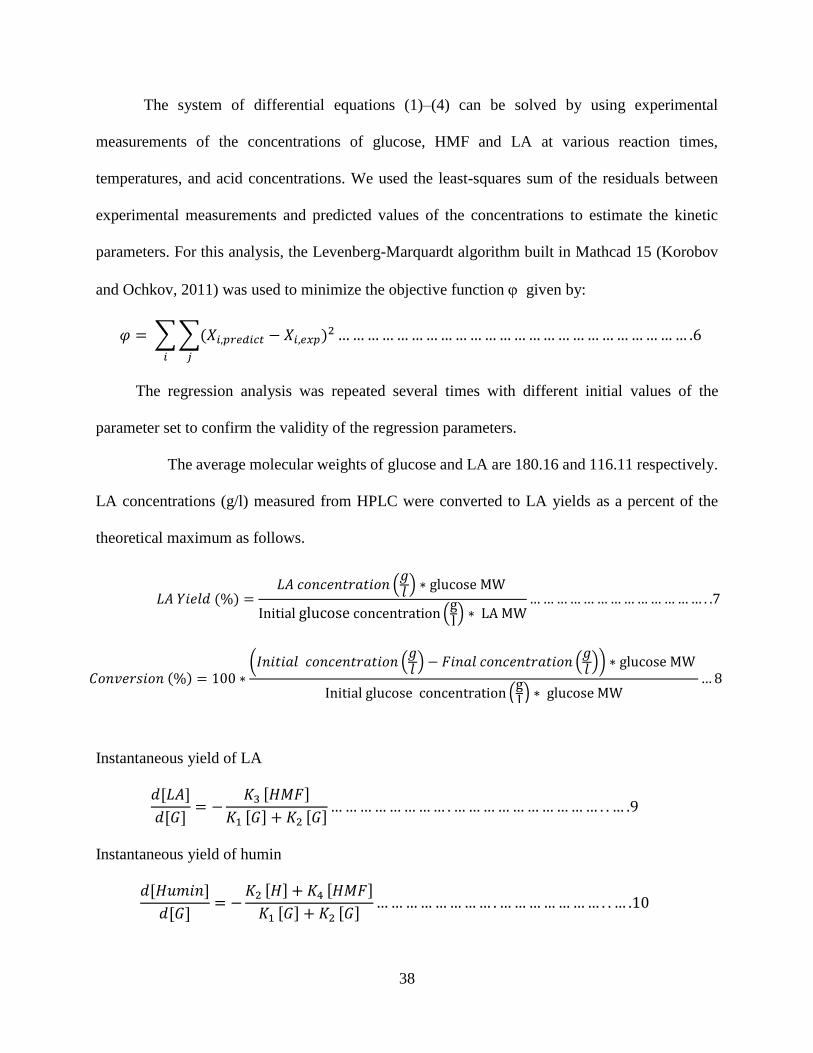
38
The system of differential equations (1)–(4) can be solved by using experimental
measurements of the concentrations of glucose, HMF and LA at various reaction times,
temperatures, and acid concentrations. We used the least-squares sum of the residuals between
experimental measurements and predicted values of the concentrations to estimate the kinetic
parameters. For this analysis, the Levenberg-Marquardt algorithm built in Mathcad 15 (Korobov
and Ochkov, 2011) was used to minimize the objective function given by:
𝜑 = ∑ ∑(𝑋𝑖,𝑝𝑟𝑒𝑑𝑖𝑐𝑡 − 𝑋𝑖,𝑒𝑥𝑝)2
𝑗𝑖
… … … … … … … … … … … … … … … … … … … … … … … … .6
The regression analysis was repeated several times with different initial values of the
parameter set to confirm the validity of the regression parameters.
The average molecular weights of glucose and LA are 180.16 and 116.11 respectively.
LA concentrations (g/l) measured from HPLC were converted to LA yields as a percent of the
theoretical maximum as follows.
Instantaneous yield of LA
𝑑[𝐿𝐴]
𝑑[𝐺]= −
𝐾3 [𝐻𝑀𝐹]
𝐾1 [𝐺] + 𝐾2 [𝐺]… … … … … … … … . … … … … … … … … … … . . … .9
Instantaneous yield of humin
𝑑[𝐻𝑢𝑚𝑖𝑛]
𝑑[𝐺]= −
𝐾2 [𝐻] + 𝐾4 [𝐻𝑀𝐹]
𝐾1 [𝐺] + 𝐾2 [𝐺]… … … … … … … … . … … … … … … … . . … .10
𝐿𝐴 𝑌𝑖𝑒𝑙𝑑 (%) =𝐿𝐴 𝑐𝑜𝑛𝑐𝑒𝑛𝑡𝑟𝑎𝑡𝑖𝑜𝑛 (
𝑔𝑙
) ∗ glucose MW
Initial glucose concentration (gl) ∗ LA MW
… … … … … … … … … … … … … . .7
𝐶𝑜𝑛𝑣𝑒𝑟𝑠𝑖𝑜𝑛 (%) = 100 ∗(𝐼𝑛𝑖𝑡𝑖𝑎𝑙 𝑐𝑜𝑛𝑐𝑒𝑛𝑡𝑟𝑎𝑡𝑖𝑜𝑛 (
𝑔𝑙
) − 𝐹𝑖𝑛𝑎𝑙 𝑐𝑜𝑛𝑐𝑒𝑛𝑡𝑟𝑎𝑡𝑖𝑜𝑛 (𝑔𝑙
)) ∗ glucose MW
Initial glucose concentration (gl) ∗ glucose MW
… 8
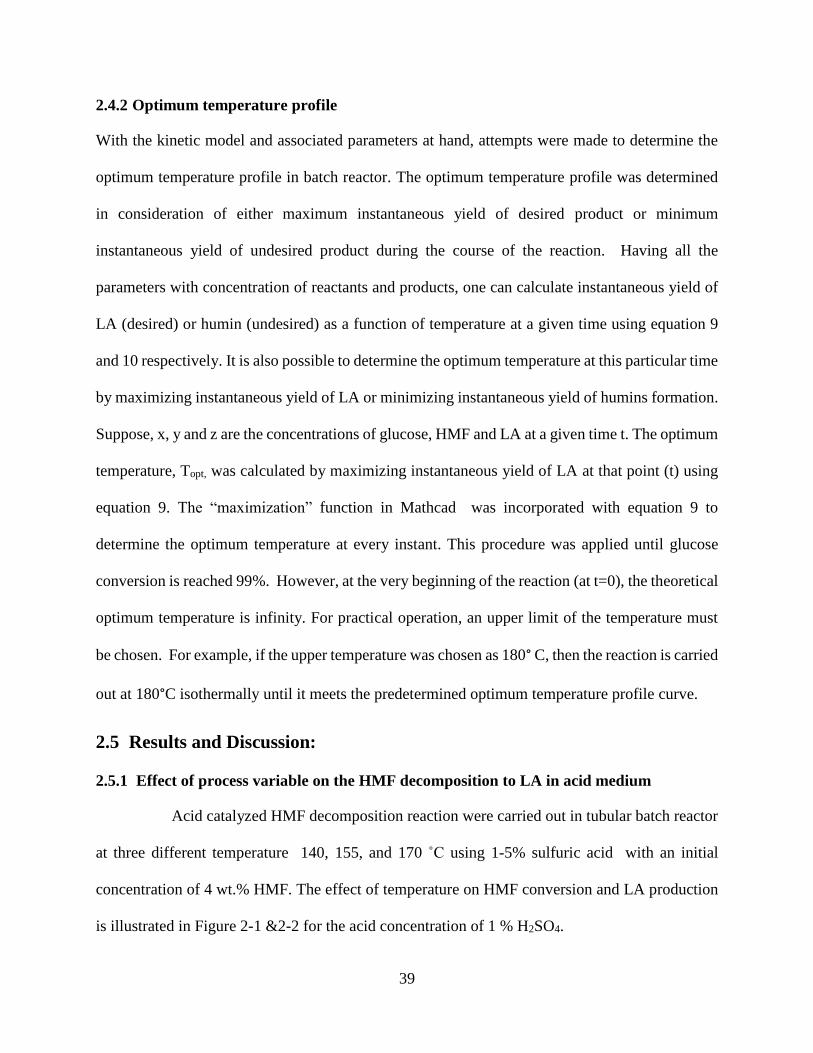
39
2.4.2 Optimum temperature profile
With the kinetic model and associated parameters at hand, attempts were made to determine the
optimum temperature profile in batch reactor. The optimum temperature profile was determined
in consideration of either maximum instantaneous yield of desired product or minimum
instantaneous yield of undesired product during the course of the reaction. Having all the
parameters with concentration of reactants and products, one can calculate instantaneous yield of
LA (desired) or humin (undesired) as a function of temperature at a given time using equation 9
and 10 respectively. It is also possible to determine the optimum temperature at this particular time
by maximizing instantaneous yield of LA or minimizing instantaneous yield of humins formation.
Suppose, x, y and z are the concentrations of glucose, HMF and LA at a given time t. The optimum
temperature, Topt, was calculated by maximizing instantaneous yield of LA at that point (t) using
equation 9. The “maximization” function in Mathcad was incorporated with equation 9 to
determine the optimum temperature at every instant. This procedure was applied until glucose
conversion is reached 99%. However, at the very beginning of the reaction (at t=0), the theoretical
optimum temperature is infinity. For practical operation, an upper limit of the temperature must
be chosen. For example, if the upper temperature was chosen as 180° C, then the reaction is carried
out at 180°C isothermally until it meets the predetermined optimum temperature profile curve.
2.5 Results and Discussion:
2.5.1 Effect of process variable on the HMF decomposition to LA in acid medium
Acid catalyzed HMF decomposition reaction were carried out in tubular batch reactor
at three different temperature 140, 155, and 170 ˚C using 1-5% sulfuric acid with an initial
concentration of 4 wt.% HMF. The effect of temperature on HMF conversion and LA production
is illustrated in Figure 2-1 &2-2 for the acid concentration of 1 % H2SO4.
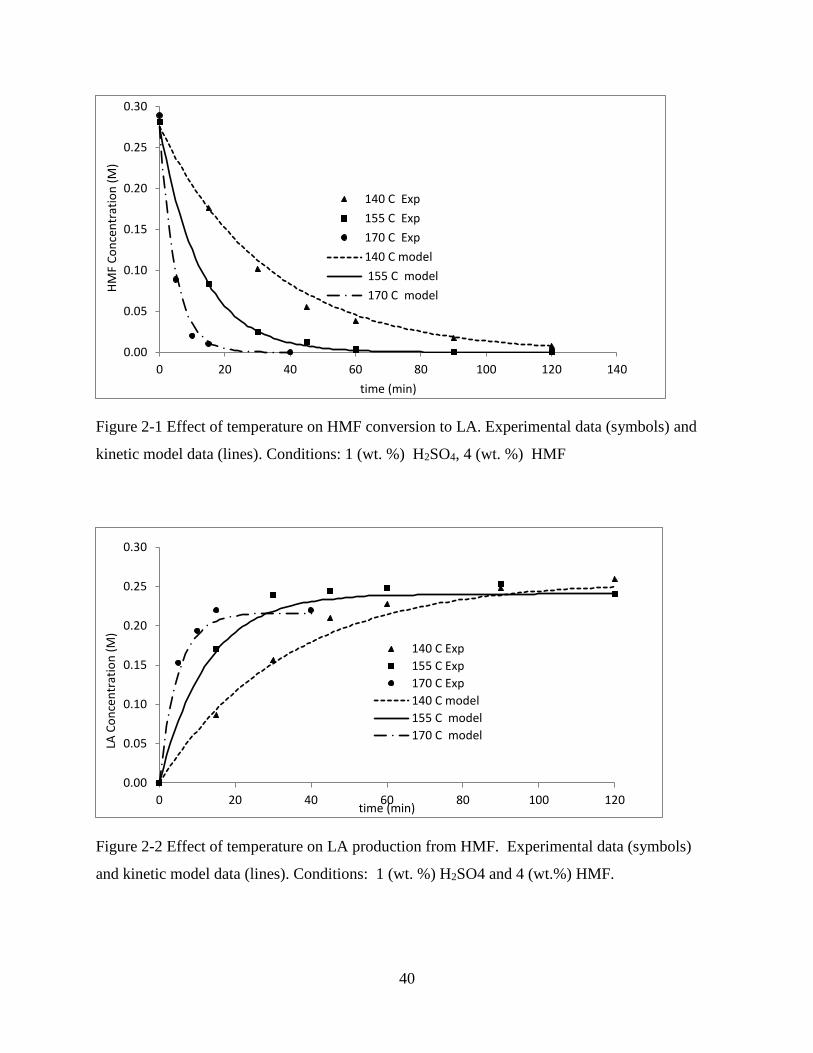
40
Figure 2-1 Effect of temperature on HMF conversion to LA. Experimental data (symbols) and
kinetic model data (lines). Conditions: 1 (wt. %) H2SO4, 4 (wt. %) HMF
Figure 2-2 Effect of temperature on LA production from HMF. Experimental data (symbols)
and kinetic model data (lines). Conditions: 1 (wt. %) H2SO4 and 4 (wt.%) HMF.
0.00
0.05
0.10
0.15
0.20
0.25
0.30
0 20 40 60 80 100 120 140
HM
F C
on
cen
trat
ion
(M
)
time (min)
140 C Exp
155 C Exp
170 C Exp
140 C model
155 C model
170 C model
0.00
0.05
0.10
0.15
0.20
0.25
0.30
0 20 40 60 80 100 120
LA C
on
cen
trat
ion
(M
)
time (min)
140 C Exp
155 C Exp
170 C Exp
140 C model
155 C model
170 C model
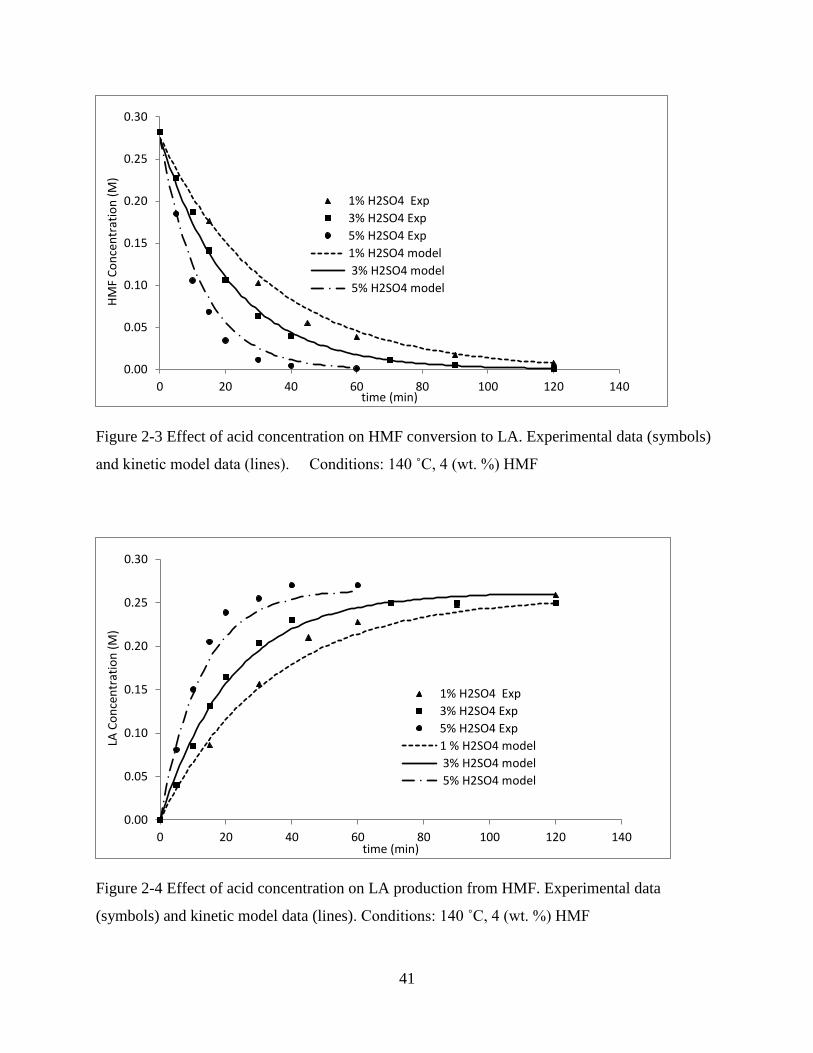
41
Figure 2-3 Effect of acid concentration on HMF conversion to LA. Experimental data (symbols)
and kinetic model data (lines). Conditions: 140 ˚C, 4 (wt. %) HMF
Figure 2-4 Effect of acid concentration on LA production from HMF. Experimental data
(symbols) and kinetic model data (lines). Conditions: 140 ˚C, 4 (wt. %) HMF
0.00
0.05
0.10
0.15
0.20
0.25
0.30
0 20 40 60 80 100 120 140
HM
F C
on
cen
trat
ion
(M
)
time (min)
1% H2SO4 Exp
3% H2SO4 Exp
5% H2SO4 Exp
1% H2SO4 model
3% H2SO4 model
5% H2SO4 model
0.00
0.05
0.10
0.15
0.20
0.25
0.30
0 20 40 60 80 100 120 140
LA C
on
cen
trat
ion
(M
)
time (min)
1% H2SO4 Exp
3% H2SO4 Exp
5% H2SO4 Exp
1 % H2SO4 model
3% H2SO4 model
5% H2SO4 model
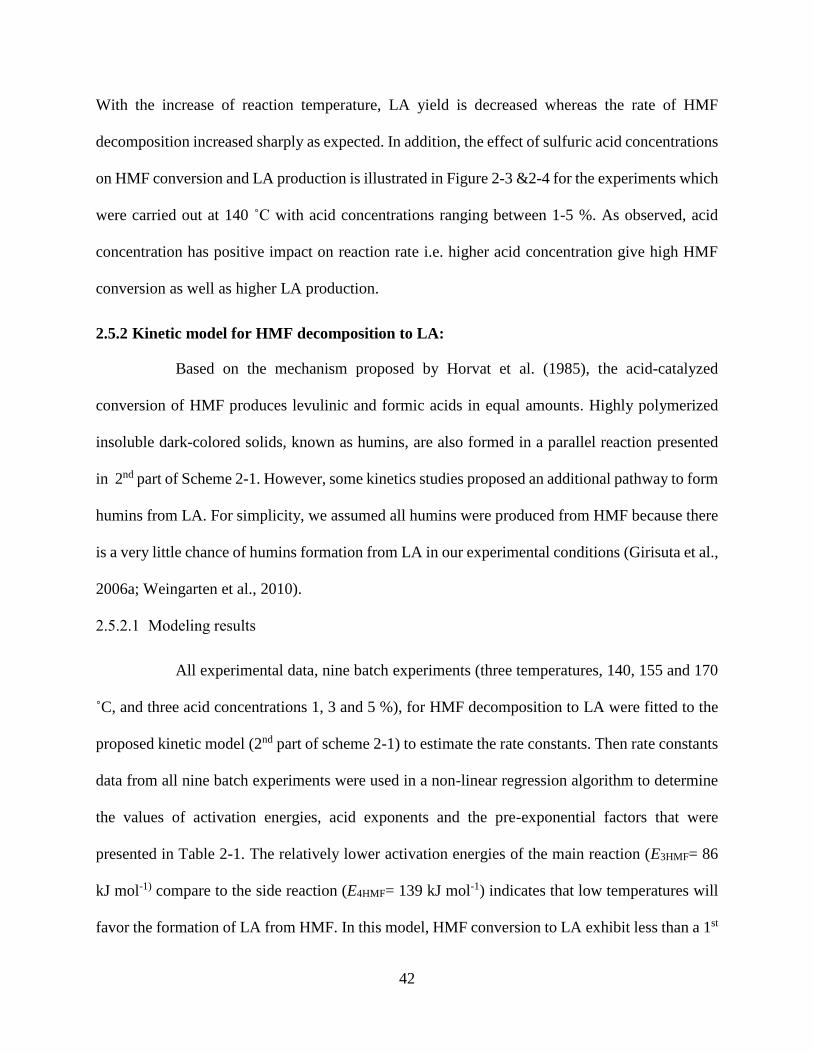
42
With the increase of reaction temperature, LA yield is decreased whereas the rate of HMF
decomposition increased sharply as expected. In addition, the effect of sulfuric acid concentrations
on HMF conversion and LA production is illustrated in Figure 2-3 &2-4 for the experiments which
were carried out at 140 ˚C with acid concentrations ranging between 1-5 %. As observed, acid
concentration has positive impact on reaction rate i.e. higher acid concentration give high HMF
conversion as well as higher LA production.
2.5.2 Kinetic model for HMF decomposition to LA:
Based on the mechanism proposed by Horvat et al. (1985), the acid-catalyzed
conversion of HMF produces levulinic and formic acids in equal amounts. Highly polymerized
insoluble dark-colored solids, known as humins, are also formed in a parallel reaction presented
in 2nd part of Scheme 2-1. However, some kinetics studies proposed an additional pathway to form
humins from LA. For simplicity, we assumed all humins were produced from HMF because there
is a very little chance of humins formation from LA in our experimental conditions (Girisuta et al.,
2006a; Weingarten et al., 2010).
2.5.2.1 Modeling results
All experimental data, nine batch experiments (three temperatures, 140, 155 and 170
˚C, and three acid concentrations 1, 3 and 5 %), for HMF decomposition to LA were fitted to the
proposed kinetic model (2nd part of scheme 2-1) to estimate the rate constants. Then rate constants
data from all nine batch experiments were used in a non-linear regression algorithm to determine
the values of activation energies, acid exponents and the pre-exponential factors that were
presented in Table 2-1. The relatively lower activation energies of the main reaction (E3HMF= 86
kJ mol-1) compare to the side reaction (E4HMF= 139 kJ mol-1) indicates that low temperatures will
favor the formation of LA from HMF. In this model, HMF conversion to LA exhibit less than a 1st
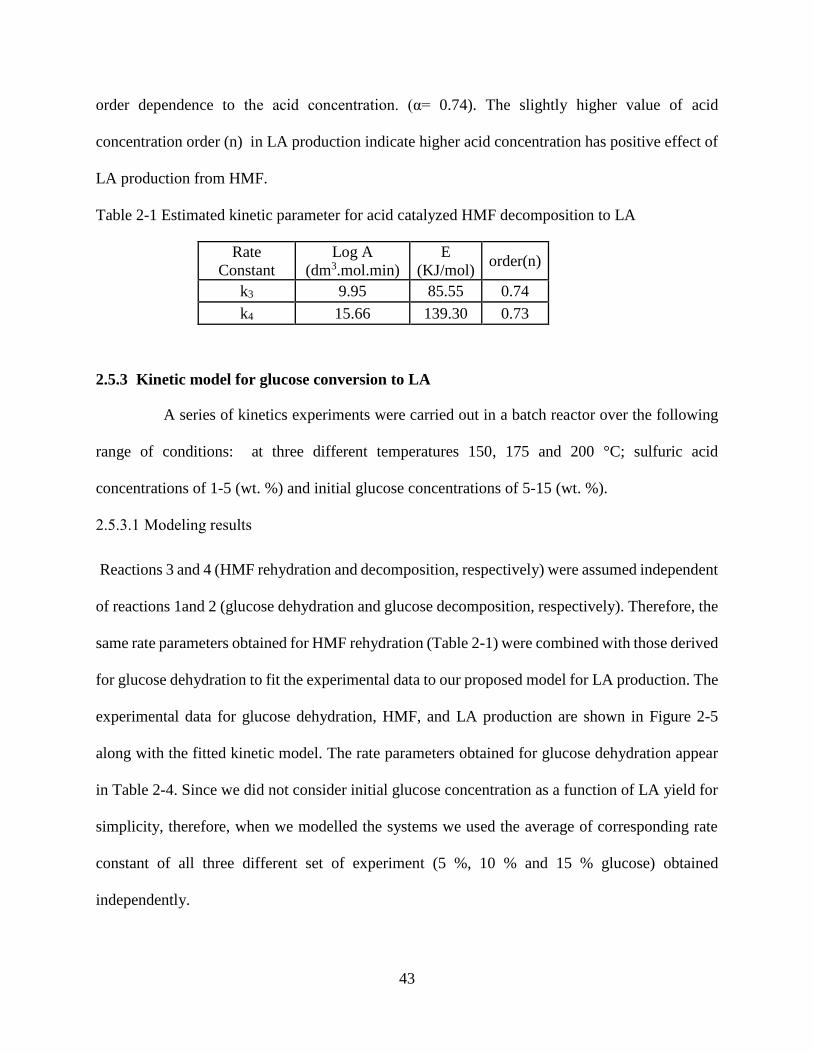
43
order dependence to the acid concentration. (α= 0.74). The slightly higher value of acid
concentration order (n) in LA production indicate higher acid concentration has positive effect of
LA production from HMF.
Table 2-1 Estimated kinetic parameter for acid catalyzed HMF decomposition to LA
Rate
Constant
Log A
(dm3.mol.min)
E
(KJ/mol) order(n)
k3 9.95 85.55 0.74
k4 15.66 139.30 0.73
2.5.3 Kinetic model for glucose conversion to LA
A series of kinetics experiments were carried out in a batch reactor over the following
range of conditions: at three different temperatures 150, 175 and 200 °C; sulfuric acid
concentrations of 1-5 (wt. %) and initial glucose concentrations of 5-15 (wt. %).
2.5.3.1 Modeling results
Reactions 3 and 4 (HMF rehydration and decomposition, respectively) were assumed independent
of reactions 1and 2 (glucose dehydration and glucose decomposition, respectively). Therefore, the
same rate parameters obtained for HMF rehydration (Table 2-1) were combined with those derived
for glucose dehydration to fit the experimental data to our proposed model for LA production. The
experimental data for glucose dehydration, HMF, and LA production are shown in Figure 2-5
along with the fitted kinetic model. The rate parameters obtained for glucose dehydration appear
in Table 2-4. Since we did not consider initial glucose concentration as a function of LA yield for
simplicity, therefore, when we modelled the systems we used the average of corresponding rate
constant of all three different set of experiment (5 %, 10 % and 15 % glucose) obtained
independently.
44
a) d)
b) e)
c) f)
Figure 2-5 Data fitting for LA production at different initial concentration of glucose.
Experimental data (symbols) and kinetic model data (lines) for different experimental
concentration. Conditions a) 175˚C, 5% glucose, 5 (wt. %) H2SO4. b) 200˚C, 5% glucose, 5 (wt.
%) H2SO4. c) 175˚C, 5 (wt. %) H2SO4 with 5 % initial glucose. d) 175˚C, 10 % glucose, 5 (wt.
%) H2SO4. e) 200˚C, 5% glucose, 1 (wt. %) H2SO4. ) e) 200˚C, 5% glucose, 1 (wt. %) H2SO4. f)
150˚C, 5% glucose, 5 (wt. %) H2SO4.
45
2.5.3.1.1 Model predictions for HMF and LA yield in batch reactor
2..5.3.1.1.1 Effect of initial hexose concentration
To study the effect of initial hexose concentration on HMF and LA yield, a three different set of
experiments (total 3× 9=27) were carried out with sulfuric acid concentrations of 1, 3 and 5 (wt.
%) and initial glucose concentrations of 5, 10 and 15 (wt. %) at temperatures 150, 175 and 200 °C.
The effect of initial glucose concentration on glucose conversion and on the production of HMF
and LA are summarized in Figure 2-6, 2-7 &2-8 respectively. The conversion of glucose seems to
be independent of the initial concentration as shown in Figure 2-6. Therefore, when we modelled
the system, we considered that rate constants are dependent on the first order of glucose
concentration. That mean HMF and LA yields are not a function of initial glucose concentration
as shown in Figure 2-7 and 2-8. However, in our experiments we have seen, in some cases,
maximum LA yield is decreased with the increase of glucose.
Figure 2-6 Effect of initial concentration on glucose conversion. Experimental data (symbols)
and kinetic model data (lines) .Conditions: 150 ˚C and 5 (wt.%) H2SO4.
0
10
20
30
40
50
60
70
80
90
100
0 20 40 60 80 100 120 140
Co
nve
rsio
n (
%)
time (min)
Model
Exp at 5% glucose
Exp at 10% glucose
Exp at 15% glucose
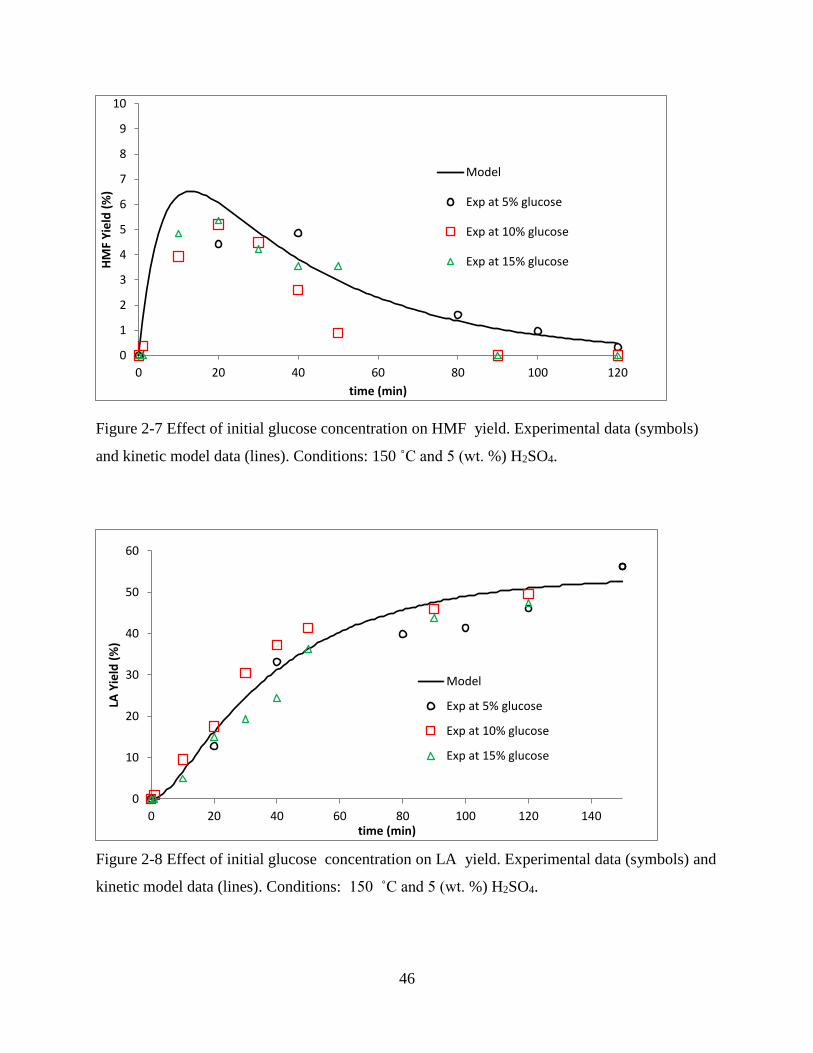
46
Figure 2-7 Effect of initial glucose concentration on HMF yield. Experimental data (symbols)
and kinetic model data (lines). Conditions: 150 ˚C and 5 (wt. %) H2SO4.
Figure 2-8 Effect of initial glucose concentration on LA yield. Experimental data (symbols) and
kinetic model data (lines). Conditions: 150 ˚C and 5 (wt. %) H2SO4.
0
1
2
3
4
5
6
7
8
9
10
0 20 40 60 80 100 120
HM
F Y
ield
(%
)
time (min)
Model
Exp at 5% glucose
Exp at 10% glucose
Exp at 15% glucose
0
10
20
30
40
50
60
0 20 40 60 80 100 120 140
LA Y
ield
(%
)
time (min)
Model
Exp at 5% glucose
Exp at 10% glucose
Exp at 15% glucose
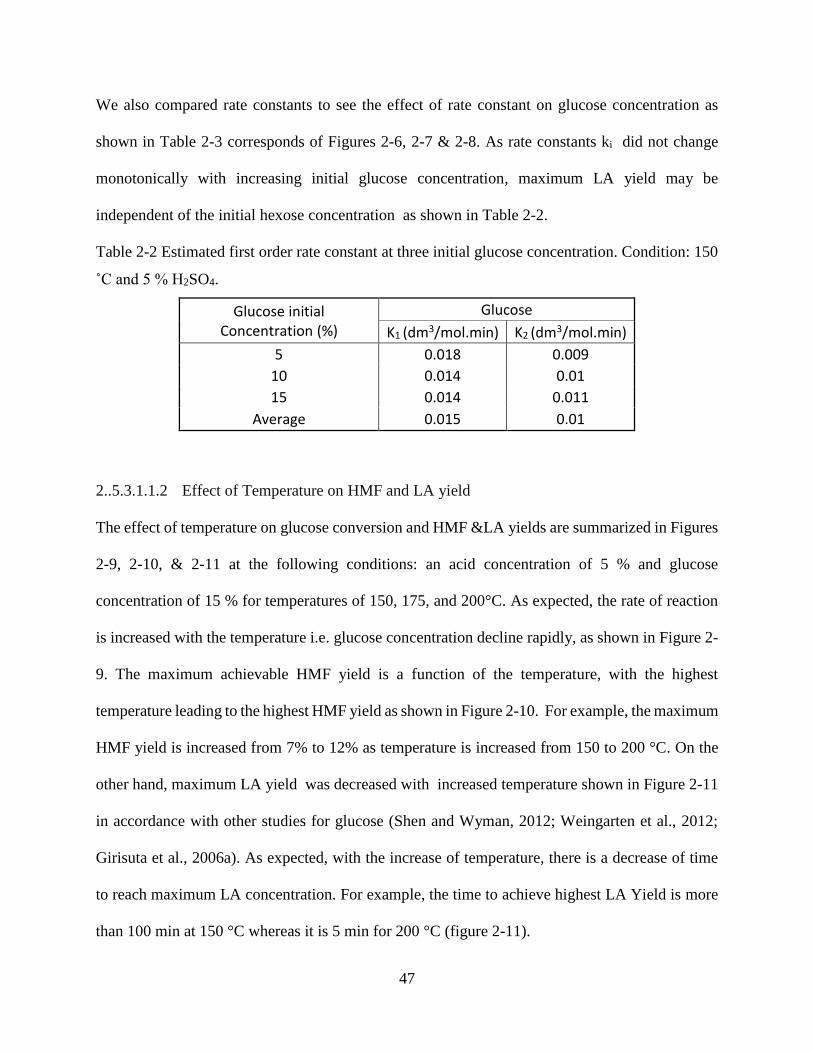
47
We also compared rate constants to see the effect of rate constant on glucose concentration as
shown in Table 2-3 corresponds of Figures 2-6, 2-7 & 2-8. As rate constants ki did not change
monotonically with increasing initial glucose concentration, maximum LA yield may be
independent of the initial hexose concentration as shown in Table 2-2.
Table 2-2 Estimated first order rate constant at three initial glucose concentration. Condition: 150
˚C and 5 % H2SO4.
Glucose initial Concentration (%)
Glucose
K1 (dm3/mol.min) K2 (dm3/mol.min)
5 0.018 0.009
10 0.014 0.01
15 0.014 0.011
Average 0.015 0.01
2..5.3.1.1.2 Effect of Temperature on HMF and LA yield
The effect of temperature on glucose conversion and HMF &LA yields are summarized in Figures
2-9, 2-10, & 2-11 at the following conditions: an acid concentration of 5 % and glucose
concentration of 15 % for temperatures of 150, 175, and 200°C. As expected, the rate of reaction
is increased with the temperature i.e. glucose concentration decline rapidly, as shown in Figure 2-
9. The maximum achievable HMF yield is a function of the temperature, with the highest
temperature leading to the highest HMF yield as shown in Figure 2-10. For example, the maximum
HMF yield is increased from 7% to 12% as temperature is increased from 150 to 200 °C. On the
other hand, maximum LA yield was decreased with increased temperature shown in Figure 2-11
in accordance with other studies for glucose (Shen and Wyman, 2012; Weingarten et al., 2012;
Girisuta et al., 2006a). As expected, with the increase of temperature, there is a decrease of time
to reach maximum LA concentration. For example, the time to achieve highest LA Yield is more
than 100 min at 150 °C whereas it is 5 min for 200 °C (figure 2-11).
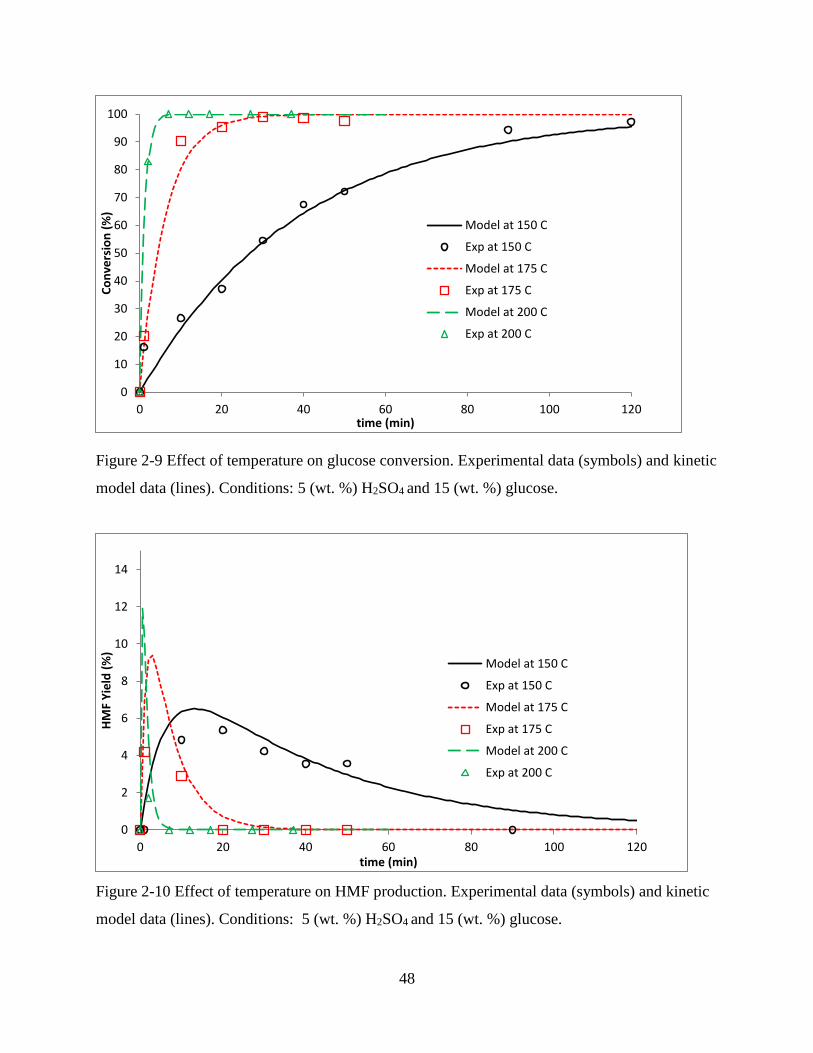
48
Figure 2-9 Effect of temperature on glucose conversion. Experimental data (symbols) and kinetic
model data (lines). Conditions: 5 (wt. %) H2SO4 and 15 (wt. %) glucose.
Figure 2-10 Effect of temperature on HMF production. Experimental data (symbols) and kinetic
model data (lines). Conditions: 5 (wt. %) H2SO4 and 15 (wt. %) glucose.
0
10
20
30
40
50
60
70
80
90
100
0 20 40 60 80 100 120
Co
nve
rsio
n (
%)
time (min)
Model at 150 C
Exp at 150 C
Model at 175 C
Exp at 175 C
Model at 200 C
Exp at 200 C
0
2
4
6
8
10
12
14
0 20 40 60 80 100 120
HM
F Y
ield
(%
)
time (min)
Model at 150 C
Exp at 150 C
Model at 175 C
Exp at 175 C
Model at 200 C
Exp at 200 C
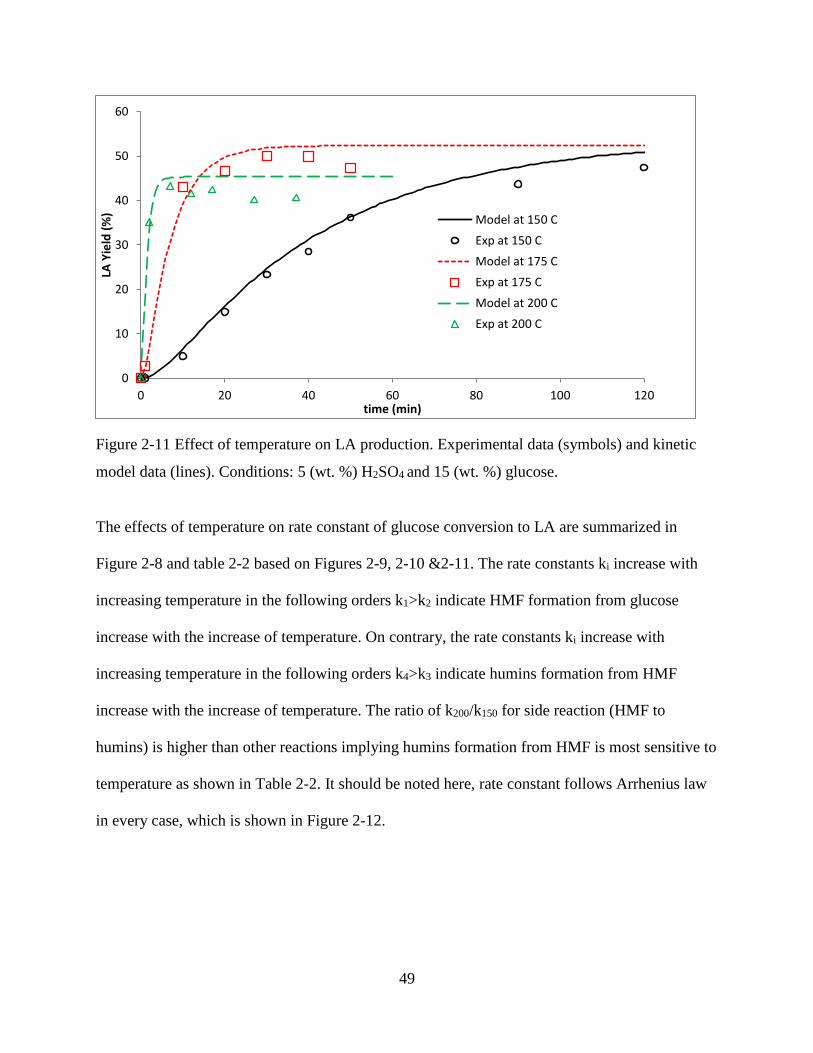
49
Figure 2-11 Effect of temperature on LA production. Experimental data (symbols) and kinetic
model data (lines). Conditions: 5 (wt. %) H2SO4 and 15 (wt. %) glucose.
The effects of temperature on rate constant of glucose conversion to LA are summarized in
Figure 2-8 and table 2-2 based on Figures 2-9, 2-10 &2-11. The rate constants ki increase with
increasing temperature in the following orders k1>k2 indicate HMF formation from glucose
increase with the increase of temperature. On contrary, the rate constants ki increase with
increasing temperature in the following orders k4>k3 indicate humins formation from HMF
increase with the increase of temperature. The ratio of k200/k150 for side reaction (HMF to
humins) is higher than other reactions implying humins formation from HMF is most sensitive to
temperature as shown in Table 2-2. It should be noted here, rate constant follows Arrhenius law
in every case, which is shown in Figure 2-12.
0
10
20
30
40
50
60
0 20 40 60 80 100 120
LA Y
ield
(%
)
time (min)
Model at 150 C
Exp at 150 C
Model at 175 C
Exp at 175 C
Model at 200 C
Exp at 200 C
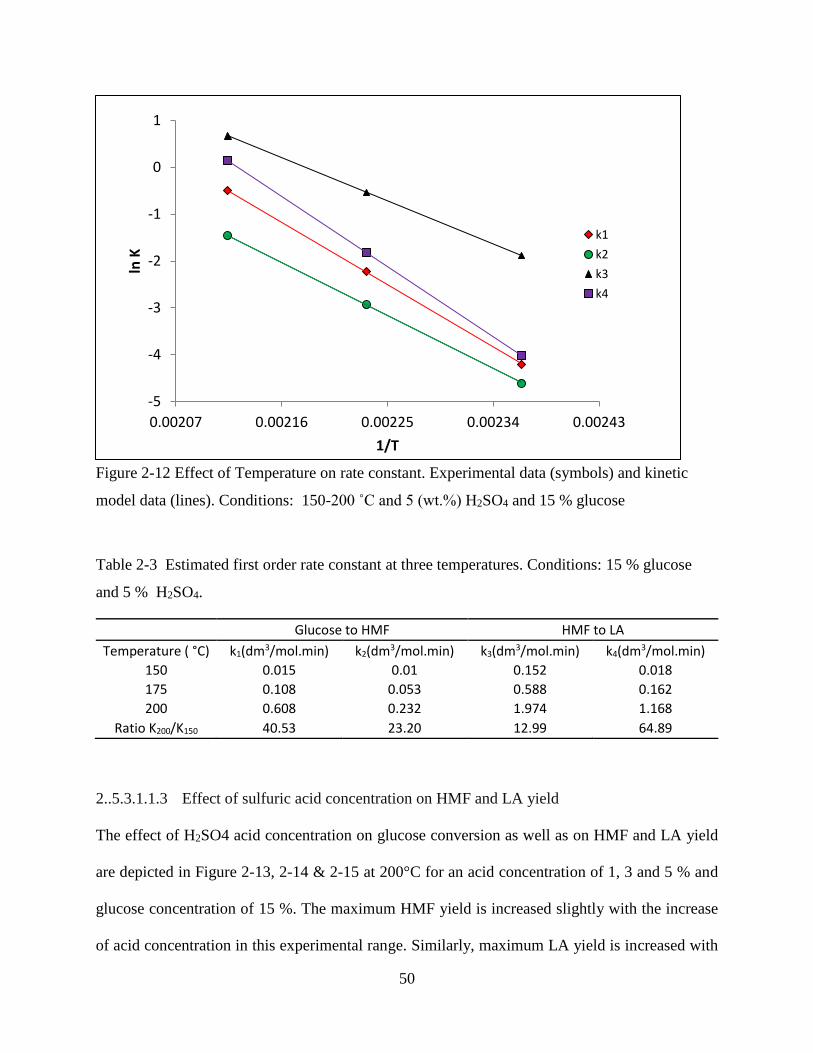
50
Figure 2-12 Effect of Temperature on rate constant. Experimental data (symbols) and kinetic
model data (lines). Conditions: 150-200 ˚C and 5 (wt.%) H2SO4 and 15 % glucose
Table 2-3 Estimated first order rate constant at three temperatures. Conditions: 15 % glucose
and 5 % H2SO4.
Glucose to HMF HMF to LA
Temperature ( °C) k1(dm3/mol.min) k2(dm3/mol.min) k3(dm3/mol.min) k4(dm3/mol.min)
150 0.015 0.01 0.152 0.018
175 0.108 0.053 0.588 0.162
200 0.608 0.232 1.974 1.168
Ratio K200/K150 40.53 23.20 12.99 64.89
2..5.3.1.1.3 Effect of sulfuric acid concentration on HMF and LA yield
The effect of H2SO4 acid concentration on glucose conversion as well as on HMF and LA yield
are depicted in Figure 2-13, 2-14 & 2-15 at 200°C for an acid concentration of 1, 3 and 5 % and
glucose concentration of 15 %. The maximum HMF yield is increased slightly with the increase
of acid concentration in this experimental range. Similarly, maximum LA yield is increased with
-5
-4
-3
-2
-1
0
1
0.00207 0.00216 0.00225 0.00234 0.00243
ln K
1/T
k1
k2
k3
k4
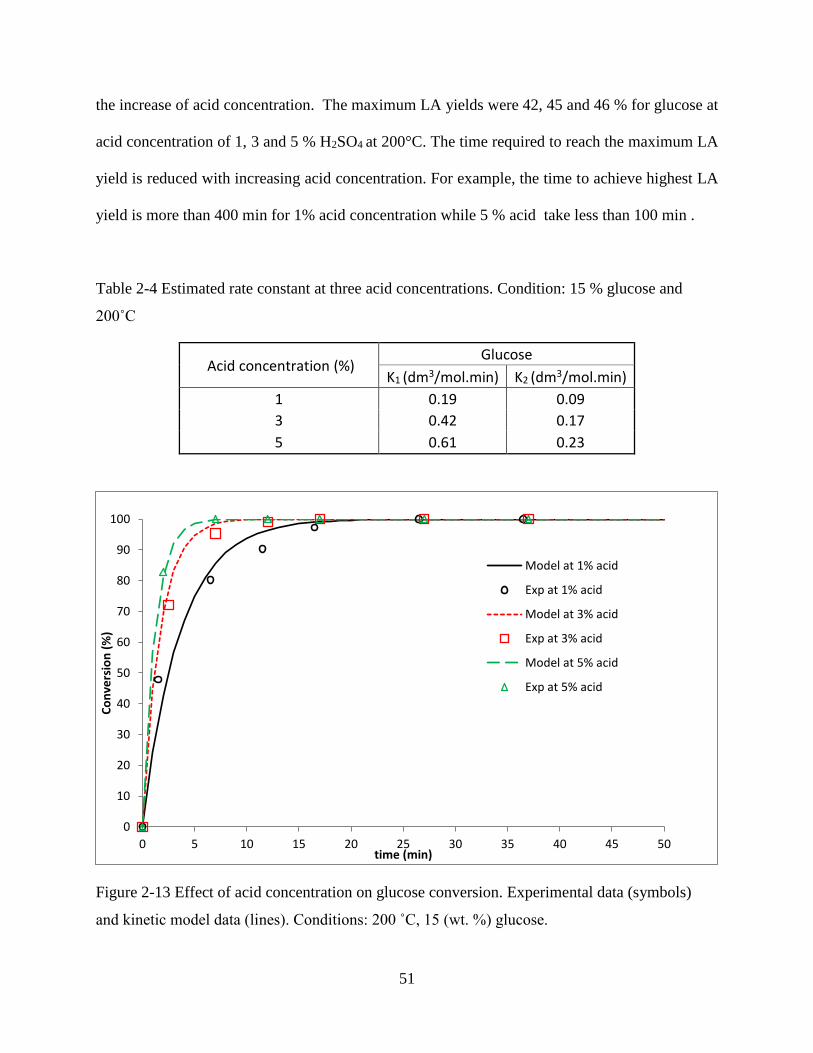
51
the increase of acid concentration. The maximum LA yields were 42, 45 and 46 % for glucose at
acid concentration of 1, 3 and 5 % H2SO4 at 200°C. The time required to reach the maximum LA
yield is reduced with increasing acid concentration. For example, the time to achieve highest LA
yield is more than 400 min for 1% acid concentration while 5 % acid take less than 100 min .
Table 2-4 Estimated rate constant at three acid concentrations. Condition: 15 % glucose and
200˚C
Acid concentration (%) Glucose
K1 (dm3/mol.min) K2 (dm3/mol.min)
1 0.19 0.09
3 0.42 0.17
5 0.61 0.23
Figure 2-13 Effect of acid concentration on glucose conversion. Experimental data (symbols)
and kinetic model data (lines). Conditions: 200 ˚C, 15 (wt. %) glucose.
0
10
20
30
40
50
60
70
80
90
100
0 5 10 15 20 25 30 35 40 45 50
Co
nve
rsio
n (
%)
time (min)
Model at 1% acid
Exp at 1% acid
Model at 3% acid
Exp at 3% acid
Model at 5% acid
Exp at 5% acid
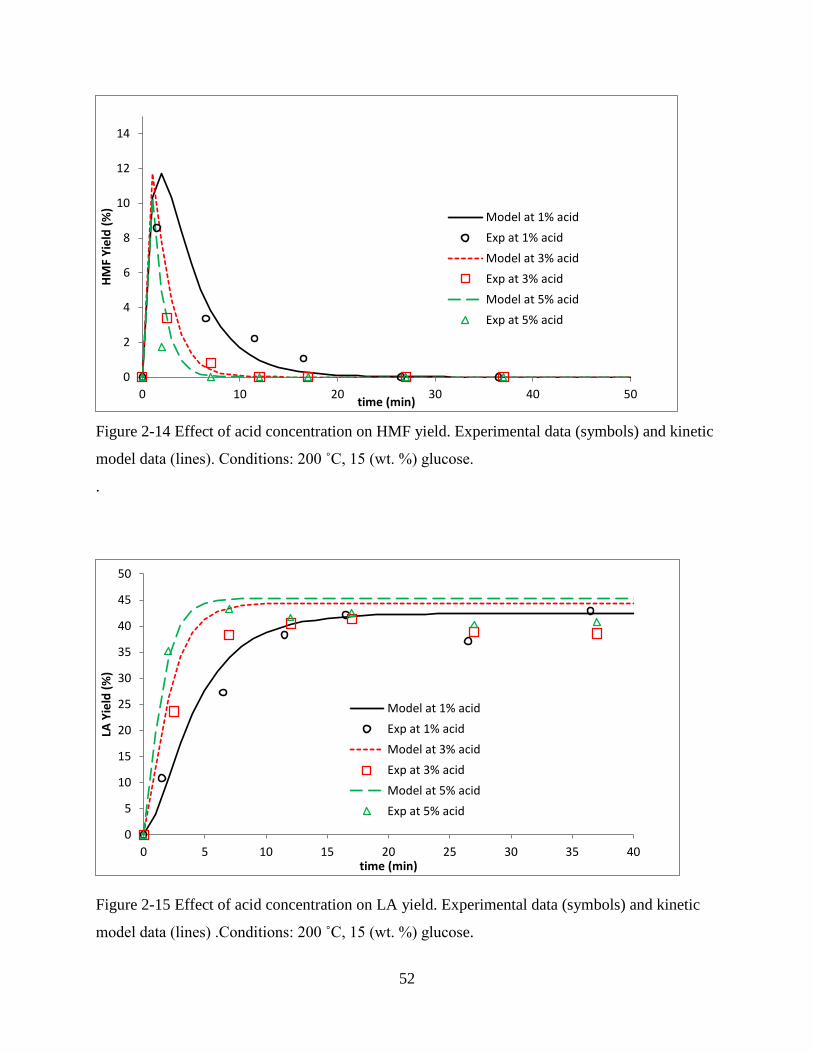
52
Figure 2-14 Effect of acid concentration on HMF yield. Experimental data (symbols) and kinetic
model data (lines). Conditions: 200 ˚C, 15 (wt. %) glucose.
.
Figure 2-15 Effect of acid concentration on LA yield. Experimental data (symbols) and kinetic
model data (lines) .Conditions: 200 ˚C, 15 (wt. %) glucose.
0
2
4
6
8
10
12
14
0 10 20 30 40 50
HM
F Y
ield
(%
)
time (min)
Model at 1% acid
Exp at 1% acid
Model at 3% acid
Exp at 3% acid
Model at 5% acid
Exp at 5% acid
0
5
10
15
20
25
30
35
40
45
50
0 5 10 15 20 25 30 35 40
LA Y
ield
(%
)
time (min)
Model at 1% acid
Exp at 1% acid
Model at 3% acid
Exp at 3% acid
Model at 5% acid
Exp at 5% acid
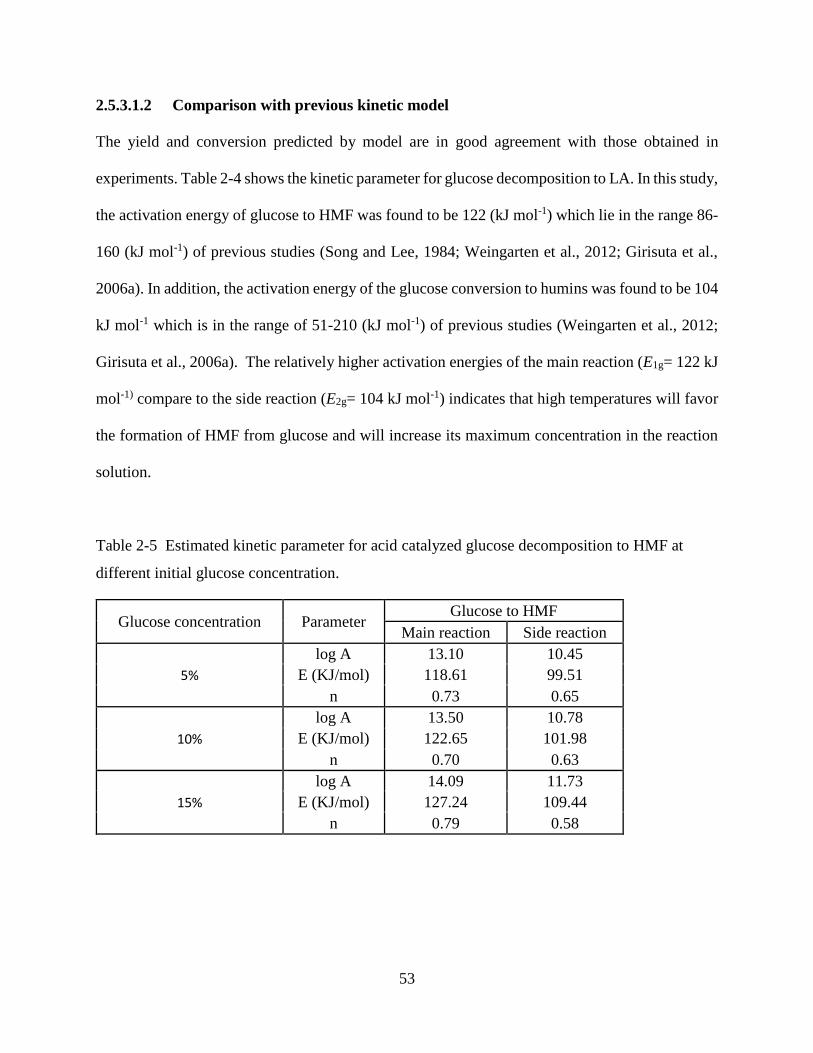
53
2.5.3.1.2 Comparison with previous kinetic model
The yield and conversion predicted by model are in good agreement with those obtained in
experiments. Table 2-4 shows the kinetic parameter for glucose decomposition to LA. In this study,
the activation energy of glucose to HMF was found to be 122 (kJ mol-1) which lie in the range 86-
160 (kJ mol-1) of previous studies (Song and Lee, 1984; Weingarten et al., 2012; Girisuta et al.,
2006a). In addition, the activation energy of the glucose conversion to humins was found to be 104
kJ mol-1 which is in the range of 51-210 (kJ mol-1) of previous studies (Weingarten et al., 2012;
Girisuta et al., 2006a). The relatively higher activation energies of the main reaction (E1g= 122 kJ
mol-1) compare to the side reaction (E2g= 104 kJ mol-1) indicates that high temperatures will favor
the formation of HMF from glucose and will increase its maximum concentration in the reaction
solution.
Table 2-5 Estimated kinetic parameter for acid catalyzed glucose decomposition to HMF at
different initial glucose concentration.
Glucose concentration Parameter Glucose to HMF
Main reaction Side reaction
5%
log A 13.10 10.45
E (KJ/mol) 118.61 99.51
n 0.73 0.65
10%
log A 13.50 10.78
E (KJ/mol) 122.65 101.98
n 0.70 0.63
15%
log A 14.09 11.73
E (KJ/mol) 127.24 109.44
n 0.79 0.58
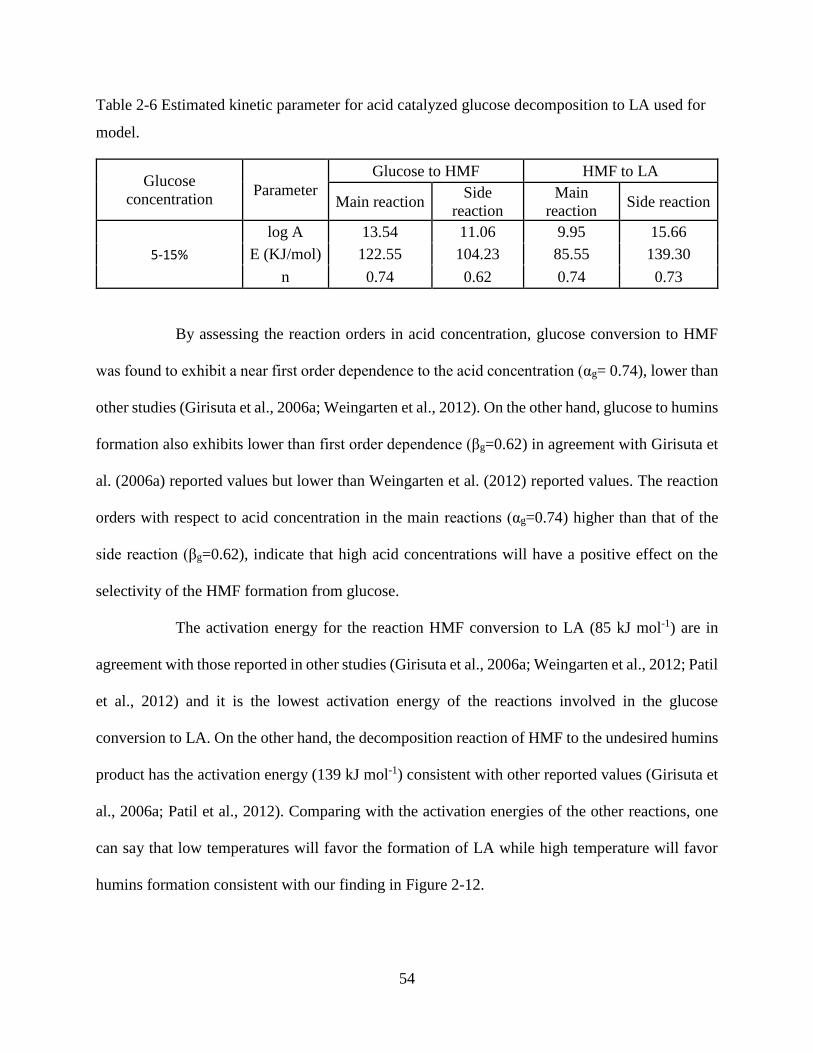
54
Table 2-6 Estimated kinetic parameter for acid catalyzed glucose decomposition to LA used for
model.
Glucose
concentration Parameter
Glucose to HMF HMF to LA
Main reaction Side
reaction
Main
reaction Side reaction
5-15%
log A 13.54 11.06 9.95 15.66
E (KJ/mol) 122.55 104.23 85.55 139.30
n 0.74 0.62 0.74 0.73
By assessing the reaction orders in acid concentration, glucose conversion to HMF
was found to exhibit a near first order dependence to the acid concentration (αg= 0.74), lower than
other studies (Girisuta et al., 2006a; Weingarten et al., 2012). On the other hand, glucose to humins
formation also exhibits lower than first order dependence (βg=0.62) in agreement with Girisuta et
al. (2006a) reported values but lower than Weingarten et al. (2012) reported values. The reaction
orders with respect to acid concentration in the main reactions (αg=0.74) higher than that of the
side reaction (βg=0.62), indicate that high acid concentrations will have a positive effect on the
selectivity of the HMF formation from glucose.
The activation energy for the reaction HMF conversion to LA (85 kJ mol-1) are in
agreement with those reported in other studies (Girisuta et al., 2006a; Weingarten et al., 2012; Patil
et al., 2012) and it is the lowest activation energy of the reactions involved in the glucose
conversion to LA. On the other hand, the decomposition reaction of HMF to the undesired humins
product has the activation energy (139 kJ mol-1) consistent with other reported values (Girisuta et
al., 2006a; Patil et al., 2012). Comparing with the activation energies of the other reactions, one
can say that low temperatures will favor the formation of LA while high temperature will favor
humins formation consistent with our finding in Figure 2-12.
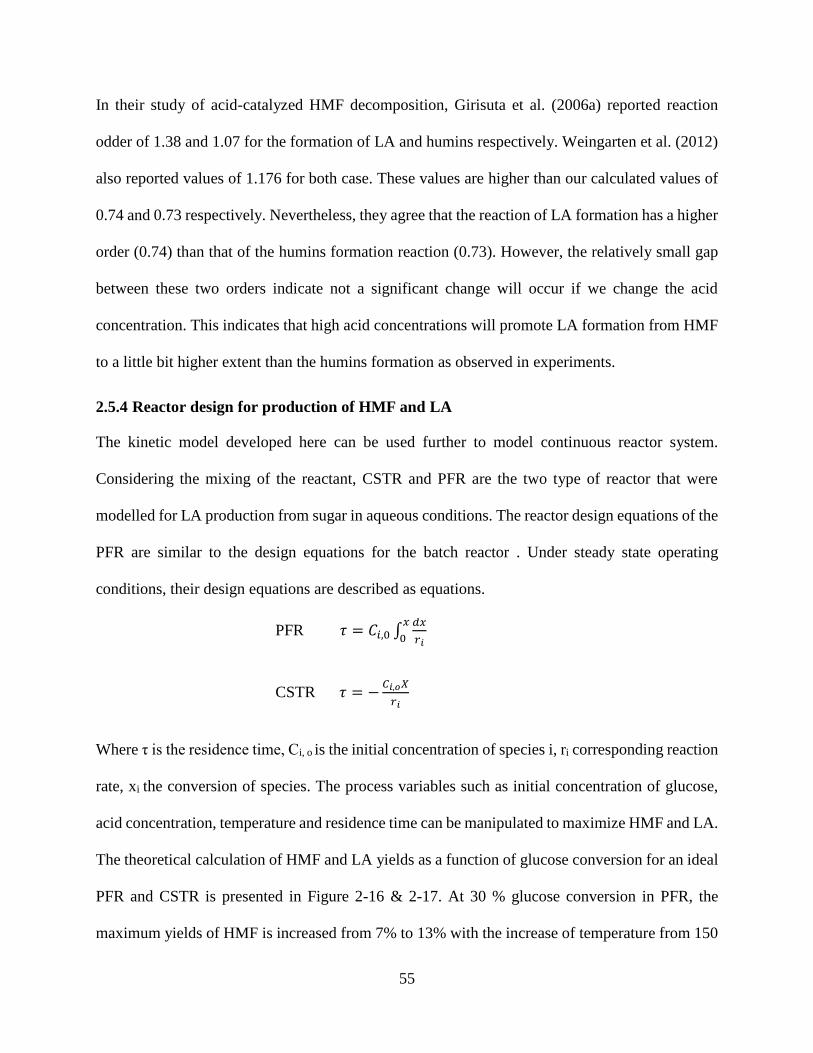
55
In their study of acid-catalyzed HMF decomposition, Girisuta et al. (2006a) reported reaction
odder of 1.38 and 1.07 for the formation of LA and humins respectively. Weingarten et al. (2012)
also reported values of 1.176 for both case. These values are higher than our calculated values of
0.74 and 0.73 respectively. Nevertheless, they agree that the reaction of LA formation has a higher
order (0.74) than that of the humins formation reaction (0.73). However, the relatively small gap
between these two orders indicate not a significant change will occur if we change the acid
concentration. This indicates that high acid concentrations will promote LA formation from HMF
to a little bit higher extent than the humins formation as observed in experiments.
2.5.4 Reactor design for production of HMF and LA
The kinetic model developed here can be used further to model continuous reactor system.
Considering the mixing of the reactant, CSTR and PFR are the two type of reactor that were
modelled for LA production from sugar in aqueous conditions. The reactor design equations of the
PFR are similar to the design equations for the batch reactor . Under steady state operating
conditions, their design equations are described as equations.
PFR 𝜏 = 𝐶𝑖,0 ∫𝑑𝑥
𝑟𝑖
𝑥
0
CSTR 𝜏 = −𝐶𝑖,𝑜𝑋
𝑟𝑖
Where τ is the residence time, Ci, o is the initial concentration of species i, ri corresponding reaction
rate, xi the conversion of species. The process variables such as initial concentration of glucose,
acid concentration, temperature and residence time can be manipulated to maximize HMF and LA.
The theoretical calculation of HMF and LA yields as a function of glucose conversion for an ideal
PFR and CSTR is presented in Figure 2-16 & 2-17. At 30 % glucose conversion in PFR, the
maximum yields of HMF is increased from 7% to 13% with the increase of temperature from 150
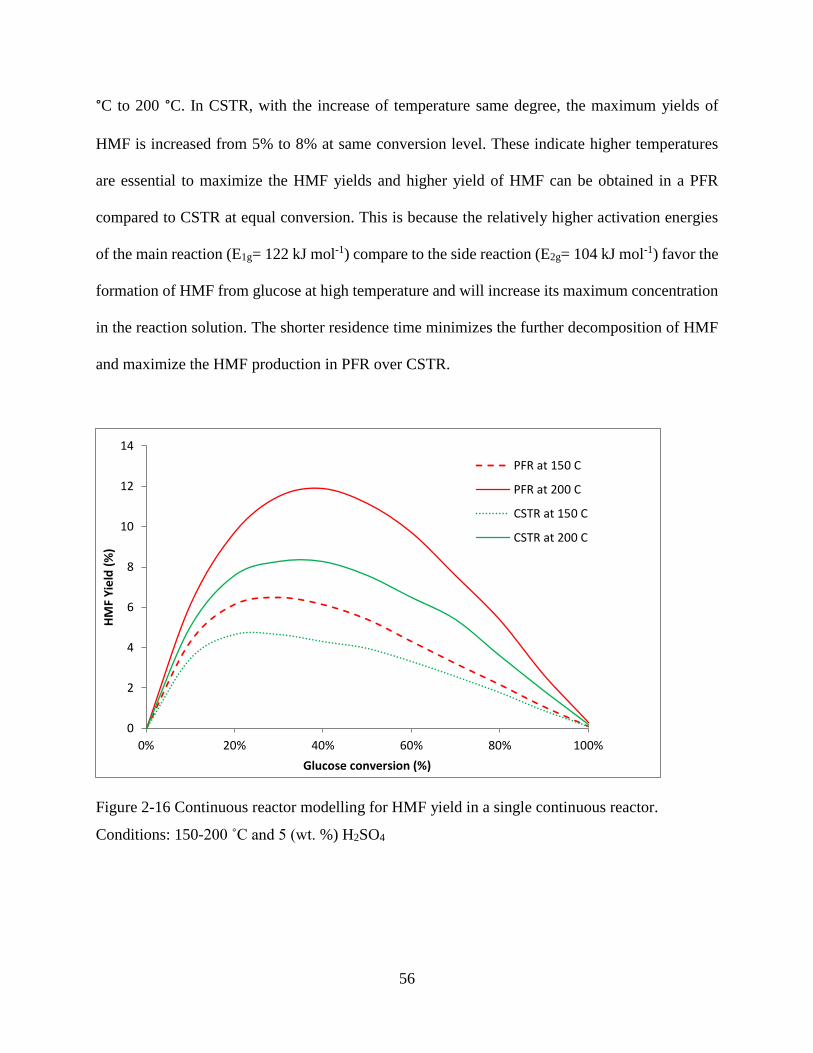
56
°C to 200 °C. In CSTR, with the increase of temperature same degree, the maximum yields of
HMF is increased from 5% to 8% at same conversion level. These indicate higher temperatures
are essential to maximize the HMF yields and higher yield of HMF can be obtained in a PFR
compared to CSTR at equal conversion. This is because the relatively higher activation energies
of the main reaction (E1g= 122 kJ mol-1) compare to the side reaction (E2g= 104 kJ mol-1) favor the
formation of HMF from glucose at high temperature and will increase its maximum concentration
in the reaction solution. The shorter residence time minimizes the further decomposition of HMF
and maximize the HMF production in PFR over CSTR.
Figure 2-16 Continuous reactor modelling for HMF yield in a single continuous reactor.
Conditions: 150-200 ˚C and 5 (wt. %) H2SO4
0
2
4
6
8
10
12
14
0% 20% 40% 60% 80% 100%
HM
F Y
ield
(%
)
Glucose conversion (%)
PFR at 150 C
PFR at 200 C
CSTR at 150 C
CSTR at 200 C
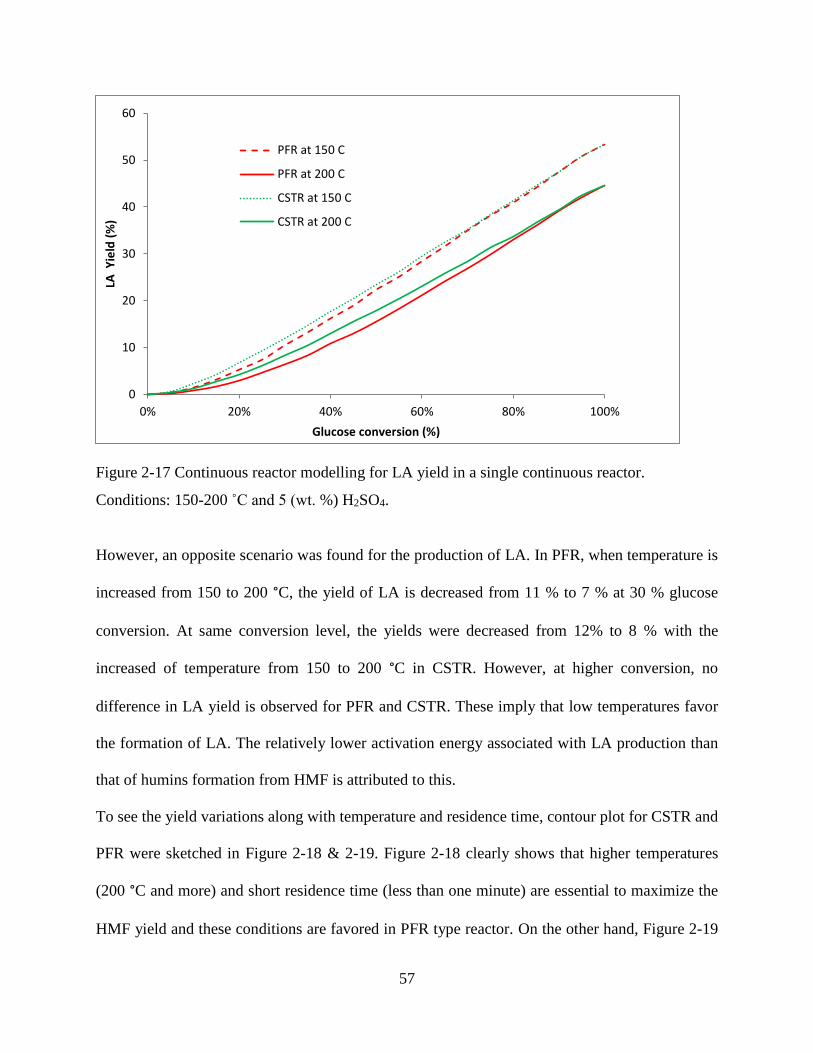
57
Figure 2-17 Continuous reactor modelling for LA yield in a single continuous reactor.
Conditions: 150-200 ˚C and 5 (wt. %) H2SO4.
However, an opposite scenario was found for the production of LA. In PFR, when temperature is
increased from 150 to 200 °C, the yield of LA is decreased from 11 % to 7 % at 30 % glucose
conversion. At same conversion level, the yields were decreased from 12% to 8 % with the
increased of temperature from 150 to 200 °C in CSTR. However, at higher conversion, no
difference in LA yield is observed for PFR and CSTR. These imply that low temperatures favor
the formation of LA. The relatively lower activation energy associated with LA production than
that of humins formation from HMF is attributed to this.
To see the yield variations along with temperature and residence time, contour plot for CSTR and
PFR were sketched in Figure 2-18 & 2-19. Figure 2-18 clearly shows that higher temperatures
(200 °C and more) and short residence time (less than one minute) are essential to maximize the
HMF yield and these conditions are favored in PFR type reactor. On the other hand, Figure 2-19
0
10
20
30
40
50
60
0% 20% 40% 60% 80% 100%
LA Y
ield
(%
)
Glucose conversion (%)
PFR at 150 C
PFR at 200 C
CSTR at 150 C
CSTR at 200 C
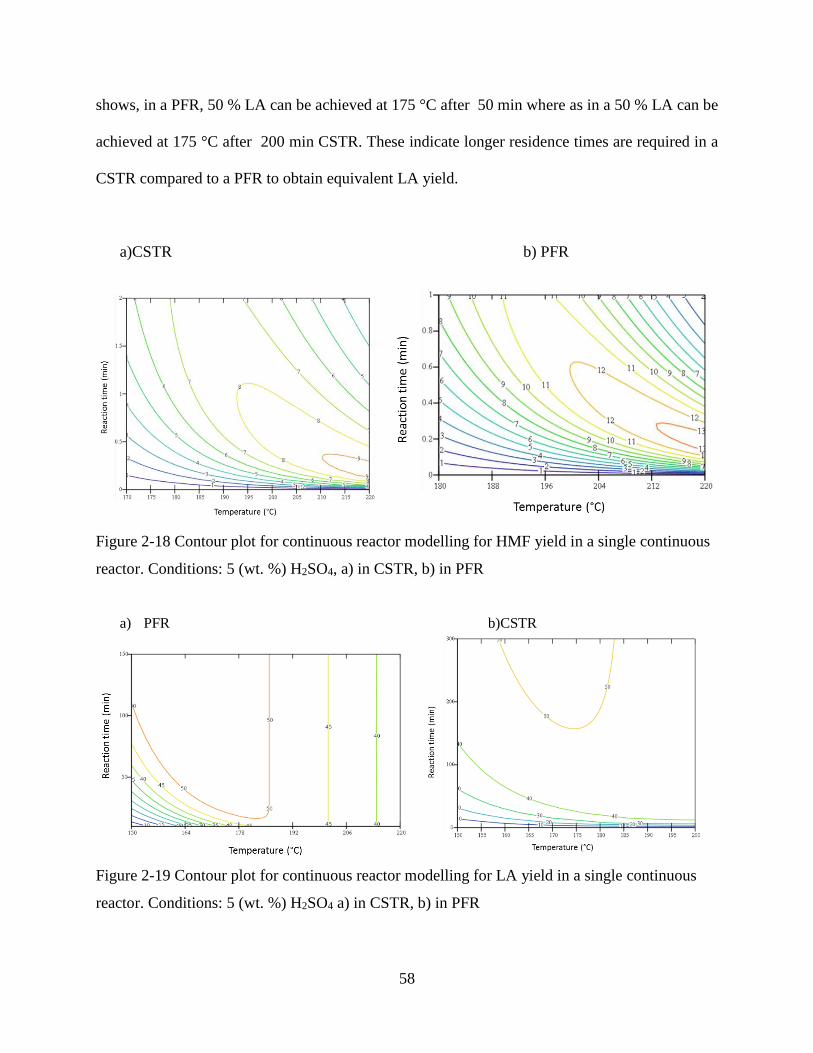
58
shows, in a PFR, 50 % LA can be achieved at 175 °C after 50 min where as in a 50 % LA can be
achieved at 175 °C after 200 min CSTR. These indicate longer residence times are required in a
CSTR compared to a PFR to obtain equivalent LA yield.
a)CSTR b) PFR
Figure 2-18 Contour plot for continuous reactor modelling for HMF yield in a single continuous
reactor. Conditions: 5 (wt. %) H2SO4, a) in CSTR, b) in PFR
a) PFR b)CSTR
Figure 2-19 Contour plot for continuous reactor modelling for LA yield in a single continuous
reactor. Conditions: 5 (wt. %) H2SO4 a) in CSTR, b) in PFR
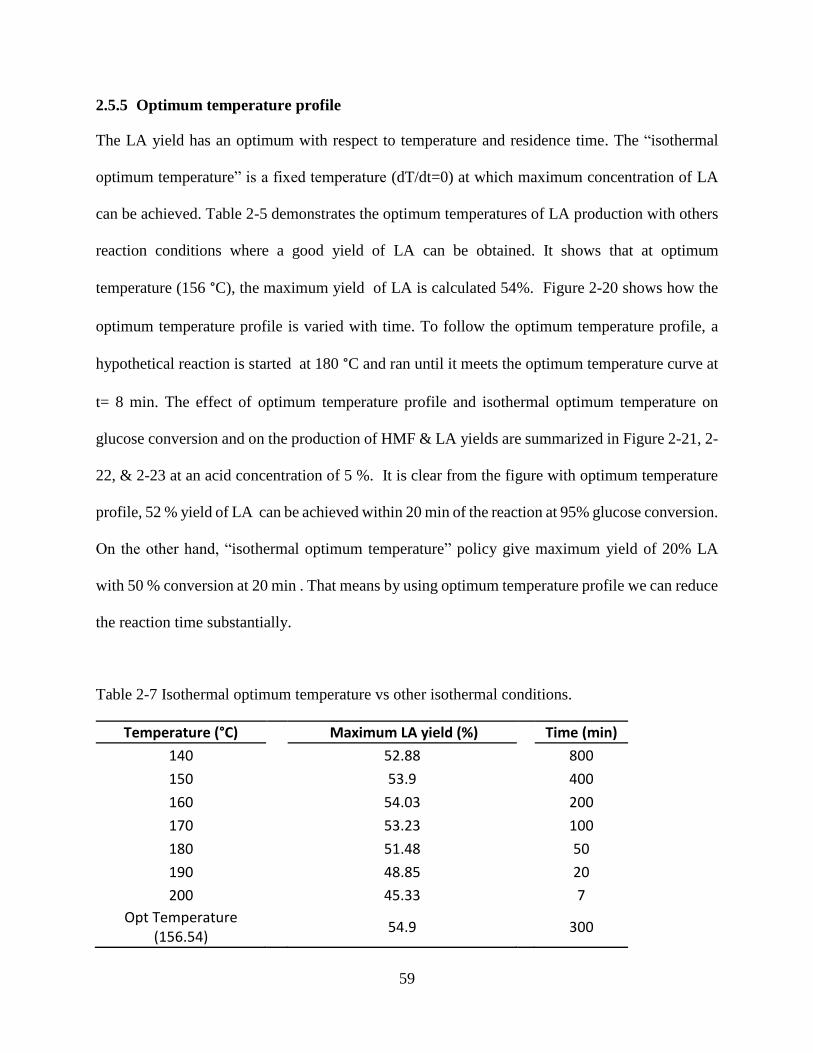
59
2.5.5 Optimum temperature profile
The LA yield has an optimum with respect to temperature and residence time. The “isothermal
optimum temperature” is a fixed temperature (dT/dt=0) at which maximum concentration of LA
can be achieved. Table 2-5 demonstrates the optimum temperatures of LA production with others
reaction conditions where a good yield of LA can be obtained. It shows that at optimum
temperature (156 °C), the maximum yield of LA is calculated 54%. Figure 2-20 shows how the
optimum temperature profile is varied with time. To follow the optimum temperature profile, a
hypothetical reaction is started at 180 °C and ran until it meets the optimum temperature curve at
t= 8 min. The effect of optimum temperature profile and isothermal optimum temperature on
glucose conversion and on the production of HMF & LA yields are summarized in Figure 2-21, 2-
22, & 2-23 at an acid concentration of 5 %. It is clear from the figure with optimum temperature
profile, 52 % yield of LA can be achieved within 20 min of the reaction at 95% glucose conversion.
On the other hand, “isothermal optimum temperature” policy give maximum yield of 20% LA
with 50 % conversion at 20 min . That means by using optimum temperature profile we can reduce
the reaction time substantially.
Table 2-7 Isothermal optimum temperature vs other isothermal conditions.
Temperature (°C) Maximum LA yield (%) Time (min)
140 52.88 800
150 53.9 400
160 54.03 200
170 53.23 100
180 51.48 50
190 48.85 20
200 45.33 7
Opt Temperature (156.54)
54.9 300
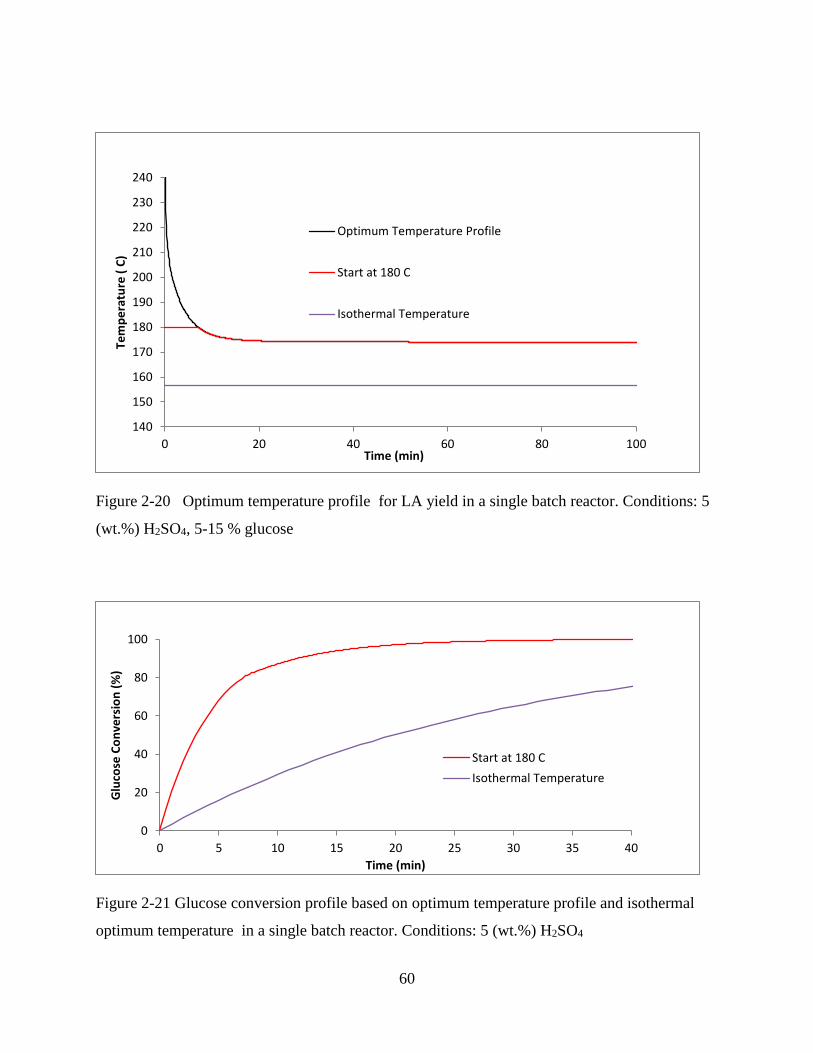
60
Figure 2-20 Optimum temperature profile for LA yield in a single batch reactor. Conditions: 5
(wt.%) H2SO4, 5-15 % glucose
Figure 2-21 Glucose conversion profile based on optimum temperature profile and isothermal
optimum temperature in a single batch reactor. Conditions: 5 (wt.%) H2SO4
140
150
160
170
180
190
200
210
220
230
240
0 20 40 60 80 100
Tem
pe
ratu
re (
C)
Time (min)
Optimum Temperature Profile
Start at 180 C
Isothermal Temperature
0
20
40
60
80
100
0 5 10 15 20 25 30 35 40
Glu
cose
Co
nve
rsio
n (
%)
Time (min)
Start at 180 C
Isothermal Temperature
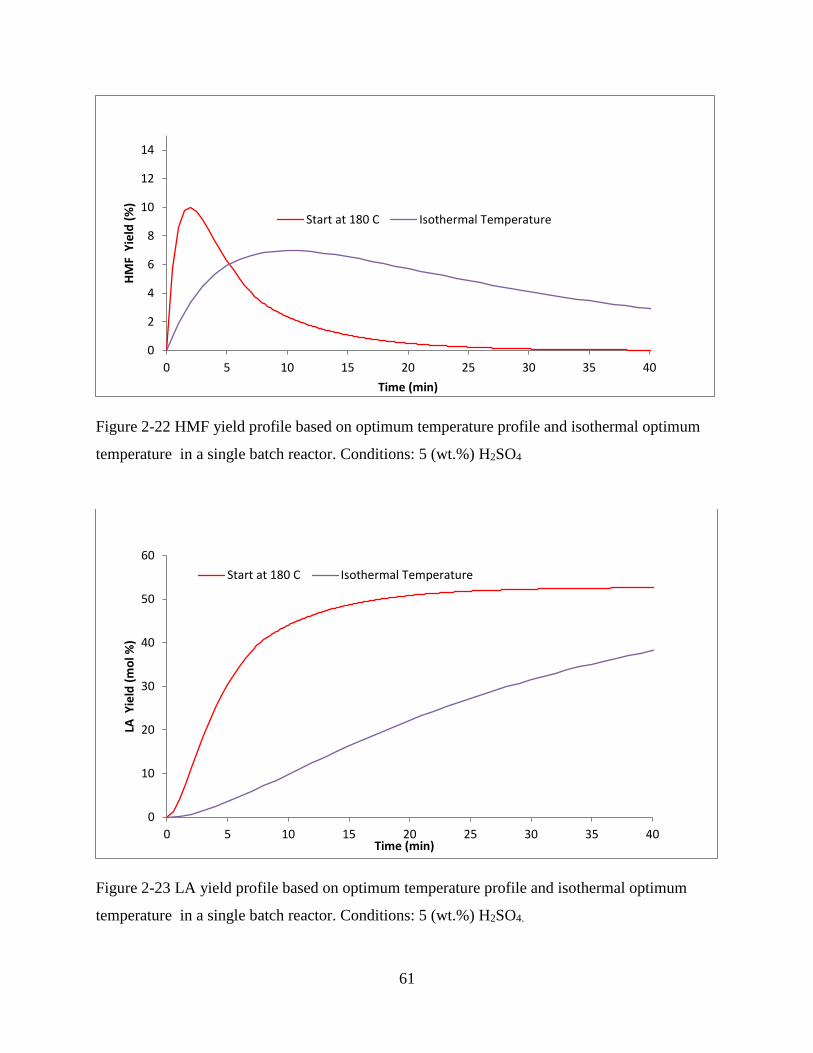
61
Figure 2-22 HMF yield profile based on optimum temperature profile and isothermal optimum
temperature in a single batch reactor. Conditions: 5 (wt.%) H2SO4
Figure 2-23 LA yield profile based on optimum temperature profile and isothermal optimum
temperature in a single batch reactor. Conditions: 5 (wt.%) H2SO4.
0
2
4
6
8
10
12
14
0 5 10 15 20 25 30 35 40
HM
F Y
ield
(%
)
Time (min)
Start at 180 C Isothermal Temperature
0
10
20
30
40
50
60
0 5 10 15 20 25 30 35 40
LA Y
ield
(m
ol %
)
Time (min)
Start at 180 C Isothermal Temperature
62
2.6 Conclusion
This study describes an experimental study on the acid-catalyzed decomposition of glucose into
LA and formic acid in a batch reactor. In this study, we have developed a kinetic model for LA
production from glucose that consists of four steps: (1) glucose dehydration to form HMF; (2)
glucose degradation reactions to form humins; (3) HMF rehydration to form LA and formic acid,
and (4) HMF degradation to produce humins. Some parameters such as reaction temperature, acid
concentration and initial hexose concentration that impact LA yield have been investigated in
detail. The results shows LA yields depend on sulfuric acid concentration. Although temperature
speed up the reaction rate and allowed the maximum LA yield to be reached sooner, the maximum
LA yield is decrease with increasing temperature. The acid concentration has little positive effect
on maximum LA yield. The kinetic model derived for batch reactor was further used to model
continuous reactor system. The model suggests that high temperature and shorter reaction times
are required to maximize hydroxymethylfurfural (HMF), an intermediate in the process. It also
predicts low temperature and longer reaction times are essential to maximize LA yield. By
following optimum temperature profile, a near maximum LA yield can be obtained within short
period of time.
63
Chapter 3
Production of levulinic acid from glucose by dual solid-acid
catalysts
3.1 Abstract
Levulinic acid is a versatile specialty chemical usable as a building-block for synthesis of various
chemicals. In this study, we have prepared a series of solid Lewis acid catalysts and tested them
for glucose to fructose isomerization. We also tested a Brønsted solid acid catalyst (Amberlyst-15)
to investigate conversion of fructose to levulinic. Among the Lewis solid acid catalysts tested, tin
imbedded on large-pore zeolite (Sn-Beta) has shown the highest specific activity in isomerization
of glucose to fructose in aqueous media. The concurrent use of the dual-catalysts of Sn-beta and
Amberlyst-15 was further investigated. The dual-acid catalyst has improved the yield of LA over
that of Amberlyst-15 alone, from 37% to 45% of the theoretical maximum. The improvement was
due to enhanced isomerization of glucose to fructose by Sn-Beta. Stability tests have shown that
the Sn-beta zeolite catalyst loses 20 % of its activity after five consecutive batch-cycles. The
activity of this catalyst, however, was fully regenerated by calcination. Ambelyst-15 also suffers
from deactivation, which is lower than that of Sn-Beta. The deactivation is primarily due to humin
deposit on the surface of the catalyst.
64
3.2 Introduction
LA (gamma-ketovaleric acid), is a short-chain fatty acid, provide potentially important platforms
for production of liquid fuels and chemicals(Shen & Wyman, 2012). The unique feature of LA is
its ketone and a carboxylic acid groups. These two functional groups make it a potentially very
versatile building block for the synthesis of various organic chemicals (Girisuta et al., 2006b). For
example, Levulinic ester, which is produced from the esterification of LA, is suitable to be used
as additives for gasoline and diesel of transportation fuels (Peng et al., 2011). LA can also be
hydrogenated to g-valerolactone (GVL), a non-toxic solvent, has the functionality to be upgraded
to a variety of chemicals, fuels additives, and fuels (Alonso et al., 2013). Serrano –Ruiz et al.
(2011) have developed a cost effective route for the conversion of lignocellulosic biomass to
liquid hydrocarbon fuels via catalytic decarboxylation of GVL to butene followed by alkene
oligomerization.
The most common method to produce LA is the acid catalyzed hydrolysis of hexose sugars or
carbohydrates. Traditionally, homogeneous catalysts such as HCl and H2SO4 have been used to
synthesis LA from glucose (Girisuta et al., 2006b), cellulose, (Girisuta et al., 2007b), normal corn
starch (Cha & Hanna, 2002), water hyacinth plant (Girisuta et al., 2008), sugarcane bagasse
(Girisuta et al., 2013) and Pine (Rivas et al., 2013). A wealth of research have been conducted on
conversion of lignocellulosic biomass to LA using homogeneous catalysts, but relatively few
address heterogeneous catalyst in the process of LA production from soluble sugars. The difficulty
in recovery of the homogeneous catalyst and disposal problem along with equipment corrosion
issues make heterogeneous catalyst a viable option. Use of solid catalysts, however, is restricted
to liquid feedstocks. There are liquid carbohydrates available from various sources that can
compete cost-wise with lignocellulosic feedstocks. The examples are industrial byproducts such
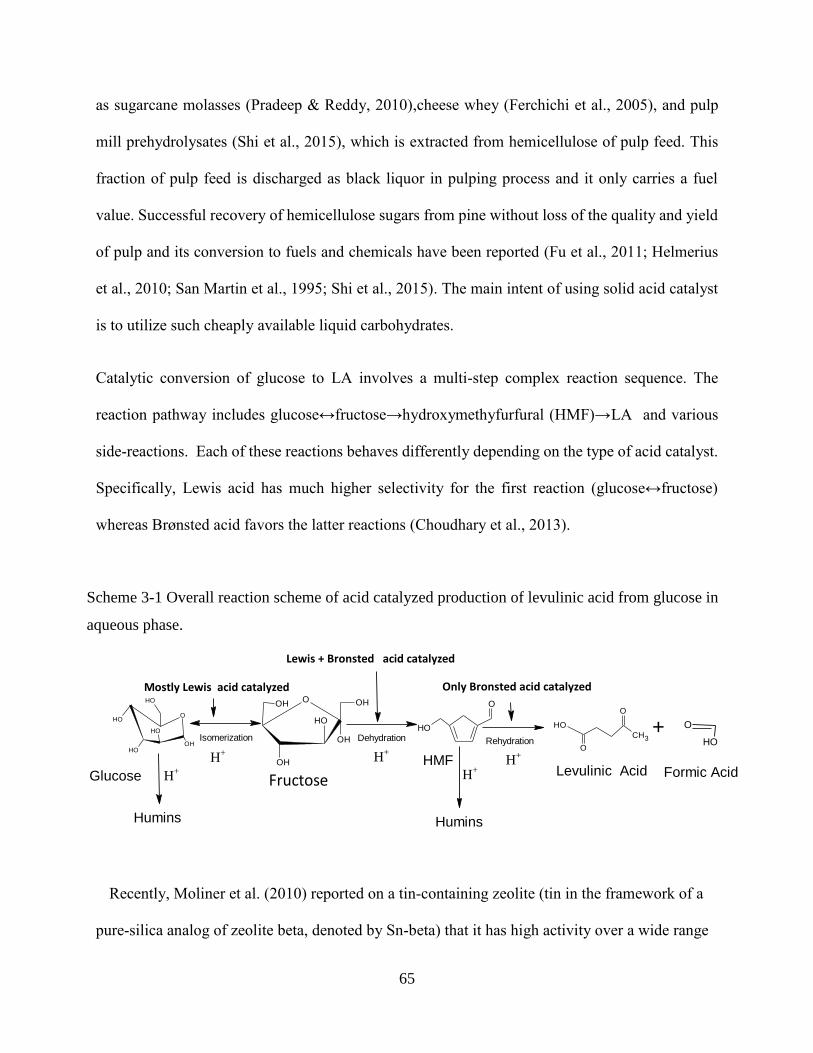
65
as sugarcane molasses (Pradeep & Reddy, 2010),cheese whey (Ferchichi et al., 2005), and pulp
mill prehydrolysates (Shi et al., 2015), which is extracted from hemicellulose of pulp feed. This
fraction of pulp feed is discharged as black liquor in pulping process and it only carries a fuel
value. Successful recovery of hemicellulose sugars from pine without loss of the quality and yield
of pulp and its conversion to fuels and chemicals have been reported (Fu et al., 2011; Helmerius
et al., 2010; San Martin et al., 1995; Shi et al., 2015). The main intent of using solid acid catalyst
is to utilize such cheaply available liquid carbohydrates.
Catalytic conversion of glucose to LA involves a multi-step complex reaction sequence. The
reaction pathway includes glucose↔fructose→hydroxymethyfurfural (HMF)→LA and various
side-reactions. Each of these reactions behaves differently depending on the type of acid catalyst.
Specifically, Lewis acid has much higher selectivity for the first reaction (glucose↔fructose)
whereas Brønsted acid favors the latter reactions (Choudhary et al., 2013).
Recently, Moliner et al. (2010) reported on a tin-containing zeolite (tin in the framework of a
pure-silica analog of zeolite beta, denoted by Sn-beta) that it has high activity over a wide range
OH
OH
O
OH
OH
OHO
OH OH
O
O
CH3+ O
OH
Humins Humins
H+ H+
H+H+
GlucoseHMF
Levulinic Acid Formic Acid
O
OH
OH
OH OH
OH
Fructose
Mostly Lewis acid catalyzed Only Bronsted acid catalyzed
Lewis + Bronsted acid catalyzed
Isomerization Dehydration Rehydration
H+
Scheme 3-1 Overall reaction scheme of acid catalyzed production of levulinic acid from glucose in
aqueous phase.
66
of temperature (110– 140 °C) for isomerization of glucose into fructose in aqueous media with
glucose feed as high as 45 wt.%. In another study, Son et al. (2012) reported that the synthesis of
LA from fructose with high yield (56% molar yield) using Amberlyst-15, an ion-exchange resin
with strongly acidic sulfonic groups that contains more Brønsted acid sites than Lewis acid sites.
Results of these studies collectively suggest that yield of levulinic from glucose can be improved
applying the dual-acid catalyst system, each carrying out the respective reaction steps.
In this work, we have explored the use of solid-acid Lewis acid catalysts including post-
transitional metal (tin-containing zeolite), transitional metal (vanadium-containing zeolite, iron-
containing zeolite), lanthanoide metal (lanthanum-containing zeolite) to identify their roles in
catalyzing the glucose isomerization reaction as well as to investigate the combined effect of
Lewis acid and Brønsted acid (Amberlyst-15) on glucose conversion to levulinic. Our strategy
was to separately investigate the two independent reactions involved in the synthesis of LA from
glucose: (1) isomerization of glucose into fructose catalyzed by Lewis acid (Sn-beta, V-beta, La-
beta, Fe-beta) and (2) dehydration of fructose into LA by Brønsted acid (Amberlyst-15).
3.3 Materials and Method
3.3.1 Chemicals and reagents
Hydroxymethylfurfural (HMF) was obtained from Fisher Scientific Inc. (Cincinnati, Ohio).
Zeolite beta, Tin (II) acetate, ammonium metavandate (NH4VO3), Iron chloride hexahydrate
(FeCl3.6H2O), LaCl3.7 H2O, glucose, fructose, nitric acid, LA and formic acid were purchased
from VWR (Radnor, PA). All chemicals used in this study were of analytical grade and used
without further purification.
67
3.3.2 Catalyst preparation
Lewis acid doped zeolites are typically obtained by direct incorporation of the Lewis acid into
the framework during hydrothermal synthesis. However, this procedure has some disadvantages
such as undesirable formation of metal oxide particles, significant retardation of the zeolite
nucleation, and hence excessively time-consuming synthesis procedure (up to 40 days for Sn-
beta), and undesirable crystal formation during the catalyst synthesis. To avoid these, Sn-beta
was synthesized according to the solid-state ion-exchange (SSIE) procedure described by
Hammond et al. (2012). Zeolite beta was treated with 13 M HNO3 mixing them in proportion of
1 g zeolite per 20 ml solution. This treatment was carried out at 90 °C for 20 h to remove the
aluminum content. Then de-aluminated zeolite beta was recovered by filtration, extensively
washed with water, and dried at 45 °C overnight. The SSIE reaction was then applied by
grinding the appropriate amount of de-aluminated zeolite together with required amount of tin
(II) acetate for 15 minutes to prepare 10% (w/w) Sn-beta/dealuminated zeolite and then calcined
in an air-flow furnace at 550 °C for 6 h. To prepare V-beta, Fe-beta and La-beta, SSIE reactions
were carried out the same way as that of Sn-beta except that NH4VO3, FeCl3.6 H2O, and LaCl3.7
H2O, in place of tin (II) acetate, were used as starting material. The detailed procedures are
described elsewhere (Capek et al., 2005; Dzwigaj et al., 1998; Jia et al., 1998). For Fe-beta and
La-beta, the calcined samples were washed thoroughly with water to remove any Cl- anions, and
dried at 45 °C overnight.
3.3.3 Catalyst characterization
The method of Brunauer, Emmett, and Teller (BET) was used to determine the total surface area
of catalysts and the micro pore volume. The surface areas and pore volumes of catalysts were
determined by nitrogen adsorption at 77 K using Quantachrome automated gas sorption
68
system/Nova 2200e surface area and pore volume analyzer (Boynton Beach, Florida). The
catalyst samples were degassed in vacuum for 12 h at 200 °C before measurement. The XRD
patterns were obtained using a Bruker D8 Discover diffractometer. The spectra were acquired at
a scan rate of 1.6 degrees/min between 2 theta = 5 to 35. An accelerating voltage of 40 kV was
used at 40 mA. The SEM pictures of the catalysts were taken by a ZEISS DSM940 scanning
electron microscope.
3.3.4 Catalytic reaction procedure
All of the catalytic reactions were carried out using batch reactors made out of SS-316 tubes
with dimension of 0.75 inch ID x 1.89 inch L. For the dual catalysts experiments, the two
catalysts were premixed and placed into reactor containing glucose solution. The reactors were
filled with 2 ml of reaction mixture, sealed with screw-cap ends, and placed in a constant-
temperature oven to initiate the reaction. The reactor was preheated for 15–30 min to reach the
set temperature and maintained at the level for desired period of time. The reaction time in this
report is defined as the duration after it reached the set temperature. The reactors were shaken at
200 rpm connecting them to a laboratory arm shaker externally located. The reactors and the
shakers were connected by a rod through a hole on top of the furnace. It was done to keep the
catalyst particles uniformly suspended in the reactor maintaining vigorous solid-liquid contact.
The reactors were removed from the oven with predetermined interval and placed into ice-bath to
quench the reaction. The reaction mixture was centrifuged, and the particle-free solution was
analyzed for its composition by HPLC.
3.3.5 Catalyst stability test
The relative activity of the Sn-Beta catalyst was measured over five-consecutive isomerization
cycles at 140 °C for 20 min. After each cycle, catalyst was separated from the liquid by filtration
69
and dried without washing at 45 °C in oven for 12 h. Its relative activity was measured by
conversion of glucose over 20-minutes period. The activity test for Amberlyst-15 was carried out
slightly different way. Unlike Sn-beta, the catalyst particles were separated from the liquid after
each cycle by filtration and air-dried without washing at room temperature for 2 days. The
activity test run was then carried out adding fresh fructose solution to react at 140 °C for 1 h. The
conversion of the reactant after 1 hour was taken as the relative activity. This was done over five
cycles of batch runs. In each of the batch runs, the reaction was carried out for 8 hours at 140 °C.
3.3.6 Product analysis
Composition of the liquid samples were determined by HPLC system equipped with Bio-Rad
HPX-87H column (Hercules, CA), refractive index detector (Shodex, NY), Alcott 708
Autosampler, PeakSimple Chromatography Data Systems (Torrance, CA).
Conversion is defined as moles of feed reacted divide by the initial moles of feed in the reactor
as shown by the following equation.
Yield is defined as moles of product divided by the initial moles of feed in the reactor. LA
concentration (g/l) was converted to LA percent-yield on the basis of the theoretical maximum as
follows.
𝐶𝑜𝑛𝑣𝑒𝑟𝑠𝑖𝑜𝑛 (%) = 100 ∗(𝐼𝑛𝑖𝑡𝑖𝑎𝑙 𝑐𝑜𝑛𝑐𝑒𝑛𝑡𝑟𝑎𝑡𝑖𝑜𝑛 (
𝑔𝑙
) − 𝐹𝑖𝑛𝑎𝑙 𝑐𝑜𝑛𝑐𝑒𝑛𝑡𝑟𝑎𝑡𝑖𝑜𝑛 (𝑔𝑙
)) ∗ hexose MW
Initial hexose concentration (gl) ∗ hexose MW
𝐿𝑒𝑣𝑢𝑙𝑖𝑛𝑖𝑐 𝑎𝑐𝑖𝑑 𝑌𝑖𝑒𝑙𝑑 (%) = 100 ∗𝑙𝑒𝑣𝑢𝑙𝑖𝑛𝑖𝑐 𝑎𝑐𝑖𝑑 𝑐𝑜𝑛𝑐𝑒𝑛𝑡𝑟𝑎𝑡𝑖𝑜𝑛 (
𝑔𝑙
) ∗ hexose MW
Initial hexose concentration (gl) ∗ levulinic acid MW
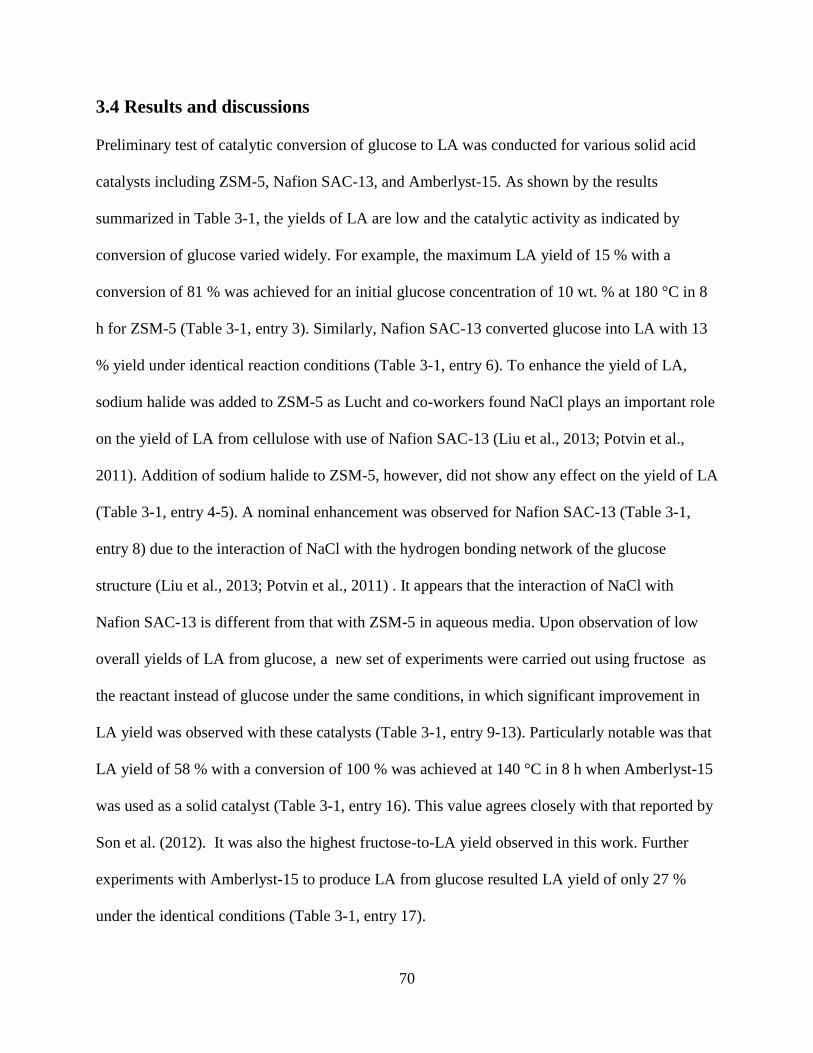
70
3.4 Results and discussions
Preliminary test of catalytic conversion of glucose to LA was conducted for various solid acid
catalysts including ZSM-5, Nafion SAC-13, and Amberlyst-15. As shown by the results
summarized in Table 3-1, the yields of LA are low and the catalytic activity as indicated by
conversion of glucose varied widely. For example, the maximum LA yield of 15 % with a
conversion of 81 % was achieved for an initial glucose concentration of 10 wt. % at 180 °C in 8
h for ZSM-5 (Table 3-1, entry 3). Similarly, Nafion SAC-13 converted glucose into LA with 13
% yield under identical reaction conditions (Table 3-1, entry 6). To enhance the yield of LA,
sodium halide was added to ZSM-5 as Lucht and co-workers found NaCl plays an important role
on the yield of LA from cellulose with use of Nafion SAC-13 (Liu et al., 2013; Potvin et al.,
2011). Addition of sodium halide to ZSM-5, however, did not show any effect on the yield of LA
(Table 3-1, entry 4-5). A nominal enhancement was observed for Nafion SAC-13 (Table 3-1,
entry 8) due to the interaction of NaCl with the hydrogen bonding network of the glucose
structure (Liu et al., 2013; Potvin et al., 2011) . It appears that the interaction of NaCl with
Nafion SAC-13 is different from that with ZSM-5 in aqueous media. Upon observation of low
overall yields of LA from glucose, a new set of experiments were carried out using fructose as
the reactant instead of glucose under the same conditions, in which significant improvement in
LA yield was observed with these catalysts (Table 3-1, entry 9-13). Particularly notable was that
LA yield of 58 % with a conversion of 100 % was achieved at 140 °C in 8 h when Amberlyst-15
was used as a solid catalyst (Table 3-1, entry 16). This value agrees closely with that reported by
Son et al. (2012). It was also the highest fructose-to-LA yield observed in this work. Further
experiments with Amberlyst-15 to produce LA from glucose resulted LA yield of only 27 %
under the identical conditions (Table 3-1, entry 17).
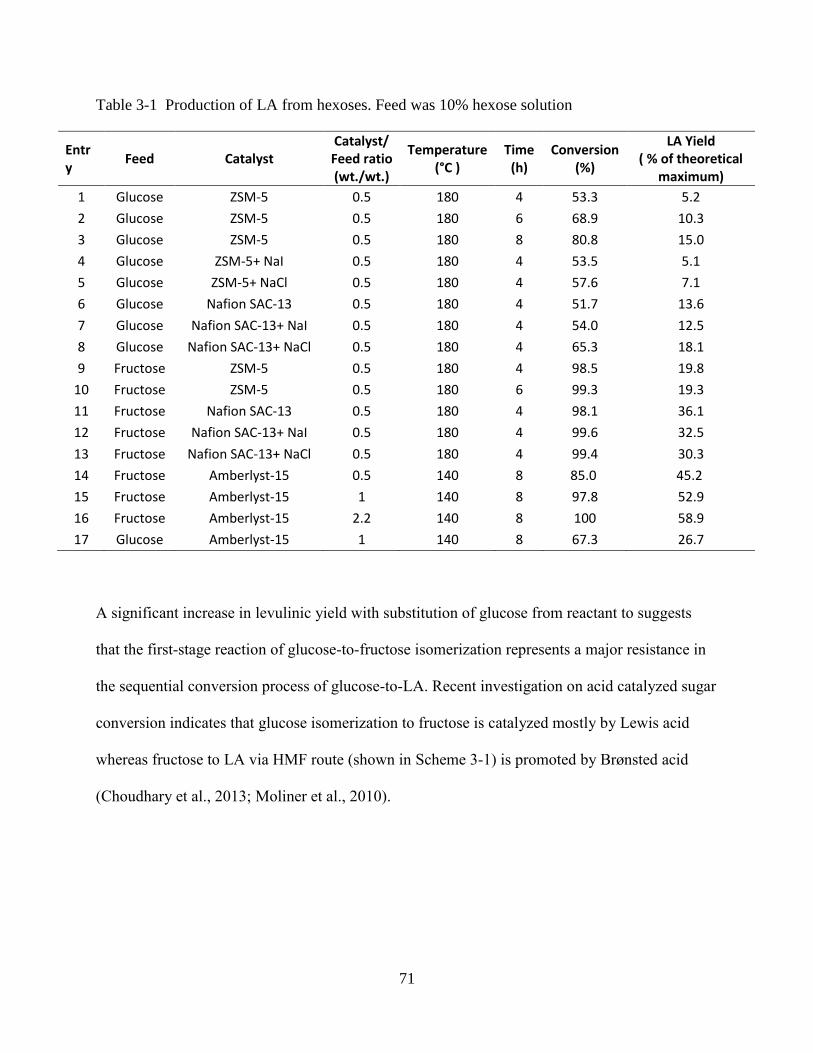
71
Table 3-1 Production of LA from hexoses. Feed was 10% hexose solution
Entry
Feed Catalyst Catalyst/ Feed ratio (wt./wt.)
Temperature (°C )
Time (h)
Conversion (%)
LA Yield ( % of theoretical
maximum)
1 Glucose ZSM-5 0.5 180 4 53.3 5.2
2 Glucose ZSM-5 0.5 180 6 68.9 10.3
3 Glucose ZSM-5 0.5 180 8 80.8 15.0
4 Glucose ZSM-5+ NaI 0.5 180 4 53.5 5.1
5 Glucose ZSM-5+ NaCl 0.5 180 4 57.6 7.1
6 Glucose Nafion SAC-13 0.5 180 4 51.7 13.6
7 Glucose Nafion SAC-13+ NaI 0.5 180 4 54.0 12.5
8 Glucose Nafion SAC-13+ NaCl 0.5 180 4 65.3 18.1
9 Fructose ZSM-5 0.5 180 4 98.5 19.8
10 Fructose ZSM-5 0.5 180 6 99.3 19.3
11 Fructose Nafion SAC-13 0.5 180 4 98.1 36.1
12 Fructose Nafion SAC-13+ NaI 0.5 180 4 99.6 32.5
13 Fructose Nafion SAC-13+ NaCl 0.5 180 4 99.4 30.3
14 Fructose Amberlyst-15 0.5 140 8 85.0 45.2
15 Fructose Amberlyst-15 1 140 8 97.8 52.9
16 Fructose Amberlyst-15 2.2 140 8 100 58.9
17 Glucose Amberlyst-15 1 140 8 67.3 26.7
A significant increase in levulinic yield with substitution of glucose from reactant to suggests
that the first-stage reaction of glucose-to-fructose isomerization represents a major resistance in
the sequential conversion process of glucose-to-LA. Recent investigation on acid catalyzed sugar
conversion indicates that glucose isomerization to fructose is catalyzed mostly by Lewis acid
whereas fructose to LA via HMF route (shown in Scheme 3-1) is promoted by Brønsted acid
(Choudhary et al., 2013; Moliner et al., 2010).
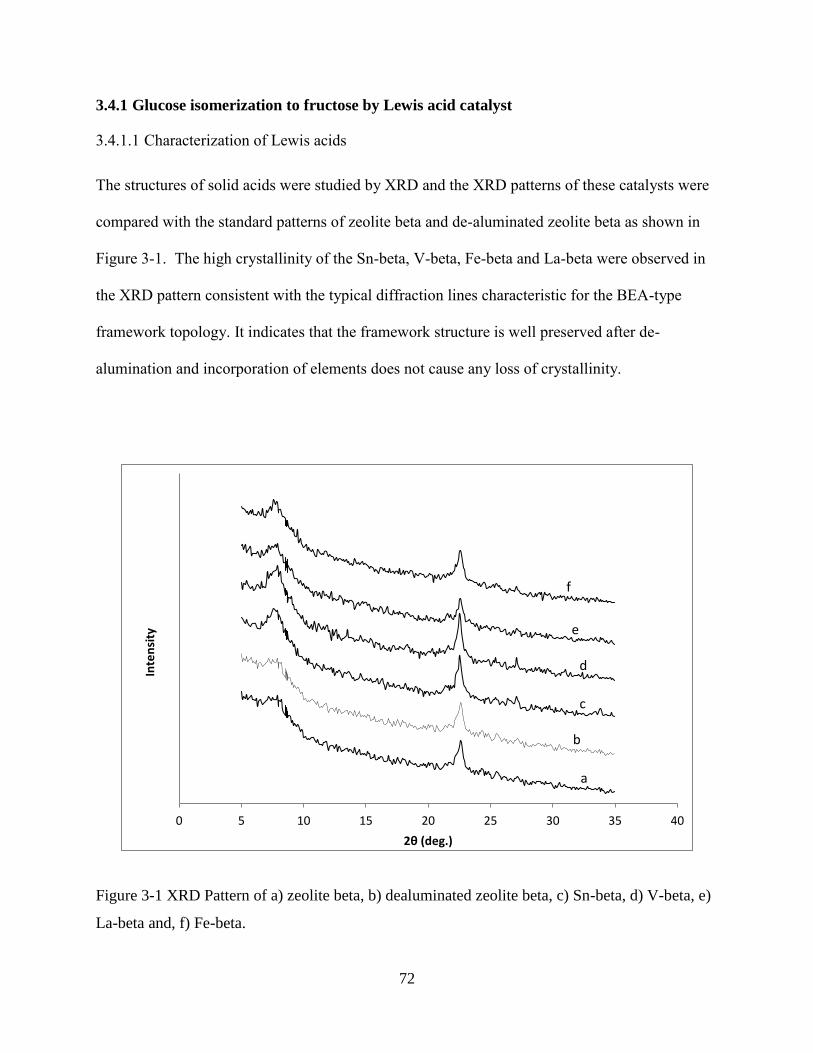
72
3.4.1 Glucose isomerization to fructose by Lewis acid catalyst
3.4.1.1 Characterization of Lewis acids
The structures of solid acids were studied by XRD and the XRD patterns of these catalysts were
compared with the standard patterns of zeolite beta and de-aluminated zeolite beta as shown in
Figure 3-1. The high crystallinity of the Sn-beta, V-beta, Fe-beta and La-beta were observed in
the XRD pattern consistent with the typical diffraction lines characteristic for the BEA-type
framework topology. It indicates that the framework structure is well preserved after de-
alumination and incorporation of elements does not cause any loss of crystallinity.
Figure 3-1 XRD Pattern of a) zeolite beta, b) dealuminated zeolite beta, c) Sn-beta, d) V-beta, e)
La-beta and, f) Fe-beta.
0 5 10 15 20 25 30 35 40
Inte
nsi
ty
2θ (deg.)
d
c
b
e
f
a
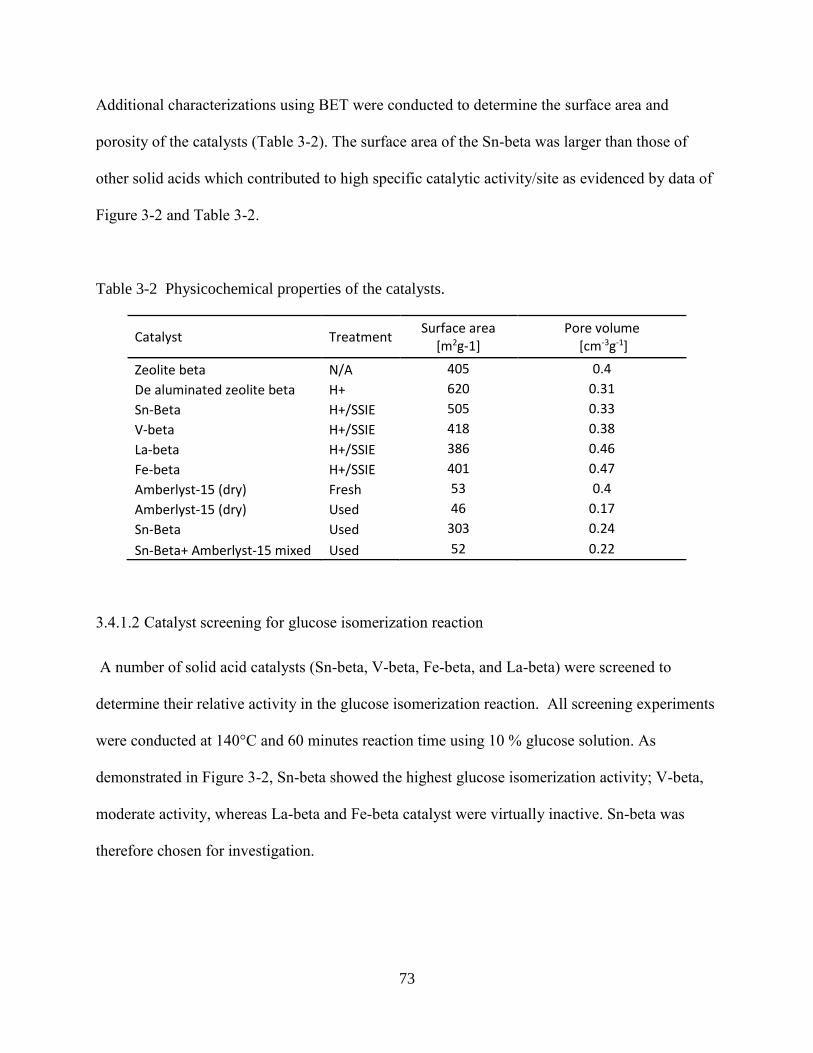
73
Additional characterizations using BET were conducted to determine the surface area and
porosity of the catalysts (Table 3-2). The surface area of the Sn-beta was larger than those of
other solid acids which contributed to high specific catalytic activity/site as evidenced by data of
Figure 3-2 and Table 3-2.
Table 3-2 Physicochemical properties of the catalysts.
Catalyst Treatment Surface area
[m2g-1] Pore volume
[cm-3g-1]
Zeolite beta N/A 405 0.4
De aluminated zeolite beta H+ 620 0.31
Sn-Beta H+/SSIE 505 0.33
V-beta H+/SSIE 418 0.38
La-beta H+/SSIE 386 0.46
Fe-beta H+/SSIE 401 0.47
Amberlyst-15 (dry) Fresh 53 0.4
Amberlyst-15 (dry) Used 46 0.17
Sn-Beta Used 303 0.24
Sn-Beta+ Amberlyst-15 mixed Used 52 0.22
3.4.1.2 Catalyst screening for glucose isomerization reaction
A number of solid acid catalysts (Sn-beta, V-beta, Fe-beta, and La-beta) were screened to
determine their relative activity in the glucose isomerization reaction. All screening experiments
were conducted at 140°C and 60 minutes reaction time using 10 % glucose solution. As
demonstrated in Figure 3-2, Sn-beta showed the highest glucose isomerization activity; V-beta,
moderate activity, whereas La-beta and Fe-beta catalyst were virtually inactive. Sn-beta was
therefore chosen for investigation.
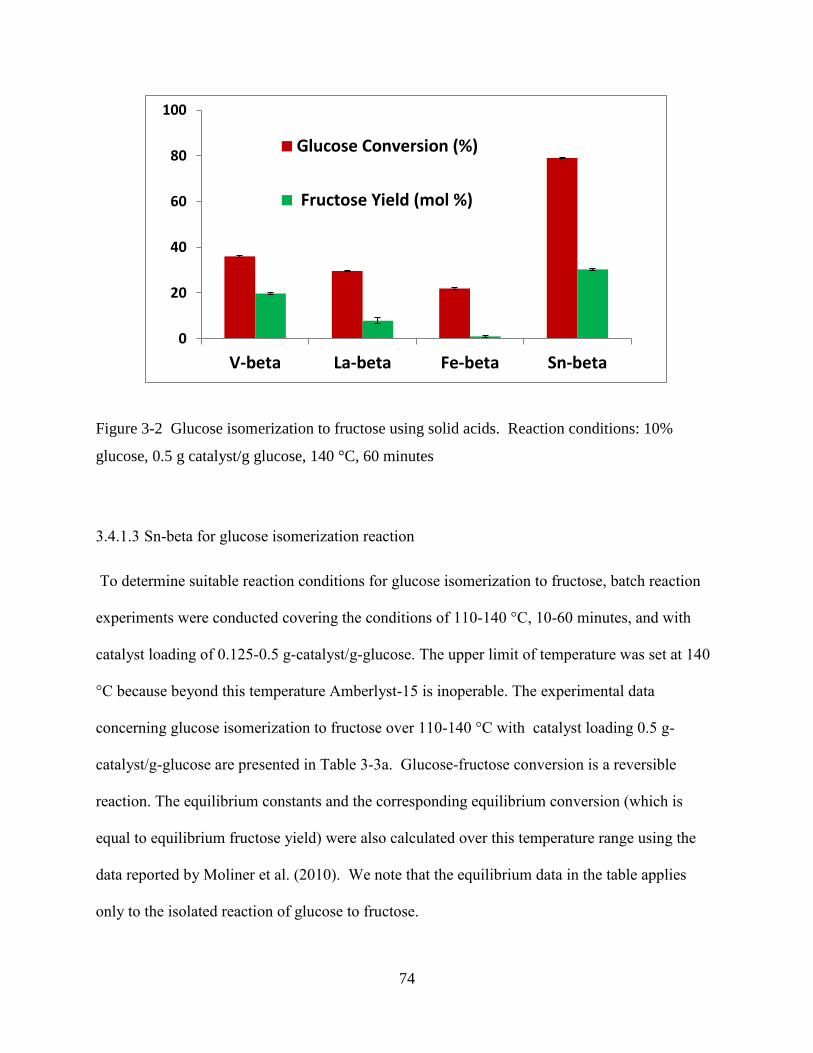
74
Figure 3-2 Glucose isomerization to fructose using solid acids. Reaction conditions: 10%
glucose, 0.5 g catalyst/g glucose, 140 °C, 60 minutes
3.4.1.3 Sn-beta for glucose isomerization reaction
To determine suitable reaction conditions for glucose isomerization to fructose, batch reaction
experiments were conducted covering the conditions of 110-140 °C, 10-60 minutes, and with
catalyst loading of 0.125-0.5 g-catalyst/g-glucose. The upper limit of temperature was set at 140
°C because beyond this temperature Amberlyst-15 is inoperable. The experimental data
concerning glucose isomerization to fructose over 110-140 °C with catalyst loading 0.5 g-
catalyst/g-glucose are presented in Table 3-3a. Glucose-fructose conversion is a reversible
reaction. The equilibrium constants and the corresponding equilibrium conversion (which is
equal to equilibrium fructose yield) were also calculated over this temperature range using the
data reported by Moliner et al. (2010). We note that the equilibrium data in the table applies
only to the isolated reaction of glucose to fructose.
0
20
40
60
80
100
V-beta La-beta Fe-beta Sn-beta
Glucose Conversion (%)
Fructose Yield (mol %)
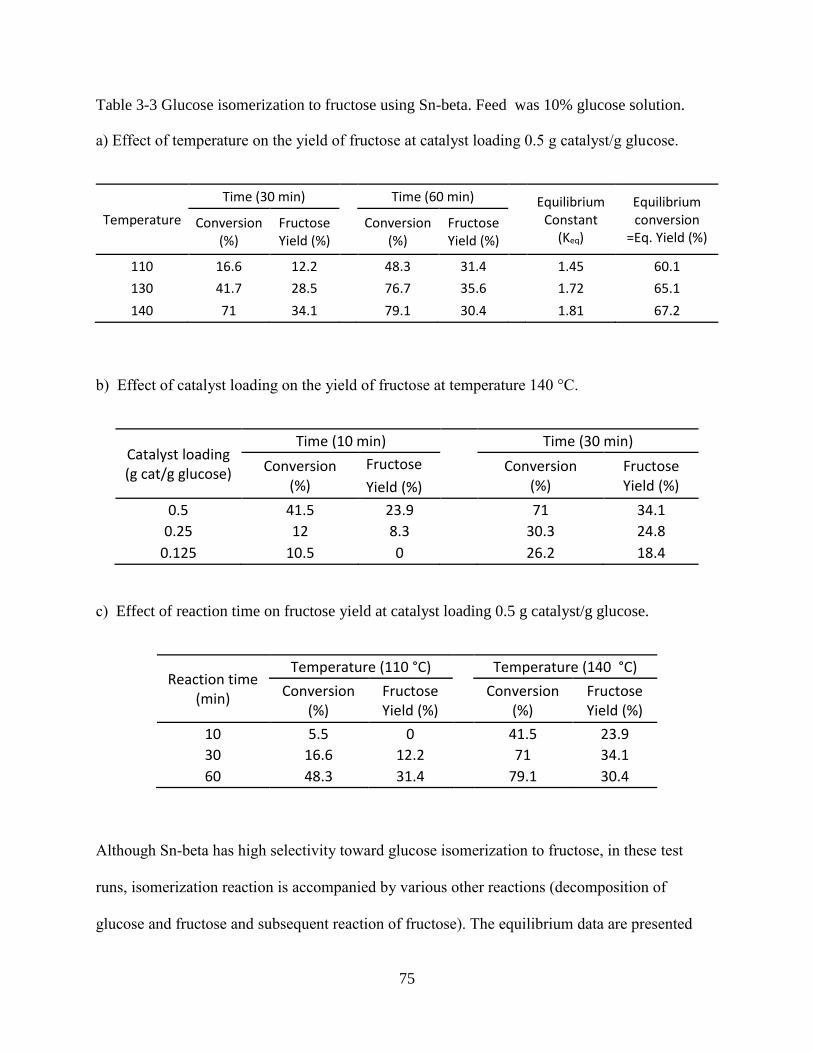
75
Table 3-3 Glucose isomerization to fructose using Sn-beta. Feed was 10% glucose solution.
a) Effect of temperature on the yield of fructose at catalyst loading 0.5 g catalyst/g glucose.
Temperature
Time (30 min) Time (60 min) Equilibrium Constant
(Keq)
Equilibrium conversion
=Eq. Yield (%) Conversion
(%) Fructose Yield (%)
Conversion
(%) Fructose Yield (%)
110 16.6 12.2 48.3 31.4 1.45 60.1
130 41.7 28.5 76.7 35.6 1.72 65.1
140 71 34.1 79.1 30.4 1.81 67.2
b) Effect of catalyst loading on the yield of fructose at temperature 140 °C.
Catalyst loading (g cat/g glucose)
Time (10 min) Time (30 min)
Conversion (%)
Fructose
Conversion (%)
Fructose Yield (%) Yield (%)
0.5 41.5 23.9 71 34.1
0.25 12 8.3 30.3 24.8
0.125 10.5 0 26.2 18.4
c) Effect of reaction time on fructose yield at catalyst loading 0.5 g catalyst/g glucose.
Reaction time (min)
Temperature (110 °C) Temperature (140 °C)
Conversion (%)
Fructose Yield (%)
Conversion
(%) Fructose Yield (%)
10 5.5 0 41.5 23.9
30 16.6 12.2 71 34.1
60 48.3 31.4 79.1 30.4
Although Sn-beta has high selectivity toward glucose isomerization to fructose, in these test
runs, isomerization reaction is accompanied by various other reactions (decomposition of
glucose and fructose and subsequent reaction of fructose). The equilibrium data are presented
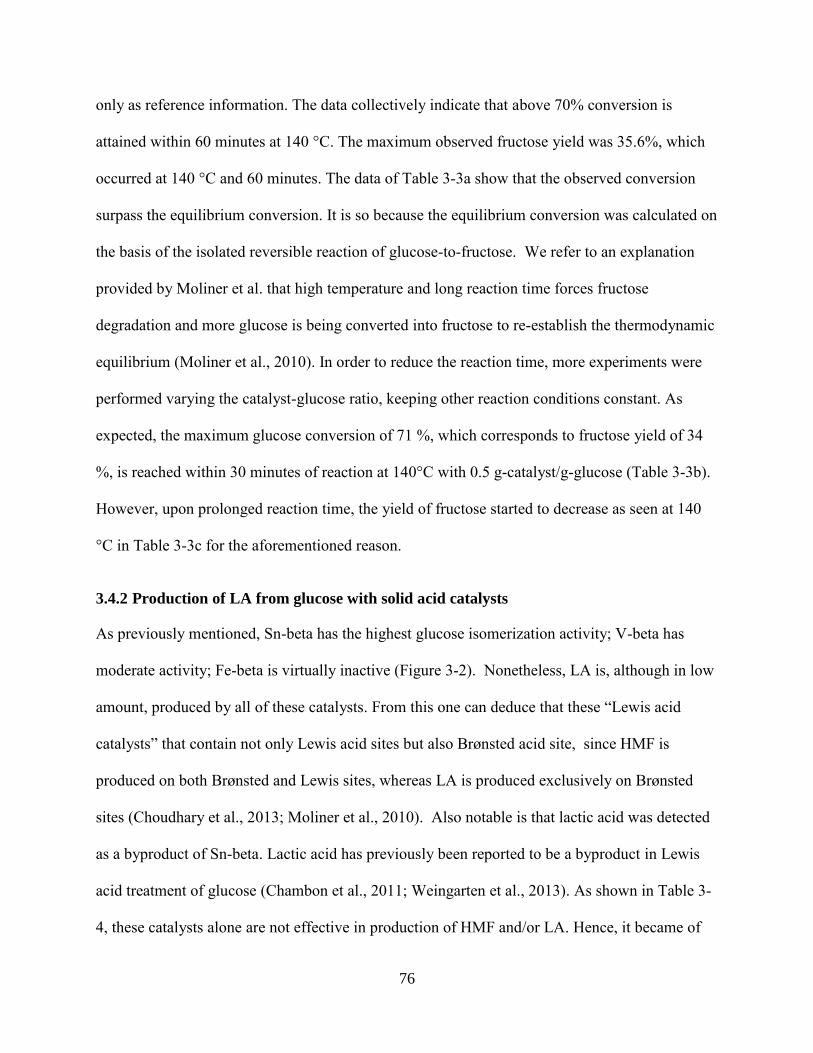
76
only as reference information. The data collectively indicate that above 70% conversion is
attained within 60 minutes at 140 °C. The maximum observed fructose yield was 35.6%, which
occurred at 140 °C and 60 minutes. The data of Table 3-3a show that the observed conversion
surpass the equilibrium conversion. It is so because the equilibrium conversion was calculated on
the basis of the isolated reversible reaction of glucose-to-fructose. We refer to an explanation
provided by Moliner et al. that high temperature and long reaction time forces fructose
degradation and more glucose is being converted into fructose to re-establish the thermodynamic
equilibrium (Moliner et al., 2010). In order to reduce the reaction time, more experiments were
performed varying the catalyst-glucose ratio, keeping other reaction conditions constant. As
expected, the maximum glucose conversion of 71 %, which corresponds to fructose yield of 34
%, is reached within 30 minutes of reaction at 140°C with 0.5 g-catalyst/g-glucose (Table 3-3b).
However, upon prolonged reaction time, the yield of fructose started to decrease as seen at 140
°C in Table 3-3c for the aforementioned reason.
3.4.2 Production of LA from glucose with solid acid catalysts
As previously mentioned, Sn-beta has the highest glucose isomerization activity; V-beta has
moderate activity; Fe-beta is virtually inactive (Figure 3-2). Nonetheless, LA is, although in low
amount, produced by all of these catalysts. From this one can deduce that these “Lewis acid
catalysts” that contain not only Lewis acid sites but also Brønsted acid site, since HMF is
produced on both Brønsted and Lewis sites, whereas LA is produced exclusively on Brønsted
sites (Choudhary et al., 2013; Moliner et al., 2010). Also notable is that lactic acid was detected
as a byproduct of Sn-beta. Lactic acid has previously been reported to be a byproduct in Lewis
acid treatment of glucose (Chambon et al., 2011; Weingarten et al., 2013). As shown in Table 3-
4, these catalysts alone are not effective in production of HMF and/or LA. Hence, it became of
77
our interest to use the Lewis solid acids jointly with Amberlyst-15 that has been proven to be
highly effective in production of LA from fructose.
Table 3-4 Glucose transformation to LA using solid acids. Reaction conditions: 10% glucose,
catalyst loading 0.5 g catalyst/g glucose. a fructose as a starting material instead of glucose.
Catalyst Temperature
(° C ) Time
(h) Conversion
(%) LA Yield (mol %)
HMF Yield (mol %)
Lactic Acid Yield (mol%)
Sn-beta 140 8 88.7 2.9 9.8 9.7
Sn-beta 140 16 92.7 4.7 7.2 4.2
Sn-beta a 140 8 96.3 7.7 2.6 10.2
Sn-beta a 140 16 94.4 7.9 4.3 6.9
Fe-beta 140 8 76.0 11.4 0.0 0.0
Fe-beta 140 16 91.0 18.1 0.0 0.0
V-beta 140 8 77.0 11.8 0.0 0.0
V-beta 140 16 92.8 18.8 0.0 0.0
To see the effect of the Lewis acid and Amberlyst-15 ratio on the reactions, a series of
experiments were carried out applying varying ratio of the catalysts. From the results of these
experiments the optimum ratio that maximizes the synergetic effect was determined to be 10
(Amberlysi-15/Sn-beta). In order to assess the effectiveness of the combined solid-solid catalyst
system in production of LA from glucose, another series of batch experiments were performed
and the results were compared with those of Amberlyst-15 alone. The experiments were carried
out at 140 °C, for 12 hours using 10 % glucose solution with catalyst loading of 2.2 g-cat./g-
glucose. As shown in Figure 3-3, the most effective dual-catalysts was found to be Sn-beta and
Amberlyst-15 that has shown LA yield of 41 % of the theoretical maximum.
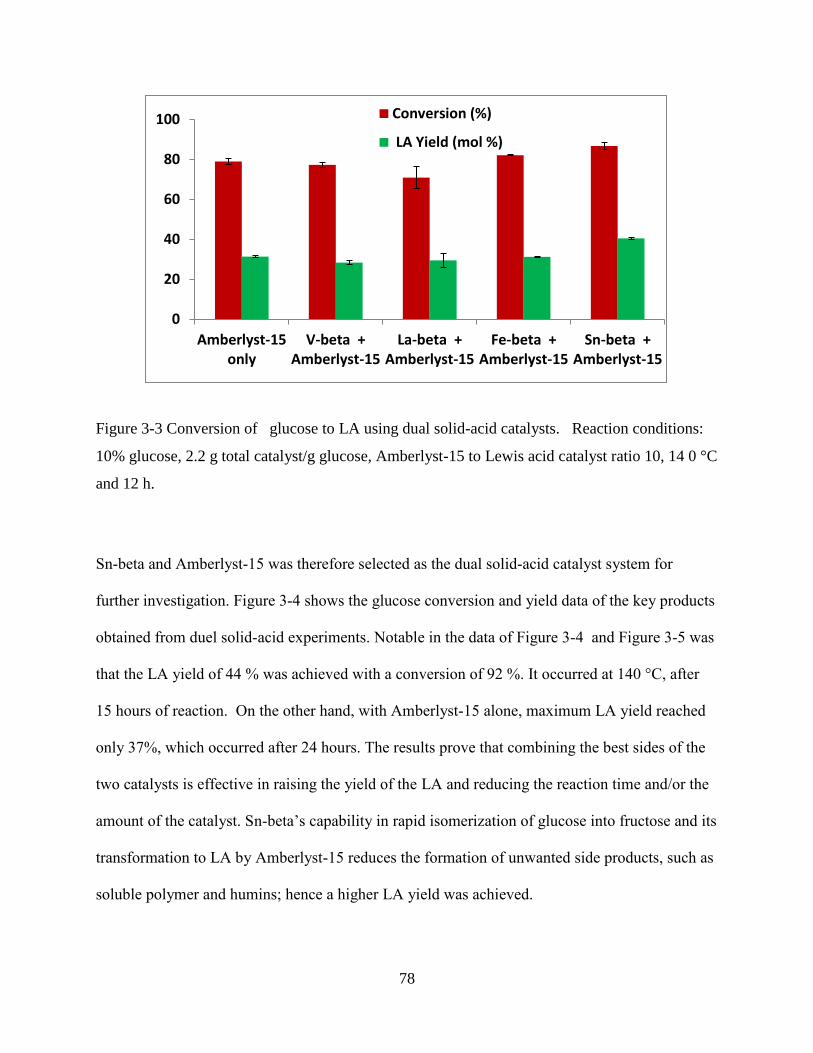
78
Figure 3-3 Conversion of glucose to LA using dual solid-acid catalysts. Reaction conditions:
10% glucose, 2.2 g total catalyst/g glucose, Amberlyst-15 to Lewis acid catalyst ratio 10, 14 0 °C
and 12 h.
Sn-beta and Amberlyst-15 was therefore selected as the dual solid-acid catalyst system for
further investigation. Figure 3-4 shows the glucose conversion and yield data of the key products
obtained from duel solid-acid experiments. Notable in the data of Figure 3-4 and Figure 3-5 was
that the LA yield of 44 % was achieved with a conversion of 92 %. It occurred at 140 °C, after
15 hours of reaction. On the other hand, with Amberlyst-15 alone, maximum LA yield reached
only 37%, which occurred after 24 hours. The results prove that combining the best sides of the
two catalysts is effective in raising the yield of the LA and reducing the reaction time and/or the
amount of the catalyst. Sn-beta’s capability in rapid isomerization of glucose into fructose and its
transformation to LA by Amberlyst-15 reduces the formation of unwanted side products, such as
soluble polymer and humins; hence a higher LA yield was achieved.
0
20
40
60
80
100
Amberlyst-15only
V-beta +Amberlyst-15
La-beta +Amberlyst-15
Fe-beta +Amberlyst-15
Sn-beta +Amberlyst-15
Conversion (%)
LA Yield (mol %)
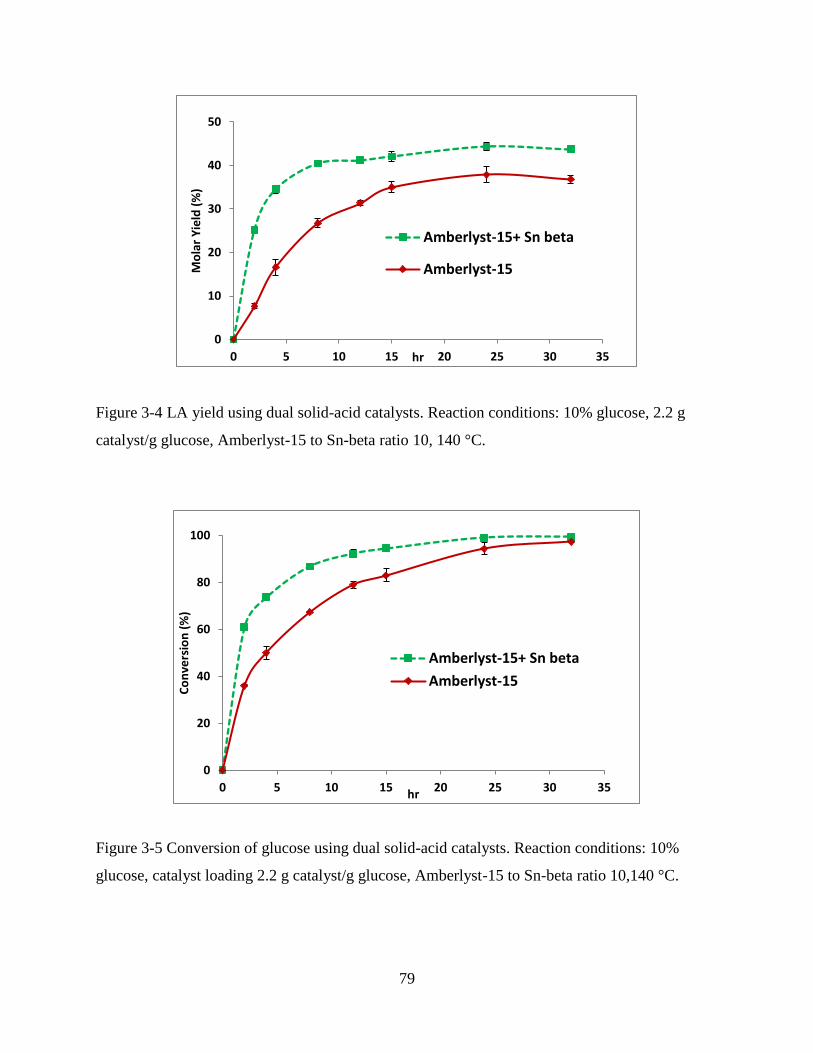
79
Figure 3-4 LA yield using dual solid-acid catalysts. Reaction conditions: 10% glucose, 2.2 g
catalyst/g glucose, Amberlyst-15 to Sn-beta ratio 10, 140 °C.
Figure 3-5 Conversion of glucose using dual solid-acid catalysts. Reaction conditions: 10%
glucose, catalyst loading 2.2 g catalyst/g glucose, Amberlyst-15 to Sn-beta ratio 10,140 °C.
0
10
20
30
40
50
0 5 10 15 20 25 30 35
Mo
lar
Yie
ld (
%)
hr
Amberlyst-15+ Sn beta
Amberlyst-15
0
20
40
60
80
100
0 5 10 15 20 25 30 35
Co
nve
rsio
n (
%)
hr
Amberlyst-15+ Sn beta
Amberlyst-15
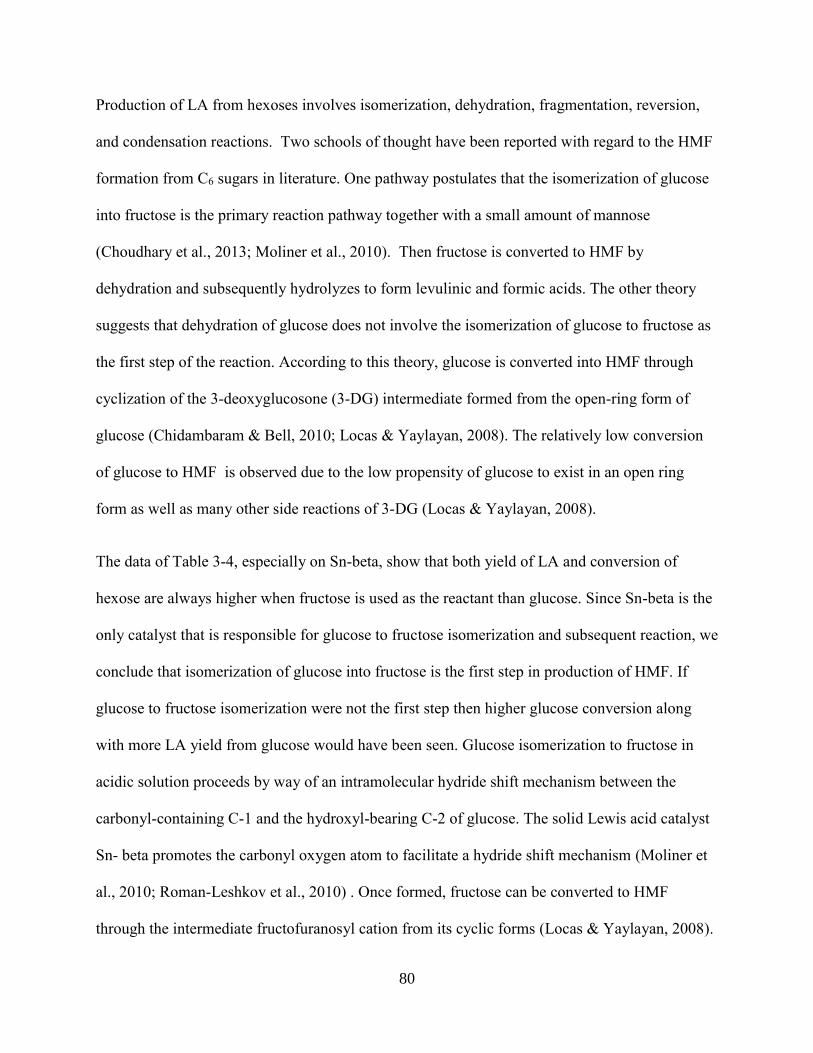
80
Production of LA from hexoses involves isomerization, dehydration, fragmentation, reversion,
and condensation reactions. Two schools of thought have been reported with regard to the HMF
formation from C6 sugars in literature. One pathway postulates that the isomerization of glucose
into fructose is the primary reaction pathway together with a small amount of mannose
(Choudhary et al., 2013; Moliner et al., 2010). Then fructose is converted to HMF by
dehydration and subsequently hydrolyzes to form levulinic and formic acids. The other theory
suggests that dehydration of glucose does not involve the isomerization of glucose to fructose as
the first step of the reaction. According to this theory, glucose is converted into HMF through
cyclization of the 3-deoxyglucosone (3-DG) intermediate formed from the open-ring form of
glucose (Chidambaram & Bell, 2010; Locas & Yaylayan, 2008). The relatively low conversion
of glucose to HMF is observed due to the low propensity of glucose to exist in an open ring
form as well as many other side reactions of 3-DG (Locas & Yaylayan, 2008).
The data of Table 3-4, especially on Sn-beta, show that both yield of LA and conversion of
hexose are always higher when fructose is used as the reactant than glucose. Since Sn-beta is the
only catalyst that is responsible for glucose to fructose isomerization and subsequent reaction, we
conclude that isomerization of glucose into fructose is the first step in production of HMF. If
glucose to fructose isomerization were not the first step then higher glucose conversion along
with more LA yield from glucose would have been seen. Glucose isomerization to fructose in
acidic solution proceeds by way of an intramolecular hydride shift mechanism between the
carbonyl-containing C-1 and the hydroxyl-bearing C-2 of glucose. The solid Lewis acid catalyst
Sn- beta promotes the carbonyl oxygen atom to facilitate a hydride shift mechanism (Moliner et
al., 2010; Roman-Leshkov et al., 2010) . Once formed, fructose can be converted to HMF
through the intermediate fructofuranosyl cation from its cyclic forms (Locas & Yaylayan, 2008).
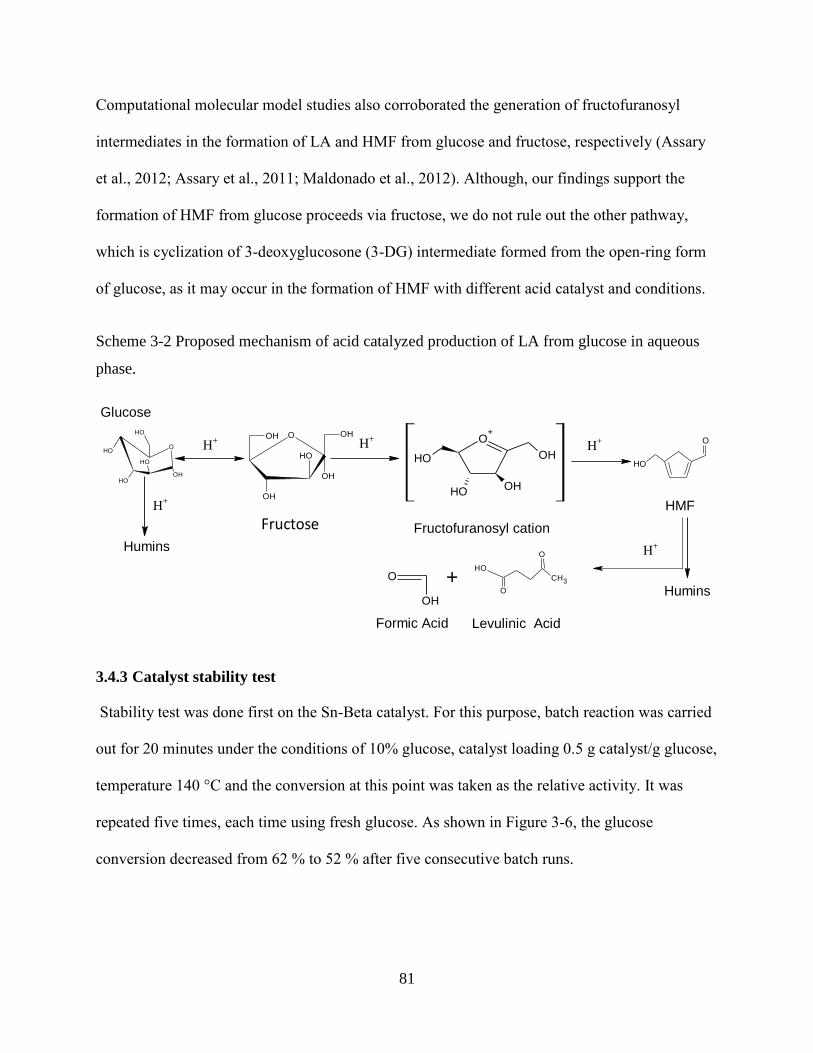
81
Computational molecular model studies also corroborated the generation of fructofuranosyl
intermediates in the formation of LA and HMF from glucose and fructose, respectively (Assary
et al., 2012; Assary et al., 2011; Maldonado et al., 2012). Although, our findings support the
formation of HMF from glucose proceeds via fructose, we do not rule out the other pathway,
which is cyclization of 3-deoxyglucosone (3-DG) intermediate formed from the open-ring form
of glucose, as it may occur in the formation of HMF with different acid catalyst and conditions.
Scheme 3-2 Proposed mechanism of acid catalyzed production of LA from glucose in aqueous
phase.
OH
OH
O
OH
OH
OH
O
OH
OH
O
O
CH3+
Humins
Humins
H+
H+H+
H+
Glucose
Fructofuranosyl cation
Levulinic AcidFormic Acid
O
OH
OH
OH
OH
OH
Fructose
O+
OH
OHOH
OH
HMF
O
OH
H+
3.4.3 Catalyst stability test
Stability test was done first on the Sn-Beta catalyst. For this purpose, batch reaction was carried
out for 20 minutes under the conditions of 10% glucose, catalyst loading 0.5 g catalyst/g glucose,
temperature 140 °C and the conversion at this point was taken as the relative activity. It was
repeated five times, each time using fresh glucose. As shown in Figure 3-6, the glucose
conversion decreased from 62 % to 52 % after five consecutive batch runs.
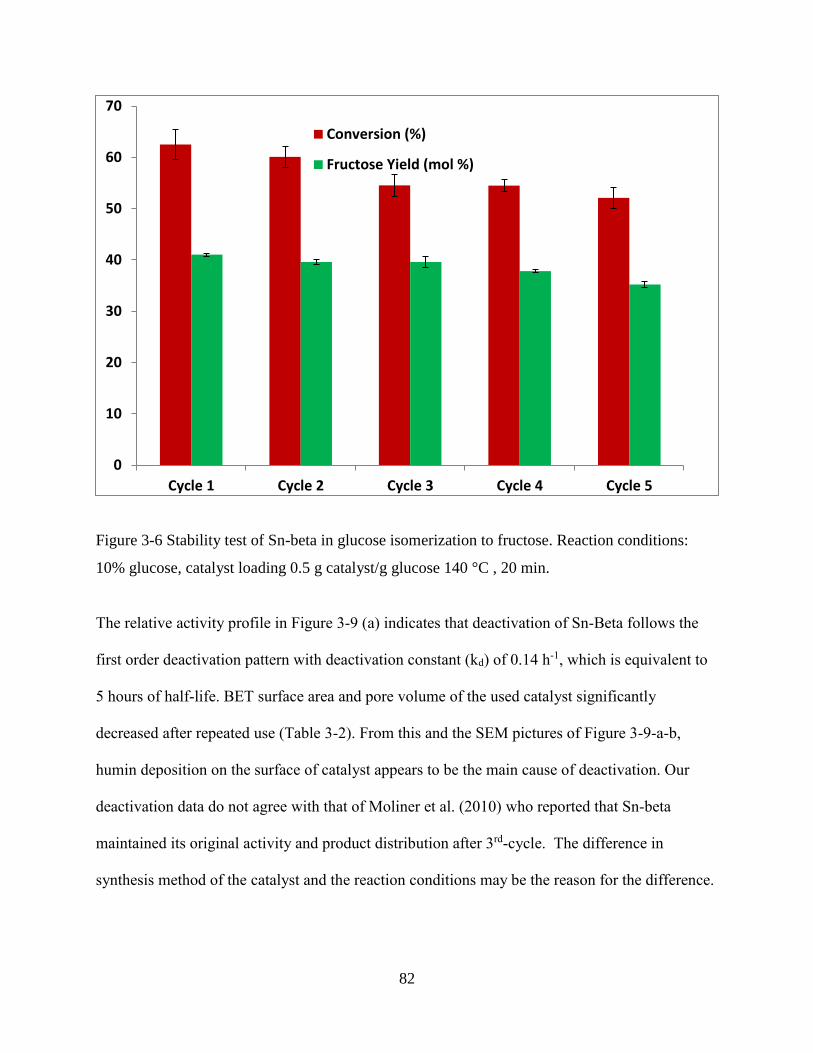
82
Figure 3-6 Stability test of Sn-beta in glucose isomerization to fructose. Reaction conditions:
10% glucose, catalyst loading 0.5 g catalyst/g glucose 140 °C , 20 min.
The relative activity profile in Figure 3-9 (a) indicates that deactivation of Sn-Beta follows the
first order deactivation pattern with deactivation constant (kd) of 0.14 h-1, which is equivalent to
5 hours of half-life. BET surface area and pore volume of the used catalyst significantly
decreased after repeated use (Table 3-2). From this and the SEM pictures of Figure 3-9-a-b,
humin deposition on the surface of catalyst appears to be the main cause of deactivation. Our
deactivation data do not agree with that of Moliner et al. (2010) who reported that Sn-beta
maintained its original activity and product distribution after 3rd-cycle. The difference in
synthesis method of the catalyst and the reaction conditions may be the reason for the difference.
0
10
20
30
40
50
60
70
Cycle 1 Cycle 2 Cycle 3 Cycle 4 Cycle 5
Conversion (%)
Fructose Yield (mol %)
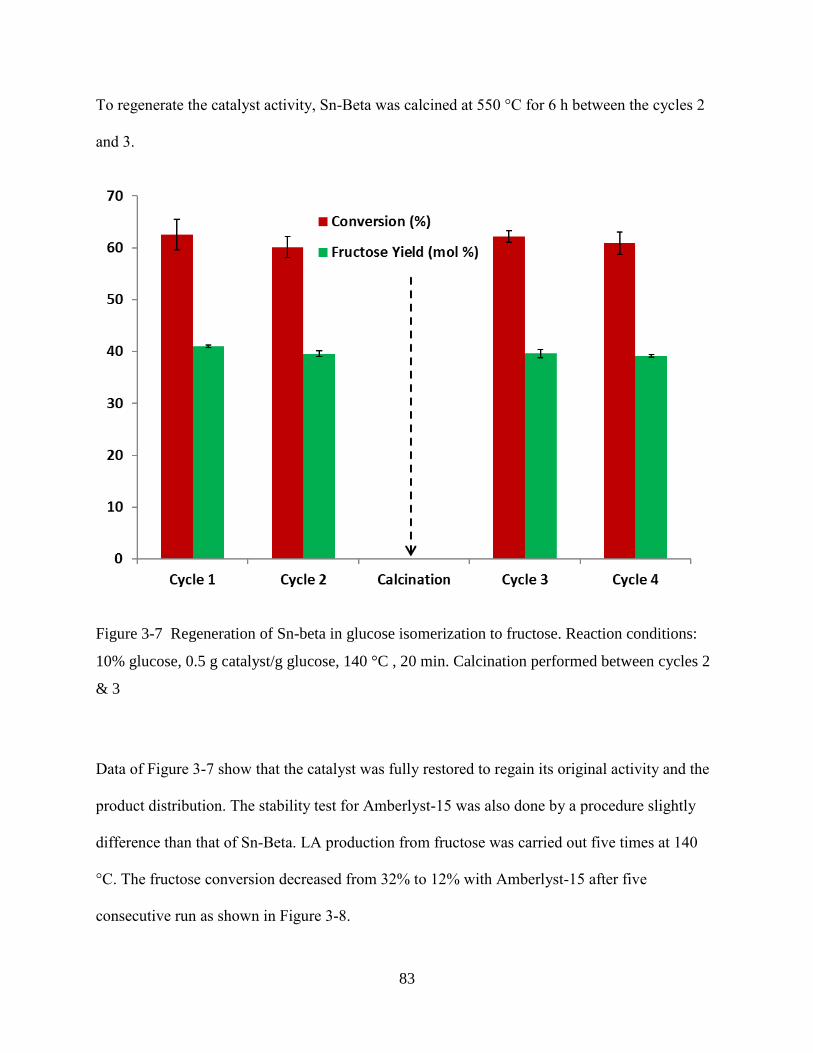
83
To regenerate the catalyst activity, Sn-Beta was calcined at 550 °C for 6 h between the cycles 2
and 3.
Figure 3-7 Regeneration of Sn-beta in glucose isomerization to fructose. Reaction conditions:
10% glucose, 0.5 g catalyst/g glucose, 140 °C , 20 min. Calcination performed between cycles 2
& 3
Data of Figure 3-7 show that the catalyst was fully restored to regain its original activity and the
product distribution. The stability test for Amberlyst-15 was also done by a procedure slightly
difference than that of Sn-Beta. LA production from fructose was carried out five times at 140
°C. The fructose conversion decreased from 32% to 12% with Amberlyst-15 after five
consecutive run as shown in Figure 3-8.
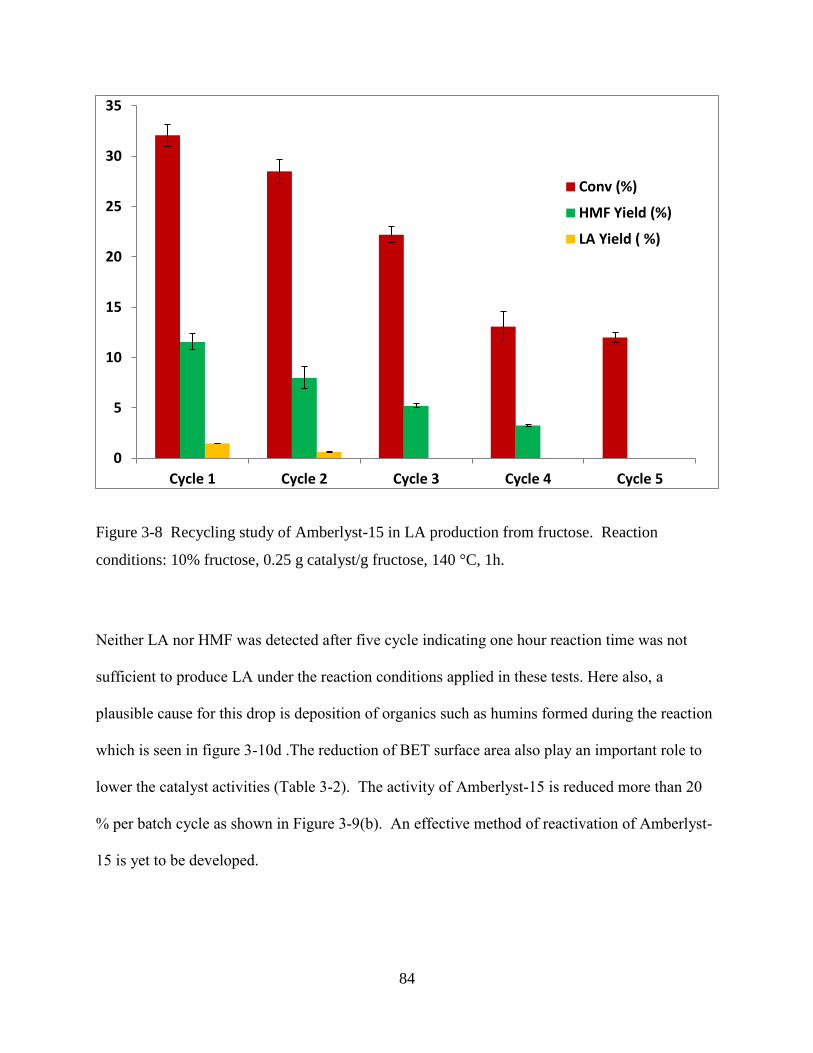
84
Figure 3-8 Recycling study of Amberlyst-15 in LA production from fructose. Reaction
conditions: 10% fructose, 0.25 g catalyst/g fructose, 140 °C, 1h.
Neither LA nor HMF was detected after five cycle indicating one hour reaction time was not
sufficient to produce LA under the reaction conditions applied in these tests. Here also, a
plausible cause for this drop is deposition of organics such as humins formed during the reaction
which is seen in figure 3-10d .The reduction of BET surface area also play an important role to
lower the catalyst activities (Table 3-2). The activity of Amberlyst-15 is reduced more than 20
% per batch cycle as shown in Figure 3-9(b). An effective method of reactivation of Amberlyst-
15 is yet to be developed.
0
5
10
15
20
25
30
35
Cycle 1 Cycle 2 Cycle 3 Cycle 4 Cycle 5
Conv (%)
HMF Yield (%)
LA Yield ( %)
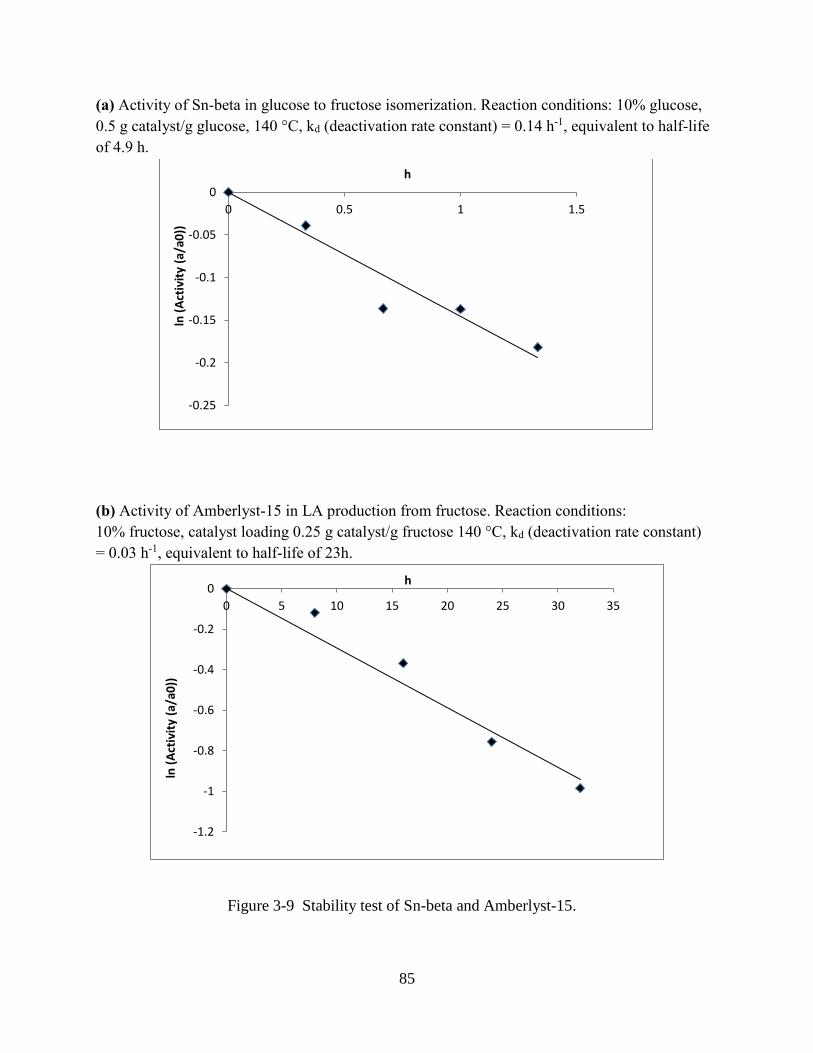
85
(a) Activity of Sn-beta in glucose to fructose isomerization. Reaction conditions: 10% glucose,
0.5 g catalyst/g glucose, 140 °C, kd (deactivation rate constant) = 0.14 h-1, equivalent to half-life
of 4.9 h.
(b) Activity of Amberlyst-15 in LA production from fructose. Reaction conditions:
10% fructose, catalyst loading 0.25 g catalyst/g fructose 140 °C, kd (deactivation rate constant)
= 0.03 h-1, equivalent to half-life of 23h.
Figure 3-9 Stability test of Sn-beta and Amberlyst-15.
-0.25
-0.2
-0.15
-0.1
-0.05
0
0 0.5 1 1.5
ln (
Act
ivit
y (a
/a0
))h
-1.2
-1
-0.8
-0.6
-0.4
-0.2
0
0 5 10 15 20 25 30 35
ln (
Act
ivit
y (a
/a0
))
h
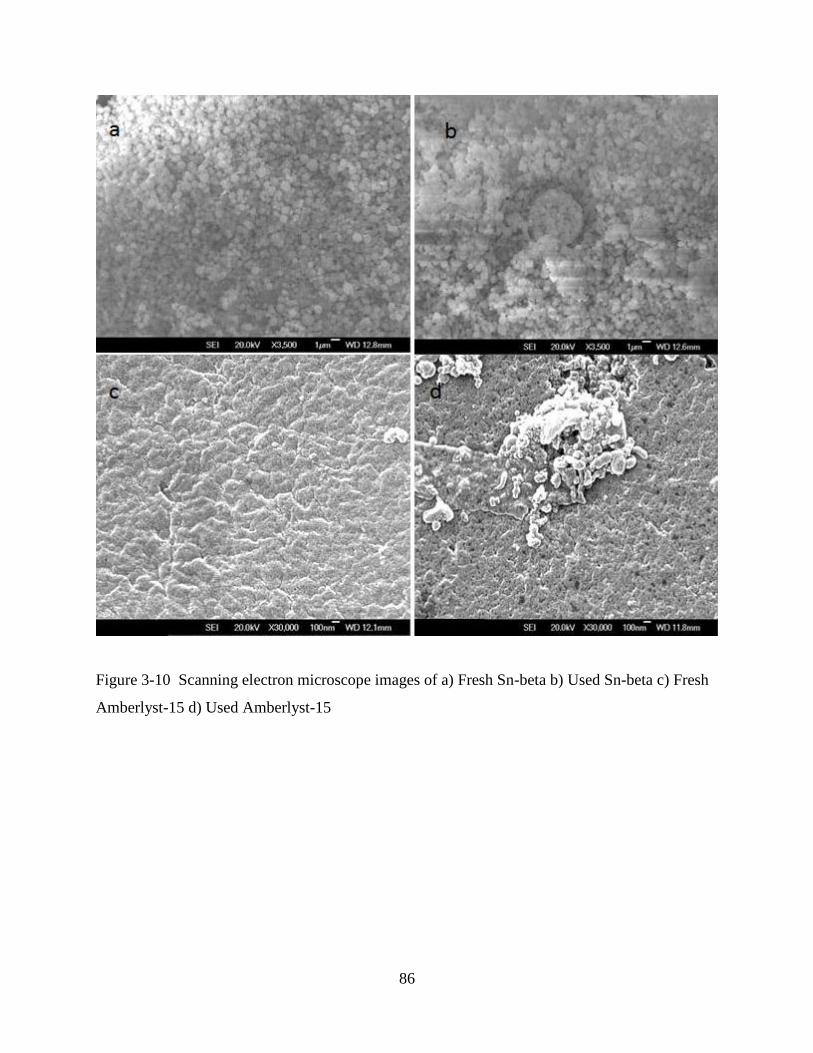
86
Figure 3-10 Scanning electron microscope images of a) Fresh Sn-beta b) Used Sn-beta c) Fresh
Amberlyst-15 d) Used Amberlyst-15
87
3.5 Conclusions
Acid-catalyzed synthesis of LA from glucose involves a number of sequential and branching
reactions including isomerization, dehydration, and rehydration. A cation exchange resin,
Amberlyst-15, is a proven solid-acid catalyst capable of converting glucose into LA. It is
primarily a Brønsted acid, but also carries limited Lewis acid sites. Its low Lewis acid activity
limits the yield of LA to the level of 37% of the theoretical maximum. As a means to improve
the product yield, Sn-Beta embodied on large-pore Zeolite was synthesized and found to be
highly effective in the glucose isomerization to fructose, a rate-limiting step in the overall
conversion process. Concurrent use of this catalyst along with Amberlyst-15 significantly
improved the yield of LA over that of Amberlyst alone, from 37% to 44%. Stability study has
shown that both of these catalysts deactivates during the reaction, showing the respective
deactivation rate constants of 0.14 h-1 and 0.03 h-1 for Sn-beta and Amberlyst-15. The main
cause of deactivation was humin deposit on the surface of catalyst surface for both catalysts.
Activity of Sn-Beta can be fully recovered by calcination.
88
Chapter 4
Simultaneous saccharification and co-fermentation of paper mill
sludge mixed with hemp hurd for the production of lactic acid
4.1 Abstract
Mixture of paper mill sludge and hemp hurd, was investigated as a raw material for lactic acid
production by way of simultaneous saccharification and co-fermentation (SSCF). Hemp hurd is an
industrial waste material generated during pulping of hemp for bast fiber production. The SSCF
was carried out employing Cellic C-Tec2 enzyme and Lactobacillus pentosus (ATCC-8041)
without pH control utilizing the ash content existing in the sludge (primarily calcium carbonate)
as a neutralizing reagent. Calcium lactate is therefore obtained as the end product of the SSCF.
The neutralizing capacity of the ash in the sludge is high enough to accommodate additional
lignocellulosic feedstock. From SSCF experiments applying various ratio of the two solid
feedstocks, the sludge to hemp hurd ratio of 3:1 was found to be the minimum in that it maintains
the pH at near optimum and provided highest lactic acid yield. From multiple runs of SSCF, lactic
acid concentration of 52-67 g/L and lactic acid yield of 0.69-0.82 g/g sugars were achieved from
the mixed feed under the conditions of 10-12 % solid loading and 15 FPU/g-glucan enzyme
loading.
89
4.2 Introduction
Lactic Acid is an important industrial commodity with large and fast growing market due to its
widespread applications, mainly in food, chemical, cosmetic, and pharmaceutical industries (Xu
et al., 2006). Currently, most lactic acid is produced by microbial fermentation of carbohydrates
due to low temperature, low energy consumption, and high product specificity as it produces a
desired stereoisomer, optically pure L-(+)- or D-(−)-lactic acid when the appropriate
microorganism is selected as the lactic acid producer (John et al., 2007). The main obstacle for the
fermentative production of lactic acid is the high cost of feedstocks (Abdel-Rahman et al., 2013).
Therefore, lignocellulosic feedstocks are promising for lactic acid production. However, the
biochemical conversion of lignocellulosic feedstock requires several processing steps to convert
structural carbohydrates to monomeric sugars, e.g., glucose, xylose, arabinose, and mannose.
These monomeric sugars can be fermented to lactic acid through different types of microorganisms
(Abdel-Rahman et al., 2013).
The main objective of this study is to utilize wastes materials, especially available from pulp and
paper plants to reduce the raw material cost. Among the various wastes from pulp and plants, paper
mill sludge, emerge as the most attractive feedstock as it has a number of advantages (Shi et al.,
2015). Being a waste material, the cost of disposal is about $20-$50 per wet ton sludge (Kang et
al., 2010). Sludge can be biologically converted to value-added products without pretreatment due
to its high carbohydrate content and well-dispersed structure (Guan et al., 2016). Pretreatment is
one of the major cost factors in bioconversion of lignocellulosic materials. Its elimination can
significantly reduce the processing cost (Kim et al., 2003). Hemp hurd, available as a waste
material from bast fibers production which is currently discarded as solid waste, can also be
considered as a promising feedstock for lactic acid production due to its greater sustainability and
90
low cost compared to refined sugars (Gandolfi et al., 2015). Comparing to the paper mill sludge,
raw hemp hurd consists of a similar amount of cellulose (40-45%) but a much higher amount of
hemicellulose (around 18-24%). Due to lower degree of cellulose polymerization and crystallinity
the treated hemp hurd might be somewhat amenable for bioconversion without further
pretreatment same as paper mill sludge (Gandolfi et al., 2013).
A large number of studies related to lactic acid fermentation through Simultaneous saccharification
and fermentation (SSF) using Lactobacillus (LAB) from lignocellulosic feedstocks have been
investigated (Abdel-Rahman et al., 2011; Bustos et al., 2005; Monteagudo et al., 1997; Zhu et al.,
2007). The growth of LAB i.e. lactic acid production is significantly affected by pH, nutrient
concentration, substrate concentration, products concentration, and temperature (Abdel-Rahman
et al., 2011). For an example, low pH has an inhibitory effect on cellular metabolism and lactic
acid production (Adachi et al., 1998). Hence, neutralizing agents such as calcium carbonate,
sodium hydroxide, or ammonium hydroxide must be added to keep the pH at a constant value in
order to reduce the inhibitory effects of low pH (Hofvendahl & Hahn-Hagerdal, 2000). Since paper
mill sludge is a pretreated material from Kraft pulping, which contains mainly glucan, xylan and
ash (CaCO3), we hypothesize that both glucan and xylan can be directly converted into lactic acid
in a SSF process without pH control. Besides, treated hemp hurd which contain mostly glucan can
be converted into lactic acid using sludge CaCO3 as a buffer reagent simultaneously.
In this study, we explored a novel process scheme wherein the two different carbohydrate
resources available from pulp mills are biologically converted to lactic acid. Here, we used three
different mixing schemes such as sludge rich mixture (sludge and hemp hurd = 75:25), equal
mixture (sludge and hemp hurd = 50:50), and hemp hurd-rich mixture (sludge and hemp hurd =
25:75). The main objective of this study is to investigate the technical feasibility of one-step
91
bioconversion of mixed feedstock into lactic acid through simultaneous saccharification and co-
fermentation (SSCF).
4.3 Materials and Methods
4.3.1 Feedstock and reagents
The paper mill sludges were collected a Kraft paper mill in Alabama. Two different types of
sludges were used in the study. The primary sludge which was collected from the primary
wastewater clarifier unit was a discharge from the paper machine and the digester and the deink
sludge also known as recycle sludge was obtained from reprocessing unit (Kang et al., 2010) Hemp
hurd and pretreated hemp hurd, provided by Pure Vision Technology Inc. (Fort Lupton, CO), were
examined in this work. Hemp hurd were pretreated by soaking in 2% (w/w) sodium hydroxide
solution at 200 °C for 10 minutes and pretreatment was done at Fort Lupton location. All the
feedstocks as received were stored in 4 °C until further analysis. The chemical compositions of
paper mill sludge and hemp hurd were determined according to the NREL standard procedure
(NREL/TP-510-42618). Lactic acid, glucose, xylose, acetic acid, used in this study purchased from
VWR (Radnor, PA) were of analytical grade and used without purification. Recycle sludge and
pretreated hemp hurd are termed as sludge and hemp hurd, respectively hereafter.
4.3.2 Enzymes and microorganism
The cellulose enzyme (Cellic C-Tec 2), a generous gift from Novozymes (North America,
Franklinton, NC), having specific enzyme activity of 119 FPU/mL and total protein number of 255
mg protein/mL was applied to feedstocks. Lactobacillus pentosus (ATCC-8041), purchased from
American Type Culture Collection (ATCC), was used as the microorganism in the SSCF.
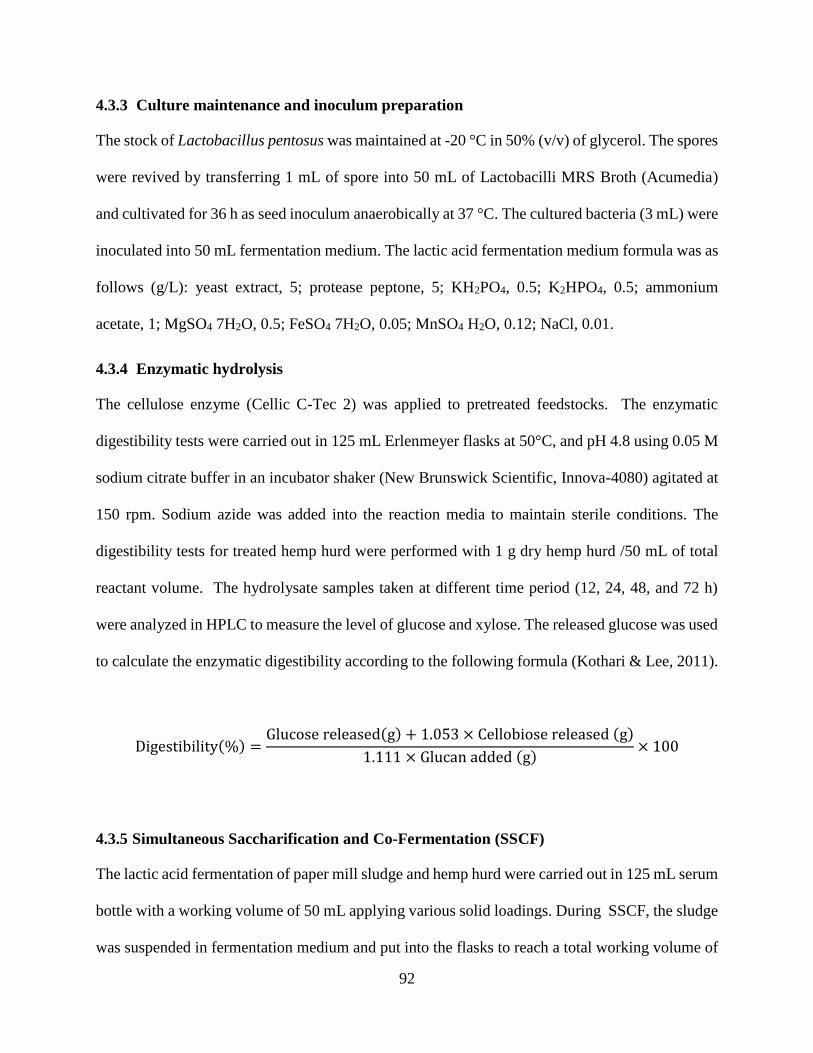
92
4.3.3 Culture maintenance and inoculum preparation
The stock of Lactobacillus pentosus was maintained at -20 °C in 50% (v/v) of glycerol. The spores
were revived by transferring 1 mL of spore into 50 mL of Lactobacilli MRS Broth (Acumedia)
and cultivated for 36 h as seed inoculum anaerobically at 37 °C. The cultured bacteria (3 mL) were
inoculated into 50 mL fermentation medium. The lactic acid fermentation medium formula was as
follows (g/L): yeast extract, 5; protease peptone, 5; KH2PO4, 0.5; K2HPO4, 0.5; ammonium
acetate, 1; MgSO4 7H2O, 0.5; FeSO4 7H2O, 0.05; MnSO4 H2O, 0.12; NaCl, 0.01.
4.3.4 Enzymatic hydrolysis
The cellulose enzyme (Cellic C-Tec 2) was applied to pretreated feedstocks. The enzymatic
digestibility tests were carried out in 125 mL Erlenmeyer flasks at 50°C, and pH 4.8 using 0.05 M
sodium citrate buffer in an incubator shaker (New Brunswick Scientific, Innova-4080) agitated at
150 rpm. Sodium azide was added into the reaction media to maintain sterile conditions. The
digestibility tests for treated hemp hurd were performed with 1 g dry hemp hurd /50 mL of total
reactant volume. The hydrolysate samples taken at different time period (12, 24, 48, and 72 h)
were analyzed in HPLC to measure the level of glucose and xylose. The released glucose was used
to calculate the enzymatic digestibility according to the following formula (Kothari & Lee, 2011).
Digestibility(%) =Glucose released(g) + 1.053 × Cellobiose released (g)
1.111 × Glucan added (g)× 100
4.3.5 Simultaneous Saccharification and Co-Fermentation (SSCF)
The lactic acid fermentation of paper mill sludge and hemp hurd were carried out in 125 mL serum
bottle with a working volume of 50 mL applying various solid loadings. During SSCF, the sludge
was suspended in fermentation medium and put into the flasks to reach a total working volume of
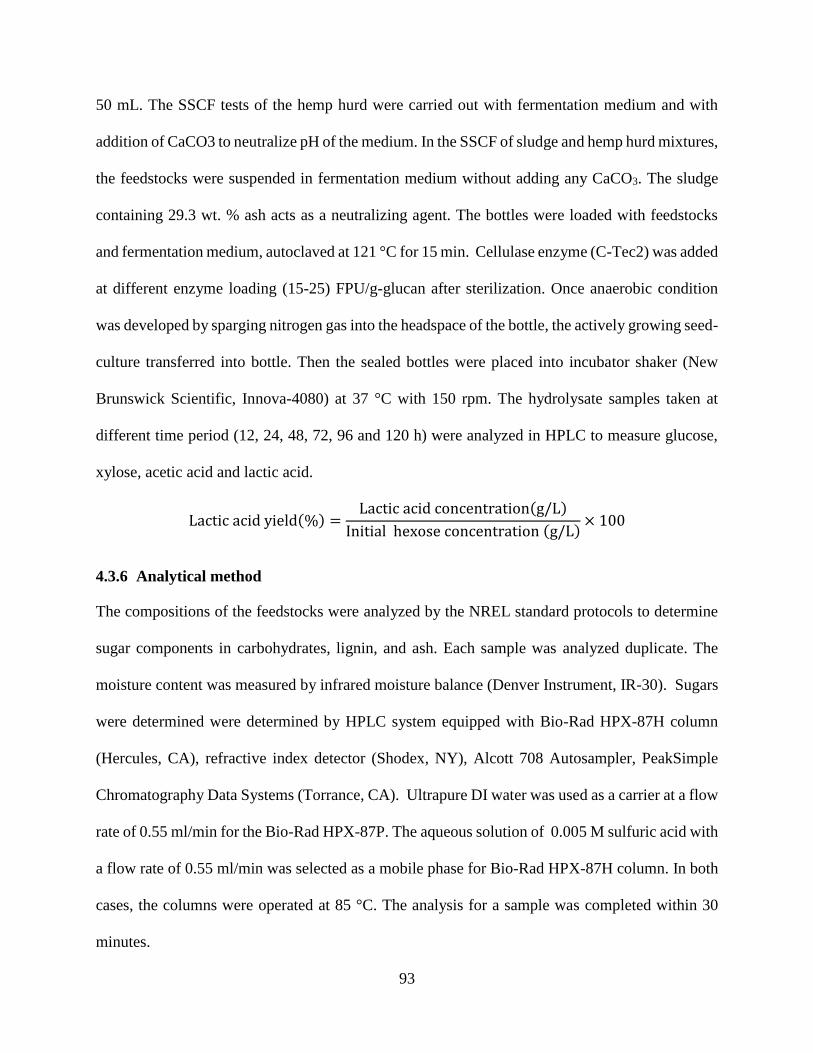
93
50 mL. The SSCF tests of the hemp hurd were carried out with fermentation medium and with
addition of CaCO3 to neutralize pH of the medium. In the SSCF of sludge and hemp hurd mixtures,
the feedstocks were suspended in fermentation medium without adding any CaCO3. The sludge
containing 29.3 wt. % ash acts as a neutralizing agent. The bottles were loaded with feedstocks
and fermentation medium, autoclaved at 121 °C for 15 min. Cellulase enzyme (C-Tec2) was added
at different enzyme loading (15-25) FPU/g-glucan after sterilization. Once anaerobic condition
was developed by sparging nitrogen gas into the headspace of the bottle, the actively growing seed-
culture transferred into bottle. Then the sealed bottles were placed into incubator shaker (New
Brunswick Scientific, Innova-4080) at 37 °C with 150 rpm. The hydrolysate samples taken at
different time period (12, 24, 48, 72, 96 and 120 h) were analyzed in HPLC to measure glucose,
xylose, acetic acid and lactic acid.
Lactic acid yield(%) =Lactic acid concentration(g/L)
Initial hexose concentration (g/L)× 100
4.3.6 Analytical method
The compositions of the feedstocks were analyzed by the NREL standard protocols to determine
sugar components in carbohydrates, lignin, and ash. Each sample was analyzed duplicate. The
moisture content was measured by infrared moisture balance (Denver Instrument, IR-30). Sugars
were determined were determined by HPLC system equipped with Bio-Rad HPX-87H column
(Hercules, CA), refractive index detector (Shodex, NY), Alcott 708 Autosampler, PeakSimple
Chromatography Data Systems (Torrance, CA). Ultrapure DI water was used as a carrier at a flow
rate of 0.55 ml/min for the Bio-Rad HPX-87P. The aqueous solution of 0.005 M sulfuric acid with
a flow rate of 0.55 ml/min was selected as a mobile phase for Bio-Rad HPX-87H column. In both
cases, the columns were operated at 85 °C. The analysis for a sample was completed within 30
minutes.
94
4.4 Results
The experimental work in this investigation was structured to perform the following specific tasks:
characterization of the sludge and hemp hurd including the bioconversion compatibility and
assessment of the SSCF as a bioconversion process converting the mixed feed to lactic acid.
4.4.1 Composition
The chemical compositions of sludge and hemp hurd are shown in Table 4-1. Glucan and xylan
are the two major organic components in the sludge. Sludge contains high amount of ash, about
one third of the total mass and the main component of the sludge is CaCO3 (Kang et al., 2010). On
the other hand, the hemp hurd are composed of mainly glucan (39%), xylan (22%) and lignin
(29%). The treated hemp hurd contain 85 % glucan and 11 % lignin as pretreatment removes
almost all xylan and a significant amount lignin; thus increasing glucan percentage in the
feedstock.
Table 4-1 Composition of paper mill sludge and hemp hurd.
a Hemp hurd Treated Hemp hurd b Primary sludge Deink sludge
Glucan (%) 39.3 84.9 43.7 51.8
Xylan (%) 22.7 1.5 10.5 12.6
Mannan (%) 0.0 0.0 1.3 1.1
Lignin (%) 28.5 10.5 3.9 2.5
Ash (%) 1.6 1.3 38.3 32.7
In this study, deink sludge and pretreated hemp hurd were used as feedstocks. a Hemp hurd and b
primary sludge shown only as reference.
4.4.2 Enzymatic hydrolysis of hemp hurd
To assess the compatibility of hemp hurd with sludge on the SSCF, enzymatic hydrolysis tests
were performed at 2 % solid loading under 10-20 FPU/g-glucan and. Although the optimum
temperature for enzymatic hydrolysis was 50°C, tests were made at 37°C in consideration of SSCF
95
investigated in this work. The digestibility data of hemp hurd was then compared with sludge data
based on our previous report as shown in Table 4-2 (Kang et al., 2010).
Table 4-2 Enzymatic digestibility data of sludge and hemp hurd
Feedstocks Enzyme and its loading
Protein Number (mg /g-glucan )
72 h glucan digestibility
72 h xylan digestibility
aSludge Spezyme CP (15 FPU)+ Novozyme-188 (30 NBU)
27 30.2 28.7
aHardwood pulp with 0.5 g CacCO3/g-glucan
Spezyme CP (15 FPU)+ Novozyme-188 (30 NBU)
27 32.9 25.2
aHardwood pulp with 0.05 M citrate buffer (pH=4.8)
Spezyme CP (15 FPU)+ Novozyme-188 (30 NBU)
27 82.0 56.8
Pretreated Hemp hurd with 0.05 M citrate buffer (pH=4.8)
Cellic C-Tec 2 (10 FPU) 16 48.4 -
Pretreated Hemp hurd with 0.05 M citrate buffer (pH=4.8)
Cellic C-Tec 2 (15 FPU) 24 58.7 -
Pretreated Hemp hurd with 0.05 M citrate buffer (pH=4.8)
Cellic C-Tec 2 (25 FPU) 40 69.6 -
a Data was adapted from the literature (Kang et al., 2010). Hardwood pulp was taken as the
reference substrate because the composition is similar to the organic portion of the sludges.
However, hardwood pulp was taken as the reference substrate because the composition is similar
to the organic portion of the sludges. The 72-h glucan digestibility of pretreated hump under the
enzyme loading of 25 FPU/g-glucan of Ctec-2 (= 40 mg protein/g-glucan) was found to be 70%.
On the other hand, 72-h glucan digestibility of hardwood pulp is 82% with (15 FPU/g-glucan of
Spezyme-CP) and β-glucosidase (30 CBU/g-glucan of Novozyme-188) (equivalent to 27 mg
protein/g-glucan). The results clearly indicate that sludge is more easily digestible than hemp hurd.
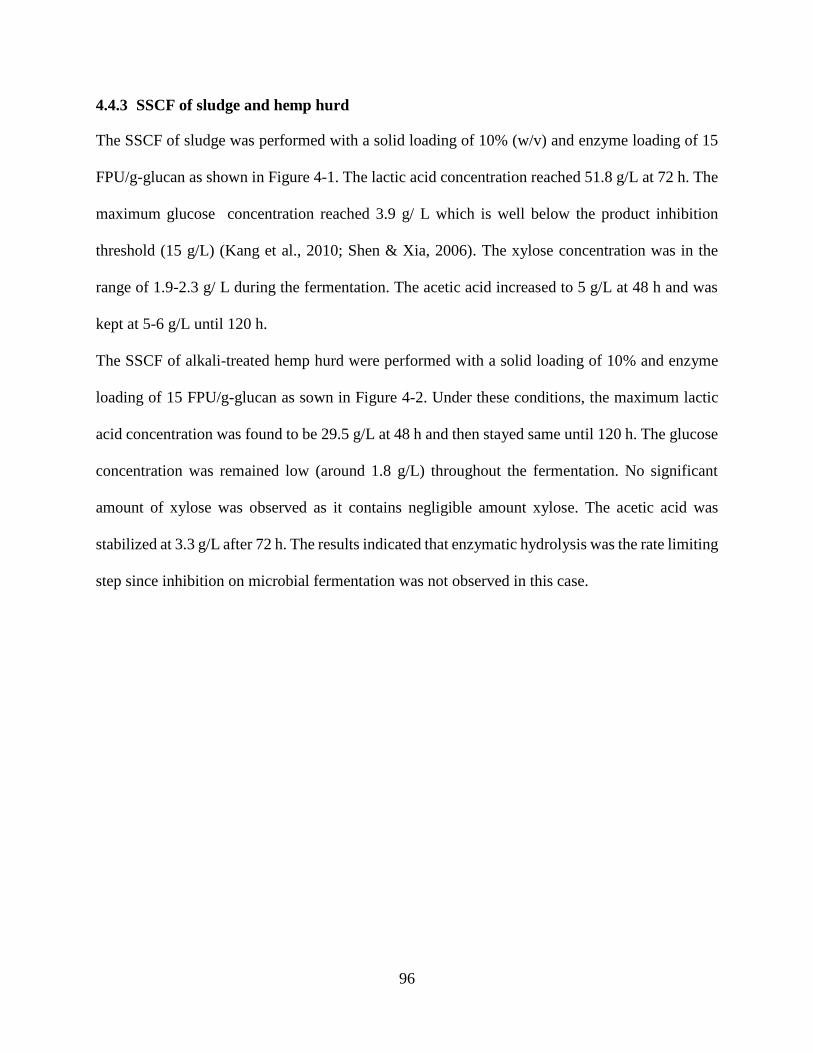
96
4.4.3 SSCF of sludge and hemp hurd
The SSCF of sludge was performed with a solid loading of 10% (w/v) and enzyme loading of 15
FPU/g-glucan as shown in Figure 4-1. The lactic acid concentration reached 51.8 g/L at 72 h. The
maximum glucose concentration reached 3.9 g/ L which is well below the product inhibition
threshold (15 g/L) (Kang et al., 2010; Shen & Xia, 2006). The xylose concentration was in the
range of 1.9-2.3 g/ L during the fermentation. The acetic acid increased to 5 g/L at 48 h and was
kept at 5-6 g/L until 120 h.
The SSCF of alkali-treated hemp hurd were performed with a solid loading of 10% and enzyme
loading of 15 FPU/g-glucan as sown in Figure 4-2. Under these conditions, the maximum lactic
acid concentration was found to be 29.5 g/L at 48 h and then stayed same until 120 h. The glucose
concentration was remained low (around 1.8 g/L) throughout the fermentation. No significant
amount of xylose was observed as it contains negligible amount xylose. The acetic acid was
stabilized at 3.3 g/L after 72 h. The results indicated that enzymatic hydrolysis was the rate limiting
step since inhibition on microbial fermentation was not observed in this case.
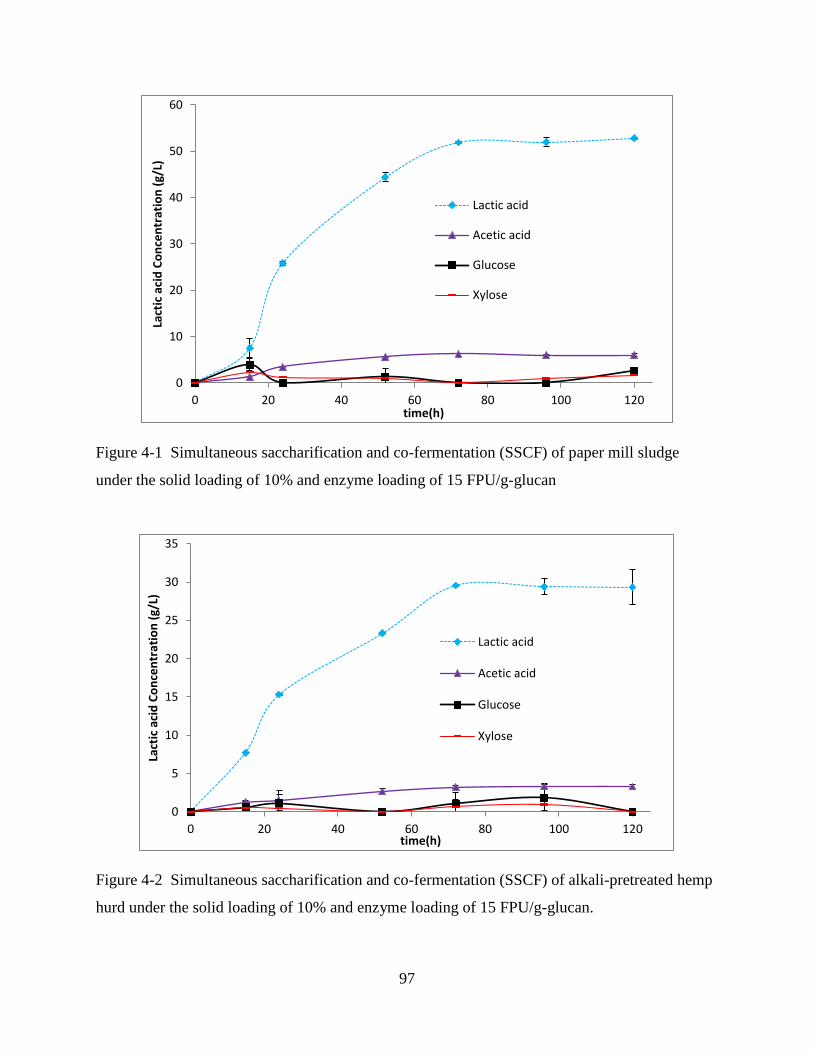
97
Figure 4-1 Simultaneous saccharification and co-fermentation (SSCF) of paper mill sludge
under the solid loading of 10% and enzyme loading of 15 FPU/g-glucan
Figure 4-2 Simultaneous saccharification and co-fermentation (SSCF) of alkali-pretreated hemp
hurd under the solid loading of 10% and enzyme loading of 15 FPU/g-glucan.
0
10
20
30
40
50
60
0 20 40 60 80 100 120
Lact
ic a
cid
Co
nce
ntr
atio
n (
g/L)
time(h)
Lactic acid
Acetic acid
Glucose
Xylose
0
5
10
15
20
25
30
35
0 20 40 60 80 100 120
Lact
ic a
cid
Co
nce
ntr
atio
n (
g/L)
time(h)
Lactic acid
Acetic acid
Glucose
Xylose
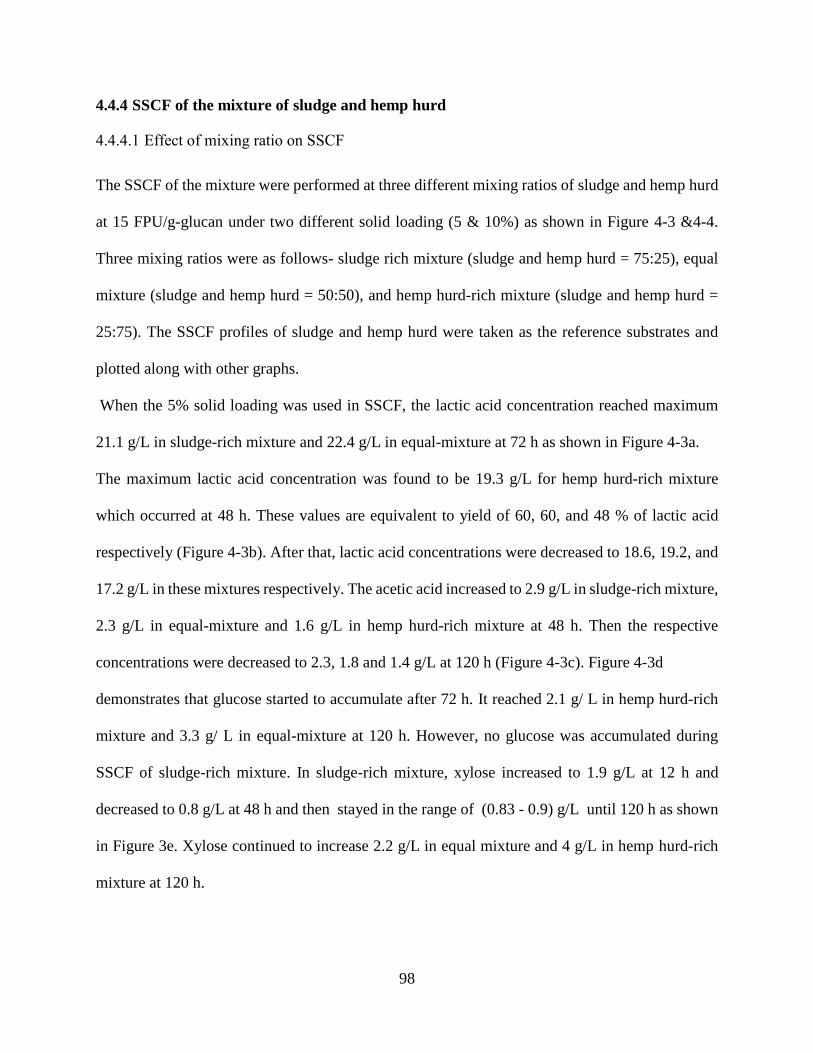
98
4.4.4 SSCF of the mixture of sludge and hemp hurd
4.4.4.1 Effect of mixing ratio on SSCF
The SSCF of the mixture were performed at three different mixing ratios of sludge and hemp hurd
at 15 FPU/g-glucan under two different solid loading (5 & 10%) as shown in Figure 4-3 &4-4.
Three mixing ratios were as follows- sludge rich mixture (sludge and hemp hurd = 75:25), equal
mixture (sludge and hemp hurd = 50:50), and hemp hurd-rich mixture (sludge and hemp hurd =
25:75). The SSCF profiles of sludge and hemp hurd were taken as the reference substrates and
plotted along with other graphs.
When the 5% solid loading was used in SSCF, the lactic acid concentration reached maximum
21.1 g/L in sludge-rich mixture and 22.4 g/L in equal-mixture at 72 h as shown in Figure 4-3a.
The maximum lactic acid concentration was found to be 19.3 g/L for hemp hurd-rich mixture
which occurred at 48 h. These values are equivalent to yield of 60, 60, and 48 % of lactic acid
respectively (Figure 4-3b). After that, lactic acid concentrations were decreased to 18.6, 19.2, and
17.2 g/L in these mixtures respectively. The acetic acid increased to 2.9 g/L in sludge-rich mixture,
2.3 g/L in equal-mixture and 1.6 g/L in hemp hurd-rich mixture at 48 h. Then the respective
concentrations were decreased to 2.3, 1.8 and 1.4 g/L at 120 h (Figure 4-3c). Figure 4-3d
demonstrates that glucose started to accumulate after 72 h. It reached 2.1 g/ L in hemp hurd-rich
mixture and 3.3 g/ L in equal-mixture at 120 h. However, no glucose was accumulated during
SSCF of sludge-rich mixture. In sludge-rich mixture, xylose increased to 1.9 g/L at 12 h and
decreased to 0.8 g/L at 48 h and then stayed in the range of (0.83 - 0.9) g/L until 120 h as shown
in Figure 3e. Xylose continued to increase 2.2 g/L in equal mixture and 4 g/L in hemp hurd-rich
mixture at 120 h.
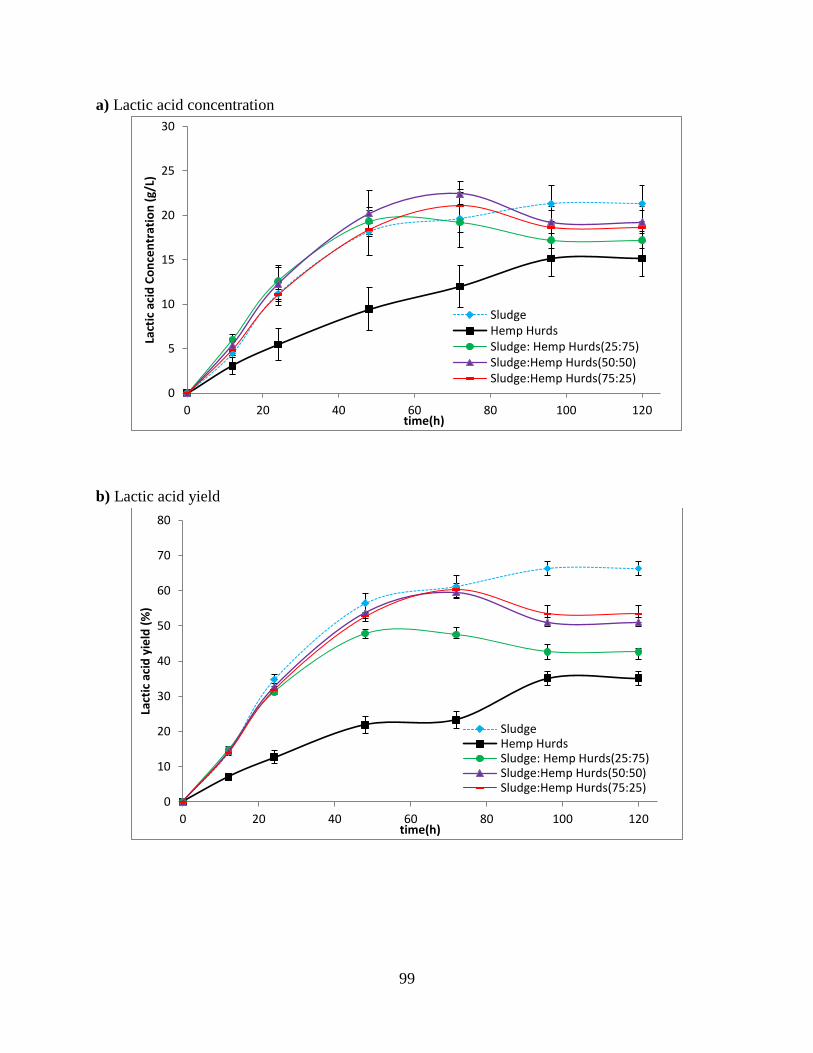
99
a) Lactic acid concentration
b) Lactic acid yield
0
5
10
15
20
25
30
0 20 40 60 80 100 120
Lact
ic a
cid
Co
nce
ntr
atio
n (
g/L)
time(h)
SludgeHemp HurdsSludge: Hemp Hurds(25:75)Sludge:Hemp Hurds(50:50)Sludge:Hemp Hurds(75:25)
0
10
20
30
40
50
60
70
80
0 20 40 60 80 100 120
Lact
ic a
cid
yie
ld (
%)
time(h)
SludgeHemp HurdsSludge: Hemp Hurds(25:75)Sludge:Hemp Hurds(50:50)Sludge:Hemp Hurds(75:25)
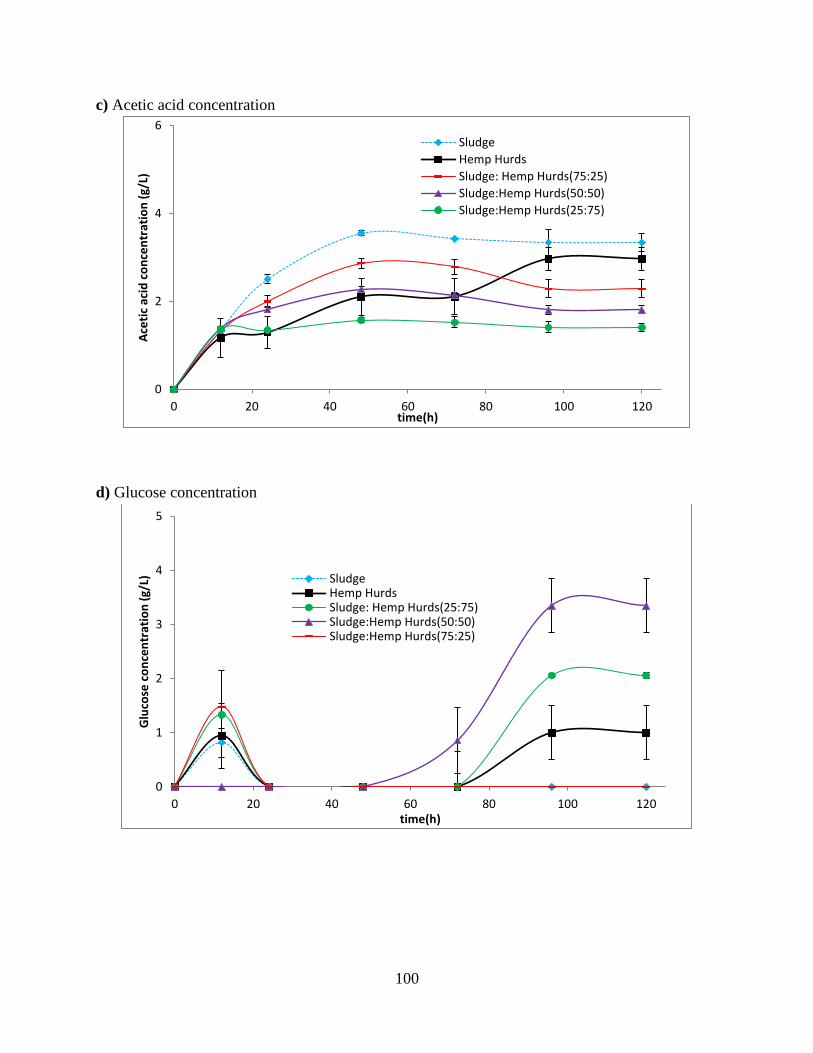
100
c) Acetic acid concentration
d) Glucose concentration
0
2
4
6
0 20 40 60 80 100 120
Ace
tic
acid
co
nce
ntr
atio
n (
g/L)
time(h)
Sludge
Hemp Hurds
Sludge: Hemp Hurds(75:25)
Sludge:Hemp Hurds(50:50)
Sludge:Hemp Hurds(25:75)
0
1
2
3
4
5
0 20 40 60 80 100 120
Glu
cose
co
nce
ntr
atio
n (
g/L)
time(h)
SludgeHemp HurdsSludge: Hemp Hurds(25:75)Sludge:Hemp Hurds(50:50)Sludge:Hemp Hurds(75:25)
101
e) Xylose concentration
f) pH profile
Figure 4-3 Effect of mixing ratio on simultaneous saccharification and co-fermentation (SSCF)
of mixture of sludge and alkali-pretreated hemp hurd under the solid loading of 5% and enzyme
loading of 15 FPU/g-glucan.
0
2
4
6
8
0 20 40 60 80 100 120
Xyl
ose
co
ncn
etr
atio
n (
g/L)
time(h)
Sludge
Hemp Hurds
Sludge: Hemp Hurds(25:75)
Sludge:Hemp Hurds(50:50)
0
1
2
3
4
5
6
7
8
0 20 40 60 80 100 120
PH
time(h)
Sludge
Hemp Hurds
Sludge: Hemp Hurds(75:25)
Sludge:Hemp Hurds(50:50)
Sludge:Hemp Hurds(25:75)
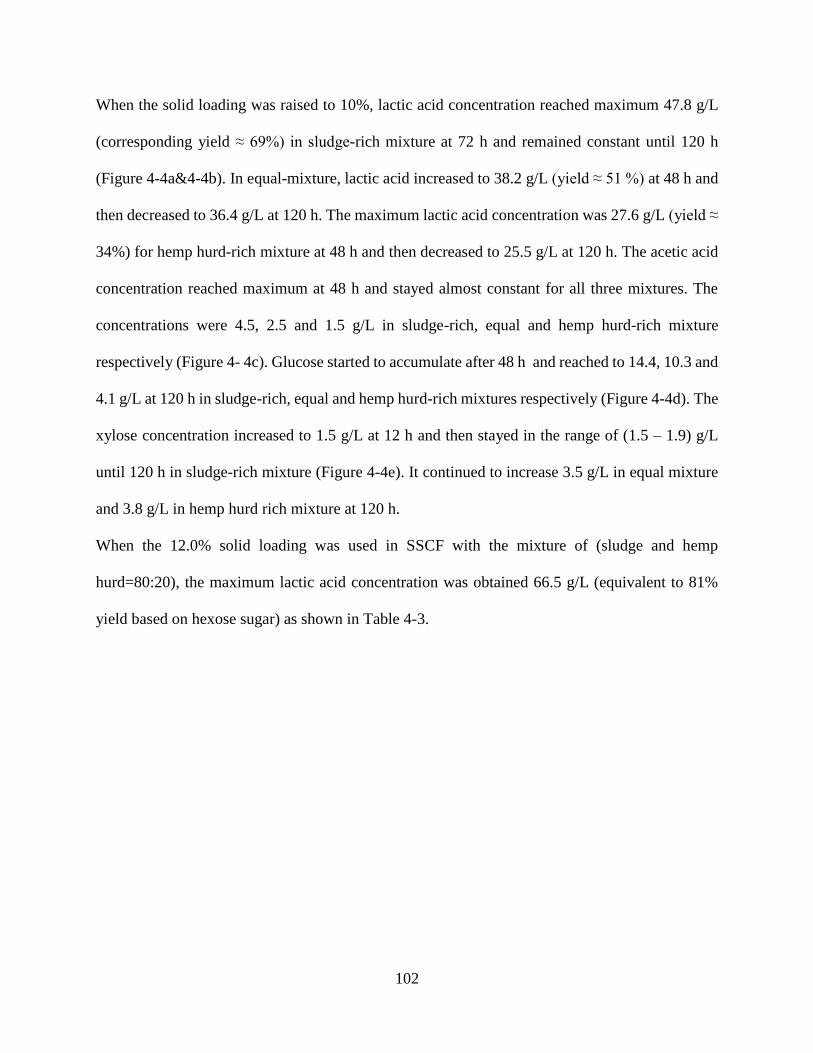
102
When the solid loading was raised to 10%, lactic acid concentration reached maximum 47.8 g/L
(corresponding yield ≈ 69%) in sludge-rich mixture at 72 h and remained constant until 120 h
(Figure 4-4a&4-4b). In equal-mixture, lactic acid increased to 38.2 g/L (yield ≈ 51 %) at 48 h and
then decreased to 36.4 g/L at 120 h. The maximum lactic acid concentration was 27.6 g/L (yield ≈
34%) for hemp hurd-rich mixture at 48 h and then decreased to 25.5 g/L at 120 h. The acetic acid
concentration reached maximum at 48 h and stayed almost constant for all three mixtures. The
concentrations were 4.5, 2.5 and 1.5 g/L in sludge-rich, equal and hemp hurd-rich mixture
respectively (Figure 4- 4c). Glucose started to accumulate after 48 h and reached to 14.4, 10.3 and
4.1 g/L at 120 h in sludge-rich, equal and hemp hurd-rich mixtures respectively (Figure 4-4d). The
xylose concentration increased to 1.5 g/L at 12 h and then stayed in the range of (1.5 – 1.9) g/L
until 120 h in sludge-rich mixture (Figure 4-4e). It continued to increase 3.5 g/L in equal mixture
and 3.8 g/L in hemp hurd rich mixture at 120 h.
When the 12.0% solid loading was used in SSCF with the mixture of (sludge and hemp
hurd=80:20), the maximum lactic acid concentration was obtained 66.5 g/L (equivalent to 81%
yield based on hexose sugar) as shown in Table 4-3.
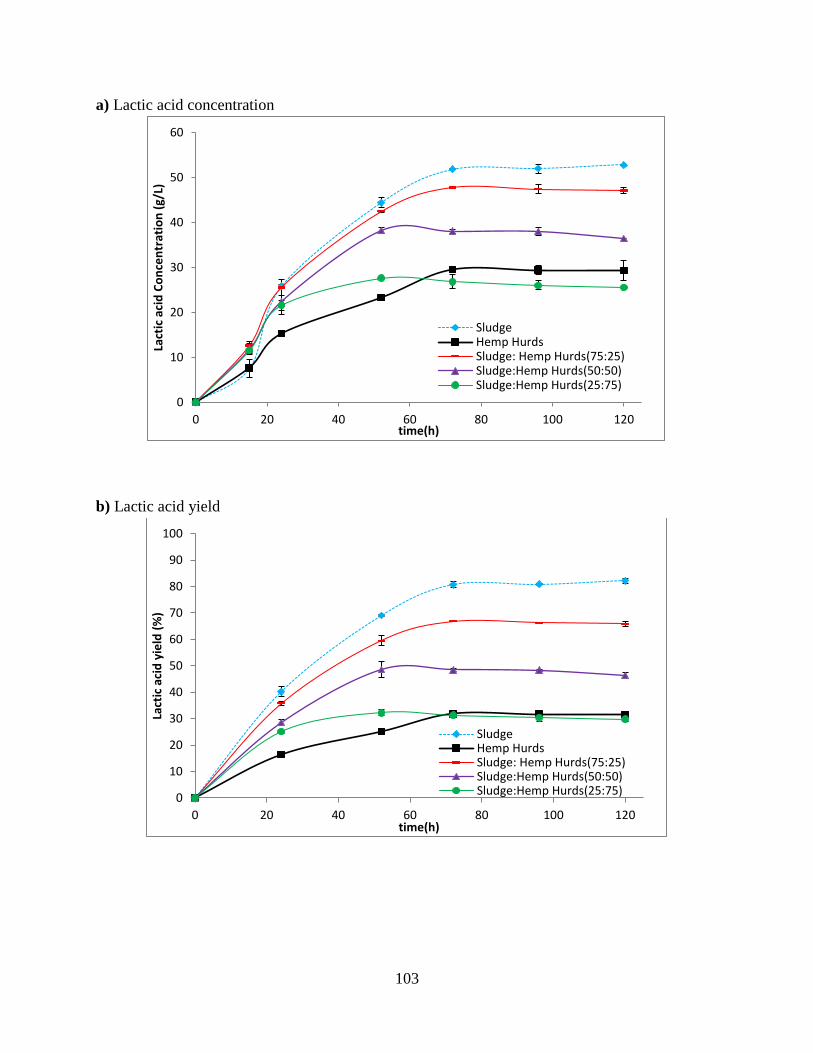
103
a) Lactic acid concentration
b) Lactic acid yield
0
10
20
30
40
50
60
0 20 40 60 80 100 120
Lact
ic a
cid
Co
nce
ntr
atio
n (
g/L)
time(h)
SludgeHemp HurdsSludge: Hemp Hurds(75:25)Sludge:Hemp Hurds(50:50)Sludge:Hemp Hurds(25:75)
0
10
20
30
40
50
60
70
80
90
100
0 20 40 60 80 100 120
Lact
ic a
cid
yie
ld (
%)
time(h)
SludgeHemp HurdsSludge: Hemp Hurds(75:25)Sludge:Hemp Hurds(50:50)Sludge:Hemp Hurds(25:75)
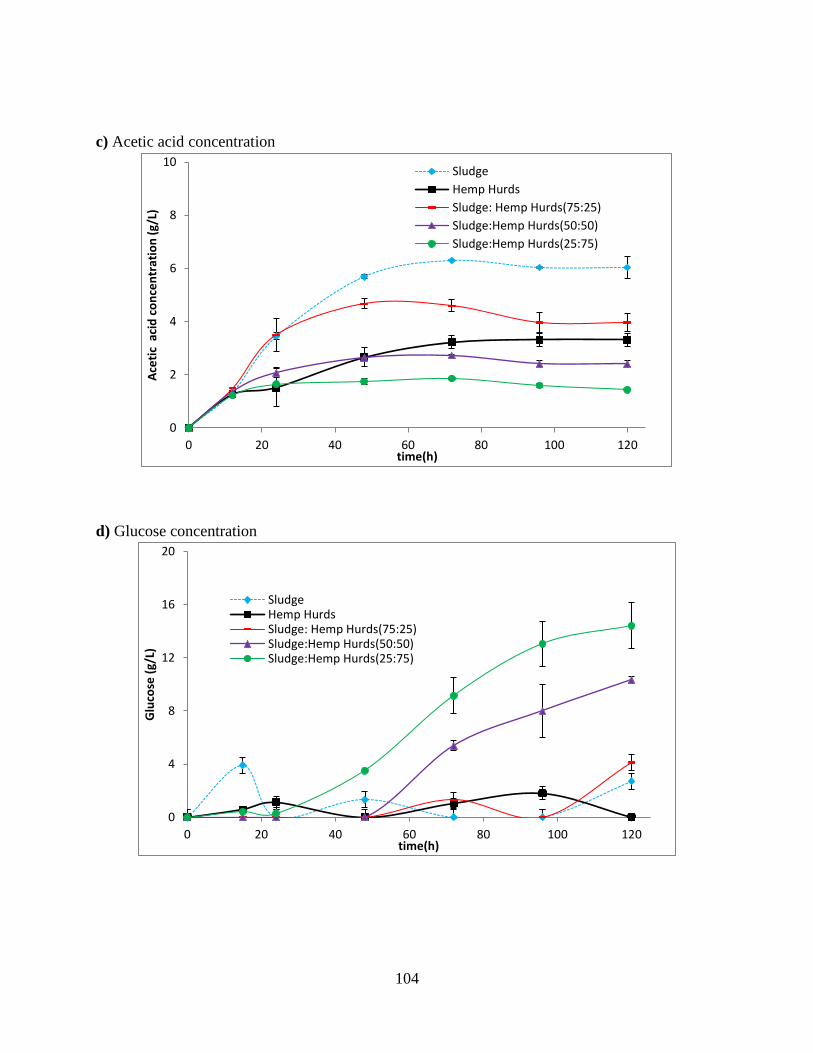
104
c) Acetic acid concentration
d) Glucose concentration
0
2
4
6
8
10
0 20 40 60 80 100 120
Ace
tic
aci
d c
on
cen
trat
ion
(g/
L)
time(h)
Sludge
Hemp Hurds
Sludge: Hemp Hurds(75:25)
Sludge:Hemp Hurds(50:50)
Sludge:Hemp Hurds(25:75)
0
4
8
12
16
20
0 20 40 60 80 100 120
Glu
cose
(g/
L)
time(h)
SludgeHemp HurdsSludge: Hemp Hurds(75:25)Sludge:Hemp Hurds(50:50)Sludge:Hemp Hurds(25:75)
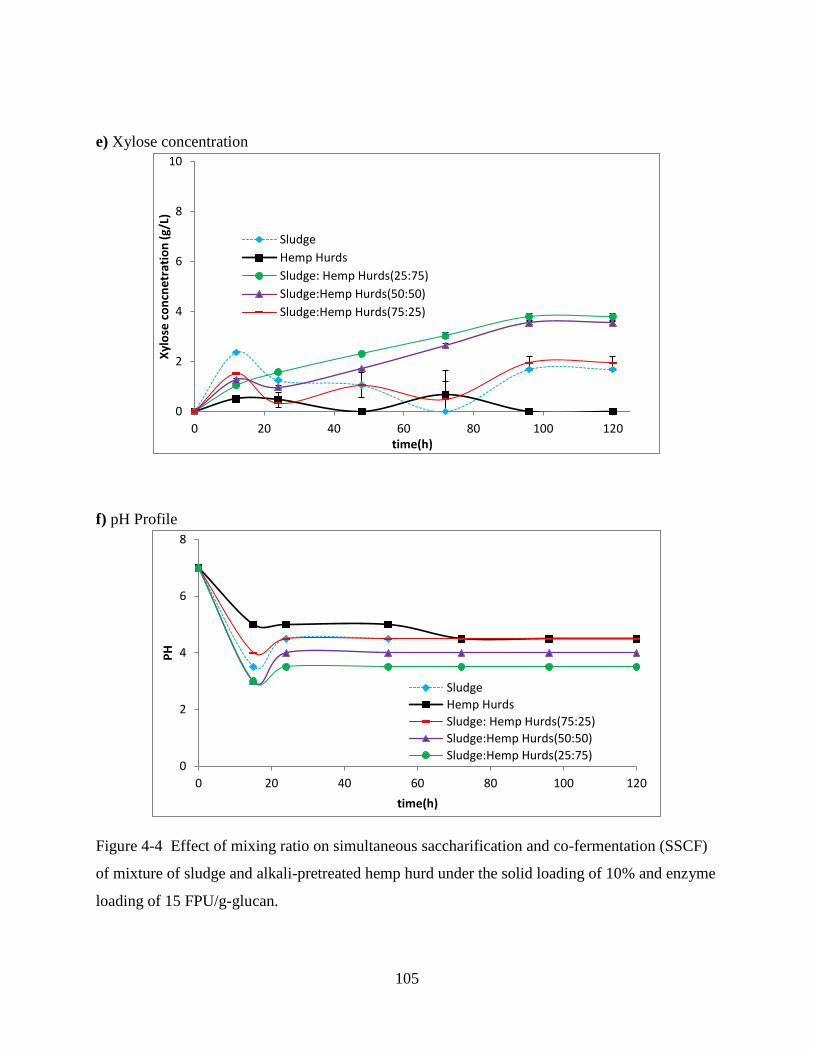
105
e) Xylose concentration
f) pH Profile
Figure 4-4 Effect of mixing ratio on simultaneous saccharification and co-fermentation (SSCF)
of mixture of sludge and alkali-pretreated hemp hurd under the solid loading of 10% and enzyme
loading of 15 FPU/g-glucan.
0
2
4
6
8
10
0 20 40 60 80 100 120
Xyl
ose
co
ncn
etr
atio
n (
g/L)
time(h)
Sludge
Hemp Hurds
Sludge: Hemp Hurds(25:75)
Sludge:Hemp Hurds(50:50)
Sludge:Hemp Hurds(75:25)
0
2
4
6
8
0 20 40 60 80 100 120
PH
time(h)
Sludge
Hemp Hurds
Sludge: Hemp Hurds(75:25)
Sludge:Hemp Hurds(50:50)
Sludge:Hemp Hurds(25:75)
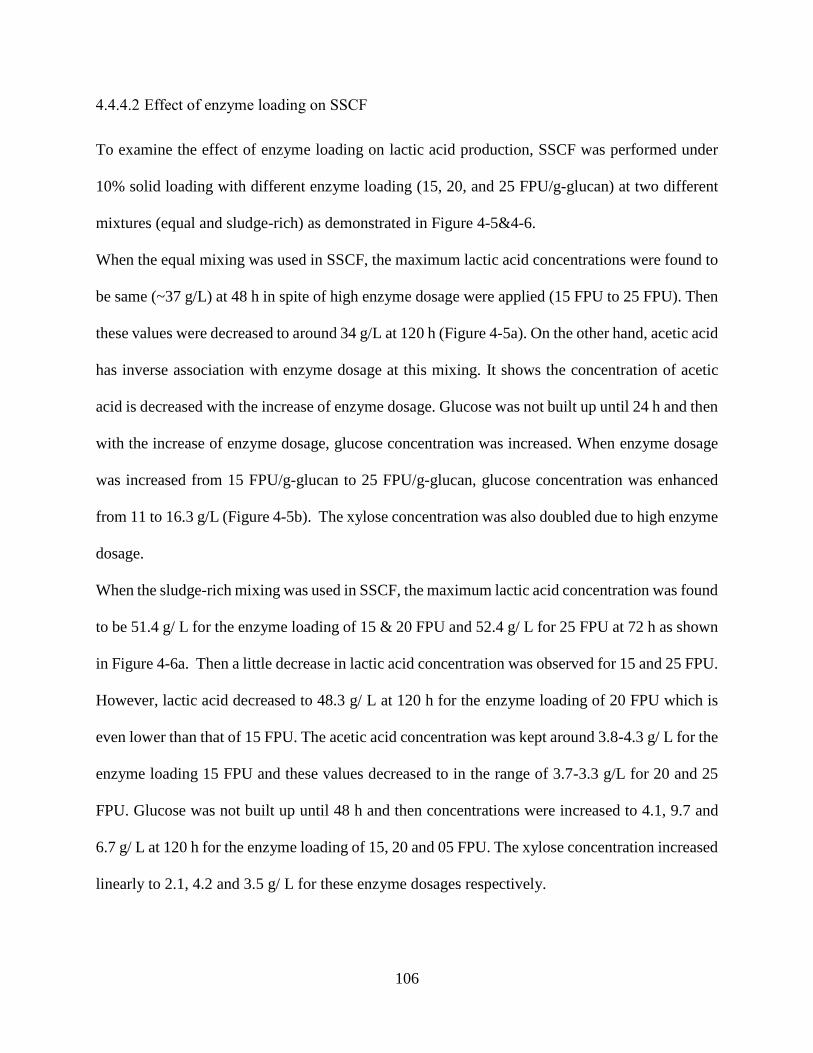
106
4.4.4.2 Effect of enzyme loading on SSCF
To examine the effect of enzyme loading on lactic acid production, SSCF was performed under
10% solid loading with different enzyme loading (15, 20, and 25 FPU/g-glucan) at two different
mixtures (equal and sludge-rich) as demonstrated in Figure 4-5&4-6.
When the equal mixing was used in SSCF, the maximum lactic acid concentrations were found to
be same (~37 g/L) at 48 h in spite of high enzyme dosage were applied (15 FPU to 25 FPU). Then
these values were decreased to around 34 g/L at 120 h (Figure 4-5a). On the other hand, acetic acid
has inverse association with enzyme dosage at this mixing. It shows the concentration of acetic
acid is decreased with the increase of enzyme dosage. Glucose was not built up until 24 h and then
with the increase of enzyme dosage, glucose concentration was increased. When enzyme dosage
was increased from 15 FPU/g-glucan to 25 FPU/g-glucan, glucose concentration was enhanced
from 11 to 16.3 g/L (Figure 4-5b). The xylose concentration was also doubled due to high enzyme
dosage.
When the sludge-rich mixing was used in SSCF, the maximum lactic acid concentration was found
to be 51.4 g/ L for the enzyme loading of 15 & 20 FPU and 52.4 g/ L for 25 FPU at 72 h as shown
in Figure 4-6a. Then a little decrease in lactic acid concentration was observed for 15 and 25 FPU.
However, lactic acid decreased to 48.3 g/ L at 120 h for the enzyme loading of 20 FPU which is
even lower than that of 15 FPU. The acetic acid concentration was kept around 3.8-4.3 g/ L for the
enzyme loading 15 FPU and these values decreased to in the range of 3.7-3.3 g/L for 20 and 25
FPU. Glucose was not built up until 48 h and then concentrations were increased to 4.1, 9.7 and
6.7 g/ L at 120 h for the enzyme loading of 15, 20 and 05 FPU. The xylose concentration increased
linearly to 2.1, 4.2 and 3.5 g/ L for these enzyme dosages respectively.
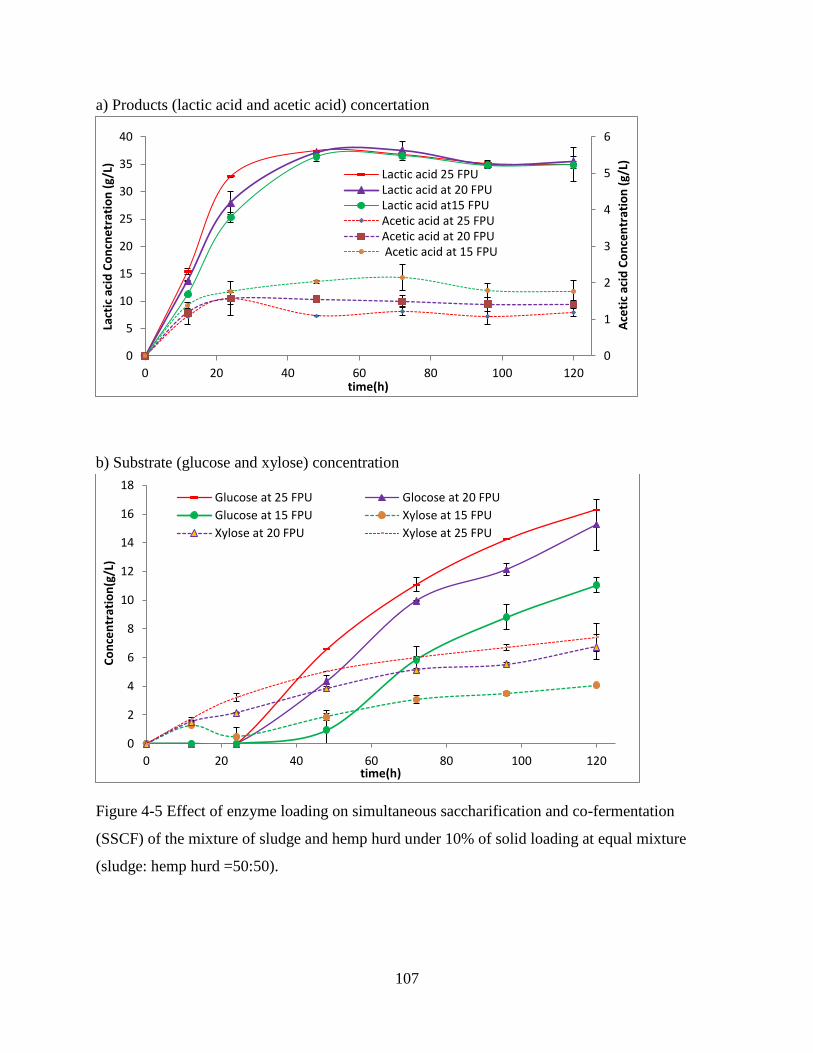
107
a) Products (lactic acid and acetic acid) concertation
b) Substrate (glucose and xylose) concentration
Figure 4-5 Effect of enzyme loading on simultaneous saccharification and co-fermentation
(SSCF) of the mixture of sludge and hemp hurd under 10% of solid loading at equal mixture
(sludge: hemp hurd =50:50).
0
1
2
3
4
5
6
0
5
10
15
20
25
30
35
40
0 20 40 60 80 100 120
Ace
tic
acid
Co
nce
ntr
atio
n (
g/L)
Lact
ic a
cid
Co
ncn
etr
atio
n (
g/L)
time(h)
Lactic acid 25 FPULactic acid at 20 FPULactic acid at15 FPUAcetic acid at 25 FPUAcetic acid at 20 FPU Acetic acid at 15 FPU
0
2
4
6
8
10
12
14
16
18
0 20 40 60 80 100 120
Co
nce
ntr
atio
n(g
/L)
time(h)
Glucose at 25 FPU Glocose at 20 FPU
Glucose at 15 FPU Xylose at 15 FPU
Xylose at 20 FPU Xylose at 25 FPU
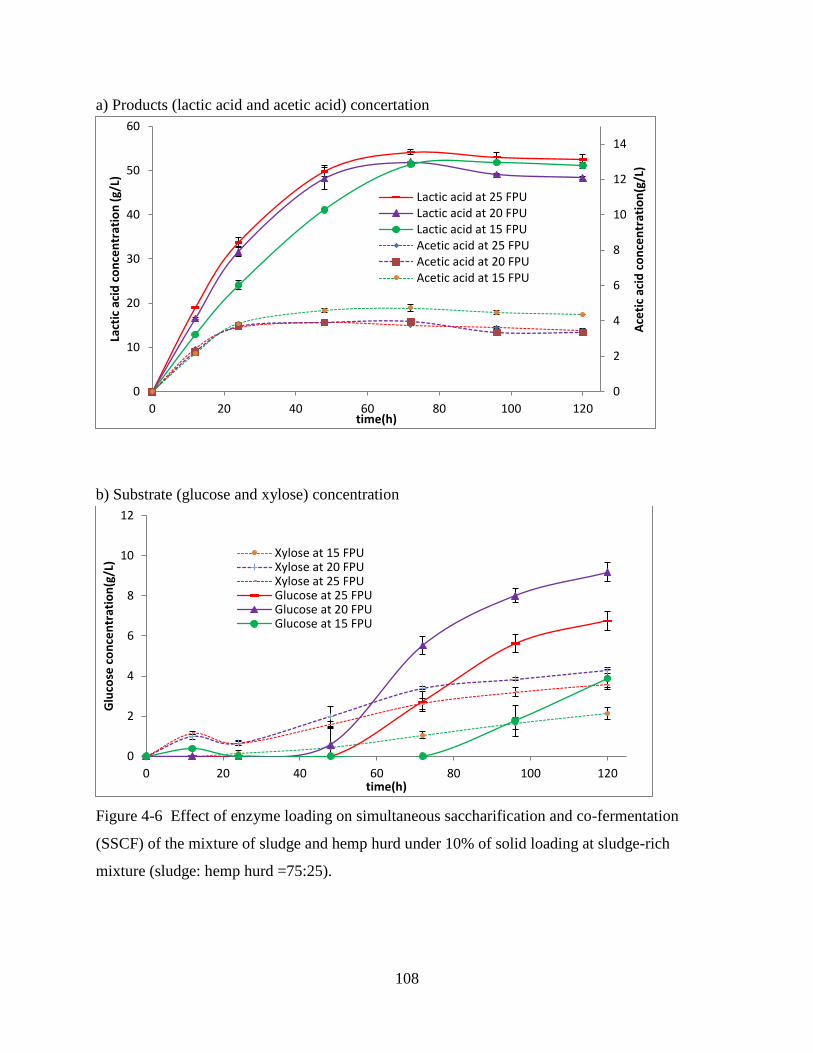
108
a) Products (lactic acid and acetic acid) concertation
b) Substrate (glucose and xylose) concentration
Figure 4-6 Effect of enzyme loading on simultaneous saccharification and co-fermentation
(SSCF) of the mixture of sludge and hemp hurd under 10% of solid loading at sludge-rich
mixture (sludge: hemp hurd =75:25).
0
2
4
6
8
10
12
14
0
10
20
30
40
50
60
0 20 40 60 80 100 120
Ace
tic
acid
co
nce
ntr
atio
n(g
/L)
Lact
ic a
cid
co
nce
ntr
atio
n (
g/L)
time(h)
Lactic acid at 25 FPULactic acid at 20 FPULactic acid at 15 FPUAcetic acid at 25 FPUAcetic acid at 20 FPUAcetic acid at 15 FPU
0
2
4
6
8
10
12
0 20 40 60 80 100 120
Glu
cose
co
nce
ntr
atio
n(g
/L)
time(h)
Xylose at 15 FPUXylose at 20 FPUXylose at 25 FPUGlucose at 25 FPUGlucose at 20 FPUGlucose at 15 FPU
109
4.5 Discussions
Hemp hurd were utilized directly as complementary feedstocks to paper mill sludge for lactic acid
production via SSCF. Under the solid loading of 10-12% and enzyme loading of 15 FPU/g-glucan,
a total of 52-66 g/L of lactic acid was produced with the mixture of sludge and hemp hurd (Table
4-3).
Table 4-3 Net amount of lactic acid generated from sludge, hemp hurd and mixture
4.5.1 Effect of process variables on lactic acid production
When 5% solid loading was used in SSCF, the pH of the sludge quickly dropped to 4.5 from the
initial value of 7 and then stayed at 5 throughout the SSCF (Figure 4-3f). With high solid loading
(10 %), this drop went further down to 3.5 and then stayed at 4.5 (near optimum for the SSF)
(Figure 4-4f). The initial quick drop of pH is due to production of lactic acid, which eventually
turns into calcium lactate. The presence of calcium lactate and calcium acetate along with sludge-
ash collectively acts as a buffer, maintaining a steady pH afterwards (Shi et al., 2015).
The pH profile of sludge-rich mixtures resembles that of sludge alone due to little difference in
ash content between the two. The same applies to the lactic acid profile, only the level of lactic
acid is slightly higher for sludge than the mixture (Figure 3a& 4a). The lower lactic acid
concentration of sludge-rich mixture than that of sludge is attributed to initial glucan loading.
Although experiments were conducted at same solid loading and the same enzyme-to-substrate
Solid loading FeedstocksTotal Glucan
(g/L)
Total Xylan
(g/L)
Total sugar
(g/L)
Sugar from
sludge (g/L)
Sugar from
Hemp Hurds
(g/L)
Maximum
Lactic acid (g/L)
Lactic acid
Yield
(%)
Sludge 25.88 6.28 32.16 32.16 - 21.32 66.29
Hemp Hurds 42.44 0.76 42.44 - 43.94 15.16 35.72
Mix (S:H=25:75) 38.30 1.56 39.86 8.04 31.84 22.40 52.89
Mix (S:H=50:50) 34.16 3.14 37.30 16.09 21.23 19.25 60.05
Mix (S:H=75:25) 30.02 4.70 34.72 24.13 10.61 19.21 55.33
Sludge 51.76 12.56 64.32 64.32 - 51.88 80.66
Hemp Hurds 84.88 1.50 84.88 - 86.38 29.56 34.83
Mix (S:H=25:75) 76.60 3.14 79.74 16.09 63.68 26.81 33.62
Mix (S:H=50:50) 68.32 6.28 74.60 32.18 42.45 38.09 51.06
Mix (S:H=75:25) 60.04 9.42 69.46 48.27 21.23 47.77 68.77
12% Mix (S:H=80:20) 68.72 12.56 81.28 64.36 16.98 66.57 81.90
5%
10%
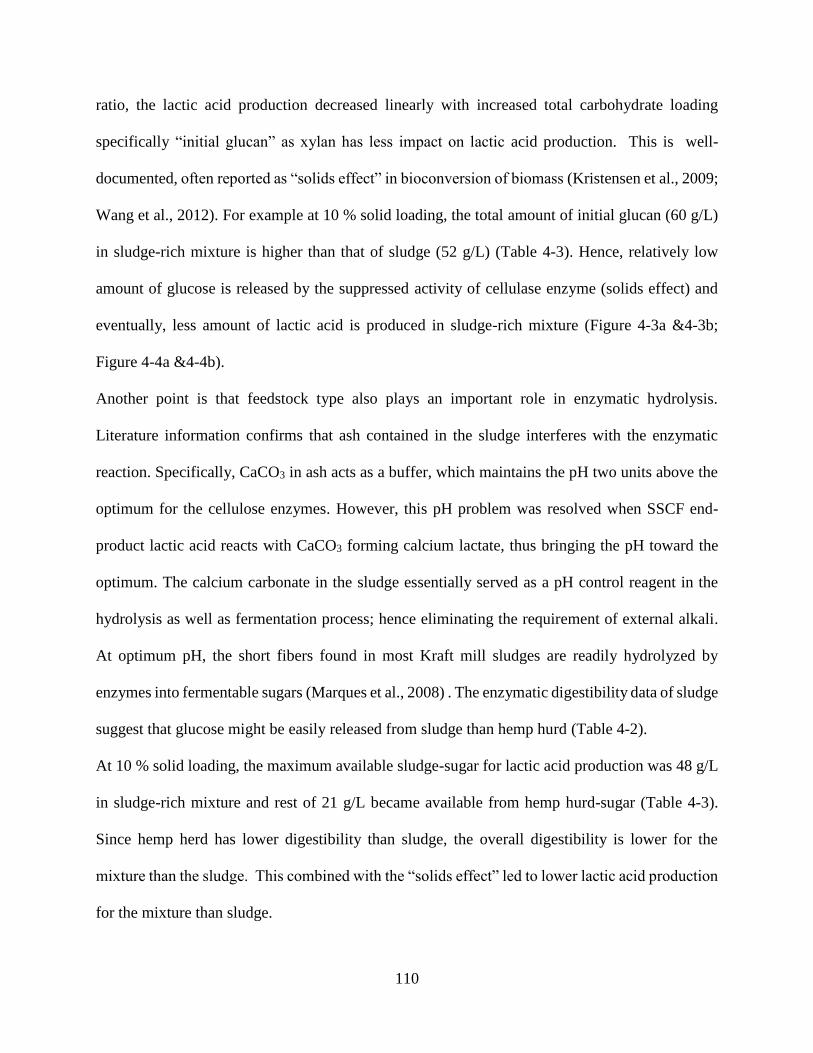
110
ratio, the lactic acid production decreased linearly with increased total carbohydrate loading
specifically “initial glucan” as xylan has less impact on lactic acid production. This is well-
documented, often reported as “solids effect” in bioconversion of biomass (Kristensen et al., 2009;
Wang et al., 2012). For example at 10 % solid loading, the total amount of initial glucan (60 g/L)
in sludge-rich mixture is higher than that of sludge (52 g/L) (Table 4-3). Hence, relatively low
amount of glucose is released by the suppressed activity of cellulase enzyme (solids effect) and
eventually, less amount of lactic acid is produced in sludge-rich mixture (Figure 4-3a &4-3b;
Figure 4-4a &4-4b).
Another point is that feedstock type also plays an important role in enzymatic hydrolysis.
Literature information confirms that ash contained in the sludge interferes with the enzymatic
reaction. Specifically, CaCO3 in ash acts as a buffer, which maintains the pH two units above the
optimum for the cellulose enzymes. However, this pH problem was resolved when SSCF end-
product lactic acid reacts with CaCO3 forming calcium lactate, thus bringing the pH toward the
optimum. The calcium carbonate in the sludge essentially served as a pH control reagent in the
hydrolysis as well as fermentation process; hence eliminating the requirement of external alkali.
At optimum pH, the short fibers found in most Kraft mill sludges are readily hydrolyzed by
enzymes into fermentable sugars (Marques et al., 2008) . The enzymatic digestibility data of sludge
suggest that glucose might be easily released from sludge than hemp hurd (Table 4-2).
At 10 % solid loading, the maximum available sludge-sugar for lactic acid production was 48 g/L
in sludge-rich mixture and rest of 21 g/L became available from hemp hurd-sugar (Table 4-3).
Since hemp herd has lower digestibility than sludge, the overall digestibility is lower for the
mixture than the sludge. This combined with the “solids effect” led to lower lactic acid production
for the mixture than sludge.
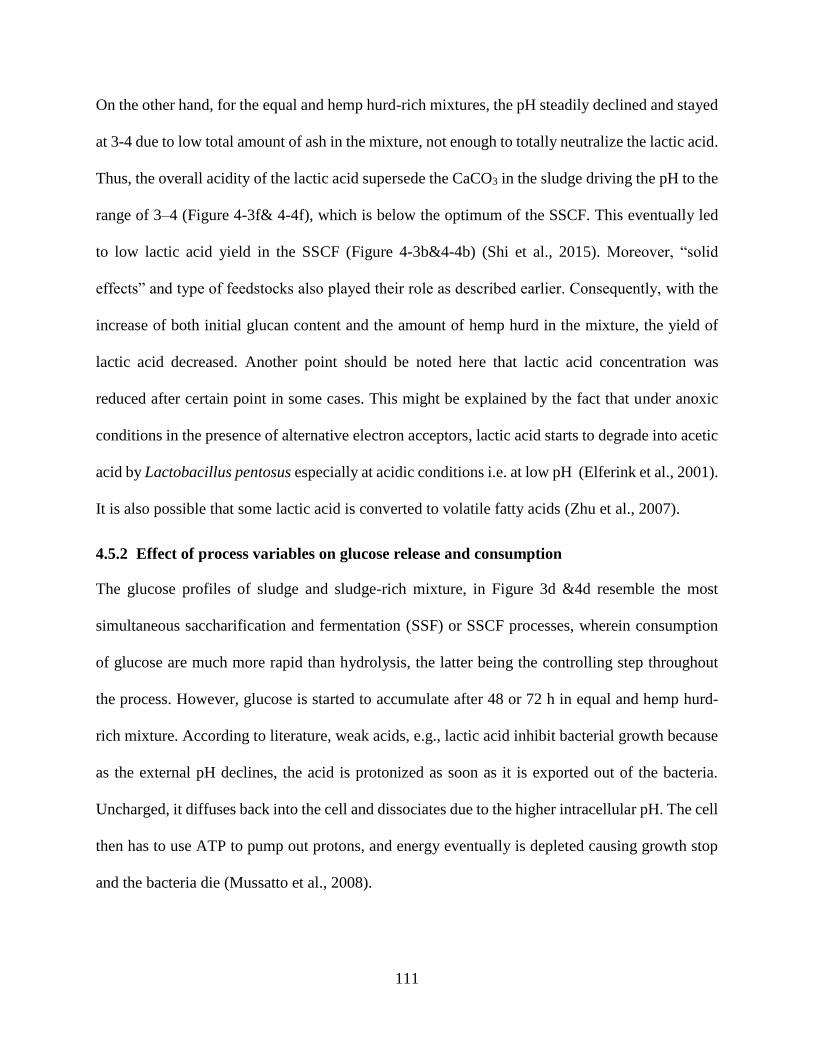
111
On the other hand, for the equal and hemp hurd-rich mixtures, the pH steadily declined and stayed
at 3-4 due to low total amount of ash in the mixture, not enough to totally neutralize the lactic acid.
Thus, the overall acidity of the lactic acid supersede the CaCO3 in the sludge driving the pH to the
range of 3–4 (Figure 4-3f& 4-4f), which is below the optimum of the SSCF. This eventually led
to low lactic acid yield in the SSCF (Figure 4-3b&4-4b) (Shi et al., 2015). Moreover, “solid
effects” and type of feedstocks also played their role as described earlier. Consequently, with the
increase of both initial glucan content and the amount of hemp hurd in the mixture, the yield of
lactic acid decreased. Another point should be noted here that lactic acid concentration was
reduced after certain point in some cases. This might be explained by the fact that under anoxic
conditions in the presence of alternative electron acceptors, lactic acid starts to degrade into acetic
acid by Lactobacillus pentosus especially at acidic conditions i.e. at low pH (Elferink et al., 2001).
It is also possible that some lactic acid is converted to volatile fatty acids (Zhu et al., 2007).
4.5.2 Effect of process variables on glucose release and consumption
The glucose profiles of sludge and sludge-rich mixture, in Figure 3d &4d resemble the most
simultaneous saccharification and fermentation (SSF) or SSCF processes, wherein consumption
of glucose are much more rapid than hydrolysis, the latter being the controlling step throughout
the process. However, glucose is started to accumulate after 48 or 72 h in equal and hemp hurd-
rich mixture. According to literature, weak acids, e.g., lactic acid inhibit bacterial growth because
as the external pH declines, the acid is protonized as soon as it is exported out of the bacteria.
Uncharged, it diffuses back into the cell and dissociates due to the higher intracellular pH. The cell
then has to use ATP to pump out protons, and energy eventually is depleted causing growth stop
and the bacteria die (Mussatto et al., 2008).
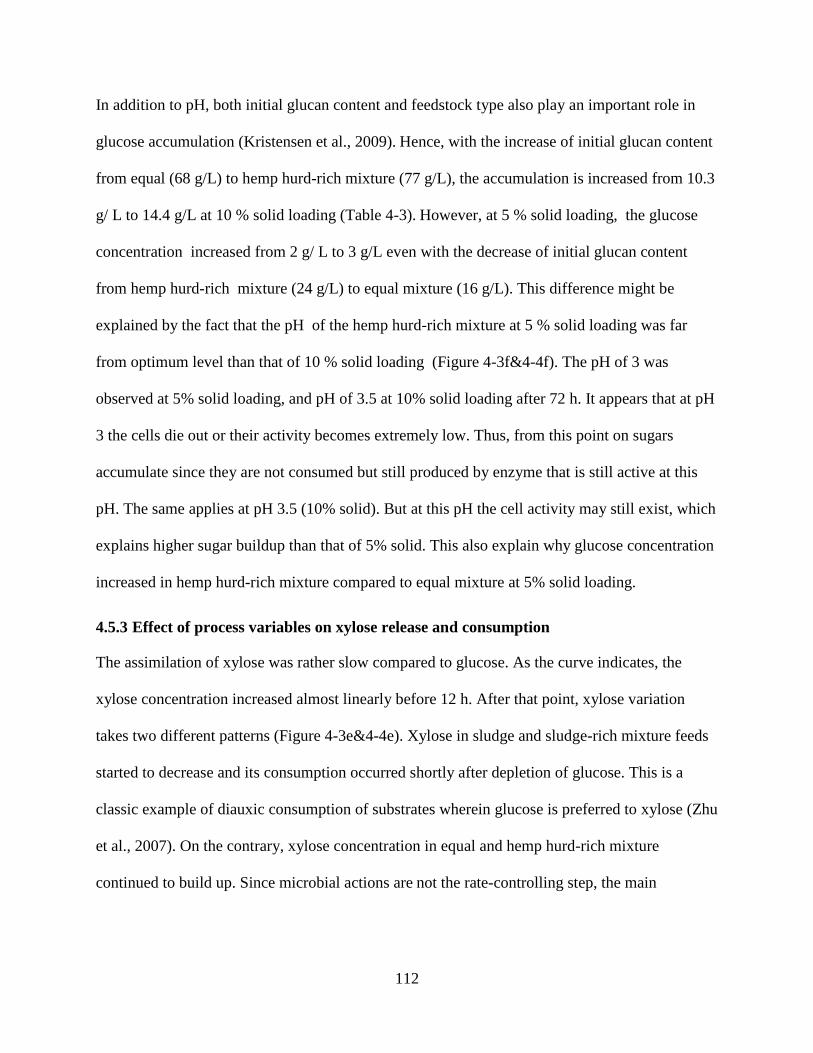
112
In addition to pH, both initial glucan content and feedstock type also play an important role in
glucose accumulation (Kristensen et al., 2009). Hence, with the increase of initial glucan content
from equal (68 g/L) to hemp hurd-rich mixture (77 g/L), the accumulation is increased from 10.3
g/ L to 14.4 g/L at 10 % solid loading (Table 4-3). However, at 5 % solid loading, the glucose
concentration increased from 2 g/ L to 3 g/L even with the decrease of initial glucan content
from hemp hurd-rich mixture (24 g/L) to equal mixture (16 g/L). This difference might be
explained by the fact that the pH of the hemp hurd-rich mixture at 5 % solid loading was far
from optimum level than that of 10 % solid loading (Figure 4-3f&4-4f). The pH of 3 was
observed at 5% solid loading, and pH of 3.5 at 10% solid loading after 72 h. It appears that at pH
3 the cells die out or their activity becomes extremely low. Thus, from this point on sugars
accumulate since they are not consumed but still produced by enzyme that is still active at this
pH. The same applies at pH 3.5 (10% solid). But at this pH the cell activity may still exist, which
explains higher sugar buildup than that of 5% solid. This also explain why glucose concentration
increased in hemp hurd-rich mixture compared to equal mixture at 5% solid loading.
4.5.3 Effect of process variables on xylose release and consumption
The assimilation of xylose was rather slow compared to glucose. As the curve indicates, the
xylose concentration increased almost linearly before 12 h. After that point, xylose variation
takes two different patterns (Figure 4-3e&4-4e). Xylose in sludge and sludge-rich mixture feeds
started to decrease and its consumption occurred shortly after depletion of glucose. This is a
classic example of diauxic consumption of substrates wherein glucose is preferred to xylose (Zhu
et al., 2007). On the contrary, xylose concentration in equal and hemp hurd-rich mixture
continued to build up. Since microbial actions are not the rate-controlling step, the main
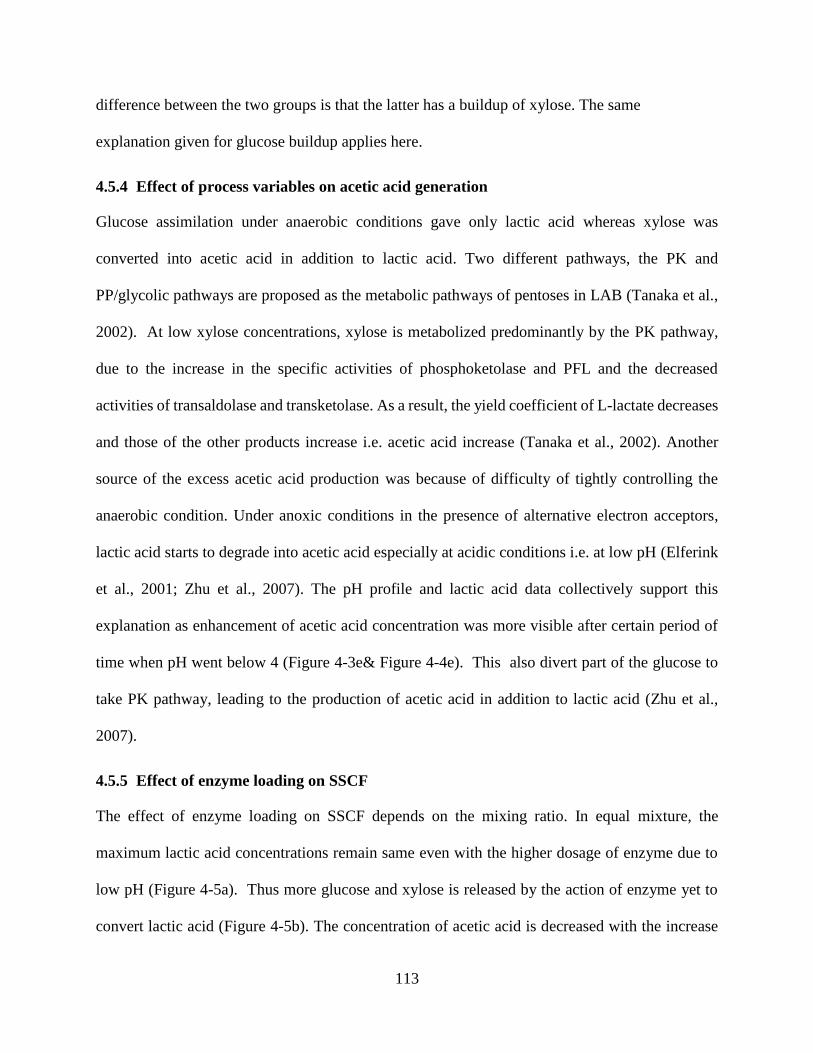
113
difference between the two groups is that the latter has a buildup of xylose. The same
explanation given for glucose buildup applies here.
4.5.4 Effect of process variables on acetic acid generation
Glucose assimilation under anaerobic conditions gave only lactic acid whereas xylose was
converted into acetic acid in addition to lactic acid. Two different pathways, the PK and
PP/glycolic pathways are proposed as the metabolic pathways of pentoses in LAB (Tanaka et al.,
2002). At low xylose concentrations, xylose is metabolized predominantly by the PK pathway,
due to the increase in the specific activities of phosphoketolase and PFL and the decreased
activities of transaldolase and transketolase. As a result, the yield coefficient of L-lactate decreases
and those of the other products increase i.e. acetic acid increase (Tanaka et al., 2002). Another
source of the excess acetic acid production was because of difficulty of tightly controlling the
anaerobic condition. Under anoxic conditions in the presence of alternative electron acceptors,
lactic acid starts to degrade into acetic acid especially at acidic conditions i.e. at low pH (Elferink
et al., 2001; Zhu et al., 2007). The pH profile and lactic acid data collectively support this
explanation as enhancement of acetic acid concentration was more visible after certain period of
time when pH went below 4 (Figure 4-3e& Figure 4-4e). This also divert part of the glucose to
take PK pathway, leading to the production of acetic acid in addition to lactic acid (Zhu et al.,
2007).
4.5.5 Effect of enzyme loading on SSCF
The effect of enzyme loading on SSCF depends on the mixing ratio. In equal mixture, the
maximum lactic acid concentrations remain same even with the higher dosage of enzyme due to
low pH (Figure 4-5a). Thus more glucose and xylose is released by the action of enzyme yet to
convert lactic acid (Figure 4-5b). The concentration of acetic acid is decreased with the increase
114
of enzyme dosage. The possible explanation is, at high concentration, glucose is metabolized
predominantly by the EMP pathway giving lactic acid as sole product and this process is
accelerated by high pH. At lower concentration, glucose is converted to lactic acid and acetic acid
via PK pathways and this process is accelerated by low pH. Thus the acetic acid concentration is
increased with low enzyme loading. When sludge-rich mixture was used in SSCF, the maximum
lactic acid concentrations were almost same for the applied dosages. Interestingly, the degradation
of lactic acid is more prominent after 72 h and relatively high concentration of glucose and xylose
is observed in SSCF for the enzyme loading of 20 FPU. We don’t have any explanation for this.
This may be due to microbes turn into spores,
The major advantages of Hemp hurd as a complementary feedstock to paper sludge for lactic acid
production for lactic acid production are that no further pretreatment is needed and no pH control
is required. By comparing sludge data at 10 % solid loading and sludge rich mixture at 12% solid
loading, one can conclude that 14.6 g/L lactic acid was obtained from hemp hurd without more
feedstock cost (Table 4.3).
4.6 Conclusions
Pulp mill sludge is a feedstock suitable for lactic acid production. The buffering effect of CaCO3
existing in sludge can be effectively used in lactic acid production by SSCF as it keeps the pH
near optimum level resulting calcium lactate as the end-product. The ash content in pulp mill
sludges is 30-40%, which gives higher than required neutralizing capacity when it is used as a
sole feed, especially at high solid loading. The SSCF of sludge can thus accommodate additional
common cellulosic feedstocks. As a proof, it was demonstrated that a mixed feed of pulp mill
sludge and hemp hurd can effectively processed by SSCF. In addition to pH, both initial glucan
content and feedstock type also play an important role in lactic acid production process.
115
Applying proper operating conditions, lactic acid concentration of 67 g/L corresponding to the
yield of 0.82 g/g-sugar were achieved. It was attained under the condition of: sludge/hemp hurd
ratio= 4, total solid loading of 12 wt%, and enzyme loading of 15 FPU/g-glucan. The maximum
lactic acid concentrations remain same even with the higher dosage of enzyme whereas the acetic
acid concentration is increased with low enzyme loading in this experimental range. This study
suggests that combination of sludge and other cellulosic feedstock can be used to produce lactic
acid, eliminating the need of external neutralizing reagent.
.
116
Chapter 5
Chlorine dioxide as a secondary pretreatment reagent for
herbaceous biomass
5.1 Abstract
Chlorine dioxide (ClO2) is a bleaching reagent used in paper industry. Two different types of
pretreatment methods were investigated incorporating ClO2 as a secondary reagent: (a) alkaline
followed by ClO2 treatment; (b) dilute-sulfuric acid followed ClO2 treatment. In these methods,
ClO2 treatment has shown little effect on delignification. Scheme-a has shown a significant
improvement in enzymatic digestibility of glucan far above that treated by ammonia alone. On the
contrary, dilute-acid followed by ClO2 treatment has shown negative effect on the enzymatic
hydrolysis. The main factors affecting the enzymatic hydrolysis are the changes of the chemical
structure of lignin and its distribution on the biomass surface. ClO2 treatment significantly
increases the carboxylic acid content and reduces phenolic groups of lignin, affecting
hydrophobicity of lignin and the H-bond induced association between the enzyme and lignin. This
collectively led to reduction of unproductive binding of enzyme with lignin, consequently
increasing the digestibility.
117
5.2 Introduction
The cell wall of lignocellulosic biomass is a composite material of crystalline cellulose fibrils
bound by non-crystalline cellulose fibrils and hemicellulose and surrounded by a matrix of
hemicellulose and lignin (Rubin, 2008). Among them, lignin is believed to be a major hindrance
to bioconversion as it surrounds carbohydrates (cellulose and hemicellulose) making it highly
recalcitrant to enzymes, pathogens and microorganisms (Studer et al., 2011). Delignification is
therefore an important step for successful enzymatic hydrolysis and subsequent microbial
fermentation of lignocellulosic biomass. A wealth of research has been conducted to improve
enzymatic hydrolysis through a specific delignification. For example, hydrogen peroxide (Gupta
& Lee, 2010), chlorine dioxide (Barroca et al., 2001),aqueous liquid ammonia (Kim et al., 2003),
ozone (Kaur et al., 2012) and sodium chlorite (Kumar et al., 2013) have been studied to reduce the
lignin content in lignocellulosic biomass but relatively few address the effect of ClO2 on
enzymatic hydrolysis of biomass through delignification.
ClO2 is a bleaching reagent commonly used in pulp and paper industry. Chlorine dioxide based
delignification method and acid-chlorite delignification, often utilize aqueous solution of acetic
acid and sodium chlorite (Kumar et al., 2013). In water solution, sodium chlorite (NaClO2)
becomes a strong and stable alkali, but when acidified it forms gaseous chlorine dioxide (ClO2),
which is a highly selective bleaching reagent, preferentially oxidizing lignin in the presence of
carbohydrates thereby fulfilling the requirement of pretreatment (Svenson et al., 2006). Kumar et
al. (2013) carried out the reaction at 70 °C for 8 h with successive addition (every two hour) of
fresh sodium chlorite and acetic acid at loadings of 0.6 g/g dry biomass of NaClO2 and 0.6 ml/g
dry biomass of acetic acid. They removed more than 90 % lignin from all biomass they studied.
In another study, Siqueira et al., (2013) employed NaClO2 to increase enzymatic digestibility of
118
sugarcane bagasse by removing lignin. They observed that removing approximately 60% of lignin
can result in a considerable increase in cellulose conversion (80%) after 72 h of hydrolysis of feed
stocks. Yu et al., (2011) investigated the effect of delignification methods on enzymatic hydrolysis
of forest biomass using softwood and hardwood that were pretreated at an alkaline condition
followed by NaClO2 or ozone delignification. They found both delignifications improved
enzymatic hydrolysis especially for softwood, while pretreatment alone was found effective for
hardwood. A recent laboratory investigation by Sannigrahi et al., (2012) explored the use of an
aqueous solution of ethanol and ClO2 mixture for ethanol production from sweet gum. They
achieved 87% ethanol yield with sweet gum treated using 60% ethanol solution with 1.1% ClO2,
liquid/solid ratio 7, 75 °C, 3 hours.
Acid-chlorite primarily acts on lignin in biomass, but it can also affect the polysaccharides. The
two most likely scenarios for cellulose degradation during acid-chlorite delignification are acidic
cleavage of the glycosidic bonds and/or oxidative degradation of the polysaccharides (Hubbell &
Ragauskas, 2010). However, the oxidation efficiency of acid chlorite treatment largely depends on
pH as ClO2 is generated from the acid chlorite solution at pH below 4 (Svenson et al., 2006).
Usually, acetic acid is added to the delignification procedure to reduce pH.
On the other hand, aqueous ammonia (NH3) is widely used in various pretreatment processes
including ammonia recycle percolation (ARP), ammonia fiber explosion (AFEX) and soaking in
aqueous ammonia (SAA) (Gupta & Lee, 2010; Gupta & Lee, 2009; Kim et al., 2016; Kim et al.,
2003). Under normal pretreatment conditions, ammonia in aqueous solution reacts primarily with
lignin showing little effects on carbohydrates in biomass (Gupta & Lee, 2010). The ammonia based
processes have been proven to be effective in improving the glucan digestibility (Kim et al., 2003).
119
In this study, a two-step pretreatment was performed to enhance the overall efficiency of enzymatic
deconstruction of agricultural residue to monomeric sugars feedstocks. In the 1st stages called as
primary stage, feedstocks were treated with either alkali or acid. Then the washed sample was
treated with ClO2 at 2nd stage (secondary stage) before performing enzymatic hydrolysis. The
objective of this study is to determine the effectiveness of ClO2 as a secondary reagent, and to
identify the underlying cause of its effectiveness.
5.3 Materials and Methods
5.3.1 Feedstock and reagents
Corn stover and poplar were dried, milled and the fraction between 20-80 mesh was used as
standard laboratory feedstocks. All chemicals except ClO2 used in this study purchased from VWR
(Radnor, PA) were of analytical grade and used without purification. ClO2 was synthesis in our
lab according to procedure described in AkzoNobel Pulp and Performance Chemicals brochure
(personal communication).
5.3.2 Experimental procedure for pretreatment
Primary pretreatment (Stage-1): Primary pretreatment reactions were carried out in stainless steel
reactors (ID: 1.375 inch and Length: 6 inch). The reactors were loaded with appropriate amount
of feedstocks with required amount of pretreatment reagent (mostly aqueous ammonia) with solid/
liquid (S: L) ratio of 1:10. The sealed reactors were placed in constant-temperature oven. The
reactor was preheated for 15–30 min to reach the set temperature and maintained at the level for
desired period of time. The reaction time in this report is defined as the duration after it reached
the set temperature. Once pretreatment was done, the reactors were removed from the oven and
quenched in cold water to room temperature to stop the reaction. After the reactor reached room
temperature, the contents in the reactor was filtered out by vacuum filtration. The pH of the liquid
120
was measured before washing and the solid part was washed for subsequent analysis until it
achieved a pH of 7.
Secondary pretreatment (Stage-2): Secondary pretreatment were carried out in screw-capped
laboratory tubular glass reactors following the same procedure as primary treatment other than that
water bath was used for heating. The washed solid samples obtained from 1st stage were mixed
with required amount of specified concentration of ClO2 with a S: L ratio of 1:10 to maintain
consistency of chemical usage per gram of dry biomass. The reactors were filled to 50 % of the
total volume to allow for volume expansion due to heating. After the pretreatment reaction, the
content in the reactor was filtered out by vacuum filtration.
5.3.3 Enzymatic hydrolysis
The cellulase enzyme (Cellic C-Tec 2) was a generous gift from Novozymes (North America,
Franklinton, NC). Its specific enzyme activity was 119 FPU/mL and total protein number was 255
mg/mL was applied to pretreated feedstocks. The enzymatic digestibility tests were carried out
in screw capped 125 mL Erlenmeyer flasks at 50°C, and pH 4.8 using 0.05 M sodium citrate buffer
in an incubator shaker (New Brunswick Scientific, Innova-4080) agitated at 150 rpm. Antibiotics
sodium nitride was added into the reaction media to maintain sterile conditions. The digestibility
tests for treated biomass were done with 1 g dry biomass loading/50 mL of total reactant volume.
The hydrolysate samples taken at different time period (12, 24, 48, and 72 h) were analyzed in
HPLC to measure the level of glucose and xylose. The glucose content released at different time
period of hydrolysis was used to calculate the enzymatic digestibility (Kothari & Lee, 2011).
5.3.4 Composition analysis
The composition of the feedstocks was analyzed by the NREL standard protocols to determine
sugar components in carbohydrates, lignin, and ash. Each sample was analyzed duplicate. The
121
moisture content was measured by infrared moisture balance (Denver Instrument, IR-30). Sugars
were determined using an HPLC system consisting of a AcuFlow Series III pump (LabX, Midland,
ON, Canada), Alcott 708 auto sampler (LabX, Midland, ON, Canada), a Bio-Rad HPX-87P or a
Bio-Rad HPX-87H column (Hercules, CA) , a refractive index detector (Shodex, NY) and
PeakSimple Chromatography Data Systems(Torrance, CA). Ultrapure DI water was used as
carriers at a flow rate of 0.55 ml/min for the Bio-Rad HPX-87P. The aqueous solution of 0.005
M sulfuric acid with a flow rate of 0.55 ml/min was selected as mobile phase for Bio-Rad HPX-
87H column. In both cases, the columns were operated at 85 °C. The analysis for a sample was
completed within 40 minutes.
5.3.5 FTIR and SEM analysis
The infrared spectra of biomass were recorded in the range of 650–4000 cm-1 on a PerkinElmer
(Waltham, MA, USA) 400 FT-NIR spectrometer using 32 scans, a resolution of 4 cm−1 and
interval of 1 cm-1. The SEM pictures of the biomass samples were taken by a ZEISS DSM940
scanning electron microscope.
5.3.6 Biomass crystallinity
The XRD patterns were obtained using a Bruker D8 Discover diffractometer. The spectra were
acquired at a scan rate of 1.6 degrees/min between 2θ = 5 to 35. An accelerating voltage of 40 kV
was used at 40 mA. The crystallinity index (CI) was calculated according to the equation: CI= (I002
–I18)/I002, where, I002 is the diffraction intensity of peaks corresponding to lattice plane of 002
(2θ=22.6°) and I18 is the intensity of the amorphous background, which has a minimum value
between lattice planes of 101 and 002 (2θ=18°) (Kim et al., 2003).
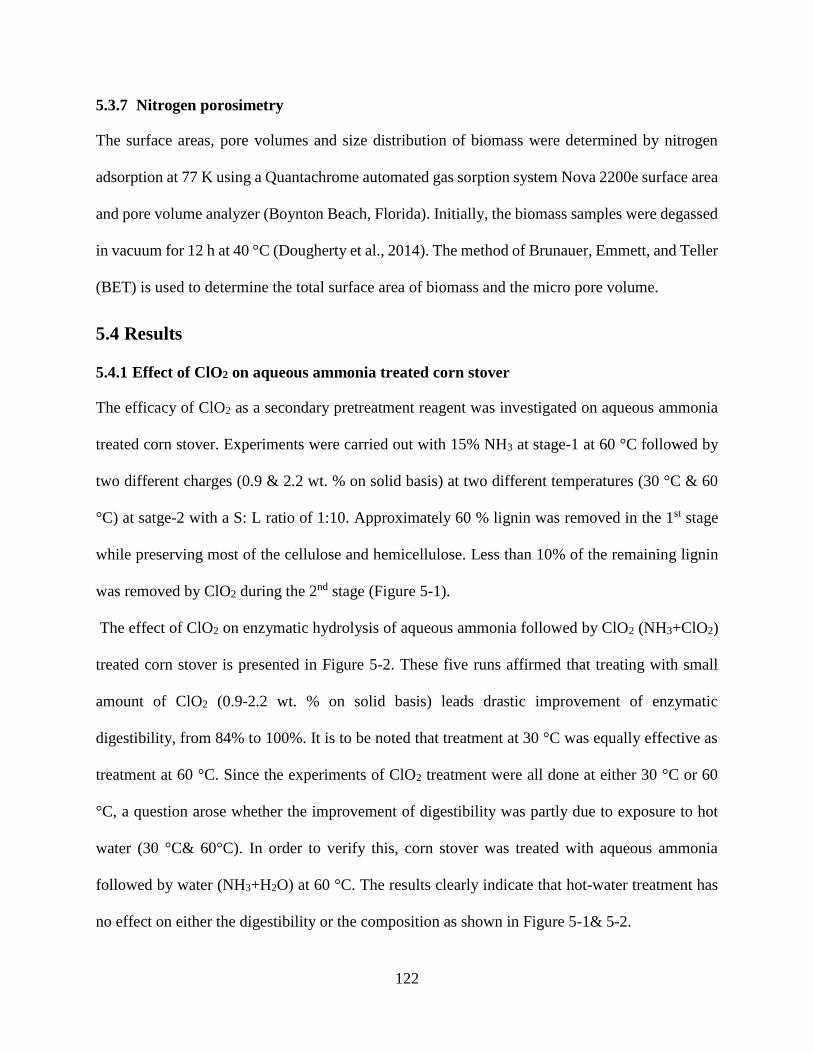
122
5.3.7 Nitrogen porosimetry
The surface areas, pore volumes and size distribution of biomass were determined by nitrogen
adsorption at 77 K using a Quantachrome automated gas sorption system Nova 2200e surface area
and pore volume analyzer (Boynton Beach, Florida). Initially, the biomass samples were degassed
in vacuum for 12 h at 40 °C (Dougherty et al., 2014). The method of Brunauer, Emmett, and Teller
(BET) is used to determine the total surface area of biomass and the micro pore volume.
5.4 Results
5.4.1 Effect of ClO2 on aqueous ammonia treated corn stover
The efficacy of ClO2 as a secondary pretreatment reagent was investigated on aqueous ammonia
treated corn stover. Experiments were carried out with 15% NH3 at stage-1 at 60 °C followed by
two different charges (0.9 & 2.2 wt. % on solid basis) at two different temperatures (30 °C & 60
°C) at satge-2 with a S: L ratio of 1:10. Approximately 60 % lignin was removed in the 1st stage
while preserving most of the cellulose and hemicellulose. Less than 10% of the remaining lignin
was removed by ClO2 during the 2nd stage (Figure 5-1).
The effect of ClO2 on enzymatic hydrolysis of aqueous ammonia followed by ClO2 (NH3+ClO2)
treated corn stover is presented in Figure 5-2. These five runs affirmed that treating with small
amount of ClO2 (0.9-2.2 wt. % on solid basis) leads drastic improvement of enzymatic
digestibility, from 84% to 100%. It is to be noted that treatment at 30 °C was equally effective as
treatment at 60 °C. Since the experiments of ClO2 treatment were all done at either 30 °C or 60
°C, a question arose whether the improvement of digestibility was partly due to exposure to hot
water (30 °C& 60°C). In order to verify this, corn stover was treated with aqueous ammonia
followed by water (NH3+H2O) at 60 °C. The results clearly indicate that hot-water treatment has
no effect on either the digestibility or the composition as shown in Figure 5-1& 5-2.
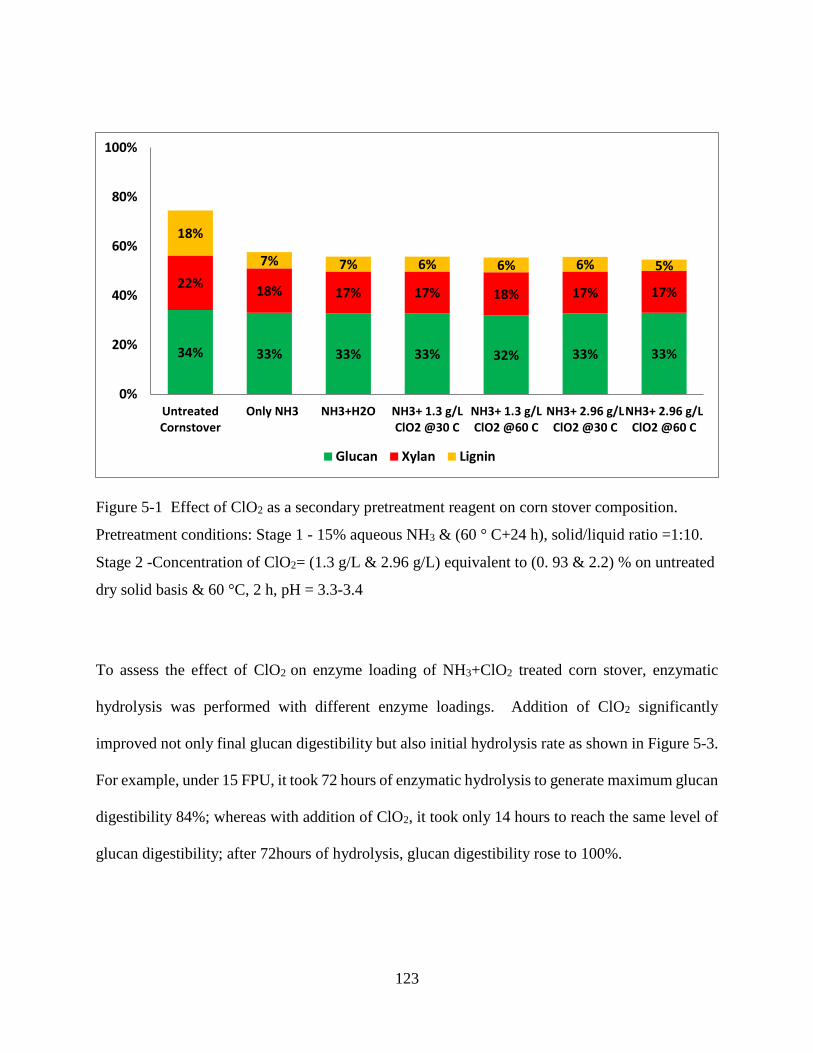
123
Figure 5-1 Effect of ClO2 as a secondary pretreatment reagent on corn stover composition.
Pretreatment conditions: Stage 1 - 15% aqueous NH3 & (60 ° C+24 h), solid/liquid ratio =1:10.
Stage 2 -Concentration of ClO2= (1.3 g/L & 2.96 g/L) equivalent to (0. 93 & 2.2) % on untreated
dry solid basis & 60 °C, 2 h, pH = 3.3-3.4
To assess the effect of ClO2 on enzyme loading of NH3+ClO2 treated corn stover, enzymatic
hydrolysis was performed with different enzyme loadings. Addition of ClO2 significantly
improved not only final glucan digestibility but also initial hydrolysis rate as shown in Figure 5-3.
For example, under 15 FPU, it took 72 hours of enzymatic hydrolysis to generate maximum glucan
digestibility 84%; whereas with addition of ClO2, it took only 14 hours to reach the same level of
glucan digestibility; after 72hours of hydrolysis, glucan digestibility rose to 100%.
34% 33% 33% 33% 32% 33% 33%
22%18% 17% 17% 18% 17% 17%
18%
7% 7% 6% 6% 6% 5%
0%
20%
40%
60%
80%
100%
UntreatedCornstover
Only NH3 NH3+H2O NH3+ 1.3 g/LClO2 @30 C
NH3+ 1.3 g/LClO2 @60 C
NH3+ 2.96 g/LClO2 @30 C
NH3+ 2.96 g/LClO2 @60 C
Glucan Xylan Lignin
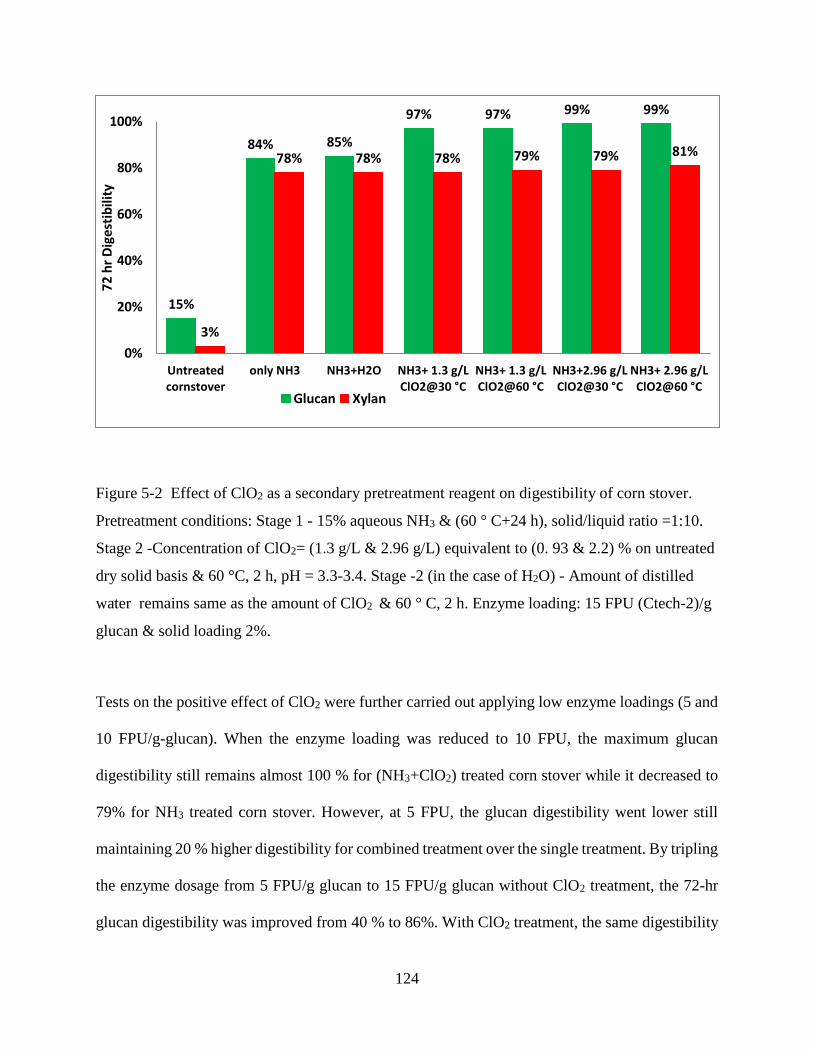
124
Figure 5-2 Effect of ClO2 as a secondary pretreatment reagent on digestibility of corn stover.
Pretreatment conditions: Stage 1 - 15% aqueous NH3 & (60 ° C+24 h), solid/liquid ratio =1:10.
Stage 2 -Concentration of ClO2= (1.3 g/L & 2.96 g/L) equivalent to (0. 93 & 2.2) % on untreated
dry solid basis & 60 °C, 2 h, pH = 3.3-3.4. Stage -2 (in the case of H2O) - Amount of distilled
water remains same as the amount of ClO2 & 60 ° C, 2 h. Enzyme loading: 15 FPU (Ctech-2)/g
glucan & solid loading 2%.
Tests on the positive effect of ClO2 were further carried out applying low enzyme loadings (5 and
10 FPU/g-glucan). When the enzyme loading was reduced to 10 FPU, the maximum glucan
digestibility still remains almost 100 % for (NH3+ClO2) treated corn stover while it decreased to
79% for NH3 treated corn stover. However, at 5 FPU, the glucan digestibility went lower still
maintaining 20 % higher digestibility for combined treatment over the single treatment. By tripling
the enzyme dosage from 5 FPU/g glucan to 15 FPU/g glucan without ClO2 treatment, the 72-hr
glucan digestibility was improved from 40 % to 86%. With ClO2 treatment, the same digestibility
15%
84% 85%
97% 97% 99% 99%
3%
78% 78% 78% 79% 79% 81%
0%
20%
40%
60%
80%
100%
Untreatedcornstover
only NH3 NH3+H2O NH3+ 1.3 g/LClO2@30 °C
NH3+ 1.3 g/LClO2@60 °C
NH3+2.96 g/LClO2@30 °C
NH3+ 2.96 g/LClO2@60 °C
72
hr
Dig
esti
bili
ty
Glucan Xylan
125
can be obtained with enzyme dosage less than 10 FPU /g glucan. These data prove that it can be
an effective tool to reduce enzyme cost in the enzymatic saccharification of corn stover. We also
note that digestibility in the range of 70-80% is acceptable from a process viewpoint. However,
ClO2 treatment did not show any effect on the xylan digestibility in all three different enzymes
loading as shown in Figure 5-4.
Figure 5-3 Effect of enzyme loading on glucan digestibility of aqueous NH3 followed by ClO2
(NH3+ ClO2) treated corn stover. Pretreatment conditions: Stage 1 - 15% NH3 & (60 ° C+24 h),
solid/liquid ratio= 1:10. Stage 2 - Concentration of ClO2= ( 2.96 g/L) equivalent to (2.2) % on
untreated dry solid basis & 60 ° C, 2 h, pH = 3.3-3.4. Enzyme loading: 15 FPU (Ctech-2)/g
glucan & solid loading 2%.
0%
20%
40%
60%
80%
100%
0 10 20 30 40 50 60 70 80
Glu
can
dig
est
ibili
ty
h
15 FPU+ NH3+ ClO215 FPU + NH310 FPU+ NH3+ClO210 FPU+ NH35 FPU+ NH3+ClO25 FPU+ NH3
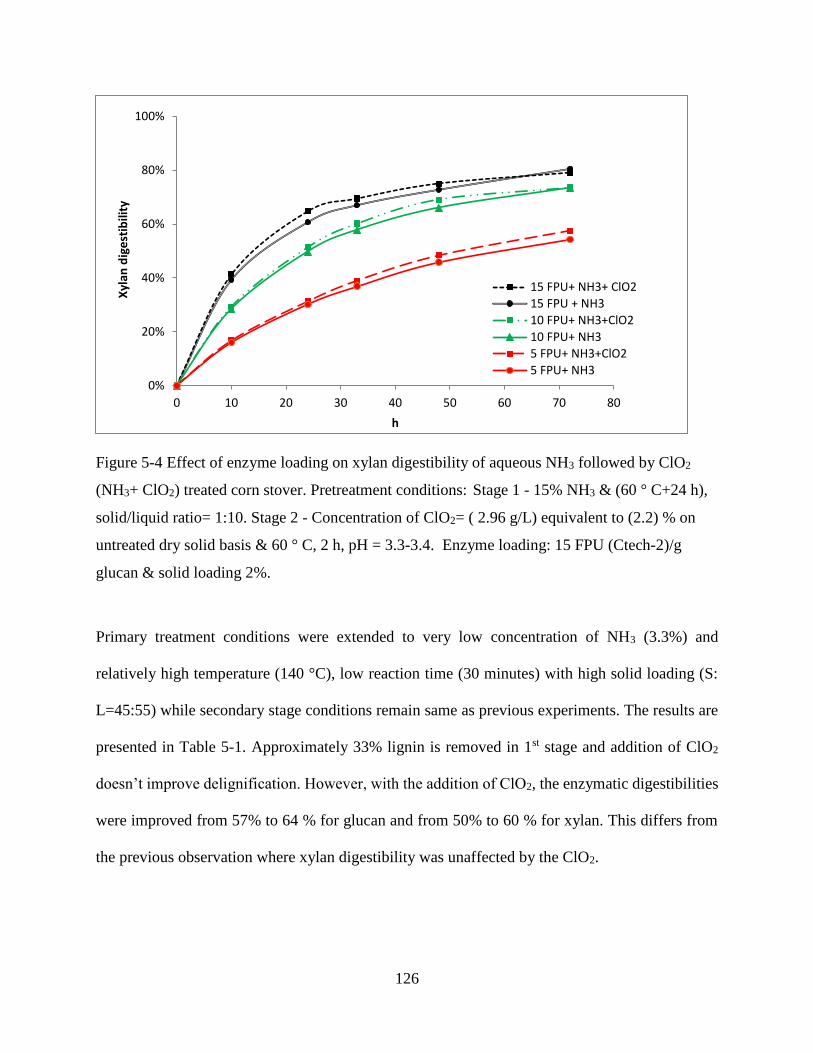
126
Figure 5-4 Effect of enzyme loading on xylan digestibility of aqueous NH3 followed by ClO2
(NH3+ ClO2) treated corn stover. Pretreatment conditions: Stage 1 - 15% NH3 & (60 ° C+24 h),
solid/liquid ratio= 1:10. Stage 2 - Concentration of ClO2= ( 2.96 g/L) equivalent to (2.2) % on
untreated dry solid basis & 60 ° C, 2 h, pH = 3.3-3.4. Enzyme loading: 15 FPU (Ctech-2)/g
glucan & solid loading 2%.
Primary treatment conditions were extended to very low concentration of NH3 (3.3%) and
relatively high temperature (140 °C), low reaction time (30 minutes) with high solid loading (S:
L=45:55) while secondary stage conditions remain same as previous experiments. The results are
presented in Table 5-1. Approximately 33% lignin is removed in 1st stage and addition of ClO2
doesn’t improve delignification. However, with the addition of ClO2, the enzymatic digestibilities
were improved from 57% to 64 % for glucan and from 50% to 60 % for xylan. This differs from
the previous observation where xylan digestibility was unaffected by the ClO2.
0%
20%
40%
60%
80%
100%
0 10 20 30 40 50 60 70 80
Xyl
an d
ige
stib
ility
h
15 FPU+ NH3+ ClO2
15 FPU + NH3
10 FPU+ NH3+ClO2
10 FPU+ NH3
5 FPU+ NH3+ClO2
5 FPU+ NH3
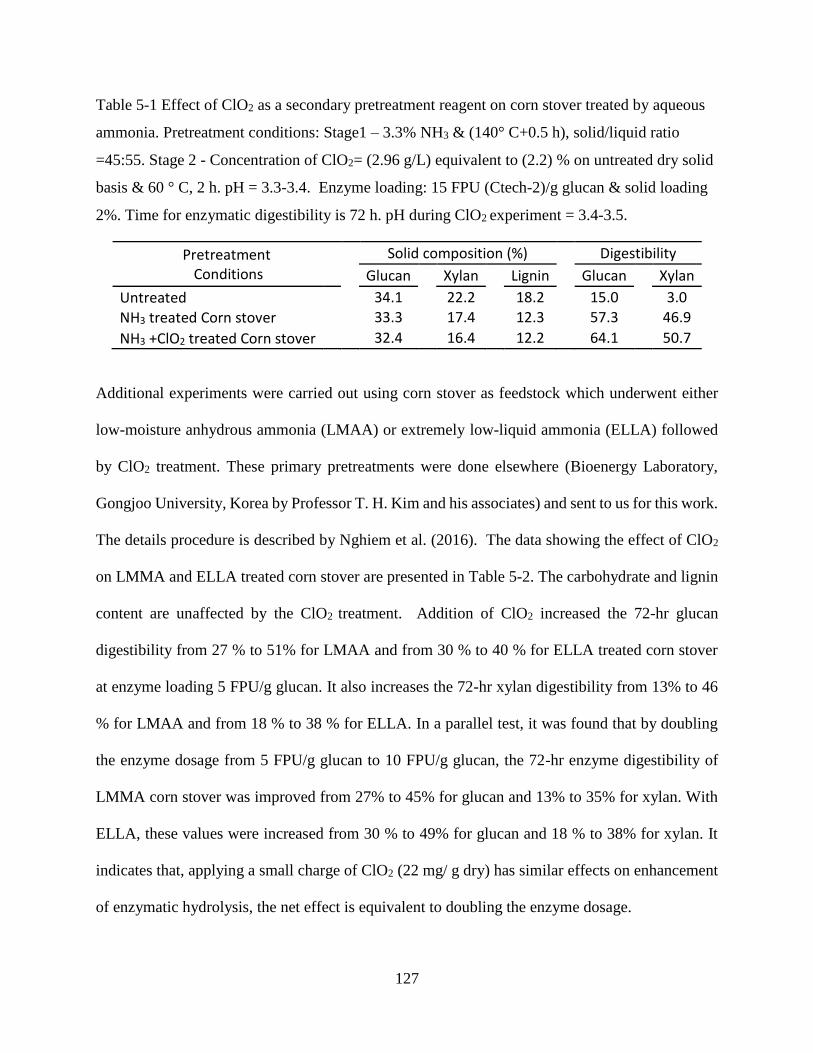
127
Table 5-1 Effect of ClO2 as a secondary pretreatment reagent on corn stover treated by aqueous
ammonia. Pretreatment conditions: Stage1 – 3.3% NH3 & (140° C+0.5 h), solid/liquid ratio
=45:55. Stage 2 - Concentration of ClO2= (2.96 g/L) equivalent to (2.2) % on untreated dry solid
basis & 60 ° C, 2 h. pH = 3.3-3.4. Enzyme loading: 15 FPU (Ctech-2)/g glucan & solid loading
2%. Time for enzymatic digestibility is 72 h. pH during ClO2 experiment = 3.4-3.5.
Pretreatment Conditions
Solid composition (%) Digestibility
Glucan Xylan Lignin Glucan Xylan
Untreated 34.1 22.2 18.2 15.0 3.0
NH3 treated Corn stover 33.3 17.4 12.3 57.3 46.9
NH3 +ClO2 treated Corn stover 32.4 16.4 12.2 64.1 50.7
Additional experiments were carried out using corn stover as feedstock which underwent either
low-moisture anhydrous ammonia (LMAA) or extremely low-liquid ammonia (ELLA) followed
by ClO2 treatment. These primary pretreatments were done elsewhere (Bioenergy Laboratory,
Gongjoo University, Korea by Professor T. H. Kim and his associates) and sent to us for this work.
The details procedure is described by Nghiem et al. (2016). The data showing the effect of ClO2
on LMMA and ELLA treated corn stover are presented in Table 5-2. The carbohydrate and lignin
content are unaffected by the ClO2 treatment. Addition of ClO2 increased the 72-hr glucan
digestibility from 27 % to 51% for LMAA and from 30 % to 40 % for ELLA treated corn stover
at enzyme loading 5 FPU/g glucan. It also increases the 72-hr xylan digestibility from 13% to 46
% for LMAA and from 18 % to 38 % for ELLA. In a parallel test, it was found that by doubling
the enzyme dosage from 5 FPU/g glucan to 10 FPU/g glucan, the 72-hr enzyme digestibility of
LMMA corn stover was improved from 27% to 45% for glucan and 13% to 35% for xylan. With
ELLA, these values were increased from 30 % to 49% for glucan and 18 % to 38% for xylan. It
indicates that, applying a small charge of ClO2 (22 mg/ g dry) has similar effects on enhancement
of enzymatic hydrolysis, the net effect is equivalent to doubling the enzyme dosage.
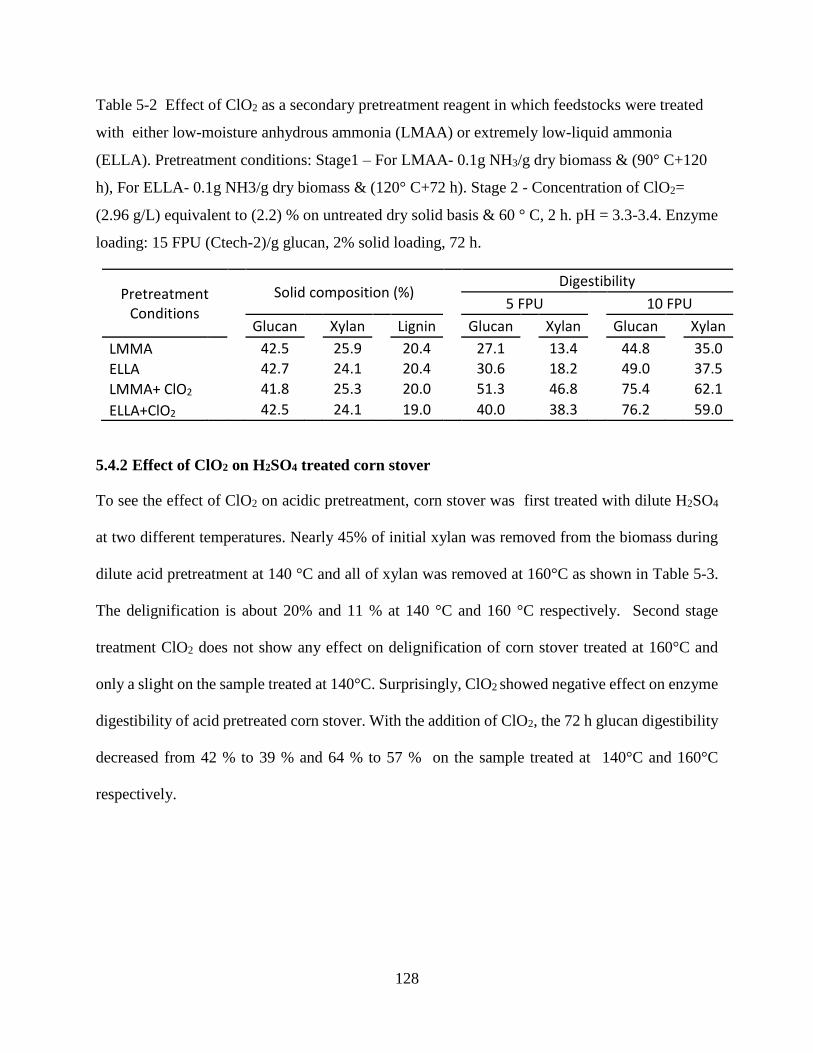
128
Table 5-2 Effect of ClO2 as a secondary pretreatment reagent in which feedstocks were treated
with either low-moisture anhydrous ammonia (LMAA) or extremely low-liquid ammonia
(ELLA). Pretreatment conditions: Stage1 – For LMAA- 0.1g NH3/g dry biomass & (90° C+120
h), For ELLA- 0.1g NH3/g dry biomass & (120° C+72 h). Stage 2 - Concentration of ClO2=
(2.96 g/L) equivalent to (2.2) % on untreated dry solid basis & 60 ° C, 2 h. pH = 3.3-3.4. Enzyme
loading: 15 FPU (Ctech-2)/g glucan, 2% solid loading, 72 h.
Pretreatment Conditions
Solid composition (%)
Digestibility
5 FPU 10 FPU
Glucan Xylan Lignin Glucan Xylan Glucan Xylan
LMMA 42.5 25.9 20.4 27.1 13.4 44.8 35.0
ELLA 42.7 24.1 20.4 30.6 18.2 49.0 37.5
LMMA+ ClO2 41.8 25.3 20.0 51.3 46.8 75.4 62.1
ELLA+ClO2 42.5 24.1 19.0 40.0 38.3 76.2 59.0
5.4.2 Effect of ClO2 on H2SO4 treated corn stover
To see the effect of ClO2 on acidic pretreatment, corn stover was first treated with dilute H2SO4
at two different temperatures. Nearly 45% of initial xylan was removed from the biomass during
dilute acid pretreatment at 140 °C and all of xylan was removed at 160°C as shown in Table 5-3.
The delignification is about 20% and 11 % at 140 °C and 160 °C respectively. Second stage
treatment ClO2 does not show any effect on delignification of corn stover treated at 160°C and
only a slight on the sample treated at 140°C. Surprisingly, ClO2 showed negative effect on enzyme
digestibility of acid pretreated corn stover. With the addition of ClO2, the 72 h glucan digestibility
decreased from 42 % to 39 % and 64 % to 57 % on the sample treated at 140°C and 160°C
respectively.
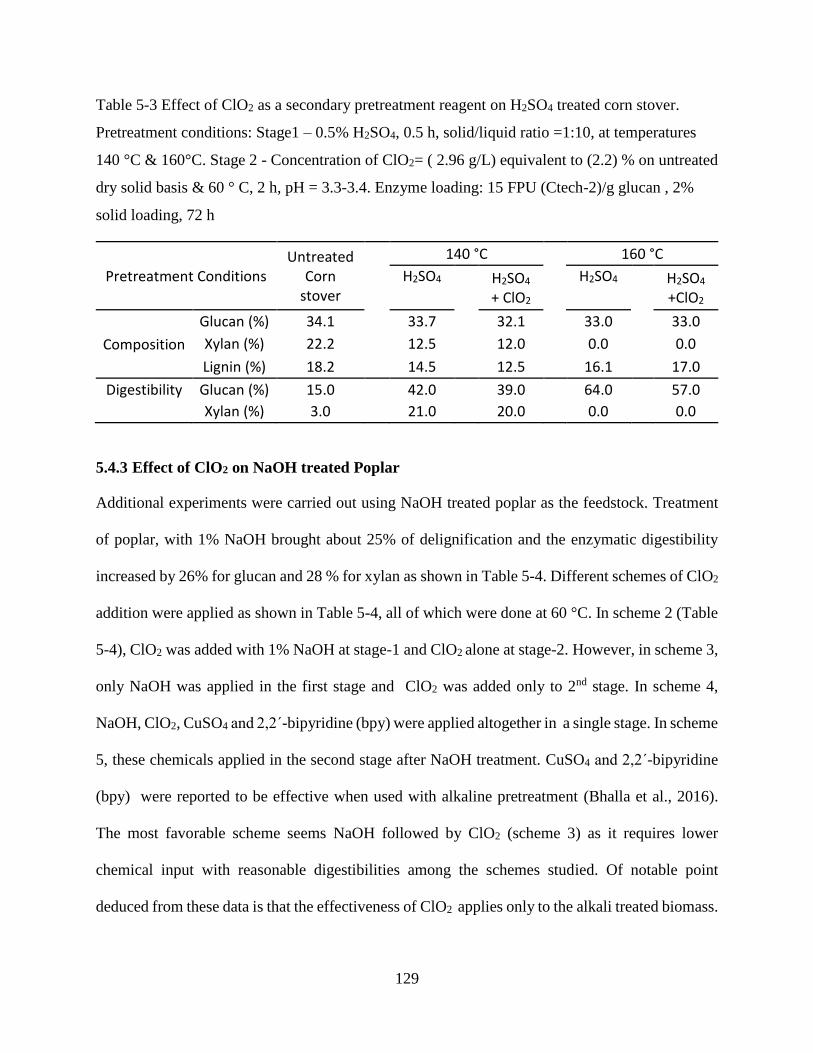
129
Table 5-3 Effect of ClO2 as a secondary pretreatment reagent on H2SO4 treated corn stover.
Pretreatment conditions: Stage1 – 0.5% H2SO4, 0.5 h, solid/liquid ratio =1:10, at temperatures
140 °C & 160°C. Stage 2 - Concentration of ClO2= ( 2.96 g/L) equivalent to (2.2) % on untreated
dry solid basis & 60 ° C, 2 h, pH = 3.3-3.4. Enzyme loading: 15 FPU (Ctech-2)/g glucan , 2%
solid loading, 72 h
Pretreatment Conditions Untreated
Corn stover
140 °C 160 °C
H2SO4
H2SO4 + ClO2
H2SO4
H2SO4 +ClO2
Composition
Glucan (%) 34.1 33.7 32.1 33.0 33.0
Xylan (%) 22.2 12.5 12.0 0.0 0.0
Lignin (%) 18.2 14.5 12.5 16.1 17.0
Digestibility Glucan (%) 15.0 42.0 39.0 64.0 57.0
Xylan (%) 3.0 21.0 20.0 0.0 0.0
5.4.3 Effect of ClO2 on NaOH treated Poplar
Additional experiments were carried out using NaOH treated poplar as the feedstock. Treatment
of poplar, with 1% NaOH brought about 25% of delignification and the enzymatic digestibility
increased by 26% for glucan and 28 % for xylan as shown in Table 5-4. Different schemes of ClO2
addition were applied as shown in Table 5-4, all of which were done at 60 °C. In scheme 2 (Table
5-4), ClO2 was added with 1% NaOH at stage-1 and ClO2 alone at stage-2. However, in scheme 3,
only NaOH was applied in the first stage and ClO2 was added only to 2nd stage. In scheme 4,
NaOH, ClO2, CuSO4 and 2,2ˊ-bipyridine (bpy) were applied altogether in a single stage. In scheme
5, these chemicals applied in the second stage after NaOH treatment. CuSO4 and 2,2ˊ-bipyridine
(bpy) were reported to be effective when used with alkaline pretreatment (Bhalla et al., 2016).
The most favorable scheme seems NaOH followed by ClO2 (scheme 3) as it requires lower
chemical input with reasonable digestibilities among the schemes studied. Of notable point
deduced from these data is that the effectiveness of ClO2 applies only to the alkali treated biomass.
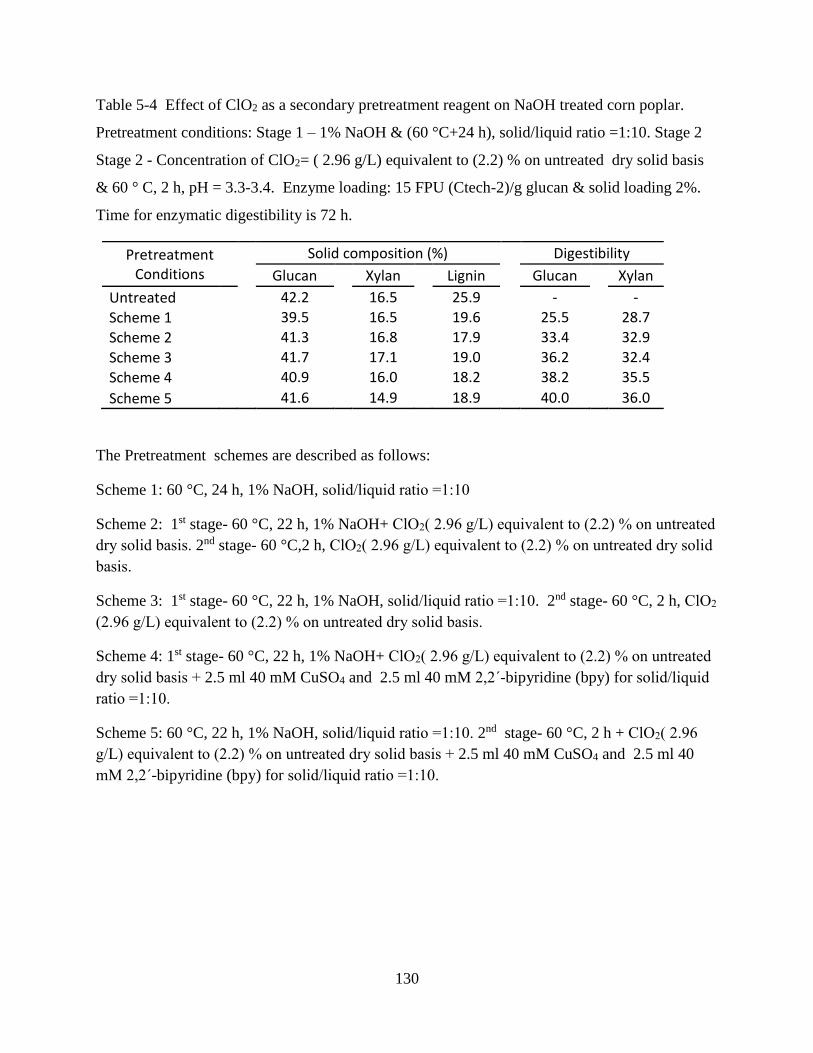
130
Table 5-4 Effect of ClO2 as a secondary pretreatment reagent on NaOH treated corn poplar.
Pretreatment conditions: Stage 1 – 1% NaOH & (60 °C+24 h), solid/liquid ratio =1:10. Stage 2
Stage 2 - Concentration of ClO2= ( 2.96 g/L) equivalent to (2.2) % on untreated dry solid basis
& 60 ° C, 2 h, pH = 3.3-3.4. Enzyme loading: 15 FPU (Ctech-2)/g glucan & solid loading 2%.
Time for enzymatic digestibility is 72 h.
Pretreatment Conditions
Solid composition (%) Digestibility
Glucan Xylan Lignin Glucan Xylan
Untreated 42.2 16.5 25.9 - -
Scheme 1 39.5 16.5 19.6 25.5 28.7
Scheme 2 41.3 16.8 17.9 33.4 32.9
Scheme 3 41.7 17.1 19.0 36.2 32.4
Scheme 4 40.9 16.0 18.2 38.2 35.5
Scheme 5 41.6 14.9 18.9 40.0 36.0
The Pretreatment schemes are described as follows:
Scheme 1: 60 °C, 24 h, 1% NaOH, solid/liquid ratio =1:10
Scheme 2: 1st stage- 60 °C, 22 h, 1% NaOH+ ClO2( 2.96 g/L) equivalent to (2.2) % on untreated
dry solid basis. 2nd stage- 60 °C,2 h, ClO2( 2.96 g/L) equivalent to (2.2) % on untreated dry solid
basis.
Scheme 3: 1st stage- 60 °C, 22 h, 1% NaOH, solid/liquid ratio =1:10. 2nd stage- 60 °C, 2 h, ClO2
(2.96 g/L) equivalent to (2.2) % on untreated dry solid basis.
Scheme 4: 1st stage- 60 °C, 22 h, 1% NaOH+ ClO2( 2.96 g/L) equivalent to (2.2) % on untreated
dry solid basis + 2.5 ml 40 mM CuSO4 and 2.5 ml 40 mM 2,2ˊ-bipyridine (bpy) for solid/liquid
ratio =1:10.
Scheme 5: 60 °C, 22 h, 1% NaOH, solid/liquid ratio =1:10. 2nd stage- 60 °C, 2 h + ClO2( 2.96
g/L) equivalent to (2.2) % on untreated dry solid basis + 2.5 ml 40 mM CuSO4 and 2.5 ml 40
mM 2,2ˊ-bipyridine (bpy) for solid/liquid ratio =1:10.
131
5.5 Discussions
The pretreatment efficiency on enzymatic hydrolysis largely depends on biomass composition
(Balan et al., 2009). In general, alkaline pretreatments targets on the removal of the lignin
component, whereas, acidic pretreatments primarily solubilize the hemicellulose fraction of the
carbohydrates. Pretreatment also affects the physical and chemical structure of lignin. Lignin
physically blocks the access of cellulase enzyme to cellulose and forms unproductive binding with
the cellulase enzyme, reducing the amount of active enzyme (Gupta & Lee, 2010). Hence, the
amount and the characteristics of lignin are regarded as the main factors affecting the enzymatic
digestion of the carbohydrates.
5.5.1 Lignin reaction under alkaline conditions at the primary stage
Under alkali conditions, in general, the carbon-carbon bonds in lignin are stable, whereas the
carbon-oxygen bonds are liable to cleavage (Santos et al., 2013). The fragmentation of lignin
during alkaline treatment including NH3 pretreatment (primary stage) is mainly due to by the
cleavage of both α- and β- aryl ether linkages (Santos et al., 2013). Most of the inter-unit β-O-4
ether structures are cleaved but alkali stable ether linkages between lignin and polysaccharides
tend to remain intact. An increased degree of branching and /or cross-linking is also found during
the treatment (Gellerstedt et al., 1995). Due to the structural changes, the residual lignin becomes
less reactive. The phenolic end groups are the most abundant reactive ligands exist within the
residual lignin. Low amount of non-phenolic groups such as styrene and stilbene are also observed
(Gellerstedt et al., 1995).
5.5.2 Lignin reaction with ClO2 at the secondary stage
In the secondary stage, ClO2 reacts preferentially with phenolic lignin units and olefinic side chains
through a radical reaction mechanism (Scheme 5-1). During chlorine dioxide oxidation of phenolic
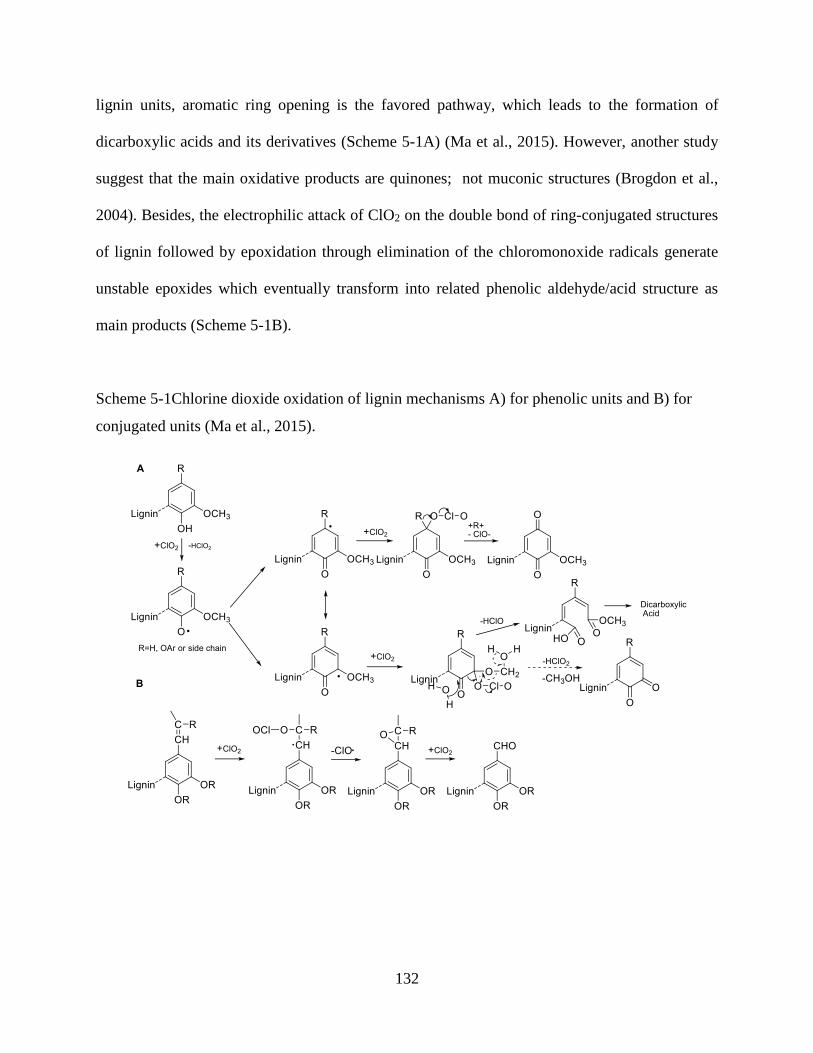
132
lignin units, aromatic ring opening is the favored pathway, which leads to the formation of
dicarboxylic acids and its derivatives (Scheme 5-1A) (Ma et al., 2015). However, another study
suggest that the main oxidative products are quinones; not muconic structures (Brogdon et al.,
2004). Besides, the electrophilic attack of ClO2 on the double bond of ring-conjugated structures
of lignin followed by epoxidation through elimination of the chloromonoxide radicals generate
unstable epoxides which eventually transform into related phenolic aldehyde/acid structure as
main products (Scheme 5-1B).
Scheme 5-1Chlorine dioxide oxidation of lignin mechanisms A) for phenolic units and B) for
conjugated units (Ma et al., 2015).
133
The initial reaction of ClO2 with phenolic lignin units and olefinic side chains moieties forms both
chlorite and hypochlorous acid (HOCl) (Svenson et al., 2006). Chlorite ions decompose in the acid
medium to reform chlorine dioxide or they react with the hypochlorous acid to form chlorate and
chloride ions. The latter reaction represents a waste of oxidation power of chlorite (Jiang et al.,
2007). Lignin oxidation by ClO2 followed by ClO2 regeneration in the acid medium continued
until all of the chlorite was consumed. As a result, at low pH, residual chlorite did not contribute
to losses in ClO2 oxidation efficiency (Svenson et al., 2006). Therefore, pH has a major effect on
ClO2 oxidation efficiency (Jiang & Berry, 2011; Svenson et al., 2006).
ClO2 oxidation of ring-conjugated structures (Scheme 1B) leads to formation of lower molecular
weight lignin fragments (Santos et al., 2013). Although ClO2 produce lignin fragment with low
molecular weight, lignin is not dissolved and removed under the acidic conditions as the pH of
ClO2 is in the range of 3.4-3.5 according to our experimental data. Therefore, Kason lignin was
not removed significantly by ClO2 from NH3 treated corn stover as shown in Figure 5-1.
5.5.3 Effect of lignin modification on enzymatic hydrolysis
Two schools of thoughts have been reported as to how lignin affect the yield of cellulose
hydrolysis. According to steric theory, the soluble enzymes while acting on an insoluble substrate
encounter ancillary components of lignin, which may restrict their access to cellulose due to
heterogeneous system. The other theory suggest that the non-productive binding of cellulases to
the lignin bonding limit the accessibility of the enzymes to the cellulose (Nakagame et al., 2010).
Although hydrophobic, electrostatic, and hydrogen bonding interactions are involved in these
cellulase-lignin interactions, the exact mechanisms by which cellulases interact with lignin and
result in the reduction in the efficiency of hydrolysis have yet to be fully resolved (Nakagame et
al., 2010).
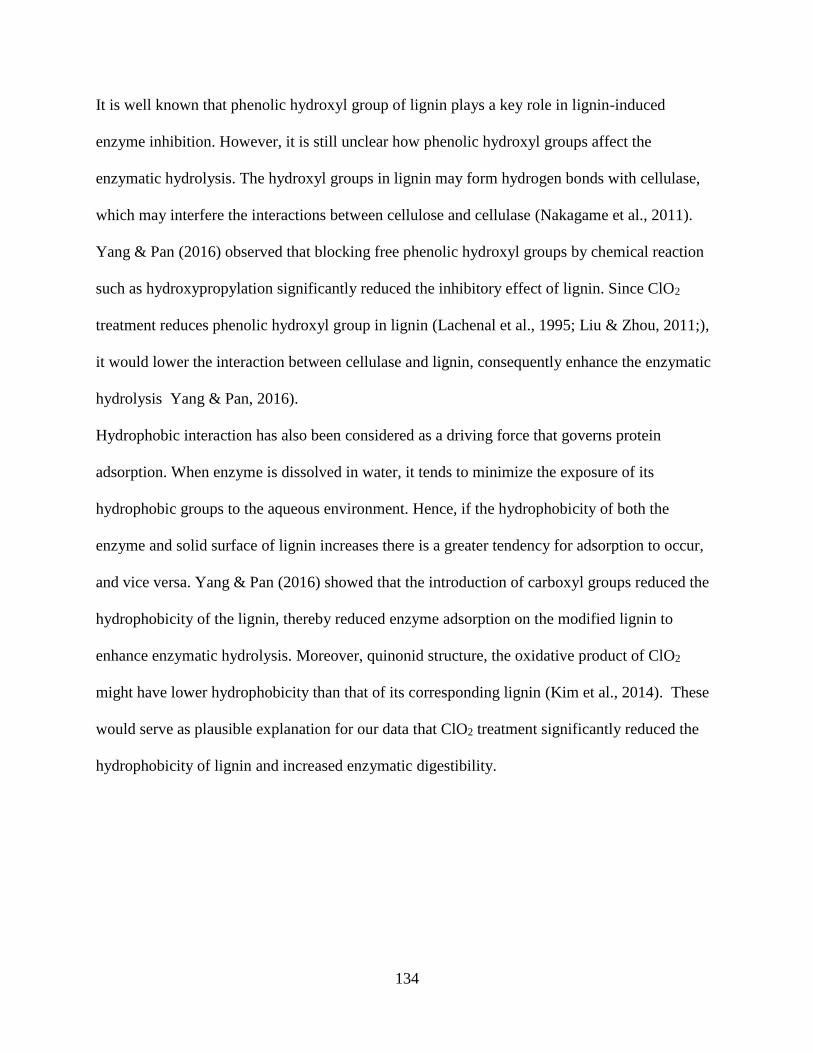
134
It is well known that phenolic hydroxyl group of lignin plays a key role in lignin-induced
enzyme inhibition. However, it is still unclear how phenolic hydroxyl groups affect the
enzymatic hydrolysis. The hydroxyl groups in lignin may form hydrogen bonds with cellulase,
which may interfere the interactions between cellulose and cellulase (Nakagame et al., 2011).
Yang & Pan (2016) observed that blocking free phenolic hydroxyl groups by chemical reaction
such as hydroxypropylation significantly reduced the inhibitory effect of lignin. Since ClO2
treatment reduces phenolic hydroxyl group in lignin (Lachenal et al., 1995; Liu & Zhou, 2011;),
it would lower the interaction between cellulase and lignin, consequently enhance the enzymatic
hydrolysis Yang & Pan, 2016).
Hydrophobic interaction has also been considered as a driving force that governs protein
adsorption. When enzyme is dissolved in water, it tends to minimize the exposure of its
hydrophobic groups to the aqueous environment. Hence, if the hydrophobicity of both the
enzyme and solid surface of lignin increases there is a greater tendency for adsorption to occur,
and vice versa. Yang & Pan (2016) showed that the introduction of carboxyl groups reduced the
hydrophobicity of the lignin, thereby reduced enzyme adsorption on the modified lignin to
enhance enzymatic hydrolysis. Moreover, quinonid structure, the oxidative product of ClO2
might have lower hydrophobicity than that of its corresponding lignin (Kim et al., 2014). These
would serve as plausible explanation for our data that ClO2 treatment significantly reduced the
hydrophobicity of lignin and increased enzymatic digestibility.
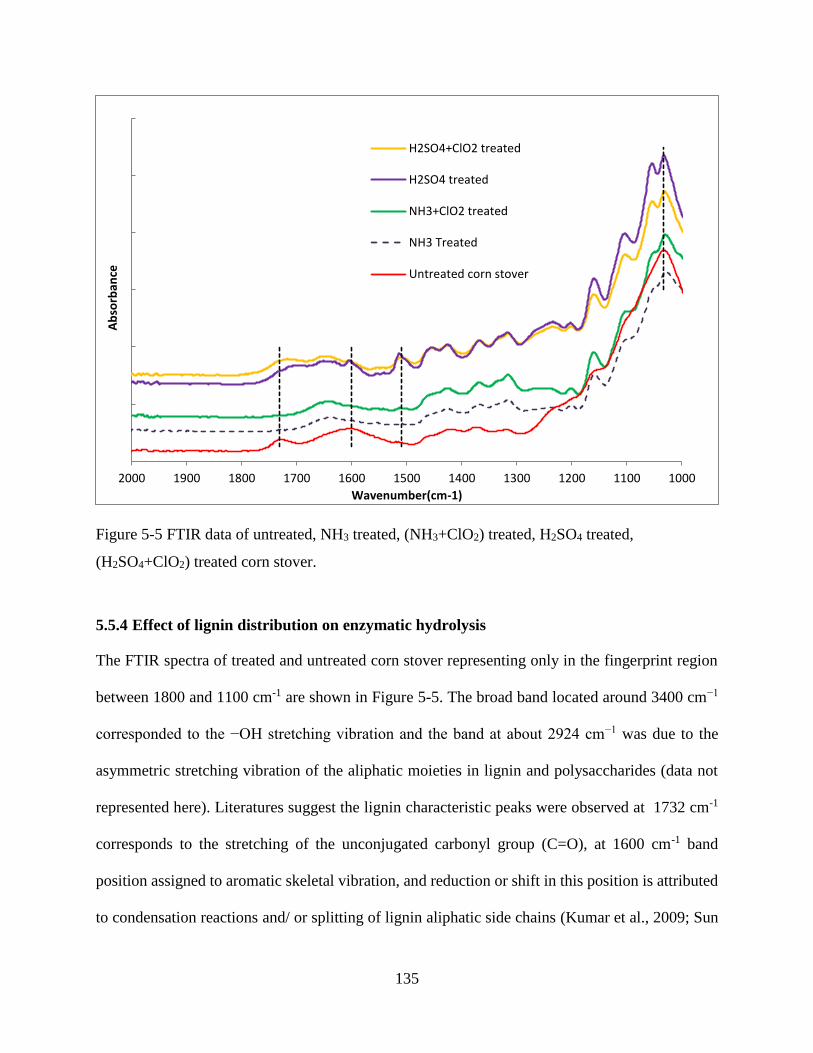
135
Figure 5-5 FTIR data of untreated, NH3 treated, (NH3+ClO2) treated, H2SO4 treated,
(H2SO4+ClO2) treated corn stover.
5.5.4 Effect of lignin distribution on enzymatic hydrolysis
The FTIR spectra of treated and untreated corn stover representing only in the fingerprint region
between 1800 and 1100 cm-1 are shown in Figure 5-5. The broad band located around 3400 cm−1
corresponded to the −OH stretching vibration and the band at about 2924 cm−1 was due to the
asymmetric stretching vibration of the aliphatic moieties in lignin and polysaccharides (data not
represented here). Literatures suggest the lignin characteristic peaks were observed at 1732 cm-1
corresponds to the stretching of the unconjugated carbonyl group (C=O), at 1600 cm-1 band
position assigned to aromatic skeletal vibration, and reduction or shift in this position is attributed
to condensation reactions and/ or splitting of lignin aliphatic side chains (Kumar et al., 2009; Sun
10001100120013001400150016001700180019002000
Ab
sorb
ance
Wavenumber(cm-1)
H2SO4+ClO2 treated
H2SO4 treated
NH3+ClO2 treated
NH3 Treated
Untreated corn stover
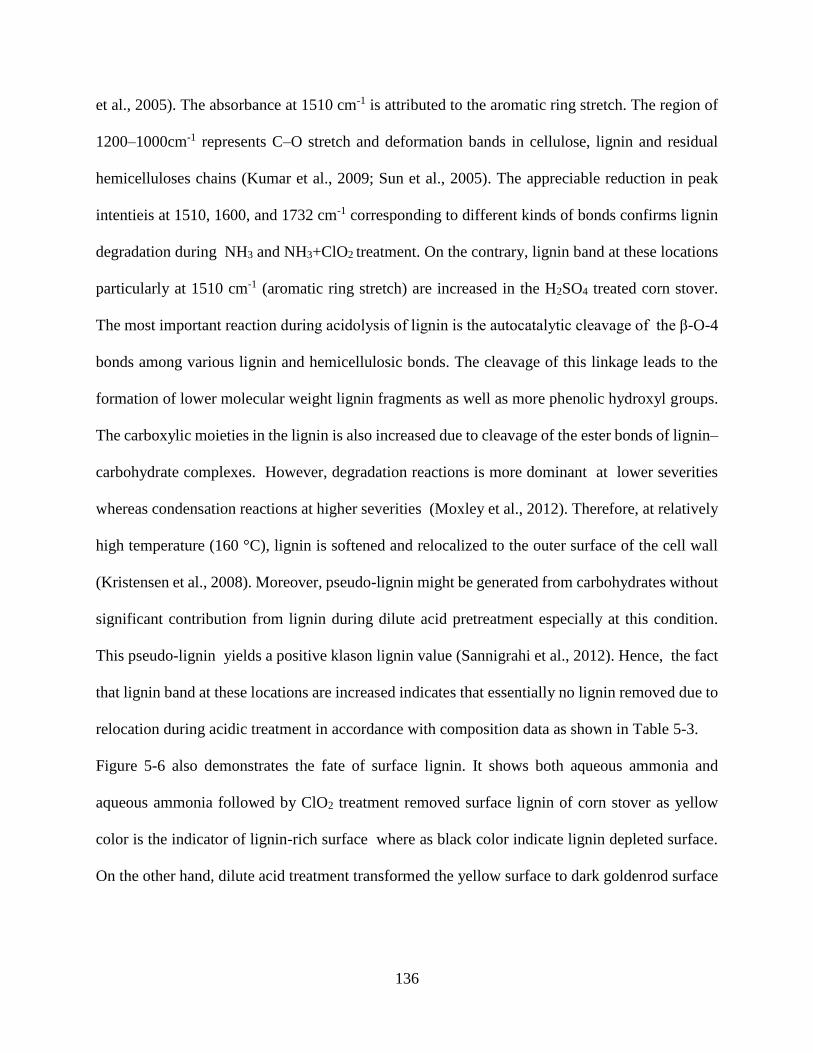
136
et al., 2005). The absorbance at 1510 cm-1 is attributed to the aromatic ring stretch. The region of
1200–1000cm-1 represents C–O stretch and deformation bands in cellulose, lignin and residual
hemicelluloses chains (Kumar et al., 2009; Sun et al., 2005). The appreciable reduction in peak
intentieis at 1510, 1600, and 1732 cm-1 corresponding to different kinds of bonds confirms lignin
degradation during NH3 and NH3+ClO2 treatment. On the contrary, lignin band at these locations
particularly at 1510 cm-1 (aromatic ring stretch) are increased in the H2SO4 treated corn stover.
The most important reaction during acidolysis of lignin is the autocatalytic cleavage of the β-O-4
bonds among various lignin and hemicellulosic bonds. The cleavage of this linkage leads to the
formation of lower molecular weight lignin fragments as well as more phenolic hydroxyl groups.
The carboxylic moieties in the lignin is also increased due to cleavage of the ester bonds of lignin–
carbohydrate complexes. However, degradation reactions is more dominant at lower severities
whereas condensation reactions at higher severities (Moxley et al., 2012). Therefore, at relatively
high temperature (160 °C), lignin is softened and relocalized to the outer surface of the cell wall
(Kristensen et al., 2008). Moreover, pseudo-lignin might be generated from carbohydrates without
significant contribution from lignin during dilute acid pretreatment especially at this condition.
This pseudo-lignin yields a positive klason lignin value (Sannigrahi et al., 2012). Hence, the fact
that lignin band at these locations are increased indicates that essentially no lignin removed due to
relocation during acidic treatment in accordance with composition data as shown in Table 5-3.
Figure 5-6 also demonstrates the fate of surface lignin. It shows both aqueous ammonia and
aqueous ammonia followed by ClO2 treatment removed surface lignin of corn stover as yellow
color is the indicator of lignin-rich surface where as black color indicate lignin depleted surface.
On the other hand, dilute acid treatment transformed the yellow surface to dark goldenrod surface
137
Figure 5-6 Stained microscope images of a) untreated, b) NH3 treated, c) (NH3+ ClO2) treated, d)
H2SO4 treated, e) (H2SO4+ClO2) treated corn stover.
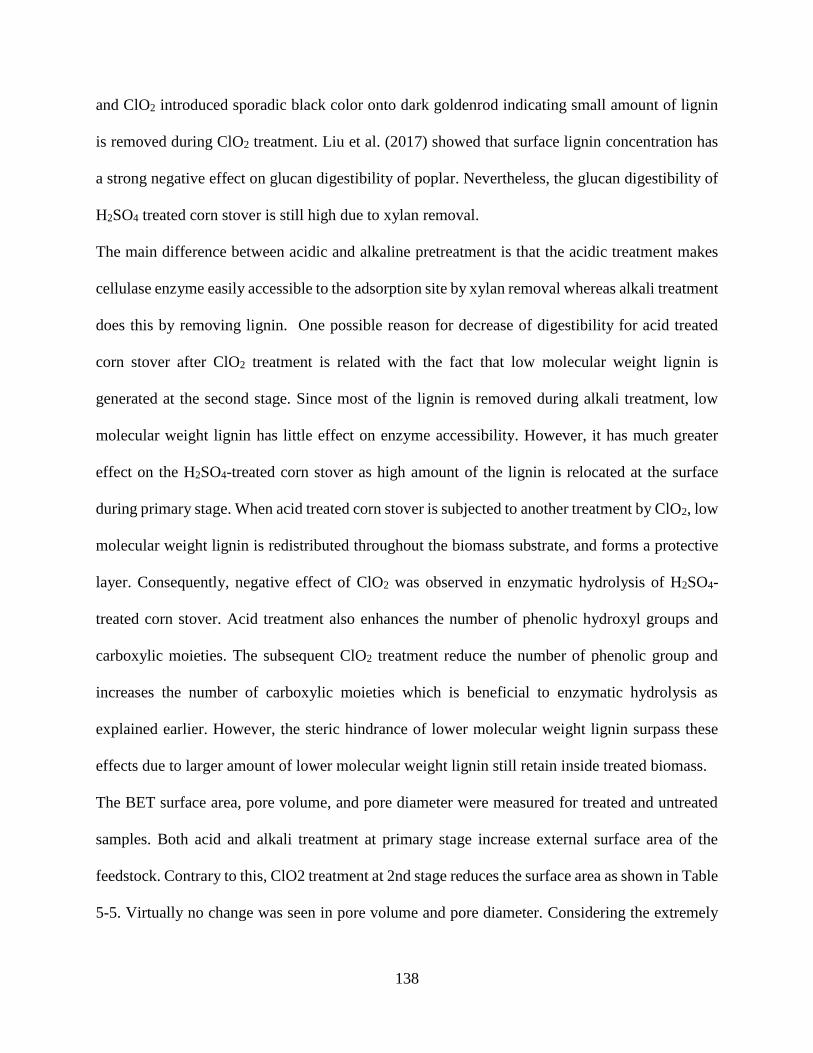
138
and ClO2 introduced sporadic black color onto dark goldenrod indicating small amount of lignin
is removed during ClO2 treatment. Liu et al. (2017) showed that surface lignin concentration has
a strong negative effect on glucan digestibility of poplar. Nevertheless, the glucan digestibility of
H2SO4 treated corn stover is still high due to xylan removal.
The main difference between acidic and alkaline pretreatment is that the acidic treatment makes
cellulase enzyme easily accessible to the adsorption site by xylan removal whereas alkali treatment
does this by removing lignin. One possible reason for decrease of digestibility for acid treated
corn stover after ClO2 treatment is related with the fact that low molecular weight lignin is
generated at the second stage. Since most of the lignin is removed during alkali treatment, low
molecular weight lignin has little effect on enzyme accessibility. However, it has much greater
effect on the H2SO4-treated corn stover as high amount of the lignin is relocated at the surface
during primary stage. When acid treated corn stover is subjected to another treatment by ClO2, low
molecular weight lignin is redistributed throughout the biomass substrate, and forms a protective
layer. Consequently, negative effect of ClO2 was observed in enzymatic hydrolysis of H2SO4-
treated corn stover. Acid treatment also enhances the number of phenolic hydroxyl groups and
carboxylic moieties. The subsequent ClO2 treatment reduce the number of phenolic group and
increases the number of carboxylic moieties which is beneficial to enzymatic hydrolysis as
explained earlier. However, the steric hindrance of lower molecular weight lignin surpass these
effects due to larger amount of lower molecular weight lignin still retain inside treated biomass.
The BET surface area, pore volume, and pore diameter were measured for treated and untreated
samples. Both acid and alkali treatment at primary stage increase external surface area of the
feedstock. Contrary to this, ClO2 treatment at 2nd stage reduces the surface area as shown in Table
5-5. Virtually no change was seen in pore volume and pore diameter. Considering the extremely
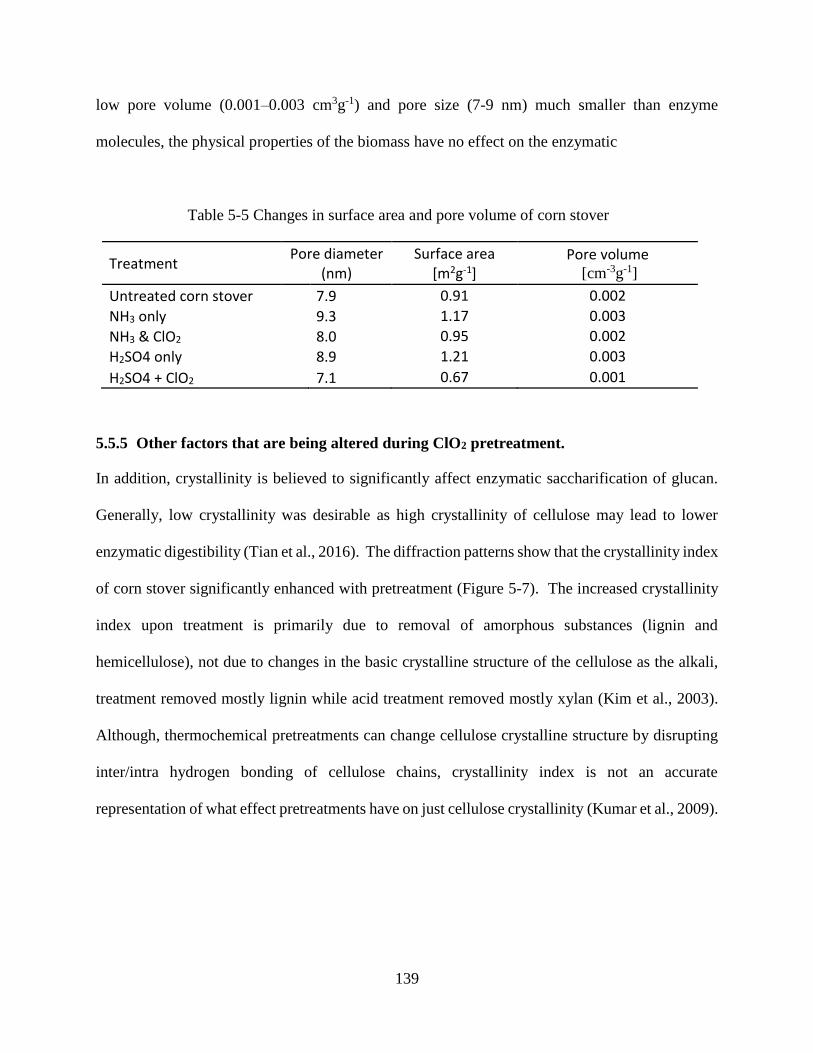
139
low pore volume (0.001–0.003 cm3g-1) and pore size (7-9 nm) much smaller than enzyme
molecules, the physical properties of the biomass have no effect on the enzymatic
Table 5-5 Changes in surface area and pore volume of corn stover
Treatment Pore diameter
(nm) Surface area
[m2g-1] Pore volume
[cm-3g-1]
Untreated corn stover 7.9 0.91 0.002
NH3 only 9.3 1.17 0.003
NH3 & ClO2 8.0 0.95 0.002
H2SO4 only 8.9 1.21 0.003
H2SO4 + ClO2 7.1 0.67 0.001
5.5.5 Other factors that are being altered during ClO2 pretreatment.
In addition, crystallinity is believed to significantly affect enzymatic saccharification of glucan.
Generally, low crystallinity was desirable as high crystallinity of cellulose may lead to lower
enzymatic digestibility (Tian et al., 2016). The diffraction patterns show that the crystallinity index
of corn stover significantly enhanced with pretreatment (Figure 5-7). The increased crystallinity
index upon treatment is primarily due to removal of amorphous substances (lignin and
hemicellulose), not due to changes in the basic crystalline structure of the cellulose as the alkali,
treatment removed mostly lignin while acid treatment removed mostly xylan (Kim et al., 2003).
Although, thermochemical pretreatments can change cellulose crystalline structure by disrupting
inter/intra hydrogen bonding of cellulose chains, crystallinity index is not an accurate
representation of what effect pretreatments have on just cellulose crystallinity (Kumar et al., 2009).
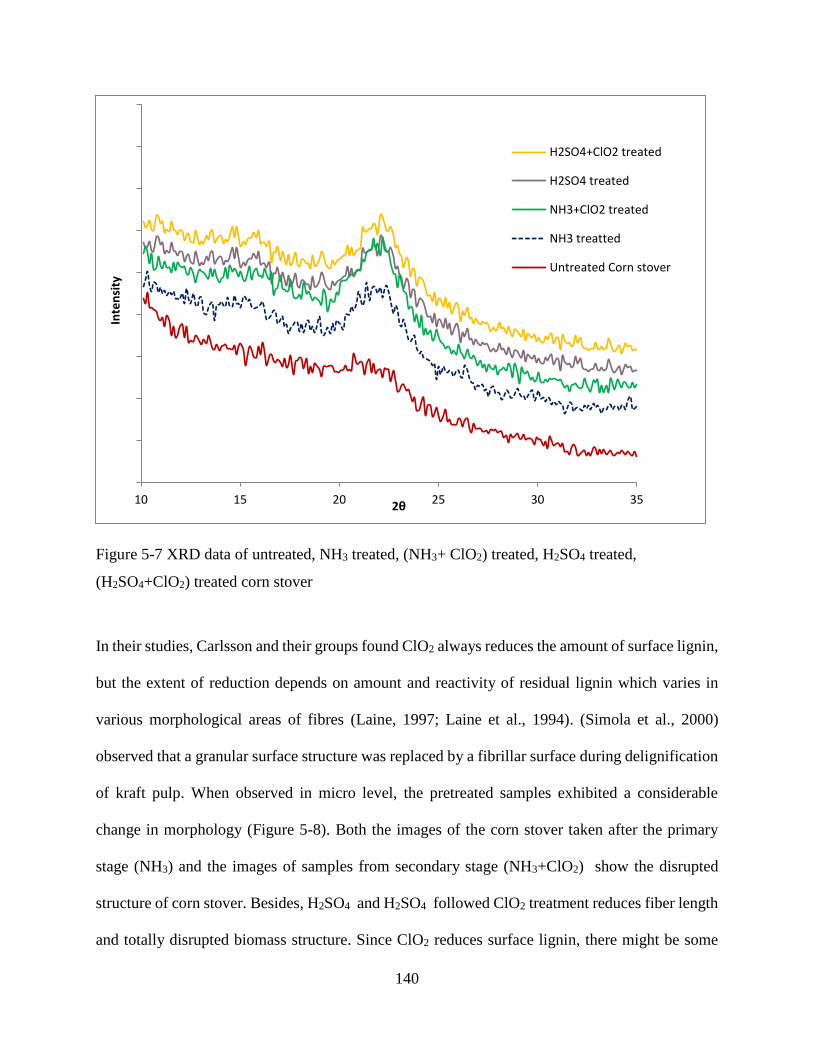
140
Figure 5-7 XRD data of untreated, NH3 treated, (NH3+ ClO2) treated, H2SO4 treated,
(H2SO4+ClO2) treated corn stover
In their studies, Carlsson and their groups found ClO2 always reduces the amount of surface lignin,
but the extent of reduction depends on amount and reactivity of residual lignin which varies in
various morphological areas of fibres (Laine, 1997; Laine et al., 1994). (Simola et al., 2000)
observed that a granular surface structure was replaced by a fibrillar surface during delignification
of kraft pulp. When observed in micro level, the pretreated samples exhibited a considerable
change in morphology (Figure 5-8). Both the images of the corn stover taken after the primary
stage (NH3) and the images of samples from secondary stage (NH3+ClO2) show the disrupted
structure of corn stover. Besides, H2SO4 and H2SO4 followed ClO2 treatment reduces fiber length
and totally disrupted biomass structure. Since ClO2 reduces surface lignin, there might be some
10 15 20 25 30 35
Inte
nsi
ty
2θ
H2SO4+ClO2 treated
H2SO4 treated
NH3+ClO2 treated
NH3 treatted
Untreated Corn stover
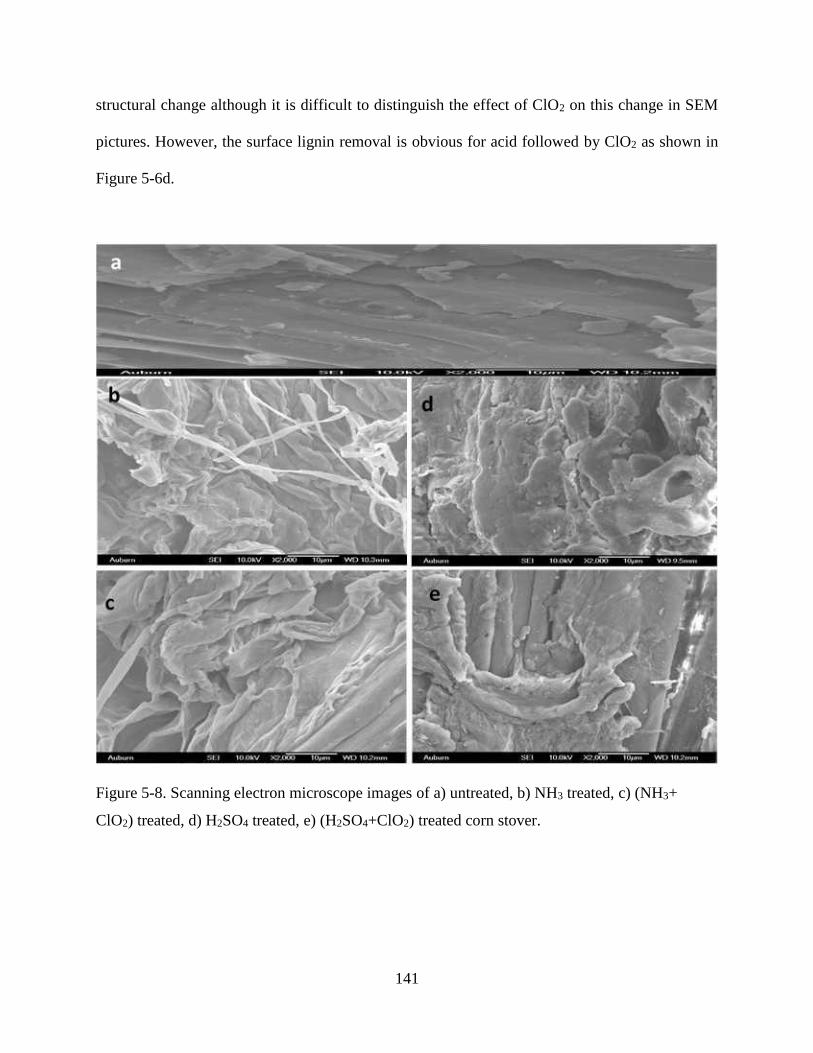
141
structural change although it is difficult to distinguish the effect of ClO2 on this change in SEM
pictures. However, the surface lignin removal is obvious for acid followed by ClO2 as shown in
Figure 5-6d.
Figure 5-8. Scanning electron microscope images of a) untreated, b) NH3 treated, c) (NH3+
ClO2) treated, d) H2SO4 treated, e) (H2SO4+ClO2) treated corn stover.
142
5.6 Conclusion
Chlorine dioxide treatment significantly improves the efficiency of enzymatic hydrolysis of alkali-
treated biomass. The main effect of ClO2 treatment is the structural change of the lignin, not
reduction of the gross lignin content. ClO2 treatment reduces phenolic hydroxyl group and
increases carboxylic acid groups and its derivatives in lignin. These two structural changes bring
about reduction of the hydrophobicity of residual lignin and interfere with the H-bond between
cellulase and lignin, consequently reducing the unproductive binding of cellulase and lignin, the
main reason for increased enzymatic hydrolysis reaction.
143
Chapter 6
Conclusions and Recommendations for Further Research
The focus of this dissertation was to develop technical strategies for the aqueous phase production
of several value added chemicals from carbohydrate through biochemical and thermochemical
pathways. In first stage of this study, a kinetic model was developed, based on the data collected
on batch reactor, to predict the optimal reactor design and operating conditions for HMF and LA
production in a continuous system. Then a dual-solid acid catalyst system was introduced to
achieve higher LA yield from glucose. In the 2nd part, a bioconversion strategy for lactic acid
production from mixed feedstocks via simultaneous saccharification and co-fermentation (SSCF)
was developed. Then a technical strategy to enhance enzymatic saccharification of lignocellulosic
biomass using chlorine dioxide as a supplementary pretreatment reagent was developed. Thus, this
study shows that both biochemical and thermochemical pathways can be effectively used to
produce biomass derived chemical LA and lactic acid. Based on this study, we proposed few more
task, which will determine the technical feasibility of these processes in a comprehensive manner.
This is very important for any process to be implemented in industrial scale.
6.1.1 Develop a generalized kinetic model of sulfuric acid catalyzed LA production from
hexose sugar
The aqueous phase production of LA from glucose involves isomerization, dehydration,
fragmentation, reversion, and condensation steps. There are two schools of thought exists with
144
regard to the HMF formation from C6 carbohydrate in literature. One pathway postulates that the
isomerization of glucose into fructose is the primary reaction pathway together with a small
amount of mannose (Choudhary et al., 2013; Moliner et al., 2010). Then fructose is converted to
HMF by dehydration and subsequently hydrolyzes to form LA and formic acids. The Other theory
suggests that the dehydration of glucose does not involve the isomerization of glucose to fructose
as the first step of the reaction. According to this theory, glucose can be converted into HMF
through cyclization of 3-deoxyglucosone (3-DG) intermediate formed from the open-ring form of
glucose (Chidambaram & Bell, 2010; Locas & Yaylayan, 2008). In chapter 2, we have developed
a kinetic model for the decomposition of glucose to produce LA and formic acid assuming no
fructose formation was involved in the formation of HMF. However, we have seen fructose
formation is the 1st step of HMF formation when solid catalyst was used in chapter 3. The next
step of this line of study is to develop a generalized kinetic model for aqueous phase production
of LA from glucose, which could explain both mechanisms. Therefore, the first task will be to
develop kinetic model of fructose decomposition and then incorporate fructose model into glucose
decomposition. Once developed, this generalized kinetic model can be be implemented to other
sugars especially mannose since it is a dominant constituent for soft wood after glucose.
6.1.2 LA production from cellulose
In chapter three, we have prepared a series of solid Lewis acid catalysts and tested them for
glucose to fructose isomerization. We also tested these solid catalysts together with a commercial
solid acid catalyst (Amberlyst-15) to produce LA from glucose in aqueous media, as LA is the
consequence of sequential reaction of hexose – 1st isomerization and then dehydration /
rehydration. In this study, we used liquid feedstocks for the production of LA. This work can be
extended to cellulose, the main component of lignocelluloses, which is also a biopolymer
145
consisting of many glucose units connected through β-1,4-glycosidic bonds. The first step for
cellulose utilization is to depolymerize it into soluble oligosaccharides and glucose. Therefore, the
next step of this line of work will be to figure out the proper catalyst, suitable conditions so that
all step of the reaction can be carried out in “one pot synthesis” manner.
6.1.3 Effect of alkali or acid on ClO2 treated biomass
In this study, two different types of two-step pretreatment process, alkaline followed by ClO2 and
dilute acid followed ClO2 were evaluated as a measure of enzymatic deconstruction of biomass to
monomeric sugars. Study reveals that the glucan digestibility of alkali followed by chlorine
dioxide treated feedstock is higher than that of alkali-only treated feedstocks. On the other hand,
dilute acid followed by chlorine dioxide has negative effect on enzymatic hydrolysis. However,
we did not have any idea about if we reverse the process i.e. ClO2 followed by alkali or acid
treatment. The objective of this task is to identify the best possible sequence of chlorine dioxide in
improving subsequent enzymatic hydrolysis.
6.1.4 Lactic acid production of different feedstocks
In chapter four, hemp hurd, an industrial byproduct of bast fiber that is currently disposed as a
solid waste, was investigated as a complementary feedstock to paper mill sludge for lactic acid
production using SSCF. The results indicate that the mixture of sludge and hemp hurd has great
potential as a feedstock for lactic acid production. This study can be extended to other feedstocks,
which is compatible with sludge to produce lactic acid. The specific task is to find the proper
mixing ratio to maintain pH at optimum level with as high as solid loading.
146
References
Abdel-Rahman, M.A., Tashiro, Y., Sonomoto, K. 2011. Lactic acid production from
lignocellulose-derived sugars using lactic acid bacteria: Overview and limits. Journal of
Biotechnology, 156(4), 286-301.
Abdel-Rahman, M.A., Tashiro, Y., Sonomoto, K. 2013. Recent advances in lactic acid production
by microbial fermentation processes. Biotechnology Advances, 31(6), 877-902.
Acharjee, T.C., 2010. Thermal pretreatment options for lignocellulosic biomass, M.S. Thesis,
University of Nevada, Reno.
Acharjee, T.C., 2011. Exploring the Potential Use of Camelina sativa as a Biofuel crop for Nevada
, M.S. Thesis, University of Nevada, Reno
Adachi, E., Torigoe, M., Sugiyama, M., Nikawa, J., Shimizu, K. 1998. Modification of metabolic
pathways of Saccharomyces cerevisiae by the expression of lactate dehydrogenase and
deletion of pyruvate decarboxylase genes for the lactic acid fermentation at low pH value.
Journal of Fermentation and Bioengineering, 86(3), 284-289.
Alonso, D.M., Wettstein, S.G., Dumesic, J.A. 2013. Gamma-valerolactone, a sustainable platform
molecule derived from lignocellulosic biomass. Green Chemistry, 15(3), 584-595.
Asghari, F.S., Yoshida, H. 2006. Acid-catalyzed production of 5-hydroxymethyl furfural from D-
fructose in subcritical water. Industrial & Engineering Chemistry Research, 45(7),
2163-2173.
Assary, R.S., Kim, T., Low, J.J., Greeley, J., Curtiss, L.A. 2012. Glucose and fructose to platform
chemicals: understanding the thermodynamic landscapes of acid-catalysed reactions using
high-level ab initio methods. Physical Chemistry Chemical Physics, 14(48), 16603-16611.
147
Assary, R.S., Redfern, P.C., Greeley, J., Curtiss, L.A. 2011. Mechanistic Insights into the
Decomposition of Fructose to Hydroxy Methyl Furfural in Neutral and Acidic
Environments Using High-Level Quantum Chemical Methods. Journal of Physical
Chemistry B, 115(15), 4341-4349.
Balan, V., Sousa, L.D., Chundawat, S.P.S., Marshall, D., Sharma, L.N., Chambliss, C.K., Dale,
B.E. 2009. Enzymatic Digestibility and Pretreatment Degradation Products of AFEX-
Treated Hardwoods (Populus nigra). Biotechnology Progress, 25(2), 365-375.
Barroca, M., Seco, I.M., Fernandes, P.M.M., Ferreira, L., Castro, J. 2001. Reduction of AOX in
the bleach plant of a pulp mill. Environmental Science & Technology, 35(21), 4390-
4393.
Bhalla, A., Bansal, N., Stoklosa, R.J., Fountain, M., Ralph, J., Hodge, D.B., Hegg, E.L. 2016.
Effective alkaline metal-catalyzed oxidative delignification of hybrid poplar.
Biotechnology for Biofuels, 9.
Bozell, J.J., Moens, L., Elliott, D.C., Wang, Y., Neuenscwander, G.G., Fitzpatrick, S.W., Bilski,
R.J., Jarnefeld, J.L. 2000. Production of levulinic acid and use as a platform chemical for
derived products. Resources Conservation and Recycling, 28(3-4), 227-239.
Bozell, J.J., Petersen, G.R. 2010. Technology development for the production of biobased products
from biorefinery carbohydrates-the US Department of Energy's "Top 10" revisited. Green
Chemistry, 12(4), 539-554.
Brogdon, B.N., Mancosky, D.G., Lucia, L.A. 2004. New insights into lignin modification during
chlorine dioxide bleaching sequences (I): Chlorine dioxide delignification. Journal of
Wood Chemistry and Technology, 24(3), 201-219.
148
Bustos, G., Moldes, A.B., Cruz, J.M., Dominguez, J.M. 2005. Influence of the metabolism
pathway on lactic acid production from hemicellulosic trimming vine shoots hydrolyzates
using Lactobacillus pentosus. Biotechnology Progress, 21(3), 793-798.
Capek, L., Kreibich, V., Dedecek, J., Grygar, T., Wichterlova, B., Sobalik, Z., Martens, J.A.,
Brosius, R., Tokarova, V. 2005. Analysis of Fe species in zeolites by UV-VIS-NIR, IR
spectra and voltammetry. Effect of preparation, Fe loading and zeolite type. Microporous
and Mesoporous Materials, 80(1-3), 279-289.
Cha, J.Y., Hanna, M.A. 2002. Levulinic acid production based on extrusion and pressurized batch
reaction. Industrial Crops and Products, 16(2), 109-118.
Chambon, F., Rataboul, F., Pinel, C., Cabiac, A., Guillon, E., Essayem, N. 2011. Cellulose
hydrothermal conversion promoted by heterogeneous Bronsted and Lewis acids:
Remarkable efficiency of solid Lewis acids to produce lactic acid. Applied Catalysis B-
Environmental, 105(1-2), 171-181.
Chang, C., Ma, X.J., Cen, P.L. 2009. Kinetic Studies on Wheat Straw Hydrolysis to Levulinic
Acid. Chinese Journal of Chemical Engineering, 17(5), 835-839.
Chang, C., Ma, X.J., Cen, P.L. 2006. Kinetics of levulinic acid formation from glucose
decomposition at high temperature. Chinese Journal of Chemical Engineering, 14(5), 708-
712.
Chapman, J.S. 2003. Biocide resistance mechanisms. International Biodeterioration &
Biodegradation, 51(2), 133-138.
Cherubini, F. 2010. The biorefinery concept: Using biomass instead of oil for producing energy
and chemicals. Energy Conversion and Management, 51(7), 1412-1421.
149
Chheda, J.N., Huber, G.W., Dumesic, J.A. 2007. Liquid-phase catalytic processing of biomass-
derived oxygenated hydrocarbons to fuels and chemicals. Angewandte Chemie-
International Edition, 46(38), 7164-7183.
Chidambaram, M., Bell, A.T. 2010. A two-step approach for the catalytic conversion of glucose
to 2,5-dimethylfuran in ionic liquids. Green Chemistry, 12(7), 1253-1262.
Choudhary, V., Mushrif, S.H., Ho, C., Anderko, A., Nikolakis, V., Marinkovic, N.S., Frenkel, A.I.,
Sandler, S.I., Vlachos, D.G. 2013. Insights into the Interplay of Lewis and Bronsted Acid
Catalysts in Glucose and Fructose Conversion to 5-(Hydroxymethyl)furfural and Levulinic
Acid in Aqueous Media. Journal of the American Chemical Society, 135(10), 3997-4006.
Corma, A., Iborra, S., Velty, A. 2007. Chemical routes for the transformation of biomass into
chemicals. Chemical Reviews, 107(6), 2411-2502.
da Costa Correia, J.A., Marques Junior, J.E., Goncalves, L.R.B., Ponte Rocha, M.V. 2013.
Alkaline hydrogen peroxide pretreatment of cashew apple bagasse for ethanol production:
Study of parameters. Bioresource Technology, 139, 249-256.
Demirbas, A. 2007. Progress and recent trends in biofuels. Progress in Energy and Combustion
Science, 33(1), 1-18.
Demirbas, M.F. 2006. Current technologies for biomass conversion into chemicals and fuels.
Energy Sources Part a-Recovery Utilization and Environmental Effects, 28(13), 1181-
1188.
Dougherty, M.J., Tran, H.M., Stavila, V., Knierim, B., George, A., Auer, M., Adams, P.D., Hadi,
M.Z. 2014. Cellulosic Biomass Pretreatment and Sugar Yields as a Function of Biomass
Particle Size. Plos One, 9(6).
150
Dzwigaj, S., Peltre, M.J., Massiani, P., Davidson, A., Che, M., Sen, T., Sivasanker, S. 1998.
Incorporation of vanadium species in a dealuminated beta zeolite. Chemical
Communications(1), 87-88.
Efremov, A.A., Pervyshina, G.G., Kuznetsov, B.N. 1997. Thermocatalytic transforms of wood
pulp and cellulose in the presence of HCl, HBr and H2SO4. Khimiya Prirodnykh
Soedinenii(1), 107-112.
Elferink, S., Krooneman, J., Gottschal, J.C., Spoelstra, S.F., Faber, F., Driehuis, F. 2001.
Anaerobic conversion of lactic acid to acetic acid and 1,2-propanediol by Lactobacillus
buchneri. Applied and Environmental Microbiology, 67(1), 125-132.
Fang, Q., Hanna, M.A. 2002. Experimental studies for levulinic acid production from whole kernel
grain sorghum. Bioresource Technology, 81(3), 187-192.
Ferchichi, M., Crabbe, E., Gil, G.H., Hintz, W., Almadidy, A. 2005. Influence of initial pH on
hydrogen production from cheese whey. Journal of Biotechnology, 120(4), 402-409.
FitzPatrick, M., Champagne, P., Cunningham, M.F., Whitney, R.A. 2010. A biorefinery
processing perspective: Treatment of lignocellulosic materials for the production of value-
added products. Bioresource Technology, 101(23), 8915-8922.
Fitzpatrick, S. W. 1997. Production of levulinic acid from carbohydrate-containing materials: U.S.
Patent 5,608,105
Fitzpatrick, S.W. 2006. The Biofine technology A "bio-refinery" concept based on
thermochemical conversion of cellulosic biomass. Feedstocks for the Future: Renewables
for the Production of Chemicals and Materials, 921, 271-287.
Fu, C.X., Mielenz, J.R., Xiao, X.R., Ge, Y.X., Hamilton, C.Y., Rodriguez, M., Chen, F., Foston,
M., Ragauskas, A., Bouton, J., Dixon, R.A., Wang, Z.Y. 2011. Genetic manipulation of
151
lignin reduces recalcitrance and improves ethanol production from switchgrass.
Proceedings of the National Academy of Sciences of the United States of America, 108(9),
3803-3808.
Gallezot, P. 2012. Conversion of biomass to selected chemical products. Chemical Society
Reviews, 41(4), 1538-1558.
Gandolfi, S., Ottolina, G., Riva, S., Fantoni, G.P., Patel, I. 2013. Complete Chemical Analysis of
Carmagnola Hemp Hurd and Structural Features of Its Components. Bioresources, 8(2),
2641-2656.
Gandolfi, S., Pistone, L., Ottolina, G., Xu, P., Riva, S. 2015. Hemp hurd biorefining: A path to
green L-(+)-lactic acid production. Bioresource Technology, 191, 59-65.
Garde, A., Jonsson, G., Schmidt, A.S., Ahring, B.K. 2002. Lactic acid production from wheat
straw hemicellulose hydrolysate by Lactobacillus pentosus and Lactobacillus brevis.
Bioresource Technology, 81(3), 217-223.
Gauss, W., Suzuki, S., Takagi, M. 1976. Manufacture of alcohol from cellulosic materials using
plural ferments
Gellerstedt, G., Lindfors, E.L., Pettersson, M., Robert, D. 1995. Reaction of lignin in chlorine
dioxide bleaching of kraft pupls. Research on Chemical Intermediates, 21(3-5), 441-456.
Girisuta, B., Danon, B., Manurung, R., Janssen, L., Heeres, H.J. 2008. Experimental and kinetic
modelling studies on the acid-catalysed hydrolysis of the water hyacinth plant to levulinic
acid. Bioresource Technology, 99(17), 8367-8375.
Girisuta, B., Dussan, K., Haverty, D., Leahy, J.J., Hayes, M.H.B. 2013. A kinetic study of acid
catalysed hydrolysis of sugar cane bagasse to levulinic acid. Chemical Engineering
Journal, 217, 61-70.
152
Girisuta, B., Janssen, L., Heeres, H.J. 2006a. A kinetic study on the conversion of glucose to
levulinic acid. Chemical Engineering Research & Design, 84(A5), 339-349.
Girisuta, B., Janssen, L., Heeres, H.J. 2006b. A kinetic study on the conversion of glucose to
levulinic acid. Chemical Engineering Research & Design, 84(A5), 339-349.
Girisuta, B., Janssen, L., Heeres, H.J. 2007a. Kinetic study on the acid-catalyzed hydrolysis of
cellulose to levulinic acid. Industrial & Engineering Chemistry Research, 46(6),
1696-1708.
Girisuta, B., Janssen, L., Heeres, H.J. 2007b. Kinetic study on the acid-catalyzed hydrolysis of
cellulose to levulinic acid. Industrial & Engineering Chemistry Research, 46(6), 1696-
1708.
Guan, Wenjian., 2016. Bioconversion of lignocellulose into acetone-butanol-ethanol (ABE):
pretreatment, enzymatic hydrolysis and fermentation, Ph.D. Dissertation, Auburn
University, Auburn
Guan, W.J., Shi, S.A., Tu, M.B., Lee, Y.Y. 2016. Acetone-butanol-ethanol production from Kraft
paper mill sludge by simultaneous saccharification and fermentation. Bioresource
Technology, 200, 713-721.
Gupta, R., 2008. Alkaline pretreatment of biomass for ethanol production and understanding the
factors influencing the cellulose hydrolysis, Ph.D. Dissertation, Auburn University,
Auburn
Gupta, R., Lee, Y.Y. 2010. Pretreatment of Corn Stover and Hybrid Poplar by Sodium Hydroxide
and Hydrogen Peroxide. Biotechnology Progress, 26(4), 1180-1186.
Gupta, R., Lee, Y.Y. 2009. Pretreatment of Hybrid Poplar by Aqueous Ammonia. Biotechnology
Progress, 25(2), 357-364.
153
Hammond, C., Conrad, S., Hermans, I. 2012. Simple and Scalable Preparation of Highly Active
Lewis Acidic Sn-beta. Angewandte Chemie-International Edition, 51(47), 11736-11739.
Hayes D. J., Ross J., Hayes M. H. B., Fitzpatrick S. 2008. The Biofine Process: Production of
Levulinic Acid, Furfural and Formic Acid from Lignocellulosic Feedstocks , Biorefinery
(8b)
Hegner, J., Pereira, K.C., DeBoef, B., Lucht, B.L. 2010. Conversion of cellulose to glucose and
levulinic acid via solid-supported acid catalysis. Tetrahedron Letters, 51(17), 2356-2358.
Helmerius, J., von Walter, J.V., Rova, U., Berglund, K.A., Hodge, D.B. 2010. Impact of
hemicellulose pre-extraction for bioconversion on birch Kraft pulp properties. Bioresource
Technology, 101(15), 5996-6005.
Hofvendahl, K., Hahn-Hagerdal, B. 2000. Factors affecting the fermentative lactic acid production
from renewable resources. Enzyme and Microbial Technology, 26(2-4), 87-107.
Horn, S.J., Vaaje-Kolstad, G., Westereng, B., Eijsink, V.G.H. 2012. Novel enzymes for the
degradation of cellulose. Biotechnology for Biofuels, 5.
Horvat, J., Klaic, B., Metelko, B., Sunjic, V. 1985. MECHANISM OF LEVULINIC ACID
FORMATION. Tetrahedron Letters, 26(17), 2111-2114
http://www.worldenergyoutlook.org/. Date of retrieval-May 16, 2015..
Huang, R., Qi, W., Su, R., He, Z. 2010. Integrating enzymatic and acid catalysis to convert glucose
into 5-hydroxymethylfurfural. Chemical Communications, 46(7), 1115-1117.
Hubbell, C.A., Ragauskas, A.J. 2010. Effect of acid-chlorite delignification on cellulose degree of
polymerization. Bioresource Technology, 101(19), 7410-7415.
Huber, G.W., Iborra, S., Corma, A. 2006. Synthesis of transportation fuels from biomass:
Chemistry, catalysts, and engineering. Chemical Reviews, 106(9), 4044-4098.
154
Jia, C.J., Beaunier, P., Massiani, P. 1998. Comparison of conventional and solid-state ion exchange
procedures for the incorporation of lanthanum in H-beta zeolite. Microporous and
Mesoporous Materials, 24(1-3), 69-82.
Jiang, Z.H., Berry, R. 2011. Near-Neutral final chlorine dioxide brightening:theory and practice J-
for-Journal of Science & Technology for Forest Products and Processes, 1(1), 14-20.
Jiang, Z.H., Van Lierop, B., Berry, R. 2007. Improving chlorine dioxide bleaching with aldehydes.
Journal of Pulp and Paper Science, 33(2), 89-94.
John, R.P., Nampoothiri, K.M., Pandey, A. 2007. Fermentative production of lactic acid from
biomass: an overview on process developments and future perspectives. Applied
Microbiology and Biotechnology, 74(3), 524-534.
Jow, J., Rorrer, G.L., Hawley, M.C., Lamport, D.T.A. 1987. Dehydration of fructose to levulininic
acid over LZY zeolite catalyst. Biomass, 14(3), 185-194.
Kamm, B., Kamm, M. 2004. Principles of biorefineries. Applied Microbiology and Biotechnology,
64(2), 137-145.
Kang, L., Wang, W., Lee, Y.Y. 2010. Bioconversion of Kraft Paper Mill Sludges to Ethanol by
SSF and SSCF. Applied Biochemistry and Biotechnology, 161(1-8), 53-66.
Kaur, U., Oberoi, H.S., Bhargav, V.K., Sharma-Shivappa, R., Dhaliwal, S.S. 2012. Ethanol
production from alkali- and ozone-treated cotton stalks using thermotolerant Pichia
kudriavzevii HOP-1. Industrial Crops and Products, 37(1), 219-226.
Kim, J.S., Lee, Y.Y., Kim, T.H. 2016. A review on alkaline pretreatment technology for
bioconversion of lignocellulosic biomass. Bioresource Technology, 199, 42-48.
155
Kim, R.S., Park, W., Hong, H., Chung, T.D., Kim, S. 2014. Quinone electrochemistry altered by
local hydrophobic environment and hydrogen bonding interactions. Electrochemistry
Communications, 41, 39-43.
Kim, T.H., Kim, J.S., Sunwoo, C., Lee, Y.Y. 2003. Pretreatment of corn stover by aqueous
ammonia. Bioresource Technology, 90(1), 39-47.
Kolar, J.J., Lindgren, B.O., Pettersson, B. 1983. Chemical reactions in chlorine dioxide stages of
pulp bleaching-intermediately formed hypochlorous acid. Wood Science and Technology,
17(2), 117-128.
Kothari, U. D., 2012. Ethanol from Lignocellulosic Biomass: Deacetylation, Pretreatment, and
Enzymatic , Ph.D. Dissertation, Auburn University, Auburn
Kothari, U.D., Lee, Y.Y. 2011. Inhibition Effects of Dilute-Acid Prehydrolysate of Corn Stover
on Enzymatic Hydrolysis of Solka Floc. Applied Biochemistry and Biotechnology, 165(5-
6), 1391-1405.
Kristensen, J.B., Felby, C., Jorgensen, H. 2009. Yield-determining factors in high-solids
enzymatic hydrolysis of lignocellulose. Biotechnology for Biofuels, 2.
Kristensen, J.B., Thygesen, L.G., Felby, C., Jorgensen, H., Elder, T. 2008. Cell-wall structural
changes in wheat straw pretreated for bioethanol production. Biotechnology for Biofuels,
1.
Kumar, R., Hu, F., Hubbell, C.A., Ragauskas, A.J., Wyman, C.E. 2013. Comparison of laboratory
delignification methods, their selectivity, and impacts on physiochemical characteristics of
cellulosic biomass. Bioresource Technology, 130, 372-381.
156
Kumar, R., Mago, G., Balan, V., Wyman, C.E. 2009. Physical and chemical characterizations of
corn stover and poplar solids resulting from leading pretreatment technologies.
Bioresource Technology, 100(17), 3948-3962.
Kuster, B.F.M., Vanderbaan, H.S. 1977. Dehydration of D-fructose(formation of 5-
hydroxymethyl-2-furfuraldehyde and levulinic acid). 2. Influence of initial and catalyst
concentrations of dehydration of D-fructose. Carbohydrate Research, 54(2), 165-176.
Lachenal, D., Fernandes, J.C., Froment, P. 1995. Behavior of residual lignin in kraft pulp during
bleaching. Journal of Pulp and Paper Science, 21(5), J173-J177.
Lai. L. X., 2010. Bioproducts from sulfite pulping: Bioconversion of sugar streams from pulp,
sludge, and spent sulfite liquor. MS thesis, University of Washington
Laine, J. 1997. Effect of ECF and TCF bleaching on the charge properties of kraft pulp. Paperi Ja
Puu-Paper and Timber, 79(8), 551-559.
Laine, J., Stenius, P., Carlsson, G., Strom, G. 1994. Surface Characterization of unbleached kraft
puls by means of ESCA . Cellulose, 1(2), 145-160.
Lamminpaa, K., Ahola, J., Tanskanen, J. 2012. Kinetics of Xylose Dehydration into Furfural in
Formic Acid. Industrial & Engineering Chemistry Research, 51(18), 6297-6303.
Liua W.; Chena W.; Houa Q.; Zhanga J.; Wang B., 2017. Surface lignin change pertaining to the
integrated process of dilute acid pre-extraction and mechanical refining of poplar wood
chips and its impact on enzymatic hydrolysis. Bioresource Technology, 228, 125-132
Liu, F., Audemar, M., Vigier, K.D.O., Cartigny, D., Clacens, J.-M., Gomes, M.F.C., Padua,
A.A.H., De Campo, F., Jerome, F. 2013. Selectivity enhancement in the aqueous acid-
catalyzed conversion of glucose to 5-hydroxymethylfurfural induced by choline chloride.
Green Chemistry, 15(11), 3205-3213.
157
Liu, J., Zhou, X.F. 2011. Structural changes in residual lignin of Eucalyptus urophylla x
Eucalyptus grandis LH 107 oxygen delignified kraft pulp upon chlorine dioxide bleaching.
Scientia Iranica, 18(3), 486-490.
Liu, X.J., Lu, M.Z., Ai, N., Yu, F.W., Ji, J.B. 2012. Kinetic model analysis of dilute sulfuric acid-
catalyzed hemicellulose hydrolysis in sweet sorghum bagasse for xylose production.
Industrial Crops and Products, 38, 81-86.
Locas, C.P., Yaylayan, V.A. 2008. Isotope labeling studies on the formation of 5-
(hydroxymethyl)-2-furaldehyde (HMF) from sucrose by pyrolysis-GC/MS. Journal of
Agricultural and Food Chemistry, 56(15), 6717-6723.
Lourvanij, K., Rorrer, G.L. 1993. Reaction of aqueous glucose solutions over solid-acid Y-zeolite
catalyst at 110-160 degree C. Industrial & Engineering Chemistry Research, 32(1), 11-
19.
Ma, R.S., Xu, Y., Zhang, X. 2015. Catalytic Oxidation of Biorefinery Lignin to Value-added
Chemicals to Support Sustainable Biofuel Production. Chemsuschem, 8(1), 24-51.
Maldonado, G.M.G., Assary, R.S., Dumesic, J., Curtiss, L.A. 2012. Experimental and theoretical
studies of the acid-catalyzed conversion of furfuryl alcohol to levulinic acid in aqueous
solution. Energy & Environmental Science, 5(5), 6981-6989.
Marcotullio, G., Cardoso, M.A.T., De Jong, W., Verkooijen, A.H.M. 2009. Bioenergy II: Furfural
Destruction Kinetics during Sulphuric Acid-Catalyzed Production from Biomass.
International Journal of Chemical Reactor Engineering, 7, 17.
Marques, S., Alves, L., Roseiro, J.C., Girio, F.M. 2008. Conversion of recycled paper sludge to
ethanol by SHF and SSF using Pichia stipitis. Biomass & Bioenergy, 32(5), 400-406.
158
Moliner, M., Roman-Leshkov, Y., Davis, M.E. 2010. Tin-containing zeolites are highly active
catalysts for the isomerization of glucose in water. Proceedings of the National Academy
of Sciences of the United States of America, 107(14), 6164-6168.
Monteagudo, J.M., Rodriguez, L., Rincon, J., Fuertes, J. 1997. Kinetics of lactic acid fermentation
by Lactobacillus delbrueckii grown on beet molasses. Journal of Chemical Technology and
Biotechnology, 68(3), 271-276.
Moxley, G., Gaspar, A.R., Higgins, D., Xu, H. 2012. Structural changes of corn stover lignin
during acid pretreatment. Journal of Industrial Microbiology & Biotechnology, 39(9),
1289-1299.
Mussatto, S.I., Fernandes, M., Mancilha, I.M., Roberto, I.C. 2008. Effects of medium
supplementation and pH control on lactic acid production from brewer's spent grain.
Biochemical Engineering Journal, 40(3), 437-444.
Nakagame, S., Chandra, R.P., Kadla, J.F., Saddler, J.N. 2011. Enhancing the Enzymatic
Hydrolysis of Lignocellulosic Biomass by Increasing the Carboxylic Acid Content of the
Associated Lignin. Biotechnology and Bioengineering, 108(3), 538-548.
Nakagame, S., Chandra, R.P., Saddler, J.N. 2010. The Effect of Isolated Lignins, Obtained From
a Range of Pretreated Lignocellulosic Substrates, on Enzymatic Hydrolysis. Biotechnology
and Bioengineering, 105(5), 871-879.
Nghiem, N.P., Senske, G.E., Kim, T.H. 2016. Pretreatment of Corn Stover by Low Moisture
Anhydrous Ammonia (LMAA) in a Pilot-Scale Reactor and Bioconversion to Fuel Ethanol
and Industrial Chemicals. Applied Biochemistry and Biotechnology, 179(1), 111-125.
159
Nikolla, E., Roman-Leshkov, Y., Moliner, M., Davis, M.E. 2011. "One-Pot" Synthesis
of 5-(Hydroxymethyl)furfural from Carbohydrates using Tin-Beta Zeolite. Acs Catalysis,
1(4), 408-410.
Ohgren, K., Bura, R., Saddler, J., Zacchi, G. 2007. Effect of hemicellulose and lignin removal on
enzymatic hydrolysis of steam pretreated corn stover. Bioresource Technology, 98(13),
2503-2510.
Okano, K., Yoshida, S., Yamada, R., Tanaka, T., Ogino, C., Fukuda, H., Kondo, A. 2009.
Improved Production of Homo-D-Lactic Acid via Xylose Fermentation by Introduction of
Xylose Assimilation Genes and Redirection of the Phosphoketolase Pathway to the Pentose
Phosphate Pathway in L-Lactate Dehydrogenase Gene-Deficient Lactobacillus plantarum.
Applied and Environmental Microbiology, 75(24), 7858-7861.
Pallapolu , V.R., 2016. Conversion of Lignocellulosic Biomass into Monomeric Sugars and
Levulinic Acid: Pretreatment, Enzymatic Hydrolysis, Ph.D. Dissertation, Auburn
University, Auburn
Parajo, J.C., Alonso, J.L., Moldes, A.B. 1997. Production of lactic acid from lignocellulose in a
single stage of hydrolysis and fermentation. Food Biotechnology, 11(1), 45-58.
Peng, L.C., Lin, L., Li, H., Yang, Q.L. 2011. Conversion of carbohydrates biomass into levulinate
esters using heterogeneous catalysts. Applied Energy, 88(12), 4590-4596.
Peng, L.C., Lin, L., Zhang, J.H., Zhuang, J.P., Zhang, B.X., Gong, Y. 2010. Catalytic Conversion
of Cellulose to Levulinic Acid by Metal Chlorides. Molecules, 15(8), 5258-5272.
Potvin, J., Sorlien, E., Hegner, J., DeBoef, B., Lucht, B.L. 2011. Effect of NaCl on the conversion
of cellulose to glucose and levulinic acid via solid supported acid catalysis. Tetrahedron
Letters, 52(44), 5891-5893.
160
Pradeep, P., Reddy, O.V.S. 2010. High gravity fermentation of sugarcane molasses to produce
ethanol: Effect of nutrients. Indian Journal of Microbiology, 50, S82-S87.
Rhee, M.S., Wei, L.S., Sawhney, N., Kim, Y.S., Rice, J.D., Preston, J.F. 2016. Metabolic potential
of Bacillus subtilis 168 for the direct conversion of xylans to fermentation products.
Applied Microbiology and Biotechnology, 100(3), 1501-1510.
Rivas, S., Gonzalez-Munoz, M.J., Vila, C., Santos, V., Parajo, J.C. 2013. Manufacture of Levulinic
Acid from Pine Wood Hemicelluloses: A Kinetic Assessment. Industrial & Engineering
Chemistry Research, 52(11), 3951-3957.
Roman-Leshkov, Y., Moliner, M., Labinger, J.A., Davis, M.E. 2010. Mechanism of Glucose
Isomerization Using a Solid Lewis Acid Catalyst in Water. Angewandte Chemie-
International Edition, 49(47), 8954-8957.
Rubin, E.M. 2008. Genomics of cellulosic biofuels. Nature, 454(7206), 841-845.
Saeman, J.F. 1945. Kinetics of wood saccharification -hydrolysis of cellulose and decompostions
of sugars in dilute acid at high temperature. Industrial and Engineering Chemistry, 37(1),
43-52.
San Martin, R., Perez, C., Briones, R. 1995. Simultaneous production of ethanol and kraft pulp
from pine (Pinus radiata) using steam explosion. Bioresource Technology, 53(3), 217-223.
Sannigrahi, P., Hu, F., Pu, Y.Q., Ragauskas, A. 2012. A Novel Oxidative Pretreatment of Loblolly
Pine, Sweetgum, and Miscanthus by Ozone. Journal of Wood Chemistry and Technology,
32(4), 361-375.
Santos, R.B., Hart, P.W., Jameel, H., Chang, H.M. 2013. Wood Based Lignin Reactions Important
to the Biorefinery and Pulp and Paper Industries. Bioresources, 8(1), 1456-1477.
161
Serrano-Ruiz, J.C., Dumesic, J.A. 2011. Catalytic routes for the conversion of biomass into liquid
hydrocarbon transportation fuels. Energy & Environmental Science, 4(1), 83-99.
Shen, J.C., Wyman, C.E. 2012. Hydrochloric Acid-Catalyzed Levulinic Acid Formation from
Cellulose: Data and Kinetic Model to Maximize Yields. Aiche Journal, 58(1), 236-246.
Shen, X.L., Xia, L.M. 2006. Lactic acid production from cellulosic material by synergetic
hydrolysis and fermentation. Applied Biochemistry and Biotechnology, 133(3), 251-262.
Shi, S., Kang, L., Lee, Y.Y. 2015. Production of Lactic Acid from the Mixture of Softwood Pre-
hydrolysate and Paper Mill Sludge by Simultaneous Saccharification and Fermentation.
Applied Biochemistry and Biotechnology, 175(5), 2741-2754.
Simeonov, S.P., Coelho, J.A.S., Afonso, C.A.M. 2013. Integrated Chemo-Enzymatic Production
of 5-Hydroxymethylfurfural from Glucose. Chemsuschem, 6(6), 997-1000.
Simola, J., Malkavaara, P., Alen, R., Peltonen, J. 2000. Scanning probe microscopy of pine and
birch kraft pulp fibres. Polymer, 41(6), 2121-2126.
Siqueira, G., Varnai, A., Ferraz, A., Milagres, A.M.F. 2013. Enhancement of cellulose hydrolysis
in sugarcane bagasse by the selective removal of lignin with sodium chlorite. Applied
Energy, 102, 399-402.
Son, P.A., Nishimura, S., Ebitani, K. 2012. Synthesis of levulinic acid from fructose using
Amberlyst-15 as a solid acid catalyst. Reaction Kinetics Mechanisms and Catalysis,
106(1), 185-192.
Studer, M.H., DeMartini, J.D., Davis, M.F., Sykes, R.W., Davison, B., Keller, M., Tuskan, G.A.,
Wyman, C.E. 2011. Lignin content in natural Populus variants affects sugar release.
Proceedings of the National Academy of Sciences of the United States of America, 108(15),
6300-6305.
162
Sun, X.F., Xu, F., Sun, R.C., Fowler, P., Baird, M.S. 2005. Characteristics of degraded cellulose
obtained from steam-exploded wheat straw. Carbohydrate Research, 340(1), 97-106.
Sun, Y., Cheng, J.Y. 2002. Hydrolysis of lignocellulosic materials for ethanol production: a
review. Bioresource Technology, 83(1), 1-11.
Svenson, D.R., Jameel, H., Chang, H.-m., Kadla, J.F. 2006. Inorganic reactions in chlorine dioxide
bleaching of softwood kraft pulp. Journal of Wood Chemistry and Technology, 26(3), 201-
213.
Takagaki, A., Ohara, M., Nishimura, S., Ebitani, K. 2009. A one-pot reaction for biorefinery:
combination of solid acid and base catalysts for direct production of 5-
hydroxymethylfurfural from saccharides. Chemical Communications(41), 6276-6278.
Tanaka, K., Komiyama, A., Sonomoto, K., Ishizaki, A., Hall, S.J., Stanbury, R. 2002. Two
different pathways for D-xylose metabolism and the effect of xylose concentration on the
yield coefficient of L-lactate in mixed-acid fermentation by the lactic acid bacterium
Lactococcus lactis 10-1. Applied Microbiology and Biotechnology, 60(1-2), 160-167.
Tian, X.F., Rebmann, L., Xu, C.C., Fang, Z. 2016. Pretreatment of Eastern White Pine (Pinus
strobes L.) for Enzymatic Hydrolysis and Ethanol Production by Organic Electrolyte
Solutions. Acs Sustainable Chemistry & Engineering, 4(5), 2822-2829.
Tsai, S.P., Moon, S.H. 1998. An integrated bioconversion process for production of L-lactic acid
from starchy potato feedstocks. Applied Biochemistry and Biotechnology, 70-2, 417-428.
U.S. Department of Energy . 2008. Biomass multiyear program, Office of the Biomass Program,
Energy Efficiency and Renewable Energy
163
van der Pol, E.C., Eggink, G., Weusthuis, R.A. 2016. Production of L(+)-lactic acid from acid
pretreated sugarcane bagasse using Bacillus coagulans DSM2314 in a simultaneous
saccharification and fermentation strategy. Biotechnology for Biofuels, 9.
Wang, L., Templer, R., Murphy, R.J. 2012. High-solids loading enzymatic hydrolysis of waste
papers for biofuel production. Applied Energy, 99, 23-31.
Wang, T., Nolte, M.W., Shanks, B.H. 2014. Catalytic dehydration of C-6 carbohydrates for the
production of hydroxymethylfurfural (HMF) as a versatile platform chemical. Green
Chemistry, 16(2), 548-572.
Watanabe, M., Aizawa, Y., Iida, T., Nishimura, R., Inomata, H. 2005. Catalytic glucose and
fructose conversions with TiO2 and ZrO2 in water at 473 K: Relationship between
reactivity and acid-base property determined by TPD measurement. Applied Catalysis a-
General, 295(2), 150-156.
Weingarten, R., Cho, J., Conner, W.C., Huber, G.W. 2010. Kinetics of furfural production by
dehydration of xylose in a biphasic reactor with microwave heating. Green Chemistry,
12(8), 1423-1429.
Weingarten, R., Cho, J., Xing, R., Conner, W.C., Huber, G.W. 2012. Kinetics and Reaction
Engineering of Levulinic Acid Production from Aqueous Glucose Solutions.
Chemsuschem, 5(7), 1280-1290.
Weingarten, R., Kim, Y.T., Tompsett, G.A., Fernandez, A., Han, K.S., Hagaman, E.W., Conner,
W.C., Jr., Dumesic, J.A., Huber, G.W. 2013. Conversion of glucose into levulinic acid with
solid metal(IV) phosphate catalysts. Journal of Catalysis, 304, 123-134
Werpy, T.; Petersen, G. 2004. NREL/TP-510-35523; National Renewable Energy Laboratory
(NREL).
164
Wiggins, L.F. 1949. The Utilization if sucrose. Advances in Carbohydrate Chemistry, 4, 293-336.
Ximenes, E., Kim, Y., Mosier, N., Dien, B., Ladisch, M. 2011. Deactivation of cellulases by
phenols. Enzyme and Microbial Technology, 48(1), 54-60.
Xu, G.Q., Chu, J., Wang, Y.H., Zhuang, Y.P., Zhang, S.L., Peng, H.Q. 2006. Development of a
continuous cell-recycle fermentation system for production of lactic acid by Lactobacillus
paracasei. Process Biochemistry, 41(12), 2458-2463.
Yan, W., Acharjee, T.C., Coronella, C.J., Vasquez, V.R. 2009. Thermal Pretreatment of
Lignocellulosic Biomass. Environmental Progress & Sustainable Energy, 28(3), 435-440.
Yang, Q., Pan, X.J. 2016. Correlation Between Lignin Physicochemical Properties and Inhibition
to Enzymatic Hydrolysis of Cellulose. Biotechnology and Bioengineering, 113(6), 1213-
1224.
Yu, Y., Lou, X., Wu, H.W. 2008a. Some recent advances in hydrolysis of biomass in hot-
compressed, water and its comparisons with other hydrolysis methods. Energy & Fuels,
22(1), 46-60.
Yu, Y., Lou, X., Wu, H.W. 2008b. Some recent advances in hydrolysis of biomass in hot-
compressed, water and its comparisons with other hydrolysis methods. Energy &
Fuels, 22(1), 46-60.
Yu, Z., Jameel, H., Chang, H.-m., Park, S. 2011. The effect of delignification of forest biomass on
enzymatic hydrolysis. Bioresource Technology, 102(19), 9083-9089.
Zeng, W., Cheng, D.G., Zhang, H.H., Chen, F.Q., Zhan, X.L. 2010. Dehydration of glucose to
levulinic acid over MFI-type zeolite in subcritical water at moderate conditions. Reaction
Kinetics Mechanisms and Catalysis, 100(2), 377-384.

165
Zhu, Y.M., Lee, Y.Y., Elander, R.T. 2007. Conversion of aqueous ammonia-treated corn stover to
lactic acid by simultaneous saccharification and cofermentation. Applied Biochemistry and
Biotechnology, 137, 721-738.