control of mnc's environmental performance and the
TRANSCRIPT
Florida International UniversityFIU Digital Commons
FIU Electronic Theses and Dissertations University Graduate School
7-12-2012
Control of MNC's Environmental Performanceand the Challenges of Subsidiary NetworkDimensionsDina Mahmoud Abdel-ZaherFlorida International University, [email protected]
DOI: 10.25148/etd.FI12080631Follow this and additional works at: https://digitalcommons.fiu.edu/etd
This work is brought to you for free and open access by the University Graduate School at FIU Digital Commons. It has been accepted for inclusion inFIU Electronic Theses and Dissertations by an authorized administrator of FIU Digital Commons. For more information, please contact [email protected].
Recommended CitationAbdel-Zaher, Dina Mahmoud, "Control of MNC's Environmental Performance and the Challenges of Subsidiary NetworkDimensions" (2012). FIU Electronic Theses and Dissertations. 673.https://digitalcommons.fiu.edu/etd/673
FLORIDA INTERNATIONAL UNIVERSITY
Miami, Florida
CONTROL OF MNC ENVIRONMENTAL PERFORMANCE AND THE
CHALLENGES OF SUBSIDIARY NETWORK DIMENSIONS
A dissertation submitted in partial fulfillment of
the requirements for the degree of
DOCTOR OF PHILOSOPHY
in
BUSINESS ADMINISTRATION
by
Dina Abdel-Zaher
2012
ii
To: Dean Joyce Elam College of Business Administration
This dissertation, written by Dina Abdel-Zaher, and entitled Control of MNC's Environmental Performance and the Challenges of Subsidiary Network Dimensions, having been approved in respect to style and intellectual content, is referred to you for judgment.
We have read this dissertation and recommend that it be approved.
_______________________________________
Jose de la Torre
_______________________________________ Nathan Hiller
_______________________________________
William Schneper
_______________________________________ Ted London
_______________________________________
Walfried Lassar
_______________________________________ William Newburry, Major Professor
Date of Defense: July 12, 2012
The dissertation of Dina Abdel-Zaher is approved.
_______________________________________ Dean Joyce Elam
College of Business Administration
_______________________________________ Dean Lakshmi N. Reddi
University Graduate School
Florida International University, 2012

iii
DEDICATION
I would like to dedicate this work to my honorable father Mahmoud Abdelzaher and
mother Amal Hafiz Osman and wonderful husband Khaled Omar, blessed children
Fatima and Mariam, incredible family, selfless loving friends, and dedicated mentors.
For your support, sincerity, and patience throughout this process, I am forever grateful. It
was Almighty God’s Mercy and Will followed by your kindness that helped me stay
focused on achieving this goal. My father I thank you for your foresight and in being the
first to see in me the potential and pushing me hard enough to achieve this goal. My
sweet mother I thank you for lending an ear when I needed advise, for being a shoulder to
cry on and giving me the hug I needed when I felt overwhelmed. You taught me to
always do what your heart tells you is right. And your heart is beautiful. You are my role
model. My wonderful husband thank you for providing the love and support before,
during and after this journey is completed you are a true blessing and source of joy in my
life. My sweet girls thank you for your prayers and patience when you saw me work so
hard. My sweet family and friends I thank you for providing the prayers and often the
meals and babysitting support to help me stay focused. This degree is truly your
achievement allow me to congratulate you all. Finally and most important, all praise
and thanks are due to Allah (the Most High The Great) and May God send his Blessings
on his Last Messenger , Muhammed, the best of mankind and our teacher in every way.
iv
ACKNOWLEDGMENTS
I wish to express my gratitude and highest respect to all the members of my committee
Dr. William Newburry, Dr. Jose de la Torre, Dr. Nathan Hiller, Dr. William Schneper,
Dr. Ted London and Dr. Walfried Lassar for their continuous support, commitment, and
expertise. I would like to express my sincere appreciation to my major professor, Dr.
William Newburry for his support and guidance. And a special thanks to Dr. Jose de la
Torre and Dr. Walfried Lassar who never hesitated to give their advice and guidance,
despite how busy they were, which reflected how much they wanted me to succeed. And
of course I cannot express my gratitude to Dr. Paul Miniard who was always there for me
to provide the support I needed to complete this journey. It was because of Dr. Miniard’s
funding in my first term that made pursuing this degree possible. I also like to thank Dr.
William Schneper for being the first to recognize my research instinct and contribute to
its development. I want to thank him for taking the time to teach and share his advice.
And I would also like to thank Dr. Amanda Bullough who reflects the true meaning of
“support”. I have learned from each one of you. And I want you to know that I appreciate
every moment or thought you invested in my development as a scholar and an educator.
Finally, I would like to give the utmost thank you to The Creator, who has made our
roads cross in this unique journey. It was wonderful working with you all.
v
ABSTRACT OF THE DISSERTATION
CONTROL OF MNC ENVIRONMENTAL PERFORMANCE AND THE
CHALLENGES OF SUBSIDIARY NETWORK DIMENSIONS
by
Dina Abdel-Zaher
Florida International University, 2012
Miami, Florida
Professor William Newburry, Major Professor
The trend of green consumerism and increased standardization of environmental
regulations has driven multinational corporations (MNCs) to seek standardization of
environmental practices or at least seek to be associated with such behavior. In fact,
many firms are seeking to free ride on this global green movement, without having the
actual ecological footprint to substantiate their environmental claims. While scholars
have articulated the benefits from such optimization of uniform global green operations,
the challenges for MNCs to control and implement such operations are understudied. For
firms to translate environmental commitment to actual performance, the obstacles are
substantial, particularly for the MNC. This is attributed to headquarters’ (HQ) control
challenges (1) in managing core elements of the corporate environmental management
(CEM) process and specifically matching verbal commitment and policy with ecological
performance and by (2) the fact that the MNC operates in multiple markets and the HQ is
required to implement policy across complex subsidiary networks consisting of diverse
and distant units. Drawing from the literature on HQ challenges of MNC management
and control, this study examines (1) how core components of the CEM process impact
vi
optimization of global environmental performance (GEP) and then uses network theory
to examine how (2) a subsidiary network’s dimensions can present challenges to the
implementation of green management policies. It presents a framework for CEM which
includes (1) MNCs’ Verbal environmental commitment, (2) green policy Management
which guides standards for operations, (3) actual environmental Performance reflected in
a firm’s ecological footprint and (4) corporate environmental Reputation (VMPR). Then
it explains how an MNC’s key subsidiary network dimensions (density, diversity, and
dispersion) create challenges that hinder the relationship between green policy
management and actual environmental performance. It combines content analysis,
multiple regression, and post-hoc hierarchal cluster analysis to study US manufacturing
MNCs. The findings support a positive significant effect of verbal environmental
commitment and green policy management on actual global environmental performance
and environmental reputation, as well as a direct impact of verbal environmental
commitment on green policy management. Unexpectedly, network dimensions were not
found to moderate the relationship between green management policy and GEP.
vii
TABLE OF CONTENTS CHAPTER PAGE I. INTRODUCTION............................................................................................................1
Research Questions .................................................................................................3 II. CEM LITERATURE REVIEW ....................................................................................4 II. RESEARCH QUESTION #1: MANAGING CORE ELEMENTS OF CEM ……….7
Headquarters’ Role in CEM: Control Challenges .................................................10 Hypotheses.............................................................................................................15
III. RESEARCH QUESTION #2: CHALLENGES NETWORK DIMENSIONS...........27 Network Theory .....................................................................................................28 Network Complexity and Environmental Performance.........................................31 Impact of Network Dimensions .............................................................................32 RQ #2 Hypotheses .................................................................................................34
IV. DATA & METHODS..................................................................................................41
Dependent Variables..............................................................................................43 Independent Variables ...........................................................................................45 Statistical Analysis ................................................................................................64
V. RESULTS .....................................................................................................................67 RQ#1: Discussion & Contributions .......................................................................78 RQ#2: Discussion & Contributions .......................................................................80 VII. POST-HOC SEGMENTATION ………...…………………………………………85
Typology 2 x 2 matrix……………………………………………………………85 Hierarchical Cluster Analysis……………………………………………...…......94
VIII. DISSERTATION SUMMARY …….………………………………………….108
Future Studies ......................................................................................................111 Limitation.............................................................................................................112
LIST OF REFERENCES.................................................................................................114 APPENDICES .................................................................................................................135 VITA................................................................................................................................199
viii
LIST OF TABLES
1. Sample Split by Sector...................................................................................................42
2. Summary of Mission Statement Types ..........................................................................49
3. Environmental Institutional Items..................................................................................53
4. Factor Analysis Environmental Institutional Diversity .................................................55
5. Reliability Analysis Institutional Diversity Items..........................................................56
6. List of Sector Dichotomous Variables...........................................................................61
7. ANOVA Sector Effects by GEP....................................................................................62
7a. ANOVA Sector Effects by Green Policy.....................................................................62
7b. ANOVA Sector Effects by Reputation ........................................................................64
8. Descriptive Statistics......................................................................................................67
9. Correlation Matrix .......................................................................................................72
10. Regression Results (Verbal Commitment & Green Policy Management GEP)..........73
10a. Regression Results (Network Effects) .......................................................................74
11. Regression Results (Green Policy Management) ........................................................76
12. Regression Results (Environmental Reputation) .........................................................77
13. Cross tabulations (GEP & Environmental Institutional Network Score) ....................89
14. Correlation Matrix: Four Quadrants ...........................................................................91
15. Post Hoc Regressions: Four Quadrants to Predict GEP...............................................92
16. Post Hoc Regressions: Four Quadrants to Predict Network Density...........................93
17. Hierarchical cluster analysis Descriptive Statistics: 6 clusters ....................................94
18. Hierarchical cluster analysis One Sample Test: 6 clusters ........................................95
19. Hierarchical cluster analysis ANOVA.........................................................................96
ix
20a. Duncan Test: Green Policies Management ................................................................97
20b. Duncan Test: GEP......................................................................................................98
20c. Duncan Test: Density.................................................................................................99
20d. Duncan Test: Geographic distance KM...................................................................100
20e. Duncan Test: Environmental institutional network score........................................101
21. Summary of Hierarchical Cluster Classification .......................................................102
x
LIST OF FIGURES
FIGURE PAGE 1. Framework for Corporate Environmental Management (VMPR) ................................14
2. Corporate Environmental Management and Strategy Formulation ...............................26
3. Corporate Environmental Management Control............................................................32
4. Research Model .............................................................................................................40
5. Environmental Reputation Frequency Distribution .......................................................45
6. PCA: Scree Plot .............................................................................................................55
7. Geographic Distance......................................................................................................57
8. Geographic Distance low COV .....................................................................................58
9. Geographic Distance low COV/High Geographic Distance..........................................59
10. Two x Two Firm Typology .........................................................................................87
xi
ACRONYMS AND ABBREVIATIONS
MNC Multinational Corporations
GEP Global Environmental Performance
VMPR Verbal Commitment, Management, Performance, Reputation
CSR Corporate social responsibility
HQ Headquarters
FDI Foreign Direct Investment
NGOs Non governmental Organizations
CEM Corporate Environmental Management PCA Principle Component Analysis EFA Exploratory Factor Analysis RQ Research Question DV Dependent Variable PSI Pacific Sustainability Index
1
INTRODUCTION
MNCs dominate the majority of high pollution producing industries like chemical,
petroleum, and heavy manufacturing, and being environmentally responsible has become
an imperative component of operating within today’s global marketplace (Kolk, 2005).
Despite the significant literature examining why environmental compliance, self
regulation, and standardization are advantageous (Hart, 1995; Dowell et al., 2000;
Carnicross, 1992; Porter, 1990; Christmann, 2004), the challenges of achieving global
environmental performance (GEP) are less discussed (Aguilera-Caracuel, Aragón-Correa,
& Hurtado-Torres, 2011). The increased trend of global environmental regulations and
green consumerism movements have shifted the scholarly debate from focusing on firms
who are seeking to exploit lax environmental contexts (Birdsall & Wheeler, 1992) to
those who are moving beyond mere compliance towards building green competitive
advantages and sustainability (Christmann, 2004; King & Shaver, 2001) for whom this
study seeks to provide useful insights. In addition, large variations in environmental
performance among firms from the same home market, industry, and environmental
regulatory contexts (Dasgupta, Hettige & Wheeler, 2000) direct the research question to
look beyond external market regulations as the sole driver of global environmental
performance (GEP) and in doing so attempt to better understand the possible challenges
preventing MNCs from achieving global environmental performance (Mohan, 2006),
focusing on the expected headquarters (HQ) role to control and/or monitor global
environmental performance of its global operations.
2
Corporate social responsibility (CSR) is defined as the “business organization's
responsibility for integrating stakeholder concerns in routine business activities for
primary stakeholders”, whereby the environment is regarded as a primary stakeholder
(Mohan 2006: 10; Starik, 1995). Corporate environmental management (CEM) refers to
“corporate environmental responsibilities, practices, procedures and the processes for
determining and implementing corporate environmental policy” (Netherwood, 1996: 35).
In order to examine the challenges MNCs may face in optimizing global environmental
performance, the objective of this research is to (1) analyze core elements of the
corporate environmental management process differentiating between verbal
commitment to act, actual ecological footprint of the MNC as a whole and its
environmental reputation. Using this comprehensive approach, this study draws from the
headquarters control literature to examine the impact of HQ verbal environmental
commitment (what they say they will do) and environmental policies (what they set out to
do) on actual environmental performance (GEP) (what subsidiaries actually do) and
environmental reputation (what the firm becomes perceived as doing by others).
Furthermore, the second objective of this study is to (2) examine the moderating impact
of MNC subsidiary network dimensions on the relationship between green policies and
actual environmental performance, a moderating relationship which has received lesser
theoretical attention. It is the subsidiary network that facilitates adoption of common
practices as well as headquarters control and management of the subsidiary network. The
3
degree to which MNCs can effectively use their internal networks to implement strategies
is often a function of limitations inherent within their inter-organizational structures
(Galbraith & Kazanjian, 1986; Ghoshal & Bartlett, 1990; Stopford & Wells, 1972).
This study takes a comprehensive approach to examining CEM by first drawing from the
literature on the HQ role in management/control of the MNC to (1) examine the core
components of the CEM process which includes Verbal environmental commitment,
environmental Management standards/policy, actual global environmental Performance,
and finally corporate environmental Reputation (VMPR framework). Second, it uses
network theory to (2) examine how key network dimensions can challenge the
implementation of CEM and hinder MNC GEP, specifically focusing on the relationship
between green policy management and actual practice.
Research Questions
This study has two main research question: (RQ #1) How do the core elements of the
CEM process work together to impact global environmental performance, distinguishing
between HQ control efforts through the use of verbal commitment vs. formalization of
environmental management policies on ecological performance? In doing so, the
dissertation attempts to identify firms who are free riding (green washing) on this green
movement without reflecting this commitment to actual ecological performance. And
then, (RQ #2) how do inherent complexities of subsidiary network design present
challenges to global environmental performance? In doing so, the study seeks to provide
4
a better understanding of the challenges faced by MNCs who are in pursuit of optimizing
GEP within their complex networks. The dissertation aims to contribute specifically to
the MNC CEM process and global implementation literatures, highlighting the
difficulties faced by headquarters in managing the core elements of the CEM process and
in driving uniform best practices across subsidiaries.
CEM Literature Review
While significant literature exists on the reasons or expected gains from firms behaving
responsibly towards the environment, this study focuses on the challenges these firms
face in accomplishing this, which are less understood, particularly when incorporating the
international nature of the MNC (Mohan, 2006). The study attempts to provide key
insights on how and why an MNC’s global CSR commitment is not to be regarded as an
easy headquarters top down decision (Barin-Cruz & Pedrozo, 2009).
Within the context of environmental performance, researchers have argued for the
importance of streamlining and uniformity of environmental practices, which is likely to
increase global competitiveness (Christmann, 1998; 2004). Aragon-Correa and Sharma
(2003: 85) argued that “organizations that adopt a consistently proactive approach will
develop a dynamic ability through which they will reap rewards during periods of state
uncertainty and complexity in the general business environment by reducing organization
and effect uncertainty at the business-natural environment interface”. Firms’ self
regulation practices often occur through the deployment of a single global environmental
5
policy across their multiple subsidiaries (Christmann, 2004). “By specifying a single
corporate standard, performance monitoring and evaluation costs might be reduced
because a single set of values, specifications, and procedures can be deployed throughout
the world, without the need to consider local deviations from the norm” (Dowell, et al.,
2000: 1062). Uniform environmental policy will make it easier for a HQ to manage and
coordinate operations, which includes the adoption of new technology and reduces
complexities of operation (Christmann, 2004). These are the same motivations commonly
noted for standardizing other key functions (Christmann, 2004). Dowell and colleagues’
(2000) investigation confirms that MNCs that apply a “single stringent global
environmental standard” actually have higher market values, as measured by Tobin's q.
For a literature review on the relationship between firm performance and environmental
behaviors, see Molina-Azorín and colleagues (2009), who provide evidence of more
studies finding a positive relationship between firm performance and environmental
behaviors, although conclusive evidence is still mixed.
However, given the complexity of managing the MNC, it is unlikely that uniform
adoption of environmental polices is likely to be achieved smoothly via headquarters top
down decisions (Tsai & Child, 1997). Newton and Harte (1997) critique business
literature that assumes the adoption of green policies will occur in an “ordered
conversion” fashion. They explain that thinking firms can smoothly adopt management
practices to comply with increased environmental regulations is “unrealistic” (Rugman &
Verbeke, 1998: 364). This study seeks to break down these challenges by first (1)
examining how HQ attempts to control MNC environmental behavior via the use of firm
6
verbal commitment and formalized policy impact environmental performance and then
(2) how subsidiary network dimensions impact the implementation of policies.
CEM literature has mainly focused on (1) home/host market institutions and the role they
play in shaping firms’ environmental behaviors (Aguilera-Caracuel, Aragón-Correa, &
Hurtado-Torres, 2011; Dasgupta, Hettige, & Wheeler, 2000; Delmas & Toffel, 2004;
Henriques & Sadorsky, 1996; Hoffman, 2001; Hurtado-Torres, 2011; King & Shaver,
2001) as well as (2) internal firm resources, examining how specific firm-level
capabilities are driving environmental behavior (Aragon-Correa & Sharma, 2003; Chen,
2011; Christmann, 2000; 2004; Elsayed, 2006; Menguc, Auh, & Ozanne, 2010; Russo &
Fouts, 1997; Waldman, Siegal & Javidan , 2006; Waddock & Graves,1997). Each of
these main research streams has indeed contributed to our understanding of significant
opportunities and challenges of CEM. Current literature relies mostly on dominate
theoretical lenses of Institutional Theory, RBV, and Legitimacy/Stakeholder Theories
(Berman et al., 1999; Cormier, Denis Gordon, & Magnan, 2004). In light of this
theoretical focus, lesser attention is given to challenges faced by headquarters in
controlling the firm, and specifically to balancing the relationships between verbal
environmental commitment, policy setting and actual environmental outcomes.
Furthermore, building on the MNC as a complex network perspective, lesser theoretical
attention is also given to the subsidiary network itself in CEM, which is (1) a strategic
source of competitive advantage behind its “causal ambiguity” (Lippman & Rumelt,
1982) and also a (2) mechanism for implementation of strategy (Ghoshal & Bartlett,
1989; Holm & Pedersen, 2000; Peng, 2001). Additionally, given the role of the
7
subsidiary network as a facilitator of inter-unit learning as well as for streamlining and
controlling global operations, it is likely to have an impact on the adoption of practices
across the network. It is through their subsidiary networks that MNCs seek to
communicate, control, coordinate, manage, and implement uniform adoption of practices,
and failures of the network are likely to bring challenges to achieving this (Martinez &
Jarillo, 1991). Nevertheless, except for a few studies, the network theory lens is
significantly underutilized in CEM (Haverkamp, Bremmers, & Omata, 2010; Akiyama,
2010; Alexander, 1998).
Research Question #1: Managing Core Elements of CEM
In Onkila‘s study (2009: 288), she cites Shrivastava (1995), stating that “Corporate
environmental management (CEM) has been characterized as a context of complexity
and uncertainty in which choices have to be made and the consequences of corporate
action and different stakeholder views coped with.” While previous literature focused on
external sources of such complexities, I build on the work of Rugman and Verbeke
(1998) who direct literary attention to corporate level strategy and the decisions made at
the firm level in response to increased environmental pressures. “(T)hrough a complex
web of constituents, environmental protection is becoming culturally refrained from
something external to the market environment to something that is central to the core
objectives of the firm” (Hoffman, 2001: 137). While some aspects are responses to
regulation, CEM includes mostly voluntary and internally driven initiatives which,
according to Sinding (2000), include a company’s stand on environmental issues,
operations and reporting policies, and finally a company's actual ecological footprint.
8
Different scholars have individually examined different elements of the CEM process
(Clemens & Bakstran, 2010; Onkila, 2009; Schendler & Toffel, 2011), but this study
investigates in concert how these key elements of verbal commitment, green policy
management, ecological performance and environmental reputation are interrelated as
key CEM process components.
While earlier scholars put forth the argument of MNCs exploiting cost advantages from
host markets with lax environment regulations known as “pollution havens” (Gladwin,
1987), Christmann (2004) explains that although such exploitation practices were
common in the 1970s and 1980s, recent evidence depicts that MNCs are increasingly
implementing more self regulation environmental policies (Brown, Derr, Renn, & White,
1993; Dowell, Hart, & Yeung, 2000). This green trend of firm behavior is no longer
connected solely to external stakeholder pressures, but is driven by firms’ self interest in
doing so. Klassen and Mclaughlin (1996) found that the announcements of firms
recognized as being environmentally conscious were directly linked to an increase in the
market value of their shares traded in the stock exchange. Others documented significant
benefits from being associated with being “green” (Hart, 1995; Dowell et al., 2000;
Carnicross, 1992; Porter, 1990; Christmann 2004), which puts significant pressures on
HQs to position their firms as “green” MNCs. But given the complexity a HQ faces in
the strategy formulation process (Mcmillan 2004; Mintzberg & Waters, 1985), there is
often a situation where there may be a gap between a HQ’s intentions manifested in their
“intended” strategy and their actions manifested in their “emerged” strategy, which
9
highlights the importance for a HQ role in controlling the organization. CEM scholars
note that although many firms use strong provocative statements to highlight their
commitment to the environment (Saha & Darnton, 2005) to positively portray their green
position in the market, that is not to say these firms are actually putting their words to
substantial action (Laine, 2005). This indicates a need for us to understand how the MNC
CEM core elements work together to impact environmental performance and HQ’s role
in this process.
Control refers to “any process (mechanism, instrument) applied by the organization to
assure the execution of organizational goals and plans” (Ambos & Schlegelmilch, 2007:
474). Control is a process “whereby management and other groups are able to initiate and
regulate the conduct and activities so that their results accord with the goals and
expectation held by those groups” (Child 2005: 112). Classical international business
theories, specifically product life cycle theory and internationalization process theory,
have all based their assumptions on the subsidiary being an instrument for
implementation of HQ strategy (Birkinshaw & Hood, 1998). Jamali (2010) describes that
“even when MNCs try to adequately resource their subsidiaries in the context of a
localized/decentralized CSR strategy, it becomes difficult to monitor and control them
because of physical and cultural distance; hence issues of coordination and control
become salient”. The fact that the MNC operates in multiple competitive host markets
“may increase the challenges of developing globally coherent CSR strategies and creating
synergies among them” (Barin-Cruz & Boehe, 2010: 248). Scholars highlight the
importance of conceptualizing control in a manner that extends beyond only hierarchical
10
top down decisions (Geringer & Hebert, 1989), calling for a better understanding to
unlock the different types of control mechanisms that firms use to guide actions (see, e.g.,
Chen, Park, & Newburry, 2009, and Cardinal, 2001, re: Output, Process and Social
Control). Geringer and Hebert (1989) borrow from Bartlett’s distinction to show that
some control mechanisms are (1) context–oriented/informal and (2) content-
oriented/direct intervention from management in a bureaucratic fashion. Similarly,
Geringer (1986) also reported that control has a scope dimension where he differentiates
between narrow vs. wide control scopes. Therefore, HQ may choose to exert control over
all activities or only select to control some activities of the organization (see, e.g., Choi &
Beamish, 2004; Newburry & Zeira, 1999).
In light of these discussed challenges, the HQ needs to effectively and smoothly manage
the CEM elements, making sure its formulated strategy is effectively implemented.
Scholars noted that control is not an automatic consequence of ownership (Friedman &
Beguin, 1971).
Headquarters’ Role in CEM: Control Challenges
Headquarters have key “administrative and leadership roles with regard to implementing
corporate strategy, participating in divisional strategy formulation, coordinating the
different divisions, and fostering overall cohesion, identity, and direction within the
company“ (Grant, 2008: 419). While it is important for MNCs to allow subsidiaries
sufficient autonomy to respond to local market conditions (Newburry & Zeira, 1999;
11
Newburry, Zeira & Yeheskel, 2003), headquarters are often responsible for effective
management and monitoring of network members’ local environmental actions, without
jeopardizing the MNCs' goals of integration and standardization of operations (Roth &
Morrison, 1990). Birkinshaw and Hood (1998) explain that subsidiaries’ prescribed
mandates within the MNC are not stagnant; instead, subsidiaries undergo “subsidiary
evolution”, which is the result of capabilities being acquired and also being depleted over
the life of the subsidiary, which makes it important for HQs to monitor subsidiaries’
behaviors even after issuance of mandates. Although we are witnessing greater
decentralization of decision making, HQ remains the key actor charged with controlling
and coordinating the operations of the MNC, while subsidiaries are implementers (Roth
& Kendall, 1992). This is recognized as “hierarchical decision making” (O’Donnell,
2000). It is the parent firm’s responsibility to issue the environmental responsibility
reports reflecting its operations around the globe (Mohan, 2006), which are often highly
scrutinized by stakeholders such as NGOs. Jamali's (2000: 193) findings support that
although subsidiaries can choose local themes to support CSR initiatives, they are
responding to the overall directions issued to them by headquarters. Managers in her
study explain that “MNC 5 annually sets a theme for CSR at the global level and all
MNC 5 offices perform CSR activities relating to that theme. The country offices come
up with suggestions about the specific activities that can be performed within the general
CSR theme, and these are communicated to the Middle East office. There are cooperative
decision-making patterns within the network.’’
12
However, the literature has also documented that given the complexity of managing the
MNC, authoritarian HQ decisions/controls are not absolute determinants of firm actions.
Subsidiary roles are defined by the interactions of different sources of influence: (1) head
office assignment (the head office predetermines the subsidiary’s capability), (2)
subsidiary choice (through networks, subsidiaries can develop their own capabilities or
by the subsidiary’s autonomous managerial decision making process which determines
their actions without the influence of their head office), and (3) determination by the local
environment (Birinshaw & Hood, 1998). Birkinshaw and colleagues (1998) reviewed
these three sources of variations in subsidiaries’ roles, and reported there was no
conclusive evidence of which factor predicted subsidiaries’ behavior most. In the first
research question, this study will focus on the role of HQ in shaping subsidiaries’
behaviors through a mix of control mechanisms.
Particularly to CEM, it is unlikely that uniform adoption of environmental polices is
likely to be achieved smoothly via headquarters’ top down decisions alone (Tsai & Child,
1997). In their study of Indo-American joint ventures, Panda and Gupta (2003) found
significant gaps between what leaders believed to be the “prevailing” company
values/mission and that which other organizational members perceived to actually exist
and also what these other members aspired for them to be. They attribute this to corporate
executives’ weak efforts in disseminating the values prescribed by these mission
statements to all organizational members resulting in the incongruity between individual
vs. corporate values.
13
MNC control can vary on dimensions of formality by being either formal or informal
(Harzing, 1999), manifested in “bureaucratic vs. personal surveillance and organizational
culture”. MNCs use a combination of mechanisms for goal alignment between their
subsidiaries to monitor and control behaviors which include (1) launching of policies
with coordination mechanisms that are either formal or subtle (Martinez & Jarillo, 1991),
and (2) the creation of a common corporate culture with shared values manifested
through the process of socialization (Geringer & Hebert, 1989). Headquarters can control
the MNC by exercising three different types of controls, which are “centralization, where
the decision-making power is retained at the headquarters; formalization, where decision-
making power is routinized through rules and procedures; and socialization, whereby
organizational members develop common expectations and shared values that promote
like-minded decision making” (Ambos & Schlegelmilch, 2007: 475).
This study seeks to explore the impact of a HQ’s efforts in setting policies and using
verbal communication to control its network of subsidiaries, specifically within the
context of optimizing environmental performance. The upcoming research model
investigates the corporate environmental management process and presents hypotheses
for how each component of that process is related. The components of corporate
environmental management investigated in this study are (1) an MNC’s verbal
environmental commitment, (2) an MNC’s environmental management policies, (3) an
MNC’s actual environmental performance/ecological footprints and finally (4) the
corporate environmental reputation the MNC has built for itself or others have associated
14
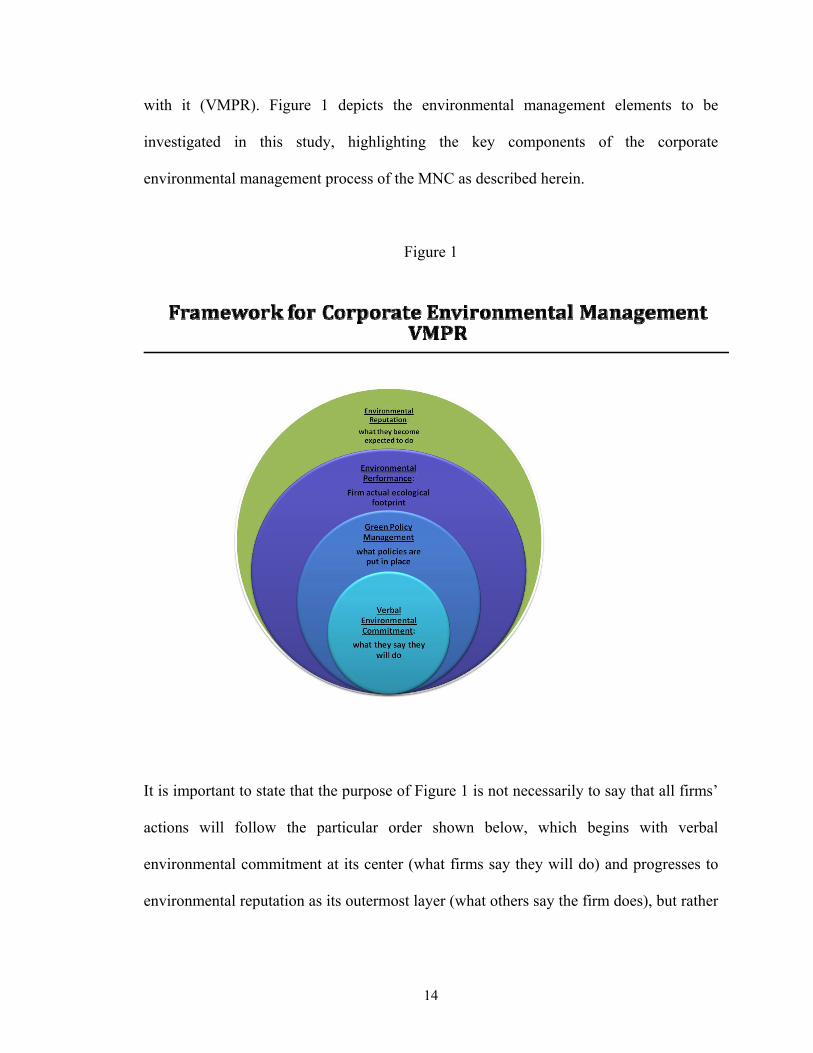
with it (VMPR). Figure 1 depicts the environmental management elements to be
investigated in this study, highlighting the key components of the corporate
environmental management process of the MNC as described herein.
Figure 1
It is important to state that the purpose of Figure 1 is not necessarily to say that all firms’
actions will follow the particular order shown below, which begins with verbal
environmental commitment at its center (what firms say they will do) and progresses to
environmental reputation as its outermost layer (what others say the firm does), but rather
15
is an attempt to conceptualize the multiple aspects of the CEM process where each
component is important for firms to effectively manage and control. The next section
presents hypotheses predicting how these elements are related within the context of
headquarters’ efforts at controlling the organization. More specifically, the study explores
the impacts of (1) informal socialization control mechanisms exercised through verbal
environmental commitment and (2) formal control mechanisms exercised through green
polices to drive green ecological footprints. The next section discusses these hypotheses.
RQ#1 HYPOTHESES
Informal Control: Verbal Environmental Commitment
Companies can use informal control mechanisms, like informal communication and
socialization efforts (Chang & Taylor, 1999), to implement corporate values using
multiple means for communicating these values. O’Donnell (2000: 531) explains that
“the cooperative behaviors needed in conditions of high international interdependence are
best facilitated through social control methods”. Birkinshaw, Hood and Jonsson (1998)
proposed that firm leadership predicted positively subsidiary initiative and the
subsidiary’s contributory role in achieving MNC goals. Informal communication control
mechanisms can allow MNCs (1) to communicate to all stakeholders what the company
cares about and plans to be committed to (King, Case, & Premo, 2010), which creates a
common culture, and also (2) serves as an initial step in building firm reputations
reflecting these core values. Birkinshaw and Hood (1998) found parent’s management
16
ethnocentrism, which refers to the parent’s sense of national superiority over subsidiaries,
to have a direct impact on the actions of subsidiaries and the role they play within the
network.
Because firms’ actual actions are often guided by their communicated actions, in
essence, what the firm “says” it believes are important issues is likely to give some
indication of what factors it is likely to act upon and seek to implement, which helps get
everyone on the same page of what strategic actions are likely to be taken. Mintzberg
and Waters (1985) explain that purely deliberate HQ strategies are those where the HQ
has communicated their intentions for these actions, which need to be “articulated in a
relatively concrete level of detail, so that there can be no doubt about what was desired
before any action was taken” (Mintzberg & Waters, 1985). Such intentions must be
collectively shared by all actors and also realized as intended.
Therefore, a key step to controlling global operations and becoming a globally
environmentally conscious company would be to articulate or verbally communicate
concerns for environmental consequences or issues, reflecting the firm’s intentions
towards the environmental issues. Firms will often use verbal commitments to different
issues to present an image to all stakeholders that will guide the behavior of their
employees and partners. Hart (1995) proposes that MNCs who are more capable at
establishing a shared vision are more likely to acquire the resources needed for
sustainable development. Mission statements can determine firm actions when there is
“organizational involvement in interpreting, refining, and making it operational” (Bartlett
17
& Ghoshal, 1994: 82). Onkila's (2009: 285) study of Finnish firms reveals that firms'
environmental statements were used to increase acceptability of the firms' environmental
behaviors using three forms of rhetoric, each depicting a different relationship between
the corporation and its stakeholders, which she defines as rhetoric of (1) dominance, (2)
subordination and equality and (3) joint action.
Mission statements are ways by which a firm can identify itself to stakeholders (King,
Case, & Premo, 2010). They serve as mechanisms by which a company can describe its
“reason for being" (David, 2009). Mission statements are a form of corporate
communication that sets “the framework or context within which the company’s
strategies are formulated” (Hill & Jones, 2008: 11) and therefore sets the strategic
direction of the firm (Sattari, Pitt & Caruana, 2011) and indicates the types of practices or
objectives the firm is committed to. Bartlett and Ghoshal (1994: 82) explain that “the
statement must be broad enough to invite — and indeed require — the organizational
involvement in interpreting, refining, and making it operational. In practice, this means
tapping into the reservoir of knowledge and expertise that is widely distributed
throughout the company”. Campbell (1992) explains that for mission statements to
impact actual day to day operations, organizational members need to develop emotional
commitment to the firm’s purpose as specified by the mission statements. For the MNC,
the translation of mission statements to guide actual behaviors is challenged by its diverse
and dispersed organizational members. Although subsidiaries may superficially identify
with the values of the mission statements, a strong cohesive organizational culture as well
18
as individual units’ engagement in formulating these mission statements is needed to
substantiate the actual practices to follow.
Firms’ environmental commitment can also be found in their websites and other
environmental online reports issued (Branco & Rodrigues, 2008; Sinclair & Walton,
2003). Furthermore, Onkila (2009) highlights the importance of understanding the
environmental rhetoric of firms, stating that this “language” aspect of corporate
environmental management (CEM) is “missing”. Given the important role of corporate
communication as an informal control mechanism, one would expect those that verbally
communicate environmental concerns are more likely to enforce their voiced
commitment (Bartkus & Glassman, 2008).
Accordingly, I hypothesize;
H1: There is a positive relationship between MNCs’ environmental verbal
commitment and their global environmental performance.
Formalization: Green Policy Management
Nobel and Birkinshaw (1998) explained that firms use three modes of control over their
dispersed units: (1) centralization, where HQ makes all the decisions, (2) formalization,
where there are established rules and guides that determine behavior, and finally (3)
socialization, where the firm seeks to create an informal setting where shared values can
lead to increased possibilities of similar decision making. Each of these modes is
19
“complementary and competing” (Nobel & Birkinshaw, 1998: 483). In the context of
CEM, the previous hypothesis discussed a mechanism of socialization. Yet, while a
majority of leading firms may issue mission statements to reflect their commitment to
different social issues, this is not to say they can be described as “effective mission
statement(s)" that will control subsidiaries’ behaviors (Panda & Gupta, 2003: 24).
Deliberate strategies rely on heavily detailed planning as well as the establishment of
formal control mechanisms (Mintzberg & Waters, 1985). While the term “environmental
policy” traditionally has been used to describe how governments or NGOs set policies
regarding how firms should behave towards the environment, I build on the work of
Rugman and Verbeke (1998), who direct literary attention to corporate level strategy and
the decisions made at the firm level in response to increased environmental pressures.
While it is important for the firm to verbally communicate in its vision or mission
statements the degree to which it cares for community and environmental issues, if such
commitment is not transferred to setting actual firm environmental management policy to
make that commitment substantial, then it remains “superficial” and less likely to become
implemented. Utilizing the formalization mechanism of control, today, many MNCs have
established well defined and strict guidelines for all aspects of operations, some of which
extend beyond their subsidiaries to all members of their supply chain including suppliers
and distributors. Hart (1995) explains that for firms to develop green competitive
advantages they must adopt best environmental practices at all stages of the product life
cycle. He describes environmental management as including (1) pollution prevention
which occurs at the production and operations stage, (2) product stewardship which
requires including the environment as a key stakeholder in the design and development
20
stage, and finally, (3) sustainability development, where corporations work on building
the bridge between environmental and economic consequences in developing countries.
Environmental management control not only refers to setting operational standards, but
also to guidelines in reporting company environmental practices. In 2008, almost 80% of
the Fortune 250 firms issued “stand alone” sustainability reports (KPMG, 2008). This
trend of so called “value reporting” (Livesey & Kearins, 2002), which is mostly
voluntary, has become an integral part of corporate communication. For these firms, it is
not enough to simply communicate verbally their commitment to the environment, but
they have also committed to specific reporting guidelines to show stakeholders they are
acting on their word and enforcing environmental commitment. Examples of firms’
successful environmental policy programs include 3M’s 3Ps (Pollution Prevention Pays)
and Dow’s WRAP (Waste Reduction Always Pays) (Smart, 1992). Alongside this trend
is the increased number of agencies whose function is to report to investors how effective
firms’ environmental polices really are. MSCI ESG (environmental, social, and
governance) Research is one of the leading ranking agencies. They provide the Global
Socrates database, and recently developed the “Green Policy” score, measuring the
effectiveness of firms’ management of their environmental policies. Similarly, although
providing data for a smaller sample, the Dow Jones Sustainability Index “focuses on
operational impacts such as pollution levels and regulatory compliance, as well as the
presence or absence of environmental management practices affecting operations (such as
environmental auditing) and stakeholder engagement (such as environmental reporting)”
(Schendler & Toffel, 17-18: 2011).
21
Building on the discussed importance of verbal environmental commitment as an
informal control mechanism and policies as a formal control mechanism, one would
expect those companies with verbal commitment to environmental performance would
more likely be the firms having effective environmental management policies to guide
their global behaviors. Accordingly, I hypothesize;
H2: There is a positive relationship between environmental verbal commitment
and green policy management.
For many of the leading firms that seek benefits from having environmental policies, the
benefits can range from mere compliance with regulations, building overall legitimacy of
operations, and achieving green competitive advantages over peers, to effective actual
environmental performance measured by their ecological footprint (Clemens & Bakstran,
2010). Given the trend of self regulation that describes the majority of leading firms’
behaviors, one would expect those firms that have in place environmental
policies/standards are more likely to behave environmentally consciously than those who
do not have such policies or those that have weaker policies.
Because of the level of interdependence between MNCs’ globally dispersed operations,
and the benefits from standardization of global operations, it would make sense for
MNCs to seek to have corporate policies that translate to wide MNC actions. In fact, this
is one of the reasons why MNCs are expected to address environmental issues. MNCs
22
can leverage their networks to maximize environmental performance, which other local
firms and governments may not be able to address to the same degree (Hart, 1995).
Accordingly, I hypothesize:
H3: There is a positive relationship between firm green policy management and
global environmental performance.
Signaling: Environmental Reputation
A firm’s reputation is the “perceived capacity to meet their stakeholders’ expectations”
(Waddock, 2000: 323). It refers to the overall knowledge and esteem about a corporation
held by the public (Fombrun & Shanley, 1990; Newburry, 2010). Although perceptions
of firm behavior are a key component in determining a firm’s reputation, its actual
behavior is perhaps even more critical. Corporate social performance and financial
performance are the two main drivers of a firm’s reputation (Fombrun, 1990; Soleimani,
2011). Signaling theory explains that stakeholders will formulate an image of expected
firm behaviors based on limited information (Myers & Majluf, 1984; Behrend Baker, &
Thompson, 2009). Reputation is determined by how the audience reacts to the different
organizational signals (Love & Kraatz, 2009). Citizens will often “anthropomorphize
organizations”, that is giving them traits as conscious actors rather than just as collective
entities which are expected to act as “coherent and social entities” (Love & Kraatz,
2009). Accordingly, firms need to not only act today in accordance with stakeholders’
current expectations, but they need to also meet expectations regarding their future
actions to allow stakeholders to develop an underlying degree of trust that a company will
23
look out for their best interests continuously. This makes a firm’s reputation serve not
only as an information signal, but also as an underlying reflection of the organization’s
character, whereby trust, as a guarantee of contracts between the firm and its
stakeholders, is an integral part (Cornell & Shapiro, 1987).
Scholars have shown that organizational behaviors can lead to significant changes in how
an audience perceives a firm (Love & Kraatz, 2009). Not only does verbal environmental
communication serve as a way to bind the firm to take actions that reflect such verbal
commitment, but it also sets the expectations of external actors in terms of expected
environmentally conscious behaviors from this firm. Scholars found pro-environmental
corporate messages had an impact in attracting potential employees (Behrend, Baker, &
Thompson, 2009). Furthermore, even if the firm’s environmental actions in one host
market do not directly impact its operations in another, corporate environmental
reputation can still be affected (Christmann, 2004). Christmann (2004) explains that
MNCs will standardize the content of their corporate environmental communication
across subsidiaries to make it appear that they all follow the same environmental
operations policies, and in doing so, use external public pressure to enforce subsidiaries’
substantial adoption of the environmental values communicated. Although reputation is
in fact externally perceived and therefore not directly controlled by managers, firms who
have communicated verbally and have put in place policies that support environmental
protection are likely to build their reputations compared to those that do not. While
contrary to our arguments, Cho and Coleefus (2012) recently found a negative
relationship between environmental performance and environmental reputation among
24
poor environmental performing firms who come from highly polluting industries.
Nonetheless, the next hypotheses are:
H4: There is a positive relationship between environmental verbal commitment
and global environmental reputation.
H5: There is a positive relationship between green policy management and
environmental reputation.
H6: There is a positive relationship between global environmental performance
and environmental reputation.
CEM CONTROL IN PERSPECTIVE
Setting environmental policies does not automatically mean effectively complying with
these policies. The MNC is confronted with various challenges which make successful
global environmental performance unlikely to be smoothly adopted (Tsai & Child, 1997).
In fact, many firms have a number of polices in place more for impression management
purposes (Bansal & Kistruck, 2006) rather than actually restricting operations.
Christmann and Taylor (2006) find that some firms will select “symbolic
implementation” of environmental best practices rather than actual implementation
depending on where self interest lies (Westphal & Zajac, 1994). Scholars also found that
firms with ISO 14000 certifications were not necessarily those having effective actual
environmental performance. While such certifications are meant to guide the
25
environmental behaviors of firms, the evidence of such a relationship is inconclusive
(Potoski & Prakash, 2005; Andrews et al., 2003). In fact, King et al. (2005) found that
firms with certifications actually had lower environmental performance. Christmann and
Taylor (2006: 866) explain that firms that “pursue symbolic implementation do not use
the certified management system in their daily operations, and make last-minute efforts to
prepare for certification audits. For these firms the standard serves a symbolic purpose”.
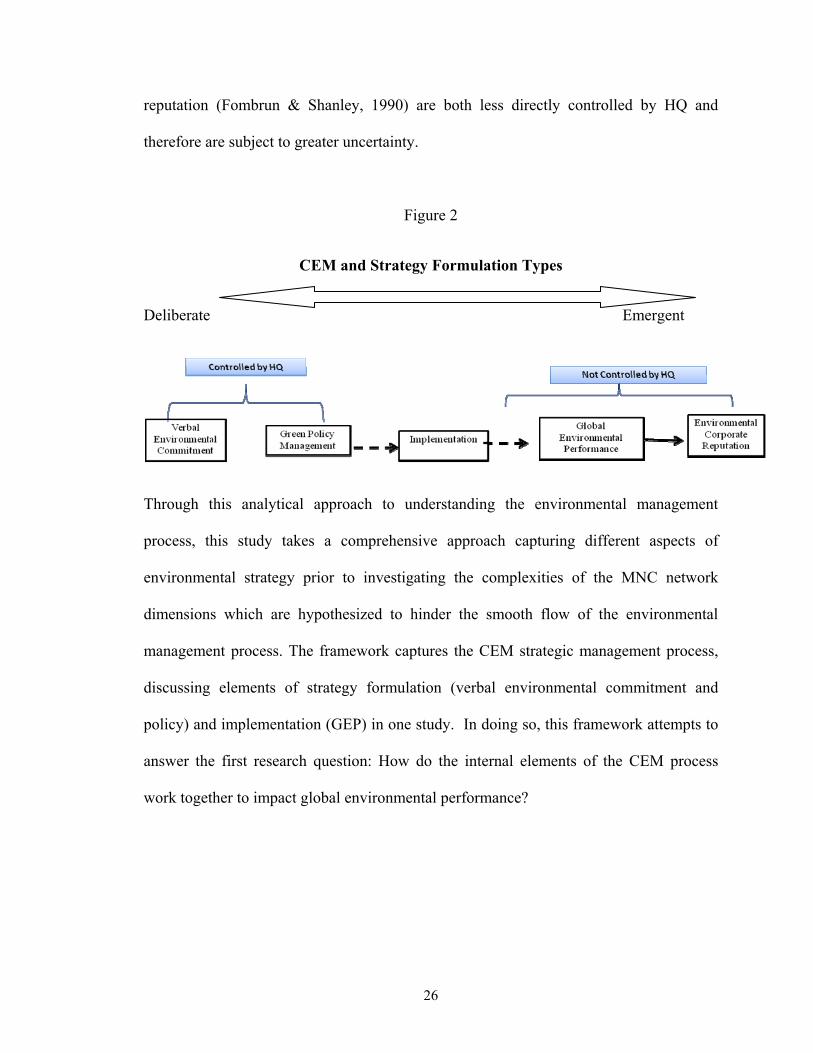
In light of the discussion provided by Mintzberg and Waters (1985) on the difference
between deliberate vs. emergent strategy, it is likely there will be some CEM strategic
elements that are more deliberate than others. It is on this basis that Figure 2 further
distinguishes between components of the VMPR framework, whereby some elements of
CEM are likely to be under more direct and deliberate influence by HQ, which seeks to
get them to be collectively honored. Other elements of CEM strategy are likely to lie
more on the continuum towards the emergent side where the HQ is likely to have less
direct control or influence on the outcome. Verbal communication and setting
environmental policy management are both internal to the firm. They are to a significant
degree actions controlled by management. Christmann's (2004) examination revealed that
corporate environmental communication content and environmental management
standards are two dimensions of the environmental management process that MNCs can
standardize. However, the other components of the environmental management process
which have to do with actual global implementation of environmental policies in order to
achieve (1) environmental performance and eventually obtain (2) environmental
26
reputation (Fombrun & Shanley, 1990) are both less directly controlled by HQ and
therefore are subject to greater uncertainty.
Figure 2
CEM and Strategy Formulation Types
Deliberate Emergent
Through this analytical approach to understanding the environmental management
process, this study takes a comprehensive approach capturing different aspects of
environmental strategy prior to investigating the complexities of the MNC network
dimensions which are hypothesized to hinder the smooth flow of the environmental
management process. The framework captures the CEM strategic management process,
discussing elements of strategy formulation (verbal environmental commitment and
policy) and implementation (GEP) in one study. In doing so, this framework attempts to
answer the first research question: How do the internal elements of the CEM process
work together to impact global environmental performance?
27
Research Question #2: Challenges from subsidiary network dimensions
In addition to the “corporate image” motivation to not following through on policies,
firms may also face significant structural challenges that act as barriers to their
substantial implementation of policies. Christmann (2004: 751) explains that “in MNCs it
is even more challenging for environmental managers at corporate headquarters to get
subsidiary managers' support for implementing standardized environmental policy”. In an
in-depth empirical analysis of eight cases in two MNCs drawn from diverse business
sectors, MNCs did have clearly stated social and environmental objective mission
statements and specific policies set at their parent companies (Mohan, 2006). However,
they were found to have variations in CSR practices across MNC subsidiaries in different
countries and across MNC subsidiaries within the same country (Mohan, 2006). These
findings indicate that there is likely to be a gap between what a HQ seeks to deploy and
what network members eventually adopt. Therefore, it is important to examine how the
green management policies to actual performance relationship is impacted by important
dimensions of MNC networks, which by default can raise complexities in implementing
policies, even if the MNC had intentions of substantiating them.
While scholars have drawn linkages to the interrelationships between MNC
internationalization elements and environmental performance (Rugman & Verbeke 2001;
Christmann 2004; King & Shaver, 2001), there is a need for theoretical and empirical
studies to indicate what elements of the inter-organizational network are likely to explain
this linkage. From a classic strategy angle, the unsettled debate between strategy and
28
structure (Wolf & Egelhoff, 2002) is also relevant here, where the question remains: does
the MNC have in place the proper network structure needed to effectively achieve global
environmental performance? Taking a network perspective to analyze environmental
management challenges is likely to reveal interesting insights, given that many believe
we are witnessing an era in which networks play a prominent role that may even “replace
markets and hierarchies” (Alter & Hage, 1993; Castells, 1996; Raab & Kenis, 2009).
Network Theory
An organization can be conceptualized as a network in which organizational units are
nodes interacting with each other, establishing formal and informal relationships (Brass et
al., 2004: 800). It is through networks that MNCs can reach strategic objectives, utilizing
the networks as mechanisms for gathering, processing, and transferring knowledge and
other strategic resources across markets (Ghoshal & Bartlett, 1989; Holm & Pedersen,
2000; Peng, 2001). Grant (1991) explains that the degree of interunit cooperation is
facilitated by the network, which transforms firm resources into capabilities. It is this
conglomeration of the individual members’ resources that will give a parent a
competitive advantage that would be too complicated if not virtually impossible for
competitors to imitate, behind their “causal ambiguity” (Lippman & Rumelt, 1982).
Subsidiaries of the MNC function as a social system of “interrelated units that are
engaged in joint problem solving to achieve a common goal" (Rogers, 2003: 23).
Network theory’s interest is in identifying the emergent order or patterns of complex
organizations and how they work rather than the underlying causes of the complex
organization’s behavior (Brodbeck, 2002; Mischen & Jackson, 2008).
29
As explained by this theory, what is unique about analyzing the network is that the
summation of the parts does not equal the whole (Anderson, 1999; Levinthal, 1997).
Instead, “the existence of whole networks points to the fact that something is produced by
the network which no single participating organization could be doing on its own and that
therefore also collective goods are produced at least for the network members” (Raab &
Kenis, 2009: 207).
Strategic Importance of the Network
MNCs that are able to effectively capitalize on their networks as sources of competitive
advantages are more likely to meet global strategic objectives. Brass and colleagues
(2004) explain that effective MNC subsidiary network interunit ties lead to improved (1)
performance for the organization and (2) innovation and knowledge activities. In
effective network structures, firms have access to each other as a resource. Therefore,
firms are able to maximize benefits from interunit information exchanges and achieve
overarching distinctive, intangible, and non imitable capabilities for the MNC as a whole.
The degree to which subsidiaries relate to one another makes up the MNC group norms,
which impact the practices that get introduced and eventually diffused among members
(Rogers, 2003; Nelson & Winter, 1982). Through interunit exchanges of acquired
knowledge, MNCs build their competencies (Zander & Kogut 1995; Szulanski, 1996).
MNC network structures can support the “exploitation and creation” of core
competencies (Prahalad & Hamel, 1990), which can be upgraded when such
competencies are transferred between units (Andersson, Forsgren & Holm, 2001). The
way an MNC network is designed has a key role to play in facilitating these interunit
30
linkages. In fact, the degree to which MNCs are able to achieve expected synergies set by
their global integration strategies is often a function of the limitations inherent in their
inter-organizational structures (Galbraith & Kazanjian, 1986; Ghoshal & Bartlett, 1990;
Stopford & Wells, 1972). “Organization theory has treated complexity as a structural
variable that characterizes both organizations and their environments” (Anderson, 1999:
216). Therefore, networks that are structured to facilitate a smoother exchange of ideas
between units create a stronger common culture of best practices across the network
members and smoother adoption of policies. These networks are more likely to maximize
the absorptive capacity of their members and more likely to uniformly adopt
environmental policies. This is in comparison to other MNC network structures which
may be less well organized to facilitate such smooth diffusion of practices between the
MNC network members.
While the application of network theory to the CEM literature is relatively new, it is
important to also shed some light on the potential of this growing direction exemplified
by the very few recent studies that have used a network theory lens to examine CEM.
Haverkamp Bremmers and Omata (2010) examine how the firm’s external network
interrelatedness impacts environmental management capability deployment in the Dutch
food and drink industry. Akiyama's (2010) case analysis of the environmental
management of a construction company revealed that the denser and stronger the
interorganizational network ties among workers, the more internalized the
CSR/environmental values became among workers. Alexander’s (1998) study used cases
31
in environmental management to present a structuration theory of interorganizational
network coordination to illustrate the possible variations of coordination structures.
Network Complexity and Environmental Performance
Furthermore, Aragón-Correa and Sharma (2003) generally proposed that the degree of
complexity moderates the relationship between a firm’s capabilities and actually
developing an effective and proactive environmental strategy, leading to competitive
advantage. The upcoming second set of hypotheses specifically investigates the
complexities brought about when we incorporate the effects of MNC subsidiary network
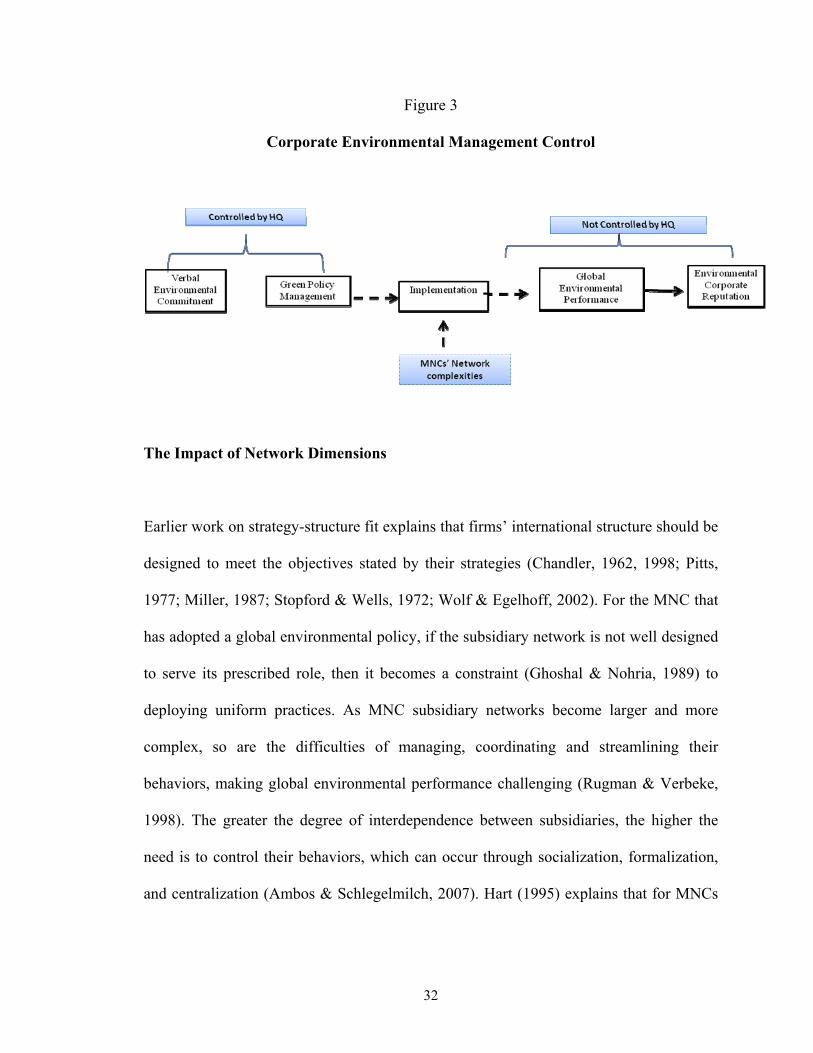
dimensions as depicted by Figure 3. Network effects are argued to bring about
complexities mainly where a firm has less control, making the firm more vulnerable to
having their strategy be shaped by external elements which they did not directly intend or
forecast. This is explained to be most evident at the point of translation between green
policy management and actual GEP, which is the implementation stage of the process.
32
Figure 3
Corporate Environmental Management Control
The Impact of Network Dimensions
Earlier work on strategy-structure fit explains that firms’ international structure should be
designed to meet the objectives stated by their strategies (Chandler, 1962, 1998; Pitts,
1977; Miller, 1987; Stopford & Wells, 1972; Wolf & Egelhoff, 2002). For the MNC that
has adopted a global environmental policy, if the subsidiary network is not well designed
to serve its prescribed role, then it becomes a constraint (Ghoshal & Nohria, 1989) to
deploying uniform practices. As MNC subsidiary networks become larger and more
complex, so are the difficulties of managing, coordinating and streamlining their
behaviors, making global environmental performance challenging (Rugman & Verbeke,
1998). The greater the degree of interdependence between subsidiaries, the higher the
need is to control their behaviors, which can occur through socialization, formalization,
and centralization (Ambos & Schlegelmilch, 2007). Hart (1995) explains that for MNCs
33
to adopt a product stewardship strategy, they must be able to effectively manage and
coordinate between the different functional units. Increasingly, MNCs are under more
pressure to satisfy multiple stakeholders across different host markets (Mohan, 2006) as
well as facing home-based pressures to meet environmentally conscious behavior
expectations. MNCs are “subject to both divergent and convergent pressures as a result of
the different institutional contexts of their home countries, host countries and global
industries” (Kolk, 2005: 147; Kostova, 1999).
Subsidiaries are challenged with “institutional duality”, which reflects pressures from
both home and host country institutions (Kostova, 1998). Subsidiaries are more likely to
superficially adopt a parent led practice when there is (1) uncertainty of outcome as well
as (2) legitimacy pressures for such practices to be adopted (Kostova & Roth, 2002).
MNCs are also under home-based pressures to effectively manage and monitor their
internal subsidiary networks’ environmental actions, while allowing their subsidiaries
sufficient autonomy to respond to local market conditions, without jeopardizing MNC
goals regarding integration and standardization of operations. Rugman and Verbeke
(1998) argue that home country effects cannot alone predict environmental policies,
because being environmentally conscious in a home market requires investment in unique
projects, which may not be transferable to other markets. But focusing on the host market
alone does not provide us a full understanding of what drives MNC environmental
behaviors either. Since the MNC has multiple host markets that operate via a network
fashion, it would be difficult to isolate the impact of one host market over another.
Scholars have noted that the behavior of complex systems is surprising and difficult to
34
predict (Daft & Lewin, 1990) because of the many interdependent and nonlinear
relationships between units (Casti, 1994), such that the “whole can be very different from
the sum of the parts” (Anderson, 1999: 217). Hoffman (2001:146) explains that the
difficulties of examining the multiple sources of cognitive and normative pressures that
simultaneously exist within the organization is the reason why network analysis is
regarded as “the most reliable way to empirically measure institutional phenomena”
when examining diffusion of environmental practices.
The next section will draw from the HQ-subsidiary management literature and
specifically the network conceptualization of the firm to examine the impact of three key
network structure dimensions on the relationship between Green Policy Management and
actual GEP.
RQ#2 HYPOTHESES
Diversity is defined as the degree of dissimilarity between network members on
dimensions related to industry scope and/or host market context (Tsai, 2000, 2001;
Varadarajan & Ramanujam, 1986; Mauri, 2009; Jackson & Deeg, 2008). Scholars have
documented the importance of similarity in facilitating communication and knowledge
sharing (Grandovetter, 1985) as well as for the formation of aligned interests and
common values. MNCs which have a high degree of institutional similarity between their
units are likely to face lesser challenges deploying a uniform environmental commitment
policy. When units share common grounds, they are likely to be more willing to adopt the
35
environmental policies initiated by headquarters or by sister firms. The comparison to
this would be an MNC that has high diversity among its units in institutional contexts
whereby it becomes harder for the network members to agree to adopt uniform
environmental policies, creating a situation of having a mix of adopters and non adopters
among units of the same MNC. Aguilera-Caracuel, Aragón-Correa and Hurtado-Torres
(2011) find that firms with low environmental institutional distance between home and
host markets actually were more effective in setting environmental standards within the
company.
Scholars highlight the importance of IB research that examines the diversity across
“institutional landscapes”. Jackson and Deeg (2008: 543) explain that “rather than
treating institutional diversity in terms of its "distance" from the norms of an MNE's
home country or ideal-typical liberal markets, the comparative capitalism approach has
developed a theory of comparative institutional advantage in which different institutional
arrangements have distinct strengths and weaknesses for different kinds of economic
activity”. They explain further that “institutions are seen not only as constraints but also
as resources for solving key problems of economic coordination through non-economic,
value-rational sets of commitments” (Jackson & Deeg, 2008: 543).
Kostova and Roth (2002) explain that subsidiaries face conflicting forces due to
institutional duality which sometimes can lead them to only superficially adopt a
management practice that the parent wants, but in actuality not implement it. Rugman
and Verbeke (1998) explain that it is likely that different units will have different
36
perceptions regarding the adoption of environmental policies. Rugman and Verbeke
(1998) argue that home country effects cannot alone predict environmental policies,
because being environmentally conscious in a home market requires investment in unique
projects, which may not be transferable to other markets. King and Shaver (2001) reveal
that firms' actions are shaped by the host markets they operate within. Having variations
in host market environmental institutions and regulatory contexts increases the
difficulties of uniform adoption and the chances that each subsidiary will adopt its own
environmental policy. Christmann (2004) highlights that setting global uniform standards
for MNCs' environmental performance is complicated by the fact that they operate in
varying regulative contexts, environmental infrastructures, and levels of workforce
education (Brown et al., 1993; Rappaport & Flaherty, 1992). Therefore, the greater the
diversity in the network, the greater the complexities that can hinder the deployment of
an MNC-wide uniform environmental policy needed to have global environmental
performance. Accordingly, I hypothesize:
H7: The relationship between green policy management and global
environmental performance will be negatively moderated by the degree of MNC
institutional network diversity, such that the higher the institutional network
diversity, the less positive the relationship between green policy management and
global environmental performance.
Geographic Dispersion deals with examining the impact of physical geographic distance
between subsidiaries and their parents (Markides, 1995, Ghemawat, 2001, Mauri, 2009)
37
on effective network management. As MNCs continue to expand into new markets, they
are likely to be challenged with the disadvantages of having highly physically dispersed
networks. The MNC’s competitive advantage depends to some extent on its ability to
integrate value chain activities among its subsidiaries (Porter, 1985), which requires a
large degree of coordination and communication between subsidiaries and increased
interdependencies among units (Martinez & Jarillo, 1991). Such integration efforts are
often made more difficult by greater physical distance (Ghemawat, 2001). MNCs with
distant units are more likely to incur higher information processing costs in order to
coordinate across diverse contexts and deploy a standardized environmental performance
policy. They are also likely to be more challenged by costs associated with imperfect
knowledge flows, making it more difficult to streamline operations across countries
(Carayol & Roux, 2009; Ghemawat, 2001; Markides, 1995). Furthermore, scholars have
shown an inverse relationship between geographical distance and the formation of social
ties/exchanges, which are important for all units to share the same level of commitment
to environmental policy (Bouquet & Birkinshaw, 2008; Brass, et al., 2004). Based on
this, it is likely that MNCs with highly dispersed network structures will find it more
complex/challenging to coordinate and deploy uniform policies across many distant units,
causing their environmental performance to suffer. Accordingly, I hypothesize:
H8: The relationship between green policy management and global
environmental performance will be negatively moderated by the degree of MNC
network geographic dispersion, such that the higher the geographic dispersion,
38
the less positive the relationship between green policy management and global
environmental performance.
Density is defined as the number of foreign units in the MNC network that share a parent
and are competing for resources from the same parent (Ghoshal & Bartlett, 1990; Gomes
& Ramaswamy, 1999; Miller & Eden, 2006; Pantzalis, 2001). Having many units also
translates into many challenges, not only in increasing an MNC’s liabilities of
foreignness (Zaheer, 1995; Mezias, 2002), but also the challenges in streamlining
operations and standardizing environmental best practices. In addition, the larger the
number of units in the network, the more challenging it is for the MNC to keep tabs on
the environmental footprints of each and every one of them. Schotter and Beamish (2011)
explain that subsidiary to parent conflicts are no longer regarded as “dysfunctional”
resulting from ineffective global integration, but are currently considered a “normal”
aspect of managing the MNC network. King and Shaver’s (2001) findings support that
foreign firms face difficulties in managing environment behavior in foreign countries.
Therefore, I hypothesize that overall, a larger number of foreign subsidiaries as compared
to having an MNC network with fewer subsidiaries is likely to make it more challenging
for the MNC to environmentally perform as a whole and increases the challenges of
applying uniform environmental policy. Thus:
H9: The relationship between green policy management and global
environmental performance will be negatively moderated by the degree of MNC
39
network density, such that the higher the density, the less positive the relationship
between green policy management and global environmental performance.
Figure 4 summarizes the hypotheses discussed in the previous sections
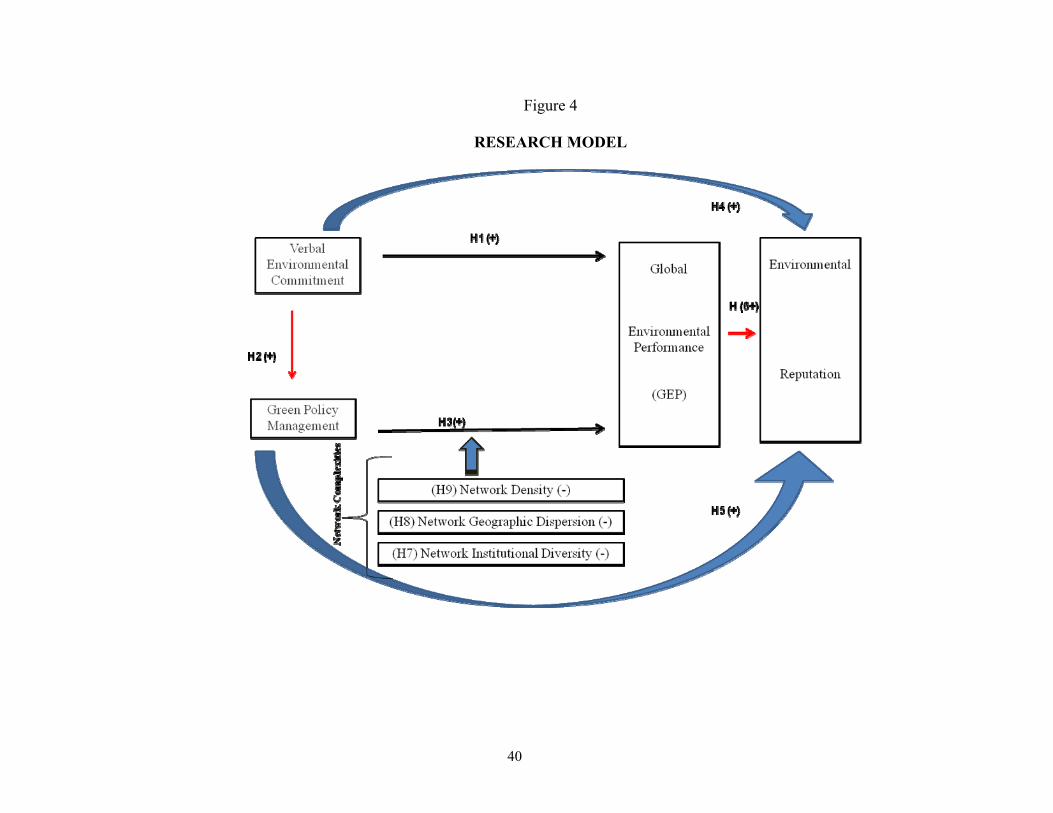
40
Figure 4
RESEARCH MODEL
41
DATA & METHODS
The sample for this study is drawn from the list of Fortune 500 US companies, which are
all rated by Newsweek Green annual Ranking. The list of 500 firms includes both service
and manufacturing firms. The study focuses on manufacturing sector firms covering SIC
codes 2000-3999, which reduces the potential sample to 184 firms. Table 1 shows the
sample split by sector for these 184 firms and the final sample. The data on their foreign
subsidiary networks is collected from the Merchant Online database of corporate
hierarchies in 2010, which reports data on public parent firms and all subsidiaries in the
hierarchy. The foreign subsidiary network data for each MNC was used to calculate the
network variables discussed below. Only subsidiaries with at least 51% ownership are
included in the analysis. When a company had multiple subsidiaries located in a foreign
country, the country was counted only once. The unit of analysis is the MNC. Only
MNCs that have a minimum of at least 2 foreign subsidiaries are included in the sample.
My sample was further reduced to 164 because 20 firms did not have at least one foreign
subsidiary. After deleting cases due to missing variables, the final analysis was conducted
on a sample of n=99 for models testing Verbal Environmental Commitment (VC) and
n=159 firms for all other models. Appendix 1 provides a list of firms in the sample.
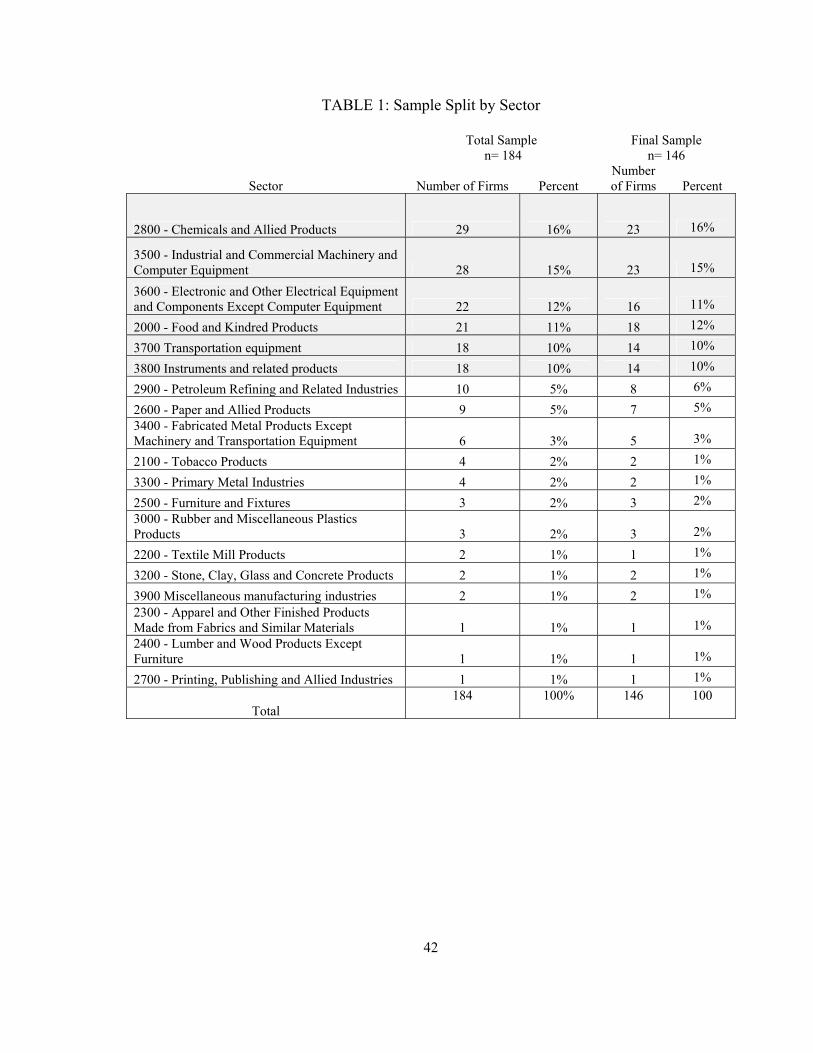
42
TABLE 1: Sample Split by Sector
Total Sample
n= 184 Final Sample
n= 146
Sector Number of Firms Percent Number of Firms Percent
2800 - Chemicals and Allied Products 29 16% 23 16%
3500 - Industrial and Commercial Machinery and Computer Equipment 28 15% 23 15%
3600 - Electronic and Other Electrical Equipment and Components Except Computer Equipment 22 12% 16 11%
2000 - Food and Kindred Products 21 11% 18 12%
3700 Transportation equipment 18 10% 14 10%
3800 Instruments and related products 18 10% 14 10%
2900 - Petroleum Refining and Related Industries 10 5% 8 6%
2600 - Paper and Allied Products 9 5% 7 5% 3400 - Fabricated Metal Products Except Machinery and Transportation Equipment 6 3% 5 3%
2100 - Tobacco Products 4 2% 2 1%
3300 - Primary Metal Industries 4 2% 2 1%
2500 - Furniture and Fixtures 3 2% 3 2% 3000 - Rubber and Miscellaneous Plastics Products 3 2% 3 2%
2200 - Textile Mill Products 2 1% 1 1%
3200 - Stone, Clay, Glass and Concrete Products 2 1% 2 1%
3900 Miscellaneous manufacturing industries 2 1% 2 1%
2300 - Apparel and Other Finished Products Made from Fabrics and Similar Materials 1 1% 1 1% 2400 - Lumber and Wood Products Except Furniture 1 1% 1 1%
2700 - Printing, Publishing and Allied Industries 1 1% 1 1%
Total 184 100% 146 100
43
Dependent Variables (DV):
Global Environmental Performance (GEP) is measured by the Environmental Impact
Score (EIS). The score is provided by Trucost (Trucost, 2010), the world's most
comprehensive data provider on corporate environmental impacts for the last 10 years (Cho,
Guidry, Hageman, & Patten, 2012; McGinn, 2009; Dawkins & Fraas, 2011). This data is a
comprehensive, quantitative, and standardized measurement made up of more than 700
metrics to assess the total environmental impacts of a corporation’s global operations (90
percent of total score) and disclosure of those impacts (10 percent of total score), including
emissions of nine key greenhouse gases, water use, solid-waste disposal, and emissions that
contribute to acid rain and smog. The score is an assessment of the company’s actual
environmental footprint. The data for each of these measures comes from publically
disclosed firm environmental data like the EPA Toxics Release Inventory. Trucost used a
“proprietary economic input-output model to calculate direct-company and supply-chain
impacts in cases where data is unavailable”
(http://www.thedailybeast.com/newsweek/2010/10/18/green-rankings-2010-full-
methodology.html). It is published on a scale from 100 (highest performing) to one (lowest
performing). The data is available for 2009, 2010, and 2011. Because the methods have
slightly changed from year to year and because the scores provided are not absolute scores
but are determined in comparison to the set of firms in the dataset of that year, accurate year
to year comparisons are challenging to achieve. For my analyses, I use the Y2010 data. For
more details on this variable, please refer to Appendix 3.
44
Environmental Corporate Reputation: CorporateRegister.com is the world’s largest online
directory of social responsibility, sustainability, and environmental reports (Maak, 2008; van
den Brink & van der Woerd, 2004). In 2010, they conducted a survey on environmental
reputation among their subscribers for Newsweek magazine’s Green Rankings of Fortune
500 firms (Guidry & Pattern, 2010; McGinn, 2009). This online survey was sent to 14,921
validated users who are professionals, academics, and other environmental experts who
subscribe to CorporateRegister.com, including CEOs of companies being rated. Respondents
were asked to rate a random sample of 15 companies on a sliding scale (100 to one) from
“leader” to “laggard” on three key green areas: environmental performance, commitment,
and communications. Each company environmental reputation score was the average of these
three components. CorporateRegister.com hosted the survey on its website for a total data
collection period of six weeks from July to August 2010 with a response rate of 12% (Green
Ranking Methodology, 2010). I used the data from the 2010 administration of this survey to
measure environmental reputation in this study, in line with prior studies that have also used
this measure of environmental reputation (e.g., Guidry & Patten, 2010; Cho, Guidry,
Hageman, & Patten, 2012). Similar to GEP, this variables is also published on a scale from
100 (highest performing) to one (lowest performing). The scores provided are not absolute
scores but are determined in comparison to the set of firms in the 2010 dataset. Newsweek
uses this same measure to calculate their annual Green Rankings Scores of US and Global
Fortune 500 firms. This variable has a normal distribution as depicted by figure 5.
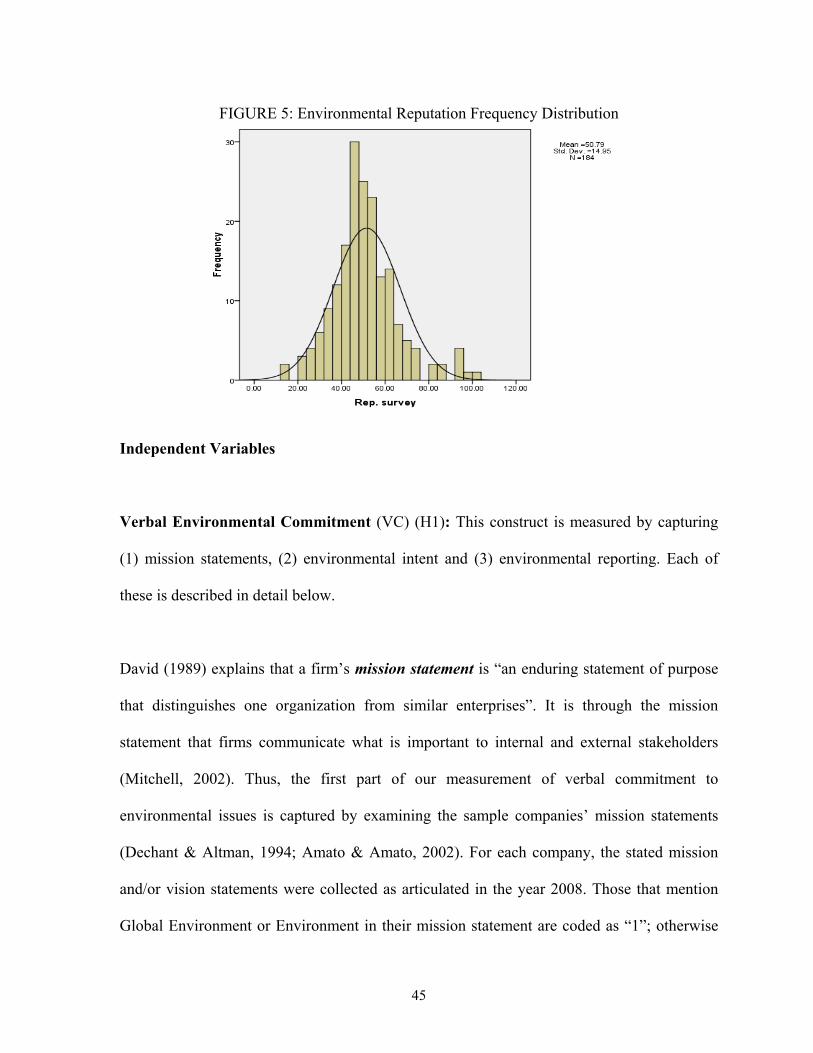
45
FIGURE 5: Environmental Reputation Frequency Distribution
Independent Variables
Verbal Environmental Commitment (VC) (H1): This construct is measured by capturing
(1) mission statements, (2) environmental intent and (3) environmental reporting. Each of
these is described in detail below.
David (1989) explains that a firm’s mission statement is “an enduring statement of purpose
that distinguishes one organization from similar enterprises”. It is through the mission
statement that firms communicate what is important to internal and external stakeholders
(Mitchell, 2002). Thus, the first part of our measurement of verbal commitment to
environmental issues is captured by examining the sample companies’ mission statements
(Dechant & Altman, 1994; Amato & Amato, 2002). For each company, the stated mission
and/or vision statements were collected as articulated in the year 2008. Those that mention
Global Environment or Environment in their mission statement are coded as “1”; otherwise
46
they are coded “0”, indicating that this company does have at least a verbal commitment
towards environmental issues. The data sources for these mission statements were found at
www.company-statements-slogans.info/index.htm (King, Case, & Premo, 2010),
www.missionstatements.com/company_mission_statements.html, as well as the companies’
main websites (Sattari, Pitt, & Caruana, 2011). To analyze the mission statements, each
statement was content analyzed for key related words and the context in which they were
used. It was important to read each statement in order to accurately get a sense of the context
in which these key words were used; therefore I did not rely only on word count. For
example, it was not enough that the word “environment” was found in the mission/vision
statement, but the researcher made sure it referred to the “natural environment” and not
“work environment”, which would not have been captured if only the existence of key words
were examined. As another example, while the word “sustainable” often refers to practices
that are in line with environmental and community development, some firms used the word
differently to refer to “sustainable sales growth”, and were therefore coded as “0”.
I started with the main sample of 184 manufacturing US Fortune 500 firms. Below are the
analysis results for 148 Fortune 500 firms' mission/vision statements (36 firms did not list
their mission statement). While previous studies focused on only top 50 or 100 Fortune 500
firms (Sattari, Pitt, & Caruana, 2011), this study is a comprehensive examination of a sample
of mission statements of 148 Fortune 500 manufacturing US firms.
From the analysis of these statements, I saw that firms can either mention the environment as
a stakeholder or mention their practices towards the environment; hence, the content key
47
word coding of “1” was marked when (1) the environment was mentioned as a stakeholder,
which was referred to when companies mentioned: Environment, planet, earth, communities
(King, Case, & Premo, 2010) and/or (2) when firm environmental compliance practices were
mentioned designated by key words like: socially responsibility, sustainability, citizenship,
business ethical conduct.
Interestingly, my results revealed the existence of three key types/groups of mission
statements. The (1) first group are those that identified the environment as a significant
stakeholder or made specific mention of environmental compliance/conscious firm
behaviors. The second (2) group of mission statements were very general using words like
“improve lives of everyone” without specifically mentioning the environment or the
communities they operate in. The third group of mission statements were those that had a
very narrow mission which focused on their core business function and maximizing
performance in that function, without necessarily mentioning a bigger goal or mission of
their firm. For the purpose of my upcoming quantitative analysis, I coded all those that would
fall under group 1 as “1”. The remaining groups 2 and 3 both received a code of “0”. Out of
148 firms that were coded in this analysis, only 43 firms received the code of 1, reflecting a
frequency of 29% of my sample.
Most of the statements focused on maximizing shareholders wealth, with 29% of my sample
mentioning responsibilities to the environment or communities they operated within.
Although one can argue that companies may also be environmentally committed even though
they do not mention this in their mission statement, chances are those that do mention these
48
words in their mission statement are likely to have a greater commitment to environmental
concerns or at least to communicating to their stakeholders that they do, regardless of
whether they act upon this consciously or not. While some firms use general statements like
“improve the lives of our customers”, these were coded with a “0”, because again, they did
not make specific reference to the environment or the communities they operate within. All
those coded with “1” mentioned the words shown above in the proper context of sustainable
business practices that reflected social responsibility and environmental committed practices.
While most mentioned key stakeholders of customers, shareholders, and investors, only those
that coded 1 reflected the environment and community as a key stakeholder whom they
specifically mentioned in their company mission statement. Others had a very narrow
mission of being the best at what they do within their industry, but again did not reflect the
companies seeing their missions in relation to the community, environment, or the planet.
Nor did these companies mention their practices in relation to this significant stakeholder.
Table 2 illustrates the sample of mission statements that can be characterized under the three
types discussed above. Appendix 2 provides a listing for all mission statements of firms in
the sample.
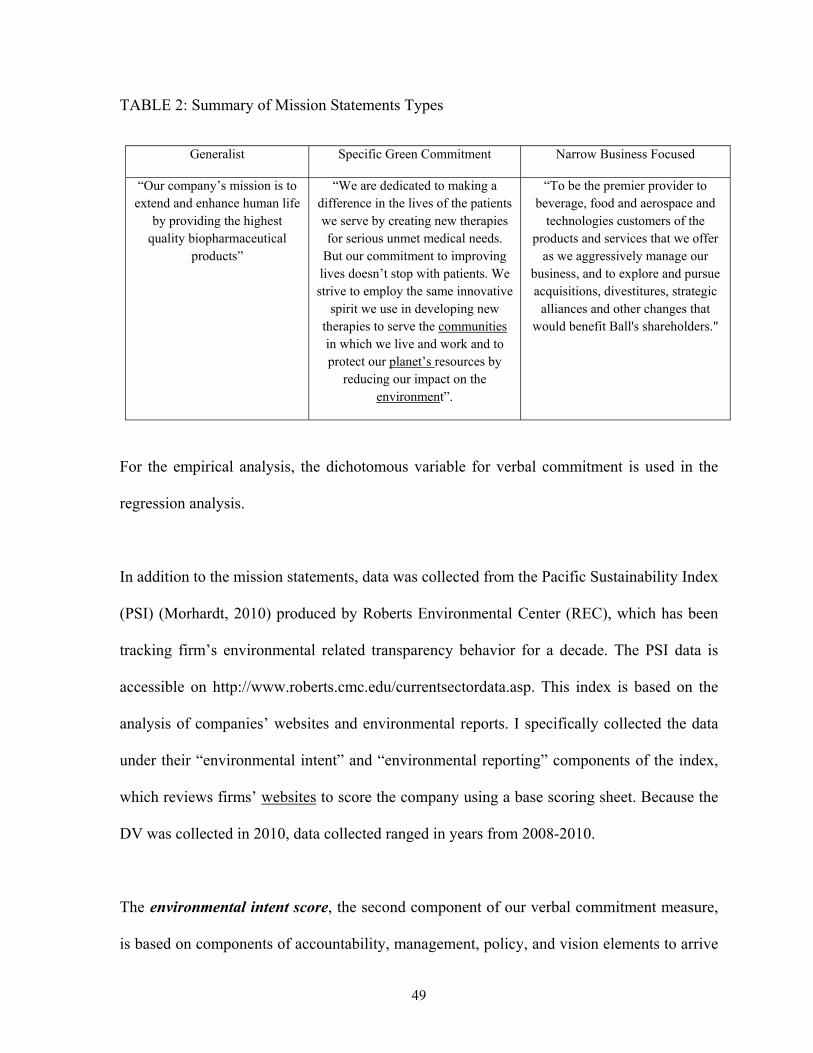
49
TABLE 2: Summary of Mission Statements Types
Generalist Specific Green Commitment Narrow Business Focused
“Our company’s mission is to extend and enhance human life
by providing the highest quality biopharmaceutical
products”
“We are dedicated to making a difference in the lives of the patients we serve by creating new therapies for serious unmet medical needs.
But our commitment to improving lives doesn’t stop with patients. We strive to employ the same innovative
spirit we use in developing new therapies to serve the communities in which we live and work and to protect our planet’s resources by
reducing our impact on the environment”.
“To be the premier provider to beverage, food and aerospace and
technologies customers of the products and services that we offer
as we aggressively manage our business, and to explore and pursue acquisitions, divestitures, strategic
alliances and other changes that would benefit Ball's shareholders."
For the empirical analysis, the dichotomous variable for verbal commitment is used in the
regression analysis.
In addition to the mission statements, data was collected from the Pacific Sustainability Index
(PSI) (Morhardt, 2010) produced by Roberts Environmental Center (REC), which has been
tracking firm’s environmental related transparency behavior for a decade. The PSI data is
accessible on http://www.roberts.cmc.edu/currentsectordata.asp. This index is based on the
analysis of companies’ websites and environmental reports. I specifically collected the data
under their “environmental intent” and “environmental reporting” components of the index,
which reviews firms’ websites to score the company using a base scoring sheet. Because the
DV was collected in 2010, data collected ranged in years from 2008-2010.
The environmental intent score, the second component of our verbal commitment measure,
is based on components of accountability, management, policy, and vision elements to arrive
50
at firms’ involvement in the general environment “whereby intent topics are each worth 2
points; 1 point for a discussion of intentions, vision, or plans, and a 1 point for evidence of
specific actions taken to implement them” (http://www.roberts.cmc.edu/). Note that the
second part of this score did not evaluate the effectiveness of these actions or whether they
were fully completed, but solely whether evidence existed that the company was
implementing their plans as a signal of potential future completion and performance. The
“environmental intent” score for each company is based on what the company scored as a
percentage of the highest scoring firm in its sector.
Environmental reporting, the third component of the verbal commitment variable, measures
the degree to which a firm actually reports environmental performance data which can be
qualitative or quantitative on their websites related to any of these key areas: emissions to air,
energy, management, material usage, products, recycling, waste and water. In REC’s
methodology report, the detailed description of how each element is scored is described as
“for quantitative topics, one point is available for a discussion, one point for putting the
information into perspective (i.e. awards, industry standards, competitor performance, etc., or
if the raw data are normalized by dividing by revenue, number of employees, number of
widgets produced, etc.), one point for the presence of an explicit numerical goal, one point
for numerical data from a single year, and one point for similar data from a previous year.
For qualitative topics, there are three criteria summed up to five points: 1.67 points for
discussion, 1.67 points for initiatives or actions, and 1.67 points for perspective”. As with the
previously described environmental intent score, this score is not meant to capture actual
environmental performance, but solely whether a firm verbally reports environmental
51
information regarding its activities (regardless of the degree to which it achieved them). It is
recognized, however, that firms may be more likely to report activities when they perform
them well, which is a potential limitation of the measure. The final “environmental
reporting” score for each company is based on what the company scored as a percentage of
the highest scoring firm in its sector.
To calculate each firm’s verbal environmental commitment, the scores for mission statement,
environmental intent, and reporting were each first standardized. Because each of these
variables is on a separate scale, it was important that they are translated to z scores. This
allows each variable to have equal weight in the analysis. To compute this variable, the three
variables were then added to make up a firm’s verbal environmental commitment.
Green Policy Management (H2) is measured by the “Green Policy Score” developed by
MSCI ESG Research, which specializes in rating companies (http://www.msci.com/about/)
on environmental, social and governance indicators. This data is provided by the same
company that offered the KLD (Kinder, Lydenberg, and Domini) Global Socrates database
over the past 20 years, except now they are called MSCI ESG as a result of the merger
between MSCI and RiskMetrics Group. The green policy score is derived from the KLD data
which has been used by a number of management scholars (Berrone & Gomez-Mejia, 2009;
Reid & Toffel, 2009; Schendler & Toffel, 2011; Dawkins & Fraas, 2010) and is described as
the “best available’’ rating tool (Waddock, 2003: 369). The score for each company provides
an “assessment of how a company manages its environmental footprint” (Green Ranking
52
Methodology, 2010). It is made up of more than 70 individual indicators which are
summarized under the following subcomponents:
• Management of Environmental Issues
• Climate Change Policies
• Pollution Policies
• Product Impact
• Environmental Stewardship
The green management policy score of each company is the weighted average of the five
sub-components and the weights are industry specific. That is, to account for industry
differences, MSCI weights each of these sub-components differently in accordance to their
industry; i.e. a mining company will have its green policy subcomponents weighted
differently than a food and beverage company.
(http://www.thedailybeast.com/newsweek/2010/10/18/green-rankings-2010-full-
methodology.html). The individual scores for these subcomponents are not publically
released by MSCI- ESG.
Some items of the Green Policy Score actually captured some level of environmental
performance related to climate and pollution components. To address the potential for
overlap with what is being captured by the GEP variable, the suspected items were all
removed by the data providers (MSCI ESG). For more details on this variable and for a
listing of the specific items removed, please refer to Appendix 3.
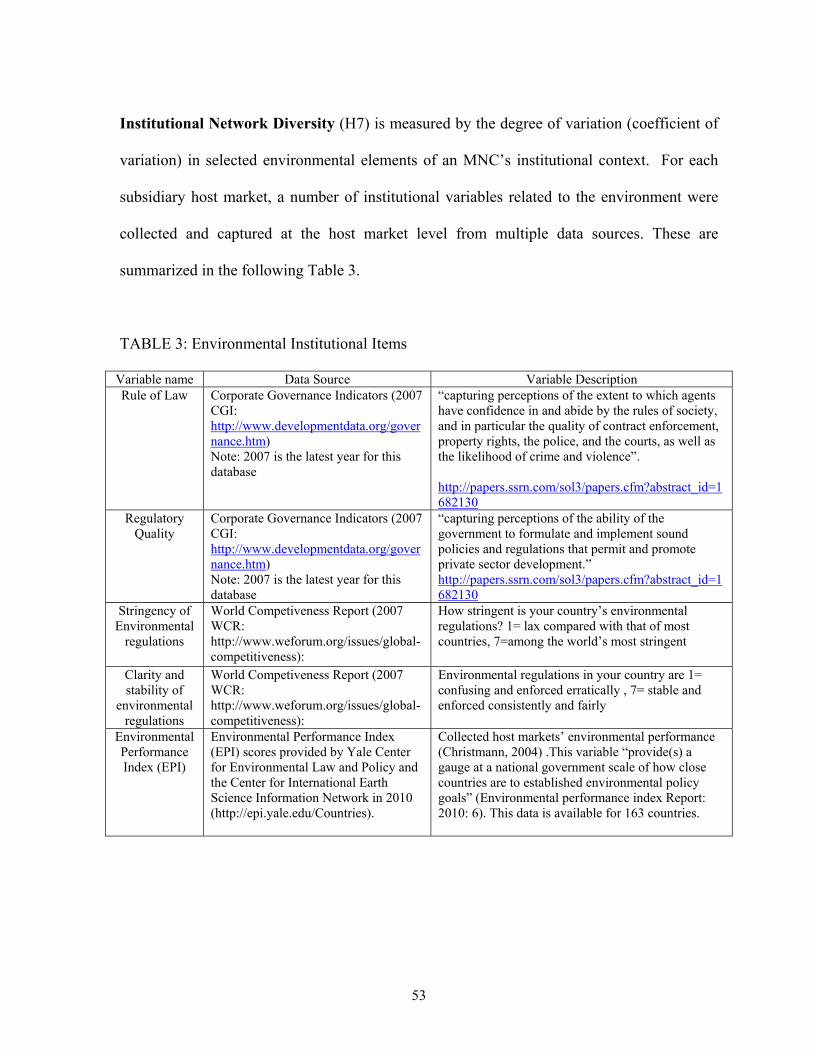
53
Institutional Network Diversity (H7) is measured by the degree of variation (coefficient of
variation) in selected environmental elements of an MNC’s institutional context. For each
subsidiary host market, a number of institutional variables related to the environment were
collected and captured at the host market level from multiple data sources. These are
summarized in the following Table 3.
TABLE 3: Environmental Institutional Items
Variable name Data Source Variable Description Rule of Law
Corporate Governance Indicators (2007 CGI: http://www.developmentdata.org/governance.htm) Note: 2007 is the latest year for this database
“capturing perceptions of the extent to which agents have confidence in and abide by the rules of society, and in particular the quality of contract enforcement, property rights, the police, and the courts, as well as the likelihood of crime and violence”. http://papers.ssrn.com/sol3/papers.cfm?abstract_id=1682130
Regulatory Quality
Corporate Governance Indicators (2007 CGI: http://www.developmentdata.org/governance.htm) Note: 2007 is the latest year for this database
“capturing perceptions of the ability of the government to formulate and implement sound policies and regulations that permit and promote private sector development.” http://papers.ssrn.com/sol3/papers.cfm?abstract_id=1682130
Stringency of Environmental
regulations
World Competiveness Report (2007 WCR: http://www.weforum.org/issues/global-competitiveness):
How stringent is your country’s environmental regulations? 1= lax compared with that of most countries, 7=among the world’s most stringent
Clarity and stability of
environmental regulations
World Competiveness Report (2007 WCR: http://www.weforum.org/issues/global-competitiveness):
Environmental regulations in your country are 1= confusing and enforced erratically , 7= stable and enforced consistently and fairly
Environmental Performance Index (EPI)
Environmental Performance Index (EPI) scores provided by Yale Center for Environmental Law and Policy and the Center for International Earth Science Information Network in 2010 (http://epi.yale.edu/Countries).
Collected host markets’ environmental performance (Christmann, 2004) .This variable “provide(s) a gauge at a national government scale of how close countries are to established environmental policy goals” (Environmental performance index Report: 2010: 6). This data is available for 163 countries.
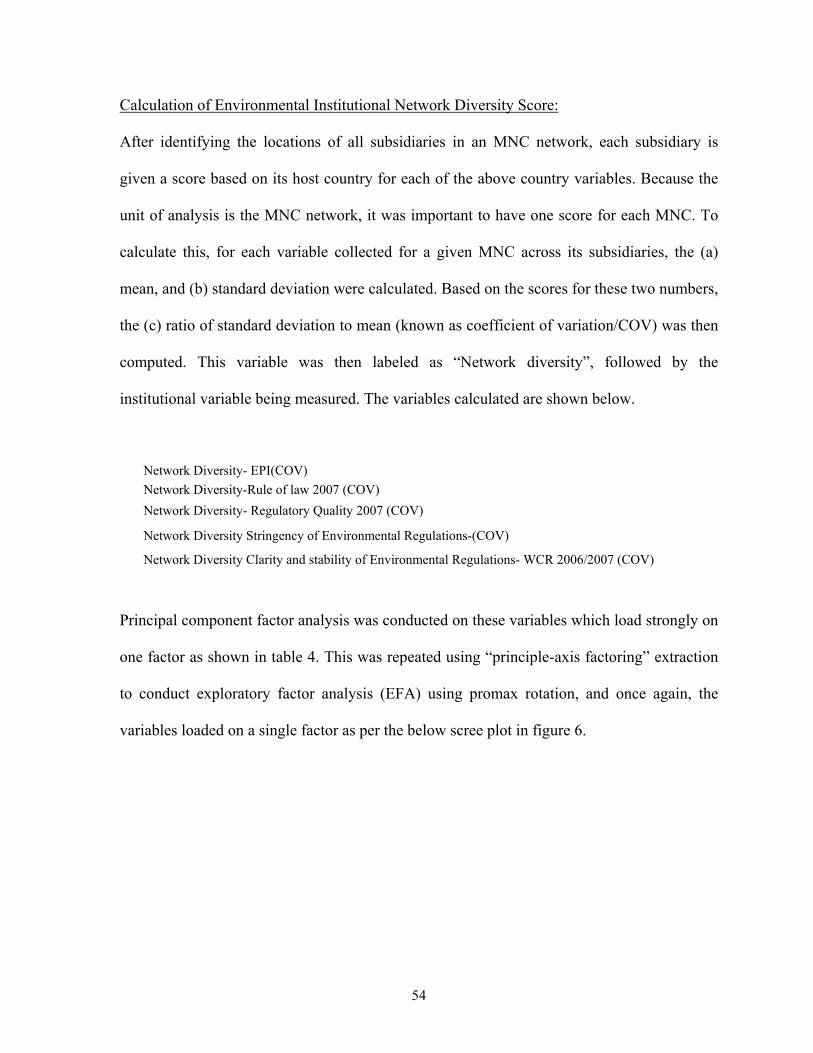
54
Calculation of Environmental Institutional Network Diversity Score:
After identifying the locations of all subsidiaries in an MNC network, each subsidiary is
given a score based on its host country for each of the above country variables. Because the
unit of analysis is the MNC network, it was important to have one score for each MNC. To
calculate this, for each variable collected for a given MNC across its subsidiaries, the (a)
mean, and (b) standard deviation were calculated. Based on the scores for these two numbers,
the (c) ratio of standard deviation to mean (known as coefficient of variation/COV) was then
computed. This variable was then labeled as “Network diversity”, followed by the
institutional variable being measured. The variables calculated are shown below.
Network Diversity- EPI(COV)
Network Diversity-Rule of law 2007 (COV)
Network Diversity- Regulatory Quality 2007 (COV)
Network Diversity Stringency of Environmental Regulations-(COV)
Network Diversity Clarity and stability of Environmental Regulations- WCR 2006/2007 (COV)
Principal component factor analysis was conducted on these variables which load strongly on
one factor as shown in table 4. This was repeated using “principle-axis factoring” extraction
to conduct exploratory factor analysis (EFA) using promax rotation, and once again, the
variables loaded on a single factor as per the below scree plot in figure 6.
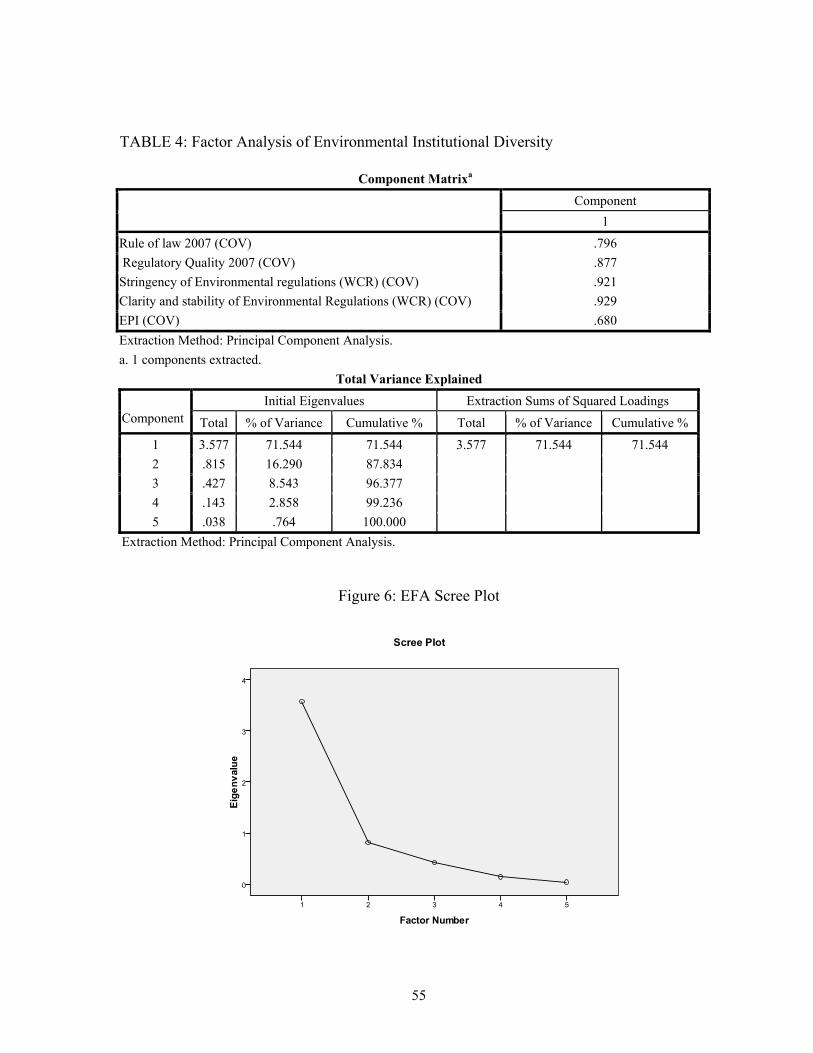
55
TABLE 4: Factor Analysis of Environmental Institutional Diversity
Component Matrixa
Component
1
Rule of law 2007 (COV) .796
Regulatory Quality 2007 (COV) .877
Stringency of Environmental regulations (WCR) (COV) .921
Clarity and stability of Environmental Regulations (WCR) (COV) .929
EPI (COV) .680
Extraction Method: Principal Component Analysis.
a. 1 components extracted.
Total Variance Explained
Initial Eigenvalues Extraction Sums of Squared Loadings Component Total % of Variance Cumulative % Total % of Variance Cumulative %
1 3.577 71.544 71.544 3.577 71.544 71.544
2 .815 16.290 87.834
3 .427 8.543 96.377
4 .143 2.858 99.236
5 .038 .764 100.000
Extraction Method: Principal Component Analysis.
Figure 6: EFA Scree Plot
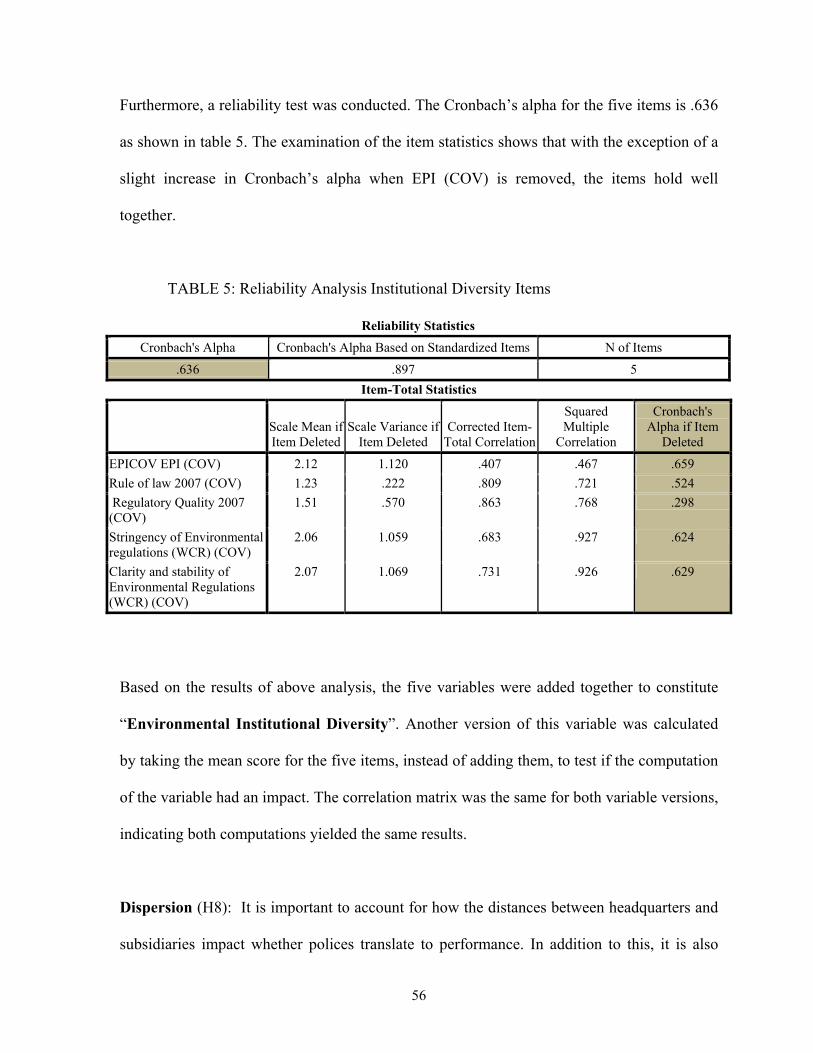
56
Furthermore, a reliability test was conducted. The Cronbach’s alpha for the five items is .636
as shown in table 5. The examination of the item statistics shows that with the exception of a
slight increase in Cronbach’s alpha when EPI (COV) is removed, the items hold well
together.
TABLE 5: Reliability Analysis Institutional Diversity Items
Reliability Statistics
Cronbach's Alpha Cronbach's Alpha Based on Standardized Items N of Items
.636 .897 5
Item-Total Statistics
Scale Mean if Item Deleted
Scale Variance if Item Deleted
Corrected Item-Total Correlation
Squared Multiple
Correlation
Cronbach's Alpha if Item
Deleted
EPICOV EPI (COV) 2.12 1.120 .407 .467 .659
Rule of law 2007 (COV) 1.23 .222 .809 .721 .524
Regulatory Quality 2007 (COV)
1.51 .570 .863 .768 .298
Stringency of Environmental regulations (WCR) (COV)
2.06 1.059 .683 .927 .624
Clarity and stability of Environmental Regulations (WCR) (COV)
2.07 1.069 .731 .926 .629
Based on the results of above analysis, the five variables were added together to constitute
“Environmental Institutional Diversity”. Another version of this variable was calculated
by taking the mean score for the five items, instead of adding them, to test if the computation
of the variable had an impact. The correlation matrix was the same for both variable versions,
indicating both computations yielded the same results.
Dispersion (H8): It is important to account for how the distances between headquarters and
subsidiaries impact whether polices translate to performance. In addition to this, it is also
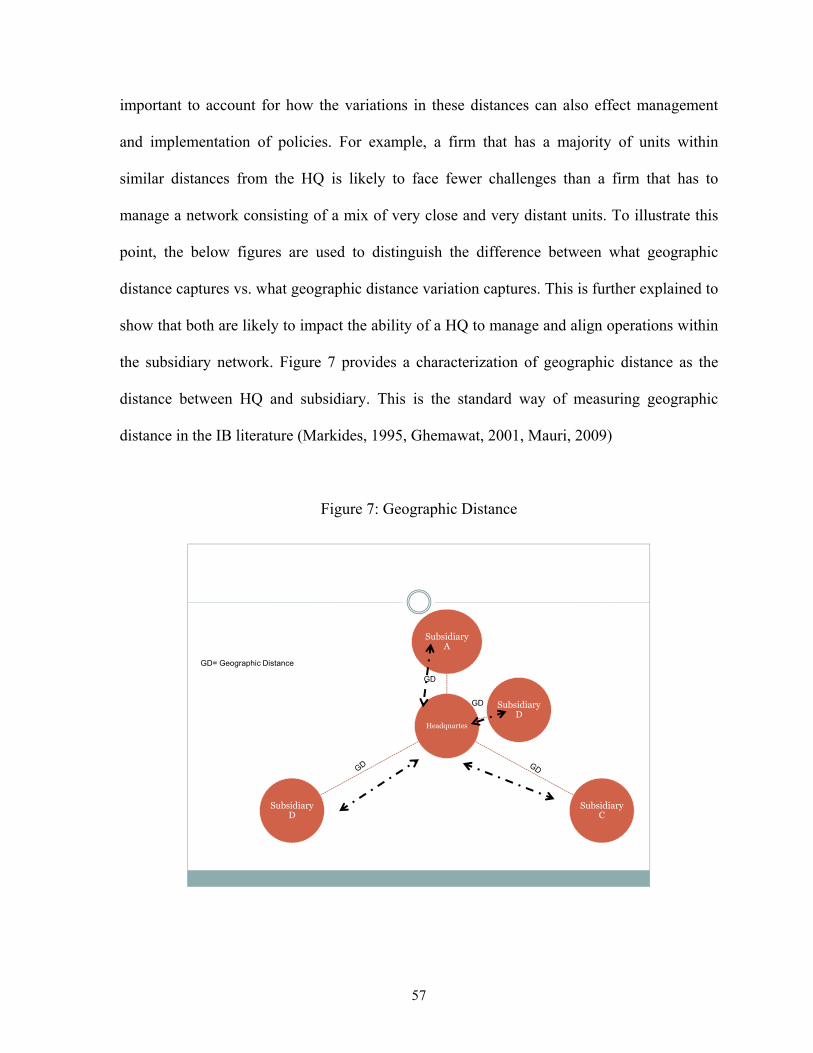
57
important to account for how the variations in these distances can also effect management
and implementation of policies. For example, a firm that has a majority of units within
similar distances from the HQ is likely to face fewer challenges than a firm that has to
manage a network consisting of a mix of very close and very distant units. To illustrate this
point, the below figures are used to distinguish the difference between what geographic
distance captures vs. what geographic distance variation captures. This is further explained to
show that both are likely to impact the ability of a HQ to manage and align operations within
the subsidiary network. Figure 7 provides a characterization of geographic distance as the
distance between HQ and subsidiary. This is the standard way of measuring geographic
distance in the IB literature (Markides, 1995, Ghemawat, 2001, Mauri, 2009)
Figure 7: Geographic Distance
Headquartes
Subsidiary A
Subsidiary D
Subsidiary C
Subsidiary D
GD= Geographic Distance
GD
GD
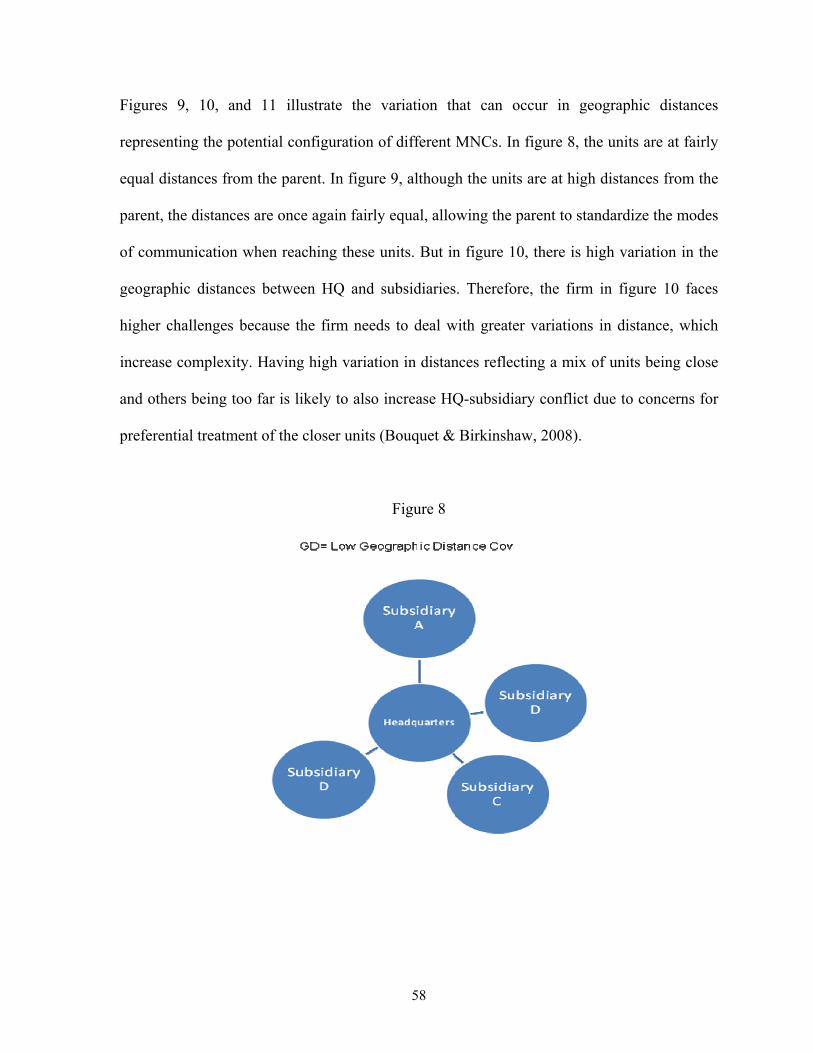
58
Figures 9, 10, and 11 illustrate the variation that can occur in geographic distances
representing the potential configuration of different MNCs. In figure 8, the units are at fairly
equal distances from the parent. In figure 9, although the units are at high distances from the
parent, the distances are once again fairly equal, allowing the parent to standardize the modes
of communication when reaching these units. But in figure 10, there is high variation in the
geographic distances between HQ and subsidiaries. Therefore, the firm in figure 10 faces
higher challenges because the firm needs to deal with greater variations in distance, which
increase complexity. Having high variation in distances reflecting a mix of units being close
and others being too far is likely to also increase HQ-subsidiary conflict due to concerns for
preferential treatment of the closer units (Bouquet & Birkinshaw, 2008).
Figure 8
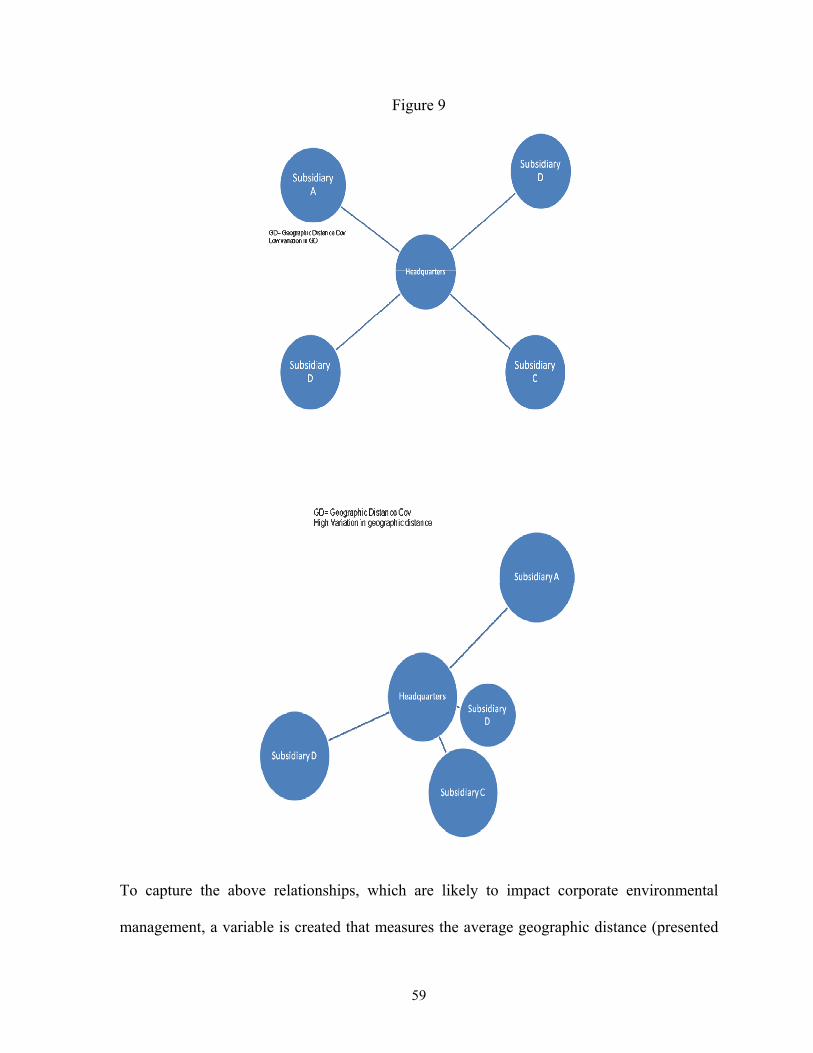
59
Figure 9
To capture the above relationships, which are likely to impact corporate environmental
management, a variable is created that measures the average geographic distance (presented
60
in figure 7) between HQ and subsidiaries weighted by the degree of geographic distance
variation (illustrated by figures 9, 10, and 11).
To calculate this variable, I first calculate the (1) average physical distance between an
MNC‘s HQ location and the location of its subsidiaries measured in kilometers (Ghemawat,
2001; Markides, 1995; Mauri, 2009). Each network is given one score based on averaging
the combination of distances. Another measure is then created which takes into account (2)
the degree of variation in the network for such distances measured by calculating the
coefficient of variation (COV) of geographic distance (COV) (mean/standard deviation).
Both of these two numbers are then standardized and are used to create the “geographic
dispersion” variable by multiplying them, arriving at a measure of geographic distance that is
weighted by degree of geographic distance variation (COV).
Density (H9) is measured by the number of foreign subsidiaries in the network which share
the same parent firm in the US. The higher the number of foreign subsidiaries an MNC has,
the greater the density of that MNC network (Tallman & Li, 1996; Tsai, 2000a, 2001b;
Varadarajan & Ramanujam, 1987). This is similar to the definition of network “breadth”
(Pantzalis, Simkins, & Laux, 2001) and that of “within density”, (Ghoshal & Bartlett, 2005).
Control Variables
It is important to control for company size, measured by the natural log of total number of
employees (2010) (Christmann, 2004; Christmann & Taylor, 2006), since size may impact
the environmental conduct of the firm (Aragon-Correa, 1998). In addition, we need to control
61
for MNC financial performance, measured by return on sales (ROS) as reported by parent
company financial statements accessed from Compustat for year 2010. Furthermore, we
control for industry sector by creating dichotomous variables for each manufacturing sector,
which was categorized by SIC codes in Table 6 below. All dummy variables were included
in the regression analysis, with Petroleum and Chemical industry firms serving as the
excluded dummy (SIC codes 2800-2900).
TABLE 6: List of Sector Dichotomous Variables
SIC 2000 and 2100 (Food / Tobacco Products)
SIC 2200 to 2500 (Textile Mill Products/Apparel/ Lumber and Wood / Furniture and Fixtures)
SIC 2600 and 2700 (Paper / Printing/Publishing )
2800 Chemicals / 2900 Petroleum Refining
SIC 3000 to 3400 ( Rubber / Stone, Clay, Glass / Primary Metal / Fabricated Metal Products
SIC 3500 (Industrial / Computer Equipment)
SIC 3600 (Electronic )
SIC 3700 (Transportation equipment)
SIC 3800 and 3900 (Instruments / Miscellaneous manufacturing industries)
The below tables 7, 7a, and 7b show a summary of GEP, Green Policy Management, and
Environmental Reputation Scores data by manufacturing sector. Preliminary data analysis
suggested that both GEP and Green Policy Management significantly vary by industry sector.
Hence, these statistics indicate that industry needs to be accounted for in the regression
analyses. On the other hand, Environmental reputation (shown in table 7b) was not found to
significantly vary by sector type.
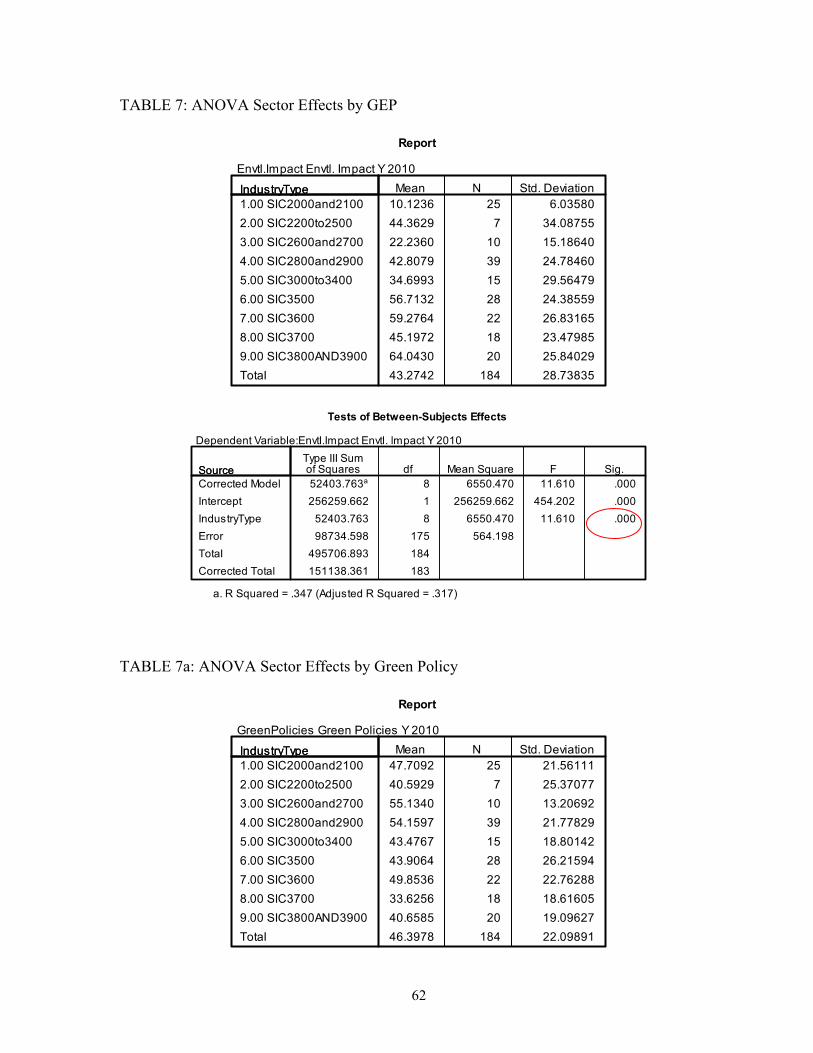
62
TABLE 7: ANOVA Sector Effects by GEP
TABLE 7a: ANOVA Sector Effects by Green Policy
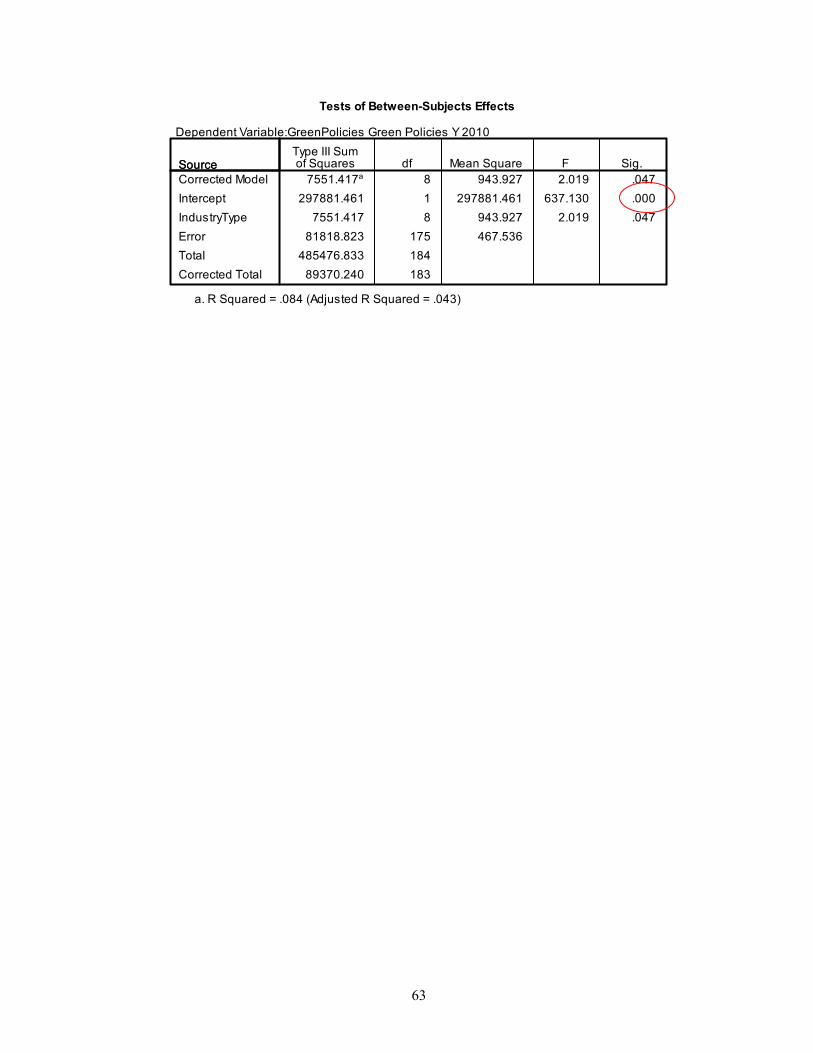
63
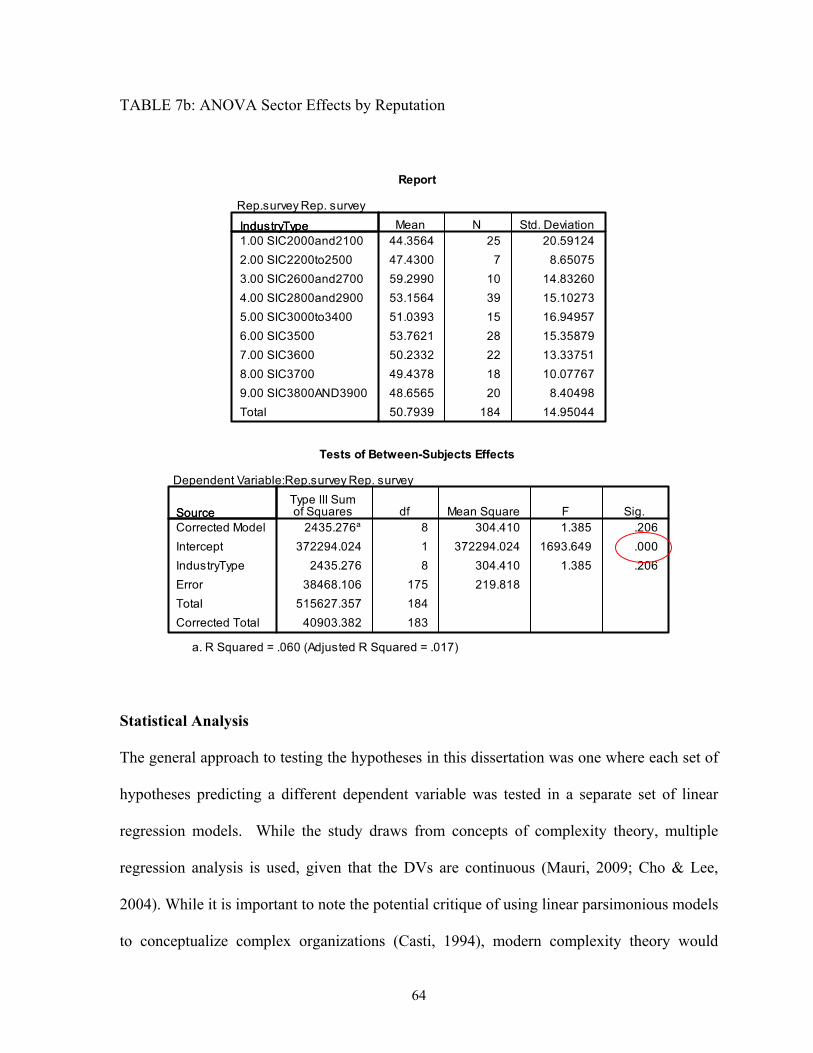
64
TABLE 7b: ANOVA Sector Effects by Reputation
Statistical Analysis
The general approach to testing the hypotheses in this dissertation was one where each set of
hypotheses predicting a different dependent variable was tested in a separate set of linear
regression models. While the study draws from concepts of complexity theory, multiple
regression analysis is used, given that the DVs are continuous (Mauri, 2009; Cho & Lee,
2004). While it is important to note the potential critique of using linear parsimonious models
to conceptualize complex organizations (Casti, 1994), modern complexity theory would
65
argue that complex systems can be reduced to simple relationships (Simon, 1996; Cohen &
Stewart, 1994), which is believed to be the task of the researcher. Anderson (1999: 217)
explains that “modern complexity theory suggests that some systems with many interactions
among highly differentiated parts can produce surprisingly simple, predictable behavior,
while others generate behavior that is impossible to forecast, though they feature simple laws
and few actors”. This study builds on scholarly works that have also used OLS regression to
analyze networks (Mauri, 2009; Cho & Lee, 2004). It is also very common for scholars to
use regression to examine interaction effects of observed variables (Jaccard & Turrisi, 2003).
Although, SEM provides insights into examining the simultaneous impact of the independent
variables on the DV, the chosen main analytical approach is more in line with the “peel the
onion” research approach and theoretical arguments of this study which sought to break the
complexity of the MNC’s CEM process into simple testable relationships.
Testing the various hypothesized relationships separately makes the assumption that the
errors across variables and equations are uncorrelated. With respect to errors associated with
data collection method, the greatest chance for correlated errors seems to occur when the
same instrument or method is used to collect both independent and dependent variables. This
is not the case here since each variable is collected from an independent data provider.
Correlated errors also may be associated with missing variables that affect multiple
dependent variables in the models. For example, if the variable Company Size had been
eliminated as a control variable, this could cause problems in interpreting the study results
since this variable has a significant impact in all of the subsequently reported dissertation
models. While Company Size was included within the dissertation models, it is recognized
66
that other variables like this may exist. Additionally, the possibility exists that errors may be
correlated due properties inherent in the variables themselves (e.g. a variable with a truncated
distribution). The possibility of correlated errors is recognized as a limitation of the study.
To minimize multicollinearity, the direct effects variables were standardized and centered
prior to creating the moderating effects (Aiken & West, 1991). Collinearity diagnostics were
conducted and variance inflation factors (VIFs) examined to determine if multicollinearity is
a concern (Netter, Wasserman & Kutner, 1996). With the exception of one model regression
in model 4 and model 5 in table 10a, all VIFs were below 2. The moderating variables
created aimed to examine if network features (density, dispersion, and diversity) moderated
the relationship between environmental management and GEP. The names of these created
moderating variables are shown below.
Green Policy Management X Density Green Policy Management X Geographic Dispersion Green Policy Management X “Environmental Institutional Diversity”.
Within Post Hoc analyses, Hierarchal Cluster Analysis was also used to classify firms
considering their GEP, green policy management, network dimensions (density, geographic
distance, and environmental institutional score). Analysis was performed using the Ward’s
approach, where the squared Euclidean distances are used to form clusters (Hair & Black,
2000; Saunders, 1993). The variables were standardized to form z- scores.
67
RESULTS
Table 8 shows the descriptive statistics including the ranges and standard deviations for each
of the variables. Table 9 shows the correlations for the main effect variables. The highest
correlation found was .46 between firm size (employees) and network density (number of
foreign subsidiaries), which is likely to raise concerns for multicollinearity when testing
interaction effects. Due to this, variance inflation factors (VIFs) were examined for each
model, as noted earlier, and potential issues are detailed below when applicable.
Environmental Verbal Commitment: Hypotheses 1 argued that there is a positive
relationship between Verbal Commitment (VC) and GEP. The regression results shown in
model 2 of Table 10 support hypothesis 1 (p<.05). This indicates that environmental verbal
commitment does significantly predict GEP when sector type, firm performance and size are
controlled. However when both Green Policy Management and Verbal Commitment are
incorporated in the model, only Green Policy Management had a significant positive
relationship with GEP.
Hypothesis 2 predicted that Verbal Commitment would predict firm Green Policy
Management. The results shown in table 11 support this hypothesis (p<.01).
Green Policy Management: Hypothesis 3 predicted a positive relationship between firms’
Green Policy Management and Global Environmental Performance. This relationship tested
in model 2 of Table 10 was found to be positive and significant (p<.001). Therefore, H3 is
68
supported with the model having an adjusted R-Square of .481 with a significant R-Square
change.
Environmental Reputation: Table 12 shows the regression results predicting
Environmental Reputation. Hypothesis 4 (tested in model 2) predicted a positive relationship
between VC and Environmental Reputation, arguing that firms use mission statements to
signal to investors and other stakeholder groups what they stand for or plan to do. This
hypothesis is supported (p<.05). Therefore, firms’ VC did predict their environmental
reputation.
H5 predicted a positive relationship between Green Policy Management and Environmental
Reputation. This hypothesis shown in model 3 of table 12 was supported (p<.001). The
model has a significant adjusted R-Square of .353 and a significant R-Square change
(p<.001). H6 predicted that GEP would have a positive relationship with Environmental
Reputation. This relationship as shown in table 12, model 4 is supported (p<.001) with a
significant adjusted R-Square of .169 and a significant R-Square change.
Model 5 tests the three variables (VC, GEP and Green Policy Management) together in
predicting Environmental Reputation. In this complete model, only the Green Policy
Management variable was found to be significant (p<.01). While GEP and VC were not
found significant in the complete model, the model still was significant with an adjusted R-
Square of .409 (p<.001) and a significant R-Square change.
69
Network Moderation Effects: Table 10a shows the regression results for the network
interaction effects. H7 argued that Environmental Institutional Diversity would negatively
moderate the relationship between Green Management and GEP. While the relationship was
found to be negative as shown in model 3, and in the expected direction, no statistical
significance was found. The highest VIF reported was for the interaction term (VIF= 1.5).
Therefore, H7 was not supported.
H8 predicted that Geographic Dispersion would negatively moderate the Green Management
to GEP relationship. It was also not supported in model 3 of table 10a. The highest VIF
reported was for the interaction term (VIF= 1.5).
H9 predicted that Network Density would negatively moderate the relationship between
Green Management and GEP. Although the relationship is negative as expected, it is also not
significant in model 4 of table 10a. The VIF factor for the interaction term is 14.411, which is
above the allowable cut off of 10 (Neter, Wasserman & Kutner, 1989). This was expected
given the high correlation between Firm Size and Density.
Model 5 of table 10a tested all the interaction terms in the same model. The highest reported
VIF factor in this complete model was for Network Density (VIF=10. 965) and for the
density network moderation variable (VIF=16.661); all others were below 10 (Neter,
Wasserman & Kutner, 1989). Only the main effect of Green Policy Management was found
to be significant in that model (p<.001). While the individual interaction effects were found

70
not significant, the model itself had an adjusted R–square of .426 with a significant R-square
change (p<.001).
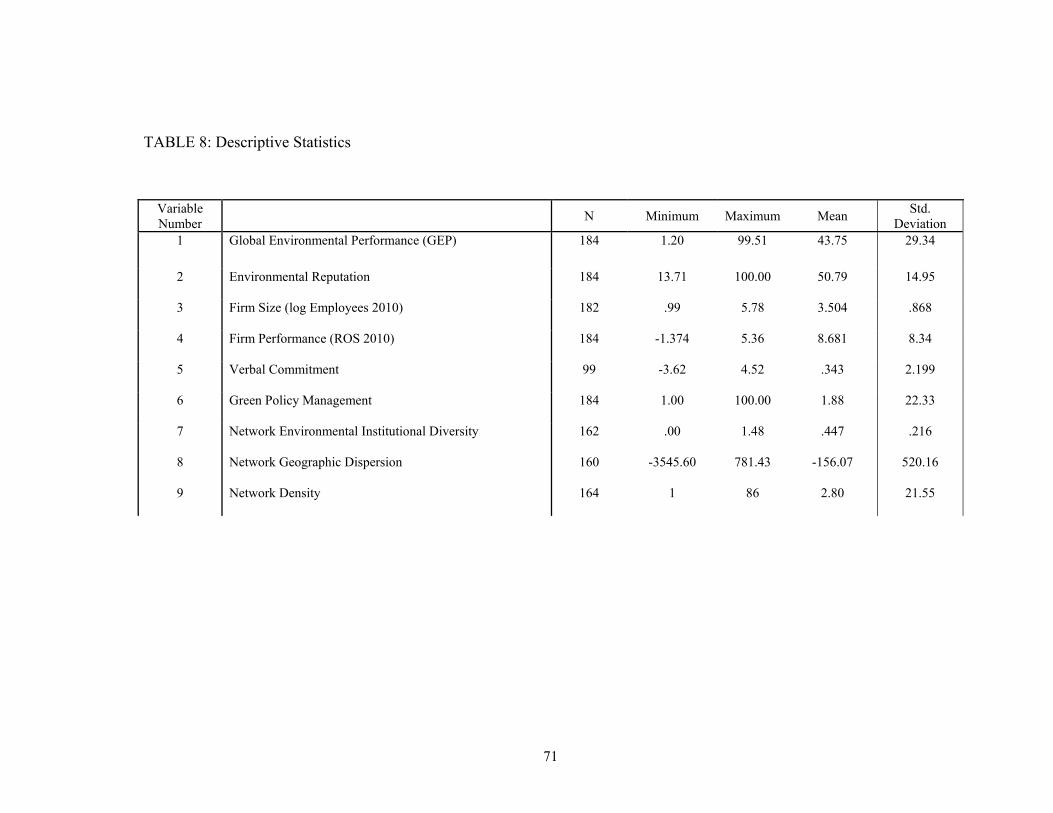
71
TABLE 8: Descriptive Statistics
Variable Number
N Minimum Maximum Mean Std.
Deviation 1 Global Environmental Performance (GEP) 184 1.20 99.51 43.75 29.34
2 Environmental Reputation 184 13.71 100.00 50.79 14.95
3 Firm Size (log Employees 2010) 182 .99 5.78 3.504 .868
4 Firm Performance (ROS 2010) 184 -1.374 5.36 8.681 8.34
5 Verbal Commitment 99 -3.62 4.52 .343 2.199
6 Green Policy Management 184 1.00 100.00 1.88 22.33
7 Network Environmental Institutional Diversity 162 .00 1.48 .447 .216
8 Network Geographic Dispersion 160 -3545.60 781.43 -156.07 520.16
9 Network Density 164 1 86 2.80 21.55
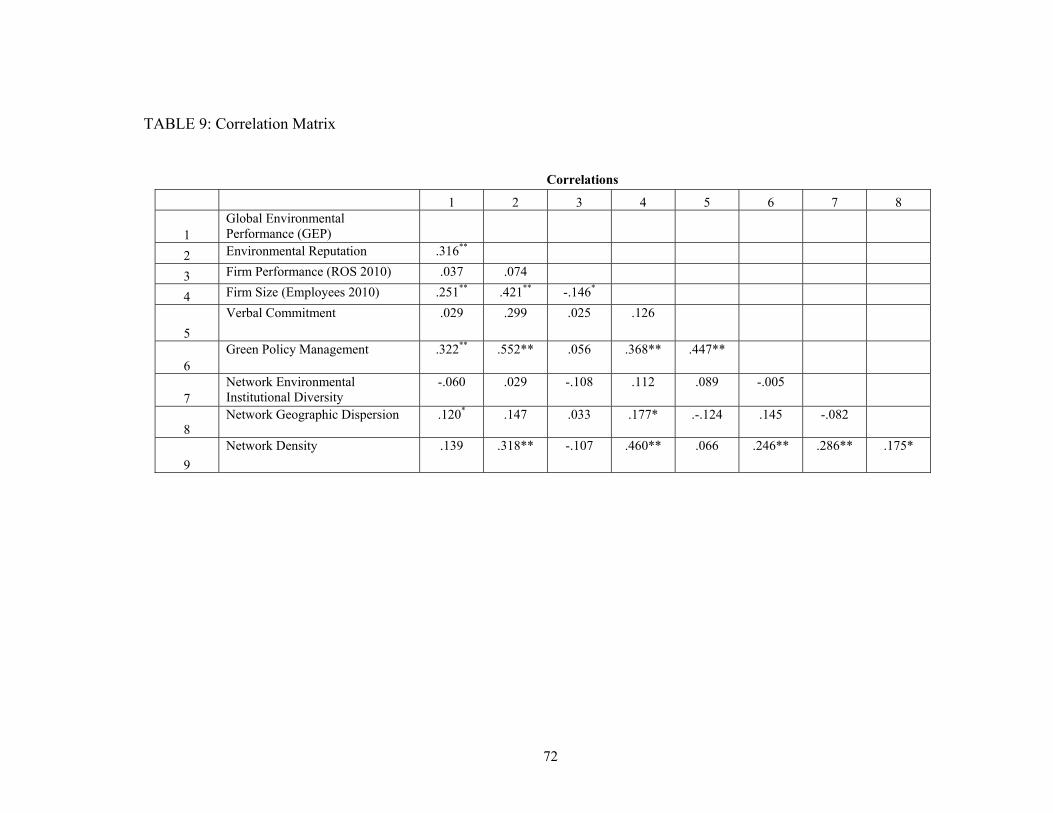
72
TABLE 9: Correlation Matrix
Correlations
1 2 3 4 5 6 7 8
1 Global Environmental Performance (GEP)
2 Environmental Reputation .316**
3 Firm Performance (ROS 2010) .037 .074
4 Firm Size (Employees 2010) .251** .421** -.146*
5
Verbal Commitment .029 .299 .025 .126
6 Green Policy Management .322** .552** .056 .368** .447**
7 Network Environmental Institutional Diversity
-.060 .029 -.108 .112 .089 -.005
8 Network Geographic Dispersion .120* .147 .033 .177* .-.124 .145 -.082
9
Network Density .139 .318** -.107 .460** .066 .246** .286** .175*
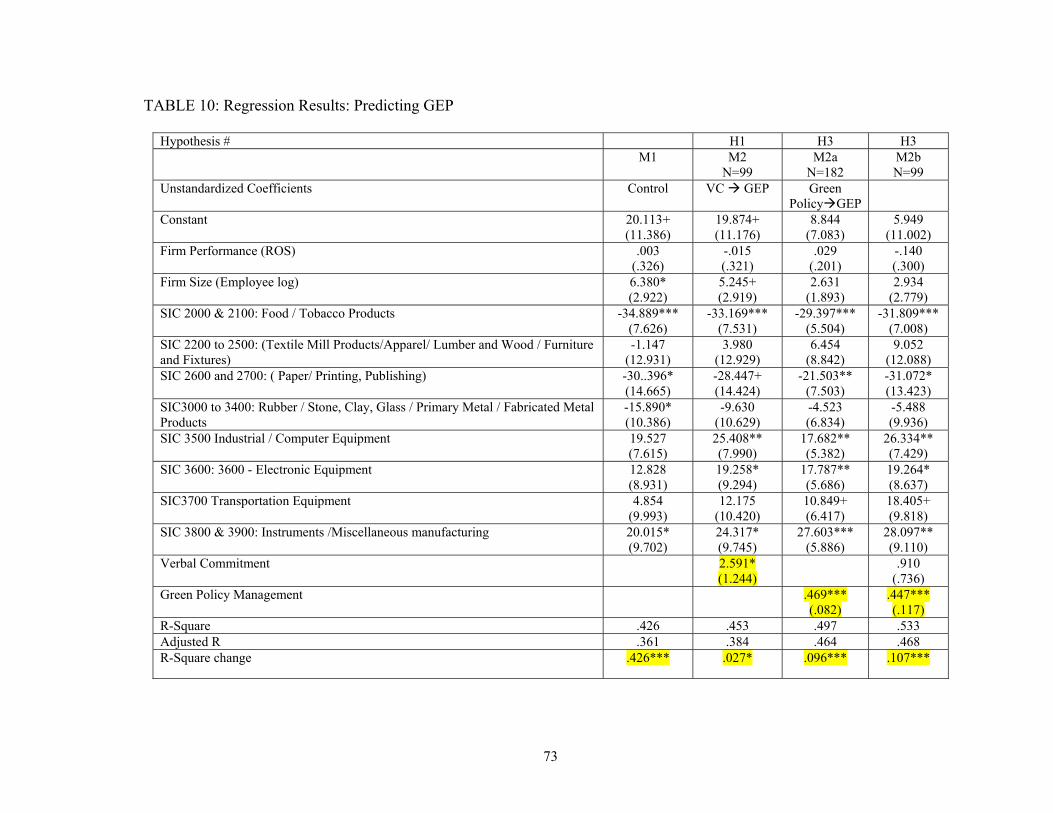
73
TABLE 10: Regression Results: Predicting GEP
Hypothesis # H1 H3 H3 M1 M2
N=99 M2a
N=182 M2b N=99
Unstandardized Coefficients Control VC GEP Green PolicyGEP
Constant 20.113+ (11.386)
19.874+ (11.176)
8.844 (7.083)
5.949 (11.002)
Firm Performance (ROS) .003 (.326)
-.015 (.321)
.029 (.201)
-.140 (.300)
Firm Size (Employee log) 6.380* (2.922)
5.245+ (2.919)
2.631 (1.893)
2.934 (2.779)
SIC 2000 & 2100: Food / Tobacco Products -34.889*** (7.626)
-33.169*** (7.531)
-29.397*** (5.504)
-31.809*** (7.008)
SIC 2200 to 2500: (Textile Mill Products/Apparel/ Lumber and Wood / Furniture and Fixtures)
-1.147 (12.931)
3.980 (12.929)
6.454 (8.842)
9.052 (12.088)
SIC 2600 and 2700: ( Paper/ Printing, Publishing) -30..396* (14.665)
-28.447+ (14.424)
-21.503** (7.503)
-31.072* (13.423)
SIC3000 to 3400: Rubber / Stone, Clay, Glass / Primary Metal / Fabricated Metal Products
-15.890* (10.386)
-9.630 (10.629)
-4.523 (6.834)
-5.488 (9.936)
SIC 3500 Industrial / Computer Equipment 19.527 (7.615)
25.408** (7.990)
17.682** (5.382)
26.334** (7.429)
SIC 3600: 3600 - Electronic Equipment 12.828 (8.931)
19.258* (9.294)
17.787** (5.686)
19.264* (8.637)
SIC3700 Transportation Equipment 4.854 (9.993)
12.175 (10.420)
10.849+ (6.417)
18.405+ (9.818)
SIC 3800 & 3900: Instruments /Miscellaneous manufacturing 20.015* (9.702)
24.317* (9.745)
27.603*** (5.886)
28.097** (9.110)
Verbal Commitment 2.591* (1.244)
.910 (.736)
Green Policy Management .469*** (.082)
.447*** (.117)
R-Square .426 .453 .497 .533 Adjusted R .361 .384 .464 .468 R-Square change .426*** .027* .096*** .107***
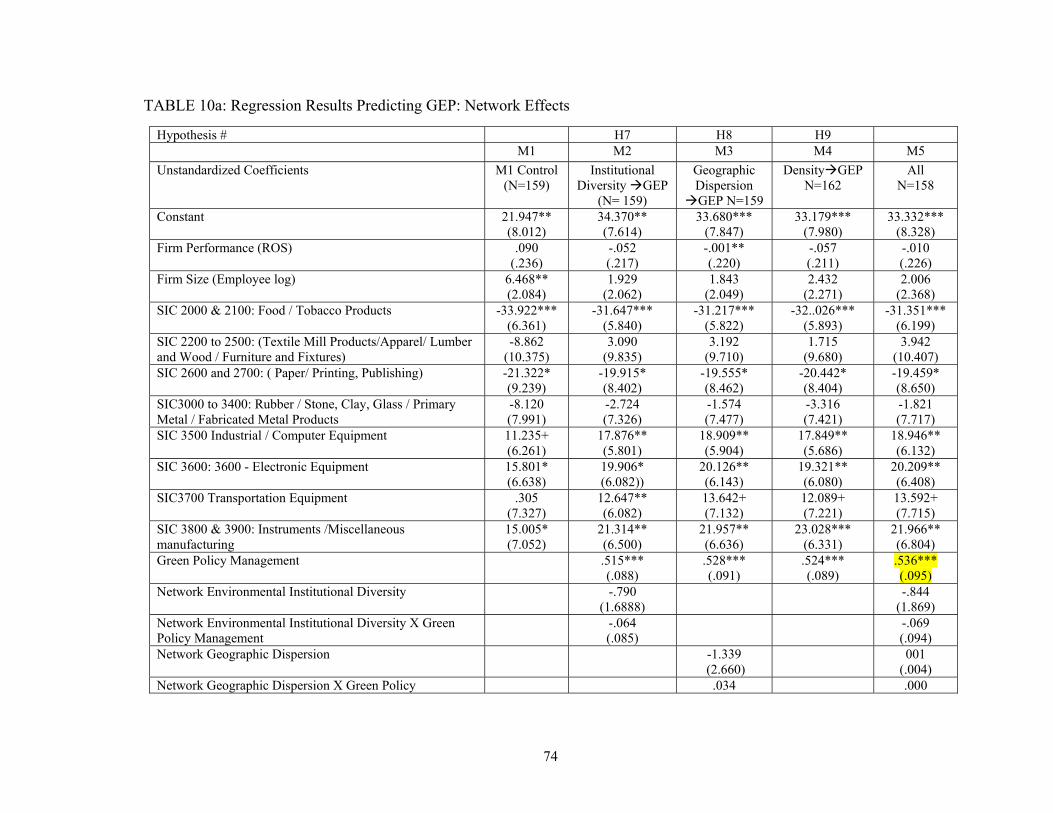
74
TABLE 10a: Regression Results Predicting GEP: Network Effects
Hypothesis # H7 H8 H9 M1 M2 M3 M4 M5
Unstandardized Coefficients M1 Control (N=159)
Institutional Diversity GEP
(N= 159)
Geographic Dispersion GEP N=159
DensityGEP N=162
All N=158
Constant 21.947** (8.012)
34.370** (7.614)
33.680*** (7.847)
33.179*** (7.980)
33.332*** (8.328)
Firm Performance (ROS) .090 (.236)
-.052 (.217)
-.001** (.220)
-.057 (.211)
-.010 (.226)
Firm Size (Employee log) 6.468** (2.084)
1.929 (2.062)
1.843 (2.049)
2.432 (2.271)
2.006 (2.368)
SIC 2000 & 2100: Food / Tobacco Products -33.922*** (6.361)
-31.647*** (5.840)
-31.217*** (5.822)
-32..026*** (5.893)
-31.351*** (6.199)
SIC 2200 to 2500: (Textile Mill Products/Apparel/ Lumber and Wood / Furniture and Fixtures)
-8.862 (10.375)
3.090 (9.835)
3.192 (9.710)
1.715 (9.680)
3.942 (10.407)
SIC 2600 and 2700: ( Paper/ Printing, Publishing) -21.322* (9.239)
-19.915* (8.402)
-19.555* (8.462)
-20.442* (8.404)
-19.459* (8.650)
SIC3000 to 3400: Rubber / Stone, Clay, Glass / Primary Metal / Fabricated Metal Products
-8.120 (7.991)
-2.724 (7.326)
-1.574 (7.477)
-3.316 (7.421)
-1.821 (7.717)
SIC 3500 Industrial / Computer Equipment 11.235+ (6.261)
17.876** (5.801)
18.909** (5.904)
17.849** (5.686)
18.946** (6.132)
SIC 3600: 3600 - Electronic Equipment 15.801* (6.638)
19.906* (6.082))
20.126** (6.143)
19.321** (6.080)
20.209** (6.408)
SIC3700 Transportation Equipment .305 (7.327)
12.647** (6.082)
13.642+ (7.132)
12.089+ (7.221)
13.592+ (7.715)
SIC 3800 & 3900: Instruments /Miscellaneous manufacturing
15.005* (7.052)
21.314** (6.500)
21.957** (6.636)
23.028*** (6.331)
21.966** (6.804)
Green Policy Management .515*** (.088)
.528*** (.091)
.524*** (.089)
.536*** (.095)
Network Environmental Institutional Diversity -.790 (1.6888)
-.844 (1.869)
Network Environmental Institutional Diversity X Green Policy Management
-.064 (.085)
-.069 (.094)
Network Geographic Dispersion -1.339 (2.660)
001 (.004)
Network Geographic Dispersion X Green Policy .034 .000
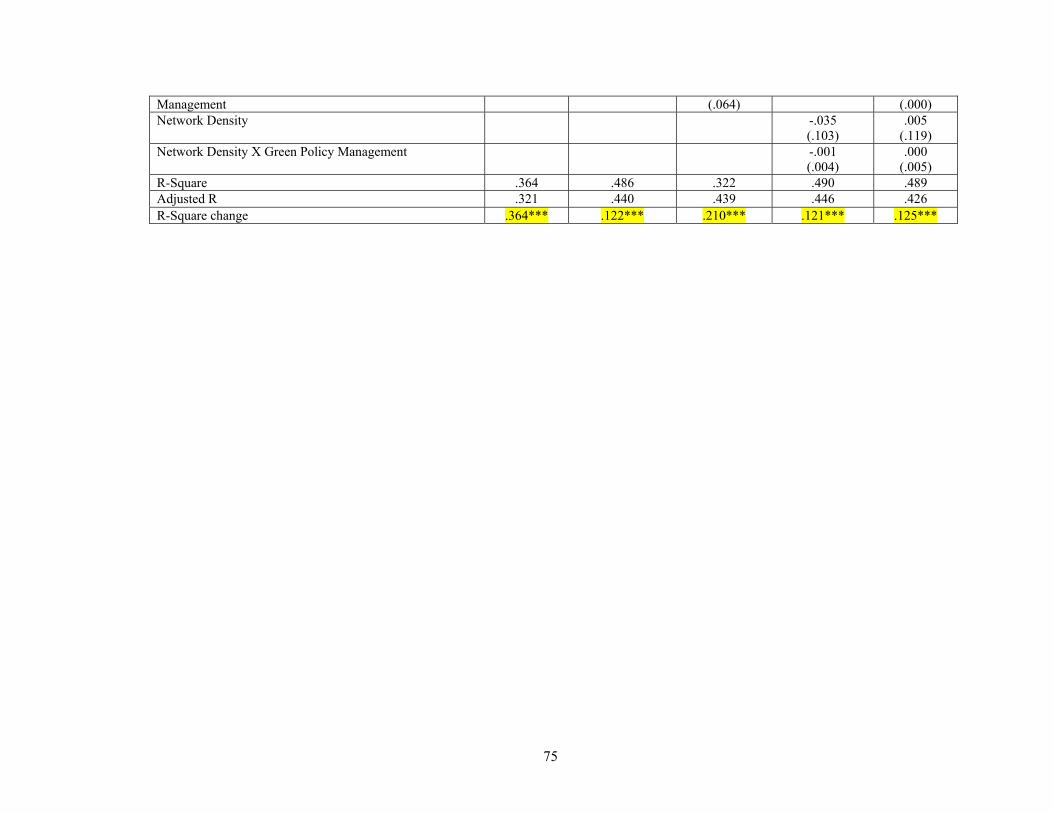
75
Management (.064) (.000) Network Density -.035
(.103) .005
(.119) Network Density X Green Policy Management -.001
(.004) .000
(.005) R-Square .364 .486 .322 .490 .489 Adjusted R .321 .440 .439 .446 .426 R-Square change .364*** .122*** .210*** .121*** .125***
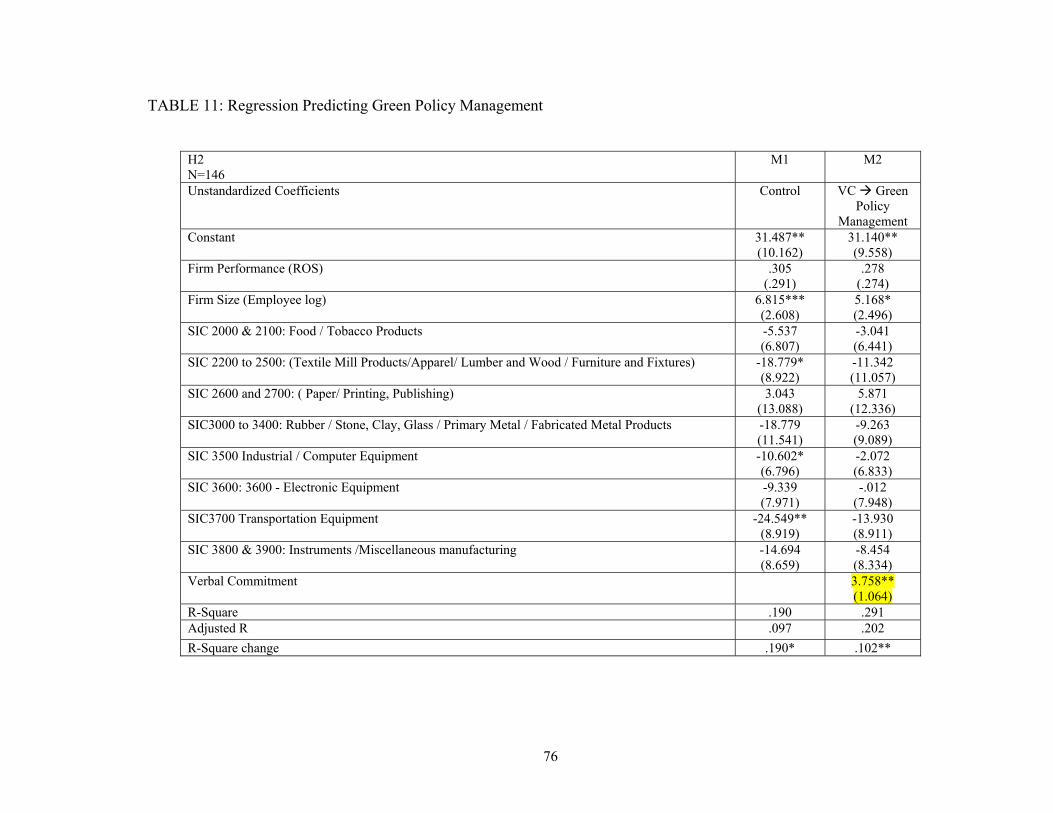
76
TABLE 11: Regression Predicting Green Policy Management
H2 N=146
M1 M2
Unstandardized Coefficients Control VC Green Policy
Management Constant 31.487**
(10.162) 31.140** (9.558)
Firm Performance (ROS) .305 (.291)
.278 (.274)
Firm Size (Employee log) 6.815*** (2.608)
5.168* (2.496)
SIC 2000 & 2100: Food / Tobacco Products -5.537 (6.807)
-3.041 (6.441)
SIC 2200 to 2500: (Textile Mill Products/Apparel/ Lumber and Wood / Furniture and Fixtures) -18.779* (8.922)
-11.342 (11.057)
SIC 2600 and 2700: ( Paper/ Printing, Publishing) 3.043 (13.088)
5.871 (12.336)
SIC3000 to 3400: Rubber / Stone, Clay, Glass / Primary Metal / Fabricated Metal Products -18.779 (11.541)
-9.263 (9.089)
SIC 3500 Industrial / Computer Equipment -10.602* (6.796)
-2.072 (6.833)
SIC 3600: 3600 - Electronic Equipment -9.339 (7.971)
-.012 (7.948)
SIC3700 Transportation Equipment -24.549** (8.919)
-13.930 (8.911)
SIC 3800 & 3900: Instruments /Miscellaneous manufacturing -14.694 (8.659)
-8.454 (8.334)
Verbal Commitment 3.758** (1.064)
R-Square .190 .291 Adjusted R .097 .202
R-Square change .190* .102**
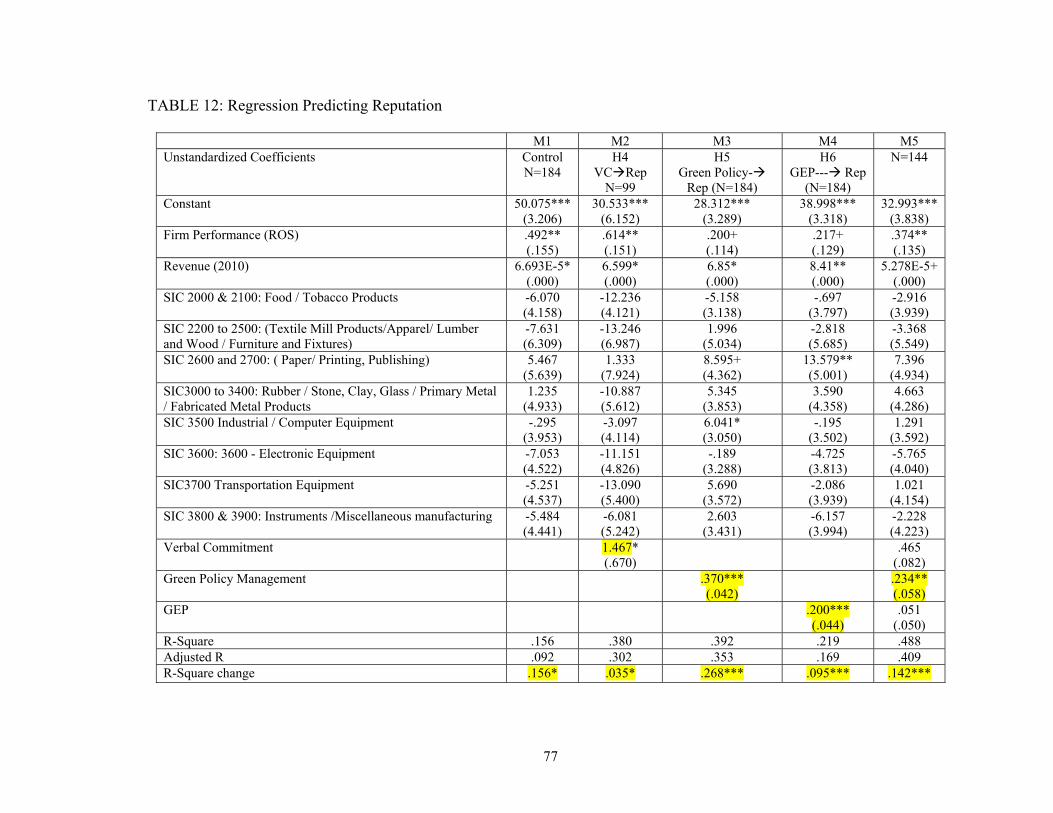
77
TABLE 12: Regression Predicting Reputation
M1 M2 M3 M4 M5 Unstandardized Coefficients Control
N=184 H4
VCRep N=99
H5 Green Policy-
Rep (N=184)
H6 GEP--- Rep
(N=184)
N=144
Constant 50.075*** (3.206)
30.533*** (6.152)
28.312*** (3.289)
38.998*** (3.318)
32.993*** (3.838)
Firm Performance (ROS) .492** (.155)
.614** (.151)
.200+ (.114)
.217+ (.129)
.374** (.135)
Revenue (2010) 6.693E-5* (.000)
6.599* (.000)
6.85* (.000)
8.41** (.000)
5.278E-5+ (.000)
SIC 2000 & 2100: Food / Tobacco Products -6.070 (4.158)
-12.236 (4.121)
-5.158 (3.138)
-.697 (3.797)
-2.916 (3.939)
SIC 2200 to 2500: (Textile Mill Products/Apparel/ Lumber and Wood / Furniture and Fixtures)
-7.631 (6.309)
-13.246 (6.987)
1.996 (5.034)
-2.818 (5.685)
-3.368 (5.549)
SIC 2600 and 2700: ( Paper/ Printing, Publishing) 5.467 (5.639)
1.333 (7.924)
8.595+ (4.362)
13.579** (5.001)
7.396 (4.934)
SIC3000 to 3400: Rubber / Stone, Clay, Glass / Primary Metal / Fabricated Metal Products
1.235 (4.933)
-10.887 (5.612)
5.345 (3.853)
3.590 (4.358)
4.663 (4.286)
SIC 3500 Industrial / Computer Equipment -.295 (3.953)
-3.097 (4.114)
6.041* (3.050)
-.195 (3.502)
1.291 (3.592)
SIC 3600: 3600 - Electronic Equipment -7.053 (4.522)
-11.151 (4.826)
-.189 (3.288)
-4.725 (3.813)
-5.765 (4.040)
SIC3700 Transportation Equipment -5.251 (4.537)
-13.090 (5.400)
5.690 (3.572)
-2.086 (3.939)
1.021 (4.154)
SIC 3800 & 3900: Instruments /Miscellaneous manufacturing -5.484 (4.441)
-6.081 (5.242)
2.603 (3.431)
-6.157 (3.994)
-2.228 (4.223)
Verbal Commitment 1.467* (.670)
.465 (.082)
Green Policy Management .370*** (.042)
.234** (.058)
GEP .200*** (.044)
.051 (.050)
R-Square .156 .380 .392 .219 .488 Adjusted R .092 .302 .353 .169 .409 R-Square change .156* .035* .268*** .095*** .142***
78
RQ #1: Discussion and Contributions
The results from this comprehensive examination revealed that firms’ verbal commitment
did predict firm environmental performance and their green policy management. This
relationship supports the literature explaining that what firms articulate in their
mission/vision statements and websites is indicative of the internal policies that guide
operations and the actions they actually perform (Bartkus & Glassman, 2008; Hart, 1995;
Onkila, 2009). Building on the control literature (Harzing, 1999; Geringer & Hebert, 1989;
Ambos & Schlegelmilch, 2007: 475), verbal commitment as a reflection of the firm’s shared
values which is an informal control mechanism and Green Policy Management as a
mechanism of formalized control predicted GEP. Therefore, the results show that both forms
of controls are effective in increasing environmental performance. However, when both were
included in the model, only Green Policy Management had a significant positive
relationship. Interestingly, the findings also support that firms that expressed verbal
commitment to the environment also had higher environmental reputation than others which
did not. These findings are supported by signaling theory (Myers & Majluf, 1984; Behrend
Baker, & Thompson, 2009), which explains that mission statements and reports will serve as
signals of firms’ actions. Green Policy Management was found to be a stable and significant
variable in predicting GEP and environmental reputation. This finding is supported by the
literature arguing that MNCs are increasingly implementing more internally driven self-
regulation environmental policies (Brown, Derr, Renn, & White, 1993; Dowell, Hart, &
Yeung, 2000) to guide their behavior. For these firms, effectiveness in managing their green
policies is likely to be the driver for developing green competencies and a source of
79
competitive advantage. Therefore, when differentiating between firms’ environmental
consciousness, scholars should investigate more internal environmental firm policies,
because they are likely to be more indicative of their actions. Future studies can and should
examine in more detail this construct, focusing on the challenges that can arise from the
actual process of implementation of green policies, while taking into account the variations at
the subsidiary level that can have an impact. Environmental reputation was found to be
driven by verbal environmental commitment, green policy management and GEP, which
indicates the importance for firms to properly use these factors to send the correct signals to
investors and other key stakeholders, which contributes to the stakeholders’ management
literature (Mitchell et al., 1997; Donaldson & Preston, 1995; Bartkus & Glassman, 2008).
The presented VMPR framework took an internal perspective to examining the core
elements of CEM by studying how the different layers are related, investigating the impact
of informal controls manifested in firms’ verbal commitments reflecting their intentions, and
substantiated intentions in the form of formal controls reflected via environmental policy on
environmental performance. While each of these elements has been studied individually
(Bartkus & Glassman, 2008; Christmann 2004, Dawkins & Fraas, 2010; Behrend & Baker,
2009) this study captures multiple CEM constructs in a single model to distinguish between
mechanisms of control. The framework presented also sought to differentiate firms on “what
they say they do” vs. “what they set out to do” and “what they actually end up doing”. This
framework serves as the base model or starting point for studying challenges and for
breaking the green free rider trend that evidence suggests describes some MNCs today.
80
The findings from investigations of the VMPR framework support the literature emphasizing
the importance of managerial decisions as drivers of CEM (Rugman & Verbeke, 1998;
Buysse & Verbeke, 2003; Christmann, 2004) versus the previous literature that puts greater
emphasis on firm’s reactionary behavior to external government regulations (Birdsall &
Wheeler, 1992). We found that effectiveness in managing green policies is a strong driver for
developing green competencies/competitive advantage. The findings support the literature on
MNC implementation of voluntary self regulated environmental policies (Christmann, 2004)
as opposed to studies that consider the MNC as a seeker of pollution havens (Gladwin, 1987;
Zyglidopoulos, 2002). In addition, the study has sought to investigate the “language” aspect
of CEM, which is regarded as “missing” (Onkila, 2009). The research findings found support
for the role of HQ’s verbal commitment and policy as key drivers of firms’ environmental
actions and the importance of using multiple control mechanisms to guide MNC-wide
environmental practices. Finally, an underlying contribution of this framework is that it
captures multiple stakeholders’ perspectives, with the HQ being the main actor behind verbal
commitment, subsidiaries being the main actors behind implementation (GEP), and finally
external stakeholders determining reputation.
RQ #2: Discussion and Contributions
While hypothesized to negatively moderate the relationship between Environmental
Management Standards and actual GEP due to increased management complexities,
Environmental Institutions Network Diversity was not found to have a significant impact.
Network Density and Network Dispersion were also hypothesized to increase the
complexities of managing the subsidiary network and hence negatively moderate the
81
relationship between Green Policy Management and actual GEP. These hypotheses were also
not supported, contrary to expectations.
Network complexities did not make it more or less difficult for the MNC to achieve GEP.
While this may be attributed to measurement error, based on traditional network theory, this
finding is indeed unexpected, given that the dimensions of density, dispersion, and diversity
have been all found to hinder uniform policy adoption, communication and knowledge flow
for the most part in the previous MNC management literature (Kostova & Roth, 2002;
Ghemawat, 2001; Bouquet & Birkinshaw, 2008; Brass, et al., 2004). Nevertheless, such a
unique finding is of itself a contribution to the literature because it tested Aragón-Correa and
Sharma’s (2003) proposition about the degree of complexity’s moderating effect, with no
significant relationship found.
The lack of significance for the interaction effect can also be explained by the rational that
firms are moving more towards standardized and uniform adoption of environmental
performance across units no matter how many units are in the network or how geographically
dispersed they may be, supporting the trends of effective standardization of environmental
operations within the subsidiary network (Christmann 2004, Aguilera-caracuel et al., 2012).
The lack of significance can also be interpreted by strategy scholars to support the literature
on dynamic capabilities, which Teece and Shuen (1997) refer to as “the ability to integrate,
build, and reconfigure internal and external competencies to address rapidly-changing
environments”. Firms that have developed green dynamic capabilities are more likely to be
successful in deploying them through their subsidiary networks, despite the institutional
82
contexts they operate within, and despite the number of subsidiaries in the networks and how
geographically distant they are from HQ. Therefore, future studies can examine dynamic
capabilities as the moderator of the green policy to green practice relationship, to determine
whether firms have the dynamic capabilities needed to implement these policies.
This finding supports the current literature which explains that leading Fortune 500 firms are
not seeking pollution havens with weak institutional infrastructure to conduct operations
(Christmann, 2004; Christmann & Taylor, 2001). This supports the perspective that more
firms are seeking to standardize and adopt uniform practices regardless of how diverse the
environmental institutional context is or how many units they need to manage within the
MNC network of subsidiaries. This supports the trends of standardization of environmental
guidelines worldwide (Birdsall & Wheeler, 1992; King & Shaver, 2001). Firms may not act
as explained by transaction cost theory in an opportunistic manner taking advantage of weak
environmental institutions; instead, MNCs are taking the upper hand and becoming more self
regulated (Christmann & Taylor, 2001). Firm characteristics and capabilities are shaping
their environmental strategies (Christmann, 2000). Firms are seeking to streamline operations
and facilitate the transfer of best practices behind complementarities between firm and host
market assets (Teece, 1986) and operating in diverse institutional contexts does not have a
significant impact.
This is supported by the literature explaining that firms are not seeking to comply with new
environmental regulations, but are also developing “green capabilities which allow them to
outperform competitors on environmental strategy grounds alone” (Rugman & Verbeke,
83
1998). In this context, self regulation behaviors and their results are likely to exceed those
expected from governmental compliance in a host market (Christmann, 2004).
The perception that MNCs are moving to more self regulation, regardless of where they
invest, creates numerous avenues for further research in the direction of investigating internal
firm capabilities driving GEP. This finding supports the growing literature depicting
emerging trends of environmental uniformity and standardization (Christmann, 2004;
Arago´n-Correa & Sharma, 2003) as self driven goals, which firms are voluntarily pursuing.
Such behavior is driven more by firms’ pursuit of gaining competitive advantages than
external stakeholder pressure (Fraj-Andrés, Martínez-Salinas & Matute-Vallejo, 2009). This
described firm behavior is also in agreement with social cognitive theory of self regulation
(Bandura, 1991). This theory has not been incorporated much in strategic management at the
firm network level and to an even lesser degree in the CEM literature. Instead, it has mostly
examined individuals; yet the rational is very relevant to explaining organizations'
environmental behavior. Bandura (1991) explains that when entities have clear goals that
guide their actions, they self regulate their actions, weighing in their own personal gains from
adopting a specific practice, including expected pressures from significant stakeholder
groups. In fact, he describes self regulated systems as “…provid(ing) the very basis of
purposeful actions” (Bandura, 1991: 248). Therefore, it is such self regulation which allows
the organization to smoothly and effectively adapt to the changing environment. This is also
supported by the MNC literature on benefits from standardization of different functions to
gain the synergies of an integrated value chain, and exchange of resources (Aguilera-
Caracuel, et al., 2012; Mueller et al., 2009). For these firms, due to the combination of the
84
green consumerism trend (BusinessWire, 2010), standardization of global regulations
(Buysse & Verbeke, 2003) and the green race (Mitchell & Ramey, 2011), they are left with
no other choice but to build green competitive advantage, regardless of how many, how
distant or how different their subsidiaries may be.
The above has provided insights into new ways for scholars to approach how organizations
behave and how best these organizations are to be managed. While international institutional
context remains important, the MNC as a complex adaptive system has figured out ways to
preserve its core identity and practice despite where it operates.
Another explanation for the above findings could be that network effects challenges are
overpowered by another variable that is not captured in this study, like firm leadership, for
example. Another possibility is that network dimensions will increase the challenges in other
elements of CEM, but not in the policy to performance relationship. An additional possibility
is that the model as it stands is underspecified because it does not capture challenges
stemming from subsidiary level management or control, where possibly network dimensions
will matter more.
Future studies can also challenge the above perspective by arguing that the relationship
between MNC green policy management and GEP may be moderated by other factors which
may not have been captured in this study. This may include variables captured more at the
“subsidiary level” versus “network level” variables, which are not examined in the scope of
this study. Future scholars can investigate moderating factors such as subsidiary size, scope,
85
and management style as potential moderators of the relationship between green policy
management and green actual practice. Another set of variables to investigate could be
related to subsidiary level capabilities (Christmann, 2000).
POST HOC SEGMENTATION OF FIRMS
According to Corporate Register (2011), the largest online directory of firms’ sustainability
reports across the globe, the number of sustainability reports has reached a milestone of over
30,000 corporate responsibility and sustainability reports from almost 7,500 companies
around the world. While this trend is a positive one, it also raises some questions related to
potential free riders, especially when being an environmentally responsible firm is an
attractive “tag” to have for firms to boost their corporate reputation and to attract investors.
Research question #1 sought to depict the differences between firms as HQ’s use of verbal
commitment and green management policy to control the firm, but for the MNC, we need to
also account for its international element. Therefore, in the upcoming post hoc analysis, the
next section seeks to make distinctions between firms’ GEP and key subsidiary network
dimensions. With the current flux of MNCs issuing environmental sustainability reports, this
can be used as a tool through which investors can discriminate between multiple firms in
accordance to their GEP and their international operations.
Typology: Two x Two Matrix
Payne and Raiborn (2001) explain that firms’ behaviors can range from compliance with the
law all the way to making environmental performance its distinct competitive advantage. So
86
conceptually, this suggests that there could be a difference between firms on dimensions of
where they invest and their environmental performance. While this study focuses on the
challenges that MNCs face in deploying global environmental policies, some may argue that
some firms intentionally seek to operate in markets with less stringent environmental
standards. A typology can be created when we try to answer the question of how can MNCs
be segmented in relation to their host market’s environmental institutional context. The
typology is presented in a 2x2 matrix shown in Figure 10.
The first quadrant represents companies that have a low GEP score and also operate networks
with a low Environmental Institutional Network Score. These firms would be labeled as
“exploiters”. They are not committed to environmental compliance and the location of their
international operations is a reflection of this. In quadrant II, companies have a low GEP, but
a high Environmental Institutional Network Score, reflecting operations in markets that have
high commitment to the environment. These companies can be labeled as being “compliant”,
and perhaps through time, they are likely to increase their environmental performance as a
function of operating in countries with high environmental commitments. In quadrant III,
companies have a high performance score, but operate in locations with a low Environmental
Institutional Network Score. In this context, it is likely that these firms are more capable of
acting out the role of the “MNC as an agent of change”, because these firms are committed to
performing environmentally well, even if the host market context does not support them in
doing so. These firms, if they possess enough bargaining power, can be trend setters and can
actually shape the local institutions of these host markets. Finally, in quadrant IV, a firm
would be characterized as “green competent” if in fact it had a high GEP and a high
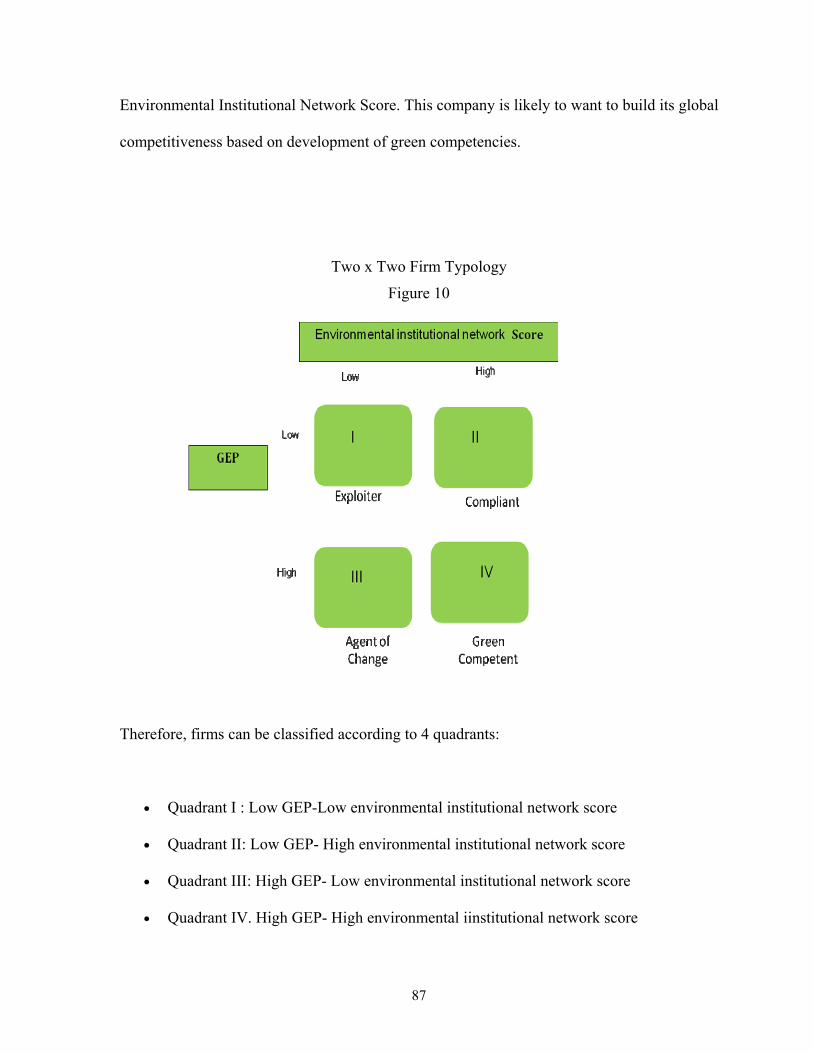
87
Environmental Institutional Network Score. This company is likely to want to build its global
competitiveness based on development of green competencies.
Two x Two Firm Typology
Figure 10
Therefore, firms can be classified according to 4 quadrants:
• Quadrant I : Low GEP-Low environmental institutional network score
• Quadrant II: Low GEP- High environmental institutional network score
• Quadrant III: High GEP- Low environmental institutional network score
• Quadrant IV. High GEP- High environmental iinstitutional network score
88
The first step in this segmentation analysis involved calculating the median for the key
variables: GEP and Network institutional dimensions. The median was used to create cut offs
(high/low) for this classification, such that “1’ was coded if above the median and “0” if
below the median. Using these cutoffs, a 2x2 matrix was created which will be used to
predict different firm outcomes. The below table 13 presents the results of the cross
tabulations used to develop the 2x2 classification.
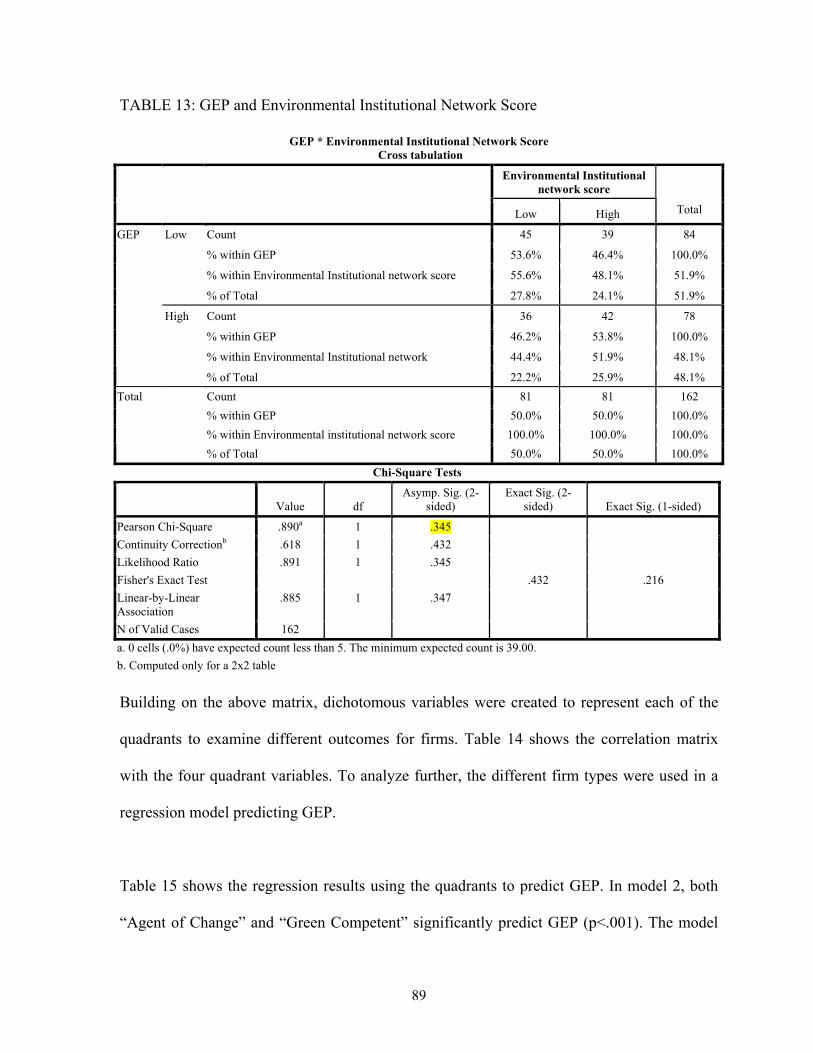
89
TABLE 13: GEP and Environmental Institutional Network Score
GEP * Environmental Institutional Network Score Cross tabulation
Environmental Institutional network score
Low High Total
Count 45 39 84
% within GEP 53.6% 46.4% 100.0%
% within Environmental Institutional network score 55.6% 48.1% 51.9%
Low
% of Total 27.8% 24.1% 51.9%
Count 36 42 78
% within GEP 46.2% 53.8% 100.0%
% within Environmental Institutional network 44.4% 51.9% 48.1%
GEP
High
% of Total 22.2% 25.9% 48.1%
Count 81 81 162
% within GEP 50.0% 50.0% 100.0%
% within Environmental institutional network score 100.0% 100.0% 100.0%
Total
% of Total 50.0% 50.0% 100.0%
Chi-Square Tests
Value df
Asymp. Sig. (2-sided)
Exact Sig. (2-sided) Exact Sig. (1-sided)
Pearson Chi-Square .890a 1 .345
Continuity Correctionb .618 1 .432
Likelihood Ratio .891 1 .345
Fisher's Exact Test .432 .216
Linear-by-Linear Association
.885 1 .347
N of Valid Cases 162
a. 0 cells (.0%) have expected count less than 5. The minimum expected count is 39.00.
b. Computed only for a 2x2 table
Building on the above matrix, dichotomous variables were created to represent each of the
quadrants to examine different outcomes for firms. Table 14 shows the correlation matrix
with the four quadrant variables. To analyze further, the different firm types were used in a
regression model predicting GEP.
Table 15 shows the regression results using the quadrants to predict GEP. In model 2, both
“Agent of Change” and “Green Competent” significantly predict GEP (p<.001). The model
90
has an adjusted R-square of .612 and a significant R-square change. The “exploiter” variable
was the excluded variable in the regression output.
The classification of firms was found to significantly predict network density as shown in
table 16. The quadrant of “Green Competent” firms had a negative and significant
relationship with network density (p<.05). This explains that firms who are not “green
competent” are also those who have to manage highly dense networks (many subsidiaries).
This finding is in line with the theoretical argument of presented in RQ#2 that increased
network density is likely to challenge GEP.
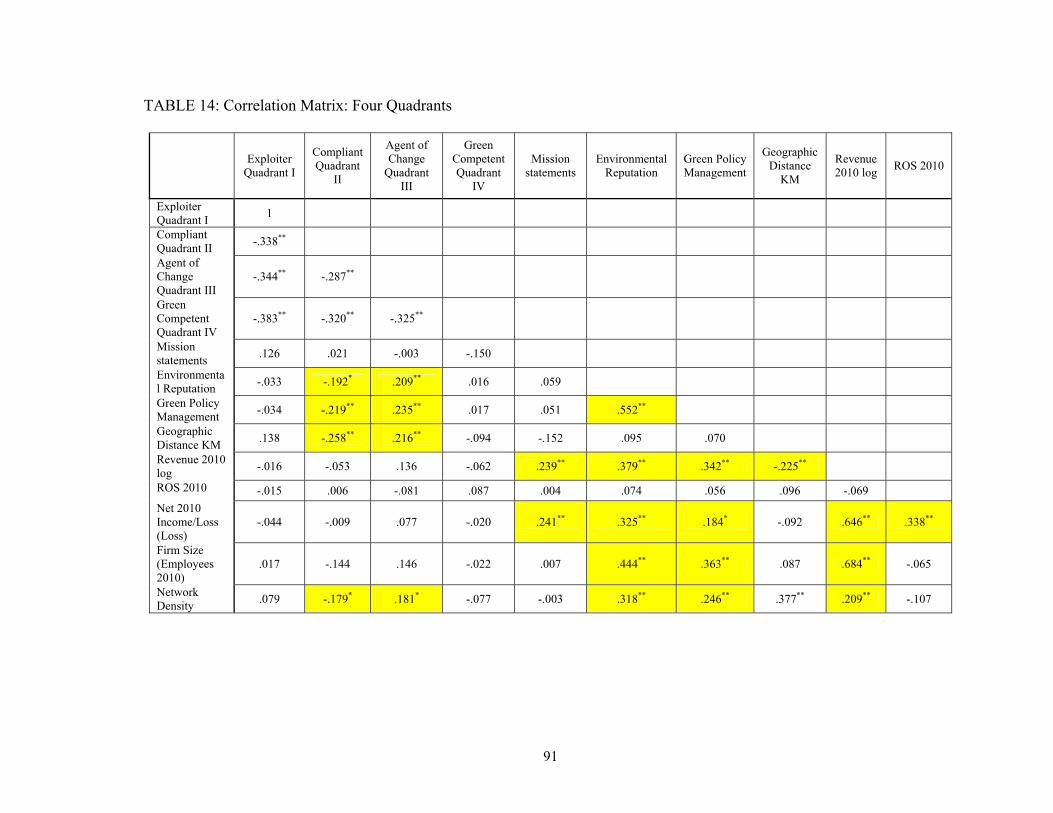
91
TABLE 14: Correlation Matrix: Four Quadrants
Exploiter
Quadrant I
Compliant Quadrant
II
Agent of Change
Quadrant III
Green Competent Quadrant
IV
Mission statements
Environmental Reputation
Green Policy Management
Geographic Distance
KM
Revenue 2010 log
ROS 2010
Exploiter Quadrant I
1
Compliant Quadrant II
-.338**
Agent of Change Quadrant III
-.344** -.287**
Green Competent Quadrant IV
-.383** -.320** -.325**
Mission statements
.126 .021 -.003 -.150
Environmental Reputation
-.033 -.192* .209** .016 .059
Green Policy Management
-.034 -.219** .235** .017 .051 .552**
Geographic Distance KM
.138 -.258** .216** -.094 -.152 .095 .070
Revenue 2010 log
-.016 -.053 .136 -.062 .239** .379** .342** -.225**
ROS 2010 -.015 .006 -.081 .087 .004 .074 .056 .096 -.069
Net 2010 Income/Loss (Loss)
-.044 -.009 .077 -.020 .241** .325** .184* -.092 .646** .338**
Firm Size (Employees 2010)
.017 -.144 .146 -.022 .007 .444** .363** .087 .684** -.065
Network Density
.079 -.179* .181* -.077 -.003 .318** .246** .377** .209** -.107
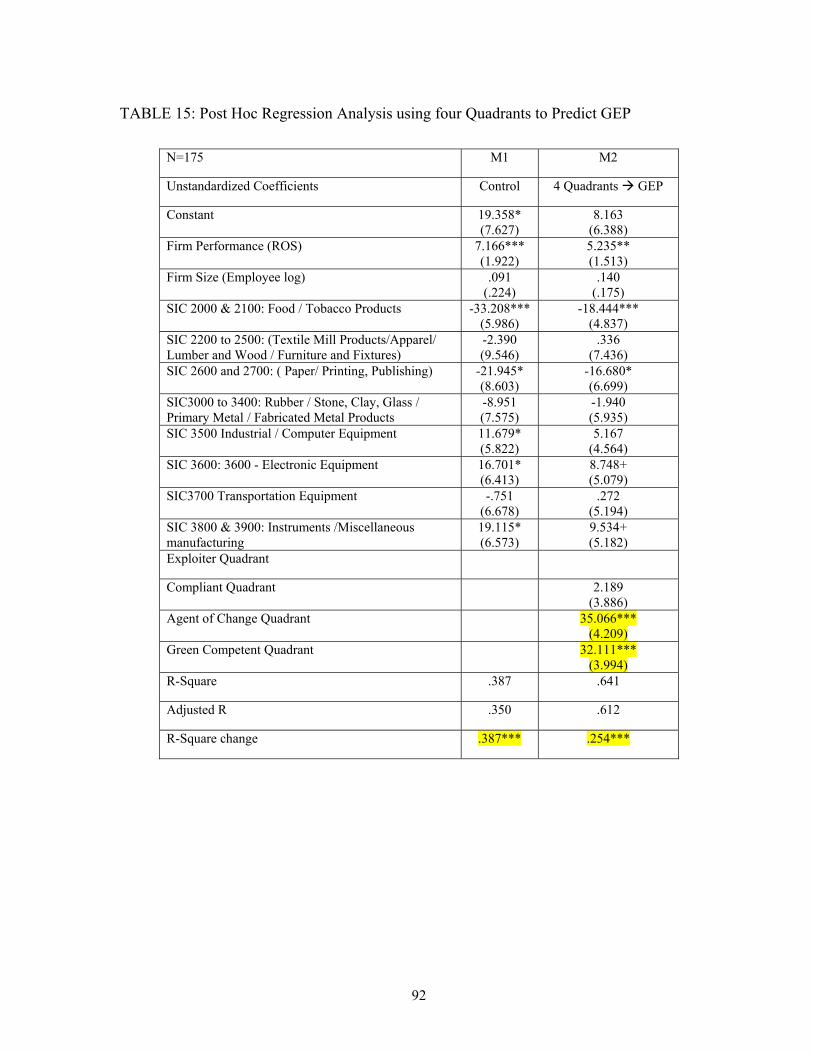
92
TABLE 15: Post Hoc Regression Analysis using four Quadrants to Predict GEP
N=175 M1 M2
Unstandardized Coefficients Control 4 Quadrants GEP
Constant 19.358* (7.627)
8.163 (6.388)
Firm Performance (ROS) 7.166*** (1.922)
5.235** (1.513)
Firm Size (Employee log) .091 (.224)
.140 (.175)
SIC 2000 & 2100: Food / Tobacco Products -33.208*** (5.986)
-18.444*** (4.837)
SIC 2200 to 2500: (Textile Mill Products/Apparel/ Lumber and Wood / Furniture and Fixtures)
-2.390 (9.546)
.336 (7.436)
SIC 2600 and 2700: ( Paper/ Printing, Publishing) -21.945* (8.603)
-16.680* (6.699)
SIC3000 to 3400: Rubber / Stone, Clay, Glass / Primary Metal / Fabricated Metal Products
-8.951 (7.575)
-1.940 (5.935)
SIC 3500 Industrial / Computer Equipment 11.679* (5.822)
5.167 (4.564)
SIC 3600: 3600 - Electronic Equipment 16.701* (6.413)
8.748+ (5.079)
SIC3700 Transportation Equipment -.751 (6.678)
.272 (5.194)
SIC 3800 & 3900: Instruments /Miscellaneous manufacturing
19.115* (6.573)
9.534+ (5.182)
Exploiter Quadrant
Compliant Quadrant 2.189 (3.886)
Agent of Change Quadrant 35.066*** (4.209)
Green Competent Quadrant 32.111*** (3.994)
R-Square .387 .641
Adjusted R .350 .612
R-Square change .387*** .254***
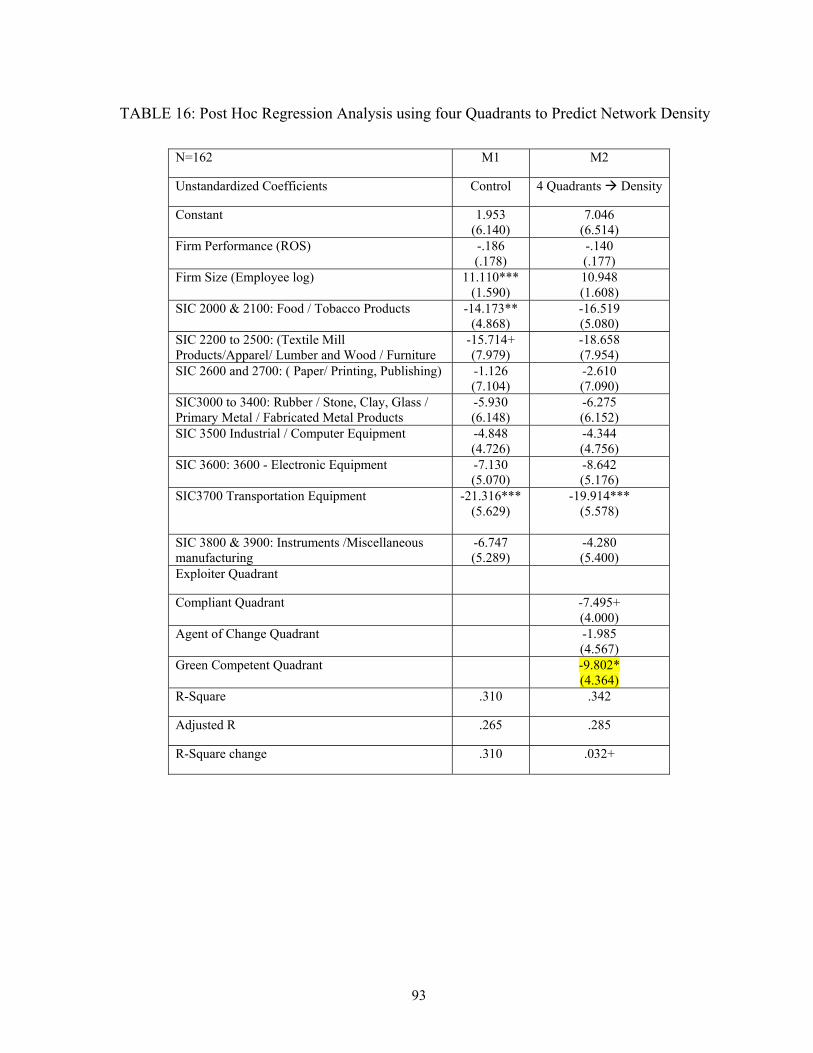
93
TABLE 16: Post Hoc Regression Analysis using four Quadrants to Predict Network Density
N=162 M1 M2
Unstandardized Coefficients Control 4 Quadrants Density
Constant 1.953 (6.140)
7.046 (6.514)
Firm Performance (ROS) -.186 (.178)
-.140 (.177)
Firm Size (Employee log) 11.110*** (1.590)
10.948 (1.608)
SIC 2000 & 2100: Food / Tobacco Products -14.173** (4.868)
-16.519 (5.080)
SIC 2200 to 2500: (Textile Mill Products/Apparel/ Lumber and Wood / Furniture
-15.714+ (7.979)
-18.658 (7.954)
SIC 2600 and 2700: ( Paper/ Printing, Publishing) -1.126 (7.104)
-2.610 (7.090)
SIC3000 to 3400: Rubber / Stone, Clay, Glass / Primary Metal / Fabricated Metal Products
-5.930 (6.148)
-6.275 (6.152)
SIC 3500 Industrial / Computer Equipment -4.848 (4.726)
-4.344 (4.756)
SIC 3600: 3600 - Electronic Equipment -7.130 (5.070)
-8.642 (5.176)
SIC3700 Transportation Equipment -21.316*** (5.629)
-19.914*** (5.578)
SIC 3800 & 3900: Instruments /Miscellaneous manufacturing
-6.747 (5.289)
-4.280 (5.400)
Exploiter Quadrant
Compliant Quadrant -7.495+ (4.000)
Agent of Change Quadrant -1.985 (4.567)
Green Competent Quadrant -9.802* (4.364)
R-Square .310 .342
Adjusted R .265 .285
R-Square change .310 .032+
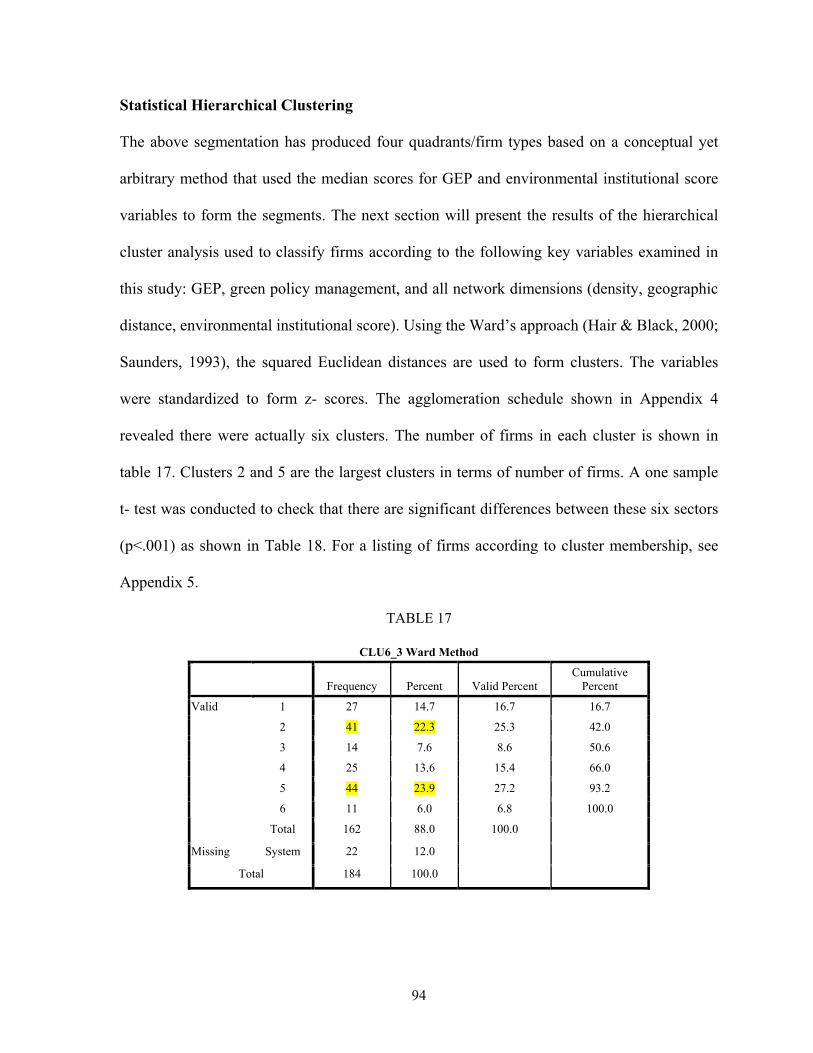
94
Statistical Hierarchical Clustering
The above segmentation has produced four quadrants/firm types based on a conceptual yet
arbitrary method that used the median scores for GEP and environmental institutional score
variables to form the segments. The next section will present the results of the hierarchical
cluster analysis used to classify firms according to the following key variables examined in
this study: GEP, green policy management, and all network dimensions (density, geographic
distance, environmental institutional score). Using the Ward’s approach (Hair & Black, 2000;
Saunders, 1993), the squared Euclidean distances are used to form clusters. The variables
were standardized to form z- scores. The agglomeration schedule shown in Appendix 4
revealed there were actually six clusters. The number of firms in each cluster is shown in
table 17. Clusters 2 and 5 are the largest clusters in terms of number of firms. A one sample
t- test was conducted to check that there are significant differences between these six sectors
(p<.001) as shown in Table 18. For a listing of firms according to cluster membership, see
Appendix 5.
TABLE 17
CLU6_3 Ward Method
Frequency Percent Valid Percent
Cumulative Percent
1 27 14.7 16.7 16.7
2 41 22.3 25.3 42.0
3 14 7.6 8.6 50.6
4 25 13.6 15.4 66.0
5 44 23.9 27.2 93.2
6 11 6.0 6.8 100.0
Valid
Total 162 88.0 100.0 Missing System 22 12.0
Total 184 100.0
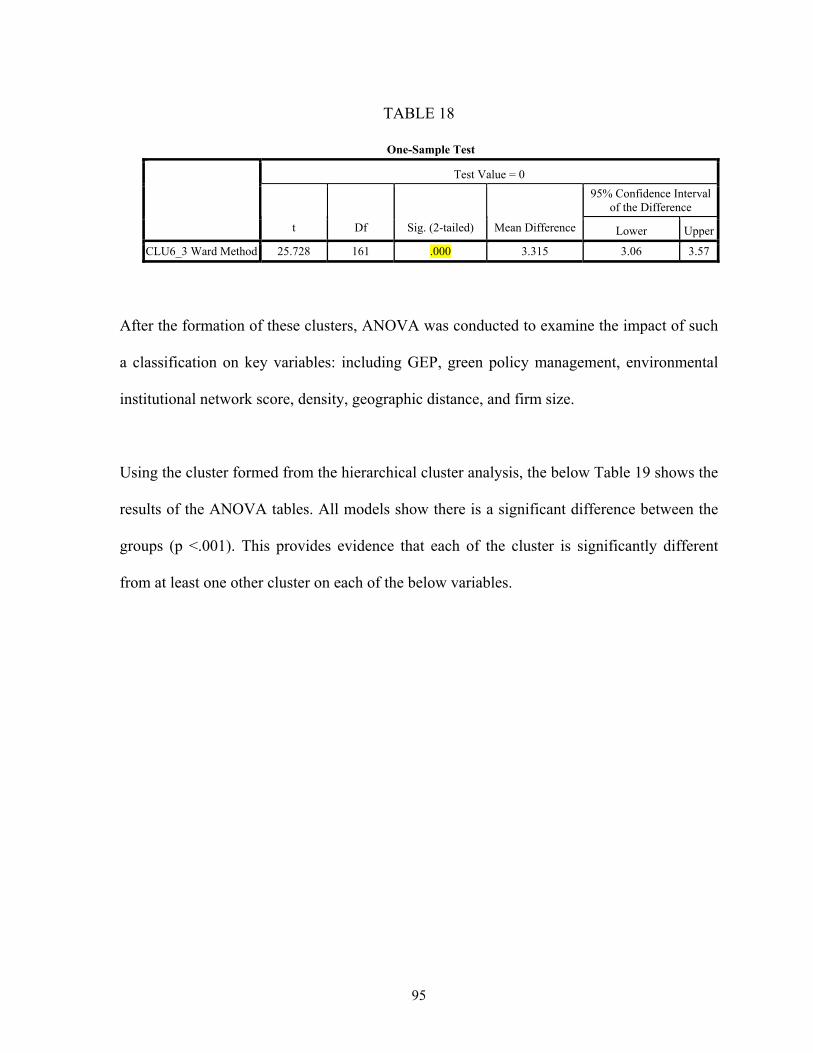
95
TABLE 18
One-Sample Test
Test Value = 0
95% Confidence Interval of the Difference
t Df Sig. (2-tailed) Mean Difference Lower Upper
CLU6_3 Ward Method 25.728 161 .000 3.315 3.06 3.57
After the formation of these clusters, ANOVA was conducted to examine the impact of such
a classification on key variables: including GEP, green policy management, environmental
institutional network score, density, geographic distance, and firm size.
Using the cluster formed from the hierarchical cluster analysis, the below Table 19 shows the
results of the ANOVA tables. All models show there is a significant difference between the
groups (p <.001). This provides evidence that each of the cluster is significantly different
from at least one other cluster on each of the below variables.
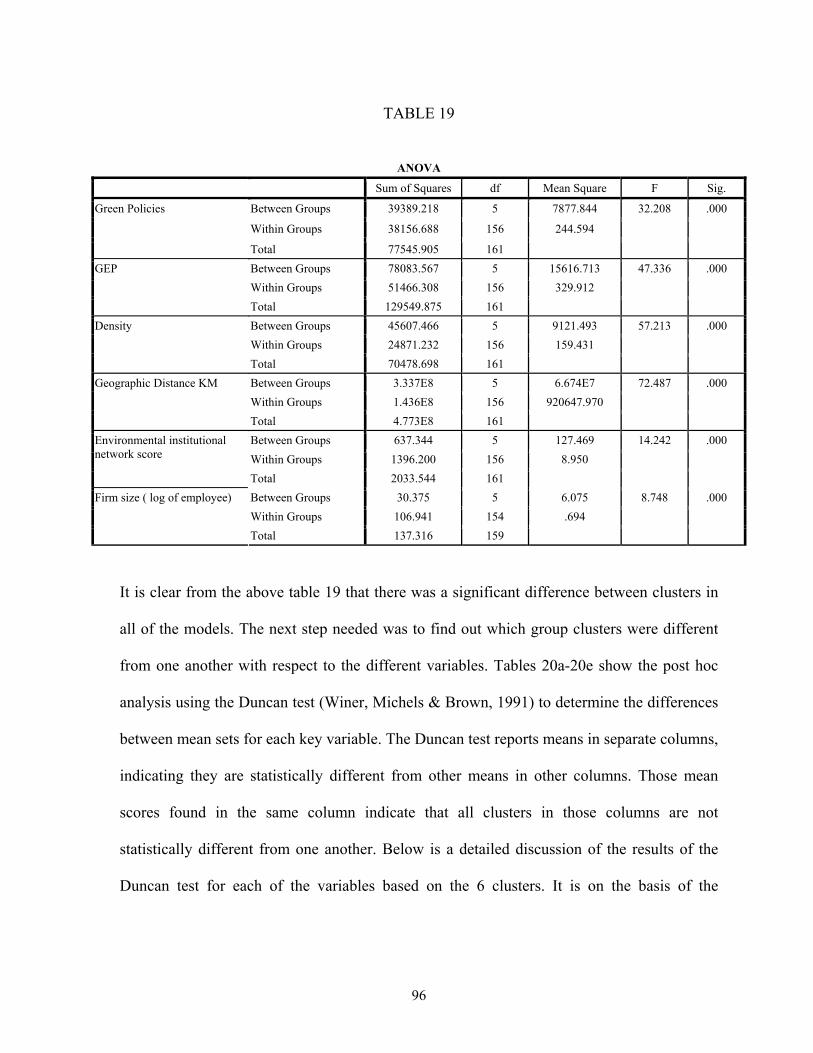
96
TABLE 19
ANOVA
Sum of Squares df Mean Square F Sig.
Between Groups 39389.218 5 7877.844 32.208 .000
Within Groups 38156.688 156 244.594
Green Policies
Total 77545.905 161
Between Groups 78083.567 5 15616.713 47.336 .000
Within Groups 51466.308 156 329.912
GEP
Total 129549.875 161
Between Groups 45607.466 5 9121.493 57.213 .000
Within Groups 24871.232 156 159.431
Density
Total 70478.698 161
Between Groups 3.337E8 5 6.674E7 72.487 .000
Within Groups 1.436E8 156 920647.970
Geographic Distance KM
Total 4.773E8 161
Between Groups 637.344 5 127.469 14.242 .000
Within Groups 1396.200 156 8.950
Environmental institutional network score
Total 2033.544 161
Between Groups 30.375 5 6.075 8.748 .000
Within Groups 106.941 154 .694
Firm size ( log of employee)
Total 137.316 159
It is clear from the above table 19 that there was a significant difference between clusters in
all of the models. The next step needed was to find out which group clusters were different
from one another with respect to the different variables. Tables 20a-20e show the post hoc
analysis using the Duncan test (Winer, Michels & Brown, 1991) to determine the differences
between mean sets for each key variable. The Duncan test reports means in separate columns,
indicating they are statistically different from other means in other columns. Those mean
scores found in the same column indicate that all clusters in those columns are not
statistically different from one another. Below is a detailed discussion of the results of the
Duncan test for each of the variables based on the 6 clusters. It is on the basis of the
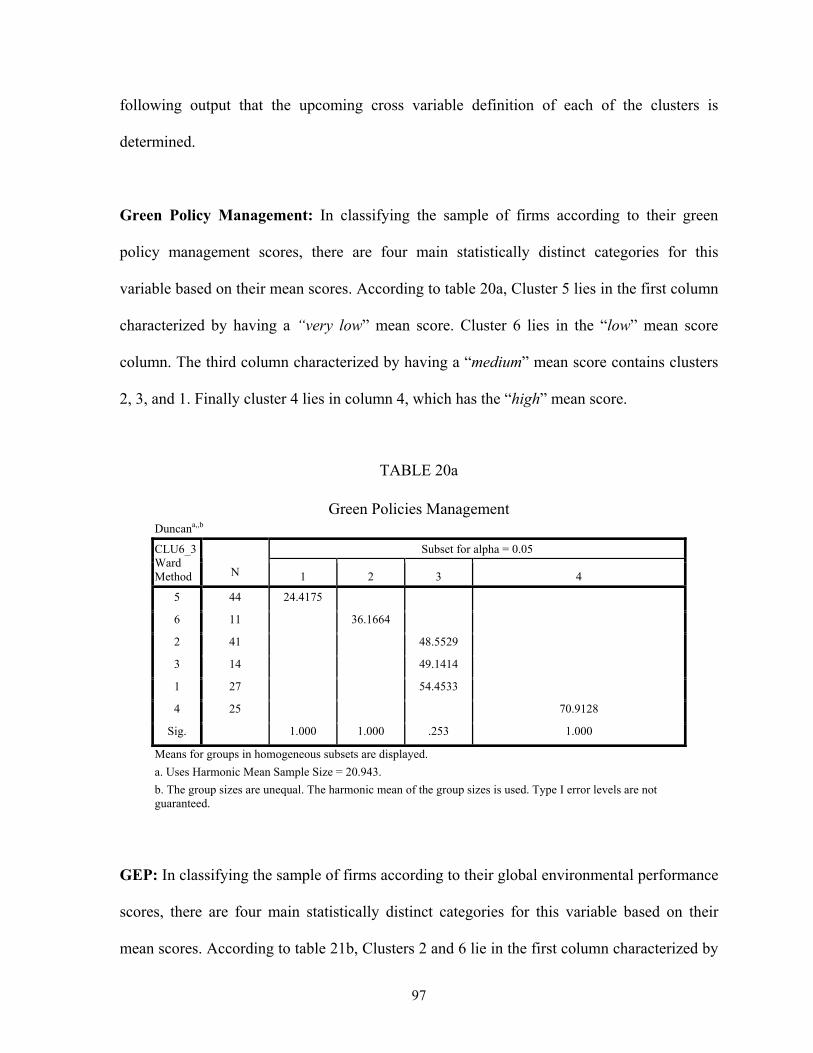
97
following output that the upcoming cross variable definition of each of the clusters is
determined.
Green Policy Management: In classifying the sample of firms according to their green
policy management scores, there are four main statistically distinct categories for this
variable based on their mean scores. According to table 20a, Cluster 5 lies in the first column
characterized by having a “very low” mean score. Cluster 6 lies in the “low” mean score
column. The third column characterized by having a “medium” mean score contains clusters
2, 3, and 1. Finally cluster 4 lies in column 4, which has the “high” mean score.
TABLE 20a
Green Policies Management Duncana,,b
Subset for alpha = 0.05 CLU6_3 Ward Method N 1 2 3 4
5 44 24.4175 6 11 36.1664 2 41 48.5529 3 14 49.1414 1 27 54.4533 4 25 70.9128
Sig. 1.000 1.000 .253 1.000
Means for groups in homogeneous subsets are displayed.
a. Uses Harmonic Mean Sample Size = 20.943.
b. The group sizes are unequal. The harmonic mean of the group sizes is used. Type I error levels are not guaranteed.
GEP: In classifying the sample of firms according to their global environmental performance
scores, there are four main statistically distinct categories for this variable based on their
mean scores. According to table 21b, Clusters 2 and 6 lie in the first column characterized by
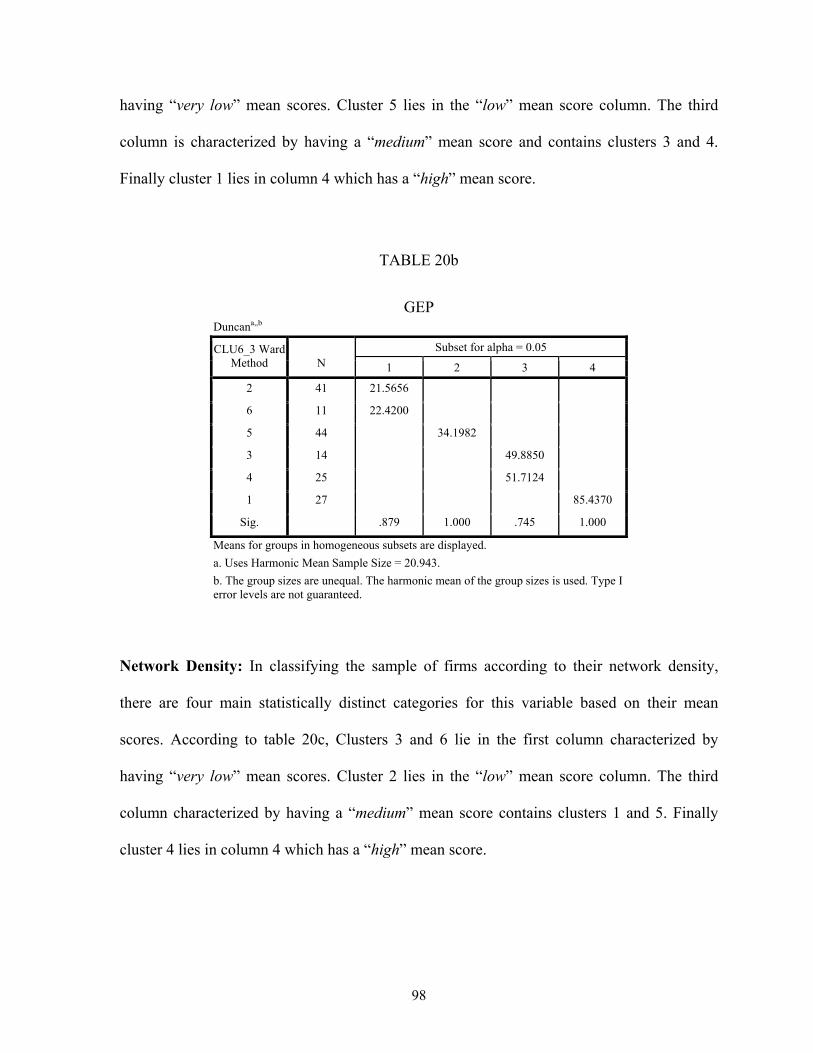
98
having “very low” mean scores. Cluster 5 lies in the “low” mean score column. The third
column is characterized by having a “medium” mean score and contains clusters 3 and 4.
Finally cluster 1 lies in column 4 which has a “high” mean score.
TABLE 20b
GEP
Duncana,,b
Subset for alpha = 0.05 CLU6_3 Ward Method N 1 2 3 4
2 41 21.5656 6 11 22.4200 5 44 34.1982 3 14 49.8850 4 25 51.7124 1 27 85.4370
Sig. .879 1.000 .745 1.000
Means for groups in homogeneous subsets are displayed.
a. Uses Harmonic Mean Sample Size = 20.943.
b. The group sizes are unequal. The harmonic mean of the group sizes is used. Type I error levels are not guaranteed.
Network Density: In classifying the sample of firms according to their network density,
there are four main statistically distinct categories for this variable based on their mean
scores. According to table 20c, Clusters 3 and 6 lie in the first column characterized by
having “very low” mean scores. Cluster 2 lies in the “low” mean score column. The third
column characterized by having a “medium” mean score contains clusters 1 and 5. Finally
cluster 4 lies in column 4 which has a “high” mean score.
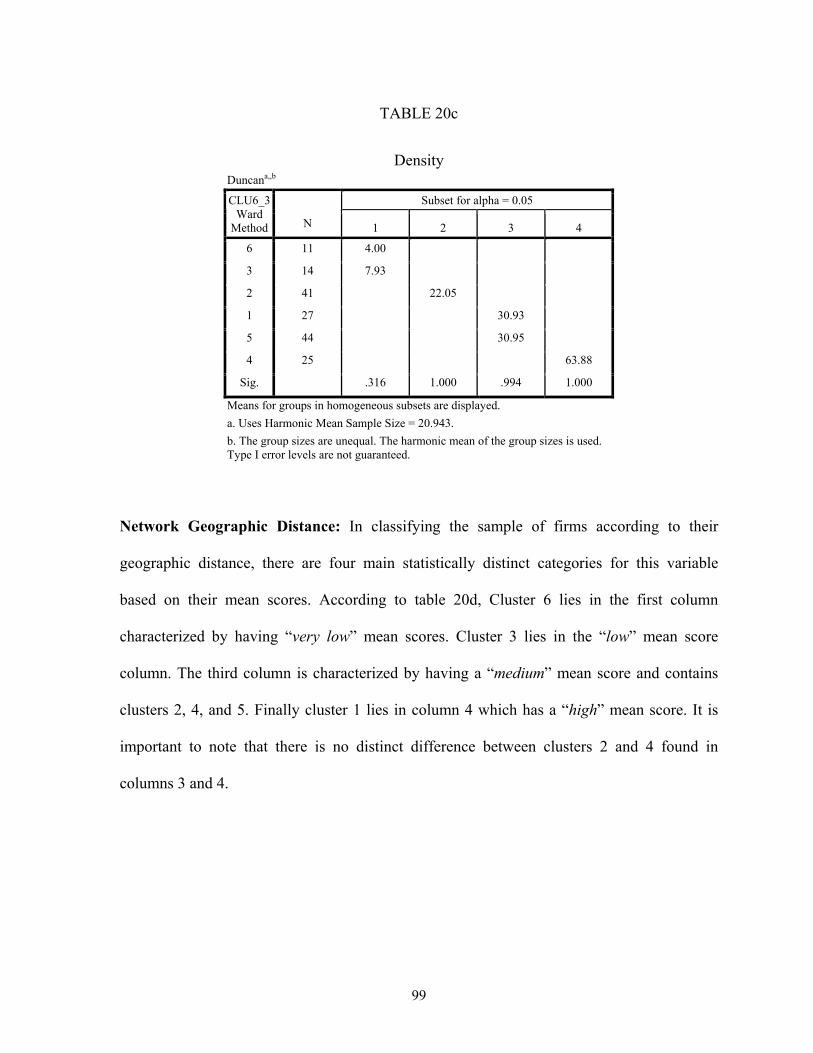
99
TABLE 20c
Density
Duncana,,b
Subset for alpha = 0.05 CLU6_3 Ward
Method N 1 2 3 4
6 11 4.00 3 14 7.93 2 41 22.05 1 27 30.93 5 44 30.95 4 25 63.88
Sig. .316 1.000 .994 1.000
Means for groups in homogeneous subsets are displayed.
a. Uses Harmonic Mean Sample Size = 20.943.
b. The group sizes are unequal. The harmonic mean of the group sizes is used. Type I error levels are not guaranteed.
Network Geographic Distance: In classifying the sample of firms according to their
geographic distance, there are four main statistically distinct categories for this variable
based on their mean scores. According to table 20d, Cluster 6 lies in the first column
characterized by having “very low” mean scores. Cluster 3 lies in the “low” mean score
column. The third column is characterized by having a “medium” mean score and contains
clusters 2, 4, and 5. Finally cluster 1 lies in column 4 which has a “high” mean score. It is
important to note that there is no distinct difference between clusters 2 and 4 found in
columns 3 and 4.
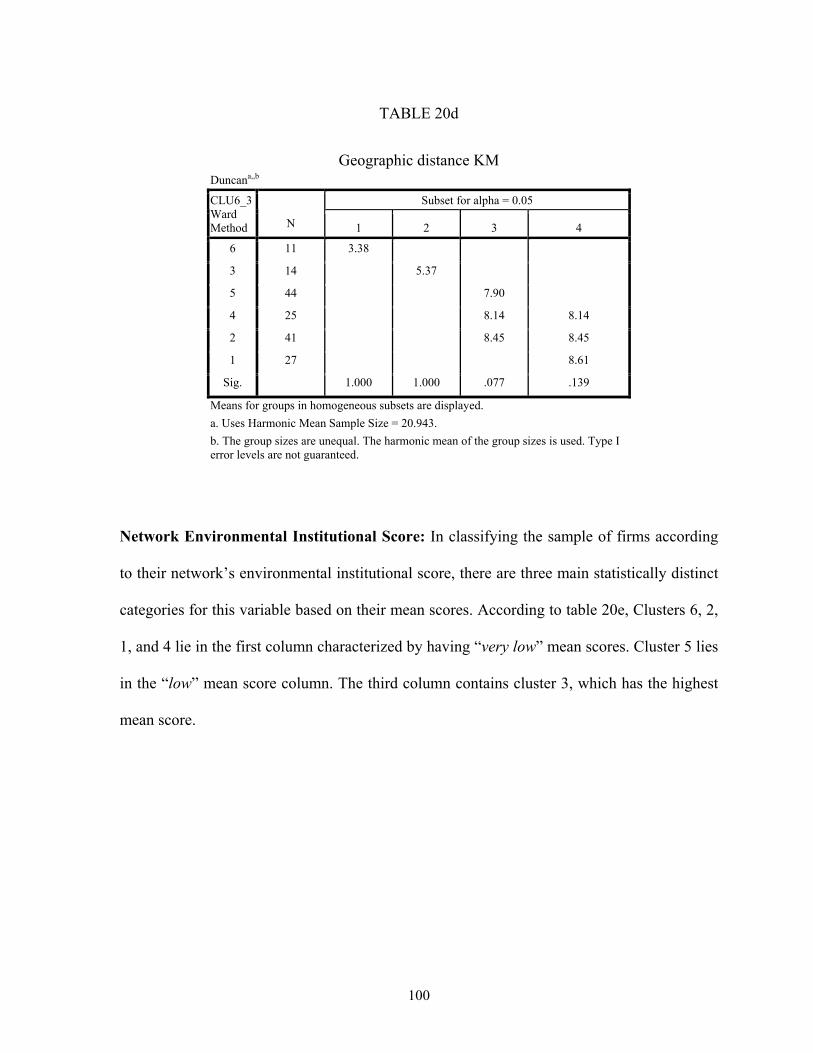
100
TABLE 20d
Geographic distance KM
Duncana,,b
Subset for alpha = 0.05 CLU6_3 Ward Method N 1 2 3 4
6 11 3.38 3 14 5.37 5 44 7.90 4 25 8.14 8.14
2 41 8.45 8.45
1 27 8.61
Sig. 1.000 1.000 .077 .139
Means for groups in homogeneous subsets are displayed.
a. Uses Harmonic Mean Sample Size = 20.943.
b. The group sizes are unequal. The harmonic mean of the group sizes is used. Type I error levels are not guaranteed.
Network Environmental Institutional Score: In classifying the sample of firms according
to their network’s environmental institutional score, there are three main statistically distinct
categories for this variable based on their mean scores. According to table 20e, Clusters 6, 2,
1, and 4 lie in the first column characterized by having “very low” mean scores. Cluster 5 lies
in the “low” mean score column. The third column contains cluster 3, which has the highest
mean score.
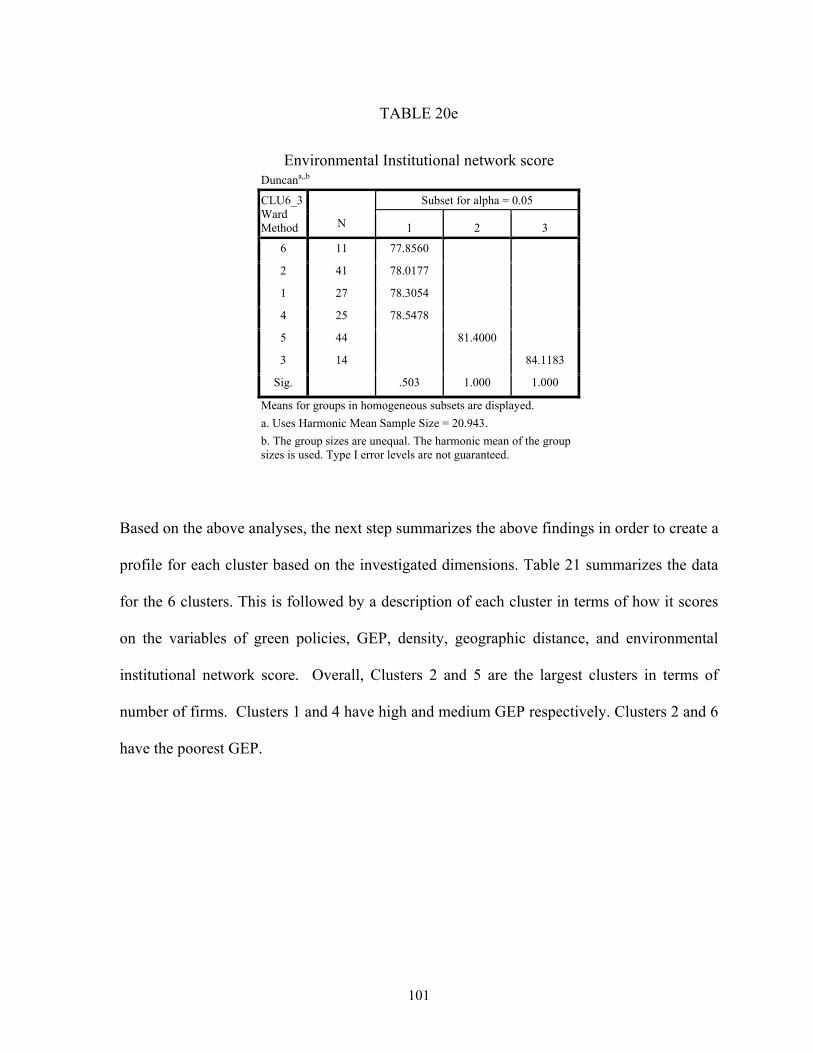
101
TABLE 20e
Environmental Institutional network score
Duncana,,b
Subset for alpha = 0.05 CLU6_3 Ward Method N 1 2 3
6 11 77.8560 2 41 78.0177 1 27 78.3054 4 25 78.5478 5 44 81.4000 3 14 84.1183
Sig. .503 1.000 1.000
Means for groups in homogeneous subsets are displayed.
a. Uses Harmonic Mean Sample Size = 20.943.
b. The group sizes are unequal. The harmonic mean of the group sizes is used. Type I error levels are not guaranteed.
Based on the above analyses, the next step summarizes the above findings in order to create a
profile for each cluster based on the investigated dimensions. Table 21 summarizes the data
for the 6 clusters. This is followed by a description of each cluster in terms of how it scores
on the variables of green policies, GEP, density, geographic distance, and environmental
institutional network score. Overall, Clusters 2 and 5 are the largest clusters in terms of
number of firms. Clusters 1 and 4 have high and medium GEP respectively. Clusters 2 and 6
have the poorest GEP.
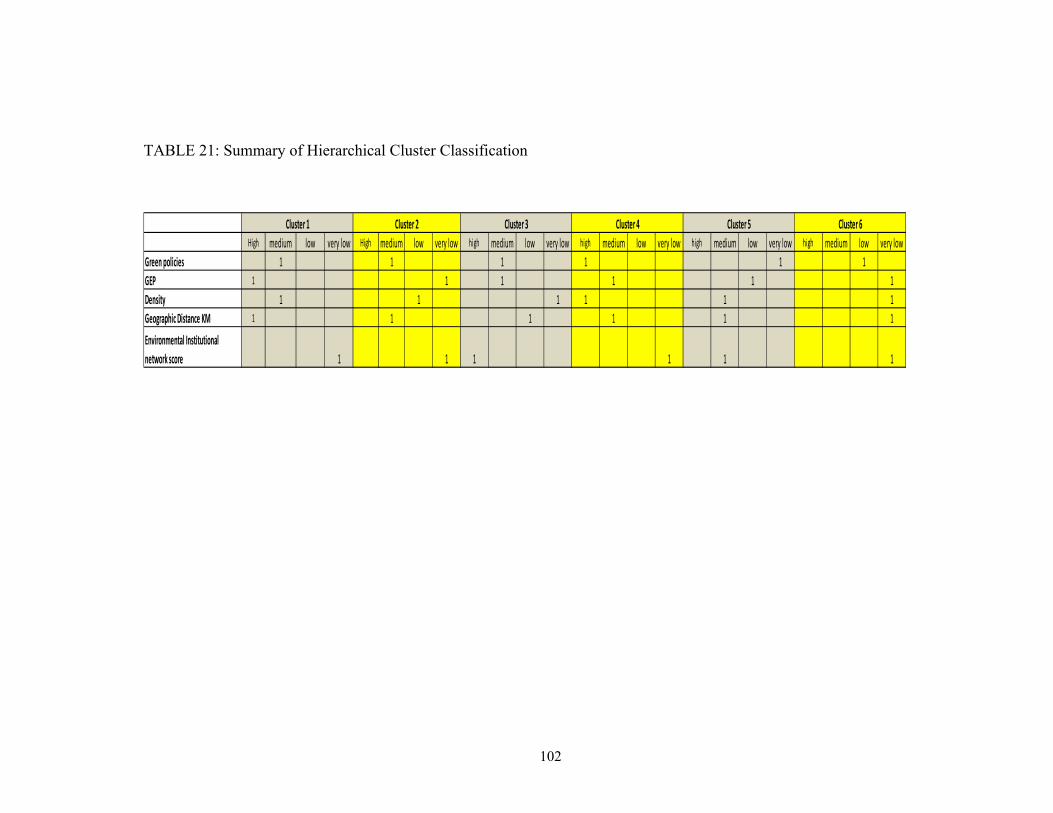
102
TABLE 21: Summary of Hierarchical Cluster Classification
High medium low very low High medium low very low high medium low very low high medium low very low high medium low very low high medium low very lowGreen policies 1 1 1 1 1 1GEP 1 1 1 1 1 1Density 1 1 1 1 1 1Geographic Distance KM 1 1 1 1 1 1Environmental Institutional network score 1 1 1 1 1 1
Cluster 2 Cluster 3 Cluster 4 Cluster 5 Cluster 6Cluster 1
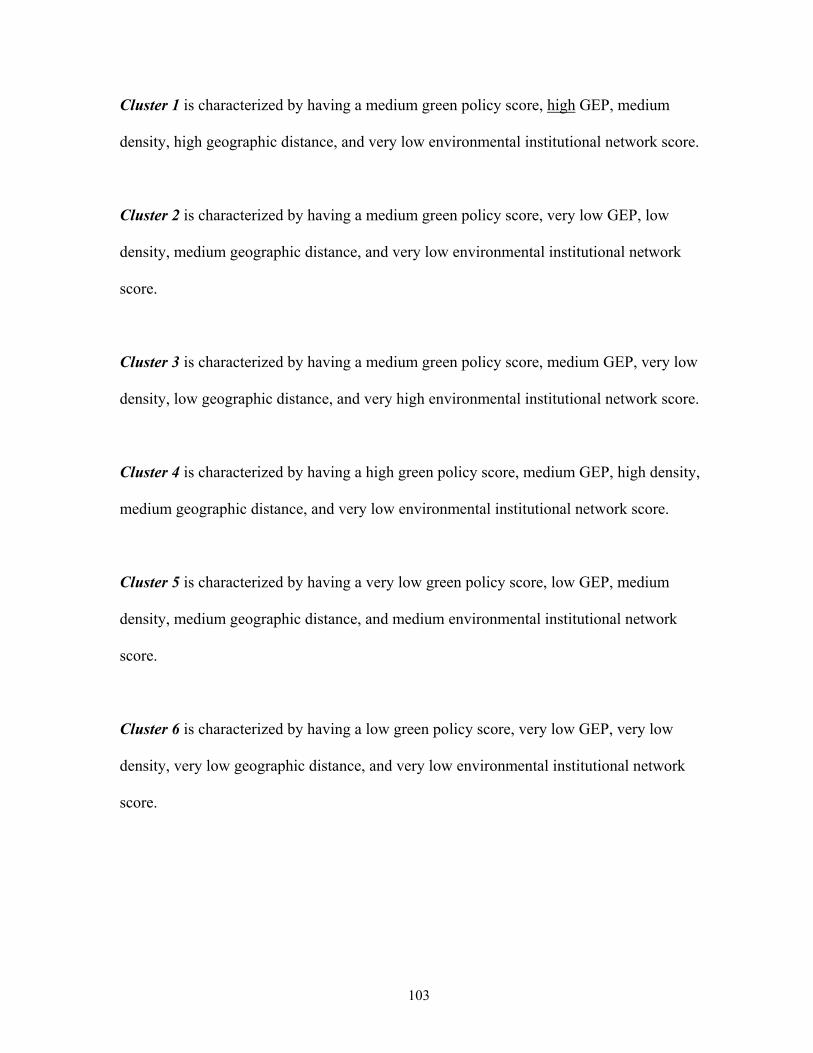
103
Cluster 1 is characterized by having a medium green policy score, high GEP, medium
density, high geographic distance, and very low environmental institutional network score.
Cluster 2 is characterized by having a medium green policy score, very low GEP, low
density, medium geographic distance, and very low environmental institutional network
score.
Cluster 3 is characterized by having a medium green policy score, medium GEP, very low
density, low geographic distance, and very high environmental institutional network score.
Cluster 4 is characterized by having a high green policy score, medium GEP, high density,
medium geographic distance, and very low environmental institutional network score.
Cluster 5 is characterized by having a very low green policy score, low GEP, medium
density, medium geographic distance, and medium environmental institutional network
score.
Cluster 6 is characterized by having a low green policy score, very low GEP, very low
density, very low geographic distance, and very low environmental institutional network
score.
104
Discussion and Contributions of Post Hoc Segmentation Analysis
The above segmentation analysis has sought to provide insights into the relationship between
MNC environmental performance/management and dimensions of their subsidiary network.
The 2 x 2 matrix has sought to classify firms on environmental performance and institutional
contexts of their subsidiaries using the underlying argument that firms’ actions can be
impacted by the environmental institutional contexts of their host markets. From this
analysis, a typology of firms was created and used to predict GEP and density. The results
show most promise for the “agent of change” and “green competent” firm types. From the
analysis based on the 2 x 2 matrix, firms classified as “agents of change” firms were found to
have the highest green policy management score. This shows that firms are capable of being
environmentally compliant even when they operate in host markets that have lesser concern
for the environment. Fergus and Rowney (2005) explain that organizations have a
responsibility to not only comply with society’s norms, but also take an active role in
changing them, possibly through activities such as building environmental awareness. Kwok
and Tadesse (2006) also advocate the role of MNCs as agents of change and show how they
can influence host market institutions over time.
In the hierarchical clustering analysis, the grouping of firms was based on a non-arbitrary
method which took into account various network and firm environmental measures, which
yielded six clusters of firms when these key variables were incorporated. So while the above
2 x 2 matrix specifically focused on the relationship between two variables to build a
105
typology of firms, the hierarchical clustering analysis showed there were actually six clusters
when the five key variables were incorporated.
Based on the above analysis, cluster 1 had firms with the highest GEP, while clusters 5 and 6
contain the poorest performers on GEP and green policy management. Four of the six
clusters operate within very low environmental institutional network contexts. Interestingly,
cluster 2 has effective green policy management but scores lowest in actual GEP. Cluster 4
constitutes firms that operate highly dense networks but still manage to have medium/high
GEP and green policy management.
The listing of firms according to cluster membership provided in the appendix section of this
study can be used to allow investors and scholars to develop insights into the (1) identity of
firms leading GEP and green policy management and also those facing harder challenges
within consideration of their subsidiary network structure dimensions. This can also help
stakeholders distinguish (2) who is actually performing in the right direction versus those
who have put policies in place but have not performed.
From the post hoc, classification of firms on the dimensions of GEP and network
environment institutional network score, this dissertation provides a typology that scholars
can build on which classifies firms as: exploiters, compliers, agents of change or green
competent. Using this classification, regression results showed agents of change to have a
positive significant relationship with green policy management and GEP. The segment of
“agents of change” is of specific interest indeed. Further studies can examine closer who are
106
these companies and what unique capabilities/characteristics are behind making this segment
play the role of leaders of change in their respective markets. What will it take for them to
become “green competent”? The findings from this analysis also showed that firms who are
“green compliant” were likely to have less dense networks, which supports the main
underlying argument that fewer units will result in lesser challenges for GEP implementation.
The post hoc, hierarchal clustering of firms revealed there were 6 clusters of firms based on
the examination of their environmental performance, green policy management and network
dimensions. The analysis reveals that firms in cluster 1 and 4 have the highest GEP, while
cluster 5 and 6 contains the poorest performers on GEP and green policy management.
Interestingly, cluster 5 has the highest absolute number of firms (44 MNCs) and it is
characterized by having very low/low Green Management Policy/GEP scores respectively.
Future research can focus on investigating this segment alone to determine how they score on
verbal environmental commitment and also environmental reputation, which will help
scholars determine if it pays to greenwash.
Four of the six clusters operate within very low environmental institutional contexts.
Interestingly, firms in clusters 1 & 4 all operated in a network with a low pro-environmental
institutional score, but still had high/medium GEP or green policy management. Meanwhile,
cluster 3 reflects firms that operate in high pro-environmental institutional contexts that have
medium GEP and Green policy management. The findings from this cluster analysis support
the variation that exists between firms on elements of ecological performance and foreign
investment locations. This argument is supported by the earlier work of Rugman and
107
Verbeke (1987) and Payne and Raiborn (2001) explain that firms’ behaviors can range from
compliance with the law all the way to making environmental performance its distinct
competitive advantage. This is also in line with the previous discussion of main results about
firms taking the upper hand of managing their footprints voluntarily aside from contextual
host market pressures.
Observations from the clusters formed indicate a correlation between green policy
management and GEP, such that when GEP is high/medium, so is green policy management.
From the cluster analysis, we can observe that the highest performing clusters in terms of
GEP and green policy management (cluster 1 &4) both had medium/high density and
geographic dispersion, although a low Environmental Institutional Network Score. A takeout
from this observation is we are finding firms that have kept policy and GEP at the same level
reflecting standardization of operations policies that coincides with actual performance, and
most interesting they have done so despite operating in low pro-environmental institutional
host markets.
From the cluster analysis we can also observe a category of firms whereby green policy
management level does not match the level of GEP. Cluster 2 presents an interesting scenario
where firms have medium green policy management but very low GEP. Perhaps it is among
these sets of firms where future studies should investigate factors that challenge the
implementation from policy to performance. Focusing on such a segment, future studies can
investigate what headquarters subsidiary and contextual level factors are behind the
108
discrepancies between policy and performance. This study has focused on network
dimensions but there could be other factors behind such discrepancies.
Overall, from this post hoc classification analysis, a typology of firms can be created which
investigates the relationship between MNCs GEP scores and subsidiary network dimensions. Extension papers can study how this typology can lead to a deeper understanding of each
segment. This is not limited to only identifying who these firms are in terms of their profile,
competencies, and leadership. In addition this, the presented classifications can be used to
predict other strategic outcomes, including identification of industry trend setters in the
CSR/CEM platform.
DISSERTATION SUMMARY
This dissertation has sought to investigate the challenges MNCs face when seeking to
optimize their global environmental performance. It first examined the core elements of
CEM with HQ using informal and formal mechanisms to control environmental outcomes.
The paper presented a comprehensive VMPR approach which investigated firms' verbal
environmental commitment, management policy, actual environmental performance and
finally environmental reputation. It investigated a combination of key constructs that
constitute corporate environmental management (CEM) in a single study. It then focused on
the challenges brought about by the MNC’s network dimensions, drawing from network
theory, corporate environmental management, and HQ-Subsidiary management literatures.
109
The potential contributions of this study can be categorized under theoretical, empirical, and
managerial aspects.
Theoretical Contributions: The paper aims to contribute to CEM and CEM implementation
focusing on the MNC-subsidiary network management literatures. While prior research has
focused on the relationship between MNC subsidiary network structure and financial
performance (Markides & Williamson, 1996; Mauri, 2009, Pitts, 1977), or the relationship
between environmental performance and financial performance (Dowell, Hart & Yeung,
2000; Bansal & Clelland, 2004; Nakao, et al. 2007), this study sought to respond to the call
for research that investigates the impact of MNC international networks of subsidiaries on
environmental practices (Rodriguez, Siegel, Hillman, & Eden, 2006). In addition, this study
introduced a new construct, “Environmental Institutional Diversity”, calling for the
importance of investigating environmental institutional variation and not only the difference
between home and host based institutions. Finally, it created a conceptual typology of firms
based on their subsidiaries’ host institutional contexts and MNC GEP presented in a two x
two matrix describing firms as either compliant, exploiter, agent of change or green
competent.
Empirical Contributions: The unit of analysis being the MNC’s subsidiary network is likely
to reveal value-adding insights about firm behavior, which may not be visible when we are
analyzing either HQ or individual subsidiaries (Gruber, Heinemann, Brettel & Hungeling,
2010; Miller, 1981). The majority of research in the HQ-subsidiary domain has taken a one-
sided perspective, arguing either the HQ or subsidiary perspectives (Birkinshaw, 2001; Doz
110
& Prahalad, 1993; Kaufmann & Roessing, 2005, Schotter & Beamish, 2005), while this
paper focus on the network, the systemic level of analysis, to analyze behavior of the
organization (Gupta & Govindarajan, 2000; Ghoshal & Bartlett, 1990). While earlier studies
have used single industry survey data to gauge the environmental performance of firms, this
study uses a continuous variable reflecting quantified assessment of companies’ actual
environmental footprint across multiple sectors within manufacturing. The data provided for
the analysis of this study combines both qualitative and quantitative measures, drawing from
a number of prominent data providers in the area of CSR/environmental management
(Trucost, MSCI ESG (former KLD data providers), Corporate Register) using a relatively
“new” database. The paper also develops a new approach to measuring “geographic
dispersion” which is driven by the network complexity lens. Finally, the study uses
hierarchical cluster analysis to segment MNCs on dimensions of environmental
management/performance and network dimensions. Through such clustering, scholars can
distinguish between who is actually performing in the right direction versus those who have
put policies in place but have not performed. This also paves the road for future studies to dig
deeper into the challenges these firms deal with as a result of the dimensions of their
subsidiary networks.
Managerial Contributions: As MNCs expand into more diverse markets, creating more
complex inter-organizational networks, it becomes very timely to better understand how their
inter-organizational networks can challenge smooth CSR strategy implementation. Particular
to global environmental practices and taking a strategic perspective, the increased trend of
green consumerism and standardized environmental regulations across host market has made
111
firms’ efforts to globally standardize environmental practice an imperative to successful
operations. Furthermore, from a stakeholder perspective, the MNC’s global operations are
today under even more scrutiny, and global social/environmental performance is a key
component of their legitimacy in both home and host markets.
Future Studies
Overall, the value of the presented VMPR research model lies in its ability to examine not
just environmental performance but a multitude of MNC strategies. This can include the
adoption of best practices related to other timely firm priorities and not only that of
environmental performance. Therefore, the VMPR is quite a comprehensive framework that
is likely to be used by a number of scholars to investigate a number of phenomena.
The presented research model in this study is likely to lead to a number of future papers
investigating different parts of the model. In addition, future versions of the paper can test the
model investigating deeper key industries while combining industry reports and trends to
understand how the model can explain industry specific phenomena. In addition, upcoming
extensions of this study can incorporate internal unit diversity, which will be measured by the
degree of variation at the subsidiary level in industry scope, using the Corporate Affiliations
(Lexis Nexus) database. It would also be interesting to examine how network complexities
can impact the relationship between GEP and environmental reputation, which is best carried
out utilizing a longitudinal research design in order to capture the lag effect on reputation.
112
Future extensions of this study can also examine the VMPR framework and research model
using other units of analysis. For example, while subsidiary networks were the focus of this
study, extensions can analyze phenomena at the team level examining the effectiveness of
team structure.
Limitations
The study is limited by the unavailability of environmental performance data at the
subsidiary level, which if incorporated, would yield a better specified model. To strengthen
the causal relationship, time series analyses is likely to be useful. Therefore the use of a cross
sectional dataset at this stage of the research can be seen as a limitation of the study.
Furthermore when predicting reputation, lag effects need to be accounted for, which was
restricted by data availability in this study. The dependent variable of Global Environmental
Performance is available for the last 8 years, but needs to be purchased. A valid critique of
the proposed research model would be the need to account for other factors to arrive at a
better specified model. Some of these key constructs which may impact the relationships
studied can include degree of decentralization of MNC and subsidiary level management
variables.
Perhaps there may be other sources of complexity that overpower of impact of our three
network diversity variables which are not measured in this study. These key elements, such
as subsidiary level management/control systems, are best captured by survey data. A verbal
commitment measure can also be captured by collecting other forms of corporate verbal
communications which include 10 K reports as well as shareholder letters. In addition the
113
content analysis done on the mission statement was analyzed by the primary investigator.
Although it only involved the search of key words, it is only the result of a single rater. The
accuracy of this measure could have benefited from conducting inter-rater reliability analysis
and therefore may be acknowledged as a limitation in the study (Krippendorff, 2003).
While multiple regression analysis has been used by multiple scholars to analyze MNC
networks, using network analysis (Ucinet) is likely to allow for capturing interunit
phenomena. Furthermore, using structural equation modeling is also likely to increase the
accuracy of the network diversity results which tested latent variables because of its
effectiveness in decreasing measurement errors (Cheng, 2001).
114
LIST OF REFERENCES
Abdelzaher, D. Schneper,W. & Douglas Fernandez, W. (2012). The institutional drivers of transnational institutions: United nations global compact and the worldwide diffusion of corporate social responsibility, Working Paper. Fraj-Andrés,E., Martínez-Salinas, E., & Matute-Vallejo, J. (2009). Factors Affecting Corporate Environmental Strategy in Spanish Industrial Firms. Business Strategy and the Environment, 18, 500–514. Aguilera-Caracuel, J., Aragón-Correa, J.A., & Hurtado-Torres, N. E. (2011). Extending the literature on the environmental strategy of MNEs. Multinational Business Review, 299-310. Aguilera-caracuel, J., Aragón-Correa, J. A., Hurtado-Torres, N. E. & Rugman, A. M. (2012). The Effects of Institutional Distance and Headquarters' Financial Performance on the Generation of Environmental Standards in Multinational Companies. Journal of Business Ethics, 105 (4), 461-474. Aiken, L. S., & West, S. G. (1991). Multiple regression: Testing and interpreting interactions. Newbury Park, CA: Sage. Akiyama, T. (2010). CSR and inter-organisational network management of corporate groups: Case study on environmental management of Sekisui House Corporation Group. Asian Business & Management, 9 (2), 223–243. Alexander, E. R. (1998). A structuration theory of interorganizational coordination: Cases in environmental management. International Journal of Organizational Analysis, 6 (4), 334-354. Allen, P.M. (2001). A complex systems approach to learning in adaptive networks. International Journal of Innovation Management, 5 (2), 149-180. Alter, C., & Hage, J. (1993): Organizations Working Together. Newbury Park: Sage. Amato, C. H., & Amato, L. H. (2002). Corporate commitment to quality of life: Evidence from company mission statements. Journal of Marketing Theory and Practice, l, 69-87. Ambos, B., & Schlegelmilch, B. B. (2007). Innovation and control in the multinational firm: A comparison of political and contingency approaches. Strategic Management Journal, 28 (5), 473-486. Anderson, Philip, (1999). Complexity theory and organization science. Organization Science, 10 (3) , 216-232.
115
Andrews, R.N.L., Amaral, D., Darnall, D., Gallagher, D.R., Edwards, D., Hutson, A., D'Amore, C., Sun, L. & Zhang, Y. (2003) Environmental Management Systems: Do They Improve Performance? The University of North Carolina: Chapel Hill, NC Andrew, A., King, J., & Myles, S. (2001). Are Aliens Green? Assessing Foreign Establishments' Environmental Conduct in the United States. Strategic Management Journal, 22 (11), 1069-1085. Andersson, U., Forsgren, M., & Holm, U., (2001). Subsidiary embeddedness and competence development in MNCs -- A multi-level analysis. Organization Studies, 22 (6), 1013-23. Aragon-Correa, J. A. (1998). Strategic proactivity and firm approach to the natural environment. Academy of Management Journal, 41, 556-567. Aragon-Correa, J. & Sharma, S. (2003). A Contingent Resource-Based View of Proactive Corporate Environmental Strategy. Academy of Management Review, 28 (1), 71–88. Bandura, A. (1991). Social Cognitive Theory of Self-Regulation. Organizational behavior and human decision processes, 50, 248-287. Bansal, P., & Clelland, I. (2004). Talking Trash: Legitimacy, Impression Management, and Unsystematic Risk in the Context of the Natural Environment, Academy of Management Journal, 47 (1), 93–103. Bansal, P., & Kistruck, G. (2006). Seeing is (not) believing: managing the impressions of the firm's commitment to the natural environment. Journal of Business Ethics, 67,165-80. Barin-Cruz, L., & Pedrozo.E.A. (2009). Corporate social responsibility and green management: Relation between headquarters and subsidiary in multinational corporations. Management Decision, 47 (7), 1174-1199. Barin Cruz, Luciano; Boehe, Dirk Michael. (2010). How do Leading Retail MNCs Leverage CSR Globally? Insights from Brazil. Journal of Business Ethics, 91 : 243-263. Barney, J., & Hesterly, W. 2012. Strategic Management and Competitive Advantage Fouth Edition: Concepts and Cases. Pearson Education Inc, NJ: Prentice Hall. Bartlett, C., Ghoshal, S. (1989). Managing across borders: The transnational solution. Boston, MA: Harvard Business School Press. Bartlett, C., Ghoshal, S. (1994). Changing the Role of Top Management: Beyond Strategy to Purpose. Harvard Business Review, 72 (6), 79-88.
116
Bartkus, B. R & Glassman, B. (2008). Do Firms Practice What They Preach? The Relationship Between Mission Statements and Stakeholder Management. Journal of Business Ethics, 83, 207–216. Battram, A. (1996) The complexities: A Lexicon of Complexity, London, Local government management Board. Behrend. T. S., Baker. B. A., & Thompson, L.F. (2009). Effects of Pro-Environmental Recruiting Messages: The Role of Organizational Reputation. Journal of Business Psychology, 24, 341–350 Berman, S. L., Wicks, A.C. Kotha, S., & Jones, T.M. (1999). Does Stakeholder Orientation Matter? The Relationship between Stakeholder Management Models and Firm Financial Performance. Academy of Management Journal, 42 (5), 488-506 Berrone, P., & Gomez-Mejia, L.R. (2009). Environmental Performance and Executive Compensation: An Integrated Agency-Institutional Perspective. Academy of Management Journal, 52 (1), 103–126. Birdsall, N., & Wheeler, D. (1992). Trade policy and industrial pollution in Latin America: Where are the pollution havens? In P. Low (Ed.), International trade and the environment (World Bank Paper No. 159, 159-167). Washington, DC: World Bank. Birkinshaw, J. M. (2001). Strategies for managing internal competition. California Management Review, 44, 21-38. Bouquet, C., & Birkinshaw, J., (2008). Weight versus voice: how foreign subsidiaries gain attention from corporate headquarters. Academy of Management Journal, 51(3), 577. Birkinshaw, J., Hood, N., & Jonsson, S., (1998). Building firm-specific advantages in multinational corporations: the role of subsidiary initiative. Strategic Management Journal, 19 (3), 221. Birkinshaw, J., Hood, N., (1998). Multinational subsidiary evolution: Capability and charter change in foreign. Academy of Management Review; 23 (4), 773 Birkinshaw, J., & Nobel, R. 1998. Innovation in multinational corporations: control and communication .Strategic Management Journal, 19 (5), 479. Brass, D. J., Galaskiewicz,J., Henrich R. G., & Tsai, W. (2004). Taking Stock of Networks and Organizations: A Multilevel Perspective. The Academy of Management Journal, 47 (6), 795-817. Brodbeck, P. W. (2002). Complexity theory and organization procedure design.
117
Business Process Management Journal, 8 (4), 377. Brown, H.S., Derr, P., Renn, O., & White, A.L. (1993). Corporate environmentalism in a global economy: Societal values in international technology transfer. Westport, CT: Quorum Books. Business Wire (2010). Research and Markets: Understand The Factors That Are Driving The Growth Of Green Consumerism In The US with 2010 Report Green Consumers in the US. Buysse, K., & Verbeke, A. (2003). Proactive environmental strategies: A stakeholder management perspective. Strategic Management Journal, 24 (5), 453-470. Behrend, T, S & Baker, B. A. (2009). Effects of Pro-Environmental Recruiting Messages: The Role of Organizational Reputation. Bus Psychology, 24, 341–350. Byrns, E.(1994). A model for a firm's optimal environmental policy. The Engineering Economist, 39 (3), 249. Campbell, A. (1992). A Sense of Mission: Defining Direction for the Large Corporation, Reading: MA: Addison-Wesley Publishing Company. Campbell, A. (2007). Why Would Corporations Behave in Socially Responsible Ways? An Institutional Theory of Corporate Social Responsibility. The Academy of Management Review, 32 (3), 946-967. Carayol, N., & Roux, P. (2009). Knowledge flows and the geography of networks: A strategic model of small world formation. Journal of Economic Behavior & Organization, 71 (2), 414. Cardinal L. 2001. Technological innovation in the pharmaceutical industry: the use of organizational control in managing research and development. Organization Science 12(1), 19–36. Carnicross, F. (1992). Costing the Earth. Harvard Business School Press: Boston, MA, 1992. Corporate Governance Indicators: http://www.developmentdata.org/governance.htm Castells, Manuel. (1996). The Rise of the Network Society. Cambridge, MA & Oxford, UK: Blackwell. Casti, J., (1994). Complexification: Explaining a Paradoxical World Through the Science of Surprise. HarperCollins, New York.
118
Chandler, A. D. (1998). Strategy and Structure. Cambridge, MA: MIT Press paperback edition20th printing (1st ed. 1962). Chandler,A.D. (1962). Strategy and structure - Chapters in the History of the Industrial Enterprise, MIT Press United States ISBN 026253009. Chang, E & Taylor, M S (1999). Control in Multinational Corporations (MNCs): The Case of Korean Manufacturing Subsidiaries. Journal of Management, 25(4), 541-565. Cheng, E. W. L. (2001). SEM being more effective than multiple regression in parsimonious model testing for management development research. The Journal of Management Development, 20 (7), 650-667. Chen, D., Park, S. & Newburry, W. (2009). Parent Contribution and Organizational Control in International Joint Ventures. Strategic Management Journal, 30(11), 1133-1156. Child, J. (2005). Organization: Contemporary Principles and Practice. Cornwall: Blackwell Publishing. Cho, K. R., & Lee, J. (2004). Firm Characteristics and MNC's Intra-network Knowledge Sharing. Management International Review, 44 (4), 435-455. Cho, C.H., Guidry, R., Hageman, A.M., & Patten, D. (2012). Do actions speak louder than words? An empirical investigation of corporate environmental reputation. Accounting, Organizations and Society, 37 (1), 14-25. Choi, C.B., & Beamish, P.W. 2004. Split management control and international joint venture performance. Journal of International Business Studies, 35 (3), 201–215. Christmann, P., & Taylor, G. (2001). Globalization and the environment: Determinants of firm self-regulation in China. Journal of International Business Studies, 32 (3), 439. Christmann, P. (2000). Effects of 'best practices' of environmental management on cost advantage: the role of complementary assets. Academy of Management Journal, 43 (4), 663-80. Christmann, P. (2004). Multinational companies and the natural environment: determinants of global environmental policy standardization. Academy of Management Journal, 47 (5), 747-60. Christmann, P., & Taylor, G. (2001). Globalization and the environment: Determinants of firm self-regulation in China. Journal of International Business Studies, 32 (3), 439-458.
119
Christmann, P., & Taylor, G. (2006). Firm self-regulation through international certifiable standards: determinants of symbolic versus substantive implementation. Journal of International Business Studies, 37 (6), 863-878. Christos, P. (2001). Does Location Matter? An Empirical Analysis of Geographic Scope and MNC Market Valuation. Journal of International Business Studies, 32 (1), 133-155. Clemens, B., & Bakstran, L., (2010). A framework of theoretical lenses and strategic purposes to describe relationships among firm environmental strategy, financial performance, and environmental performance. Management Research Review, 33 (4), 393-405. Cohen., & Stewart, I. (1994). The Collapse of Chaos: Discovering Simplicity in a Complex world, Penguin Books, ISBN 978-0-14-029125-4. Cormier, D., Gordon, I., & Magnan, M. (2004). Corporate Environmental Disclosure: Contrasting Management's Perceptions with Reality. Journal of Business Ethics, 49 (2), 143-165. Cornell, B., & Shapiro, A. (1987). Corporate stakeholders and corporate finance. Financial Management, 16, 5–14 Cortina, J., Chen, G., & Dunlap, W. (2001).Testing Interaction Effects in LISREL: Examination and Illustration of Available Procedures. Organizational Research Methods, 4 (4), 324-360. Daft, R., & Lewin, A. (1990). Can organizational studies begin to break out of the normal science straitjacket? Organization Science, 1 (2), 1-9. Dasgupta, S., Hettige, H., & Wheeler, D. (2000). What improves environmental performance? Evidence from Mexican industry. Journal of Environmental Economics and Management, 3 (9), 39-66. Dawkins, C., & Fraas, J. W. (2011). Coming Clean: The Impact of Environmental Performance and Visibility on Corporate Climate Change Disclosure. Journal of Business Ethics, 100 (2) , 303-322. David, F.R. (2009). Strategic Management: Concepts and Cases (Twelfth Edition). Upper Saddle River, NJ: Pearson Prentice Hall. David, F. R. (1989). How Do Companies Define Their Mission? Long Range Planning, 22 (1), 90-97. David, S., (2001).Varieties of capitalism: the institutional foundations of comparative advantage. PA Hall - Oxford: Oxford University Press.
120
Dechant, K., & Altman, B. (1994). Environmental leadership: From compliance to competitive advantage. Academy of Management Executive, 8 (3), 7-27. Delmas, M., & Montiel, I. (2008). The Diffusion of Voluntary International Management Standards: Responsible Care, ISO 9000, and ISO 14001 in the Chemical Industry, Policy Studies Journal, 36 (1), 65-93. Delmas, M., & Toffel, M.W. (2004). Stakeholders and environmental management practices: an institutional framework .Business Strategy and the Environment, 13 (4), 209. DiMaggio, P.J., & Powell,W.W. (1983). The Iron Cage Revisited: Institutional Isomorphism and Collective Rationality in Organizational Fields. American Sociological Review, 48 (2), 147-160. Donaldson, T. & Preston, L. E. (1995). The Stakeholder Theory of the Corporation: Concepts, Evidence and Implications. Academy of Management Review, 20 (1), 65–91. Dowell, G., Hart, S. & Yeung, B. (2000). Do corporate environmental standards create or destroy market value? Management Science, 4 (6), 1059-1074. Dörrenbächer, C., & Gammelgaard, J. (2010). Multinational corporations, inter-organizational networks and subsidiary charter removals. Journal of World Business, 4 (5), 206-216. Doz, Y., & Prahalad, C. K. (1993). Managing MNCs: A search for a new paradigm. In S. Ghosha and D. E. Westney (Eds), Organization theory and the multinational corporation: 24-50. London: Macmillan. Dunning, J. H. (1988). The Eclectic Paradigm of International Production: A Restatement and Some Possible Extensions. Journal of International Business Studies. 19 (1), 1-31. Dunning, J. H. (1993). Multinational Enterprises and the Global Economy. Wokinghan England: Addison-Wesley theories of MNE activity. International Business Review, 9, 163-90. Dunning, J., & Rugman, A., (1985). The Influence of Hymer's Dissertation on the Theory of Foreign Direct Investment. The American Economic Review, 75 (2), Papers and Proceedings of the Ninety-Seventh Annual Meeting of the American Economic Association, pp. 228-232. Eccles, T, (1993). Implementing Strategy: two reviosionst perspectives, in Hendy J, Johnson, G. and Newton, J. (eds) Strategic Thinking: Leadership and the Management of Change, Chichester: John Wiley.
121
Eden, L.,& Lenway, S. (2001). Introductions. to the Sympoposium: The Janus Face of Globalization. Journal of International Business Studies, 32 (3), 383-400. Elsayed, K. (2006). Reexamining the expected effect of available resources and firm size on firm environmental orientation: An empirical study of UK firms. Journal of Business Ethics, 65, 297–308. Environmental Performance Index (EPI): (http://epi.yale.edu/Countries). Fergus, A.H. & Rowney, J. (2005). Sustainable Development: Lost Meaning and Opportunity? Journal of Business Ethics, 60 (1), 17-27. Fischer, K., & Schot, J. eds. (1993). Environmental Strategies for Industry: International Perspectives on Research Needs and Policy Implications. Washington, DC: Island Press Fombrun, C., & Shanley, M. (1990). What’s in a name? Reputation building and corporate strategy. Academy of Management Journal, 33, 233–258. Frances, J., Milliken, L., & Martins, L. (1996). Searching for Common Threads: Understanding the Multiple Effects of Diversity in Organizational Groups. The Academy of Management Review, 21 (2), 402-433. Friedman, W.G., & Beguin, J. P. (1971). Joint International Business Ventures In Developing countries, New York, Columbia University Press. Galbraith,G. & Kazanjian, R. (1986). Organizing to implement strategies of diversity and globalization: the role of matrix designs. Human Resource Management, 25 (1), 37-54. Geringer, J. M., & Hebert, L. (1989).Control And Performance of International Joint Ventures. Journal of International Business Studies, 20 (2), 235. Ghoshal, S., Bartlett, C.A. (1990). The Multinational Corporation as an Interorganizational Network. The Academy of Management Review, 15 (4), 603-625. Ghoshal, S. & Bartlett, C.A. (2005). The multinational corporation as an interorganizational network, in Birkinshaw, J. and Piramal, G. (Eds), Sumantra Ghoshal on Management: A Force for Good, Prentice-Hall, London, pp. 71-104. Ghoshal, S., Nohria, N. (1989).Internal differentiation within multinational corporations. Strategic Management Journal, 1: 323–337.
122
Gilbert, D.U., & Rasche, A. (2008). Special section accountability in a global economy: The Emergence of International Accountability Standards to Advance Corporate Social Responsibility. Journal of Business Ethics, 82(3), 755-773. Gilbert, D.U, Rasche, A., & Waddock, S. (2011).Accountability in a Global Economy: The Emergence of International Accountability Standards. Business Ethics Quarterly, 21 (1), 23-44. Gladwin, T.N. (1987). Environment, development and multinational enterprises. In C.S. Pearson (Ed.), Multinational Corporations, Environment, and the Third World: 3-34, Durham, NC: Duke University Press. Ghemawat, P. (2001). Distance still matters: the hard reality of global expansion. Harvard Business Review, 79 (8), 137-147. Ghoshal, B. (1989). Internal differentiation within multinational corporations. Strategic Management Journal, 10 (4), 323-337. Gomes, L., & Ramaswamy, K. (1999). An empirical examination of the form of the relationship between multinationality and performance. Journal of International Business Studies, 30 (1), 173-188. Granovetter, M. (1985). Economic action and social structure: The problem of embeddedness. American Journal of Sociology, 91 (3), 481-510. Grant, R.M. (1991). The resource-based strategy theory of competitive advantage: implications for strategy formulation. California Management Review, 33(3), 114-135. Grant, R.M. (2008). Contemporary Strategy Analysis 6th edition. Blackwell Publishing Ltd.UK. Gray, W.B., & Deily, M.E. (1996). Compliance and enforcement: Air pollution regulation in the U.S. steel industry. Journal of Environmental Economics and Management, 31 (1), 96. Green Policy Score: (http://www.thedailybeast.com/newsweek/2010/10/18/green-rankings-2010-full-methodology.html). Green Ranking Methodology 2010. (http://www.thedailybeast.com/newsweek/2010/10/18/green-rankings-2010-full-methodology.html). Geringer, J.M. (1986). Criteria for Selecting Partners for Joint Ventures in Industrialized Market Economies." Ph.D. diss., University of Washington.
123
Grossman, G., & Krueger, A. (1995). Economic growth and the environment. Quarterly Journal of Economics, 110 (2), 353-377. Gruber, M., Heinemann, F., Brettel, M., & Hungeling, S. (2010). Configurations of resources and capabilities and their performance implications: an exploratory study on technology ventures. Strategic Management Journal, 31 (12), 1337. Guidry, R.P & Patten, D.M. (2010). Newsweek’s measure of corporate environmental reputation and the ‘financial halo effect’. Social and Environmental Accountability Journal, 30 (1). Gupta, A.K. & Govindarajan, V. (2000). Knowledge flows within multinational corporations. Strategic Management Journal, 21,473-496 Hair, J. F., & Black, W. C. (2000). Cluster analysis. In L. G. Grimm & P. R. Yarnold (Eds.), Reading and understanding more multivariate statistics (pp. 147-205). Washington, DC: American Psychological Association Hart, S. (1995). A Natural-Resource-Based View of the Firm. Academy of Management Review, 20 (4), 986-1014. Harzing, A.W. (1999). Managing the Multinationals: An International Study of Control Mechanism. Cheltenham, UK: Edard Elgar. Harzing, A.W. (2002). Acquisitions versus greenfield investments: International strategy and management of entry modes. Strategic Management Journal, 23 (3), 211. Haverkamp, D., Bremmers, H., & Omta, O. (2010). Stimulating environmental management performance: Towards a contingency approach. British Food Journal, 112 (11) , 1237-1251. Hedlund, G. (1986). The hypermodern MNC: A heterarchy? Human Resource Management, 2 (5), 9-36. Hedlund, G., & Rolander, D. (1990). Action in hierarchies : New approaches to managing the MNC. In C.A. Bartlett, Y. Doz, & G. Hedlund (Eds.), Managing the global firm (pp. 15-46). London: Routledge. Hill, C. & Jones, G. (2008). Strategic Management, Houghton Mifflin Company, New York, NY. Henriques, I., & Sadorsky, P. (1996). The Determinants of an Environmentally Responsive Firm: An Empirical Approach. Journal of Environmental Economics and Management, 30 (3), 381-95.
124
Herrmann, P. (2006). CEO Experiences.Effects on the Choice of FDI Entry Mode. Journal of Management Studies, 43 (4), 755-778. Hoffman, A. J. (2001). Linking organizational and field - level analyses: The diffusion of corporate environmental practice. Organization & Environment, 14 (2), 133-156. Holm, U., & Pedersen, T. (2000). The Emergence and Impact of MNC Centres of Excellence, Macmillan Press: London. Huang, X., (2011). Corporate control by Chinese MNCs over their foreign subsidiaries: combining institutional and resource-based perspectives. Labour & Industry, 22 (1), 169-191. Hunter, T., & Bansal, P. (2007). How Standard is Standardized MNC Global Environmental Communication? Journal of Business Ethics, 71, 135–147. Hymer, S. H. (1976). The international operations of national firms. Cambridge, MA: MIT Press. Hymer, S. H. (1960). The International operations of national firms, a study of direct foreign investment. Massachusetts Institute of Technology, Dept. of Economics. Hymer, S. (1970). The Efficiency (Contradictions) of Multinational Corporations. The American Economic Review, 60 (2), Papers and Proceedings of the Eighty-second Annual Meeting of the American Economic Association (May, 1970), pp. 441-448. Isabelle, M., & Ralston, D. A. (2002). Corporate Social Responsibility in Europe and the U.S.: Insights from Businesses' Self-Presentations. Journal of International Business Studies. 33 (3), 497-514. Jackson, G. & Deeg, R. (2008). Comparing capitalisms: understanding institutional diversity and its implications for international business. Journal of International Business Studies, Part Special Issue: Institutions and International Business, 39 (4), 540-561. Jaccard, J., & Turrisi, R. (2003). Interaction Effects in Multiple Regression, Second Edition. Quantitative Applications in the Social Sciences Series Volume 72, SAGE Publications, Inc. Jamali, D. (2010). The CSR of MNC Subsidiaries in Developing Countries: Global, Local, Substantive or Diluted? Journal of Business Ethics, 2 (93), 181-200. Jon, I., Martinez, J., & Carlos, J. (1991). Coordination Demands of International Strategies. Journal of International Business Studies, 22 (3), 429-444.
125
Kaufmann, L., & Roessing, S. (2005). Managing conflict of interests between headquarters and their subsidiaries regarding technology transfer to emerging markets: A framework. Journal of World Business, 40 (3), 235–253. Kennelly, J. J., & Lewis, E.E. (2002). Degree of internationalization and corporate environmental performance: Is there a link? International Journal of Management, 19 (3), 478-489. King, A.A., Lenox, M.J., & Terlaak, A. (2005). The strategic use of decentralized institutions: exploring certification with the ISO 14001 management standards. Academy of Management Journal, 48 (6), 1091-1106. King, D. L., Case, C. J, & Premo, K. M. (2010). Current mission statement emphasis: be ethical and go global. Academy of Strategic Management Journal, 9, 71-87. King, A. & Shaver, M. (2001). Are aliens green? Assessing foreign establishments’ environmental conduct in the U.S. Strategic Management Journal, 22(11), 244-256. Klassen, R.D. & McLaughlin, C.P. (1996). The impact of environmental management on firm performance. Management Science, 42 (8), 1199-213. Kogut, B,. & Zander, U. (1995). Knowledge, market failure and the multinational enterprise: A reply, Journal of International Business Studies, 26 (2), 417. Kolk, A. (2005). Environmental Reporting by Multinationals from the Triad: Convergence or Divergence. Management International Review, 45 (1), 145-166. Kolk, A., & Pinkse, J. (2008). A perspective on multinational enterprises and climate change: Learning from‘‘an inconvenient truth’’? Journal of International Business Studies, 39, 1359–1378. Kolk A., & Perego P. (2010). Determinants of the adoption of sustainability assurance statements: An international investigation. Business Strategy and the Environment, 19(3), 182–198. Konar, S., & Cohen, M.A. (2001). Does the market value environmental performance? Review of Economics and Statistics, 83 (2), 281–289. Kostova, T. (1998). Success of the transnational transfer of organizational practices within multinational companies. Research Paper Series No. 98-4, Carnegie Bosch Institute, Carnegie Mellon University. Kostova, T. (1999). Transnational transfer of strategic organizational practices: A contextual perspective. Academy of Management Review, 24 (2), 308-324.
126
Kostova, T., & Roth, K., (2002). Adoption of an organizational practice by subsidiaries of multinational corporations: Institutional and relational effects. Academy of Management Journal, 45 (1), 215-233. Kostova, T., & Zaheer, S. (1999). Organizational Legitimacy under Conditions of Complexity: The case of the Multinational Enterprise. Academy of Management Review, 24 (1), 64-81. KPMG 2008 Sustainability Report Study, Business and the Environment 19. 12 (Dec 2008): 6-7. Krippendorff, K. H. (2003). Content Analysis: An Introduction to Its Methodology Second edition. Sage Publications: California. Kwok, C., & Tadesse, S. (2006). The MNC as an agent of change for host-country institutions: FDI and corruption. Journal of International Business Studies, 37 (6), 767-785. Laine, M. (2005). Meanings of the Term ‘‘Sustainable Development’’ in Finnish Corporate Disclosures, Accounting Forum, 29, 395–413. Lenn, G., & Kannan, R. (1999). An Empirical Examination of the Form of the Relationship between Multinational and Performance. Journal of International Business Studies, 30 (1), 173-187. Levinson, A., & Taylor, M.S. (2008). Unmasking the Pollution Haven Effect. Inter-national Economic Review, 4(9), 223-254. Levinthal, D. (1997). Adaptation on Rugged Landscapes. Management Science, 43, 934–950. Levy, D. L. (2000). Applications and Limitations of Complexity Theory in Organization Theory and Strategy", in Jack Rabin, Gerald J. Miller, and W. Bartley Hildreth (editors), Handbook of Strategic Management, Second Edition, Marcel Dekker, New York. Lewin, A. Y., Massini, S., & Peeters, C. (2009). Why are companies offshoring innovation? The emerging global race for talent. Journal of International Business Studies, 40 (6), 901-925. Lippman S.,& Rumelt R. (1982). Uncertain imitability: an analysis of interfirm differences in efficiency under competition. Bell Journal of Economics, 13, 418-438. Livesey, S.M. & Kearins, K. (2002). Transparent and caring corporations? A study of sustainability reports by The Body Shop and Royal Dutch/Shell, Organization & Environment, 15 (3), 233-58.
127
Love, E., & Kraatz, M. 2009. Character, Conformity, or the bottom line? How and why downsizing affected corporate reputation. Academy of Management Journal, 52 (2), 314 Maak, T. (2008). Undivided Corporate Responsibility: Towards a Theory of Corporate Integrity. Journal of Business Ethics, 82 (2), 353-368. McMillan, E. (2004). Complexity, Organizations and Change. Routledge Markides, C., & Williamson, P.J. (1996). Corporate diversification and organizational structure: A resource based view. Academy of Management Journal, 39 (2), 340. Markides, C. C., (1995). Diversification, restructuring and economic performance. Strategic Management Journal, 16 (2), 101–118. Martinez, J. I. & Jarillo, J. C. (1991). Co-ordination Demands of International Strategies. Journal of International Business Studies, 22 (3), 429-444. Maureen, L., Cropper, W., & Qates, E. (1992). Environmental Economics: A Survey. Journal of Economic Literature, 30 (2), 675-740. Mauri, A. (2009). Influence of MNC Network Configuration Patterns on the Volatility of Firm Performance: An Empirical Investigation. Management International Review, 49 (6), 691-707. McGinn, D. (2009).The greenest big companies in America. Newsweek, 28 (September), 34–54. McMillan, E. (2004). Complexity, Organizations and Change. Routledge.London. McWilliams, A., Siegel, D.,& Wright, P.(2006). Introduction by guest editors corporate social responsibility: international perspectives. Journal of Business Strategies, 23 (1) , 1-7. Menguc, B., Auh, S., & Ozanne, L. (2010). The Interactive Effect of Internal and External Factors on a Proactive Environmental Strategy and its Influence on a Firm's Performance. Journal of Business Ethics, 94 (2) , 279-298. Meyer, J.W., & Rowan, B. (1977). Institutionalized Organizations: Formal Structure as Myth and Ceremony. The American Journal of Sociology, 83 (2), 340-363. Mezias, J. M. (2002). Identifying liabilities of foreignness and strategies to minimize their effects: The case of labor lawsuit judgments in the United States. Strategic Management Journal, 23, 229-244. Miller, D. (1987) The Structural and Environmental Correlates of Business Strategy. Strategic Management Journal, 8 (1), 55-76.
128
Miller, D. (1981). Toward a new contingency perspective: the search for organizational gestalts. Journal of Management Studies, 1 (8), 1–26. Miller S., & Eden, L. (2006). Local density and foreign subsidiary performance. The Academy of Management Journal, 49, (2), 341-355. Mintzberg, H., & Waters, J.A. (1985). Of Strategies, Deliberate and Emergent: Summary. Strategic Management Journal, 6 (3), 257. Mischen, P.A., & Jackson, S. K. (2008). Connecting the dots: applying complexity theory, knowledge management and social network analysis to policy implementation. Public Administration Quarterly, 32 (3), 314-338. Mitchell, Colin (2002). Selling the brand inside. Harvard Business Review, 5-1 1. Mitchell, L. D. & Ramey, W. D. (2011). Look How Green I Am! An Individual-Level Explanation for Greenwashing.The Journal of Applied Business and Economics, 12 (6 ): 40-45. Mitchell, R. K., Agle, B. R., & Wood, D.J. (1997).Toward a Theory of Stakeholder Identification and Salience: Defining the Principle of Who and What Really Counts, Academy of Management Review, 22(4), 853–886. Mohan, A. (2006). Global Corporate Social Responsibilities Management in MNCS. Journal of Business Strategies, 23 (1), 9-32. Molina-Azorín, J. F., Claver-Cortés, E., López-Gamero, M., Tarí, J. (2009). Green management and financial performance: a literature review, Management Decision, 47 (7). 1080 - 1100 Moon, C., & Lado, A. (2000). MNC-Host Government Bargaining Power Relationship: A Critique and Extension Within the Resource-Based View. Journal of Management, 2(6), 85. Moon, S. (2008). Corporate Environmental Behaviors in Voluntary Programs: Does Timing Matter? Social Science Quarterly, suppl. Special Issue on the Environment, 89 (5), 1102-1120. Morhardt, J. E. (2010). Corporate social responsibility and sustainability reporting on the Internet. Business Strategy and the Environment, 19 (7), 436. Mueller, M., Gomes dos Santos, V., & Seuring, S. (2009). The contribution of environmental and social standards towards ensuring legitimacy in supply chain governance. Journal of Business Ethics, 89(4), 509–523.
129
Myers, S. & Majluf, N. (1984).Corporate Financing and Investment Decisions when Firms Have Information Investors Do Not Have. Journal of Financial Economics, 13, 198–221. Nakao, Y., Amano, A., Matsumura, K., Geba, K., & Nakano. M. (2007). Relationship between environmental performance and financial performance: an empirical analysis of Japanese corporations. Business Strategy and the Eenvironment, 16 (2), 106. Nelson, R., & Winter, S. (1982). An Evolutionary Theory of Economic Change. Cambridge, MA: Harvard University Press. Netherwood, A. (1996) ‘Environmental Management Systems', in R. Welford (ed.), Corporate Environmental Management: Systems and Strategies (London: Earthscan Publications): 35-57. Netter, J., Wasserman, W., & Kutner, M. (1996). Applied Linear Statistical Models Fourth Edition. Homewood, IL, Irwin. Newburry, W. (2010). Reputation and Supportive Behavior: Moderating Impacts of Foreignness, Industry and Local Exposure. Corporate Reputation Review, 12 (4), 388-405. Newburry, W. & Zeira S. (1997). Generic differences between equity international joint ventures (EIJVs), international acquisitions (IAs) and international greenfield investments (IGIs) Implications for parent companies. Journal of World Business, 32 (2), 87-102. Newburry, W. & Zeira, Y. (1999). Autonomy and Effectiveness of Equity International Joint Ventures: A Comparative Analysis of Hungary and Britain. Journal of Management Studies, 36 (2), 263 – 285. Newburry, W., Zeira, Y., & Yeheskel, O. (2003). Autonomy and effectiveness of equity international joint ventures (IJVs) in China. International Business Review, 12 (4), 395-419. Newton, T., & Harte, G. (1997). Green business: technicist kitsch? Journal of Management Studies, 34(1) 75-98. O’Donnell, S. (2000). Managing Foreign Subsidiaries: Agents of Headquarters, or an Interdependent Network? Strategic Management Journal, 21(5), 525–548. Onkila, T.J. (2009). Corporate Argumentation for Acceptability: Reflections of Environmental Values and Stakeholder Relations in Corporate Environmental Statements. Journal of Business Ethics , 87 (2), 285-298.
130
Panda, A., & Gupta, R.K. (2003). Why mission statements become a show piece? Case of an Indo-American joint venture. Vikalpa, 28 (2), 23-47. Pantzalis, C., (2001). Does location matter? An empirical analysis of geographic scope and MNC market valuation. Journal of International Business Studies. 32 (1), 133-155. Pantzalis, C., B.J. Simkins, & Laux, P. (2001). Operational Hedges and the Foreign Exchange Exposure of US Multinational Corporations. Journal of International Business Studies, 32, 793-812. Pascale, R. T. (1999). Surfing the edge of chaos. Sloan Management Review, spring, 83-94. Payne, D., & Raiborn, C.A. (2001). Sustainable development: The ethics support the economics. Journal of Business Ethics, 32(2), 157. Peng, M.W. (2001) The resource-based view and international business. Journal of Management, 27 (6), 803-829. Penrose, E. (1956). The Theory of the Growth of the Firm. Oxford: Oxford University Press. Pitts, R.A. (1977). Strategies and structures for diversification. Academy of Management Journal, 2(0), 197-208. Porter, M. (1990). The Competitive Advantage of Nations. New York, NY: The Free Press Porter, M. 1985. Competitive Advantage. New York: Free Press. Potoski, M. & Prakash, A. (2005). Green clubs and voluntary governance: ISO 14001 and firms' regulatory compliance. American Journal of Political Science, 49 (2), 235-248. Prahalad, C.K., & Doz, Y. L. (1987). The Multinational Mission, Balancing Global Integration with local Responsiveness. New York: Free Press; London: Collier Macmillan. Prahalad, C.K., & Hamel, G. (1990). The Core Competence of the Corporation. Harvard Business Review, 79-91. Prakash, A. (2000). Greening the Firm: the Politics of Corporate Environmentalism. Cambridge University Press: Cambridge.
131
Raab, J., & Kenis, P. N. (2009) . Heading toward a society of networks: Empirical developments and theoretical challenges. Journal of Management Inquiry, 18(3), 198–210. Ramaswamy, K. (1992). Multinationality and performance: A synthesis and redirection. Advances in International Comparative Management, (7), 241-267. Rappaport, A., Flaherty, M.F. (1992). Corporate responses to environmental challenges: Initiatives by multinational management. New York: Quorum Books. Reid, E. M. & Toffel, M. W. (2009) . Responding to Public and Private Politics: Corporate Disclosure of Climate Change Strategies. Strategic Management Journal. 30, 1157–1178. Rivera, J. P. de Leon. (2004). Is Greener Whiter? Voluntary Environmental Performance of Western Ski Areas. Policy Studies Journal, 32 (3), 417-37. Rodriguez, P., Siegel, D.S., Hillman, A., & Eden, L. (2006). Three lenses on the multinational enterprise: politics, corruption, and corporate social responsibility. Journal of International Business Studies, 37 (6), 733-46. Rogers, E. M. (2003). Diffusion of Innovations ,Fifth Edition., New York: Free Press. Roth, K. & Morrison, A.J. (1990). Implementing global strategy: Characteristics of global subsidiary mandates. Journal of International Business Studies, 21 (4), 541. Roth, K., & Morrison, A.J. (1992). Implementing global strategy: Characteristics of global subsidiary mandates. Journal of International Business Studies 23 (4), 715. Rugman, A.M., & Hodgetts, R. (2001). The End of Global Strategy. European Management Journal. Rugman, A., & Verbeke, A. (1998). Multinational Enterprises and Public Policy. Journal of International Business Studies, 29 (1), 115-136. Rugman, A., & Verbeke, A. (2001). Environmental Policy and International Business. Oxford Handbook of International Business, 22, 537-558. Russo, M.V., & Fouts, P.A. (1997). A resource-based perspective on corporate environmental performance and profitability. Academy of Management Journal, 40 (3), 534. Saha, M. & Darnton, S. (2005). Green Companies or Green Con-Panies: Are Companies Really Green, or Are They Pretending to Be? Business and Society Review, 110 (2), 117–157.
132
Saunders, J.A. (1993). Cluster Analysis for Market Segmentation, European Journal of Marketing, 14 (7), 422-435. Sattari, S., Pitt, L.F., & Caruana, A. (2011). How readable are mission statements? An exploratory study . Corporate Communications. 16 (4 ), 282-292. Schendler, A., & Toffel, M. (2011). The Factor Environmental Ratings Miss . MIT Sloan Management Review, 53 (1) , 17-18. Schotter, A., & Beamish, P.W. (2011). Performance Effects of MNC Headquarters–Subsidiary Conflict and the Role of Boundary Spanners: The Case of Headquarter Initiative Rejection, Journal of International Management, 17 (3), 243-259. Scott, W. R. (1992). Organizations: Rational, Natural and Open Systems. Prentice-Hall, Englewood Cliffs, NJ. Shrivastava, P. (1995). Ecocentric Management for a Risk Society. Academy of Management Review, 20, 118–137. Sinclair P & Walton J. (2003). Environmental reporting within the forest and paper industry. Business Strategy and the Environment, 12: 326–337. Sinding, K. (2000). Environmental management beyond the boundaries of the firm: definitions and constraints . Business Strategy and the Environment, 9(2), 79-91 Smart, B. (Ed.). (1992). Beyond Compliance: A New Industry View of the Environment. Washington, DC: World Resources Institute. Soleimani, A. (2011). Essays on Corporate Reputation: Antecedents and Consequences. Unpublished Doctoral Dissertation. Florida International University. Sorsa, V. (2008). How to explain socially responsible corporate actions institutionally: theoretical and methodological critique. Electronic Journal of Business Ethics and Organizational Studies, 13(1), 32-41. Starik, M. (1995). Should trees have managerial standing? Toward stakeholder status for nonhuman nature. Journal of Business Ethics, 1(4), 207-217. Stopford, J. M.& Wells, L. (1972). Managing the Multinational Enterprise. Organization of the Firm and Ownership of the Subsidiaries, New York: Basic Books. Suchman, M. (1995). Managing legitimacy: Strategic and institutional approaches. Academy of Management Review 20: 571-610.
133
Szulanski, G. (1996). Exploring Internal Stickiness: Impediments to the Transfer of Best Practice within the Firm. Strategic Management Journal, 17, 27-43. Tallman, S., & Li, J.T. (1996). The effects of international diversity and product diversity on the performance of multinational firms. Academy of Management Journal, 39(1), 179-196. Teece, D.J. (1986). Transaction cost economics and the multinational enterprise an assessment. Journal of Economic Behavior and Organization, 7 (1), 21-45. Teece, D. J., Pisano, G., & Shuen, A. (1997). Dynamic capabilities and strategic management. Strategic Management Journal, (18) 7, 509-533. Thacker, J. W., Fields, M. W., & Tetrick, L. E. (1989). The factor structure of union commitment: An application of confirmatory factor analysis. Journal of Applied Psychology, (74), 228– 232. Trucost (2010) What We Do. http://www.trucost.com/ what-we-do. retrieved April 2012 Tsai, T., & Child, J. (1997). Strategic responses of multinational corporations to environmental demands. Journal of General Management, 23(1), 1–22. Tsai, W., (2000). Social capital, strategic relatedness and the formation of intraorganization. Strategic Management Journal, 21 (9), 925. Tsai, W. (2001). Knowledge Transfer in Intraorganizational Networks: Effects of Network Position and Absorptive Capacity on Business Unit Innovation and Performance. The Academy of Management Journal, 44 (5), 996-1004. Van den T. W. M. Brink & Van der Woerd, F. (2004). Industry Specific Sustainability Benchmarks: An ECSF Pilot Bridging Corporate Sustainability with Social Responsible Investments. Journal of Business Ethics, 55 (2), 187-203. Varadarajan, Rajan & Vasudevan, R. (1987). Diversification and Performance: A Reexamination Using a New Two-Dimensional Conceptualization of Diversity in Firms, Academy of Management Journal, 30 (2), 380-393. Waddock, S. (2000). The multiple bottom lines of corporate citizenship: Social investing, reputation, and responsibility audits. Business and Society Review, 105, 323–345. Waddock, S. (2003). Myths and Realities of Social Investing’, Organization and Environment 16 (3), 369–380. Waddock, S.A., & Graves, S.B. (1997). The corporate social performance-financial performance Link. Strategic Management Journal, 18, 303-319.
134
Waldman, D.A., Siegel, D.S., & Javidan, M. (2006). Components of CEO Transformational Leadership and Corporate Social Responsibility. Journal of Management Studies, 43 (8), 1703-1725. Westphal, J.D. & Zajac, E.J. (1994). Substance and symbolism in CEOs' long-term incentive plans. Administrative Science Quarterly, 39 (3), 367-390. Winer, B, J, Brown, D., & Michels, K. M. (1991). Statistical Principles in Experimental Design. Mcgraw-Hills Series in Psychology. Wolf, J., & Egelhoff, W. (2002). A reexamination and extension of international strategy-structure theory. Strategic Management Journal, 23 (2), 181. World Competiveness Report: http://www.weforum.org/issues/global-competitiveness Zaheer, S. (1995). Overcoming the liabilities of foreignness. Academy of Management Journal, 38 (2), 341–363. Zyglidopoulos, S. C. (2002). The social and environmental responsibilities of multinationals: Evidence from the Brent Spar case. Journal of Business Ethics, 36 (1) , 141-151.

135
APPENDICES
136
Appendix 1 – List of Companies in Sample
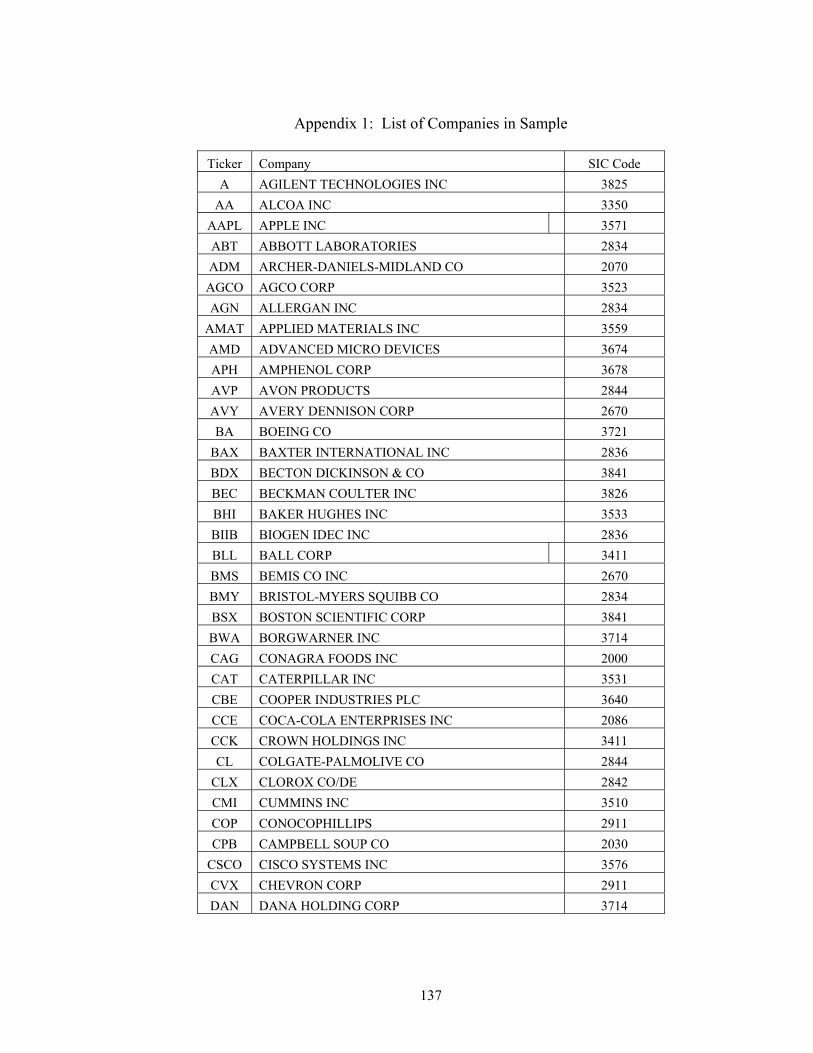
137
Appendix 1: List of Companies in Sample
Ticker Company SIC Code
A AGILENT TECHNOLOGIES INC 3825
AA ALCOA INC 3350
AAPL APPLE INC 3571
ABT ABBOTT LABORATORIES 2834
ADM ARCHER-DANIELS-MIDLAND CO 2070
AGCO AGCO CORP 3523
AGN ALLERGAN INC 2834
AMAT APPLIED MATERIALS INC 3559
AMD ADVANCED MICRO DEVICES 3674
APH AMPHENOL CORP 3678
AVP AVON PRODUCTS 2844
AVY AVERY DENNISON CORP 2670
BA BOEING CO 3721
BAX BAXTER INTERNATIONAL INC 2836
BDX BECTON DICKINSON & CO 3841
BEC BECKMAN COULTER INC 3826
BHI BAKER HUGHES INC 3533
BIIB BIOGEN IDEC INC 2836
BLL BALL CORP 3411
BMS BEMIS CO INC 2670
BMY BRISTOL-MYERS SQUIBB CO 2834
BSX BOSTON SCIENTIFIC CORP 3841
BWA BORGWARNER INC 3714
CAG CONAGRA FOODS INC 2000
CAT CATERPILLAR INC 3531
CBE COOPER INDUSTRIES PLC 3640
CCE COCA-COLA ENTERPRISES INC 2086
CCK CROWN HOLDINGS INC 3411
CL COLGATE-PALMOLIVE CO 2844
CLX CLOROX CO/DE 2842
CMI CUMMINS INC 3510
COP CONOCOPHILLIPS 2911
CPB CAMPBELL SOUP CO 2030
CSCO CISCO SYSTEMS INC 3576
CVX CHEVRON CORP 2911
DAN DANA HOLDING CORP 3714
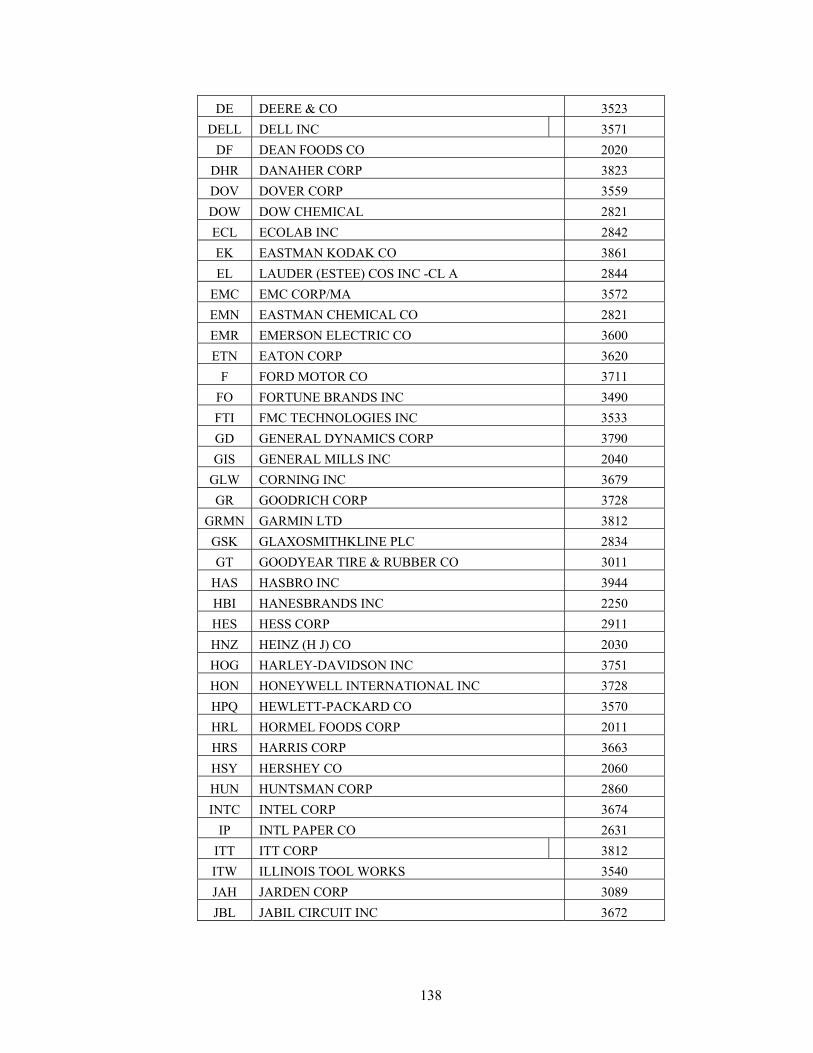
138
DE DEERE & CO 3523
DELL DELL INC 3571
DF DEAN FOODS CO 2020
DHR DANAHER CORP 3823
DOV DOVER CORP 3559
DOW DOW CHEMICAL 2821
ECL ECOLAB INC 2842
EK EASTMAN KODAK CO 3861
EL LAUDER (ESTEE) COS INC -CL A 2844
EMC EMC CORP/MA 3572
EMN EASTMAN CHEMICAL CO 2821
EMR EMERSON ELECTRIC CO 3600
ETN EATON CORP 3620
F FORD MOTOR CO 3711
FO FORTUNE BRANDS INC 3490
FTI FMC TECHNOLOGIES INC 3533
GD GENERAL DYNAMICS CORP 3790
GIS GENERAL MILLS INC 2040
GLW CORNING INC 3679
GR GOODRICH CORP 3728
GRMN GARMIN LTD 3812
GSK GLAXOSMITHKLINE PLC 2834
GT GOODYEAR TIRE & RUBBER CO 3011
HAS HASBRO INC 3944
HBI HANESBRANDS INC 2250
HES HESS CORP 2911
HNZ HEINZ (H J) CO 2030
HOG HARLEY-DAVIDSON INC 3751
HON HONEYWELL INTERNATIONAL INC 3728
HPQ HEWLETT-PACKARD CO 3570
HRL HORMEL FOODS CORP 2011
HRS HARRIS CORP 3663
HSY HERSHEY CO 2060
HUN HUNTSMAN CORP 2860
INTC INTEL CORP 3674
IP INTL PAPER CO 2631
ITT ITT CORP 3812
ITW ILLINOIS TOOL WORKS 3540
JAH JARDEN CORP 3089
JBL JABIL CIRCUIT INC 3672
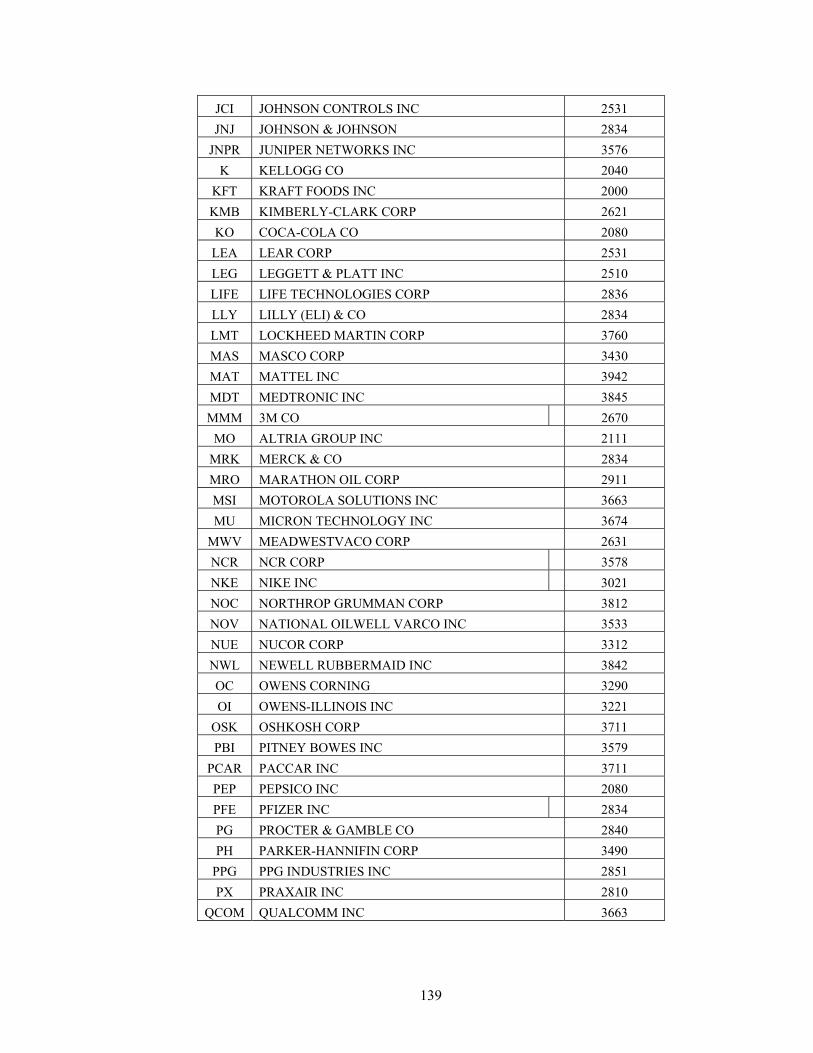
139
JCI JOHNSON CONTROLS INC 2531
JNJ JOHNSON & JOHNSON 2834
JNPR JUNIPER NETWORKS INC 3576
K KELLOGG CO 2040
KFT KRAFT FOODS INC 2000
KMB KIMBERLY-CLARK CORP 2621
KO COCA-COLA CO 2080
LEA LEAR CORP 2531
LEG LEGGETT & PLATT INC 2510
LIFE LIFE TECHNOLOGIES CORP 2836
LLY LILLY (ELI) & CO 2834
LMT LOCKHEED MARTIN CORP 3760
MAS MASCO CORP 3430
MAT MATTEL INC 3942
MDT MEDTRONIC INC 3845
MMM 3M CO 2670
MO ALTRIA GROUP INC 2111
MRK MERCK & CO 2834
MRO MARATHON OIL CORP 2911
MSI MOTOROLA SOLUTIONS INC 3663
MU MICRON TECHNOLOGY INC 3674
MWV MEADWESTVACO CORP 2631
NCR NCR CORP 3578
NKE NIKE INC 3021
NOC NORTHROP GRUMMAN CORP 3812
NOV NATIONAL OILWELL VARCO INC 3533
NUE NUCOR CORP 3312
NWL NEWELL RUBBERMAID INC 3842
OC OWENS CORNING 3290
OI OWENS-ILLINOIS INC 3221
OSK OSHKOSH CORP 3711
PBI PITNEY BOWES INC 3579
PCAR PACCAR INC 3711
PEP PEPSICO INC 2080
PFE PFIZER INC 2834
PG PROCTER & GAMBLE CO 2840
PH PARKER-HANNIFIN CORP 3490
PPG PPG INDUSTRIES INC 2851
PX PRAXAIR INC 2810
QCOM QUALCOMM INC 3663
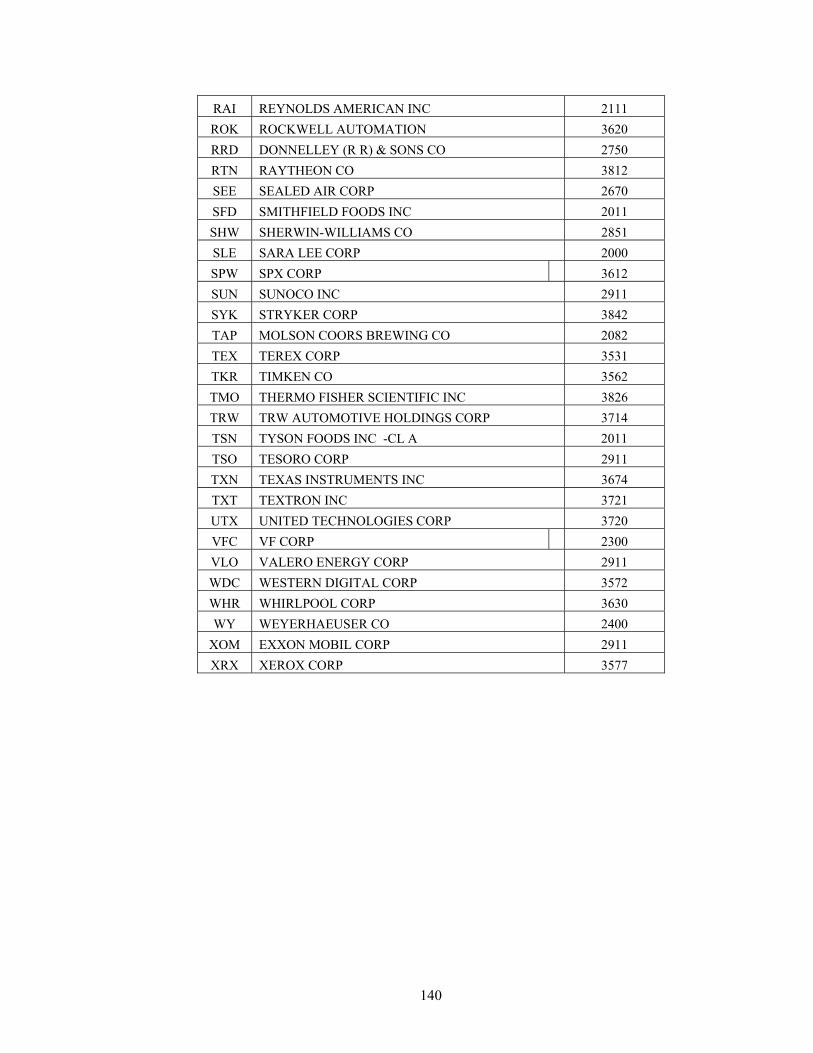
140
RAI REYNOLDS AMERICAN INC 2111
ROK ROCKWELL AUTOMATION 3620
RRD DONNELLEY (R R) & SONS CO 2750
RTN RAYTHEON CO 3812
SEE SEALED AIR CORP 2670
SFD SMITHFIELD FOODS INC 2011
SHW SHERWIN-WILLIAMS CO 2851
SLE SARA LEE CORP 2000
SPW SPX CORP 3612
SUN SUNOCO INC 2911
SYK STRYKER CORP 3842
TAP MOLSON COORS BREWING CO 2082
TEX TEREX CORP 3531
TKR TIMKEN CO 3562
TMO THERMO FISHER SCIENTIFIC INC 3826
TRW TRW AUTOMOTIVE HOLDINGS CORP 3714
TSN TYSON FOODS INC -CL A 2011
TSO TESORO CORP 2911
TXN TEXAS INSTRUMENTS INC 3674
TXT TEXTRON INC 3721
UTX UNITED TECHNOLOGIES CORP 3720
VFC VF CORP 2300
VLO VALERO ENERGY CORP 2911
WDC WESTERN DIGITAL CORP 3572
WHR WHIRLPOOL CORP 3630
WY WEYERHAEUSER CO 2400
XOM EXXON MOBIL CORP 2911
XRX XEROX CORP 3577
141
Appendix 2 – MNCs Mission Statement Summary
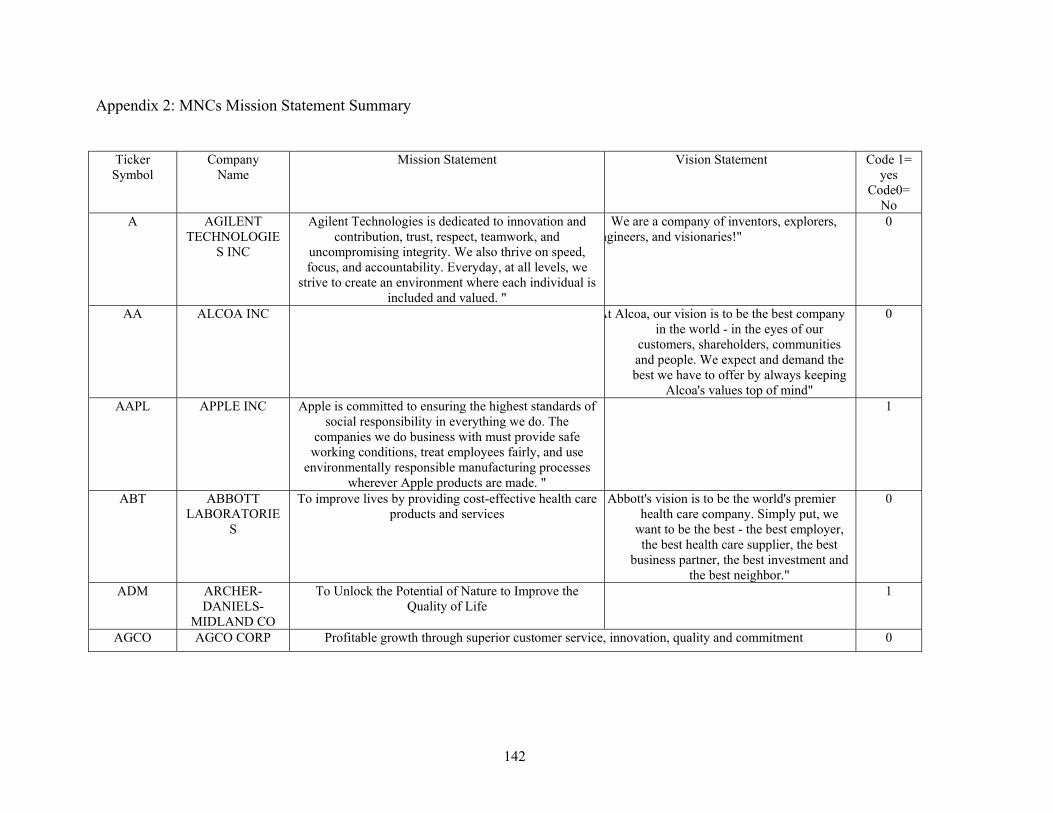
142
Appendix 2: MNCs Mission Statement Summary
Ticker Symbol
Company Name
Mission Statement Vision Statement Code 1= yes
Code0=No
A AGILENT TECHNOLOGIE
S INC
Agilent Technologies is dedicated to innovation and contribution, trust, respect, teamwork, and
uncompromising integrity. We also thrive on speed, focus, and accountability. Everyday, at all levels, we
strive to create an environment where each individual is included and valued. "
We are a company of inventors, explorers, ngineers, and visionaries!"
0
AA ALCOA INC
At Alcoa, our vision is to be the best company in the world - in the eyes of our
customers, shareholders, communities and people. We expect and demand the best we have to offer by always keeping
Alcoa's values top of mind"
0
AAPL APPLE INC Apple is committed to ensuring the highest standards of social responsibility in everything we do. The
companies we do business with must provide safe working conditions, treat employees fairly, and use
environmentally responsible manufacturing processes wherever Apple products are made. "
1
ABT ABBOTT LABORATORIE
S
To improve lives by providing cost-effective health care products and services
Abbott's vision is to be the world's premier health care company. Simply put, we
want to be the best - the best employer, the best health care supplier, the best
business partner, the best investment and the best neighbor."
0
ADM ARCHER-DANIELS-
MIDLAND CO
To Unlock the Potential of Nature to Improve the Quality of Life
1
AGCO AGCO CORP Profitable growth through superior customer service, innovation, quality and commitment 0
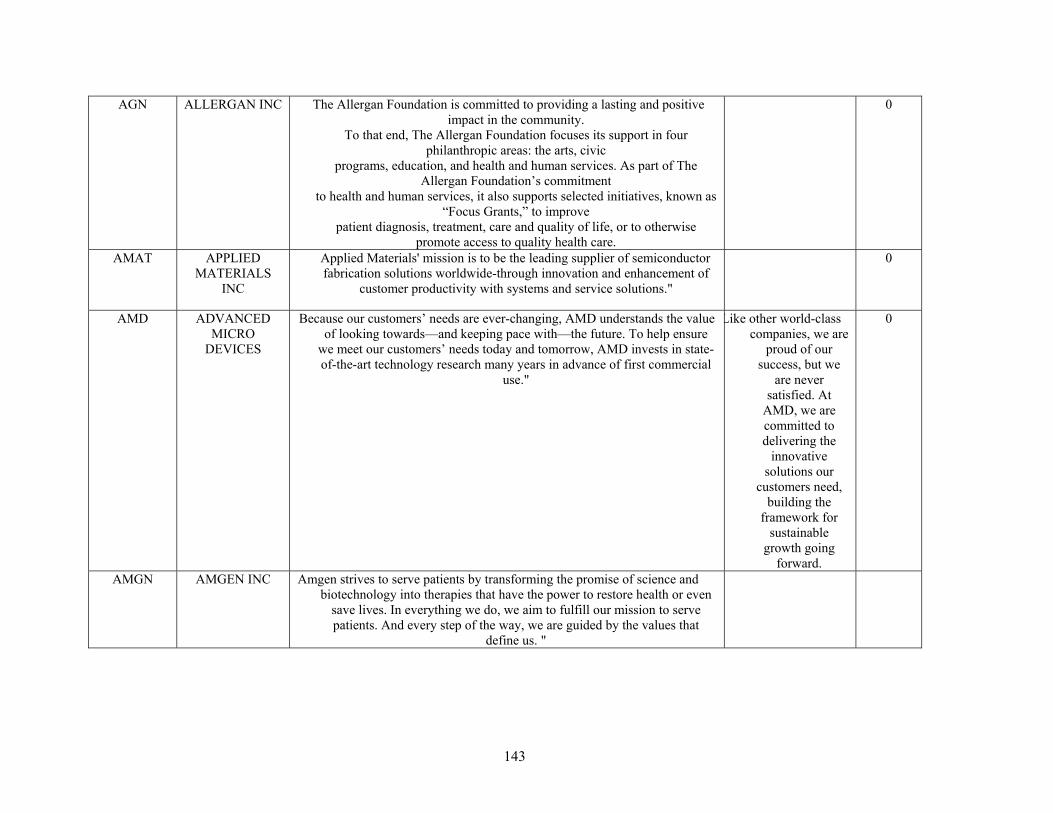
143
AGN ALLERGAN INC The Allergan Foundation is committed to providing a lasting and positive impact in the community.
To that end, The Allergan Foundation focuses its support in four philanthropic areas: the arts, civic
programs, education, and health and human services. As part of The Allergan Foundation’s commitment
to health and human services, it also supports selected initiatives, known as “Focus Grants,” to improve
patient diagnosis, treatment, care and quality of life, or to otherwise promote access to quality health care.
0
AMAT APPLIED MATERIALS
INC
Applied Materials' mission is to be the leading supplier of semiconductor fabrication solutions worldwide-through innovation and enhancement of
customer productivity with systems and service solutions."
0
AMD ADVANCED MICRO
DEVICES
Because our customers’ needs are ever-changing, AMD understands the value of looking towards—and keeping pace with—the future. To help ensure
we meet our customers’ needs today and tomorrow, AMD invests in state-of-the-art technology research many years in advance of first commercial
use."
Like other world-class companies, we are
proud of our success, but we
are never satisfied. At
AMD, we are committed to delivering the
innovative solutions our
customers need, building the
framework for sustainable
growth going forward.
0
AMGN AMGEN INC Amgen strives to serve patients by transforming the promise of science and biotechnology into therapies that have the power to restore health or even
save lives. In everything we do, we aim to fulfill our mission to serve patients. And every step of the way, we are guided by the values that
define us. "
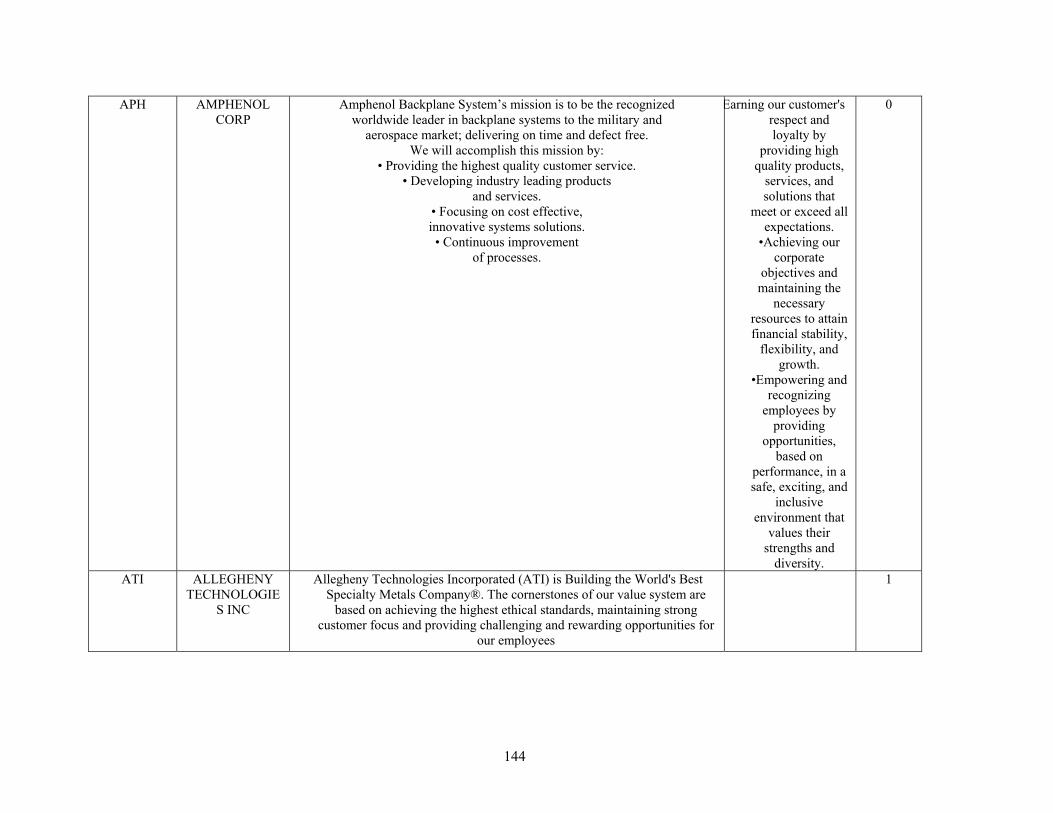
144
APH AMPHENOL CORP
Amphenol Backplane System’s mission is to be the recognized worldwide leader in backplane systems to the military and
aerospace market; delivering on time and defect free. We will accomplish this mission by:
• Providing the highest quality customer service. • Developing industry leading products
and services. • Focusing on cost effective, innovative systems solutions. • Continuous improvement
of processes.
Earning our customer's respect and loyalty by
providing high quality products,
services, and solutions that
meet or exceed all expectations.
•Achieving our corporate
objectives and maintaining the
necessary resources to attain financial stability,
flexibility, and growth.
•Empowering and recognizing
employees by providing
opportunities, based on
performance, in a safe, exciting, and
inclusive environment that
values their strengths and
diversity.
0
ATI ALLEGHENY TECHNOLOGIE
S INC
Allegheny Technologies Incorporated (ATI) is Building the World's Best Specialty Metals Company®. The cornerstones of our value system are
based on achieving the highest ethical standards, maintaining strong customer focus and providing challenging and rewarding opportunities for
our employees
1
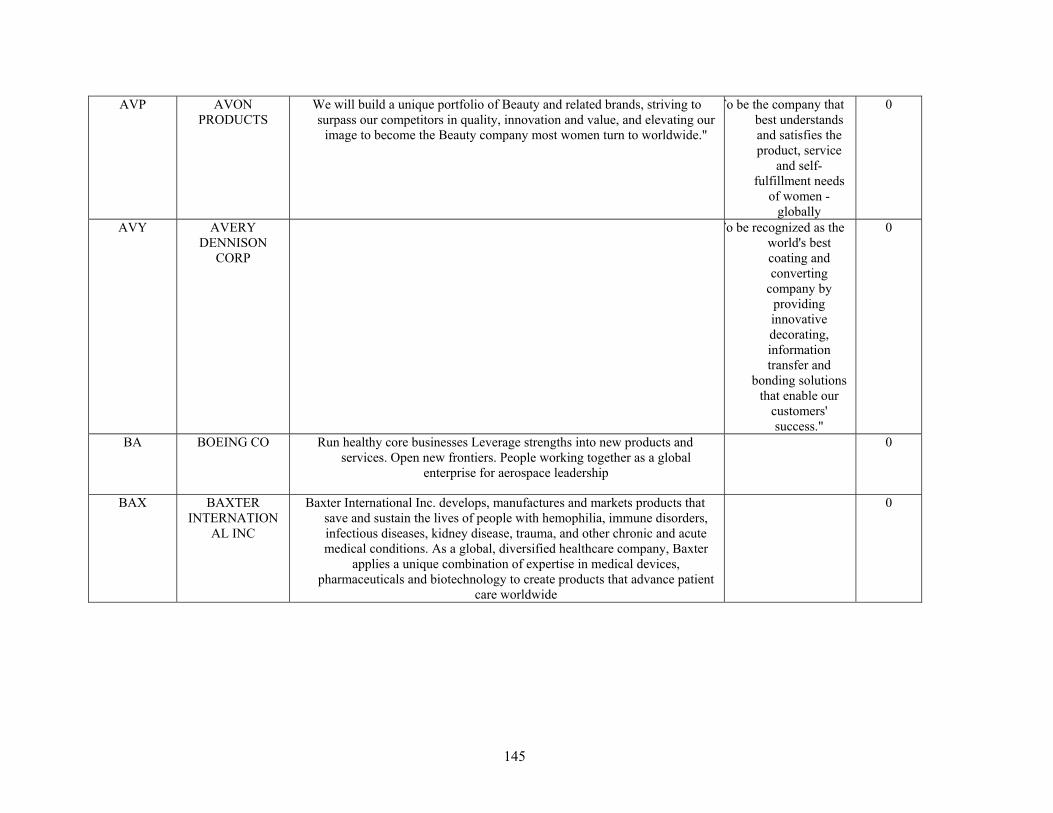
145
AVP AVON PRODUCTS
We will build a unique portfolio of Beauty and related brands, striving to surpass our competitors in quality, innovation and value, and elevating our
image to become the Beauty company most women turn to worldwide."
To be the company that best understands and satisfies the product, service
and self-fulfillment needs
of women - globally
0
AVY AVERY DENNISON
CORP
To be recognized as the world's best coating and converting
company by providing innovative decorating, information transfer and
bonding solutions that enable our
customers' success."
0
BA BOEING CO Run healthy core businesses Leverage strengths into new products and services. Open new frontiers. People working together as a global
enterprise for aerospace leadership
0
BAX BAXTER INTERNATION
AL INC
Baxter International Inc. develops, manufactures and markets products that save and sustain the lives of people with hemophilia, immune disorders, infectious diseases, kidney disease, trauma, and other chronic and acute medical conditions. As a global, diversified healthcare company, Baxter
applies a unique combination of expertise in medical devices, pharmaceuticals and biotechnology to create products that advance patient
care worldwide
0
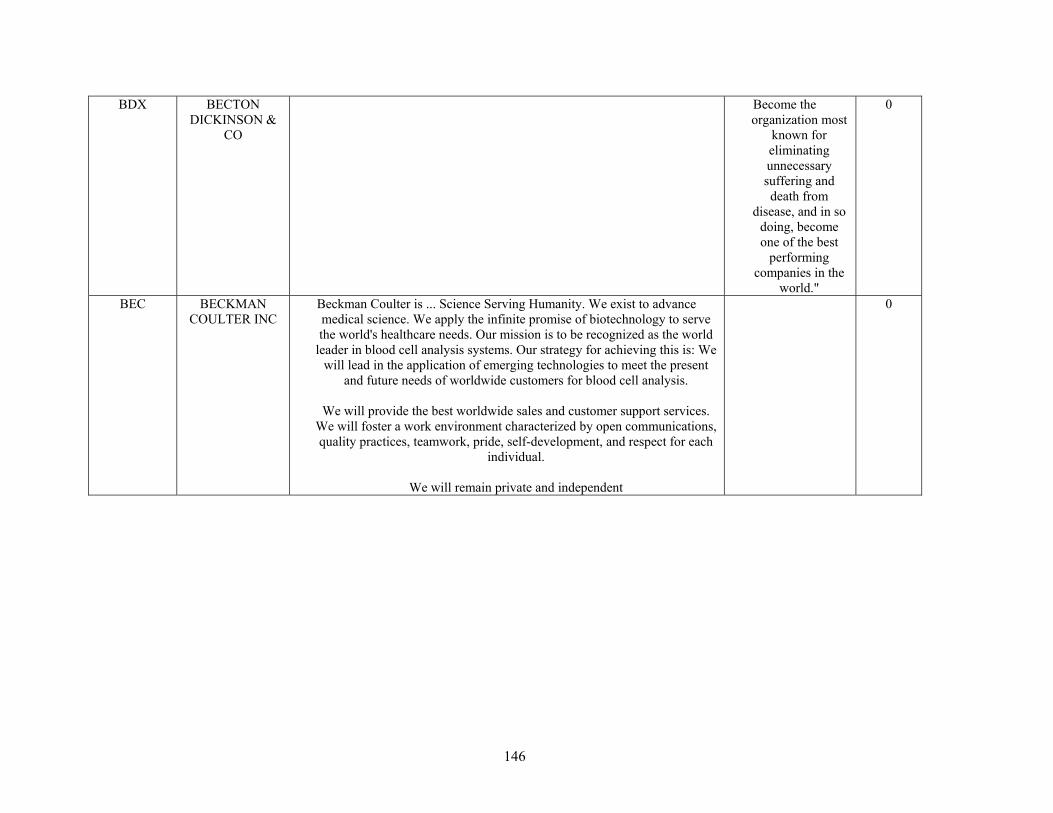
146
BDX BECTON DICKINSON &
CO
Become the organization most
known for eliminating unnecessary suffering and death from
disease, and in so doing, become one of the best
performing companies in the
world."
0
BEC BECKMAN COULTER INC
Beckman Coulter is ... Science Serving Humanity. We exist to advance medical science. We apply the infinite promise of biotechnology to serve the world's healthcare needs. Our mission is to be recognized as the world
leader in blood cell analysis systems. Our strategy for achieving this is: We will lead in the application of emerging technologies to meet the present
and future needs of worldwide customers for blood cell analysis.
We will provide the best worldwide sales and customer support services. We will foster a work environment characterized by open communications, quality practices, teamwork, pride, self-development, and respect for each
individual.
We will remain private and independent
0
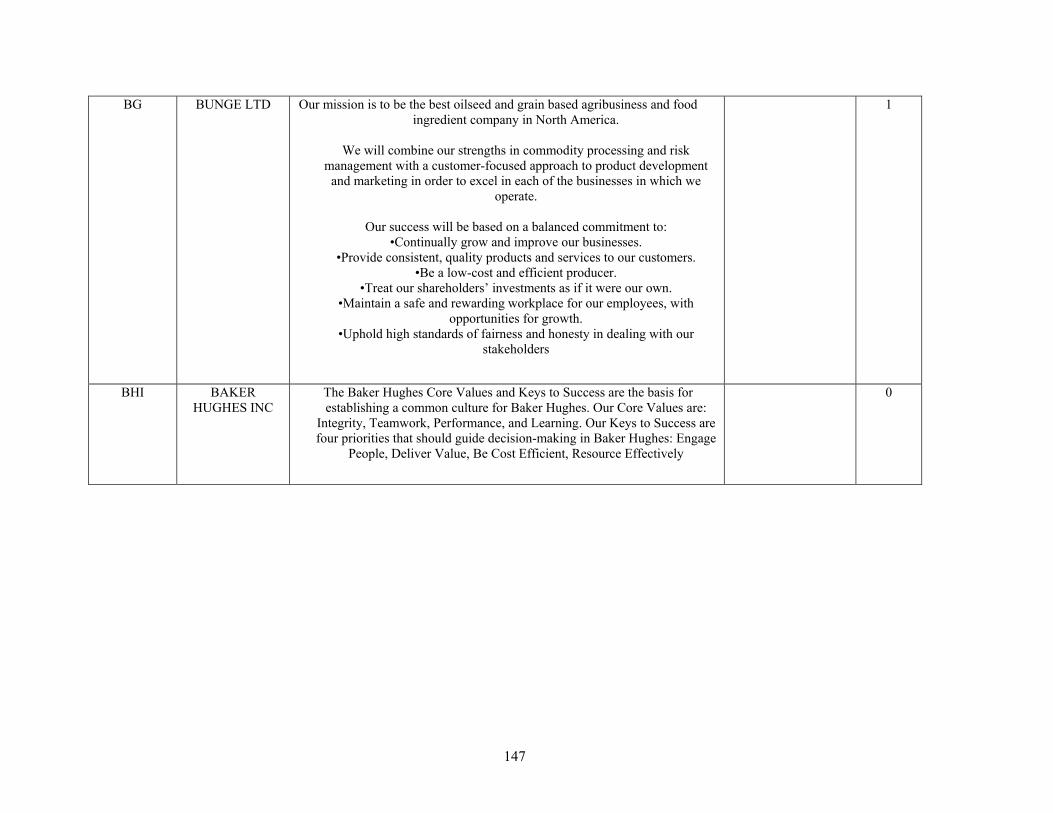
147
BG BUNGE LTD Our mission is to be the best oilseed and grain based agribusiness and food ingredient company in North America.
We will combine our strengths in commodity processing and risk
management with a customer-focused approach to product development and marketing in order to excel in each of the businesses in which we
operate.
Our success will be based on a balanced commitment to: •Continually grow and improve our businesses.
•Provide consistent, quality products and services to our customers. •Be a low-cost and efficient producer.
•Treat our shareholders’ investments as if it were our own. •Maintain a safe and rewarding workplace for our employees, with
opportunities for growth. •Uphold high standards of fairness and honesty in dealing with our
stakeholders
1
BHI BAKER HUGHES INC
The Baker Hughes Core Values and Keys to Success are the basis for establishing a common culture for Baker Hughes. Our Core Values are:
Integrity, Teamwork, Performance, and Learning. Our Keys to Success are four priorities that should guide decision-making in Baker Hughes: Engage
People, Deliver Value, Be Cost Efficient, Resource Effectively
0
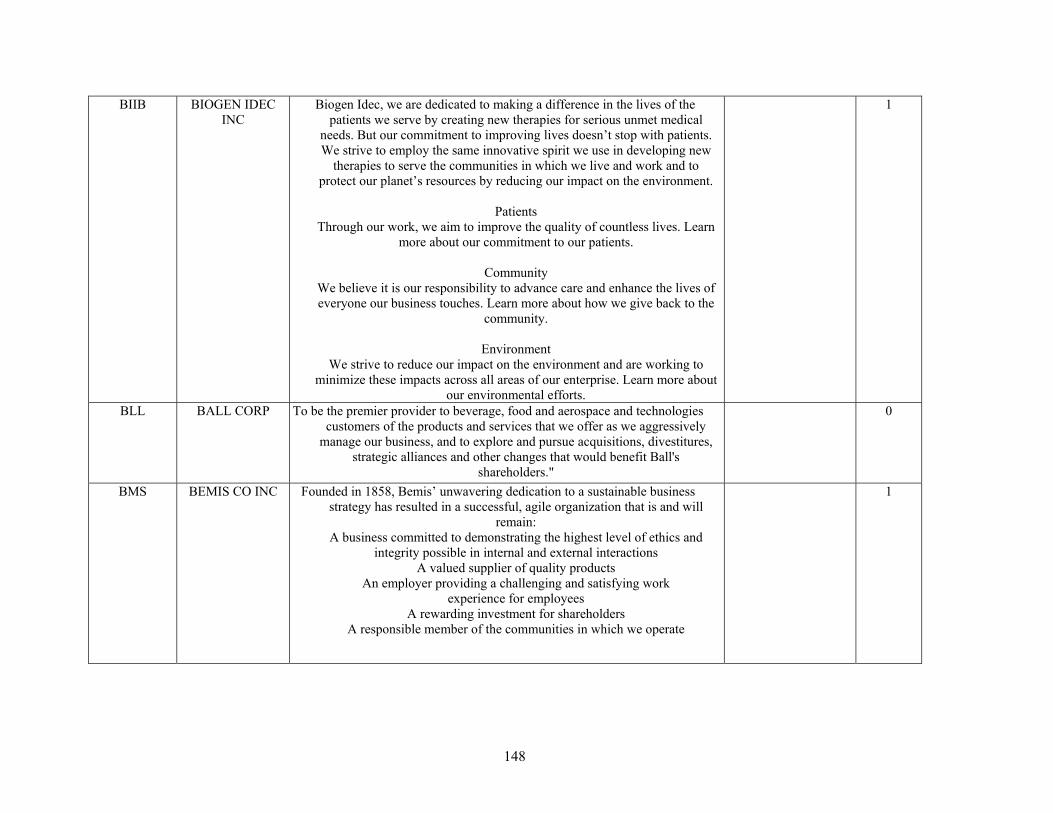
148
BIIB BIOGEN IDEC INC
Biogen Idec, we are dedicated to making a difference in the lives of the patients we serve by creating new therapies for serious unmet medical
needs. But our commitment to improving lives doesn’t stop with patients. We strive to employ the same innovative spirit we use in developing new
therapies to serve the communities in which we live and work and to protect our planet’s resources by reducing our impact on the environment.
Patients
Through our work, we aim to improve the quality of countless lives. Learn more about our commitment to our patients.
Community
We believe it is our responsibility to advance care and enhance the lives of everyone our business touches. Learn more about how we give back to the
community.
Environment We strive to reduce our impact on the environment and are working to
minimize these impacts across all areas of our enterprise. Learn more about our environmental efforts.
1
BLL BALL CORP To be the premier provider to beverage, food and aerospace and technologies customers of the products and services that we offer as we aggressively
manage our business, and to explore and pursue acquisitions, divestitures, strategic alliances and other changes that would benefit Ball's
shareholders."
0
BMS BEMIS CO INC Founded in 1858, Bemis’ unwavering dedication to a sustainable business strategy has resulted in a successful, agile organization that is and will
remain: A business committed to demonstrating the highest level of ethics and
integrity possible in internal and external interactions A valued supplier of quality products
An employer providing a challenging and satisfying work experience for employees
A rewarding investment for shareholders A responsible member of the communities in which we operate
1
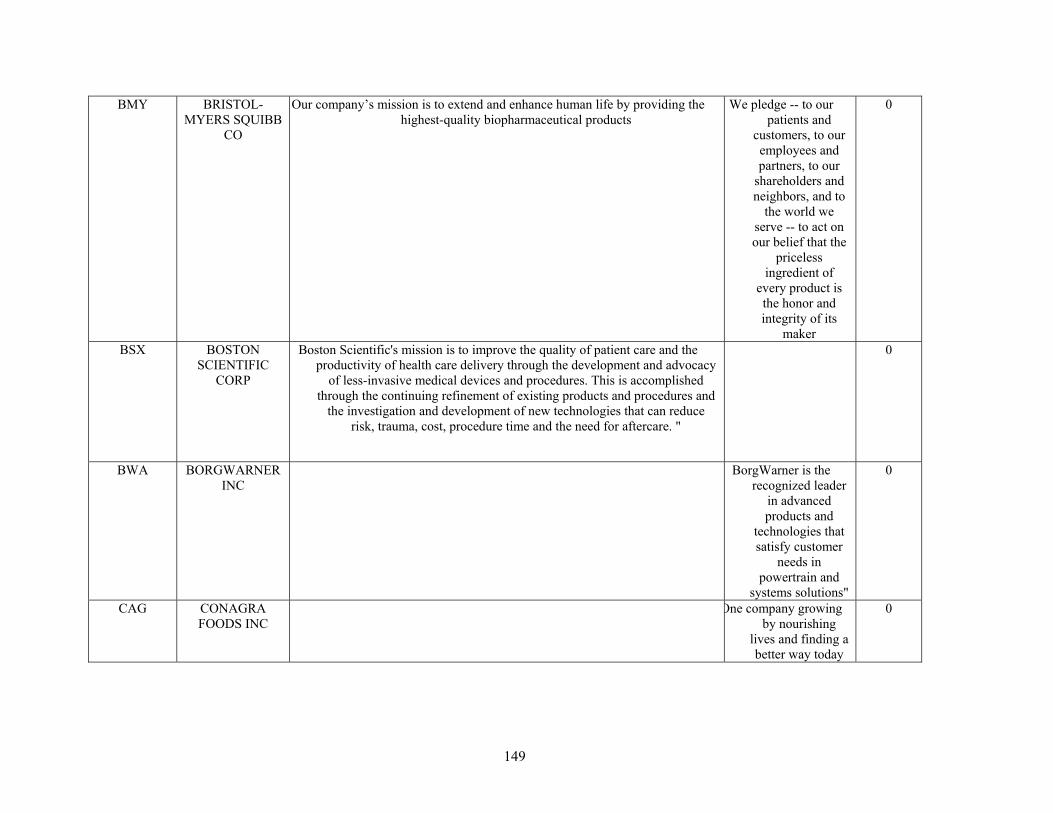
149
BMY BRISTOL-MYERS SQUIBB
CO
Our company’s mission is to extend and enhance human life by providing the highest-quality biopharmaceutical products
We pledge -- to our patients and
customers, to our employees and partners, to our
shareholders and neighbors, and to
the world we serve -- to act on our belief that the
priceless ingredient of
every product is the honor and integrity of its
maker
0
BSX BOSTON SCIENTIFIC
CORP
Boston Scientific's mission is to improve the quality of patient care and the productivity of health care delivery through the development and advocacy
of less-invasive medical devices and procedures. This is accomplished through the continuing refinement of existing products and procedures and
the investigation and development of new technologies that can reduce risk, trauma, cost, procedure time and the need for aftercare. "
0
BWA BORGWARNER INC
BorgWarner is the recognized leader
in advanced products and
technologies that satisfy customer
needs in powertrain and
systems solutions"
0
CAG CONAGRA FOODS INC
One company growing by nourishing
lives and finding a better way today
0
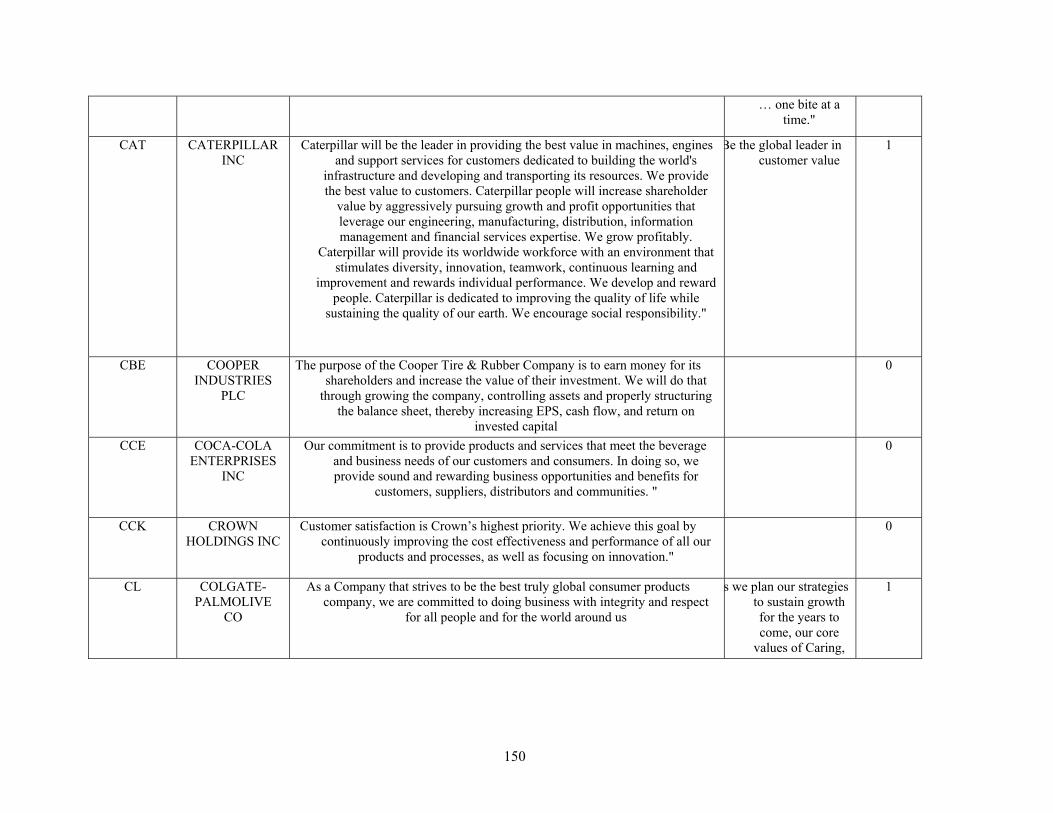
150
… one bite at a time."
CAT CATERPILLAR INC
Caterpillar will be the leader in providing the best value in machines, engines and support services for customers dedicated to building the world's
infrastructure and developing and transporting its resources. We provide the best value to customers. Caterpillar people will increase shareholder
value by aggressively pursuing growth and profit opportunities that leverage our engineering, manufacturing, distribution, information management and financial services expertise. We grow profitably.
Caterpillar will provide its worldwide workforce with an environment that stimulates diversity, innovation, teamwork, continuous learning and
improvement and rewards individual performance. We develop and reward people. Caterpillar is dedicated to improving the quality of life while
sustaining the quality of our earth. We encourage social responsibility."
Be the global leader in customer value
1
CBE COOPER INDUSTRIES
PLC
The purpose of the Cooper Tire & Rubber Company is to earn money for its shareholders and increase the value of their investment. We will do that
through growing the company, controlling assets and properly structuring the balance sheet, thereby increasing EPS, cash flow, and return on
invested capital
0
CCE COCA-COLA ENTERPRISES
INC
Our commitment is to provide products and services that meet the beverage and business needs of our customers and consumers. In doing so, we provide sound and rewarding business opportunities and benefits for
customers, suppliers, distributors and communities. "
0
CCK CROWN HOLDINGS INC
Customer satisfaction is Crown’s highest priority. We achieve this goal by continuously improving the cost effectiveness and performance of all our
products and processes, as well as focusing on innovation."
0
CL COLGATE-PALMOLIVE
CO
As a Company that strives to be the best truly global consumer products company, we are committed to doing business with integrity and respect
for all people and for the world around us
s we plan our strategies to sustain growth for the years to come, our core
values of Caring,
1
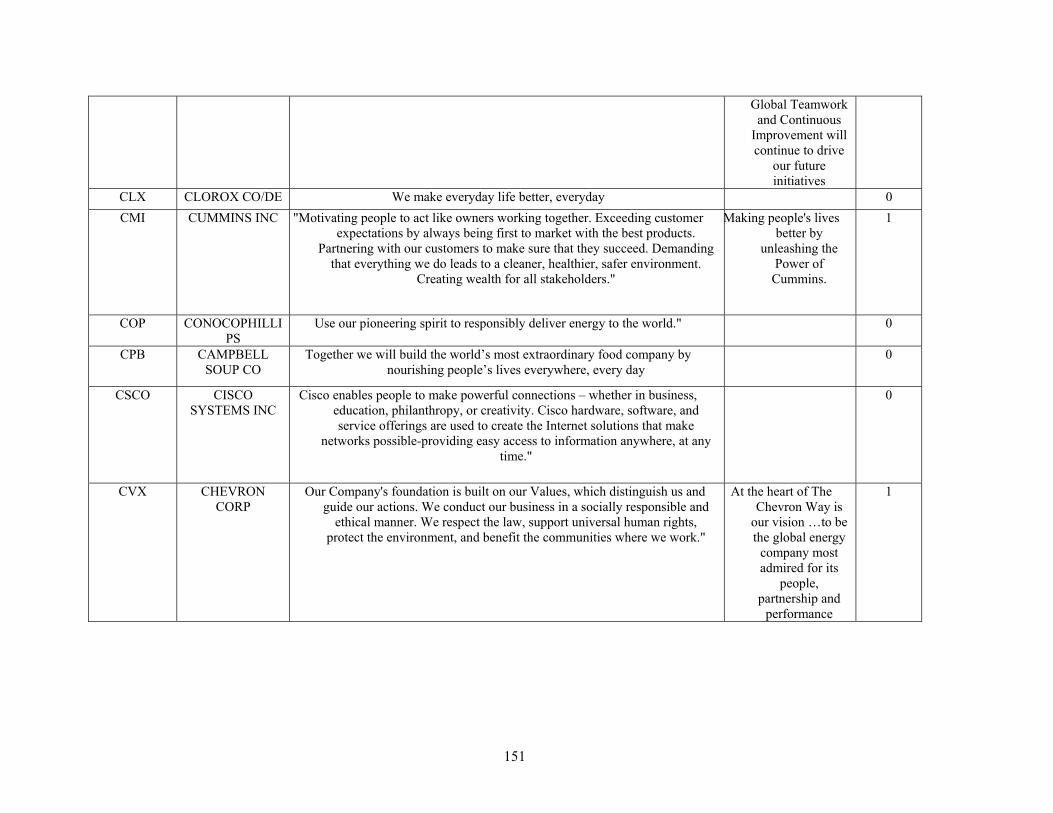
151
Global Teamwork and Continuous
Improvement will continue to drive
our future initiatives
CLX CLOROX CO/DE We make everyday life better, everyday 0
CMI CUMMINS INC "Motivating people to act like owners working together. Exceeding customer expectations by always being first to market with the best products.
Partnering with our customers to make sure that they succeed. Demanding that everything we do leads to a cleaner, healthier, safer environment.
Creating wealth for all stakeholders."
Making people's lives better by
unleashing the Power of
Cummins.
1
COP CONOCOPHILLIPS
Use our pioneering spirit to responsibly deliver energy to the world." 0
CPB CAMPBELL SOUP CO
Together we will build the world’s most extraordinary food company by nourishing people’s lives everywhere, every day
0
CSCO CISCO SYSTEMS INC
Cisco enables people to make powerful connections – whether in business, education, philanthropy, or creativity. Cisco hardware, software, and service offerings are used to create the Internet solutions that make
networks possible-providing easy access to information anywhere, at any time."
0
CVX CHEVRON CORP
Our Company's foundation is built on our Values, which distinguish us and guide our actions. We conduct our business in a socially responsible and
ethical manner. We respect the law, support universal human rights, protect the environment, and benefit the communities where we work."
At the heart of The Chevron Way is
our vision …to be the global energy
company most admired for its
people, partnership and
performance
1
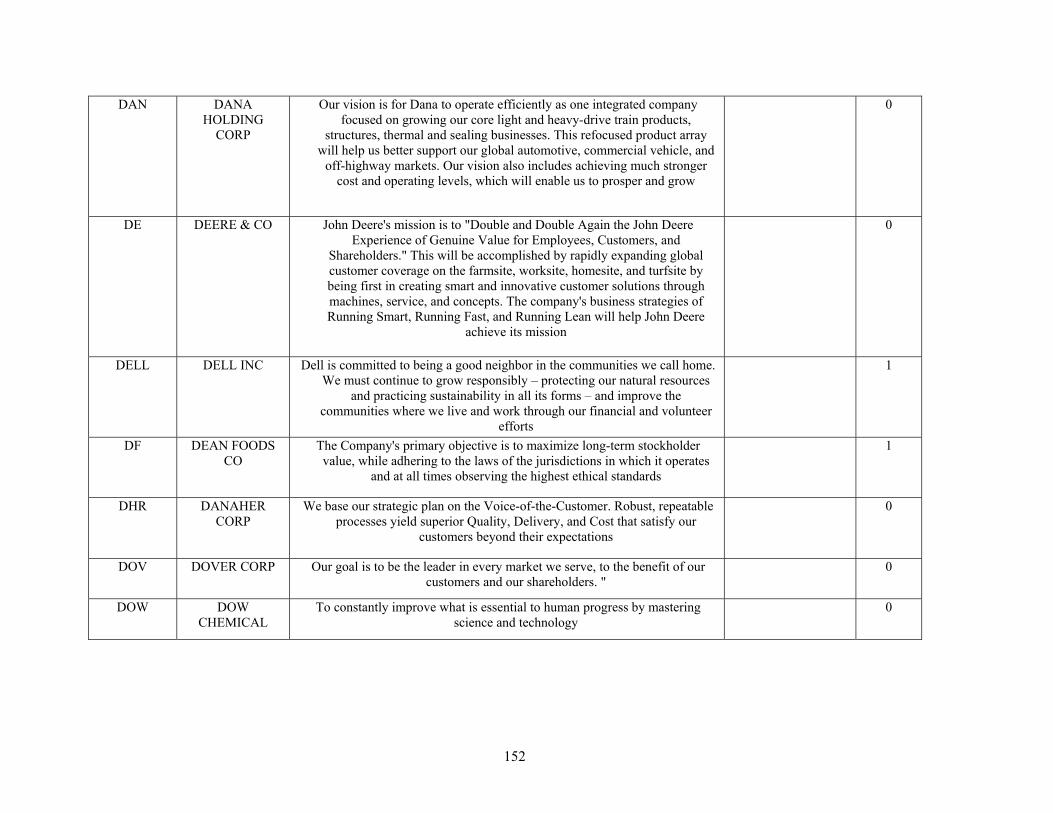
152
DAN DANA HOLDING
CORP
Our vision is for Dana to operate efficiently as one integrated company focused on growing our core light and heavy-drive train products,
structures, thermal and sealing businesses. This refocused product array will help us better support our global automotive, commercial vehicle, and
off-highway markets. Our vision also includes achieving much stronger cost and operating levels, which will enable us to prosper and grow
0
DE DEERE & CO John Deere's mission is to "Double and Double Again the John Deere Experience of Genuine Value for Employees, Customers, and
Shareholders." This will be accomplished by rapidly expanding global customer coverage on the farmsite, worksite, homesite, and turfsite by being first in creating smart and innovative customer solutions through machines, service, and concepts. The company's business strategies of Running Smart, Running Fast, and Running Lean will help John Deere
achieve its mission
0
DELL DELL INC Dell is committed to being a good neighbor in the communities we call home. We must continue to grow responsibly – protecting our natural resources
and practicing sustainability in all its forms – and improve the communities where we live and work through our financial and volunteer
efforts
1
DF DEAN FOODS CO
The Company's primary objective is to maximize long-term stockholder value, while adhering to the laws of the jurisdictions in which it operates
and at all times observing the highest ethical standards
1
DHR DANAHER CORP
We base our strategic plan on the Voice-of-the-Customer. Robust, repeatable processes yield superior Quality, Delivery, and Cost that satisfy our
customers beyond their expectations
0
DOV DOVER CORP Our goal is to be the leader in every market we serve, to the benefit of our customers and our shareholders. "
0
DOW DOW CHEMICAL
To constantly improve what is essential to human progress by mastering science and technology
0
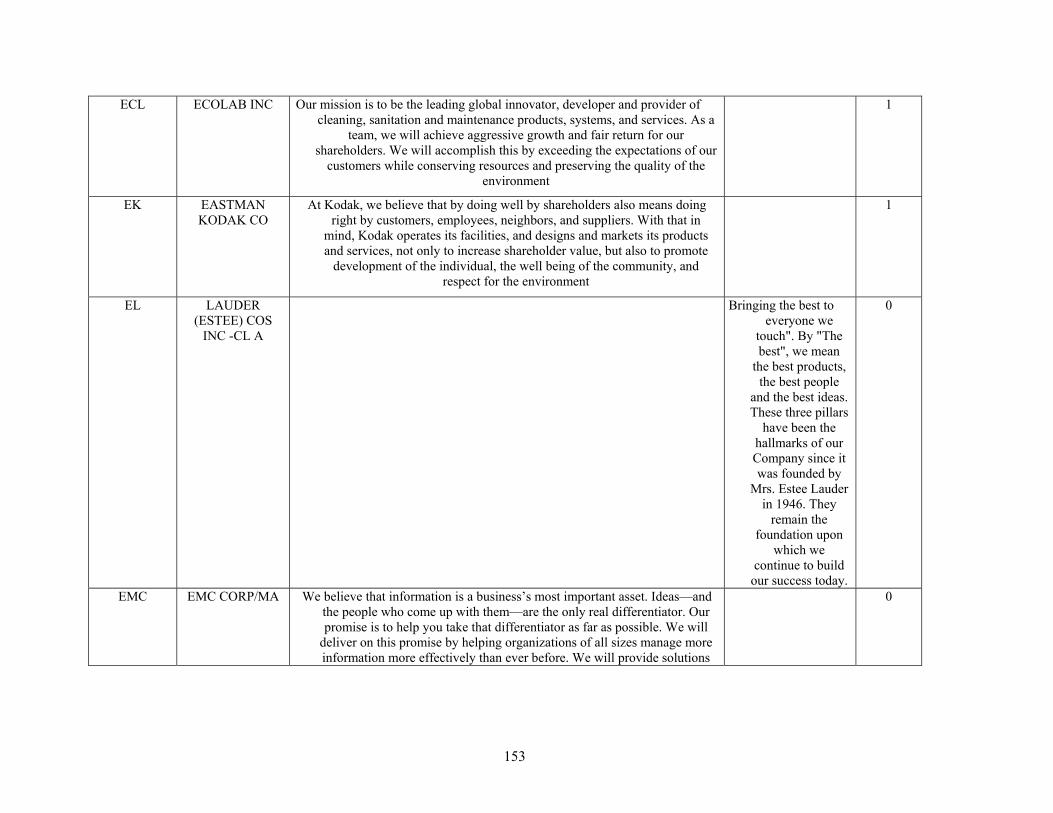
153
ECL ECOLAB INC Our mission is to be the leading global innovator, developer and provider of cleaning, sanitation and maintenance products, systems, and services. As a
team, we will achieve aggressive growth and fair return for our shareholders. We will accomplish this by exceeding the expectations of our
customers while conserving resources and preserving the quality of the environment
1
EK EASTMAN KODAK CO
At Kodak, we believe that by doing well by shareholders also means doing right by customers, employees, neighbors, and suppliers. With that in
mind, Kodak operates its facilities, and designs and markets its products and services, not only to increase shareholder value, but also to promote
development of the individual, the well being of the community, and respect for the environment
1
EL LAUDER (ESTEE) COS
INC -CL A
Bringing the best to everyone we
touch". By "The best", we mean
the best products, the best people
and the best ideas. These three pillars
have been the hallmarks of our Company since it was founded by
Mrs. Estee Lauder in 1946. They
remain the foundation upon
which we continue to build
our success today.
0
EMC EMC CORP/MA We believe that information is a business’s most important asset. Ideas—and the people who come up with them—are the only real differentiator. Our promise is to help you take that differentiator as far as possible. We will
deliver on this promise by helping organizations of all sizes manage more information more effectively than ever before. We will provide solutions
0
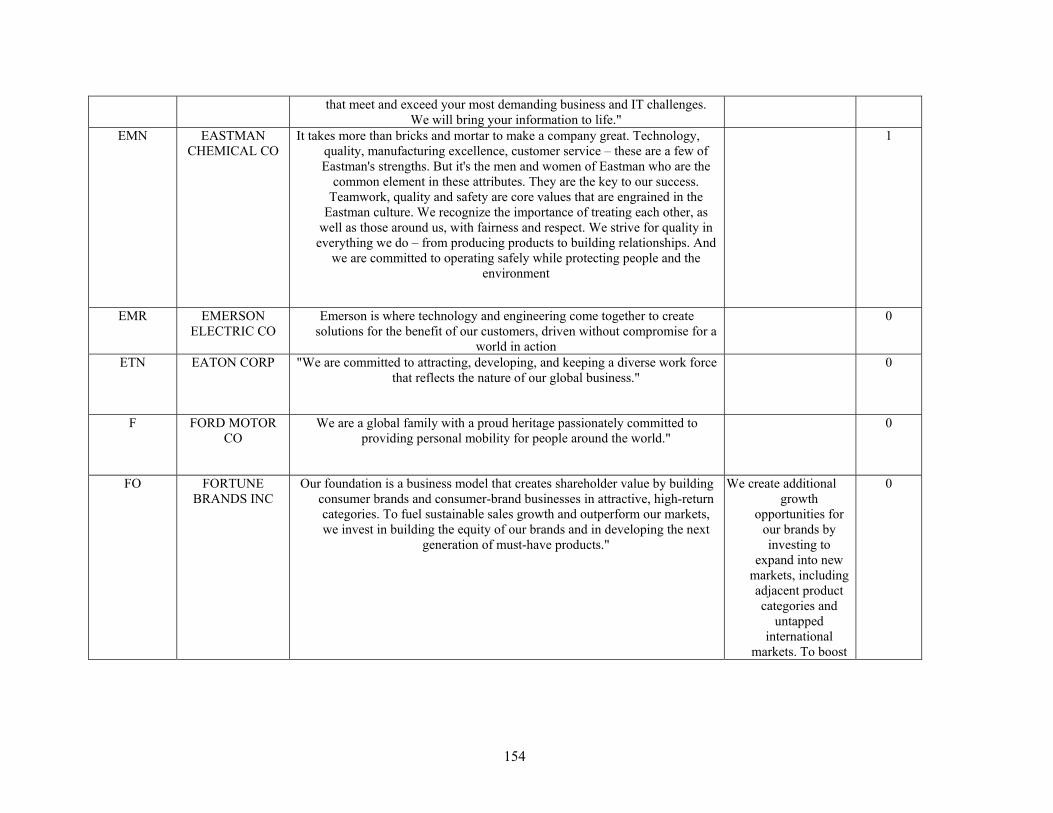
154
that meet and exceed your most demanding business and IT challenges. We will bring your information to life."
EMN EASTMAN CHEMICAL CO
It takes more than bricks and mortar to make a company great. Technology, quality, manufacturing excellence, customer service – these are a few of Eastman's strengths. But it's the men and women of Eastman who are the
common element in these attributes. They are the key to our success. Teamwork, quality and safety are core values that are engrained in the
Eastman culture. We recognize the importance of treating each other, as well as those around us, with fairness and respect. We strive for quality in everything we do – from producing products to building relationships. And
we are committed to operating safely while protecting people and the environment
1
EMR EMERSON ELECTRIC CO
Emerson is where technology and engineering come together to create solutions for the benefit of our customers, driven without compromise for a
world in action
0
ETN EATON CORP "We are committed to attracting, developing, and keeping a diverse work force that reflects the nature of our global business."
0
F FORD MOTOR CO
We are a global family with a proud heritage passionately committed to providing personal mobility for people around the world."
0
FO FORTUNE BRANDS INC
Our foundation is a business model that creates shareholder value by building consumer brands and consumer-brand businesses in attractive, high-return categories. To fuel sustainable sales growth and outperform our markets, we invest in building the equity of our brands and in developing the next
generation of must-have products."
We create additional growth
opportunities for our brands by investing to
expand into new markets, including adjacent product categories and
untapped international
markets. To boost
0
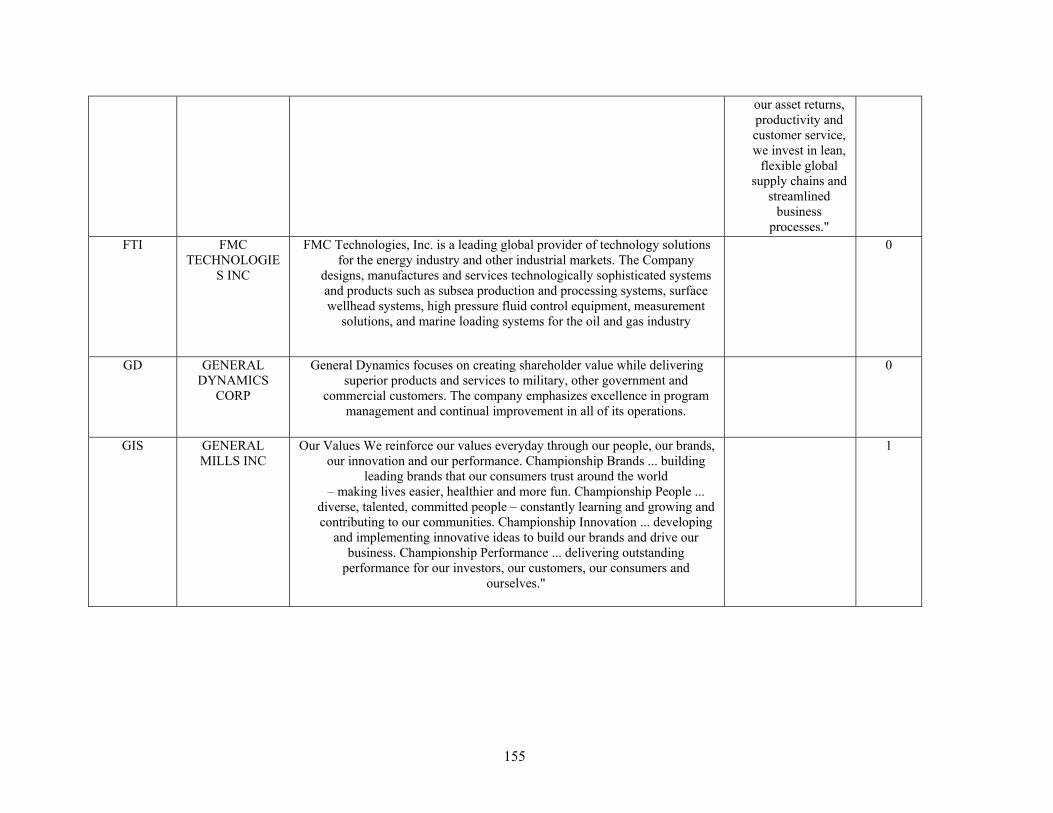
155
our asset returns, productivity and customer service, we invest in lean,
flexible global supply chains and
streamlined business
processes." FTI FMC
TECHNOLOGIES INC
FMC Technologies, Inc. is a leading global provider of technology solutions for the energy industry and other industrial markets. The Company
designs, manufactures and services technologically sophisticated systems and products such as subsea production and processing systems, surface wellhead systems, high pressure fluid control equipment, measurement
solutions, and marine loading systems for the oil and gas industry
0
GD GENERAL DYNAMICS
CORP
General Dynamics focuses on creating shareholder value while delivering superior products and services to military, other government and
commercial customers. The company emphasizes excellence in program management and continual improvement in all of its operations.
0
GIS GENERAL MILLS INC
Our Values We reinforce our values everyday through our people, our brands, our innovation and our performance. Championship Brands ... building
leading brands that our consumers trust around the world – making lives easier, healthier and more fun. Championship People ...
diverse, talented, committed people – constantly learning and growing and contributing to our communities. Championship Innovation ... developing
and implementing innovative ideas to build our brands and drive our business. Championship Performance ... delivering outstanding
performance for our investors, our customers, our consumers and ourselves."
1
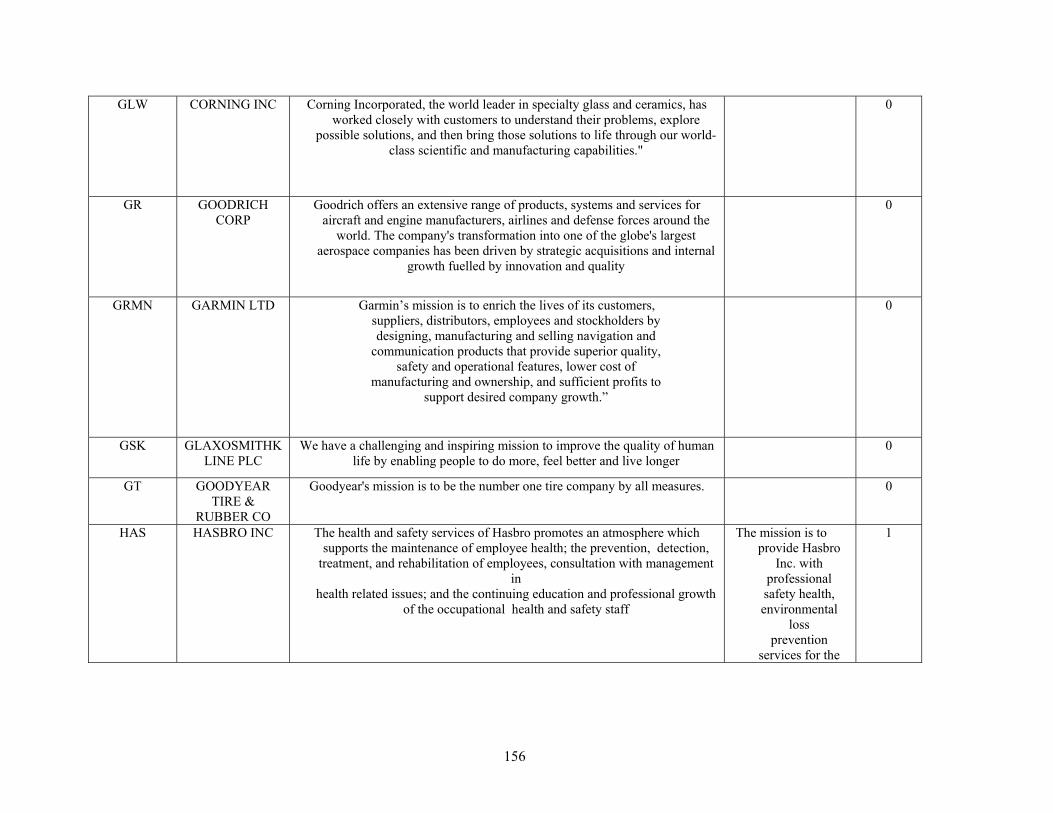
156
GLW CORNING INC Corning Incorporated, the world leader in specialty glass and ceramics, has worked closely with customers to understand their problems, explore
possible solutions, and then bring those solutions to life through our world-class scientific and manufacturing capabilities."
0
GR GOODRICH CORP
Goodrich offers an extensive range of products, systems and services for aircraft and engine manufacturers, airlines and defense forces around the
world. The company's transformation into one of the globe's largest aerospace companies has been driven by strategic acquisitions and internal
growth fuelled by innovation and quality
0
GRMN GARMIN LTD Garmin’s mission is to enrich the lives of its customers, suppliers, distributors, employees and stockholders by designing, manufacturing and selling navigation and
communication products that provide superior quality, safety and operational features, lower cost of
manufacturing and ownership, and sufficient profits to support desired company growth.”
0
GSK GLAXOSMITHKLINE PLC
We have a challenging and inspiring mission to improve the quality of human life by enabling people to do more, feel better and live longer
0
GT GOODYEAR TIRE &
RUBBER CO
Goodyear's mission is to be the number one tire company by all measures. 0
HAS HASBRO INC The health and safety services of Hasbro promotes an atmosphere which supports the maintenance of employee health; the prevention, detection,
treatment, and rehabilitation of employees, consultation with management in
health related issues; and the continuing education and professional growth of the occupational health and safety staff
The mission is to provide Hasbro
Inc. with professional safety health, environmental
loss prevention
services for the
1
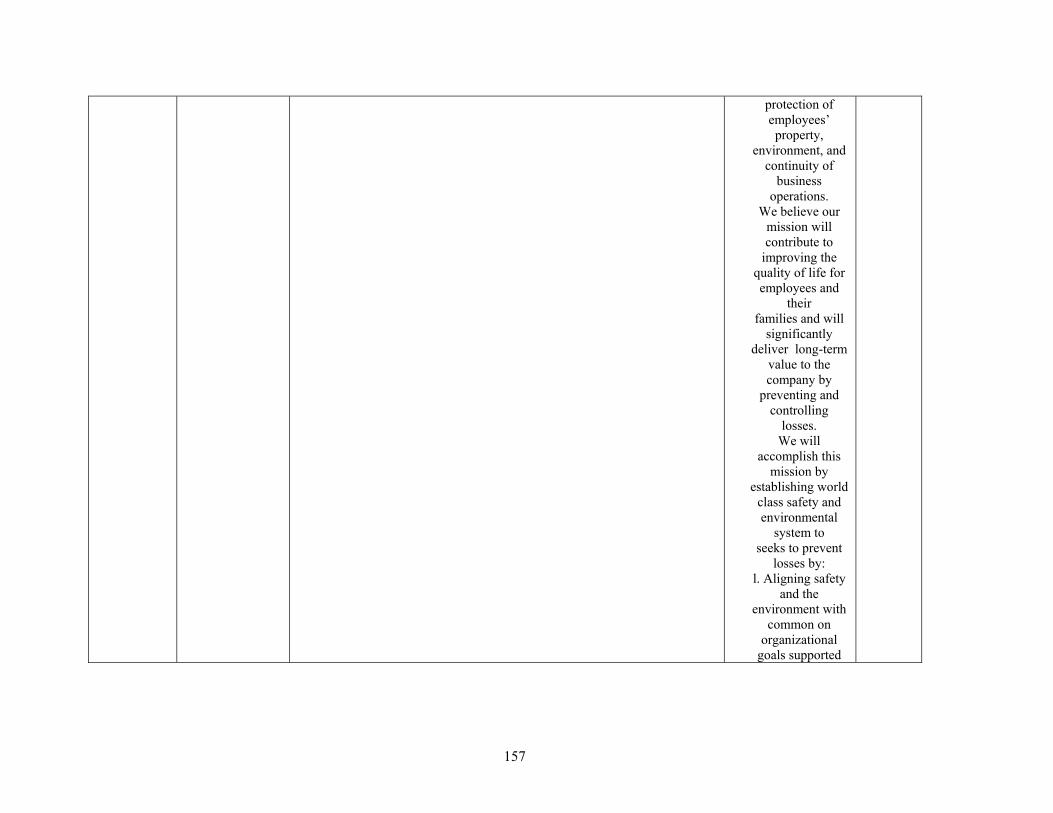
157
protection of employees’ property,
environment, and continuity of
business operations.
We believe our mission will contribute to
improving the quality of life for employees and
their families and will
significantly deliver long-term
value to the company by
preventing and controlling
losses. We will
accomplish this mission by
establishing world class safety and environmental
system to seeks to prevent
losses by: l. Aligning safety
and the environment with
common on organizational
goals supported
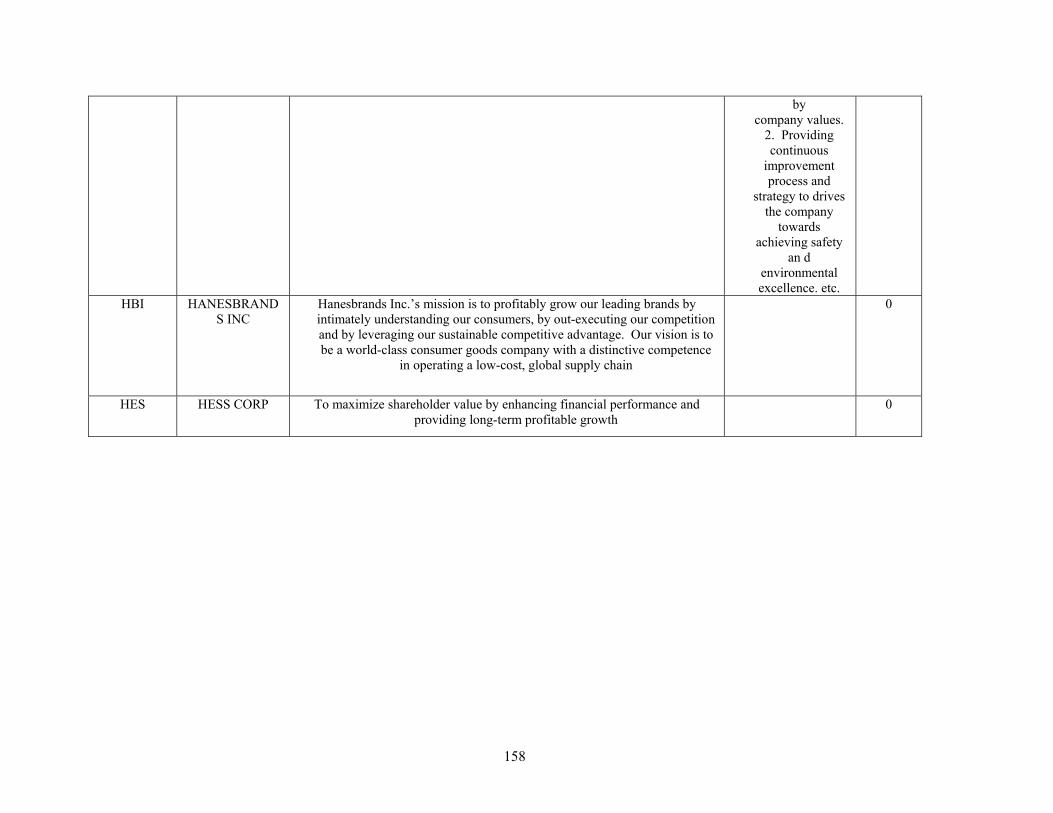
158
by company values.
2. Providing continuous
improvement process and
strategy to drives the company
towards achieving safety
an d environmental excellence. etc.
HBI HANESBRANDS INC
Hanesbrands Inc.’s mission is to profitably grow our leading brands by intimately understanding our consumers, by out-executing our competition and by leveraging our sustainable competitive advantage. Our vision is to be a world-class consumer goods company with a distinctive competence
in operating a low-cost, global supply chain
0
HES HESS CORP To maximize shareholder value by enhancing financial performance and providing long-term profitable growth
0
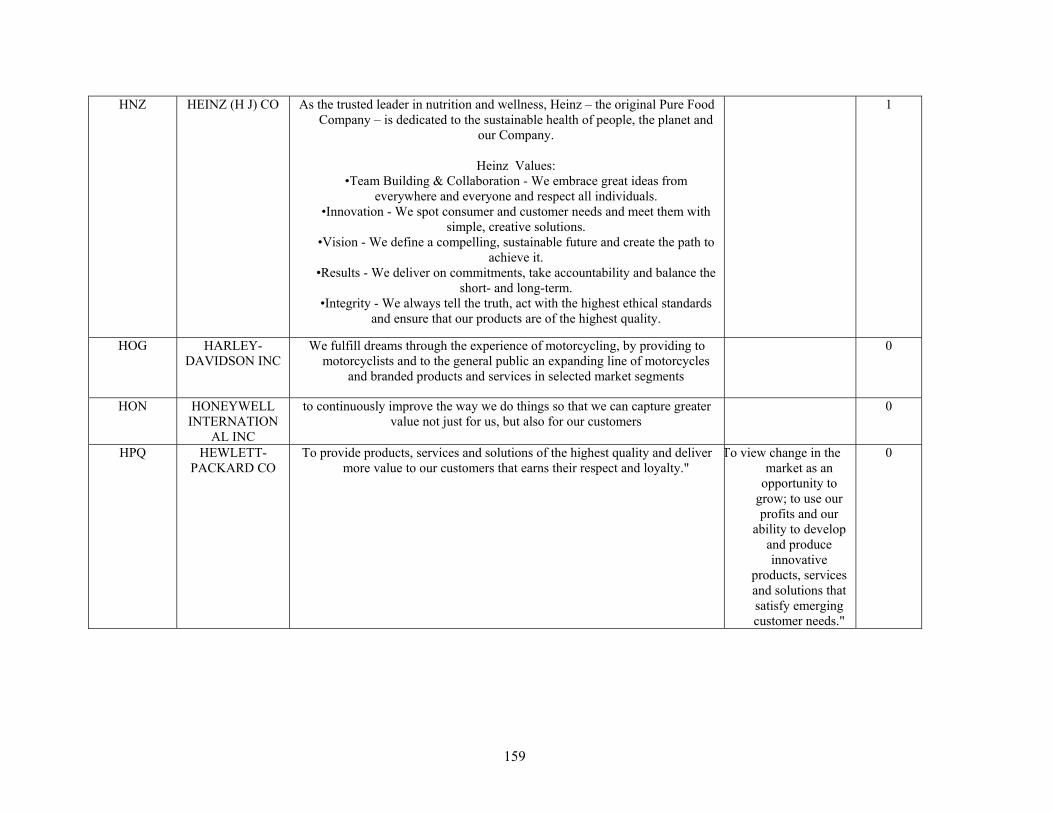
159
HNZ HEINZ (H J) CO As the trusted leader in nutrition and wellness, Heinz – the original Pure Food Company – is dedicated to the sustainable health of people, the planet and
our Company.
Heinz Values: •Team Building & Collaboration - We embrace great ideas from
everywhere and everyone and respect all individuals. •Innovation - We spot consumer and customer needs and meet them with
simple, creative solutions. •Vision - We define a compelling, sustainable future and create the path to
achieve it. •Results - We deliver on commitments, take accountability and balance the
short- and long-term. •Integrity - We always tell the truth, act with the highest ethical standards
and ensure that our products are of the highest quality.
1
HOG HARLEY-DAVIDSON INC
We fulfill dreams through the experience of motorcycling, by providing to motorcyclists and to the general public an expanding line of motorcycles
and branded products and services in selected market segments
0
HON HONEYWELL INTERNATION
AL INC
to continuously improve the way we do things so that we can capture greater value not just for us, but also for our customers
0
HPQ HEWLETT-PACKARD CO
To provide products, services and solutions of the highest quality and deliver more value to our customers that earns their respect and loyalty."
To view change in the market as an
opportunity to grow; to use our profits and our
ability to develop and produce innovative
products, services and solutions that satisfy emerging customer needs."
0
160
HRL HORMEL FOODS CORP
As a leading branded food company with a focus on profitable growth and inspired by our founder's charge to "Originate, don't imitate," we market a
balanced portfolio of highly differentiated quality products.
As a leading branded food company with a focus on
profitable growth and inspired by our founder's
charge to "Originate, don't
imitate," we market a balanced portfolio of highly
differentiated quality products
0
161
HRS HARRIS CORP Harris Corporation will be the best-in-class global provider of mission-critical assured communications systems and services to both government and
commercial customers, combining advanced technology and application knowledge to offer a superior value proposition
As a complement to the mission, a common set of corporate-wide values will drive how our employees conduct themselves in shaping the difference toward achieving our mission. •Integrity – We all have a desire for our business to succeed and grow, and we do not compromise our values to achieve that success. •Delivering Customer Value – We value customer focus in all that we do. •Collaboration/Teamwork/Global Inclusion – We realize that more creative solutions and success comes from working together and supporting each other to achieve our goals. This collaboration extends across all areas of our business — throughout the entire organization.
0
162
•Results Oriented Environment (Continuous Improvement) – We value constant striving for improvement in all we do and in flawlessly executing our tasks to achieve results. •Innovation – We are focused on solving mission-critical needs through innovation and creative thinking. •Personal Growth and Fulfillment – We value self-directed, continual learning and personal fulfillment
HSY HERSHEY CO Undisputed Marketplace Leadership 0
163
HUN HUNTSMAN CORP
We will operate safe, clean, efficient facilities in an environmentally and socially responsible manner.
We will provide a work environment that fosters teamwork, innovation, accountability and open communication.
We will place into society assistance for those who suffer, hope for those who may need inspiration and education for those who may feel the
challenge but do not have the means
We have an aggressive growth
philosophy which reflects the spirit of free enterprise and maximization
of long term profits, the best
motives for creating mutual
benefits for customers, employees,
suppliers and the communities in which we are
located
1
INTC INTEL CORP Delight our customers, employees, and shareholders by relentlessly delivering the platform and technology advancements that become essential to the
way we work and live
0
IP INTL PAPER CO International Paper is dedicated to making people's lives better. Our employees use renewable resources to make products people depend on every day. Our customers succeed because our innovative products and services make their businesses better. Our communities welcome us as neighbors, employers and environmental stewards. Our shareowners
benefit from our superior financial performances. By keeping our promises, we deliver results.
International Paper will be one of the
best and most respected
companies in the world - as
measured by our employees, our customers, our
communities and our shareowners
1
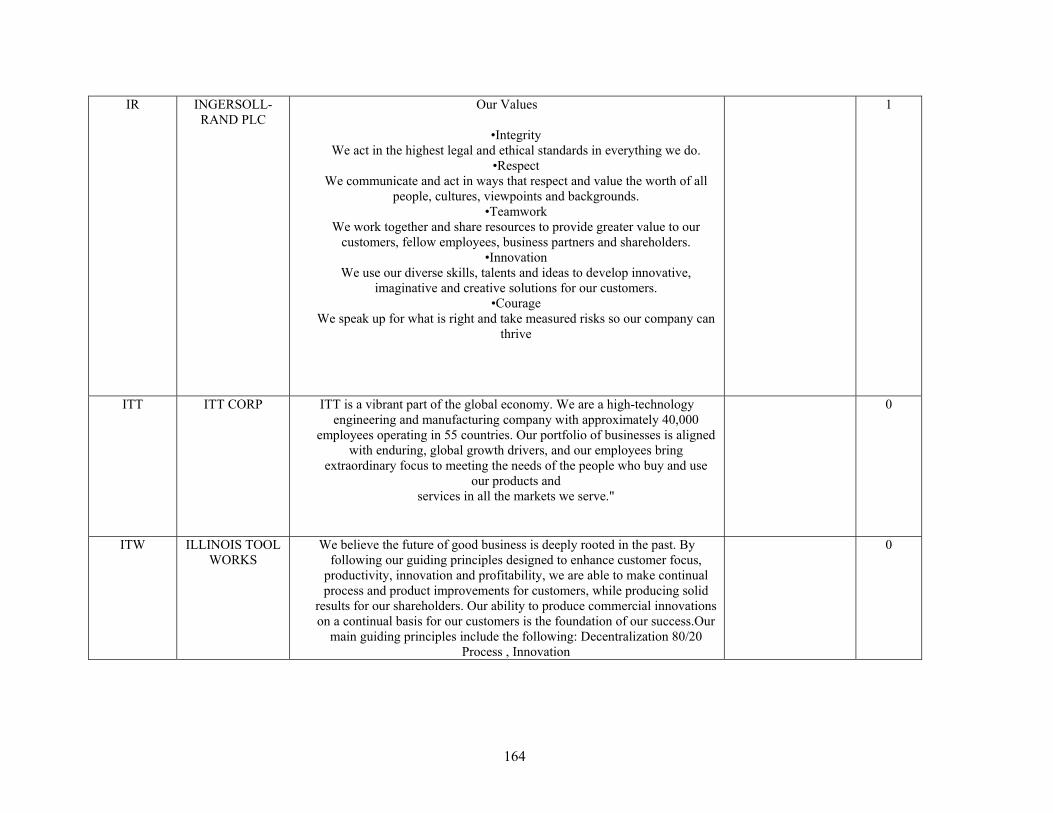
164
IR INGERSOLL-RAND PLC
Our Values
•Integrity We act in the highest legal and ethical standards in everything we do.
•Respect We communicate and act in ways that respect and value the worth of all
people, cultures, viewpoints and backgrounds. •Teamwork
We work together and share resources to provide greater value to our customers, fellow employees, business partners and shareholders.
•Innovation We use our diverse skills, talents and ideas to develop innovative,
imaginative and creative solutions for our customers. •Courage
We speak up for what is right and take measured risks so our company can thrive
1
ITT ITT CORP ITT is a vibrant part of the global economy. We are a high-technology engineering and manufacturing company with approximately 40,000
employees operating in 55 countries. Our portfolio of businesses is aligned with enduring, global growth drivers, and our employees bring
extraordinary focus to meeting the needs of the people who buy and use our products and
services in all the markets we serve."
0
ITW ILLINOIS TOOL WORKS
We believe the future of good business is deeply rooted in the past. By following our guiding principles designed to enhance customer focus,
productivity, innovation and profitability, we are able to make continual process and product improvements for customers, while producing solid
results for our shareholders. Our ability to produce commercial innovations on a continual basis for our customers is the foundation of our success.Our
main guiding principles include the following: Decentralization 80/20 Process , Innovation
0
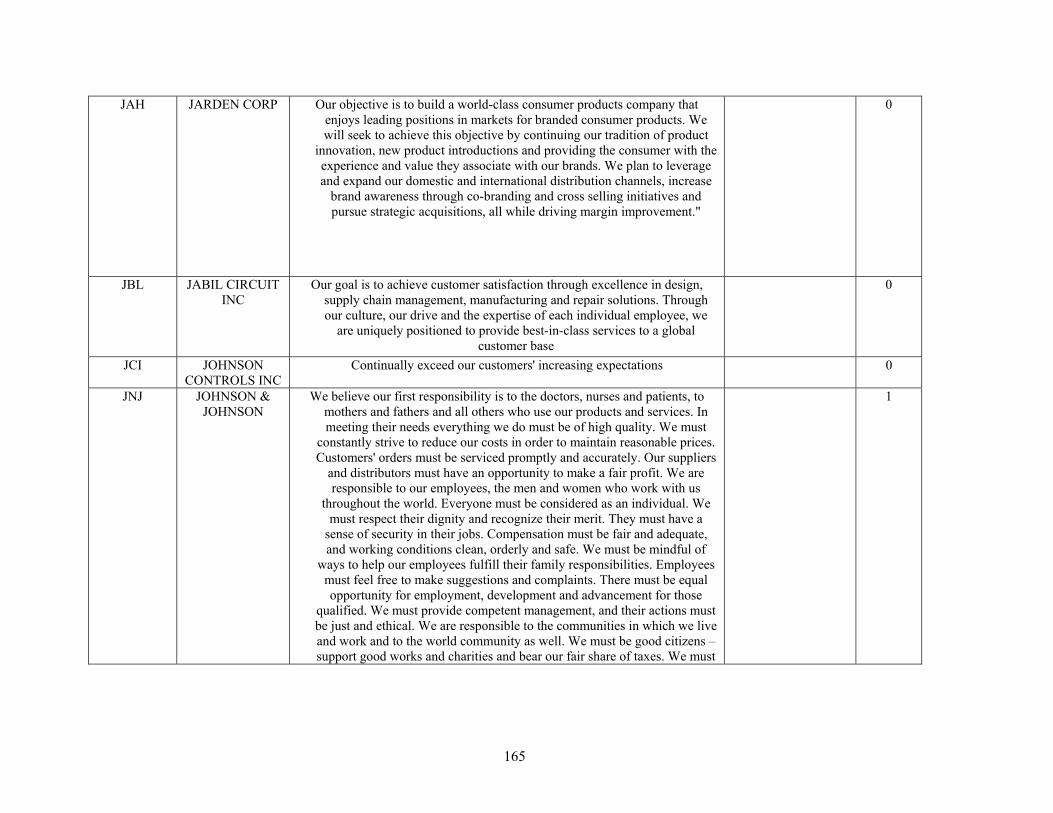
165
JAH JARDEN CORP Our objective is to build a world-class consumer products company that enjoys leading positions in markets for branded consumer products. We will seek to achieve this objective by continuing our tradition of product
innovation, new product introductions and providing the consumer with the experience and value they associate with our brands. We plan to leverage and expand our domestic and international distribution channels, increase
brand awareness through co-branding and cross selling initiatives and pursue strategic acquisitions, all while driving margin improvement."
0
JBL JABIL CIRCUIT INC
Our goal is to achieve customer satisfaction through excellence in design, supply chain management, manufacturing and repair solutions. Through our culture, our drive and the expertise of each individual employee, we
are uniquely positioned to provide best-in-class services to a global customer base
0
JCI JOHNSON CONTROLS INC
Continually exceed our customers' increasing expectations 0
JNJ JOHNSON & JOHNSON
We believe our first responsibility is to the doctors, nurses and patients, to mothers and fathers and all others who use our products and services. In meeting their needs everything we do must be of high quality. We must
constantly strive to reduce our costs in order to maintain reasonable prices.Customers' orders must be serviced promptly and accurately. Our suppliers
and distributors must have an opportunity to make a fair profit. We are responsible to our employees, the men and women who work with us
throughout the world. Everyone must be considered as an individual. We must respect their dignity and recognize their merit. They must have a
sense of security in their jobs. Compensation must be fair and adequate, and working conditions clean, orderly and safe. We must be mindful of
ways to help our employees fulfill their family responsibilities. Employees must feel free to make suggestions and complaints. There must be equal opportunity for employment, development and advancement for those
qualified. We must provide competent management, and their actions must be just and ethical. We are responsible to the communities in which we live and work and to the world community as well. We must be good citizens – support good works and charities and bear our fair share of taxes. We must
1
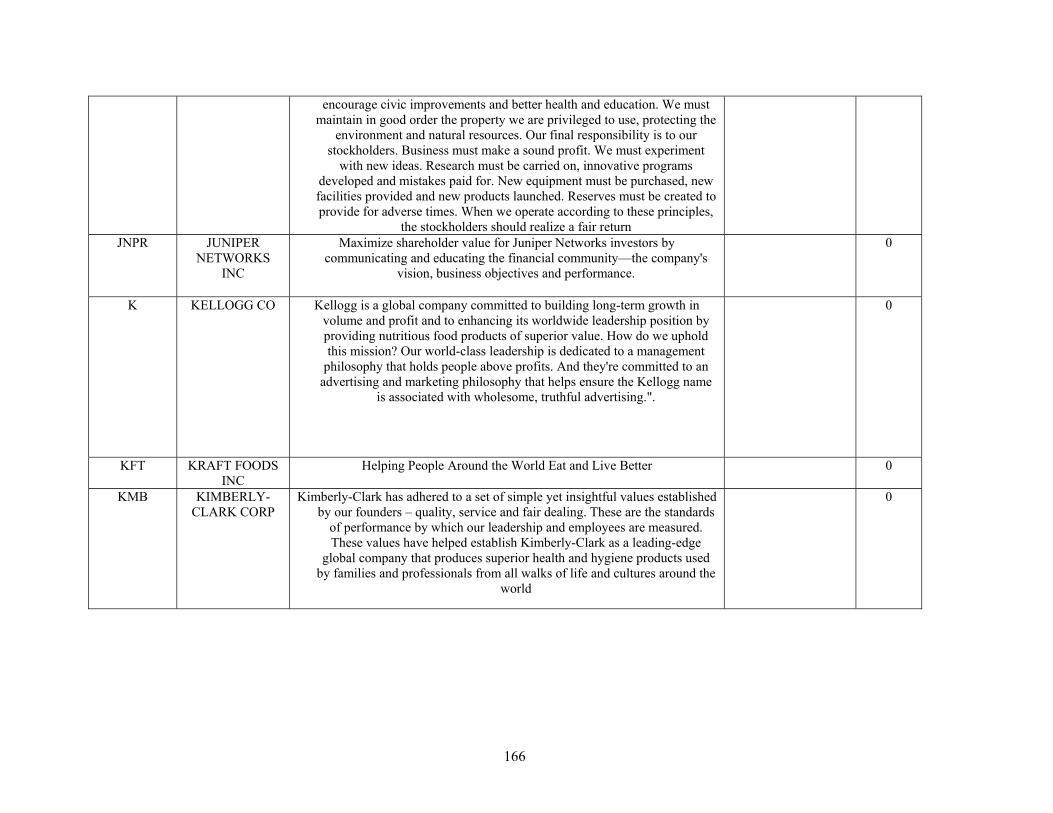
166
encourage civic improvements and better health and education. We must maintain in good order the property we are privileged to use, protecting the
environment and natural resources. Our final responsibility is to our stockholders. Business must make a sound profit. We must experiment
with new ideas. Research must be carried on, innovative programs developed and mistakes paid for. New equipment must be purchased, new facilities provided and new products launched. Reserves must be created to provide for adverse times. When we operate according to these principles,
the stockholders should realize a fair return JNPR JUNIPER
NETWORKS INC
Maximize shareholder value for Juniper Networks investors by communicating and educating the financial community—the company's
vision, business objectives and performance.
0
K KELLOGG CO Kellogg is a global company committed to building long-term growth in volume and profit and to enhancing its worldwide leadership position by providing nutritious food products of superior value. How do we uphold this mission? Our world-class leadership is dedicated to a management
philosophy that holds people above profits. And they're committed to an advertising and marketing philosophy that helps ensure the Kellogg name
is associated with wholesome, truthful advertising.".
0
KFT KRAFT FOODS INC
Helping People Around the World Eat and Live Better 0
KMB KIMBERLY-CLARK CORP
Kimberly-Clark has adhered to a set of simple yet insightful values established by our founders – quality, service and fair dealing. These are the standards
of performance by which our leadership and employees are measured. These values have helped establish Kimberly-Clark as a leading-edge
global company that produces superior health and hygiene products used by families and professionals from all walks of life and cultures around the
world
0
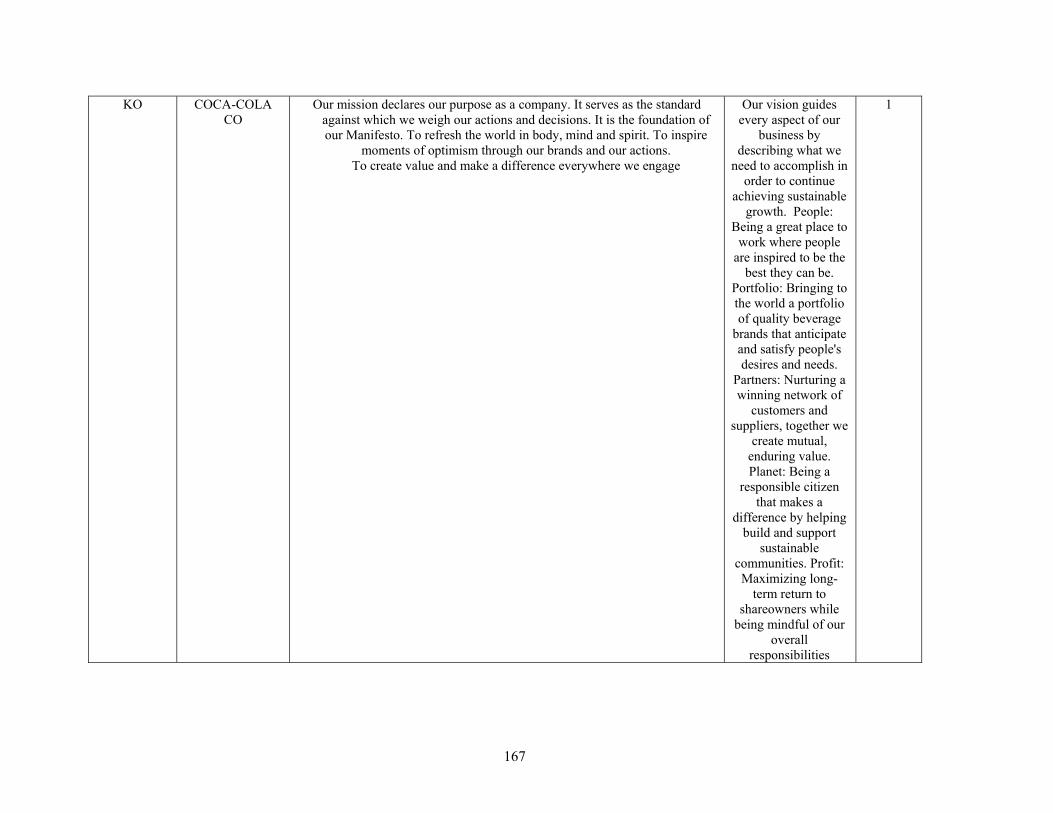
167
KO COCA-COLA CO
Our mission declares our purpose as a company. It serves as the standard against which we weigh our actions and decisions. It is the foundation of our Manifesto. To refresh the world in body, mind and spirit. To inspire
moments of optimism through our brands and our actions. To create value and make a difference everywhere we engage
Our vision guides every aspect of our
business by describing what we
need to accomplish in order to continue
achieving sustainable growth. People:
Being a great place to work where people
are inspired to be the best they can be.
Portfolio: Bringing to the world a portfolio of quality beverage
brands that anticipate and satisfy people's desires and needs.
Partners: Nurturing a winning network of
customers and suppliers, together we
create mutual, enduring value. Planet: Being a
responsible citizen that makes a
difference by helping build and support
sustainable communities. Profit: Maximizing long-
term return to shareowners while
being mindful of our overall
responsibilities
1
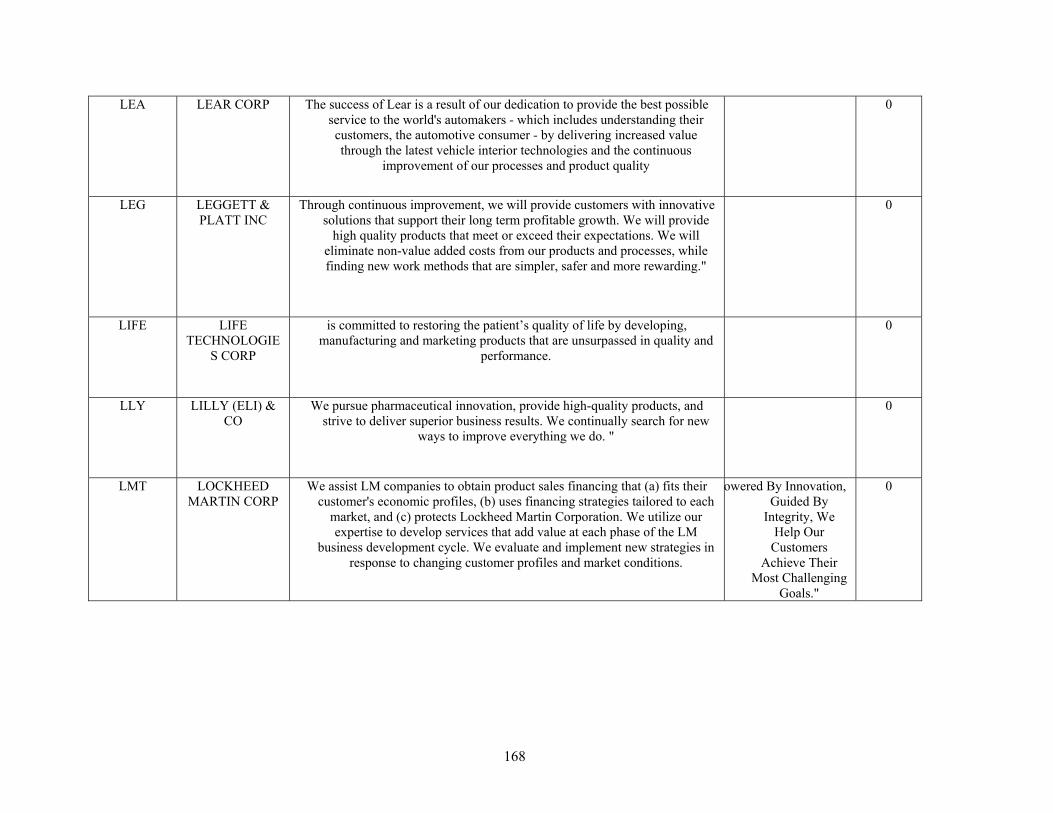
168
LEA LEAR CORP The success of Lear is a result of our dedication to provide the best possible service to the world's automakers - which includes understanding their customers, the automotive consumer - by delivering increased value through the latest vehicle interior technologies and the continuous
improvement of our processes and product quality
0
LEG LEGGETT & PLATT INC
Through continuous improvement, we will provide customers with innovative solutions that support their long term profitable growth. We will provide
high quality products that meet or exceed their expectations. We will eliminate non-value added costs from our products and processes, while finding new work methods that are simpler, safer and more rewarding."
0
LIFE LIFE TECHNOLOGIE
S CORP
is committed to restoring the patient’s quality of life by developing, manufacturing and marketing products that are unsurpassed in quality and
performance.
0
LLY LILLY (ELI) & CO
We pursue pharmaceutical innovation, provide high-quality products, and strive to deliver superior business results. We continually search for new
ways to improve everything we do. "
0
LMT LOCKHEED MARTIN CORP
We assist LM companies to obtain product sales financing that (a) fits their customer's economic profiles, (b) uses financing strategies tailored to each
market, and (c) protects Lockheed Martin Corporation. We utilize our expertise to develop services that add value at each phase of the LM
business development cycle. We evaluate and implement new strategies in response to changing customer profiles and market conditions.
owered By Innovation, Guided By
Integrity, We Help Our
Customers Achieve Their
Most Challenging Goals."
0
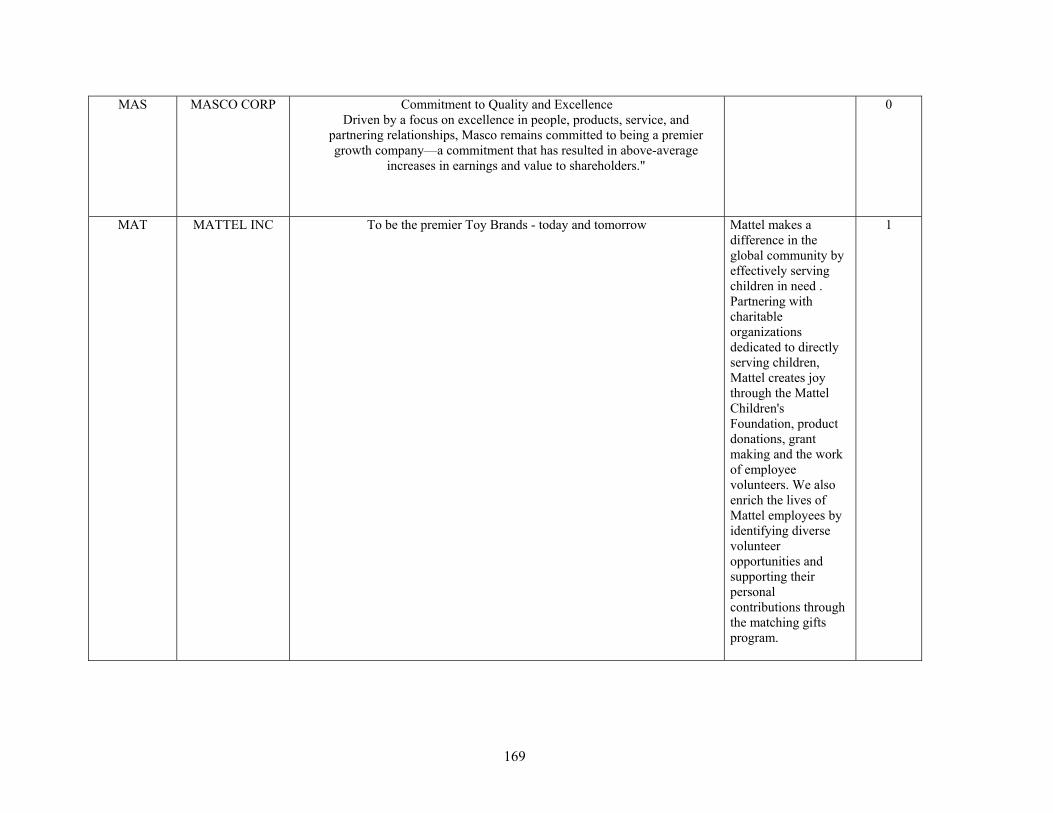
169
MAS MASCO CORP Commitment to Quality and Excellence Driven by a focus on excellence in people, products, service, and
partnering relationships, Masco remains committed to being a premier growth company—a commitment that has resulted in above-average
increases in earnings and value to shareholders."
0
MAT MATTEL INC To be the premier Toy Brands - today and tomorrow Mattel makes a difference in the global community by effectively serving children in need . Partnering with charitable organizations dedicated to directly serving children, Mattel creates joy through the Mattel Children's Foundation, product donations, grant making and the work of employee volunteers. We also enrich the lives of Mattel employees by identifying diverse volunteer opportunities and supporting their personal contributions through the matching gifts program.
1
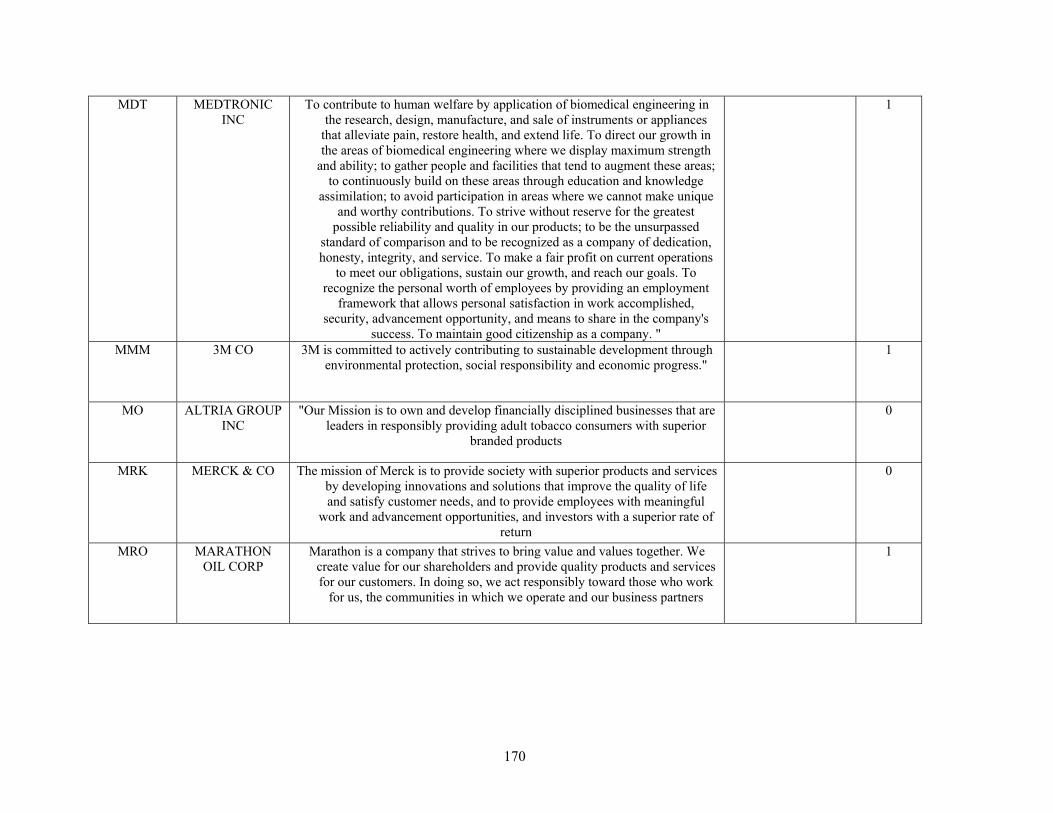
170
MDT MEDTRONIC INC
To contribute to human welfare by application of biomedical engineering in the research, design, manufacture, and sale of instruments or appliances
that alleviate pain, restore health, and extend life. To direct our growth in the areas of biomedical engineering where we display maximum strength
and ability; to gather people and facilities that tend to augment these areas; to continuously build on these areas through education and knowledge
assimilation; to avoid participation in areas where we cannot make unique and worthy contributions. To strive without reserve for the greatest
possible reliability and quality in our products; to be the unsurpassed standard of comparison and to be recognized as a company of dedication, honesty, integrity, and service. To make a fair profit on current operations
to meet our obligations, sustain our growth, and reach our goals. To recognize the personal worth of employees by providing an employment
framework that allows personal satisfaction in work accomplished, security, advancement opportunity, and means to share in the company's
success. To maintain good citizenship as a company. "
1
MMM 3M CO 3M is committed to actively contributing to sustainable development through environmental protection, social responsibility and economic progress."
1
MO ALTRIA GROUP INC
"Our Mission is to own and develop financially disciplined businesses that are leaders in responsibly providing adult tobacco consumers with superior
branded products
0
MRK MERCK & CO The mission of Merck is to provide society with superior products and services by developing innovations and solutions that improve the quality of life and satisfy customer needs, and to provide employees with meaningful
work and advancement opportunities, and investors with a superior rate of return
0
MRO MARATHON OIL CORP
Marathon is a company that strives to bring value and values together. We create value for our shareholders and provide quality products and services for our customers. In doing so, we act responsibly toward those who work
for us, the communities in which we operate and our business partners
1
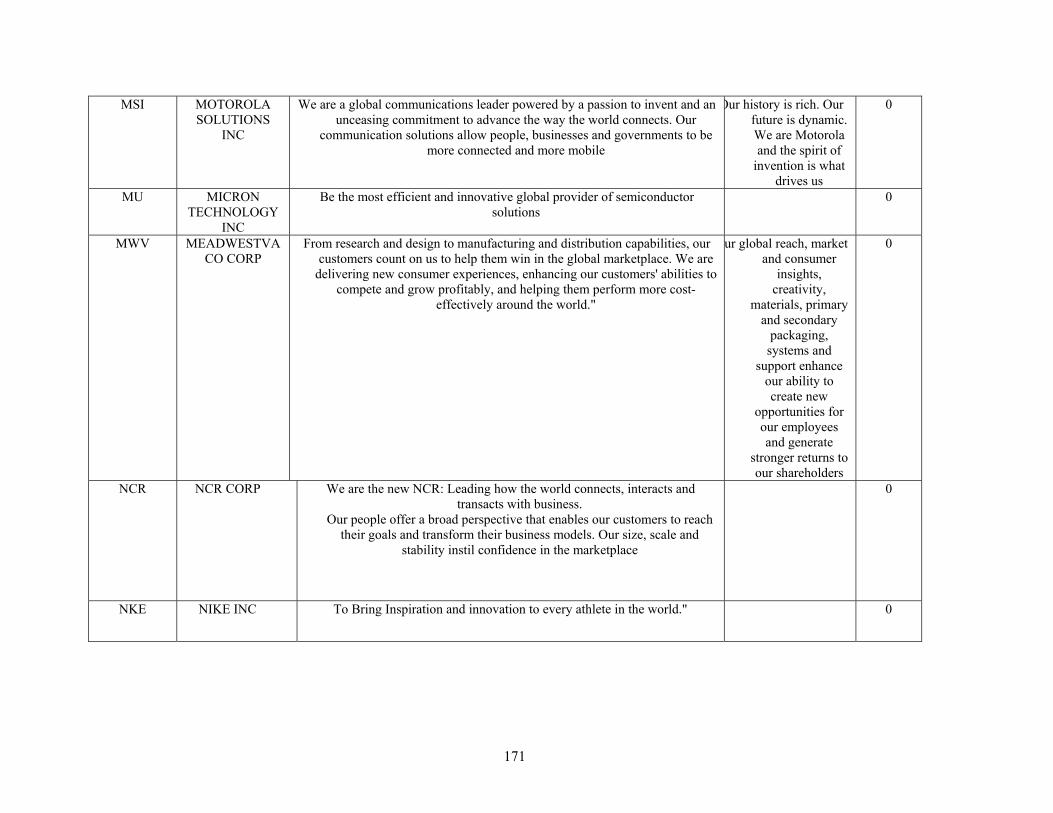
171
MSI MOTOROLA SOLUTIONS
INC
We are a global communications leader powered by a passion to invent and an unceasing commitment to advance the way the world connects. Our
communication solutions allow people, businesses and governments to be more connected and more mobile
Our history is rich. Our future is dynamic. We are Motorola and the spirit of
invention is what drives us
0
MU MICRON TECHNOLOGY
INC
Be the most efficient and innovative global provider of semiconductor solutions
0
MWV MEADWESTVACO CORP
From research and design to manufacturing and distribution capabilities, our customers count on us to help them win in the global marketplace. We are
delivering new consumer experiences, enhancing our customers' abilities to compete and grow profitably, and helping them perform more cost-
effectively around the world."
ur global reach, market and consumer
insights, creativity,
materials, primary and secondary
packaging, systems and
support enhance our ability to create new
opportunities for our employees and generate
stronger returns to our shareholders
0
NCR NCR CORP We are the new NCR: Leading how the world connects, interacts and transacts with business.
Our people offer a broad perspective that enables our customers to reach their goals and transform their business models. Our size, scale and
stability instil confidence in the marketplace
0
NKE NIKE INC To Bring Inspiration and innovation to every athlete in the world." 0
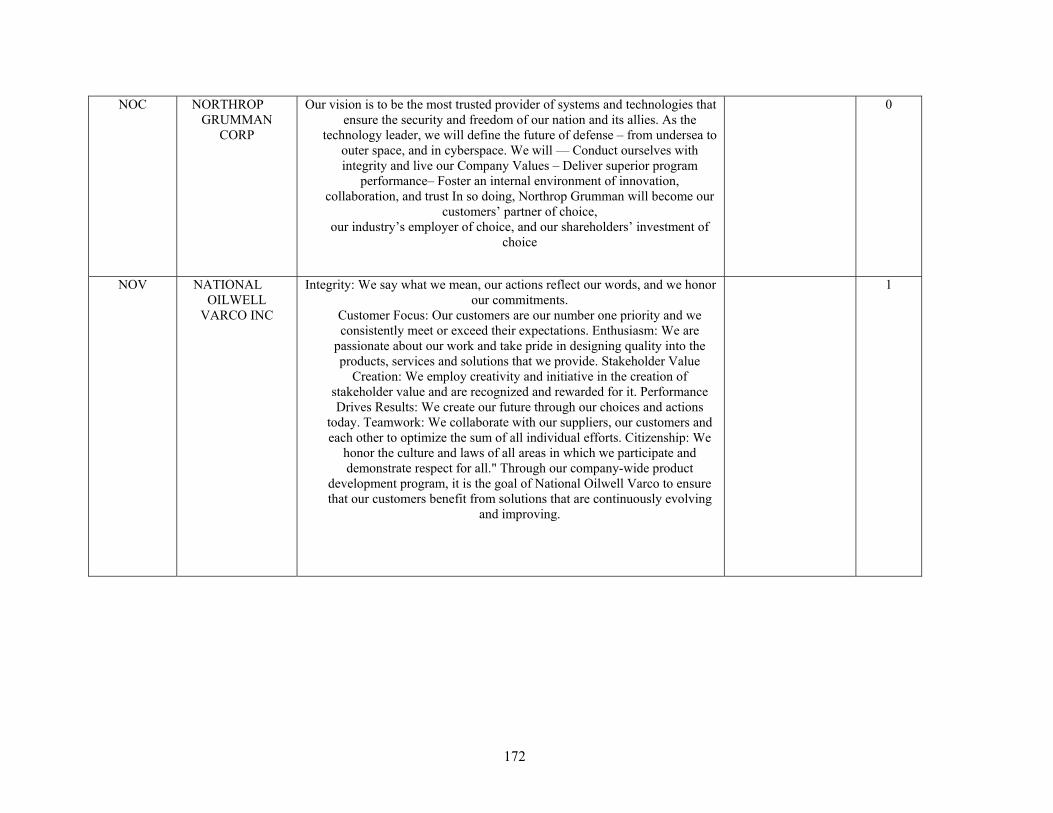
172
NOC NORTHROP GRUMMAN
CORP
Our vision is to be the most trusted provider of systems and technologies that ensure the security and freedom of our nation and its allies. As the
technology leader, we will define the future of defense – from undersea to outer space, and in cyberspace. We will –– Conduct ourselves with integrity and live our Company Values – Deliver superior program
performance– Foster an internal environment of innovation, collaboration, and trust In so doing, Northrop Grumman will become our
customers’ partner of choice, our industry’s employer of choice, and our shareholders’ investment of
choice
0
NOV NATIONAL OILWELL
VARCO INC
Integrity: We say what we mean, our actions reflect our words, and we honor our commitments.
Customer Focus: Our customers are our number one priority and we consistently meet or exceed their expectations. Enthusiasm: We are
passionate about our work and take pride in designing quality into the products, services and solutions that we provide. Stakeholder Value
Creation: We employ creativity and initiative in the creation of stakeholder value and are recognized and rewarded for it. Performance Drives Results: We create our future through our choices and actions
today. Teamwork: We collaborate with our suppliers, our customers and each other to optimize the sum of all individual efforts. Citizenship: We
honor the culture and laws of all areas in which we participate and demonstrate respect for all." Through our company-wide product
development program, it is the goal of National Oilwell Varco to ensure that our customers benefit from solutions that are continuously evolving
and improving.
1
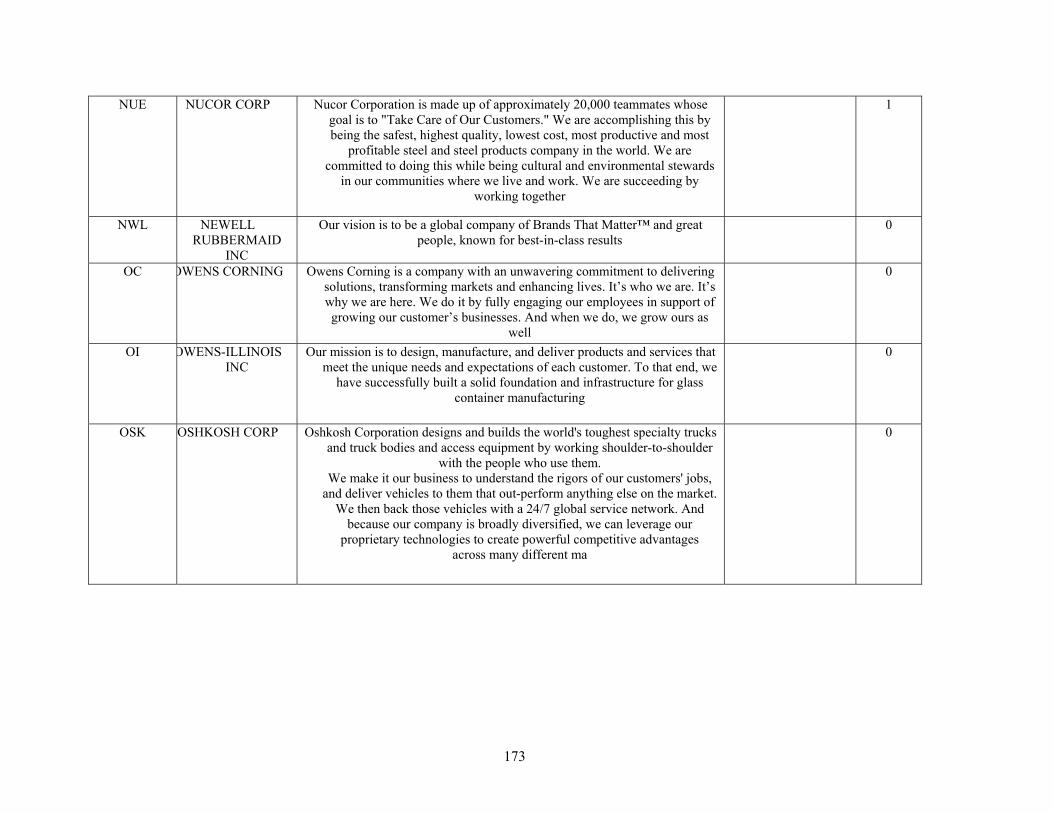
173
NUE NUCOR CORP Nucor Corporation is made up of approximately 20,000 teammates whose goal is to "Take Care of Our Customers." We are accomplishing this by being the safest, highest quality, lowest cost, most productive and most
profitable steel and steel products company in the world. We are committed to doing this while being cultural and environmental stewards
in our communities where we live and work. We are succeeding by working together
1
NWL NEWELL RUBBERMAID
INC
Our vision is to be a global company of Brands That Matter™ and great people, known for best-in-class results
0
OC OWENS CORNING Owens Corning is a company with an unwavering commitment to delivering solutions, transforming markets and enhancing lives. It’s who we are. It’s why we are here. We do it by fully engaging our employees in support of growing our customer’s businesses. And when we do, we grow ours as
well
0
OI OWENS-ILLINOIS INC
Our mission is to design, manufacture, and deliver products and services that meet the unique needs and expectations of each customer. To that end, we
have successfully built a solid foundation and infrastructure for glass container manufacturing
0
OSK OSHKOSH CORP Oshkosh Corporation designs and builds the world's toughest specialty trucks and truck bodies and access equipment by working shoulder-to-shoulder
with the people who use them. We make it our business to understand the rigors of our customers' jobs,
and deliver vehicles to them that out-perform anything else on the market. We then back those vehicles with a 24/7 global service network. And
because our company is broadly diversified, we can leverage our proprietary technologies to create powerful competitive advantages
across many different ma
0
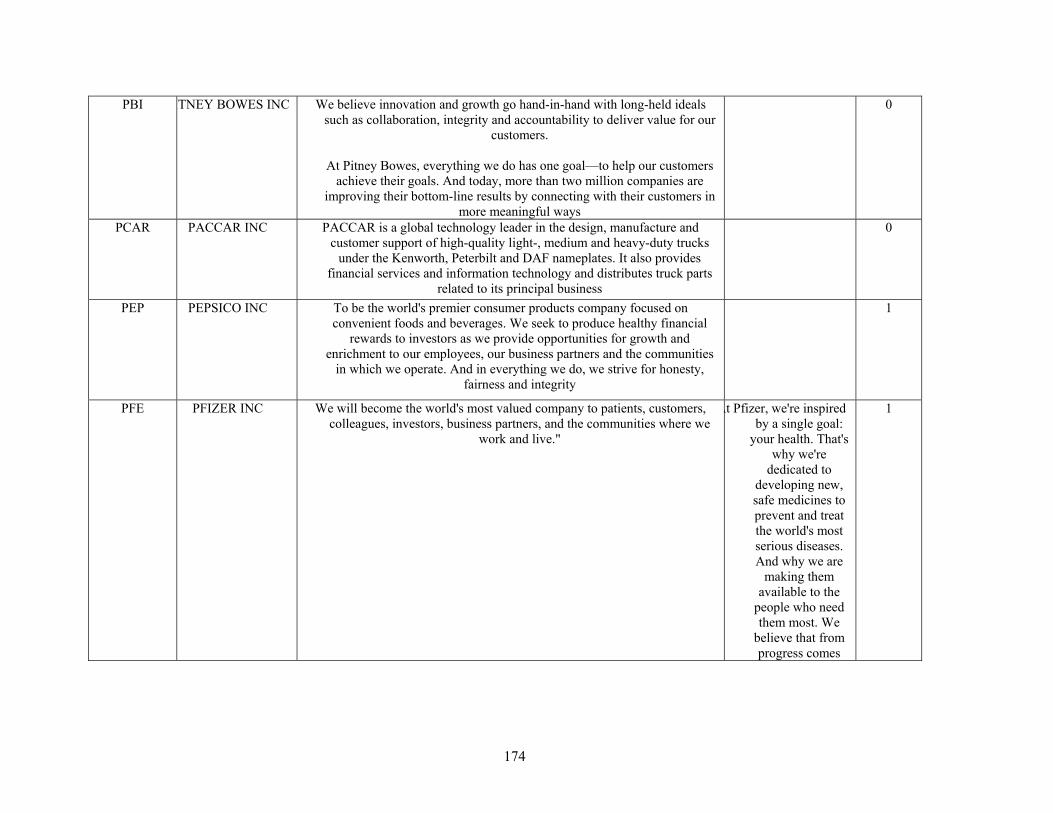
174
PBI ITNEY BOWES INC We believe innovation and growth go hand-in-hand with long-held ideals such as collaboration, integrity and accountability to deliver value for our
customers.
At Pitney Bowes, everything we do has one goal—to help our customers achieve their goals. And today, more than two million companies are
improving their bottom-line results by connecting with their customers in more meaningful ways
0
PCAR PACCAR INC PACCAR is a global technology leader in the design, manufacture and customer support of high-quality light-, medium and heavy-duty trucks
under the Kenworth, Peterbilt and DAF nameplates. It also provides financial services and information technology and distributes truck parts
related to its principal business
0
PEP PEPSICO INC To be the world's premier consumer products company focused on convenient foods and beverages. We seek to produce healthy financial
rewards to investors as we provide opportunities for growth and enrichment to our employees, our business partners and the communities
in which we operate. And in everything we do, we strive for honesty, fairness and integrity
1
PFE PFIZER INC We will become the world's most valued company to patients, customers, colleagues, investors, business partners, and the communities where we
work and live."
At Pfizer, we're inspired by a single goal:
your health. That's why we're
dedicated to developing new, safe medicines to prevent and treat the world's most serious diseases. And why we are
making them available to the
people who need them most. We
believe that from progress comes
1
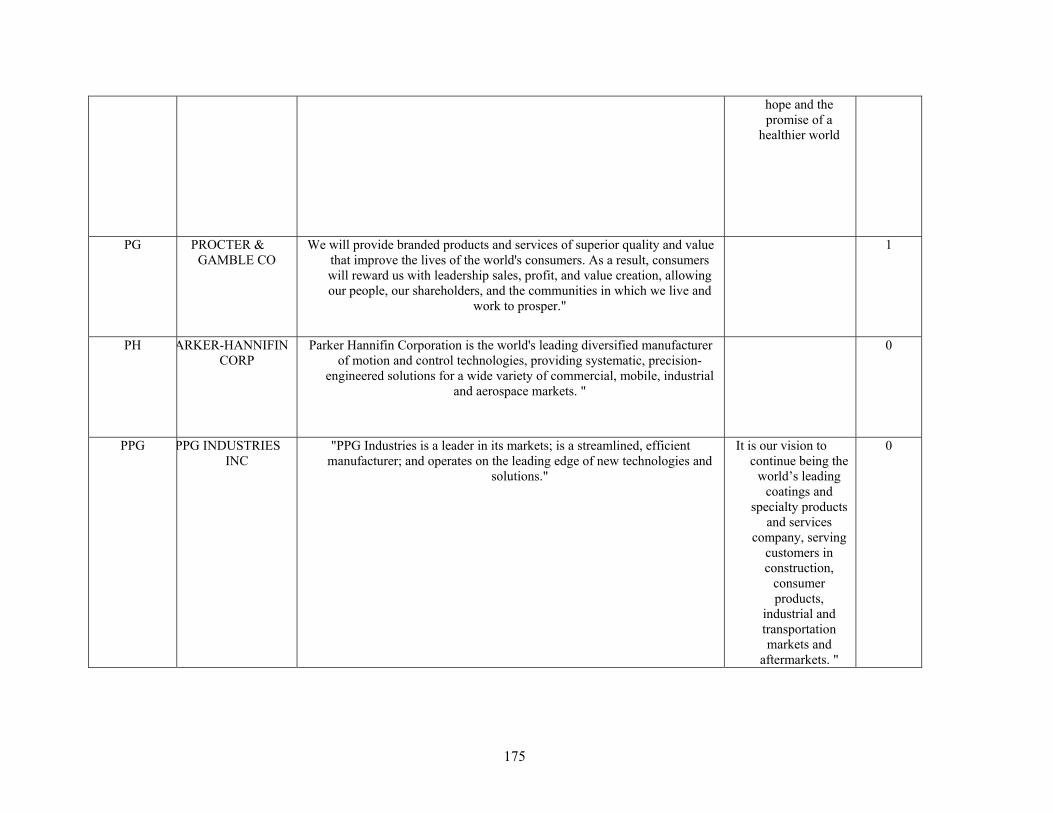
175
hope and the promise of a
healthier world
PG PROCTER & GAMBLE CO
We will provide branded products and services of superior quality and value that improve the lives of the world's consumers. As a result, consumers will reward us with leadership sales, profit, and value creation, allowing our people, our shareholders, and the communities in which we live and
work to prosper."
1
PH ARKER-HANNIFIN CORP
Parker Hannifin Corporation is the world's leading diversified manufacturer of motion and control technologies, providing systematic, precision-
engineered solutions for a wide variety of commercial, mobile, industrial and aerospace markets. "
0
PPG PPG INDUSTRIES INC
"PPG Industries is a leader in its markets; is a streamlined, efficient manufacturer; and operates on the leading edge of new technologies and
solutions."
It is our vision to continue being the
world’s leading coatings and
specialty products and services
company, serving customers in construction,
consumer products,
industrial and transportation markets and
aftermarkets. "
0
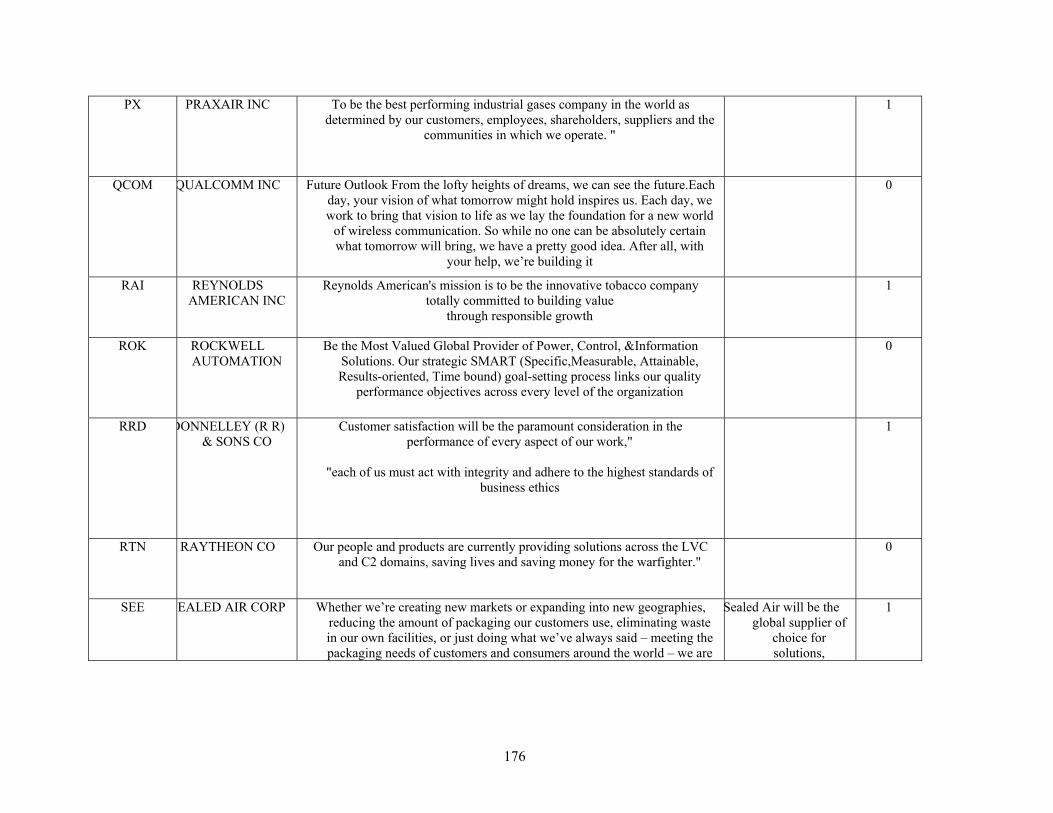
176
PX PRAXAIR INC To be the best performing industrial gases company in the world as determined by our customers, employees, shareholders, suppliers and the
communities in which we operate. "
1
QCOM QUALCOMM INC Future Outlook From the lofty heights of dreams, we can see the future.Each day, your vision of what tomorrow might hold inspires us. Each day, we work to bring that vision to life as we lay the foundation for a new world
of wireless communication. So while no one can be absolutely certain what tomorrow will bring, we have a pretty good idea. After all, with
your help, we’re building it
0
RAI REYNOLDS AMERICAN INC
Reynolds American's mission is to be the innovative tobacco company totally committed to building value
through responsible growth
1
ROK ROCKWELL AUTOMATION
Be the Most Valued Global Provider of Power, Control, &Information Solutions. Our strategic SMART (Specific,Measurable, Attainable, Results-oriented, Time bound) goal-setting process links our quality
performance objectives across every level of the organization
0
RRD DONNELLEY (R R) & SONS CO
Customer satisfaction will be the paramount consideration in the performance of every aspect of our work,"
"each of us must act with integrity and adhere to the highest standards of
business ethics
1
RTN RAYTHEON CO Our people and products are currently providing solutions across the LVC and C2 domains, saving lives and saving money for the warfighter."
0
SEE EALED AIR CORP Whether we’re creating new markets or expanding into new geographies, reducing the amount of packaging our customers use, eliminating waste in our own facilities, or just doing what we’ve always said – meeting the packaging needs of customers and consumers around the world – we are
Sealed Air will be the global supplier of
choice for solutions,
1
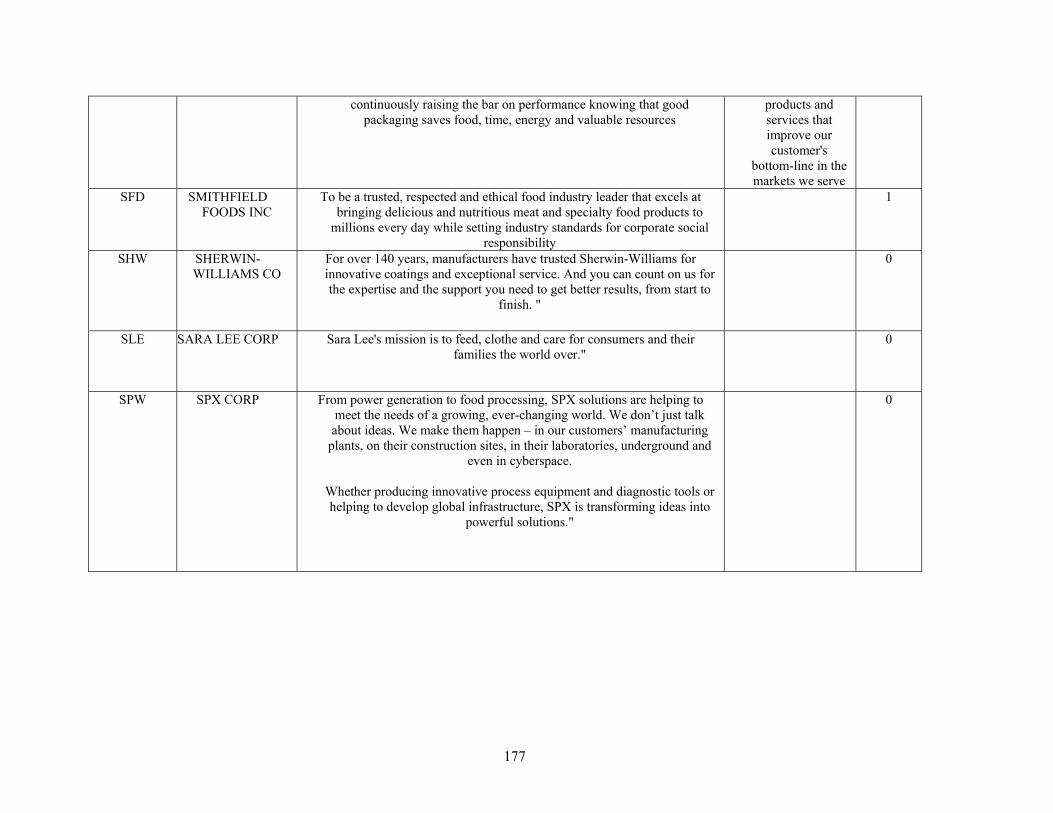
177
continuously raising the bar on performance knowing that good packaging saves food, time, energy and valuable resources
products and services that improve our customer's
bottom-line in the markets we serve
SFD SMITHFIELD FOODS INC
To be a trusted, respected and ethical food industry leader that excels at bringing delicious and nutritious meat and specialty food products to
millions every day while setting industry standards for corporate social responsibility
1
SHW SHERWIN-WILLIAMS CO
For over 140 years, manufacturers have trusted Sherwin-Williams for innovative coatings and exceptional service. And you can count on us for the expertise and the support you need to get better results, from start to
finish. "
0
SLE SARA LEE CORP Sara Lee's mission is to feed, clothe and care for consumers and their families the world over."
0
SPW SPX CORP From power generation to food processing, SPX solutions are helping to meet the needs of a growing, ever-changing world. We don’t just talk about ideas. We make them happen – in our customers’ manufacturing
plants, on their construction sites, in their laboratories, underground and even in cyberspace.
Whether producing innovative process equipment and diagnostic tools or helping to develop global infrastructure, SPX is transforming ideas into
powerful solutions."
0
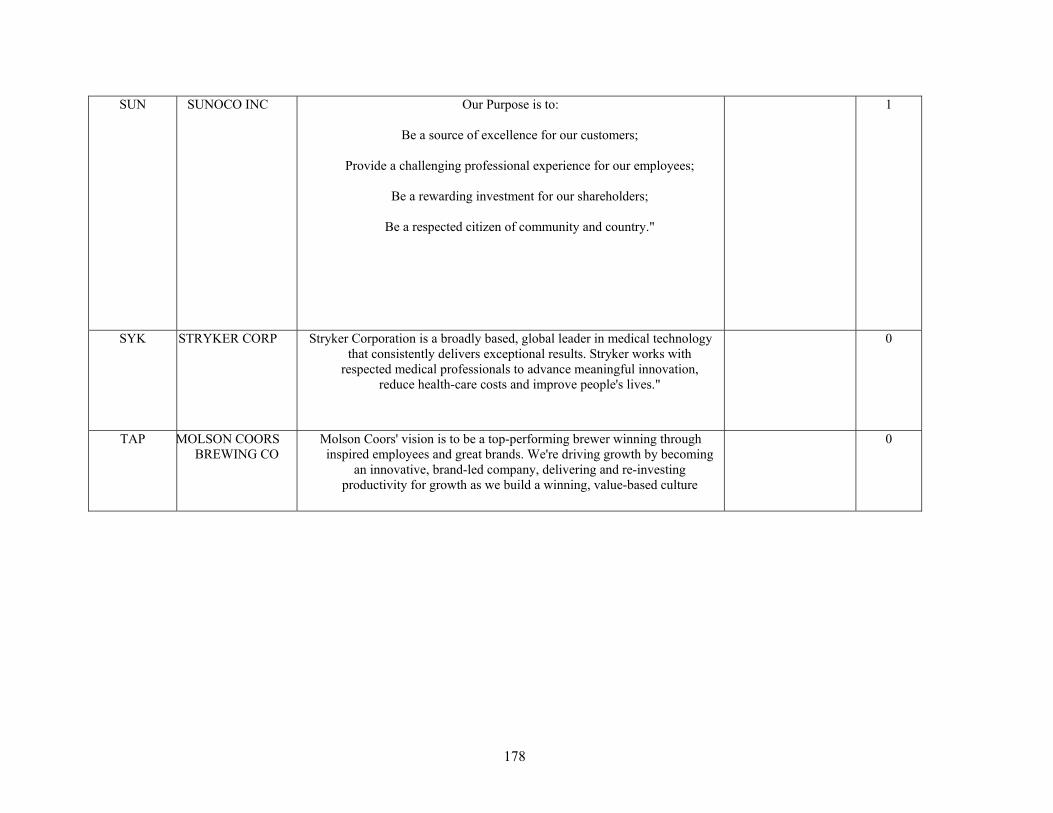
178
SUN SUNOCO INC Our Purpose is to:
Be a source of excellence for our customers;
Provide a challenging professional experience for our employees;
Be a rewarding investment for our shareholders;
Be a respected citizen of community and country."
1
SYK STRYKER CORP Stryker Corporation is a broadly based, global leader in medical technology that consistently delivers exceptional results. Stryker works with
respected medical professionals to advance meaningful innovation, reduce health-care costs and improve people's lives."
0
TAP MOLSON COORS BREWING CO
Molson Coors' vision is to be a top-performing brewer winning through inspired employees and great brands. We're driving growth by becoming
an innovative, brand-led company, delivering and re-investing productivity for growth as we build a winning, value-based culture
0
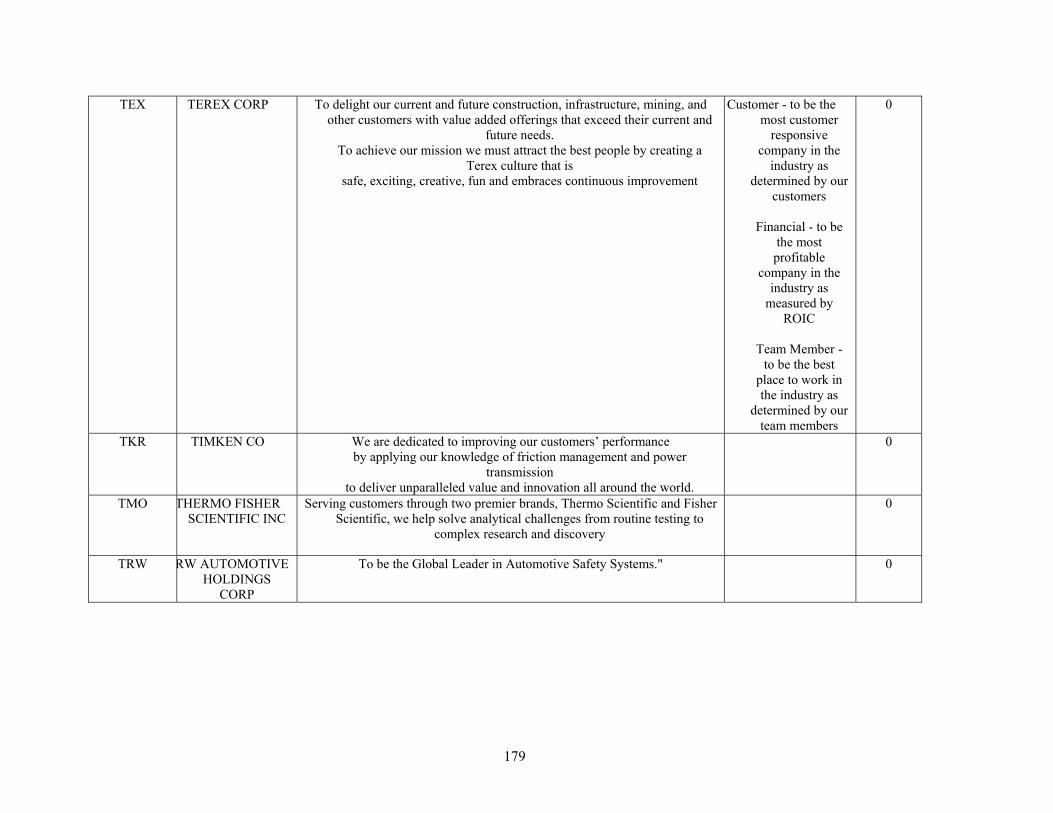
179
TEX TEREX CORP To delight our current and future construction, infrastructure, mining, and other customers with value added offerings that exceed their current and
future needs. To achieve our mission we must attract the best people by creating a
Terex culture that is safe, exciting, creative, fun and embraces continuous improvement
Customer - to be the most customer
responsive company in the
industry as determined by our
customers
Financial - to be the most profitable
company in the industry as
measured by ROIC
Team Member -
to be the best place to work in the industry as
determined by our team members
0
TKR TIMKEN CO We are dedicated to improving our customers’ performance by applying our knowledge of friction management and power
transmission to deliver unparalleled value and innovation all around the world.
0
TMO THERMO FISHER SCIENTIFIC INC
Serving customers through two premier brands, Thermo Scientific and Fisher Scientific, we help solve analytical challenges from routine testing to
complex research and discovery
0
TRW RW AUTOMOTIVE HOLDINGS
CORP
To be the Global Leader in Automotive Safety Systems."
0
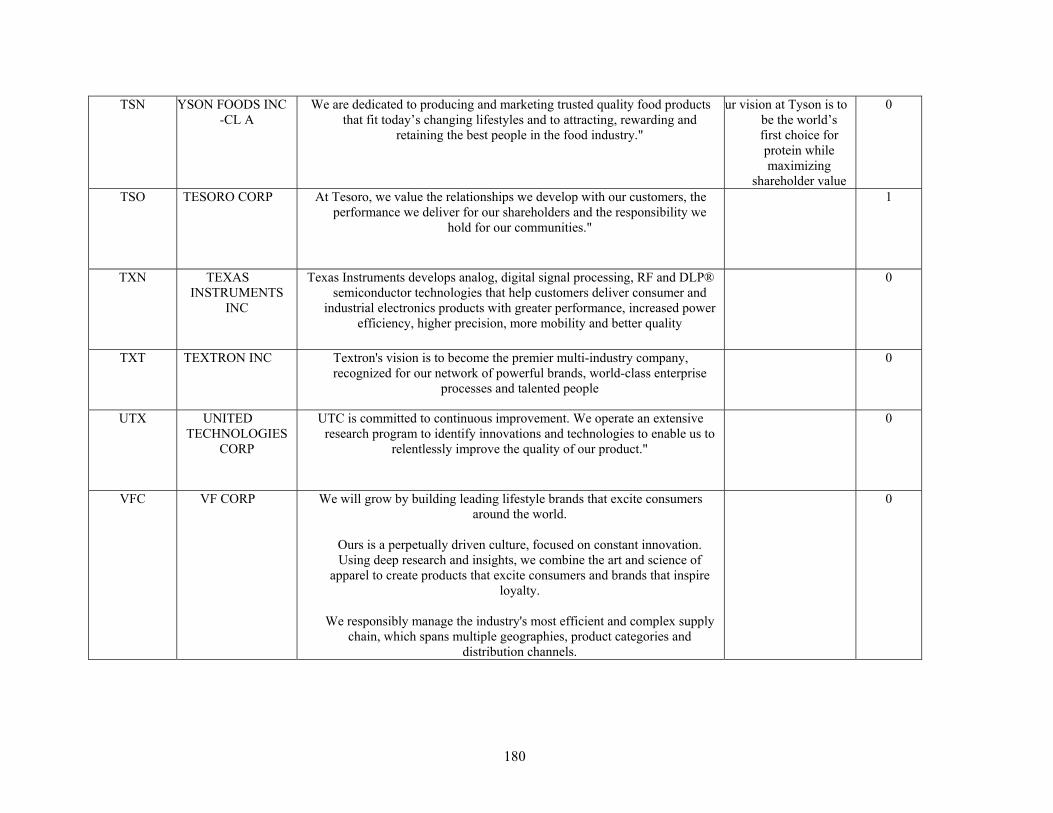
180
TSN YSON FOODS INC -CL A
We are dedicated to producing and marketing trusted quality food products that fit today’s changing lifestyles and to attracting, rewarding and
retaining the best people in the food industry."
ur vision at Tyson is to be the world’s first choice for protein while maximizing
shareholder value
0
TSO TESORO CORP At Tesoro, we value the relationships we develop with our customers, the performance we deliver for our shareholders and the responsibility we
hold for our communities."
1
TXN TEXAS INSTRUMENTS
INC
Texas Instruments develops analog, digital signal processing, RF and DLP® semiconductor technologies that help customers deliver consumer and
industrial electronics products with greater performance, increased power efficiency, higher precision, more mobility and better quality
0
TXT TEXTRON INC Textron's vision is to become the premier multi-industry company, recognized for our network of powerful brands, world-class enterprise
processes and talented people
0
UTX UNITED TECHNOLOGIES
CORP
UTC is committed to continuous improvement. We operate an extensive research program to identify innovations and technologies to enable us to
relentlessly improve the quality of our product."
0
VFC VF CORP We will grow by building leading lifestyle brands that excite consumers around the world.
Ours is a perpetually driven culture, focused on constant innovation. Using deep research and insights, we combine the art and science of
apparel to create products that excite consumers and brands that inspire loyalty.
We responsibly manage the industry's most efficient and complex supply
chain, which spans multiple geographies, product categories and distribution channels.
0
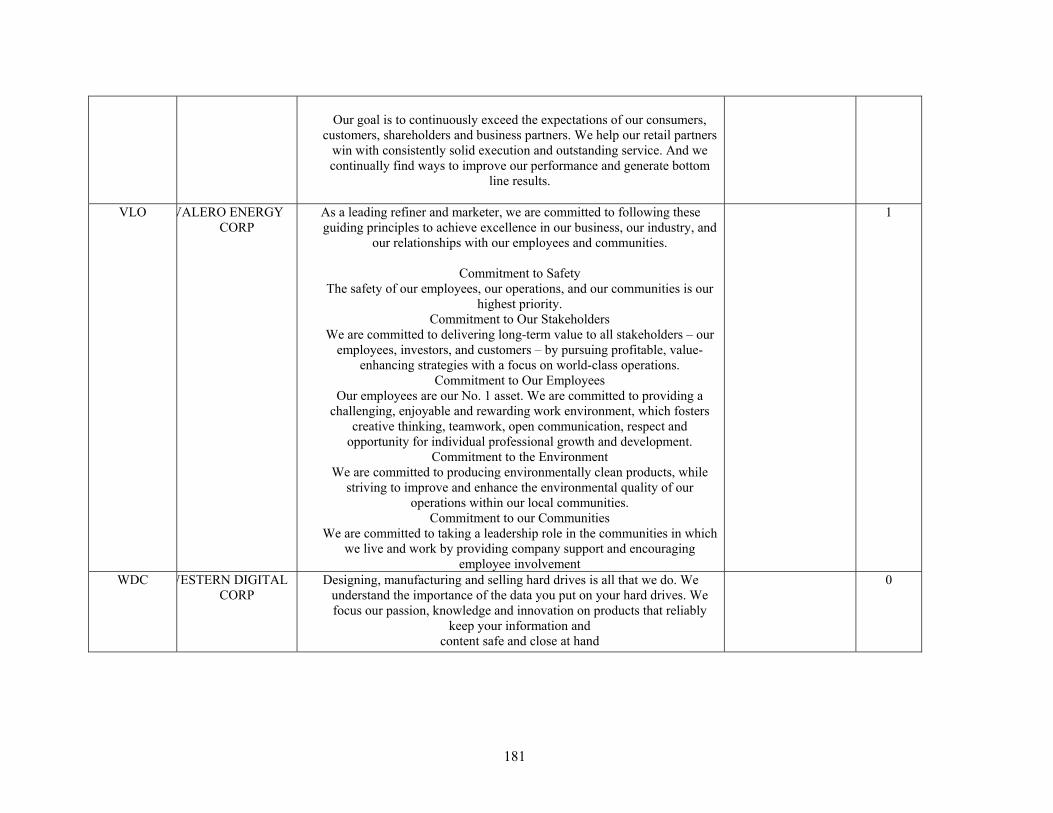
181
Our goal is to continuously exceed the expectations of our consumers,
customers, shareholders and business partners. We help our retail partners win with consistently solid execution and outstanding service. And we continually find ways to improve our performance and generate bottom
line results.
VLO VALERO ENERGY CORP
As a leading refiner and marketer, we are committed to following these guiding principles to achieve excellence in our business, our industry, and
our relationships with our employees and communities.
Commitment to Safety The safety of our employees, our operations, and our communities is our
highest priority. Commitment to Our Stakeholders
We are committed to delivering long-term value to all stakeholders – our employees, investors, and customers – by pursuing profitable, value-
enhancing strategies with a focus on world-class operations. Commitment to Our Employees
Our employees are our No. 1 asset. We are committed to providing a challenging, enjoyable and rewarding work environment, which fosters
creative thinking, teamwork, open communication, respect and opportunity for individual professional growth and development.
Commitment to the Environment We are committed to producing environmentally clean products, while
striving to improve and enhance the environmental quality of our operations within our local communities.
Commitment to our Communities We are committed to taking a leadership role in the communities in which
we live and work by providing company support and encouraging employee involvement
1
WDC WESTERN DIGITAL CORP
Designing, manufacturing and selling hard drives is all that we do. We understand the importance of the data you put on your hard drives. We focus our passion, knowledge and innovation on products that reliably
keep your information and content safe and close at hand
0
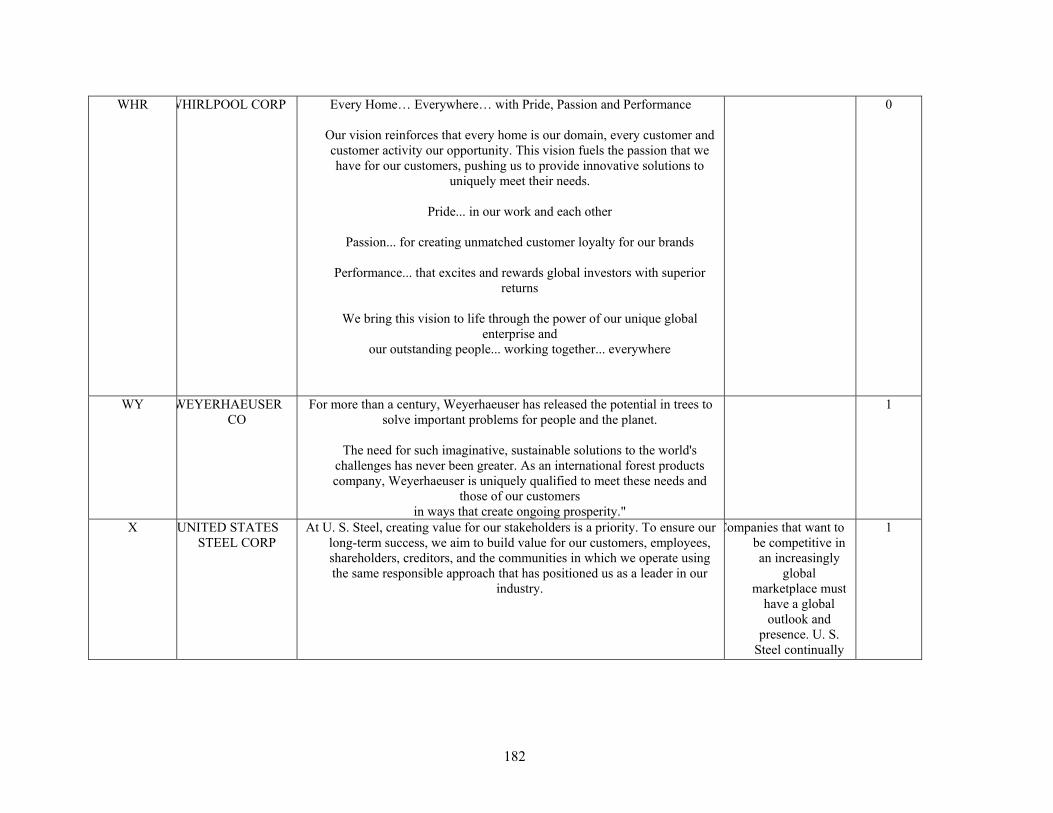
182
WHR WHIRLPOOL CORP Every Home… Everywhere… with Pride, Passion and Performance
Our vision reinforces that every home is our domain, every customer and customer activity our opportunity. This vision fuels the passion that we have for our customers, pushing us to provide innovative solutions to
uniquely meet their needs.
Pride... in our work and each other
Passion... for creating unmatched customer loyalty for our brands
Performance... that excites and rewards global investors with superior returns
We bring this vision to life through the power of our unique global
enterprise and our outstanding people... working together... everywhere
0
WY WEYERHAEUSER CO
For more than a century, Weyerhaeuser has released the potential in trees to solve important problems for people and the planet.
The need for such imaginative, sustainable solutions to the world's
challenges has never been greater. As an international forest products company, Weyerhaeuser is uniquely qualified to meet these needs and
those of our customers in ways that create ongoing prosperity."
1
X UNITED STATES STEEL CORP
At U. S. Steel, creating value for our stakeholders is a priority. To ensure our long-term success, we aim to build value for our customers, employees, shareholders, creditors, and the communities in which we operate using the same responsible approach that has positioned us as a leader in our
industry.
Companies that want to be competitive in an increasingly
global marketplace must
have a global outlook and
presence. U. S. Steel continually
1
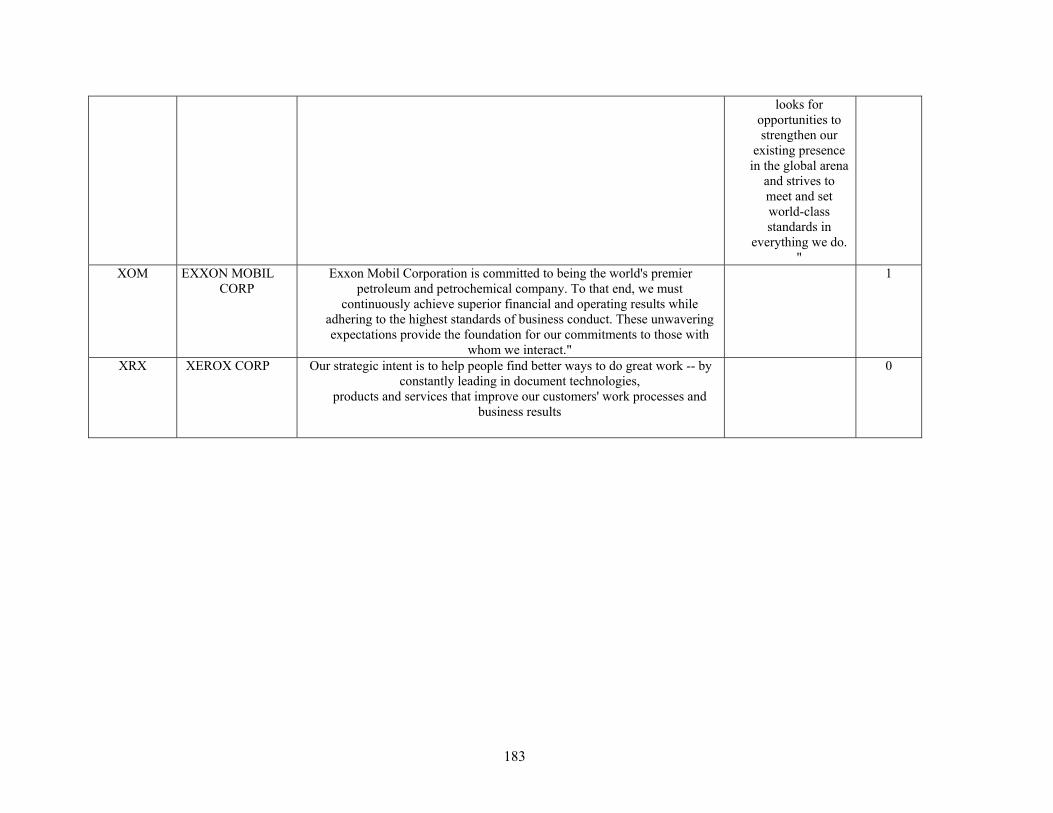
183
looks for opportunities to strengthen our
existing presence in the global arena
and strives to meet and set world-class standards in
everything we do. "
XOM EXXON MOBIL CORP
Exxon Mobil Corporation is committed to being the world's premier petroleum and petrochemical company. To that end, we must
continuously achieve superior financial and operating results while adhering to the highest standards of business conduct. These unwavering expectations provide the foundation for our commitments to those with
whom we interact."
1
XRX XEROX CORP Our strategic intent is to help people find better ways to do great work -- by constantly leading in document technologies,
products and services that improve our customers' work processes and business results
0
184
Appendix 3 – Comparison of Management Standards Variable and GEP
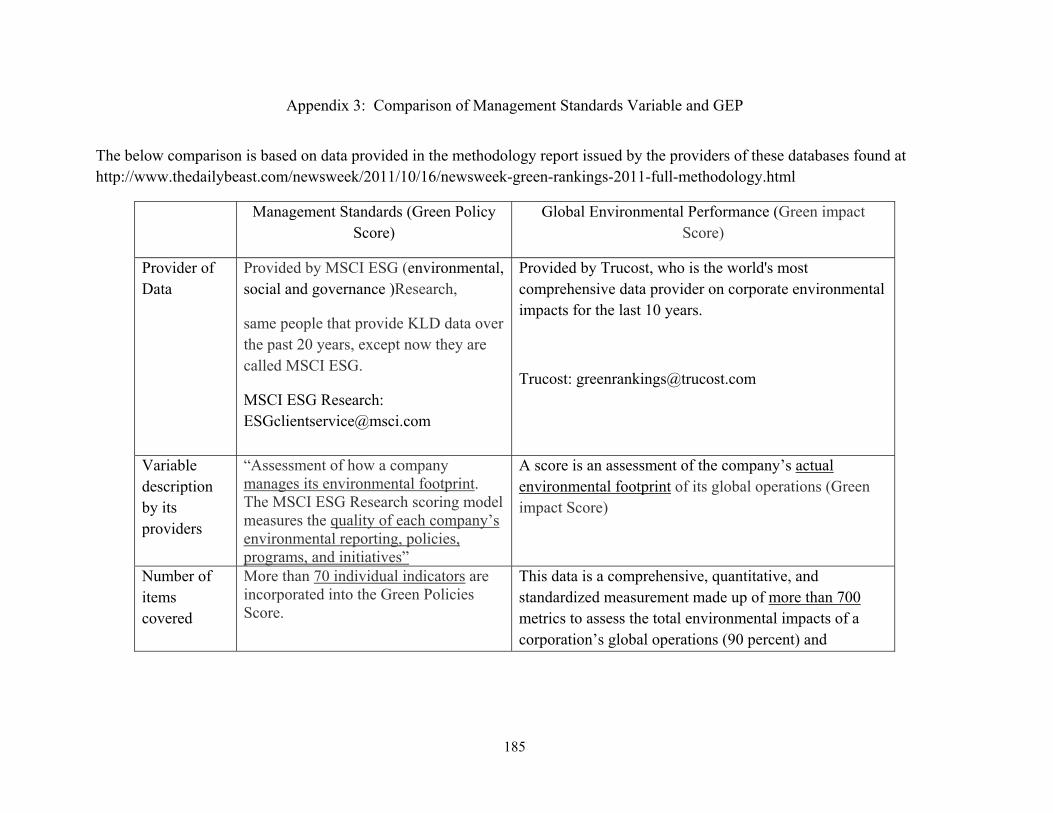
185
Appendix 3: Comparison of Management Standards Variable and GEP
The below comparison is based on data provided in the methodology report issued by the providers of these databases found at http://www.thedailybeast.com/newsweek/2011/10/16/newsweek-green-rankings-2011-full-methodology.html
Management Standards (Green Policy Score)
Global Environmental Performance (Green impact Score)
Provider of Data
Provided by MSCI ESG (environmental, social and governance )Research,
same people that provide KLD data over the past 20 years, except now they are called MSCI ESG.
MSCI ESG Research: [email protected]
Provided by Trucost, who is the world's most comprehensive data provider on corporate environmental impacts for the last 10 years.
Trucost: [email protected]
Variable description by its providers
“Assessment of how a company manages its environmental footprint. The MSCI ESG Research scoring model measures the quality of each company’s environmental reporting, policies, programs, and initiatives”
A score is an assessment of the company’s actual environmental footprint of its global operations (Green impact Score)
Number of items covered
More than 70 individual indicators are incorporated into the Green Policies Score.
This data is a comprehensive, quantitative, and standardized measurement made up of more than 700 metrics to assess the total environmental impacts of a corporation’s global operations (90 percent) and
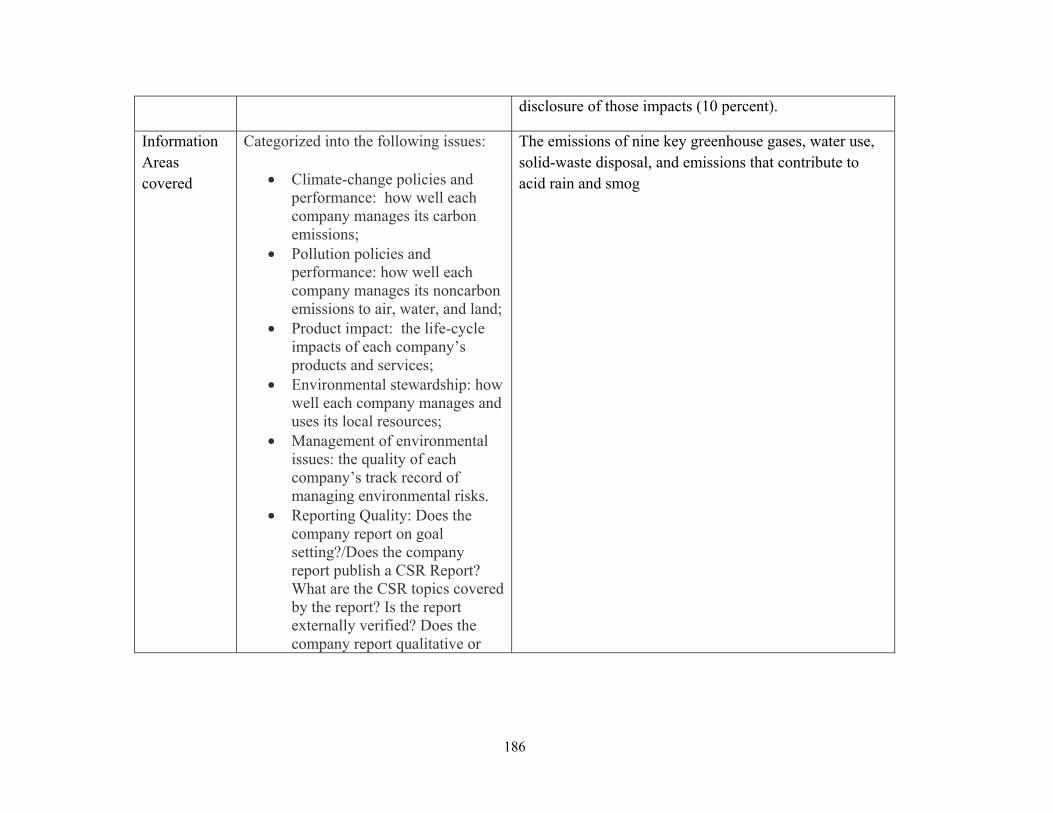
186
disclosure of those impacts (10 percent).
Information Areas covered
Categorized into the following issues:
• Climate-change policies and performance: how well each company manages its carbon emissions;
• Pollution policies and performance: how well each company manages its noncarbon emissions to air, water, and land;
• Product impact: the life-cycle impacts of each company’s products and services;
• Environmental stewardship: how well each company manages and uses its local resources;
• Management of environmental issues: the quality of each company’s track record of managing environmental risks.
• Reporting Quality: Does the company report on goal setting?/Does the company report publish a CSR Report? What are the CSR topics covered by the report? Is the report externally verified? Does the company report qualitative or
The emissions of nine key greenhouse gases, water use, solid-waste disposal, and emissions that contribute to acid rain and smog
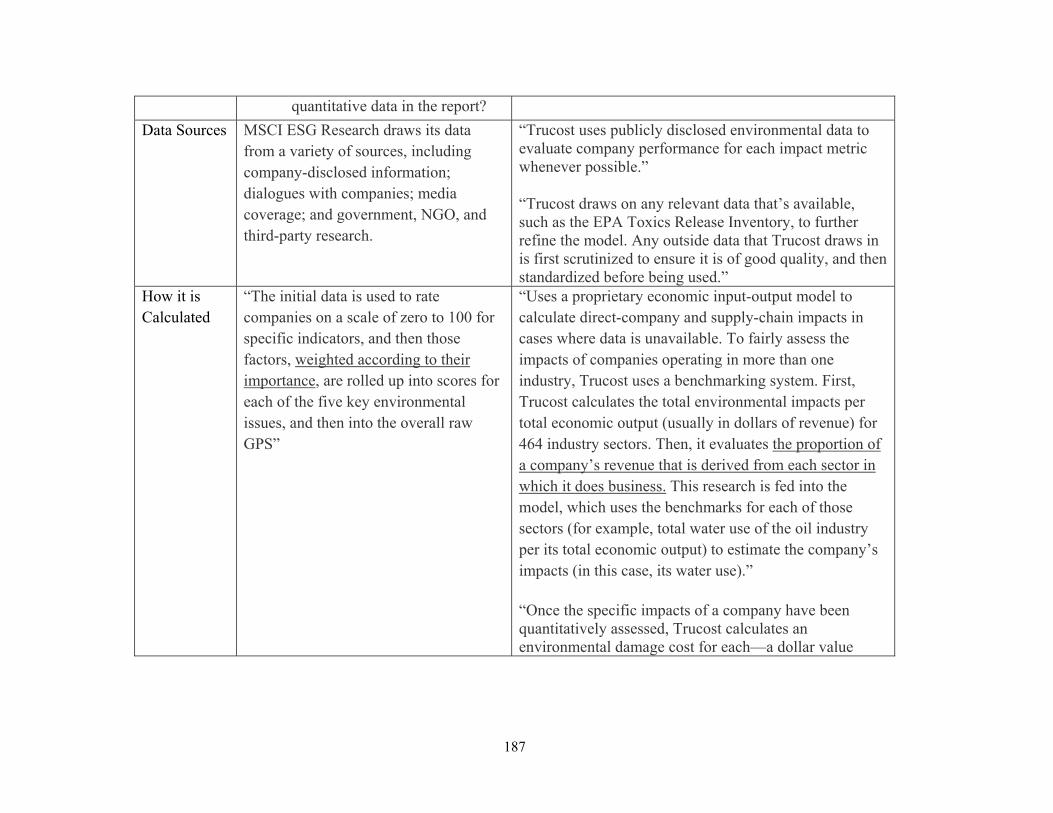
187
quantitative data in the report?
Data Sources MSCI ESG Research draws its data from a variety of sources, including company-disclosed information; dialogues with companies; media coverage; and government, NGO, and third-party research.
“Trucost uses publicly disclosed environmental data to evaluate company performance for each impact metric whenever possible.”
“Trucost draws on any relevant data that’s available, such as the EPA Toxics Release Inventory, to further refine the model. Any outside data that Trucost draws in is first scrutinized to ensure it is of good quality, and then standardized before being used.”
How it is Calculated
“The initial data is used to rate companies on a scale of zero to 100 for specific indicators, and then those factors, weighted according to their importance, are rolled up into scores for each of the five key environmental issues, and then into the overall raw GPS”
“Uses a proprietary economic input-output model to calculate direct-company and supply-chain impacts in cases where data is unavailable. To fairly assess the impacts of companies operating in more than one industry, Trucost uses a benchmarking system. First, Trucost calculates the total environmental impacts per total economic output (usually in dollars of revenue) for 464 industry sectors. Then, it evaluates the proportion of a company’s revenue that is derived from each sector in which it does business. This research is fed into the model, which uses the benchmarks for each of those sectors (for example, total water use of the oil industry per its total economic output) to estimate the company’s impacts (in this case, its water use).”
“Once the specific impacts of a company have been quantitatively assessed, Trucost calculates an environmental damage cost for each—a dollar value
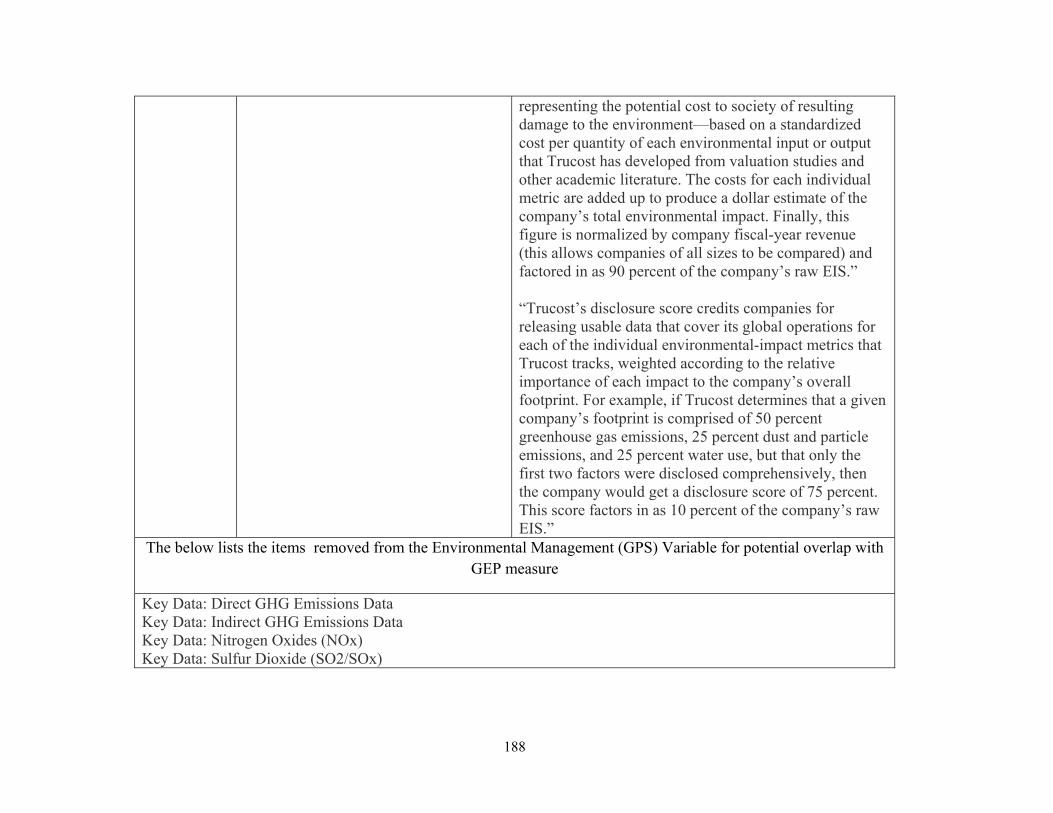
188
representing the potential cost to society of resulting damage to the environment—based on a standardized cost per quantity of each environmental input or output that Trucost has developed from valuation studies and other academic literature. The costs for each individual metric are added up to produce a dollar estimate of the company’s total environmental impact. Finally, this figure is normalized by company fiscal-year revenue (this allows companies of all sizes to be compared) and factored in as 90 percent of the company’s raw EIS.”
“Trucost’s disclosure score credits companies for releasing usable data that cover its global operations for each of the individual environmental-impact metrics that Trucost tracks, weighted according to the relative importance of each impact to the company’s overall footprint. For example, if Trucost determines that a given company’s footprint is comprised of 50 percent greenhouse gas emissions, 25 percent dust and particle emissions, and 25 percent water use, but that only the first two factors were disclosed comprehensively, then the company would get a disclosure score of 75 percent. This score factors in as 10 percent of the company’s raw EIS.”
The below lists the items removed from the Environmental Management (GPS) Variable for potential overlap with GEP measure
Key Data: Direct GHG Emissions Data Key Data: Indirect GHG Emissions Data Key Data: Nitrogen Oxides (NOx) Key Data: Sulfur Dioxide (SO2/SOx)
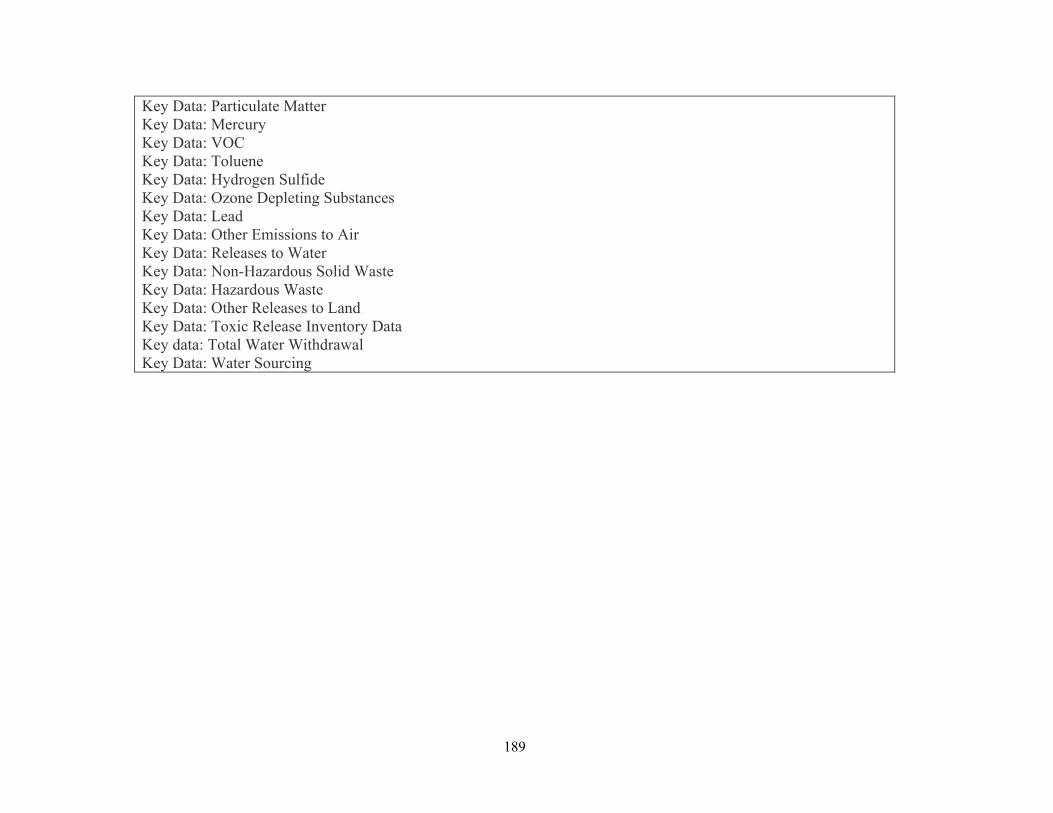
189
Key Data: Particulate Matter Key Data: Mercury Key Data: VOC Key Data: Toluene Key Data: Hydrogen Sulfide Key Data: Ozone Depleting Substances Key Data: Lead Key Data: Other Emissions to Air Key Data: Releases to Water Key Data: Non-Hazardous Solid Waste Key Data: Hazardous Waste Key Data: Other Releases to Land Key Data: Toxic Release Inventory Data Key data: Total Water Withdrawal Key Data: Water Sourcing
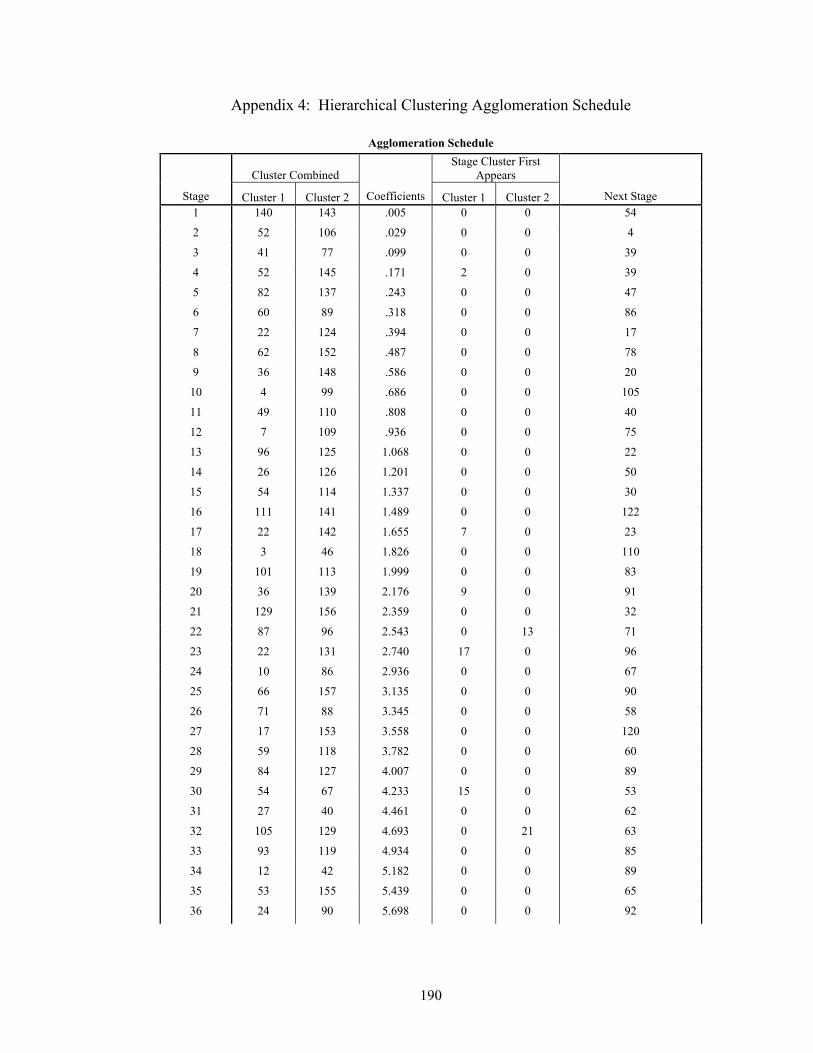
190
Appendix 4: Hierarchical Clustering Agglomeration Schedule
Agglomeration Schedule
Cluster Combined Stage Cluster First
Appears
Stage Cluster 1 Cluster 2 Coefficients Cluster 1 Cluster 2 Next Stage 1 140 143 .005 0 0 54
2 52 106 .029 0 0 4
3 41 77 .099 0 0 39
4 52 145 .171 2 0 39
5 82 137 .243 0 0 47
6 60 89 .318 0 0 86
7 22 124 .394 0 0 17
8 62 152 .487 0 0 78
9 36 148 .586 0 0 20
10 4 99 .686 0 0 105
11 49 110 .808 0 0 40
12 7 109 .936 0 0 75
13 96 125 1.068 0 0 22
14 26 126 1.201 0 0 50
15 54 114 1.337 0 0 30
16 111 141 1.489 0 0 122
17 22 142 1.655 7 0 23
18 3 46 1.826 0 0 110
19 101 113 1.999 0 0 83
20 36 139 2.176 9 0 91
21 129 156 2.359 0 0 32
22 87 96 2.543 0 13 71
23 22 131 2.740 17 0 96
24 10 86 2.936 0 0 67
25 66 157 3.135 0 0 90
26 71 88 3.345 0 0 58
27 17 153 3.558 0 0 120
28 59 118 3.782 0 0 60
29 84 127 4.007 0 0 89
30 54 67 4.233 15 0 53
31 27 40 4.461 0 0 62
32 105 129 4.693 0 21 63
33 93 119 4.934 0 0 85
34 12 42 5.182 0 0 89
35 53 155 5.439 0 0 65
36 24 90 5.698 0 0 92
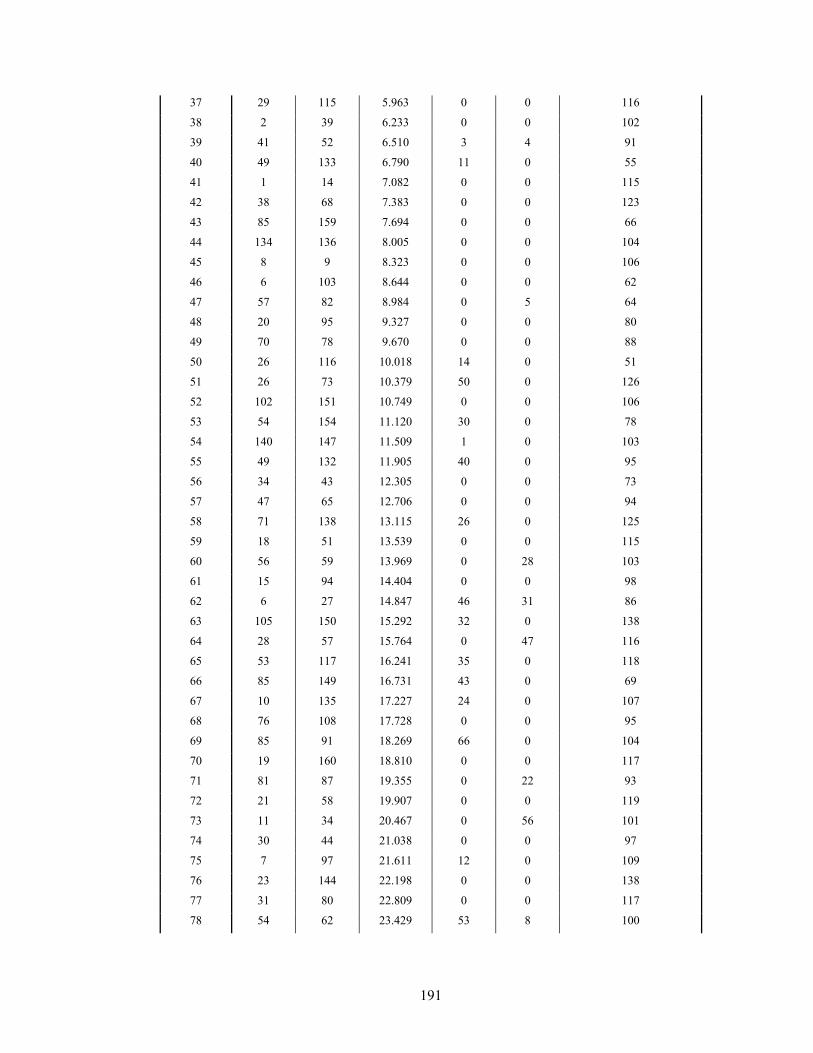
191
37 29 115 5.963 0 0 116
38 2 39 6.233 0 0 102
39 41 52 6.510 3 4 91
40 49 133 6.790 11 0 55
41 1 14 7.082 0 0 115
42 38 68 7.383 0 0 123
43 85 159 7.694 0 0 66
44 134 136 8.005 0 0 104
45 8 9 8.323 0 0 106
46 6 103 8.644 0 0 62
47 57 82 8.984 0 5 64
48 20 95 9.327 0 0 80
49 70 78 9.670 0 0 88
50 26 116 10.018 14 0 51
51 26 73 10.379 50 0 126
52 102 151 10.749 0 0 106
53 54 154 11.120 30 0 78
54 140 147 11.509 1 0 103
55 49 132 11.905 40 0 95
56 34 43 12.305 0 0 73
57 47 65 12.706 0 0 94
58 71 138 13.115 26 0 125
59 18 51 13.539 0 0 115
60 56 59 13.969 0 28 103
61 15 94 14.404 0 0 98
62 6 27 14.847 46 31 86
63 105 150 15.292 32 0 138
64 28 57 15.764 0 47 116
65 53 117 16.241 35 0 118
66 85 149 16.731 43 0 69
67 10 135 17.227 24 0 107
68 76 108 17.728 0 0 95
69 85 91 18.269 66 0 104
70 19 160 18.810 0 0 117
71 81 87 19.355 0 22 93
72 21 58 19.907 0 0 119
73 11 34 20.467 0 56 101
74 30 44 21.038 0 0 97
75 7 97 21.611 12 0 109
76 23 144 22.198 0 0 138
77 31 80 22.809 0 0 117
78 54 62 23.429 53 8 100
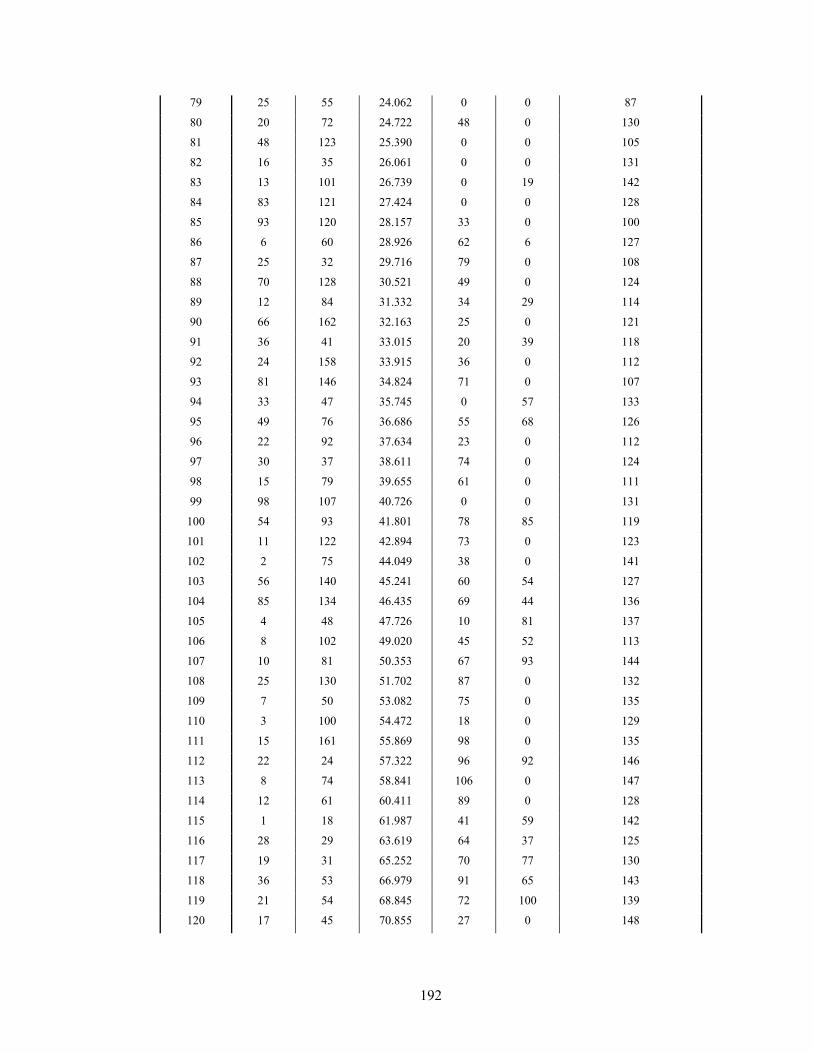
192
79 25 55 24.062 0 0 87
80 20 72 24.722 48 0 130
81 48 123 25.390 0 0 105
82 16 35 26.061 0 0 131
83 13 101 26.739 0 19 142
84 83 121 27.424 0 0 128
85 93 120 28.157 33 0 100
86 6 60 28.926 62 6 127
87 25 32 29.716 79 0 108
88 70 128 30.521 49 0 124
89 12 84 31.332 34 29 114
90 66 162 32.163 25 0 121
91 36 41 33.015 20 39 118
92 24 158 33.915 36 0 112
93 81 146 34.824 71 0 107
94 33 47 35.745 0 57 133
95 49 76 36.686 55 68 126
96 22 92 37.634 23 0 112
97 30 37 38.611 74 0 124
98 15 79 39.655 61 0 111
99 98 107 40.726 0 0 131
100 54 93 41.801 78 85 119
101 11 122 42.894 73 0 123
102 2 75 44.049 38 0 141
103 56 140 45.241 60 54 127
104 85 134 46.435 69 44 136
105 4 48 47.726 10 81 137
106 8 102 49.020 45 52 113
107 10 81 50.353 67 93 144
108 25 130 51.702 87 0 132
109 7 50 53.082 75 0 135
110 3 100 54.472 18 0 129
111 15 161 55.869 98 0 135
112 22 24 57.322 96 92 146
113 8 74 58.841 106 0 147
114 12 61 60.411 89 0 128
115 1 18 61.987 41 59 142
116 28 29 63.619 64 37 125
117 19 31 65.252 70 77 130
118 36 53 66.979 91 65 143
119 21 54 68.845 72 100 139
120 17 45 70.855 27 0 148
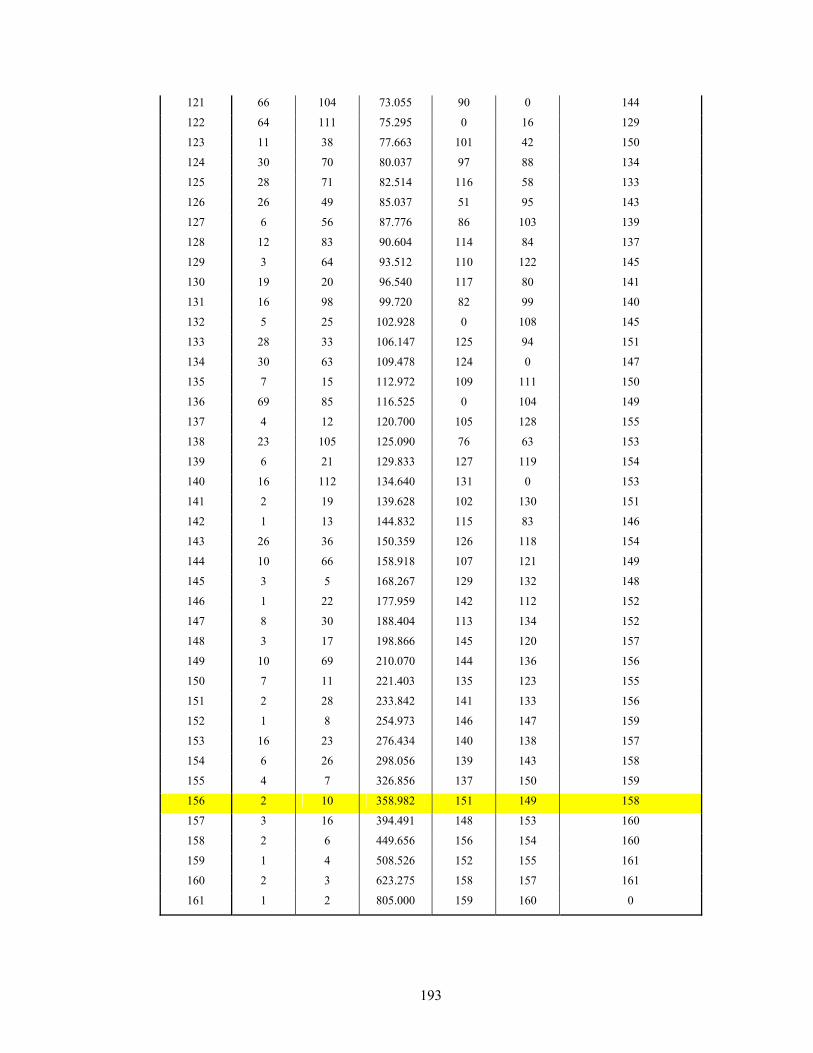
193
121 66 104 73.055 90 0 144
122 64 111 75.295 0 16 129
123 11 38 77.663 101 42 150
124 30 70 80.037 97 88 134
125 28 71 82.514 116 58 133
126 26 49 85.037 51 95 143
127 6 56 87.776 86 103 139
128 12 83 90.604 114 84 137
129 3 64 93.512 110 122 145
130 19 20 96.540 117 80 141
131 16 98 99.720 82 99 140
132 5 25 102.928 0 108 145
133 28 33 106.147 125 94 151
134 30 63 109.478 124 0 147
135 7 15 112.972 109 111 150
136 69 85 116.525 0 104 149
137 4 12 120.700 105 128 155
138 23 105 125.090 76 63 153
139 6 21 129.833 127 119 154
140 16 112 134.640 131 0 153
141 2 19 139.628 102 130 151
142 1 13 144.832 115 83 146
143 26 36 150.359 126 118 154
144 10 66 158.918 107 121 149
145 3 5 168.267 129 132 148
146 1 22 177.959 142 112 152
147 8 30 188.404 113 134 152
148 3 17 198.866 145 120 157
149 10 69 210.070 144 136 156
150 7 11 221.403 135 123 155
151 2 28 233.842 141 133 156
152 1 8 254.973 146 147 159
153 16 23 276.434 140 138 157
154 6 26 298.056 139 143 158
155 4 7 326.856 137 150 159
156 2 10 358.982 151 149 158
157 3 16 394.491 148 153 160
158 2 6 449.656 156 154 160
159 1 4 508.526 152 155 161
160 2 3 623.275 158 157 161
161 1 2 805.000 159 160 0
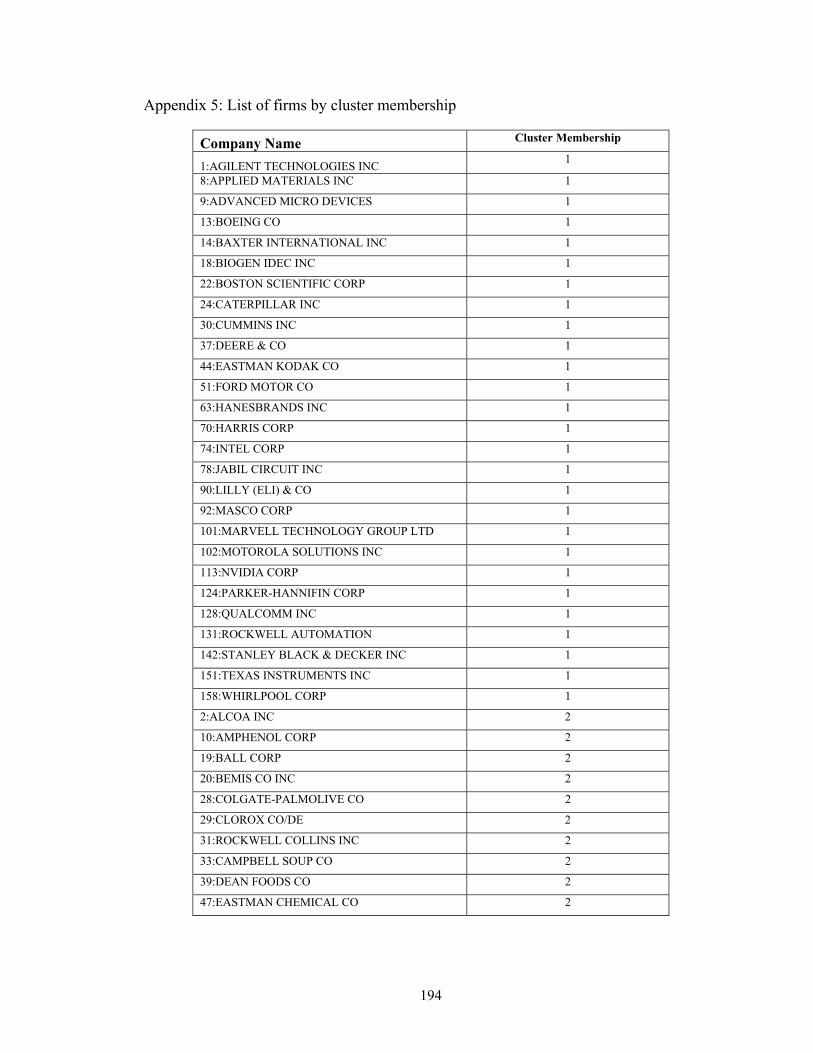
194
Appendix 5: List of firms by cluster membership
Company Name Cluster Membership
1:AGILENT TECHNOLOGIES INC 1
8:APPLIED MATERIALS INC 1
9:ADVANCED MICRO DEVICES 1
13:BOEING CO 1
14:BAXTER INTERNATIONAL INC 1
18:BIOGEN IDEC INC 1
22:BOSTON SCIENTIFIC CORP 1
24:CATERPILLAR INC 1
30:CUMMINS INC 1
37:DEERE & CO 1
44:EASTMAN KODAK CO 1
51:FORD MOTOR CO 1
63:HANESBRANDS INC 1
70:HARRIS CORP 1
74:INTEL CORP 1
78:JABIL CIRCUIT INC 1
90:LILLY (ELI) & CO 1
92:MASCO CORP 1
101:MARVELL TECHNOLOGY GROUP LTD 1
102:MOTOROLA SOLUTIONS INC 1
113:NVIDIA CORP 1
124:PARKER-HANNIFIN CORP 1
128:QUALCOMM INC 1
131:ROCKWELL AUTOMATION 1
142:STANLEY BLACK & DECKER INC 1
151:TEXAS INSTRUMENTS INC 1
158:WHIRLPOOL CORP 1
2:ALCOA INC 2
10:AMPHENOL CORP 2
19:BALL CORP 2
20:BEMIS CO INC 2
28:COLGATE-PALMOLIVE CO 2
29:CLOROX CO/DE 2
31:ROCKWELL COLLINS INC 2
33:CAMPBELL SOUP CO 2
39:DEAN FOODS CO 2
47:EASTMAN CHEMICAL CO 2
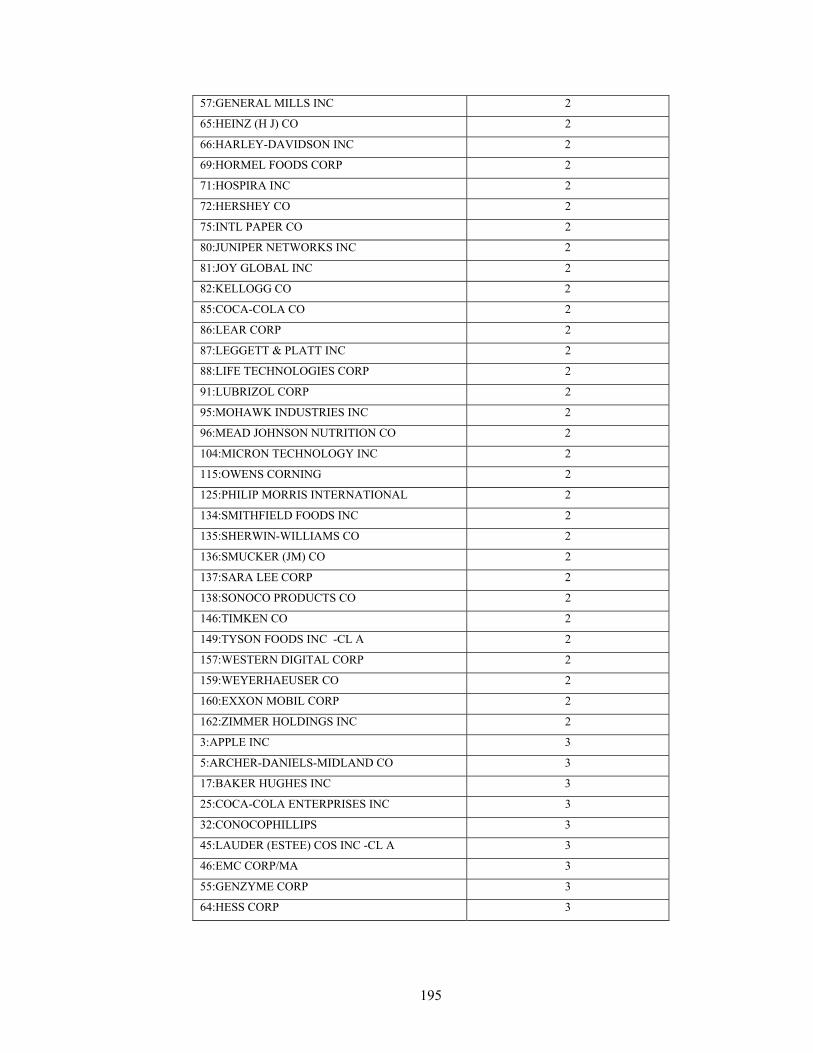
195
57:GENERAL MILLS INC 2
65:HEINZ (H J) CO 2
66:HARLEY-DAVIDSON INC 2
69:HORMEL FOODS CORP 2
71:HOSPIRA INC 2
72:HERSHEY CO 2
75:INTL PAPER CO 2
80:JUNIPER NETWORKS INC 2
81:JOY GLOBAL INC 2
82:KELLOGG CO 2
85:COCA-COLA CO 2
86:LEAR CORP 2
87:LEGGETT & PLATT INC 2
88:LIFE TECHNOLOGIES CORP 2
91:LUBRIZOL CORP 2
95:MOHAWK INDUSTRIES INC 2
96:MEAD JOHNSON NUTRITION CO 2
104:MICRON TECHNOLOGY INC 2
115:OWENS CORNING 2
125:PHILIP MORRIS INTERNATIONAL 2
134:SMITHFIELD FOODS INC 2
135:SHERWIN-WILLIAMS CO 2
136:SMUCKER (JM) CO 2
137:SARA LEE CORP 2
138:SONOCO PRODUCTS CO 2
146:TIMKEN CO 2
149:TYSON FOODS INC -CL A 2
157:WESTERN DIGITAL CORP 2
159:WEYERHAEUSER CO 2
160:EXXON MOBIL CORP 2
162:ZIMMER HOLDINGS INC 2
3:APPLE INC 3
5:ARCHER-DANIELS-MIDLAND CO 3
17:BAKER HUGHES INC 3
25:COCA-COLA ENTERPRISES INC 3
32:CONOCOPHILLIPS 3
45:LAUDER (ESTEE) COS INC -CL A 3
46:EMC CORP/MA 3
55:GENZYME CORP 3
64:HESS CORP 3
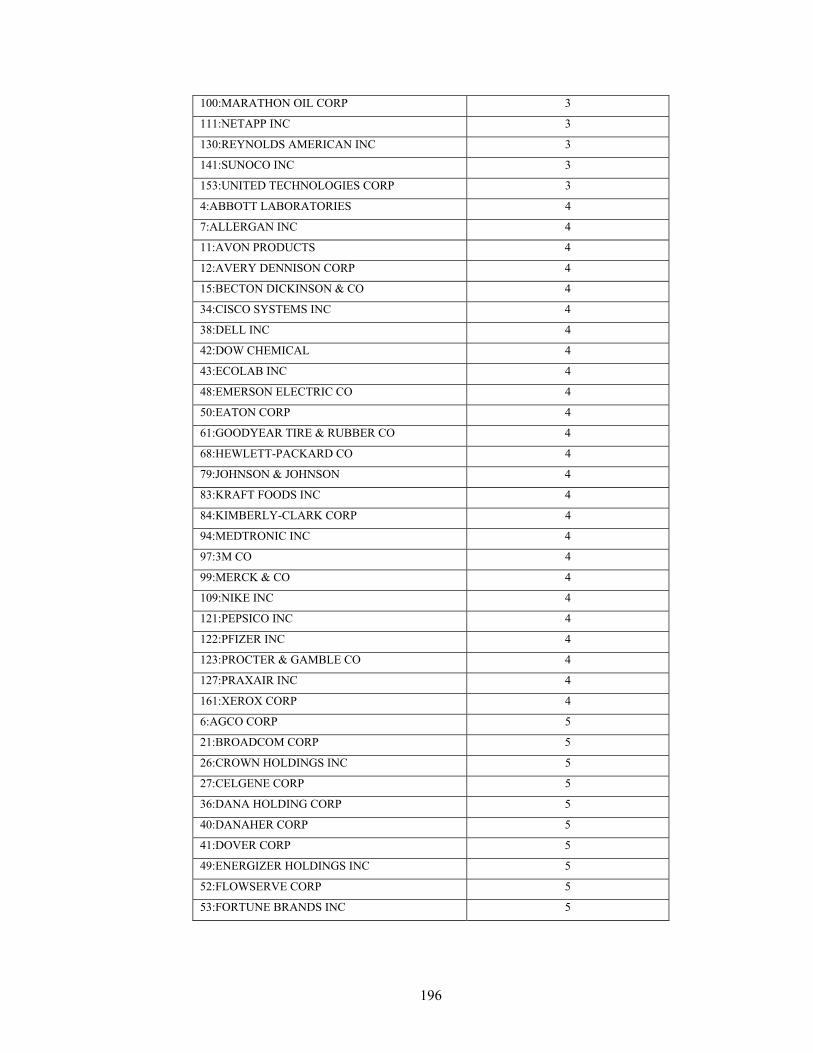
196
100:MARATHON OIL CORP 3
111:NETAPP INC 3
130:REYNOLDS AMERICAN INC 3
141:SUNOCO INC 3
153:UNITED TECHNOLOGIES CORP 3
4:ABBOTT LABORATORIES 4
7:ALLERGAN INC 4
11:AVON PRODUCTS 4
12:AVERY DENNISON CORP 4
15:BECTON DICKINSON & CO 4
34:CISCO SYSTEMS INC 4
38:DELL INC 4
42:DOW CHEMICAL 4
43:ECOLAB INC 4
48:EMERSON ELECTRIC CO 4
50:EATON CORP 4
61:GOODYEAR TIRE & RUBBER CO 4
68:HEWLETT-PACKARD CO 4
79:JOHNSON & JOHNSON 4
83:KRAFT FOODS INC 4
84:KIMBERLY-CLARK CORP 4
94:MEDTRONIC INC 4
97:3M CO 4
99:MERCK & CO 4
109:NIKE INC 4
121:PEPSICO INC 4
122:PFIZER INC 4
123:PROCTER & GAMBLE CO 4
127:PRAXAIR INC 4
161:XEROX CORP 4
6:AGCO CORP 5
21:BROADCOM CORP 5
26:CROWN HOLDINGS INC 5
27:CELGENE CORP 5
36:DANA HOLDING CORP 5
40:DANAHER CORP 5
41:DOVER CORP 5
49:ENERGIZER HOLDINGS INC 5
52:FLOWSERVE CORP 5
53:FORTUNE BRANDS INC 5
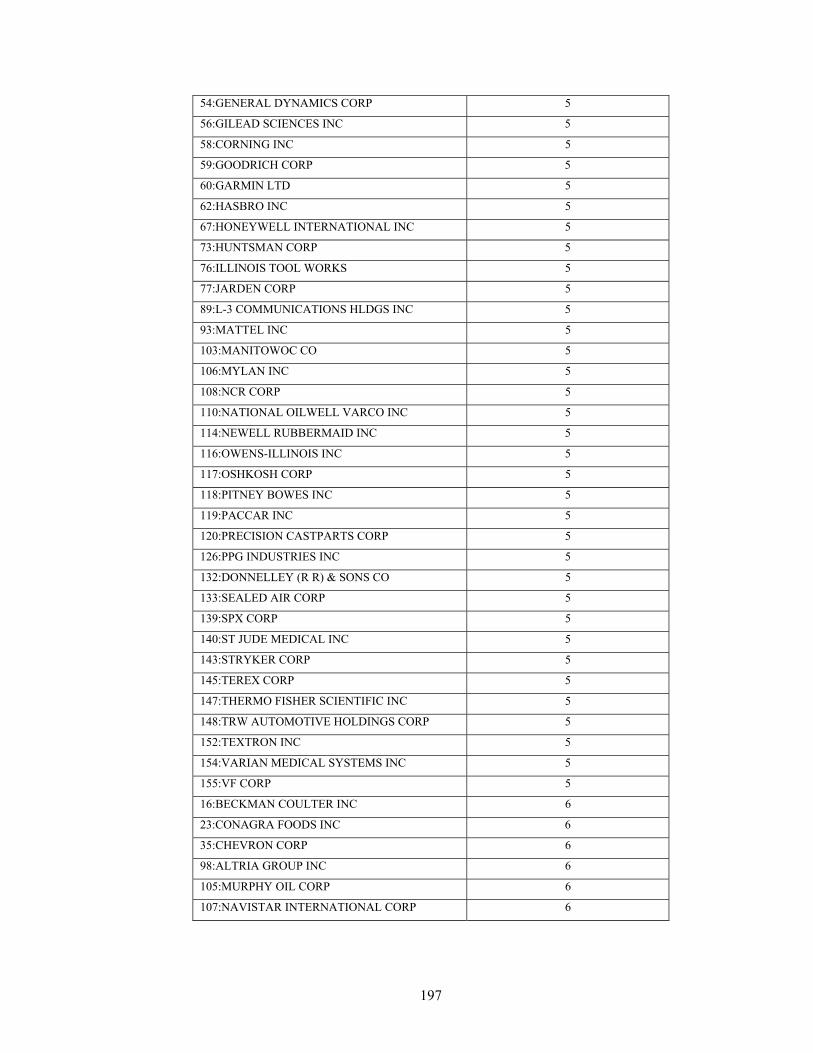
197
54:GENERAL DYNAMICS CORP 5
56:GILEAD SCIENCES INC 5
58:CORNING INC 5
59:GOODRICH CORP 5
60:GARMIN LTD 5
62:HASBRO INC 5
67:HONEYWELL INTERNATIONAL INC 5
73:HUNTSMAN CORP 5
76:ILLINOIS TOOL WORKS 5
77:JARDEN CORP 5
89:L-3 COMMUNICATIONS HLDGS INC 5
93:MATTEL INC 5
103:MANITOWOC CO 5
106:MYLAN INC 5
108:NCR CORP 5
110:NATIONAL OILWELL VARCO INC 5
114:NEWELL RUBBERMAID INC 5
116:OWENS-ILLINOIS INC 5
117:OSHKOSH CORP 5
118:PITNEY BOWES INC 5
119:PACCAR INC 5
120:PRECISION CASTPARTS CORP 5
126:PPG INDUSTRIES INC 5
132:DONNELLEY (R R) & SONS CO 5
133:SEALED AIR CORP 5
139:SPX CORP 5
140:ST JUDE MEDICAL INC 5
143:STRYKER CORP 5
145:TEREX CORP 5
147:THERMO FISHER SCIENTIFIC INC 5
148:TRW AUTOMOTIVE HOLDINGS CORP 5
152:TEXTRON INC 5
154:VARIAN MEDICAL SYSTEMS INC 5
155:VF CORP 5
16:BECKMAN COULTER INC 6
23:CONAGRA FOODS INC 6
35:CHEVRON CORP 6
98:ALTRIA GROUP INC 6
105:MURPHY OIL CORP 6
107:NAVISTAR INTERNATIONAL CORP 6

198
112:NUCOR CORP 6
129:RALCORP HOLDINGS INC 6
144:MOLSON COORS BREWING CO 6
150:TESORO CORP 6
156:VALERO ENERGY CORP 6
Case 6 Clusters
199
VITA
DINA ABDEL-ZAHER
Doctor of Philosophy Candidate, Management & International Business (2008-August 2012. Florida International University, Miami, FL.
Dissertation Topic: Corporate’s Environmental Management Framework: The Complexities Of Subsidiary Network Dimensions Committee Members: Dr .William Newburry (FIU-Chair); Dr. Jose de la Torre (FIU); Dr. Nathan Hiller (FIU) Dr. William Schneper (FIU); Dr Walfried Lassar (FIU-Marketing); Dr. Ted London (University of Michigan)
RESEARCH AWARDS Kauffman Doctoral Assistant Award 2011 awarded a research grant of $7000 from Global Entrepreneurship Center at Florida International University for research studying the relationships between global mindsets, entrepreneurship orientation, and individual Innovation. Runner Up Paper Award at Academy of International Business Southwest 2011 Abdelzaher, D., Newburry, W., & Kundu, S. “How Offshoring Affects Corporate Reputation at Home:Examining its dual impact on Firm Performance and Corporate Social Responsibility”, March 9-12 in Houston, Texas.
William J. Ziegler Award (Best Student Paper) at the Academy of International Business Southeast 2009. Abdelzaher, D. & Schneper, W. “The Diffusion of Corporate Social Responsibility: A Cross Country Empirical study”. October in Jacksonville, Fl.
RESEARCH PUBLICATIONS
Abdelzaher, D. “The Impact of Professional Service Firms’ Expansion Challenges on Internationalization Processes and Performance”. The Service Industries Journal. Forthcoming 2012. Impact Factor 1.071.
Schotter, A. & Abdelzaher, D. “The Effects of Muslim Diaspora on the Internationalization Processes of Firms from Organization of Islamic Conference
200
Countries”. Conditionally Accepted Journal of International Management. Impact Factor 1.298.
Abdelzaher, D., Newburry, W., & Kundu, S. 2011 “How Offshoring Affects Corporate Reputation at Home: Examining its dual impact on Firm Performance and Corporate Social Responsibility” Southwest Review of International Business Research vol 22, (1): 135.
Abdelzaher, D. & De la Torre, J.2011 “A Framework of the MNC’s Optimal Configuration: An Examination of the Joined Effect of Dispersion, Density, and Diversity”. Southwest Review of International Business Research vol 22, (1): 27.
CONFERENCE PROCEEDINGS
Abdelzaher, D. & Schneper, W. “The Diffusion of Corporate Social Responsibility: A Cross Country Empirical study”, Academy of Management 2010, August 6-10 in Montreal, Canada. Earlier version published in the conference proceedings at Academ of International Business- Southeast 2009 (CD). Targeted Journal of Internationa of Business Studies.
Bullough, A., Renko, M., & Abdelzaher, D. “Women’s Entrepreneurship: Operating Within the Context of Institutional and In-Group Collectivism”, published in the conference proceedings Academy of International Business Southeast 2011, October 24 in Orlando.
Bullough, A. & Abdelzaher, D. “An Overview of Available Data Sources & Limitations In Global Research On Women’s Entrepreneurship”, published in the conference proceedings Academy of International Business Southeast 2011, October 24 in Orlando.