contrasting sr and nd isotopic behaviour during magma mingling; new insights from the mannum a-type...
TRANSCRIPT
Lithos 126 (2011) 135–146
Contents lists available at ScienceDirect
Lithos
j ourna l homepage: www.e lsev ie r.com/ locate / l i thos
Contrasting Sr and Nd isotopic behaviour during magma mingling; new insights fromthe Mannum A-type granite
M.J. Pankhurst a,⁎, R.H. Vernon a, S.P. Turner a, B.F. Schaefer a, J.D. Foden b
a ARC Key Centre for GEMOC, Department of Earth and Planetary Sciences, Macquarie University, NSW 2109, Australiab School of Earth & Environmental Sciences, Adelaide University, SA 5005, Australia
⁎ Corresponding author.E-mail address: [email protected] (M.J. Pa
0024-4937/$ – see front matter © 2011 Elsevier B.V. Aldoi:10.1016/j.lithos.2011.07.005
a b s t r a c t
a r t i c l e i n f oArticle history:Received 2 December 2010Accepted 18 July 2011Available online xxxx
Keywords:A-type graniteMafic enclavesMagma minglingRapakiviSr and Nd isotopesTitanite
The Mannum granite in South Australia is a classic A-type granite which displays good evidence for magmamingling, such as numerous syn-plutonic mafic enclaves, and rapakivi feldspars in both the granite andenclave. Study of the Sr and Nd isotopes show that the systems are dominantly controlled by plagioclase andtitanite, respectively. The contrasting behaviour of these minerals during the development of a bimodalmagmatic system has led to a well-defined 482 Ma isochron across a granite–enclave boundary in the Srisotope system but not in the Nd isotope system. In-situ techniques, involving the development andproduction of a new titanite glass standard, were developed to resolve this dichotomy. Inferred repeatedinteraction with mafic magmas has resulted in the destabilization and restabilization of plagioclase. This hasproduced rapakivi textures, and provides an effective mechanism for efficient Sr isotope equilibration acrossthe range of bulk rock compositions. Despite this interaction, titanite in the host granite retain a range ofinitial Nd isotope ratios, indicating multiple parental magmas were assembled to produce the final pluton.Decoupling of the Sr and Nd isotope systems in other magmatic systems could be indicative of magmamixing,as opposed to mingling, where physical evidence (e.g. enclaves, xenocrysts etc.) is absent.
nkhurst).
l rights reserved.
© 2011 Elsevier B.V. All rights reserved.
1. Introduction and geologic setting
In this paper, we investigate the origin of rapakivi textures and thecontrasting behaviour of the Sr and Nd isotope systems in a magmamingling situation in the A-type Mannum Granite, South Australia(Fig. 1). In a similar magmamingling scenario in an early Phanerozoicpluton in Scotland, Holden et al. (1987, 1991) observed that Sr iso-topes were equilibrated between the granite host and the enclaveswhereas Nd isotopes were not. The authors interpreted this asevidence for interaction of multiple parental magmas. This is in con-trast with the interpretation of Turner and Foden (1996), for theMannum Granite, for which they concluded that the magmas werecogenetic. In order to investigate these contrasting interpretations, wehave analysed several serially sectioned enclave- granite interfacesfrom the Mannum Granite (Fig. 2) for whole-rock major, trace andrare earth element concentrations, as well as Nd and Sr isotope ratiosacross one section. We have also analysed titanites using in-situelectron microprobe and laser ablation techniques.
2. Geological setting
The Mannum Granite is an early Ordovician pluton that intrudedthe Late Proterozoic to Cambrian meta-sedimentary rocks of theAdelaide Fold Belt soon after the cessation of the Delamerian Orogeny(514±3 Ma–490±3 Ma; Foden et al., 2006). Along with other post-tectonic granites of the synchronous Padthaway A-type granite suite itis spatially and temporally accompanied by mafic dykes and plutons(Turner and Foden, 1996), which traversed the then recently over-thickened crust.
The undeformed, Mannum granite is a roughly circular pluton~11 km in diameter which, on the basis of miarolitic cavities, has beenemplaced at relatively shallow crustal levels. As discussed by Turnerand Foden (1996), it contains swarms of mafic enclaves whose com-positions range from dolerite and quartz–diorite to leucocraticvarieties. The enclaves show a variety of globular and tear-dropshapes, are fine-grained and lack chilled margins. They also enclosequartz and feldspar phenocrysts from the granite. This combinedwith apparent major element compositional continuity was used tosuggest that the enclaves represent contemporaneous mafic magmathat was mingled with the granite magma during emplacement(Turner and Foden, 1996). These authors argued on the basis ofviscosity calculations that the granite magma must have had a tem-perature in excess of 930 °C after thermal equilibration was achieved
Mannum
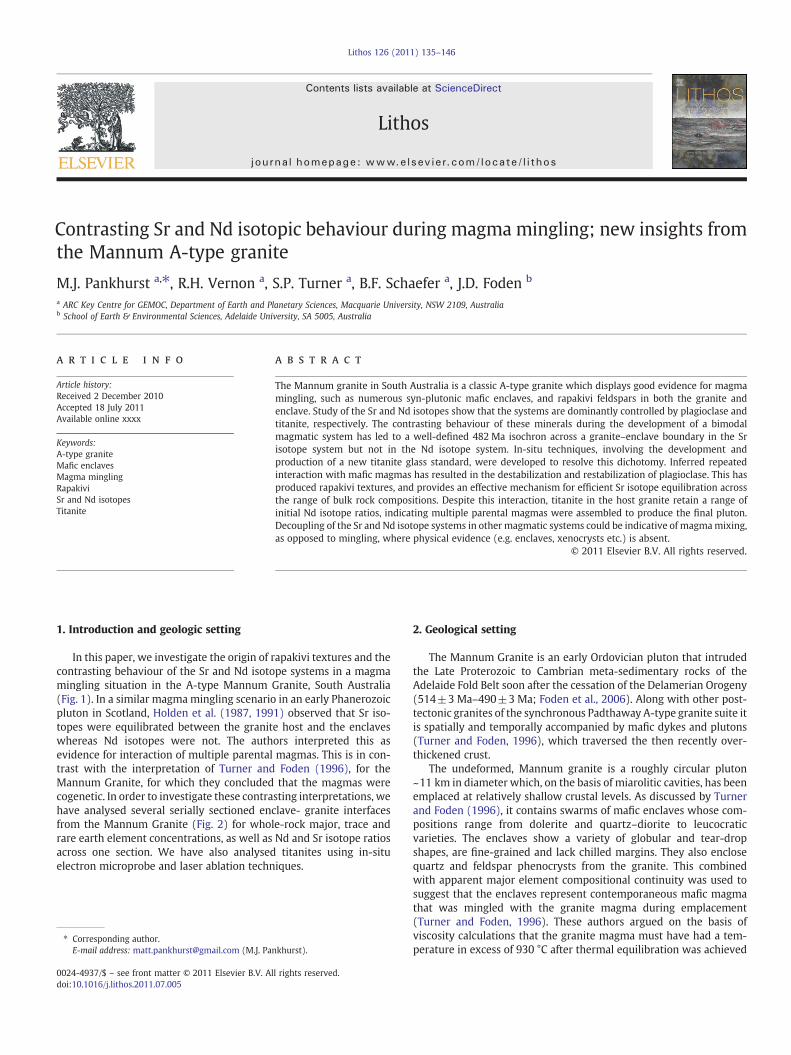
Fig. 1. Locality of the post orogenic Mannum Granite and related rocks.
136 M.J. Pankhurst et al. / Lithos 126 (2011) 135–146
with the enclaves. Furthermore, the pluton contains blocks ofmicrogranite, which may be up to 4 m across and lack enclaves.These blocks are interpreted as stoped pieces of a chilled margin. Ametre-wide, doleritic dyke with straight edges and quenchedmarginscuts the granite vertically.
3. Petrography
The Mannum Granite, described in some detail by Turner andFoden (1996), is a typical A-type granitoid, characterized by large(10–25 mm) perthite phenocrysts, many of which have plagioclaserims (rapakivi structure; Fig. 3a, c), with lesser amounts of quartz,plagioclase, biotite and titanite. Titanite is a common accessory min-eral in both the host granite and mafic enclaves. A few of the quartzphenocrysts are mantled with fine-grained mafic aggregates (e.g.hornblende; Fig. 3d). Accessory minerals include magnetite, fluorite,apatite and zircon.
MG
6A
MG
6B
MG
6C
MG
6D
MG
6E
MG
6F
1 cm
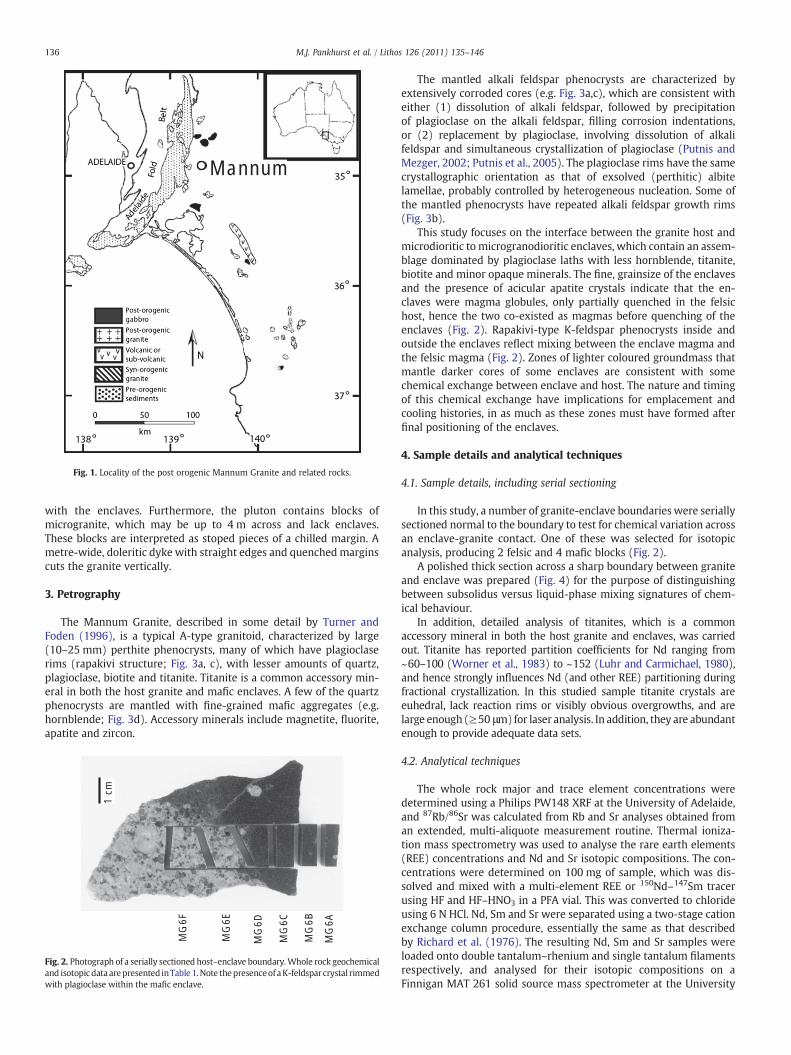
Fig. 2. Photograph of a serially sectioned host–enclave boundary.Whole rock geochemicaland isotopicdata arepresented inTable1.Note thepresenceof aK-feldspar crystal rimmedwith plagioclase within the mafic enclave.
The mantled alkali feldspar phenocrysts are characterized byextensively corroded cores (e.g. Fig. 3a,c), which are consistent witheither (1) dissolution of alkali feldspar, followed by precipitationof plagioclase on the alkali feldspar, filling corrosion indentations,or (2) replacement by plagioclase, involving dissolution of alkalifeldspar and simultaneous crystallization of plagioclase (Putnis andMezger, 2002; Putnis et al., 2005). The plagioclase rims have the samecrystallographic orientation as that of exsolved (perthitic) albitelamellae, probably controlled by heterogeneous nucleation. Some ofthe mantled phenocrysts have repeated alkali feldspar growth rims(Fig. 3b).
This study focuses on the interface between the granite host andmicrodioritic to microgranodioritic enclaves, which contain an assem-blage dominated by plagioclase laths with less hornblende, titanite,biotite and minor opaque minerals. The fine, grainsize of the enclavesand the presence of acicular apatite crystals indicate that the en-claves were magma globules, only partially quenched in the felsichost, hence the two co-existed as magmas before quenching of theenclaves (Fig. 2). Rapakivi-type K-feldspar phenocrysts inside andoutside the enclaves reflect mixing between the enclave magma andthe felsic magma (Fig. 2). Zones of lighter coloured groundmass thatmantle darker cores of some enclaves are consistent with somechemical exchange between enclave and host. The nature and timingof this chemical exchange have implications for emplacement andcooling histories, in as much as these zones must have formed afterfinal positioning of the enclaves.
4. Sample details and analytical techniques
4.1. Sample details, including serial sectioning
In this study, a number of granite-enclave boundaries were seriallysectioned normal to the boundary to test for chemical variation acrossan enclave-granite contact. One of these was selected for isotopicanalysis, producing 2 felsic and 4 mafic blocks (Fig. 2).
A polished thick section across a sharp boundary between graniteand enclave was prepared (Fig. 4) for the purpose of distinguishingbetween subsolidus versus liquid-phase mixing signatures of chem-ical behaviour.
In addition, detailed analysis of titanites, which is a commonaccessory mineral in both the host granite and enclaves, was carriedout. Titanite has reported partition coefficients for Nd ranging from~60–100 (Worner et al., 1983) to ~152 (Luhr and Carmichael, 1980),and hence strongly influences Nd (and other REE) partitioning duringfractional crystallization. In this studied sample titanite crystals areeuhedral, lack reaction rims or visibly obvious overgrowths, and arelarge enough (≥50 μm) for laser analysis. In addition, they are abundantenough to provide adequate data sets.
4.2. Analytical techniques
The whole rock major and trace element concentrations weredetermined using a Philips PW148 XRF at the University of Adelaide,and 87Rb/86Sr was calculated from Rb and Sr analyses obtained froman extended, multi-aliquote measurement routine. Thermal ioniza-tion mass spectrometry was used to analyse the rare earth elements(REE) concentrations and Nd and Sr isotopic compositions. The con-centrations were determined on 100 mg of sample, which was dis-solved and mixed with a multi-element REE or 150Nd–147Sm tracerusing HF and HF–HNO3 in a PFA vial. This was converted to chlorideusing 6 N HCl. Nd, Sm and Sr were separated using a two-stage cationexchange column procedure, essentially the same as that describedby Richard et al. (1976). The resulting Nd, Sm and Sr samples wereloaded onto double tantalum–rhenium and single tantalum filamentsrespectively, and analysed for their isotopic compositions on aFinnigan MAT 261 solid source mass spectrometer at the University
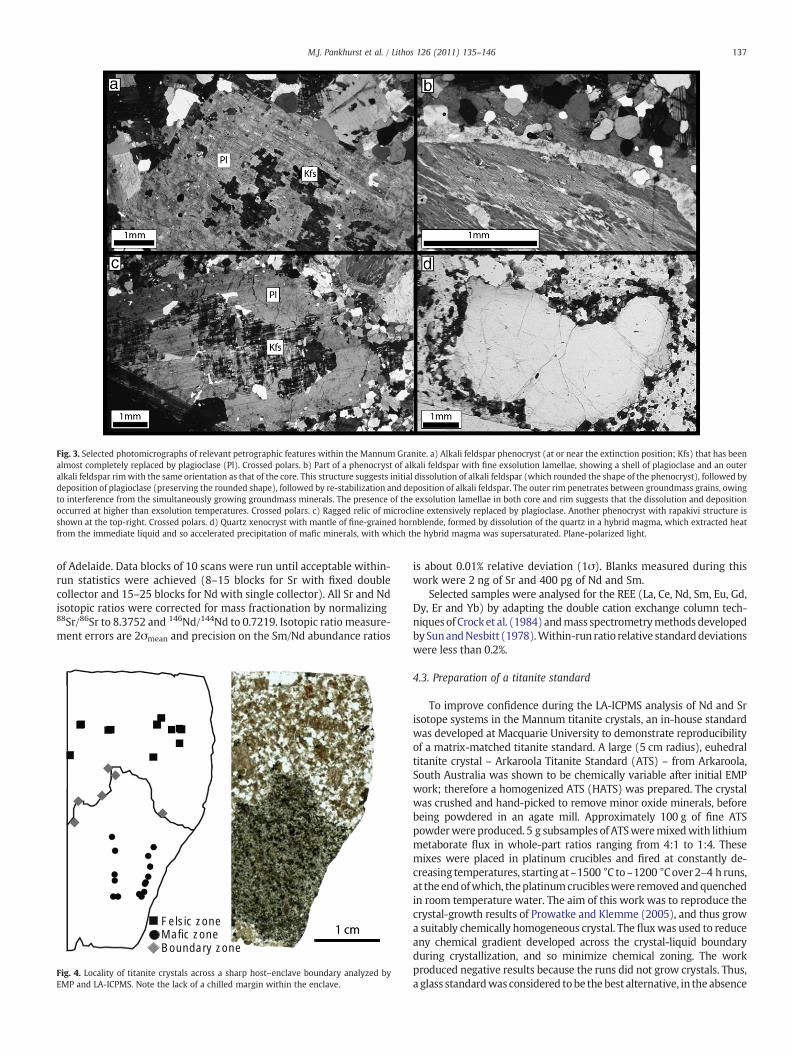
Fig. 3. Selected photomicrographs of relevant petrographic features within the Mannum Granite. a) Alkali feldspar phenocryst (at or near the extinction position; Kfs) that has beenalmost completely replaced by plagioclase (Pl). Crossed polars. b) Part of a phenocryst of alkali feldspar with fine exsolution lamellae, showing a shell of plagioclase and an outeralkali feldspar rimwith the same orientation as that of the core. This structure suggests initial dissolution of alkali feldspar (which rounded the shape of the phenocryst), followed bydeposition of plagioclase (preserving the rounded shape), followed by re-stabilization and deposition of alkali feldspar. The outer rim penetrates between groundmass grains, owingto interference from the simultaneously growing groundmass minerals. The presence of the exsolution lamellae in both core and rim suggests that the dissolution and depositionoccurred at higher than exsolution temperatures. Crossed polars. c) Ragged relic of microcline extensively replaced by plagioclase. Another phenocryst with rapakivi structure isshown at the top-right. Crossed polars. d) Quartz xenocryst with mantle of fine-grained hornblende, formed by dissolution of the quartz in a hybrid magma, which extracted heatfrom the immediate liquid and so accelerated precipitation of mafic minerals, with which the hybrid magma was supersaturated. Plane-polarized light.
137M.J. Pankhurst et al. / Lithos 126 (2011) 135–146
of Adelaide. Data blocks of 10 scans were run until acceptable within-run statistics were achieved (8–15 blocks for Sr with fixed doublecollector and 15–25 blocks for Nd with single collector). All Sr and Ndisotopic ratios were corrected for mass fractionation by normalizing88Sr/86Sr to 8.3752 and 146Nd/144Nd to 0.7219. Isotopic ratio measure-ment errors are 2σmean and precision on the Sm/Nd abundance ratios
Felsic zoneMafic zoneBoundary zone
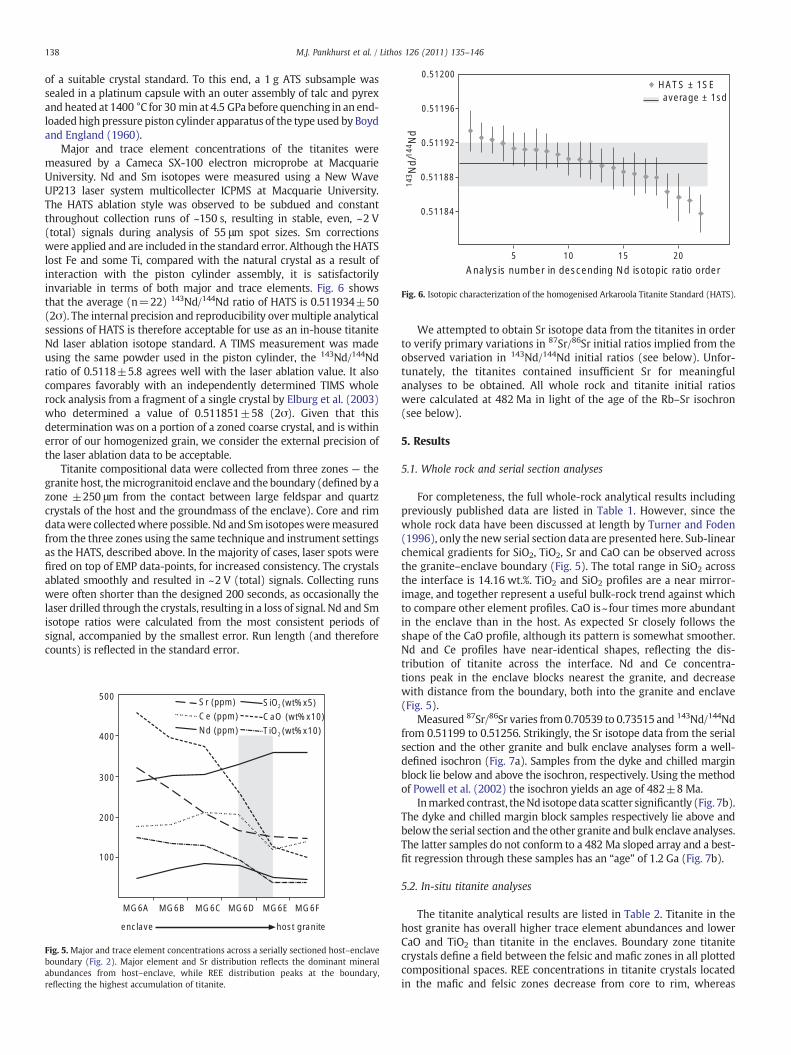
Fig. 4. Locality of titanite crystals across a sharp host–enclave boundary analyzed byEMP and LA-ICPMS. Note the lack of a chilled margin within the enclave.
is about 0.01% relative deviation (1σ). Blanks measured during thiswork were 2 ng of Sr and 400 pg of Nd and Sm.
Selected samples were analysed for the REE (La, Ce, Nd, Sm, Eu, Gd,Dy, Er and Yb) by adapting the double cation exchange column tech-niques of Crocket al. (1984) andmass spectrometrymethods developedbySunandNesbitt (1978).Within-run ratio relative standarddeviationswere less than 0.2%.
4.3. Preparation of a titanite standard
To improve confidence during the LA-ICPMS analysis of Nd and Srisotope systems in the Mannum titanite crystals, an in-house standardwas developed at Macquarie University to demonstrate reproducibilityof a matrix-matched titanite standard. A large (5 cm radius), euhedraltitanite crystal – Arkaroola Titanite Standard (ATS) – from Arkaroola,South Australia was shown to be chemically variable after initial EMPwork; therefore a homogenized ATS (HATS) was prepared. The crystalwas crushed and hand-picked to remove minor oxide minerals, beforebeing powdered in an agate mill. Approximately 100 g of fine ATSpowderwereproduced. 5 g subsamples of ATSweremixedwith lithiummetaborate flux in whole-part ratios ranging from 4:1 to 1:4. Thesemixes were placed in platinum crucibles and fired at constantly de-creasing temperatures, startingat ~1500 °C to~1200 °Cover2–4 h runs,at the endofwhich, theplatinumcrucibleswere removedandquenchedin room temperature water. The aim of this work was to reproduce thecrystal-growth results of Prowatke and Klemme (2005), and thus growa suitably chemically homogeneous crystal. The fluxwas used to reduceany chemical gradient developed across the crystal-liquid boundaryduring crystallization, and so minimize chemical zoning. The workproduced negative results because the runs did not grow crystals. Thus,a glass standardwas considered tobe thebest alternative, in the absence
HATS ± 1SEaverage ± 1sd
143 N
d/14
4 Nd
Analysis number in descending Nd isotopic ratio order
0.51184
0.51188
0.51192
0.51196
0.51200
5 10 15 20
Fig. 6. Isotopic characterization of the homogenised Arkaroola Titanite Standard (HATS).
138 M.J. Pankhurst et al. / Lithos 126 (2011) 135–146
of a suitable crystal standard. To this end, a 1 g ATS subsample wassealed in a platinum capsule with an outer assembly of talc and pyrexand heated at 1400 °C for 30 min at 4.5 GPa before quenching in an end-loadedhigh pressure piston cylinder apparatus of the type used by Boydand England (1960).
Major and trace element concentrations of the titanites weremeasured by a Cameca SX-100 electron microprobe at MacquarieUniversity. Nd and Sm isotopes were measured using a New WaveUP213 laser system multicollecter ICPMS at Macquarie University.The HATS ablation style was observed to be subdued and constantthroughout collection runs of ~150 s, resulting in stable, even, ~2 V(total) signals during analysis of 55 μm spot sizes. Sm correctionswere applied and are included in the standard error. Although the HATSlost Fe and some Ti, compared with the natural crystal as a result ofinteraction with the piston cylinder assembly, it is satisfactorilyinvariable in terms of both major and trace elements. Fig. 6 showsthat the average (n=22) 143Nd/144Nd ratio of HATS is 0.511934±50(2σ). The internal precision and reproducibility overmultiple analyticalsessions of HATS is therefore acceptable for use as an in-house titaniteNd laser ablation isotope standard. A TIMS measurement was madeusing the same powder used in the piston cylinder, the 143Nd/144Ndratio of 0.5118±5.8 agrees well with the laser ablation value. It alsocompares favorably with an independently determined TIMS wholerock analysis from a fragment of a single crystal by Elburg et al. (2003)who determined a value of 0.511851±58 (2σ). Given that thisdetermination was on a portion of a zoned coarse crystal, and is withinerror of our homogenized grain, we consider the external precision ofthe laser ablation data to be acceptable.
Titanite compositional data were collected from three zones — thegranite host, themicrogranitoid enclave and the boundary (defined by azone ±250 μm from the contact between large feldspar and quartzcrystals of the host and the groundmass of the enclave). Core and rimdatawere collectedwhere possible. Nd and Sm isotopesweremeasuredfrom the three zones using the same technique and instrument settingsas the HATS, described above. In the majority of cases, laser spots werefired on top of EMP data-points, for increased consistency. The crystalsablated smoothly and resulted in ~2 V (total) signals. Collecting runswere often shorter than the designed 200 seconds, as occasionally thelaser drilled through the crystals, resulting in a loss of signal. Nd and Smisotope ratios were calculated from the most consistent periods ofsignal, accompanied by the smallest error. Run length (and thereforecounts) is reflected in the standard error.
500
400
300
200
100
MG6A MG6B MG6C MG6D MG6E MG6F
enclave host granite
Sr (ppm)
Ce (ppm)SiO2 (wt%x5)
TiO2 (wt%x10)Nd (ppm)CaO (wt%x10)
Fig. 5.Major and trace element concentrations across a serially sectioned host–enclaveboundary (Fig. 2). Major element and Sr distribution reflects the dominant mineralabundances from host–enclave, while REE distribution peaks at the boundary,reflecting the highest accumulation of titanite.
We attempted to obtain Sr isotope data from the titanites in orderto verify primary variations in 87Sr/86Sr initial ratios implied from theobserved variation in 143Nd/144Nd initial ratios (see below). Unfor-tunately, the titanites contained insufficient Sr for meaningfulanalyses to be obtained. All whole rock and titanite initial ratioswere calculated at 482 Ma in light of the age of the Rb–Sr isochron(see below).
5. Results
5.1. Whole rock and serial section analyses
For completeness, the full whole-rock analytical results includingpreviously published data are listed in Table 1. However, since thewhole rock data have been discussed at length by Turner and Foden(1996), only the new serial section data are presented here. Sub-linearchemical gradients for SiO2, TiO2, Sr and CaO can be observed acrossthe granite–enclave boundary (Fig. 5). The total range in SiO2 acrossthe interface is 14.16 wt.%. TiO2 and SiO2 profiles are a near mirror-image, and together represent a useful bulk-rock trend against whichto compare other element profiles. CaO is~four times more abundantin the enclave than in the host. As expected Sr closely follows theshape of the CaO profile, although its pattern is somewhat smoother.Nd and Ce profiles have near-identical shapes, reflecting the dis-tribution of titanite across the interface. Nd and Ce concentra-tions peak in the enclave blocks nearest the granite, and decreasewith distance from the boundary, both into the granite and enclave(Fig. 5).
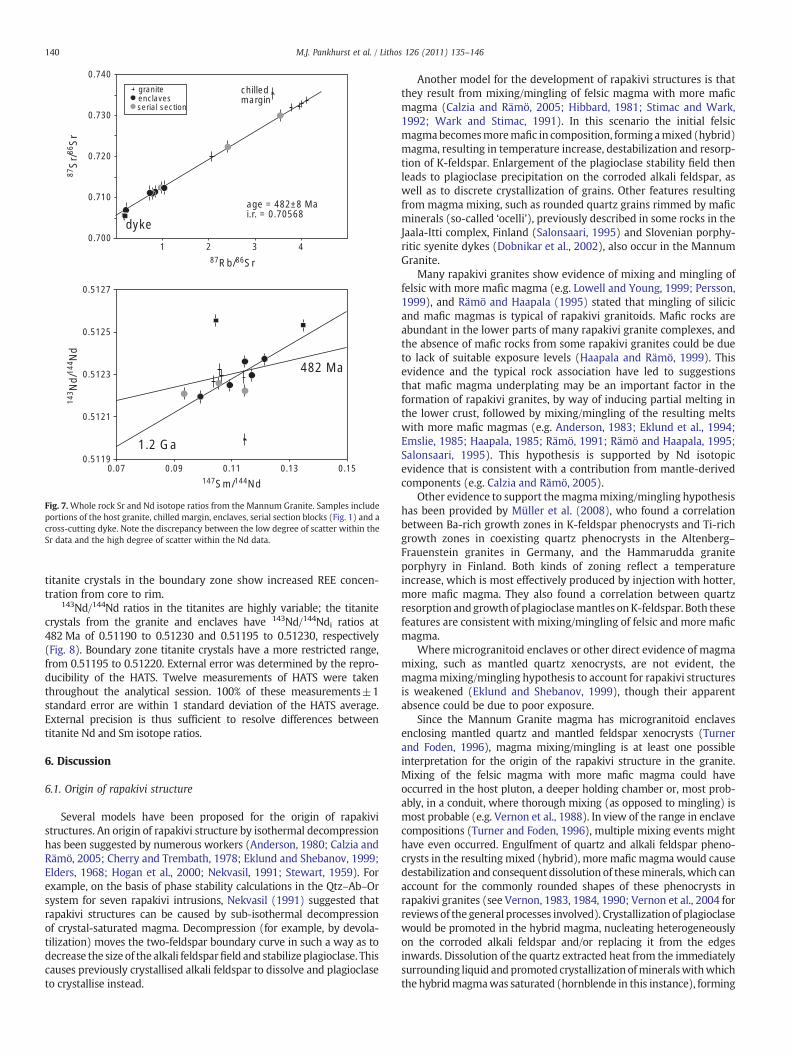
Measured 87Sr/86Sr varies from0.70539 to 0.73515 and 143Nd/144Ndfrom 0.51199 to 0.51256. Strikingly, the Sr isotope data from the serialsection and the other granite and bulk enclave analyses form a well-defined isochron (Fig. 7a). Samples from the dyke and chilled marginblock lie below and above the isochron, respectively. Using the methodof Powell et al. (2002) the isochron yields an age of 482±8 Ma.
Inmarked contrast, theNd isotopedata scatter significantly (Fig. 7b).The dyke and chilled margin block samples respectively lie above andbelow the serial section and the other granite and bulk enclave analyses.The latter samples do not conform to a 482 Ma sloped array and a best-fit regression through these samples has an “age” of 1.2 Ga (Fig. 7b).
5.2. In-situ titanite analyses
The titanite analytical results are listed in Table 2. Titanite in thehost granite has overall higher trace element abundances and lowerCaO and TiO2 than titanite in the enclaves. Boundary zone titanitecrystals define a field between the felsic and mafic zones in all plottedcompositional spaces. REE concentrations in titanite crystals locatedin the mafic and felsic zones decrease from core to rim, whereas
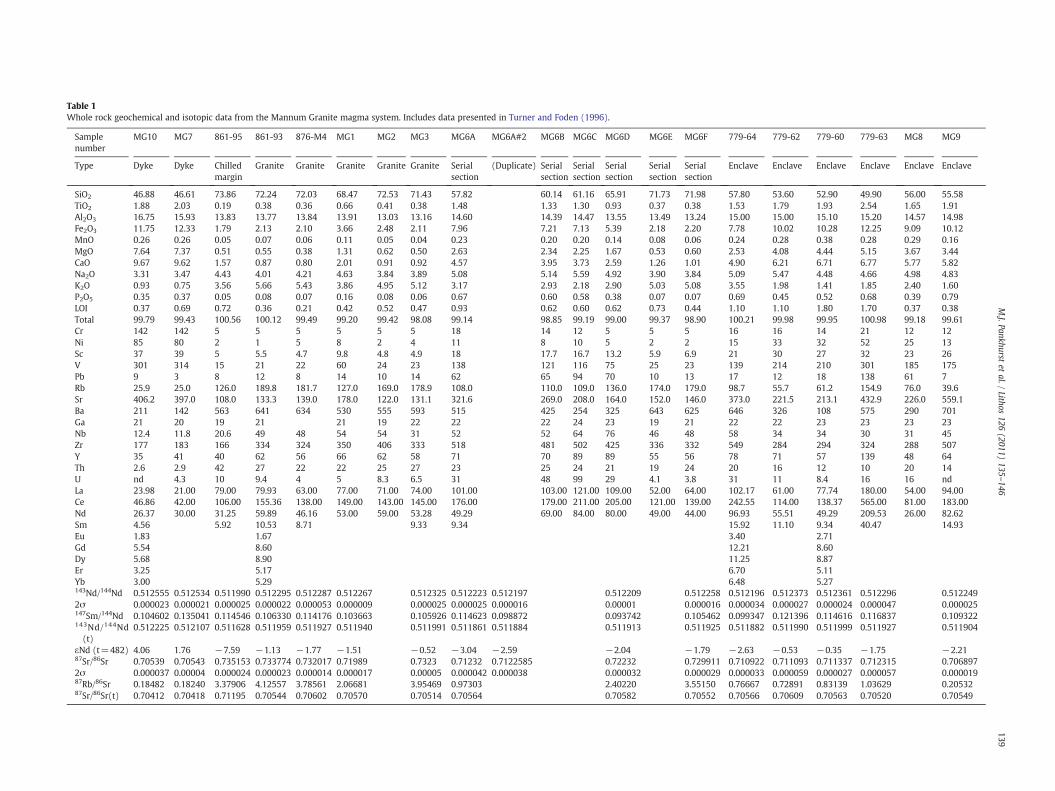
Table 1Whole rock geochemical and isotopic data from the Mannum Granite magma system. Includes data presented in Turner and Foden (1996).
Samplenumber
MG10 MG7 861-95 861-93 876-M4 MG1 MG2 MG3 MG6A MG6A#2 MG6B MG6C MG6D MG6E MG6F 779-64 779-62 779-60 779-63 MG8 MG9
Type Dyke Dyke Chilledmargin
Granite Granite Granite Granite Granite Serialsection
(Duplicate) Serialsection
Serialsection
Serialsection
Serialsection
Serialsection
Enclave Enclave Enclave Enclave Enclave Enclave
SiO2 46.88 46.61 73.86 72.24 72.03 68.47 72.53 71.43 57.82 60.14 61.16 65.91 71.73 71.98 57.80 53.60 52.90 49.90 56.00 55.58TiO2 1.88 2.03 0.19 0.38 0.36 0.66 0.41 0.38 1.48 1.33 1.30 0.93 0.37 0.38 1.53 1.79 1.93 2.54 1.65 1.91Al2O3 16.75 15.93 13.83 13.77 13.84 13.91 13.03 13.16 14.60 14.39 14.47 13.55 13.49 13.24 15.00 15.00 15.10 15.20 14.57 14.98Fe2O3 11.75 12.33 1.79 2.13 2.10 3.66 2.48 2.11 7.96 7.21 7.13 5.39 2.18 2.20 7.78 10.02 10.28 12.25 9.09 10.12MnO 0.26 0.26 0.05 0.07 0.06 0.11 0.05 0.04 0.23 0.20 0.20 0.14 0.08 0.06 0.24 0.28 0.38 0.28 0.29 0.16MgO 7.64 7.37 0.51 0.55 0.38 1.31 0.62 0.50 2.63 2.34 2.25 1.67 0.53 0.60 2.53 4.08 4.44 5.15 3.67 3.44CaO 9.67 9.62 1.57 0.87 0.80 2.01 0.91 0.92 4.57 3.95 3.73 2.59 1.26 1.01 4.90 6.21 6.71 6.77 5.77 5.82Na2O 3.31 3.47 4.43 4.01 4.21 4.63 3.84 3.89 5.08 5.14 5.59 4.92 3.90 3.84 5.09 5.47 4.48 4.66 4.98 4.83K2O 0.93 0.75 3.56 5.66 5.43 3.86 4.95 5.12 3.17 2.93 2.18 2.90 5.03 5.08 3.55 1.98 1.41 1.85 2.40 1.60P2O5 0.35 0.37 0.05 0.08 0.07 0.16 0.08 0.06 0.67 0.60 0.58 0.38 0.07 0.07 0.69 0.45 0.52 0.68 0.39 0.79LOI 0.37 0.69 0.72 0.36 0.21 0.42 0.52 0.47 0.93 0.62 0.60 0.62 0.73 0.44 1.10 1.10 1.80 1.70 0.37 0.38Total 99.79 99.43 100.56 100.12 99.49 99.20 99.42 98.08 99.14 98.85 99.19 99.00 99.37 98.90 100.21 99.98 99.95 100.98 99.18 99.61Cr 142 142 5 5 5 5 5 5 18 14 12 5 5 5 16 16 14 21 12 12Ni 85 80 2 1 5 8 2 4 11 8 10 5 2 2 15 33 32 52 25 13Sc 37 39 5 5.5 4.7 9.8 4.8 4.9 18 17.7 16.7 13.2 5.9 6.9 21 30 27 32 23 26V 301 314 15 21 22 60 24 23 138 121 116 75 25 23 139 214 210 301 185 175Pb 9 3 8 12 8 14 10 14 62 65 94 70 10 13 17 12 18 138 61 7Rb 25.9 25.0 126.0 189.8 181.7 127.0 169.0 178.9 108.0 110.0 109.0 136.0 174.0 179.0 98.7 55.7 61.2 154.9 76.0 39.6Sr 406.2 397.0 108.0 133.3 139.0 178.0 122.0 131.1 321.6 269.0 208.0 164.0 152.0 146.0 373.0 221.5 213.1 432.9 226.0 559.1Ba 211 142 563 641 634 530 555 593 515 425 254 325 643 625 646 326 108 575 290 701Ga 21 20 19 21 21 19 22 22 22 24 23 19 21 22 22 23 23 23 23Nb 12.4 11.8 20.6 49 48 54 54 31 52 52 64 76 46 48 58 34 34 30 31 45Zr 177 183 166 334 324 350 406 333 518 481 502 425 336 332 549 284 294 324 288 507Y 35 41 40 62 56 66 62 58 71 70 89 89 55 56 78 71 57 139 48 64Th 2.6 2.9 42 27 22 22 25 27 23 25 24 21 19 24 20 16 12 10 20 14U nd 4.3 10 9.4 4 5 8.3 6.5 31 48 99 29 4.1 3.8 31 11 8.4 16 16 ndLa 23.98 21.00 79.00 79.93 63.00 77.00 71.00 74.00 101.00 103.00 121.00 109.00 52.00 64.00 102.17 61.00 77.74 180.00 54.00 94.00Ce 46.86 42.00 106.00 155.36 138.00 149.00 143.00 145.00 176.00 179.00 211.00 205.00 121.00 139.00 242.55 114.00 138.37 565.00 81.00 183.00Nd 26.37 30.00 31.25 59.89 46.16 53.00 59.00 53.28 49.29 69.00 84.00 80.00 49.00 44.00 96.93 55.51 49.29 209.53 26.00 82.62Sm 4.56 5.92 10.53 8.71 9.33 9.34 15.92 11.10 9.34 40.47 14.93Eu 1.83 1.67 3.40 2.71Gd 5.54 8.60 12.21 8.60Dy 5.68 8.90 11.25 8.87Er 3.25 5.17 6.70 5.11Yb 3.00 5.29 6.48 5.27143Nd/144Nd 0.512555 0.512534 0.511990 0.512295 0.512287 0.512267 0.512325 0.512223 0.512197 0.512209 0.512258 0.512196 0.512373 0.512361 0.512296 0.5122492σ 0.000023 0.000021 0.000025 0.000022 0.000053 0.000009 0.000025 0.000025 0.000016 0.00001 0.000016 0.000034 0.000027 0.000024 0.000047 0.000025147Sm/144Nd 0.104602 0.135041 0.114546 0.106330 0.114176 0.103663 0.105926 0.114623 0.098872 0.093742 0.105462 0.099347 0.121396 0.114616 0.116837 0.109322143Nd/144Nd(t)
0.512225 0.512107 0.511628 0.511959 0.511927 0.511940 0.511991 0.511861 0.511884 0.511913 0.511925 0.511882 0.511990 0.511999 0.511927 0.511904
εNd (t=482) 4.06 1.76 −7.59 −1.13 −1.77 −1.51 −0.52 −3.04 −2.59 −2.04 −1.79 −2.63 −0.53 −0.35 −1.75 −2.2187Sr/86Sr 0.70539 0.70543 0.735153 0.733774 0.732017 0.71989 0.7323 0.71232 0.7122585 0.72232 0.729911 0.710922 0.711093 0.711337 0.712315 0.7068972σ 0.000037 0.00004 0.000024 0.000023 0.000014 0.000017 0.00005 0.000042 0.000038 0.000032 0.000029 0.000033 0.000059 0.000027 0.000057 0.00001987Rb/86Sr 0.18482 0.18240 3.37906 4.12557 3.78561 2.06681 3.95469 0.97303 2.40220 3.55150 0.76667 0.72891 0.83139 1.03629 0.2053287Sr/86Sr(t) 0.70412 0.70418 0.71195 0.70544 0.70602 0.70570 0.70514 0.70564 0.70582 0.70552 0.70566 0.70609 0.70563 0.70520 0.70549
139M.J.Pankhurst
etal./
Lithos126
(2011)135
–146
87Rb/86Sr
87S
r/86
Sr
147Sm/144Nd
143 N
d/14
4 Nd
dyke
graniteenclavesserial section
chilledmargin
age = 482±8 Mai.r. = 0.70568
1 2 3 4
0.710
0.720
0.730
0.740
0.700
0.5127
0.5125
0.5123
0.5121
0.51190.07 0.09 0.11 0.13 0.15
482 Ma
1.2 Ga
Fig. 7.Whole rock Sr and Nd isotope ratios from the Mannum Granite. Samples includeportions of the host granite, chilled margin, enclaves, serial section blocks (Fig. 1) and across-cutting dyke. Note the discrepancy between the low degree of scatter within theSr data and the high degree of scatter within the Nd data.
140 M.J. Pankhurst et al. / Lithos 126 (2011) 135–146
titanite crystals in the boundary zone show increased REE concen-tration from core to rim.
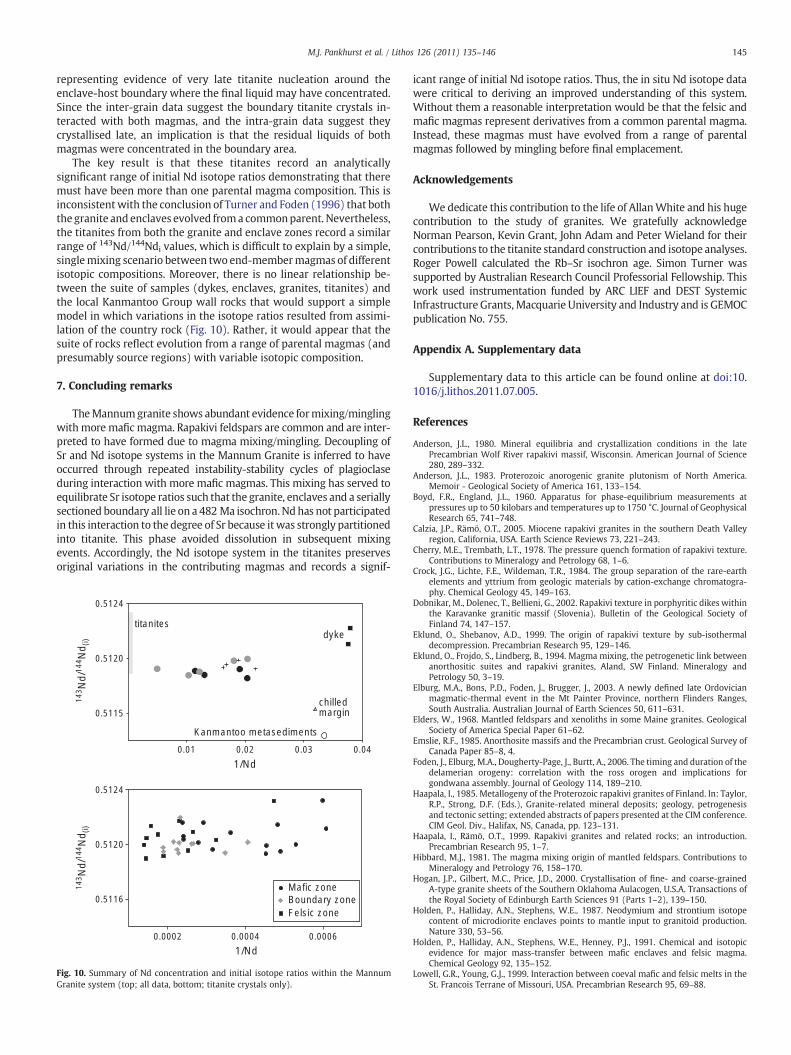
143Nd/144Nd ratios in the titanites are highly variable; the titanitecrystals from the granite and enclaves have 143Nd/144Ndi ratios at482 Ma of 0.51190 to 0.51230 and 0.51195 to 0.51230, respectively(Fig. 8). Boundary zone titanite crystals have a more restricted range,from 0.51195 to 0.51220. External error was determined by the repro-ducibility of the HATS. Twelve measurements of HATS were takenthroughout the analytical session. 100% of these measurements±1standard error are within 1 standard deviation of the HATS average.External precision is thus sufficient to resolve differences betweentitanite Nd and Sm isotope ratios.
6. Discussion
6.1. Origin of rapakivi structure
Several models have been proposed for the origin of rapakivistructures. An origin of rapakivi structure by isothermal decompressionhas been suggested by numerous workers (Anderson, 1980; Calzia andRämö, 2005; Cherry and Trembath, 1978; Eklund and Shebanov, 1999;Elders, 1968; Hogan et al., 2000; Nekvasil, 1991; Stewart, 1959). Forexample, on the basis of phase stability calculations in the Qtz–Ab–Orsystem for seven rapakivi intrusions, Nekvasil (1991) suggested thatrapakivi structures can be caused by sub-isothermal decompressionof crystal-saturated magma. Decompression (for example, by devola-tilization) moves the two-feldspar boundary curve in such a way as todecrease the size of the alkali feldsparfield and stabilize plagioclase. Thiscauses previously crystallised alkali feldspar to dissolve and plagioclaseto crystallise instead.
Another model for the development of rapakivi structures is thatthey result from mixing/mingling of felsic magma with more maficmagma (Calzia and Rämö, 2005; Hibbard, 1981; Stimac and Wark,1992; Wark and Stimac, 1991). In this scenario the initial felsicmagmabecomesmoremafic in composition, forming amixed (hybrid)magma, resulting in temperature increase, destabilization and resorp-tion of K-feldspar. Enlargement of the plagioclase stability field thenleads to plagioclase precipitation on the corroded alkali feldspar, aswell as to discrete crystallization of grains. Other features resultingfrom magma mixing, such as rounded quartz grains rimmed by maficminerals (so-called ‘ocelli’), previously described in some rocks in theJaala-Itti complex, Finland (Salonsaari, 1995) and Slovenian porphy-ritic syenite dykes (Dobnikar et al., 2002), also occur in the MannumGranite.
Many rapakivi granites show evidence of mixing and mingling offelsic with more mafic magma (e.g. Lowell and Young, 1999; Persson,1999), and Rämö and Haapala (1995) stated that mingling of silicicand mafic magmas is typical of rapakivi granitoids. Mafic rocks areabundant in the lower parts of many rapakivi granite complexes, andthe absence of mafic rocks from some rapakivi granites could be dueto lack of suitable exposure levels (Haapala and Rämö, 1999). Thisevidence and the typical rock association have led to suggestionsthat mafic magma underplating may be an important factor in theformation of rapakivi granites, by way of inducing partial melting inthe lower crust, followed by mixing/mingling of the resulting meltswith more mafic magmas (e.g. Anderson, 1983; Eklund et al., 1994;Emslie, 1985; Haapala, 1985; Rämö, 1991; Rämö and Haapala, 1995;Salonsaari, 1995). This hypothesis is supported by Nd isotopicevidence that is consistent with a contribution from mantle-derivedcomponents (e.g. Calzia and Rämö, 2005).
Other evidence to support themagmamixing/mingling hypothesishas been provided by Müller et al. (2008), who found a correlationbetween Ba-rich growth zones in K-feldspar phenocrysts and Ti-richgrowth zones in coexisting quartz phenocrysts in the Altenberg–Frauenstein granites in Germany, and the Hammarudda graniteporphyry in Finland. Both kinds of zoning reflect a temperatureincrease, which is most effectively produced by injection with hotter,more mafic magma. They also found a correlation between quartzresorption andgrowthof plagioclasemantles onK-feldspar. Both thesefeatures are consistent with mixing/mingling of felsic and more maficmagma.
Where microgranitoid enclaves or other direct evidence of magmamixing, such as mantled quartz xenocrysts, are not evident, themagmamixing/mingling hypothesis to account for rapakivi structuresis weakened (Eklund and Shebanov, 1999), though their apparentabsence could be due to poor exposure.
Since the Mannum Granite magma has microgranitoid enclavesenclosing mantled quartz and mantled feldspar xenocrysts (Turnerand Foden, 1996), magma mixing/mingling is at least one possibleinterpretation for the origin of the rapakivi structure in the granite.Mixing of the felsic magma with more mafic magma could haveoccurred in the host pluton, a deeper holding chamber or, most prob-ably, in a conduit, where thorough mixing (as opposed to mingling) ismost probable (e.g. Vernon et al., 1988). In view of the range in enclavecompositions (Turner and Foden, 1996), multiple mixing events mighthave even occurred. Engulfment of quartz and alkali feldspar pheno-crysts in the resulting mixed (hybrid), more mafic magma would causedestabilization and consequent dissolution of theseminerals, which canaccount for the commonly rounded shapes of these phenocrysts inrapakivi granites (see Vernon, 1983, 1984, 1990; Vernon et al., 2004 forreviews of the general processes involved). Crystallization of plagioclasewould be promoted in the hybrid magma, nucleating heterogeneouslyon the corroded alkali feldspar and/or replacing it from the edgesinwards. Dissolution of the quartz extracted heat from the immediatelysurrounding liquid andpromoted crystallization ofmineralswithwhichthe hybridmagmawas saturated (hornblende in this instance), forming
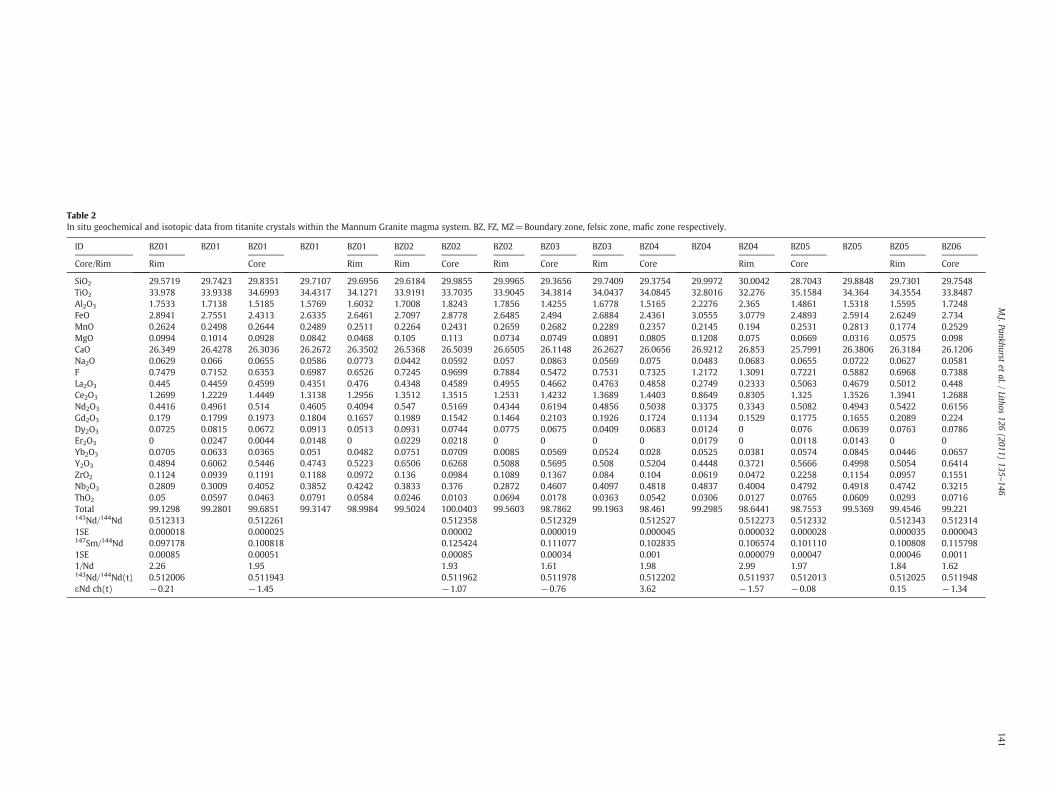
Table 2In situ geochemical and isotopic data from titanite crystals within the Mannum Granite magma system. BZ, FZ, MZ=Boundary zone, felsic zone, mafic zone respectively.
ID BZ01 BZ01 BZ01 BZ01 BZ01 BZ02 BZ02 BZ02 BZ03 BZ03 BZ04 BZ04 BZ04 BZ05 BZ05 BZ05 BZ06
Core/Rim Rim Core Rim Rim Core Rim Core Rim Core Rim Core Rim Core
SiO2 29.5719 29.7423 29.8351 29.7107 29.6956 29.6184 29.9855 29.9965 29.3656 29.7409 29.3754 29.9972 30.0042 28.7043 29.8848 29.7301 29.7548TiO2 33.978 33.9338 34.6993 34.4317 34.1271 33.9191 33.7035 33.9045 34.3814 34.0437 34.0845 32.8016 32.276 35.1584 34.364 34.3554 33.8487Al2O3 1.7533 1.7138 1.5185 1.5769 1.6032 1.7008 1.8243 1.7856 1.4255 1.6778 1.5165 2.2276 2.365 1.4861 1.5318 1.5595 1.7248FeO 2.8941 2.7551 2.4313 2.6335 2.6461 2.7097 2.8778 2.6485 2.494 2.6884 2.4361 3.0555 3.0779 2.4893 2.5914 2.6249 2.734MnO 0.2624 0.2498 0.2644 0.2489 0.2511 0.2264 0.2431 0.2659 0.2682 0.2289 0.2357 0.2145 0.194 0.2531 0.2813 0.1774 0.2529MgO 0.0994 0.1014 0.0928 0.0842 0.0468 0.105 0.113 0.0734 0.0749 0.0891 0.0805 0.1208 0.075 0.0669 0.0316 0.0575 0.098CaO 26.349 26.4278 26.3036 26.2672 26.3502 26.5368 26.5039 26.6505 26.1148 26.2627 26.0656 26.9212 26.853 25.7991 26.3806 26.3184 26.1206Na2O 0.0629 0.066 0.0655 0.0586 0.0773 0.0442 0.0592 0.057 0.0863 0.0569 0.075 0.0483 0.0683 0.0655 0.0722 0.0627 0.0581F 0.7479 0.7152 0.6353 0.6987 0.6526 0.7245 0.9699 0.7884 0.5472 0.7531 0.7325 1.2172 1.3091 0.7221 0.5882 0.6968 0.7388La2O3 0.445 0.4459 0.4599 0.4351 0.476 0.4348 0.4589 0.4955 0.4662 0.4763 0.4858 0.2749 0.2333 0.5063 0.4679 0.5012 0.448Ce2O3 1.2699 1.2229 1.4449 1.3138 1.2956 1.3512 1.3515 1.2531 1.4232 1.3689 1.4403 0.8649 0.8305 1.325 1.3526 1.3941 1.2688Nd2O3 0.4416 0.4961 0.514 0.4605 0.4094 0.547 0.5169 0.4344 0.6194 0.4856 0.5038 0.3375 0.3343 0.5082 0.4943 0.5422 0.6156Gd2O3 0.179 0.1799 0.1973 0.1804 0.1657 0.1989 0.1542 0.1464 0.2103 0.1926 0.1724 0.1134 0.1529 0.1775 0.1655 0.2089 0.224Dy2O3 0.0725 0.0815 0.0672 0.0913 0.0513 0.0931 0.0744 0.0775 0.0675 0.0409 0.0683 0.0124 0 0.076 0.0639 0.0763 0.0786Er2O3 0 0.0247 0.0044 0.0148 0 0.0229 0.0218 0 0 0 0 0.0179 0 0.0118 0.0143 0 0Yb2O3 0.0705 0.0633 0.0365 0.051 0.0482 0.0751 0.0709 0.0085 0.0569 0.0524 0.028 0.0525 0.0381 0.0574 0.0845 0.0446 0.0657Y2O3 0.4894 0.6062 0.5446 0.4743 0.5223 0.6506 0.6268 0.5088 0.5695 0.508 0.5204 0.4448 0.3721 0.5666 0.4998 0.5054 0.6414ZrO2 0.1124 0.0939 0.1191 0.1188 0.0972 0.136 0.0984 0.1089 0.1367 0.084 0.104 0.0619 0.0472 0.2258 0.1154 0.0957 0.1551Nb2O3 0.2809 0.3009 0.4052 0.3852 0.4242 0.3833 0.376 0.2872 0.4607 0.4097 0.4818 0.4837 0.4004 0.4792 0.4918 0.4742 0.3215ThO2 0.05 0.0597 0.0463 0.0791 0.0584 0.0246 0.0103 0.0694 0.0178 0.0363 0.0542 0.0306 0.0127 0.0765 0.0609 0.0293 0.0716Total 99.1298 99.2801 99.6851 99.3147 98.9984 99.5024 100.0403 99.5603 98.7862 99.1963 98.461 99.2985 98.6441 98.7553 99.5369 99.4546 99.221143Nd/144Nd 0.512313 0.512261 0.512358 0.512329 0.512527 0.512273 0.512332 0.512343 0.5123141SE 0.000018 0.000025 0.00002 0.000019 0.000045 0.000032 0.000028 0.000035 0.000043147Sm/144Nd 0.097178 0.100818 0.125424 0.111077 0.102835 0.106574 0.101110 0.100808 0.1157981SE 0.00085 0.00051 0.00085 0.00034 0.001 0.000079 0.00047 0.00046 0.00111/Nd 2.26 1.95 1.93 1.61 1.98 2.99 1.97 1.84 1.62143Nd/144Nd(t) 0.512006 0.511943 0.511962 0.511978 0.512202 0.511937 0.512013 0.512025 0.511948εNd ch(t) −0.21 −1.45 −1.07 −0.76 3.62 −1.57 −0.08 0.15 −1.34
141M.J.Pankhurst
etal./
Lithos126
(2011)135
–146
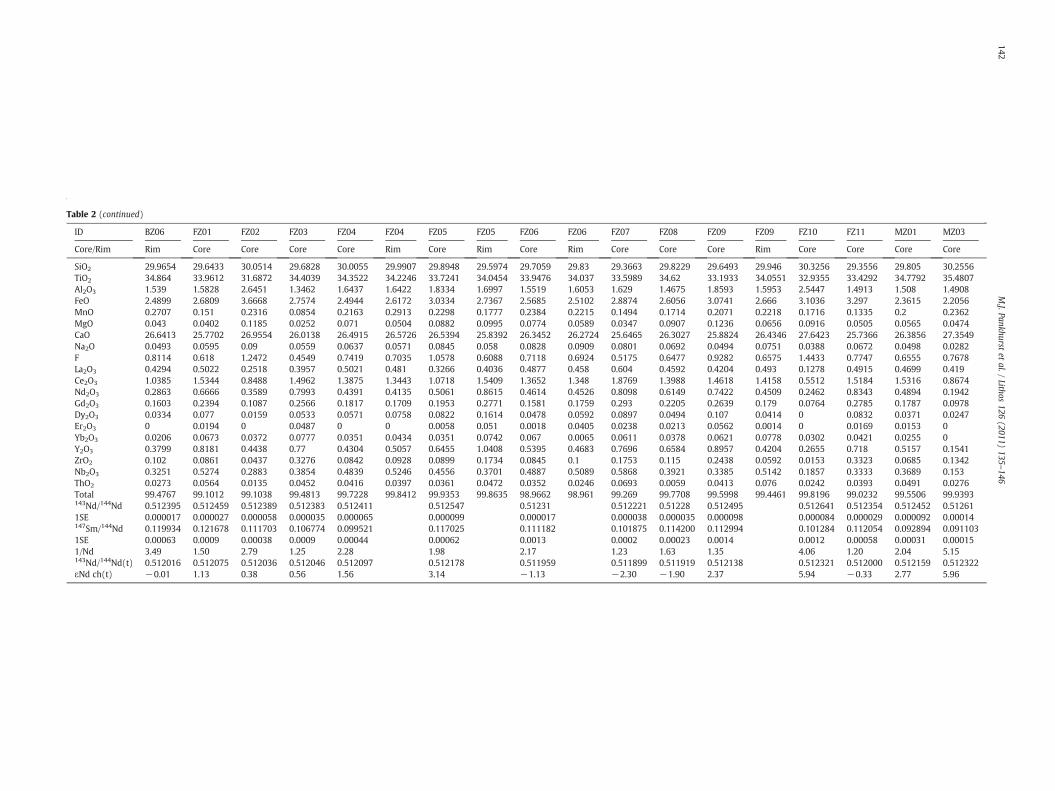
Table 2In situ geochemical and isotopic data from titanite crystals within the Mannum Granite magma system. BZ, FZ, MZ=Boundary zone, felsic zone, mafic zone respectively.
ID BZ06 FZ01 FZ02 FZ03 FZ04 FZ04 FZ05 FZ05 FZ06 FZ06 FZ07 FZ08 FZ09 FZ09 FZ10 FZ11 MZ01 MZ03
Core/Rim Rim Core Core Core Core Rim Core Rim Core Rim Core Core Core Rim Core Core Core Core
SiO2 29.9654 29.6433 30.0514 29.6828 30.0055 29.9907 29.8948 29.5974 29.7059 29.83 29.3663 29.8229 29.6493 29.946 30.3256 29.3556 29.805 30.2556TiO2 34.864 33.9612 31.6872 34.4039 34.3522 34.2246 33.7241 34.0454 33.9476 34.037 33.5989 34.62 33.1933 34.0551 32.9355 33.4292 34.7792 35.4807Al2O3 1.539 1.5828 2.6451 1.3462 1.6437 1.6422 1.8334 1.6997 1.5519 1.6053 1.629 1.4675 1.8593 1.5953 2.5447 1.4913 1.508 1.4908FeO 2.4899 2.6809 3.6668 2.7574 2.4944 2.6172 3.0334 2.7367 2.5685 2.5102 2.8874 2.6056 3.0741 2.666 3.1036 3.297 2.3615 2.2056MnO 0.2707 0.151 0.2316 0.0854 0.2163 0.2913 0.2298 0.1777 0.2384 0.2215 0.1494 0.1714 0.2071 0.2218 0.1716 0.1335 0.2 0.2362MgO 0.043 0.0402 0.1185 0.0252 0.071 0.0504 0.0882 0.0995 0.0774 0.0589 0.0347 0.0907 0.1236 0.0656 0.0916 0.0505 0.0565 0.0474CaO 26.6413 25.7702 26.9554 26.0138 26.4915 26.5726 26.5394 25.8392 26.3452 26.2724 25.6465 26.3027 25.8824 26.4346 27.6423 25.7366 26.3856 27.3549Na2O 0.0493 0.0595 0.09 0.0559 0.0637 0.0571 0.0845 0.058 0.0828 0.0909 0.0801 0.0692 0.0494 0.0751 0.0388 0.0672 0.0498 0.0282F 0.8114 0.618 1.2472 0.4549 0.7419 0.7035 1.0578 0.6088 0.7118 0.6924 0.5175 0.6477 0.9282 0.6575 1.4433 0.7747 0.6555 0.7678La2O3 0.4294 0.5022 0.2518 0.3957 0.5021 0.481 0.3266 0.4036 0.4877 0.458 0.604 0.4592 0.4204 0.493 0.1278 0.4915 0.4699 0.419Ce2O3 1.0385 1.5344 0.8488 1.4962 1.3875 1.3443 1.0718 1.5409 1.3652 1.348 1.8769 1.3988 1.4618 1.4158 0.5512 1.5184 1.5316 0.8674Nd2O3 0.2863 0.6666 0.3589 0.7993 0.4391 0.4135 0.5061 0.8615 0.4614 0.4526 0.8098 0.6149 0.7422 0.4509 0.2462 0.8343 0.4894 0.1942Gd2O3 0.1603 0.2394 0.1087 0.2566 0.1817 0.1709 0.1953 0.2771 0.1581 0.1759 0.293 0.2205 0.2639 0.179 0.0764 0.2785 0.1787 0.0978Dy2O3 0.0334 0.077 0.0159 0.0533 0.0571 0.0758 0.0822 0.1614 0.0478 0.0592 0.0897 0.0494 0.107 0.0414 0 0.0832 0.0371 0.0247Er2O3 0 0.0194 0 0.0487 0 0 0.0058 0.051 0.0018 0.0405 0.0238 0.0213 0.0562 0.0014 0 0.0169 0.0153 0Yb2O3 0.0206 0.0673 0.0372 0.0777 0.0351 0.0434 0.0351 0.0742 0.067 0.0065 0.0611 0.0378 0.0621 0.0778 0.0302 0.0421 0.0255 0Y2O3 0.3799 0.8181 0.4438 0.77 0.4304 0.5057 0.6455 1.0408 0.5395 0.4683 0.7696 0.6584 0.8957 0.4204 0.2655 0.718 0.5157 0.1541ZrO2 0.102 0.0861 0.0437 0.3276 0.0842 0.0928 0.0899 0.1734 0.0845 0.1 0.1753 0.115 0.2438 0.0592 0.0153 0.3323 0.0685 0.1342Nb2O3 0.3251 0.5274 0.2883 0.3854 0.4839 0.5246 0.4556 0.3701 0.4887 0.5089 0.5868 0.3921 0.3385 0.5142 0.1857 0.3333 0.3689 0.153ThO2 0.0273 0.0564 0.0135 0.0452 0.0416 0.0397 0.0361 0.0472 0.0352 0.0246 0.0693 0.0059 0.0413 0.076 0.0242 0.0393 0.0491 0.0276Total 99.4767 99.1012 99.1038 99.4813 99.7228 99.8412 99.9353 99.8635 98.9662 98.961 99.269 99.7708 99.5998 99.4461 99.8196 99.0232 99.5506 99.9393143Nd/144Nd 0.512395 0.512459 0.512389 0.512383 0.512411 0.512547 0.51231 0.512221 0.51228 0.512495 0.512641 0.512354 0.512452 0.512611SE 0.000017 0.000027 0.000058 0.000035 0.000065 0.000099 0.000017 0.000038 0.000035 0.000098 0.000084 0.000029 0.000092 0.00014147Sm/144Nd 0.119934 0.121678 0.111703 0.106774 0.099521 0.117025 0.111182 0.101875 0.114200 0.112994 0.101284 0.112054 0.092894 0.0911031SE 0.00063 0.0009 0.00038 0.0009 0.00044 0.00062 0.0013 0.0002 0.00023 0.0014 0.0012 0.00058 0.00031 0.000151/Nd 3.49 1.50 2.79 1.25 2.28 1.98 2.17 1.23 1.63 1.35 4.06 1.20 2.04 5.15143Nd/144Nd(t) 0.512016 0.512075 0.512036 0.512046 0.512097 0.512178 0.511959 0.511899 0.511919 0.512138 0.512321 0.512000 0.512159 0.512322εNd ch(t) −0.01 1.13 0.38 0.56 1.56 3.14 −1.13 −2.30 −1.90 2.37 5.94 −0.33 2.77 5.96
Table 2 (continued)
142M.J.Pankhurst
etal./
Lithos126
(2011)135
–146
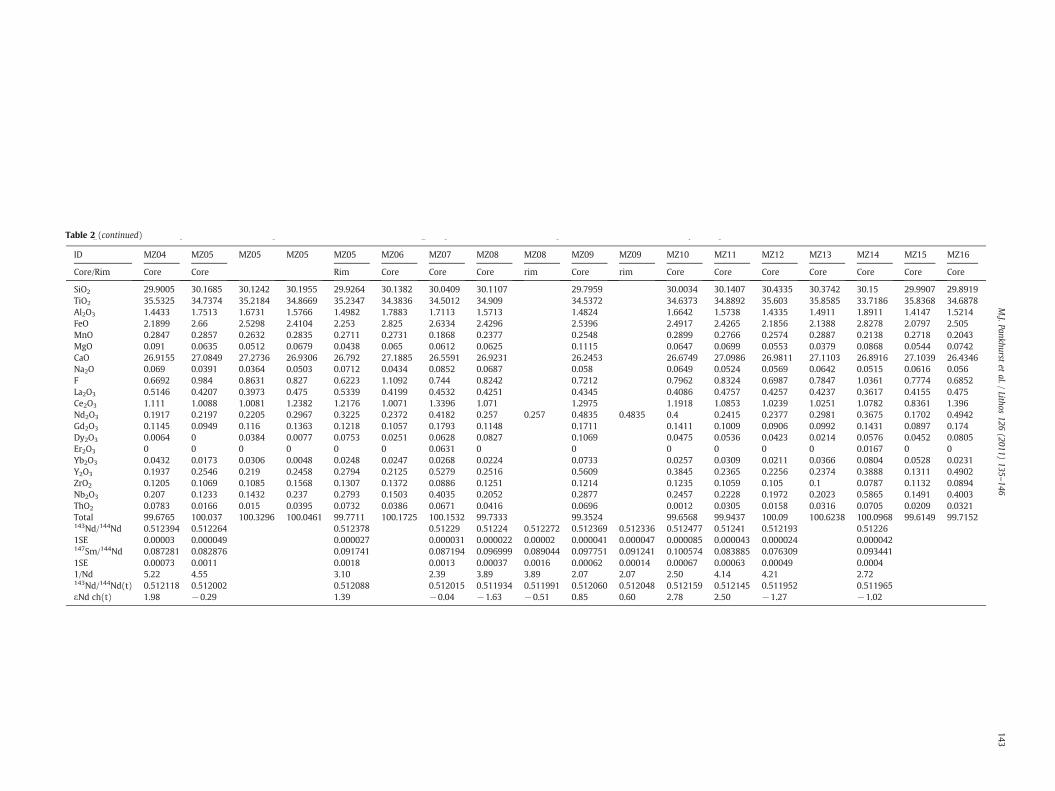
Table 2In situ geochemical and isotopic data from titanite crystals within the Mannum Granite magma system. BZ, FZ, MZ=Boundary zone, felsic zone, mafic zone respectively.
ID MZ04 MZ05 MZ05 MZ05 MZ05 MZ06 MZ07 MZ08 MZ08 MZ09 MZ09 MZ10 MZ11 MZ12 MZ13 MZ14 MZ15 MZ16
Core/Rim Core Core Rim Core Core Core rim Core rim Core Core Core Core Core Core Core
SiO2 29.9005 30.1685 30.1242 30.1955 29.9264 30.1382 30.0409 30.1107 29.7959 30.0034 30.1407 30.4335 30.3742 30.15 29.9907 29.8919TiO2 35.5325 34.7374 35.2184 34.8669 35.2347 34.3836 34.5012 34.909 34.5372 34.6373 34.8892 35.603 35.8585 33.7186 35.8368 34.6878Al2O3 1.4433 1.7513 1.6731 1.5766 1.4982 1.7883 1.7113 1.5713 1.4824 1.6642 1.5738 1.4335 1.4911 1.8911 1.4147 1.5214FeO 2.1899 2.66 2.5298 2.4104 2.253 2.825 2.6334 2.4296 2.5396 2.4917 2.4265 2.1856 2.1388 2.8278 2.0797 2.505MnO 0.2847 0.2857 0.2632 0.2835 0.2711 0.2731 0.1868 0.2377 0.2548 0.2899 0.2766 0.2574 0.2887 0.2138 0.2718 0.2043MgO 0.091 0.0635 0.0512 0.0679 0.0438 0.065 0.0612 0.0625 0.1115 0.0647 0.0699 0.0553 0.0379 0.0868 0.0544 0.0742CaO 26.9155 27.0849 27.2736 26.9306 26.792 27.1885 26.5591 26.9231 26.2453 26.6749 27.0986 26.9811 27.1103 26.8916 27.1039 26.4346Na2O 0.069 0.0391 0.0364 0.0503 0.0712 0.0434 0.0852 0.0687 0.058 0.0649 0.0524 0.0569 0.0642 0.0515 0.0616 0.056F 0.6692 0.984 0.8631 0.827 0.6223 1.1092 0.744 0.8242 0.7212 0.7962 0.8324 0.6987 0.7847 1.0361 0.7774 0.6852La2O3 0.5146 0.4207 0.3973 0.475 0.5339 0.4199 0.4532 0.4251 0.4345 0.4086 0.4757 0.4257 0.4237 0.3617 0.4155 0.475Ce2O3 1.111 1.0088 1.0081 1.2382 1.2176 1.0071 1.3396 1.071 1.2975 1.1918 1.0853 1.0239 1.0251 1.0782 0.8361 1.396Nd2O3 0.1917 0.2197 0.2205 0.2967 0.3225 0.2372 0.4182 0.257 0.257 0.4835 0.4835 0.4 0.2415 0.2377 0.2981 0.3675 0.1702 0.4942Gd2O3 0.1145 0.0949 0.116 0.1363 0.1218 0.1057 0.1793 0.1148 0.1711 0.1411 0.1009 0.0906 0.0992 0.1431 0.0897 0.174Dy2O3 0.0064 0 0.0384 0.0077 0.0753 0.0251 0.0628 0.0827 0.1069 0.0475 0.0536 0.0423 0.0214 0.0576 0.0452 0.0805Er2O3 0 0 0 0 0 0 0.0631 0 0 0 0 0 0 0.0167 0 0Yb2O3 0.0432 0.0173 0.0306 0.0048 0.0248 0.0247 0.0268 0.0224 0.0733 0.0257 0.0309 0.0211 0.0366 0.0804 0.0528 0.0231Y2O3 0.1937 0.2546 0.219 0.2458 0.2794 0.2125 0.5279 0.2516 0.5609 0.3845 0.2365 0.2256 0.2374 0.3888 0.1311 0.4902ZrO2 0.1205 0.1069 0.1085 0.1568 0.1307 0.1372 0.0886 0.1251 0.1214 0.1235 0.1059 0.105 0.1 0.0787 0.1132 0.0894Nb2O3 0.207 0.1233 0.1432 0.237 0.2793 0.1503 0.4035 0.2052 0.2877 0.2457 0.2228 0.1972 0.2023 0.5865 0.1491 0.4003ThO2 0.0783 0.0166 0.015 0.0395 0.0732 0.0386 0.0671 0.0416 0.0696 0.0012 0.0305 0.0158 0.0316 0.0705 0.0209 0.0321Total 99.6765 100.037 100.3296 100.0461 99.7711 100.1725 100.1532 99.7333 99.3524 99.6568 99.9437 100.09 100.6238 100.0968 99.6149 99.7152143Nd/144Nd 0.512394 0.512264 0.512378 0.51229 0.51224 0.512272 0.512369 0.512336 0.512477 0.51241 0.512193 0.512261SE 0.00003 0.000049 0.000027 0.000031 0.000022 0.00002 0.000041 0.000047 0.000085 0.000043 0.000024 0.000042147Sm/144Nd 0.087281 0.082876 0.091741 0.087194 0.096999 0.089044 0.097751 0.091241 0.100574 0.083885 0.076309 0.0934411SE 0.00073 0.0011 0.0018 0.0013 0.00037 0.0016 0.00062 0.00014 0.00067 0.00063 0.00049 0.00041/Nd 5.22 4.55 3.10 2.39 3.89 3.89 2.07 2.07 2.50 4.14 4.21 2.72143Nd/144Nd(t) 0.512118 0.512002 0.512088 0.512015 0.511934 0.511991 0.512060 0.512048 0.512159 0.512145 0.511952 0.511965εNd ch(t) 1.98 −0.29 1.39 −0.04 −1.63 −0.51 0.85 0.60 2.78 2.50 −1.27 −1.02
Table 2 (continued)
143M.J.Pankhurst
etal./
Lithos126
(2011)135
–146
Ce 2
O3
wt%
Fe2O3 /TiO2
Mafic zone(90% of n = 23)
Felsic zone(90% of n = 16)
Boundary zone(90% of n = 16)
0.7
0.9
1.1
1.3
1.5
1.7
1.9
0.070.06 0.08 0.09 0.1
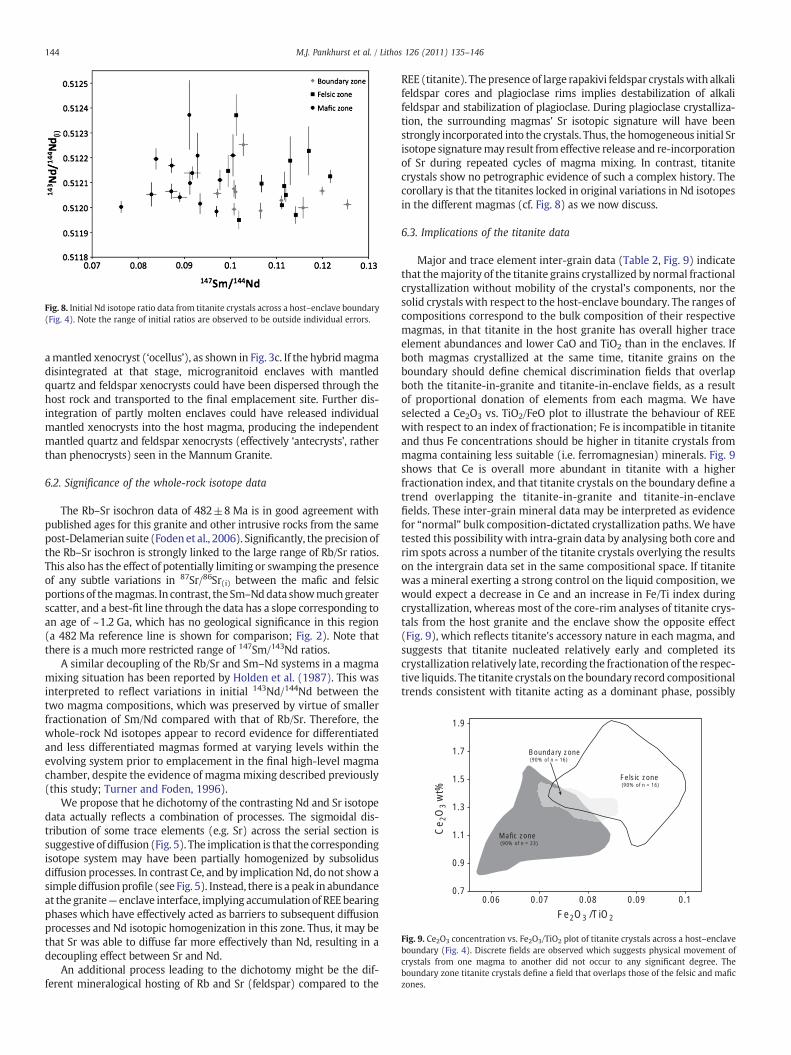
Fig. 9. Ce2O3 concentration vs. Fe2O3/TiO2 plot of titanite crystals across a host–enclaveboundary (Fig. 4). Discrete fields are observed which suggests physical movement ofcrystals from one magma to another did not occur to any significant degree. Theboundary zone titanite crystals define a field that overlaps those of the felsic and maficzones.
Fig. 8. Initial Nd isotope ratio data from titanite crystals across a host–enclave boundary(Fig. 4). Note the range of initial ratios are observed to be outside individual errors.
144 M.J. Pankhurst et al. / Lithos 126 (2011) 135–146
amantled xenocryst (‘ocellus’), as shown in Fig. 3c. If the hybridmagmadisintegrated at that stage, microgranitoid enclaves with mantledquartz and feldspar xenocrysts could have been dispersed through thehost rock and transported to the final emplacement site. Further dis-integration of partly molten enclaves could have released individualmantled xenocrysts into the host magma, producing the independentmantled quartz and feldspar xenocrysts (effectively ‘antecrysts’, ratherthan phenocrysts) seen in the Mannum Granite.
6.2. Significance of the whole-rock isotope data
The Rb–Sr isochron data of 482±8 Ma is in good agreement withpublished ages for this granite and other intrusive rocks from the samepost-Delamerian suite (Foden et al., 2006). Significantly, the precision ofthe Rb–Sr isochron is strongly linked to the large range of Rb/Sr ratios.This also has the effect of potentially limiting or swamping the presenceof any subtle variations in 87Sr/86Sr(i) between the mafic and felsicportions of themagmas. In contrast, the Sm–Nddata showmuchgreaterscatter, and a best-fit line through the data has a slope corresponding toan age of ~1.2 Ga, which has no geological significance in this region(a 482 Ma reference line is shown for comparison; Fig. 2). Note thatthere is a much more restricted range of 147Sm/143Nd ratios.
A similar decoupling of the Rb/Sr and Sm–Nd systems in a magmamixing situation has been reported by Holden et al. (1987). This wasinterpreted to reflect variations in initial 143Nd/144Nd between thetwo magma compositions, which was preserved by virtue of smallerfractionation of Sm/Nd compared with that of Rb/Sr. Therefore, thewhole-rock Nd isotopes appear to record evidence for differentiatedand less differentiated magmas formed at varying levels within theevolving system prior to emplacement in the final high-level magmachamber, despite the evidence of magmamixing described previously(this study; Turner and Foden, 1996).
We propose that he dichotomy of the contrasting Nd and Sr isotopedata actually reflects a combination of processes. The sigmoidal dis-tribution of some trace elements (e.g. Sr) across the serial section issuggestive of diffusion (Fig. 5). The implication is that the correspondingisotope system may have been partially homogenized by subsolidusdiffusion processes. In contrast Ce, and by implication Nd, do not show asimple diffusionprofile (see Fig. 5). Instead, there is a peak in abundanceat the granite— enclave interface, implying accumulation of REE bearingphases which have effectively acted as barriers to subsequent diffusionprocesses and Nd isotopic homogenization in this zone. Thus, it may bethat Sr was able to diffuse far more effectively than Nd, resulting in adecoupling effect between Sr and Nd.
An additional process leading to the dichotomy might be the dif-ferent mineralogical hosting of Rb and Sr (feldspar) compared to the
REE (titanite). The presence of large rapakivi feldspar crystalswith alkalifeldspar cores and plagioclase rims implies destabilization of alkalifeldspar and stabilization of plagioclase. During plagioclase crystalliza-tion, the surrounding magmas' Sr isotopic signature will have beenstrongly incorporated into the crystals. Thus, the homogeneous initial Srisotope signaturemay result fromeffective release and re-incorporationof Sr during repeated cycles of magma mixing. In contrast, titanitecrystals show no petrographic evidence of such a complex history. Thecorollary is that the titanites locked in original variations in Nd isotopesin the different magmas (cf. Fig. 8) as we now discuss.
6.3. Implications of the titanite data
Major and trace element inter-grain data (Table 2, Fig. 9) indicatethat themajority of the titanite grains crystallized by normal fractionalcrystallization without mobility of the crystal's components, nor thesolid crystals with respect to the host-enclave boundary. The ranges ofcompositions correspond to the bulk composition of their respectivemagmas, in that titanite in the host granite has overall higher traceelement abundances and lower CaO and TiO2 than in the enclaves. Ifboth magmas crystallized at the same time, titanite grains on theboundary should define chemical discrimination fields that overlapboth the titanite-in-granite and titanite-in-enclave fields, as a resultof proportional donation of elements from each magma. We haveselected a Ce2O3 vs. TiO2/FeO plot to illustrate the behaviour of REEwith respect to an index of fractionation; Fe is incompatible in titaniteand thus Fe concentrations should be higher in titanite crystals frommagma containing less suitable (i.e. ferromagnesian) minerals. Fig. 9shows that Ce is overall more abundant in titanite with a higherfractionation index, and that titanite crystals on the boundary define atrend overlapping the titanite-in-granite and titanite-in-enclavefields. These inter-grain mineral data may be interpreted as evidencefor “normal” bulk composition-dictated crystallization paths.We havetested this possibility with intra-grain data by analysing both core andrim spots across a number of the titanite crystals overlying the resultson the intergrain data set in the same compositional space. If titanitewas a mineral exerting a strong control on the liquid composition, wewould expect a decrease in Ce and an increase in Fe/Ti index duringcrystallization, whereas most of the core-rim analyses of titanite crys-tals from the host granite and the enclave show the opposite effect(Fig. 9), which reflects titanite's accessory nature in each magma, andsuggests that titanite nucleated relatively early and completed itscrystallization relatively late, recording the fractionation of the respec-tive liquids. The titanite crystals on the boundary record compositionaltrends consistent with titanite acting as a dominant phase, possibly
145M.J. Pankhurst et al. / Lithos 126 (2011) 135–146
representing evidence of very late titanite nucleation around theenclave-host boundary where the final liquid may have concentrated.Since the inter-grain data suggest the boundary titanite crystals in-teracted with both magmas, and the intra-grain data suggest theycrystallised late, an implication is that the residual liquids of bothmagmas were concentrated in the boundary area.
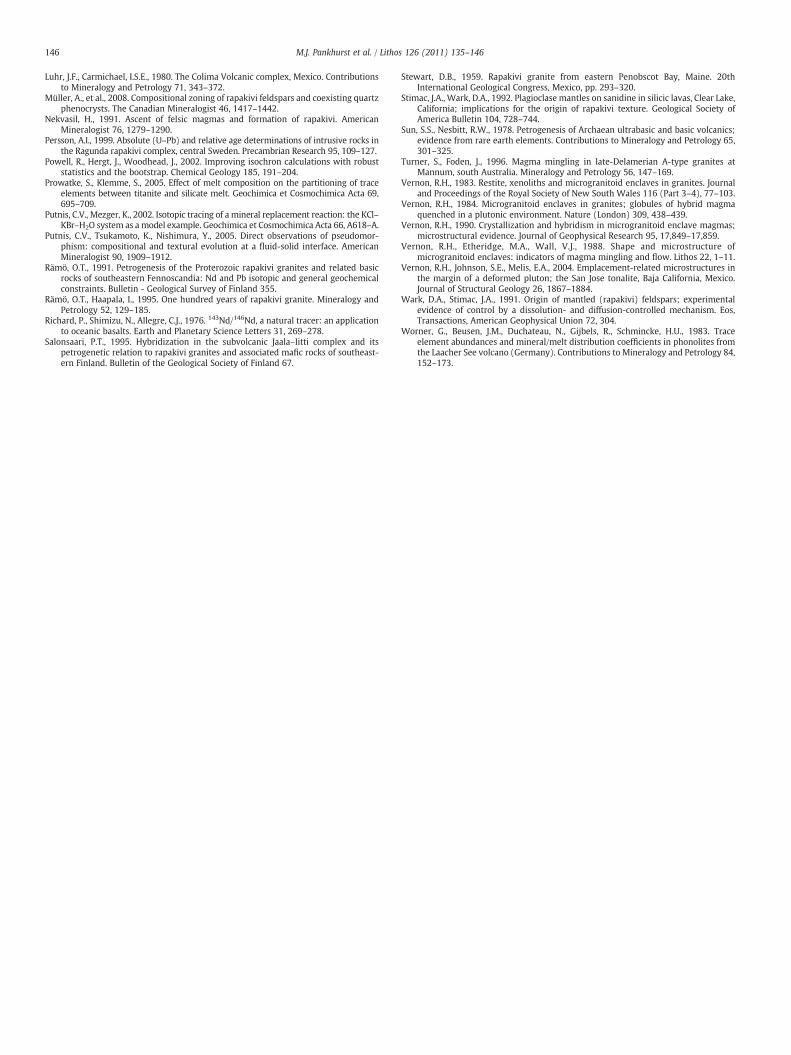
The key result is that these titanites record an analyticallysignificant range of initial Nd isotope ratios demonstrating that theremust have been more than one parental magma composition. This isinconsistent with the conclusion of Turner and Foden (1996) that boththe granite and enclaves evolved froma commonparent. Nevertheless,the titanites from both the granite and enclave zones record a similarrange of 143Nd/144Ndi values, which is difficult to explain by a simple,singlemixing scenario between two end-membermagmas of differentisotopic compositions. Moreover, there is no linear relationship be-tween the suite of samples (dykes, enclaves, granites, titanites) andthe local Kanmantoo Group wall rocks that would support a simplemodel in which variations in the isotope ratios resulted from assimi-lation of the country rock (Fig. 10). Rather, it would appear that thesuite of rocks reflect evolution from a range of parental magmas (andpresumably source regions) with variable isotopic composition.
7. Concluding remarks
TheMannumgranite shows abundant evidence formixing/minglingwithmore mafic magma. Rapakivi feldspars are common and are inter-preted to have formed due to magma mixing/mingling. Decoupling ofSr and Nd isotope systems in the Mannum Granite is inferred to haveoccurred through repeated instability-stability cycles of plagioclaseduring interaction with more mafic magmas. This mixing has served toequilibrate Sr isotope ratios such that the granite, enclaves and a seriallysectioned boundary all lie on a 482 Ma isochron. Ndhas not participatedin this interaction to the degree of Sr because itwas strongly partitionedinto titanite. This phase avoided dissolution in subsequent mixingevents. Accordingly, the Nd isotope system in the titanites preservesoriginal variations in the contributing magmas and records a signif-
1/Nd
Mafic zone
Felsic zoneBoundary zone
0.5124
0.5116
0.5120
1/Nd0.0002 0.0004 0.0006
dyke
Kanmantoo metasediments
chilledmargin
titanites
0.5124
0.5120
0.5115
0.01 0.02 0.03 0.04
143 N
d/14
4 Nd (
i)14
3 Nd/
144 N
d (i)
Fig. 10. Summary of Nd concentration and initial isotope ratios within the MannumGranite system (top; all data, bottom; titanite crystals only).
icant range of initial Nd isotope ratios. Thus, the in situ Nd isotope datawere critical to deriving an improved understanding of this system.Without them a reasonable interpretation would be that the felsic andmafic magmas represent derivatives from a common parental magma.Instead, these magmas must have evolved from a range of parentalmagmas followed by mingling before final emplacement.
Acknowledgements
We dedicate this contribution to the life of AllanWhite and his hugecontribution to the study of granites. We gratefully acknowledgeNorman Pearson, Kevin Grant, John Adam and Peter Wieland for theircontributions to the titanite standard construction and isotope analyses.Roger Powell calculated the Rb–Sr isochron age. Simon Turner wassupported by Australian Research Council Professorial Fellowship. Thiswork used instrumentation funded by ARC LIEF and DEST SystemicInfrastructure Grants, Macquarie University and Industry and is GEMOCpublication No. 755.
Appendix A. Supplementary data
Supplementary data to this article can be found online at doi:10.1016/j.lithos.2011.07.005.
References
Anderson, J.L., 1980. Mineral equilibria and crystallization conditions in the latePrecambrian Wolf River rapakivi massif, Wisconsin. American Journal of Science280, 289–332.
Anderson, J.L., 1983. Proterozoic anorogenic granite plutonism of North America.Memoir - Geological Society of America 161, 133–154.
Boyd, F.R., England, J.L., 1960. Apparatus for phase-equilibrium measurements atpressures up to 50 kilobars and temperatures up to 1750 °C. Journal of GeophysicalResearch 65, 741–748.
Calzia, J.P., Rämö, O.T., 2005. Miocene rapakivi granites in the southern Death Valleyregion, California, USA. Earth Science Reviews 73, 221–243.
Cherry, M.E., Trembath, L.T., 1978. The pressure quench formation of rapakivi texture.Contributions to Mineralogy and Petrology 68, 1–6.
Crock, J.G., Lichte, F.E., Wildeman, T.R., 1984. The group separation of the rare-earthelements and yttrium from geologic materials by cation-exchange chromatogra-phy. Chemical Geology 45, 149–163.
Dobnikar, M., Dolenec, T., Bellieni, G., 2002. Rapakivi texture in porphyritic dikes withinthe Karavanke granitic massif (Slovenia). Bulletin of the Geological Society ofFinland 74, 147–157.
Eklund, O., Shebanov, A.D., 1999. The origin of rapakivi texture by sub-isothermaldecompression. Precambrian Research 95, 129–146.
Eklund, O., Frojdo, S., Lindberg, B., 1994. Magma mixing, the petrogenetic link betweenanorthositic suites and rapakivi granites, Aland, SW Finland. Mineralogy andPetrology 50, 3–19.
Elburg, M.A., Bons, P.D., Foden, J., Brugger, J., 2003. A newly defined late Ordovicianmagmatic-thermal event in the Mt Painter Province, northern Flinders Ranges,South Australia. Australian Journal of Earth Sciences 50, 611–631.
Elders, W., 1968. Mantled feldspars and xenoliths in some Maine granites. GeologicalSociety of America Special Paper 61–62.
Emslie, R.F., 1985. Anorthosite massifs and the Precambrian crust. Geological Survey ofCanada Paper 85–8, 4.
Foden, J., Elburg, M.A., Dougherty-Page, J., Burtt, A., 2006. The timing and duration of thedelamerian orogeny: correlation with the ross orogen and implications forgondwana assembly. Journal of Geology 114, 189–210.
Haapala, I., 1985. Metallogeny of the Proterozoic rapakivi granites of Finland. In: Taylor,R.P., Strong, D.F. (Eds.), Granite-related mineral deposits; geology, petrogenesisand tectonic setting; extended abstracts of papers presented at the CIM conference.CIM Geol. Div., Halifax, NS, Canada, pp. 123–131.
Haapala, I., Rämö, O.T., 1999. Rapakivi granites and related rocks; an introduction.Precambrian Research 95, 1–7.
Hibbard, M.J., 1981. The magma mixing origin of mantled feldspars. Contributions toMineralogy and Petrology 76, 158–170.
Hogan, J.P., Gilbert, M.C., Price, J.D., 2000. Crystallisation of fine- and coarse-grainedA-type granite sheets of the Southern Oklahoma Aulacogen, U.S.A. Transactions ofthe Royal Society of Edinburgh Earth Sciences 91 (Parts 1–2), 139–150.
Holden, P., Halliday, A.N., Stephens, W.E., 1987. Neodymium and strontium isotopecontent of microdiorite enclaves points to mantle input to granitoid production.Nature 330, 53–56.
Holden, P., Halliday, A.N., Stephens, W.E., Henney, P.J., 1991. Chemical and isotopicevidence for major mass-transfer between mafic enclaves and felsic magma.Chemical Geology 92, 135–152.
Lowell, G.R., Young, G.J., 1999. Interaction between coeval mafic and felsic melts in theSt. Francois Terrane of Missouri, USA. Precambrian Research 95, 69–88.
146 M.J. Pankhurst et al. / Lithos 126 (2011) 135–146
Luhr, J.F., Carmichael, I.S.E., 1980. The Colima Volcanic complex, Mexico. Contributionsto Mineralogy and Petrology 71, 343–372.
Müller, A., et al., 2008. Compositional zoning of rapakivi feldspars and coexisting quartzphenocrysts. The Canadian Mineralogist 46, 1417–1442.
Nekvasil, H., 1991. Ascent of felsic magmas and formation of rapakivi. AmericanMineralogist 76, 1279–1290.
Persson, A.I., 1999. Absolute (U–Pb) and relative age determinations of intrusive rocks inthe Ragunda rapakivi complex, central Sweden. Precambrian Research 95, 109–127.
Powell, R., Hergt, J., Woodhead, J., 2002. Improving isochron calculations with robuststatistics and the bootstrap. Chemical Geology 185, 191–204.
Prowatke, S., Klemme, S., 2005. Effect of melt composition on the partitioning of traceelements between titanite and silicate melt. Geochimica et Cosmochimica Acta 69,695–709.
Putnis, C.V., Mezger, K., 2002. Isotopic tracing of a mineral replacement reaction: the KCl–KBr–H2O system as a model example. Geochimica et Cosmochimica Acta 66, A618–A.
Putnis, C.V., Tsukamoto, K., Nishimura, Y., 2005. Direct observations of pseudomor-phism: compositional and textural evolution at a fluid-solid interface. AmericanMineralogist 90, 1909–1912.
Rämö, O.T., 1991. Petrogenesis of the Proterozoic rapakivi granites and related basicrocks of southeastern Fennoscandia: Nd and Pb isotopic and general geochemicalconstraints. Bulletin - Geological Survey of Finland 355.
Rämö, O.T., Haapala, I., 1995. One hundred years of rapakivi granite. Mineralogy andPetrology 52, 129–185.
Richard, P., Shimizu, N., Allegre, C.J., 1976. 143Nd/146Nd, a natural tracer: an applicationto oceanic basalts. Earth and Planetary Science Letters 31, 269–278.
Salonsaari, P.T., 1995. Hybridization in the subvolcanic Jaala–Iitti complex and itspetrogenetic relation to rapakivi granites and associated mafic rocks of southeast-ern Finland. Bulletin of the Geological Society of Finland 67.
Stewart, D.B., 1959. Rapakivi granite from eastern Penobscot Bay, Maine. 20thInternational Geological Congress, Mexico, pp. 293–320.
Stimac, J.A., Wark, D.A., 1992. Plagioclase mantles on sanidine in silicic lavas, Clear Lake,California; implications for the origin of rapakivi texture. Geological Society ofAmerica Bulletin 104, 728–744.
Sun, S.S., Nesbitt, R.W., 1978. Petrogenesis of Archaean ultrabasic and basic volcanics;evidence from rare earth elements. Contributions to Mineralogy and Petrology 65,301–325.
Turner, S., Foden, J., 1996. Magma mingling in late-Delamerian A-type granites atMannum, south Australia. Mineralogy and Petrology 56, 147–169.
Vernon, R.H., 1983. Restite, xenoliths and microgranitoid enclaves in granites. Journaland Proceedings of the Royal Society of New South Wales 116 (Part 3–4), 77–103.
Vernon, R.H., 1984. Microgranitoid enclaves in granites; globules of hybrid magmaquenched in a plutonic environment. Nature (London) 309, 438–439.
Vernon, R.H., 1990. Crystallization and hybridism in microgranitoid enclave magmas;microstructural evidence. Journal of Geophysical Research 95, 17,849–17,859.
Vernon, R.H., Etheridge, M.A., Wall, V.J., 1988. Shape and microstructure ofmicrogranitoid enclaves: indicators of magma mingling and flow. Lithos 22, 1–11.
Vernon, R.H., Johnson, S.E., Melis, E.A., 2004. Emplacement-related microstructures inthe margin of a deformed pluton; the San Jose tonalite, Baja California, Mexico.Journal of Structural Geology 26, 1867–1884.
Wark, D.A., Stimac, J.A., 1991. Origin of mantled (rapakivi) feldspars; experimentalevidence of control by a dissolution- and diffusion-controlled mechanism. Eos,Transactions, American Geophysical Union 72, 304.
Worner, G., Beusen, J.M., Duchateau, N., Gijbels, R., Schmincke, H.U., 1983. Traceelement abundances and mineral/melt distribution coefficients in phonolites fromthe Laacher See volcano (Germany). Contributions to Mineralogy and Petrology 84,152–173.