continuous on-line beat-to-beat analysis of av conduction time
TRANSCRIPT
Continuous On-Line Beat-to-Beat Analysis of AVConduction Time
MENASHE B. WAXMAN, ROBERT W. WALD. RICHARD McGILLIVRAY.DOUGLAS A. CAMERON, ARJUN D. SHARMA, and FELIX HUERTAFrom the Department of Medicine of the University of Toronto and the Division of Cardiologyof the Toronto General Hospital, Toronto, Canada
WAXMAN, M.B., ET AL.: Continuous on-Zine beat-to-beat analysis of AV conductiontime. A simple analog circuit is described which is capabie of measuring on a beat-lo-beat basis P-fl, R-P, P-P, and R-R inlervais during sinus rhythm and paroxysmalsupraventricuiar tachycardia. In addition the circuit wiJJ emit a puise when the con-secutively alternating P and R wave sequence is interrupted thereby signaiiing atrigger problem or a change in rhythm. The operation of the device requires proper Pand R wave sensing and provides outputs which are linear over a range of rateswhich are applicable to the human heart. (PACE, Vol. 4, May-June, 1981}
AV node, conduction intervals
Beat-to-beat interval measurements are centralto the description and analysis of the conduc-tion behavior of cardiac structures, such as theAV node, under a variety of physiologic condi-tions and in the setting of rhythm disturbancesinvolving these structures. Among the multifac-toral influences which determine antegrade AVnodal conduction time (P-R interval] the dual in-fluence of the antecedent P-P and R-P intervalsis paramount.'-^ Because their influence is ex-erted on a beat-to-beat basis, any analysis oftheir effect on the P-R interval has to be basedupon a beat-to-beat sampling of this interval aswell as of the P-P and R-P intervals. In this re-port we describe a simple analog circuit capa-ble of generating on-line beat-to-beat measure-ments of P-R, R-P, P-P, and R-R intervals.
Supported in part by grants-in-aid from the Ontario andCanadian Heart Foundations.
Address for reprints; Menashe B. Waxman, M.D., Cardio-vascular Unit, Toronto General Hospital, 101 College Street.Toronto. Ontario. Canada. M5G 1L7
Submitted Aug. 8, 1980; revised Oct. 24, 1980; accepted Dec.30, 1980
Input Trigger Signals
A standard surface ECG lead was used as theR wave trigger source and an atrial electrogramrecorded from a right atrial electrode was usedas the P wave trigger source. The atrial electro-gram was recorded as a bipolar signal from anelectrode catheter with 2 mm electrode spacing.The ECG iead and atrial electrogram chosenwere such that the R wave and P wave, respec-tively, had the largest waveform amplitude. Alsoeach waveform amplitude was dominant in apositive or negative sense. The surface ECG wasamplified 1,000-fold and low and high passfilters were set at 15 and 100 Hz, respectively.The atrial electrogram was amplified 250 - 1,000-fold and low and high pass filters were set at 15and 300 Hz, respectively. These signals wereconditioned by standard amplifiers (Hewlett-Packard* Model 8811A) and led separately intotwo rate amplifiers (Hewlett-Packard Model8812A). The rate amplifier automatically trig-
*Hewlett-Packard. Ontario, Canada
262 May-June 1981 PACE. Vol. 4
CONTINUOUS ON-LINE BEAT-TO-BEAT ANALYSIS OF AV CONDUCTION TIME
gers on the largest signal of either polarity andone of these amplifiers provided a square wavecoincident with R wave triggering and the otheramplifier provided a square wave coincidentwith P wave triggering. The level detector andcalibrating oscillator portion of these rate am-plifiers was tapped at point number 34 where apositive square wave of 12 volts and 170 ms dura-tion is available. The duration of this pulse of170 ms acts as a refractory period which pre-vents double triggering of the amplifier withinthis time period. The square wave pulses wereused as the inputs to the interval circuit de-scribed below. The rate amplifier [8812A) alsoprovided a display of beat-to-beat heart rate.The location of the atriai sensing electrodecatheter was chosen so that the atriai electro-gram amplitude was at least twice as large as theaccompanying ventricular electrogram. Carewas taken to ensure that each rate amplifier trig-gered only on an R wave or P wave. High speedoscilloscope measurements verified that the trig-ger point of both R and P waves was constant towithin ± 2% over a cycle length range of 250-1400 ms.
Design Considerations
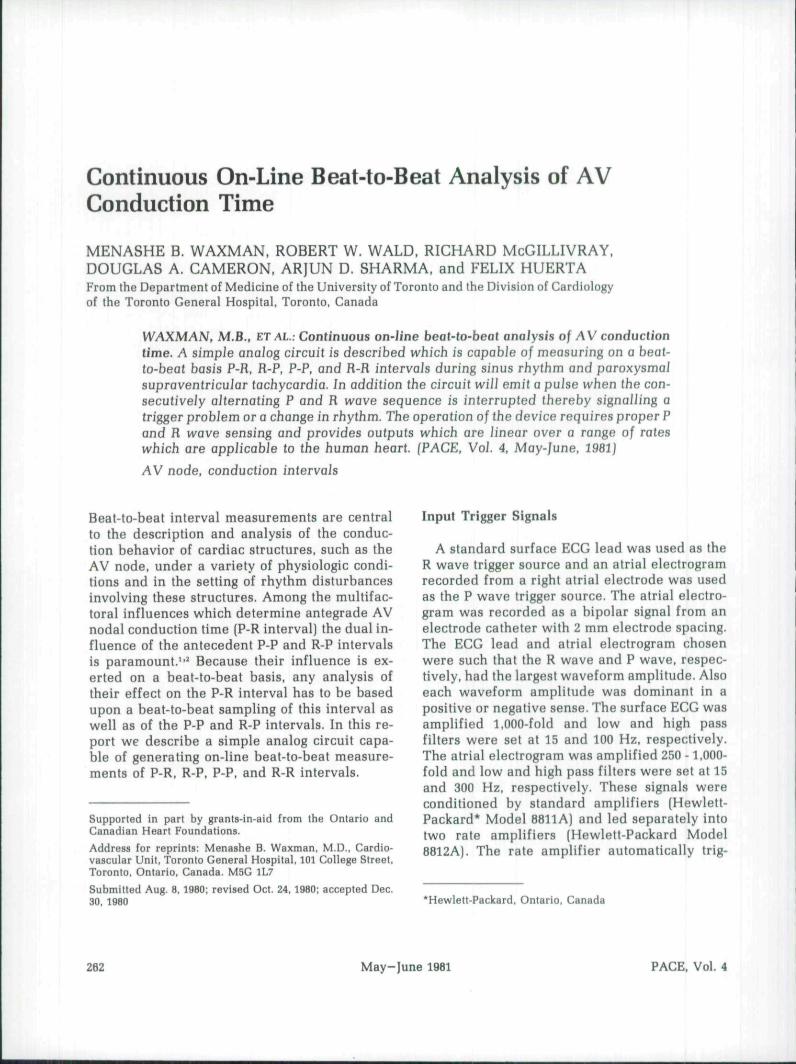
The circuit was designed to accept squarewave input pulses which range in amplitudefrom 1-15 volts and one millisecond or longer induration. Four analog outputs linearly propor-tional to the P-R interval, R-P interval, R-R in-terval, and P-P interval are provided. Further-more, when an R wave is followed by another Rwave without an interposed P wave, or a P waveis followed by a P wave with no intervening Rwave, the circuits responsible for the R-P and P-R outputs should not be updated, but the timingintegrator for that section should be reset. In ad-dition, an output was required to indicate a miss-ing P or a missing R wave. Circuit configura-tions implementing these considerations are out-lined in Figures 1 and 2.
The timing integrators employed to measurethe ahove intervals are configured around IC5 inFigure 1 (R-P and P-R intervals), IC 7 in Figure 2a(R-R interval) and IC9 in Figure 2b (P-P inter-val]. The timing components R25C13. R27C16,
and R28C17 may be selected based on the fol-lowing expression:
RC - V D tmax/Vo I Iwhere R is the resistor value, C is the capacitorvalue, V Q is the voltage across the diode D6, VQis the desired output voltage of the integrator at t= tmax. and tmax is the longest duration ex-pected for the intervals of interest. Thus, the out-put voltage range of the integrators can be ad-justed by selecting appropriate values of R andC, and in this way any particular time intervalcan be represented by a desired voltage level.
Circuit Operation
The circuit description is divided into threesections: 1. the measurement of the R-P and P-Rin situations where P and R events occur in acontinuously alternating sequence; 2. the R-Rand P-P interval measurement circuit, and 3. theresponse of the R-P and P-R circuit to situationswhere R and P do not consistently follow eachother.
R-P and P-R Timing Circuit for Aiternating TimeSequences of P and R Events. (Figure 1)
To set the initial conditions for the descrip-tion which follows assume that a P wave detec-tion pulse was the last input to the circuit. The Pwave pulse has reset the flip-flop Ul and the in-tegrator IC5, and the sample and hold device IC4has acquired a new value proportional to the lastR-P interval. The circuit is now waiting for an Rwave detection pulse. When the expected pulseoccurs it will be applied to the set input of Uland will result in a positive going transition atthe Q output. This transition will initiate twoconsecutive pulses being produced by U2, U3,and U6. The first of these pulses will appear atthe output of U3 and will be gated through U4 tothe sample control of IC3. Thus, the device IC3will sample and hold the output voltage of theintegrator which will be proportional to the P-Rinterval. The second pulse, at the output of U6,will be used to reset the integrator via thetransistor Ql. The integrator, IC5. will now inte-grate over the subsequent R-P interval. The cir-
PACE, Voi. 4 May-June 1981 263
WAXMAN, ET AL.
•V - 15V-V = -15V
Figure 1. Circuit diagram of P-H and R-P intervai timer. Resistors: Rl. R2, R4, R6, R7. R9. RIO,RII = 20Kfi. R32, R16, RI7, R38, R20 = 100 KQ; R3.R8 = 390KQ; R13 = 680 Kfi; R34, R15, RI6= 4.7KQ: R23 = 47 KQ; R22 = 5.6KQ: R24. R25 = WKQ; R26 see text. Capacitors; CI, C2, C4,C7, C9 = .01 M F; C5 = 390 pF; C8, ClO = .001/i F; C l l , C12 = O.I^ F {mylar}; C13 see text(mylar). Transistors; Ql = 2N3904; Q2 = 2N3904: Q2 = 2N5457. Diodes: Dl, D2, D3, D4. D5, D6.Dll = 1N914; Operationoi Ampiifiers: ICl. 1C2, IC5 = TL0S2C; IC3, IC4 = LF 398H. DigitalDevices: Ul, U9, UIO = CD4027: Vll. V12, U13. V14, V15. U16 = CD4584; U2. V3. V6 =CD4013; U4, U5. U7, U8 = CD4081.
cuit will now be waiting for a P wave detectionpulse. When this pulse arrives it will be appliedto the reset input of Ul and once again willresult in the two consecutive pulses as men-tioned above. In this case, however, the pulse atthe output of U3 will be directed by U5 to thesample control of IC4 which will sample andhold the voltage proportional to the R-P inter-val. The second pulse once again is used to resetthe integrator. Thus the sample and hold IC3 isupdated for each P-R interval and the sampleand hold IC4 is updated for each R-P interval.
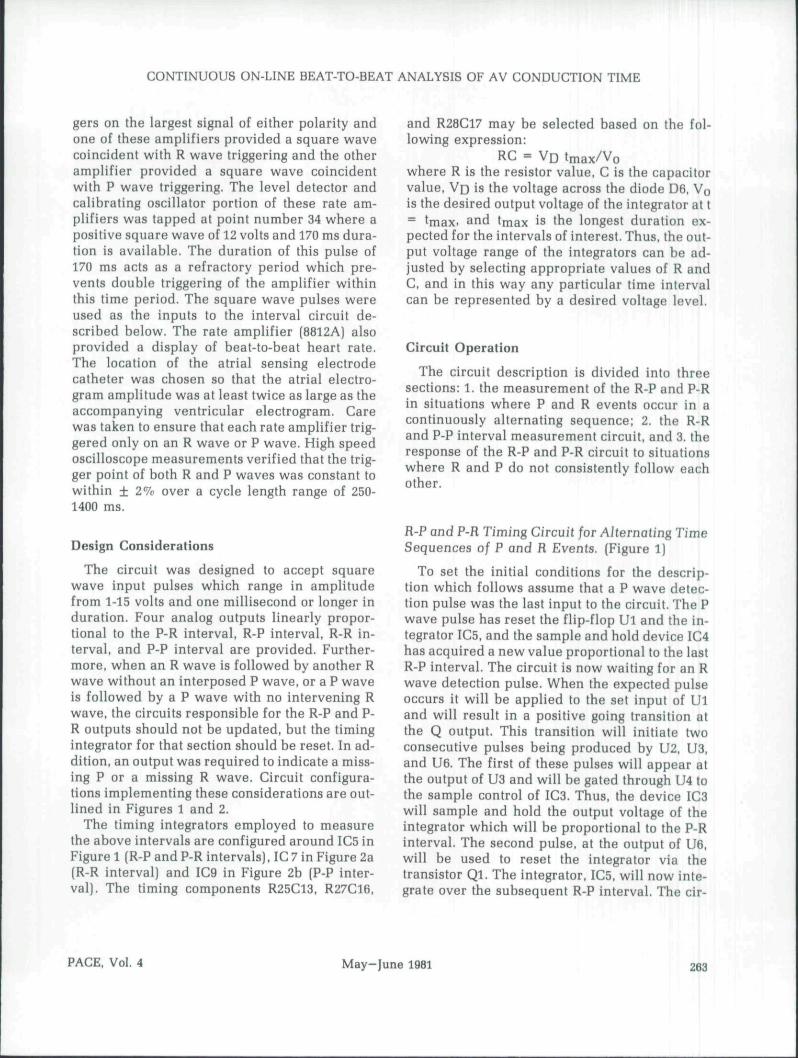
Measurement of R-R and P-P intervaJs (Figure 1,2a and h)
The configuration in Figure 2a consisting ofU17, U18, U19, IC6, and IC7 is used to measurethe R-R interval. An R wave detection pulse ar-riving at the input of ICl (Figure 1) results in theproduction of two consecutive pulses by the de-vices U17, U18, and U19. The first of these twopulses, appearing at the output of U18, is appliedto the sample control of the sample and holddevice IC6 which then samples the voltage at the
264 May-June 1981 PACE, Vol. 4
CONTINUOUS ON-LINE BEAT-TO-BEAT ANALYSIS OF AV CONDUCTION TIME
from B._fig1
D7
missingPwave
Figure 2. Circuit diagrams for a. R-R interval timer, b. P-F intervaJ timer, and c. missingpuJse indicator. Resistors: R21, R39, R40, R43. R44. R46, R47, R48. R49, R50. R51, R51 = 100 Kfi;R41, R42 = 680 Kfi; R3I, R32 = 4.7KU: H33, R34 = 47Kfi; R37, R3B = 5.6KU: R29, R30, R45 =10 Km R27, R28 see text; R53, R54 = WKQ (trim pot], Capacitors: C20, C21 = 390 pF; C6, C18,C19 = 600 pF; C14, C15 = O.l^F (mylar); C16, C17 see text fmyJarJ; C22, C23 = 0.2^. Transis-tors: Q3, Q4, Q5, Q6 = 2N3904. Diodes: D7, D8, D9, DlO, D12, D12 = 1N914. Operation Ampli-fiers: /C7, IC9, lClO = TL082C. IC6, IC8 = IF398H. Digital Devices; U17. U18. UW, U20, U21.U22, U23, V24 = CD4011.
output of IC7. This voltage is proportional to thelast R-R interval which has heen measured. Thesecond pulse, at the output of U19, is used to re-set the timing integrator, via transistor Q3, which
then starts measuring the subsequent R-R inter-vals.
The circuit in Figure 2b used to measure the P-P interval is configured around U20, U21, and
PACE. Vol. 4 May-Iune 1981 265
WAXMAN. ET AL.
U22 in conjunction with IC8 and IC9 andoperates in an identical manner to the R-R timer.
R-P and P-R Timing Circuit Operation duringOccurrence of Two Consecutive R or P Events(Figures 1 and 2C]
When the continuous alternating sequence ofP and R waves is interrupted such as could occurif one of the signals was not sensed or a rhythmchange such as AV block occurred, an outputfrom the circuit is provided.
Under the condition of an R triggered pulsebeing the last input to the circuit, this pulse hasset Ul and has also set UlO after a delay pro-vided by U14, U15. and U16. This delay is neces-sary in order to prevent the immediate reset ofthe integrator by the pulse being gated throughU8. Since the Q output of UlO is now at a logic" 1 " level, the gate U8 is enabled. Consequently,if a second R triggered pulse appears at the in-put of ICl, it cannot change the state of Ul andno pulses will be produced by U2, U3, and U6.Thus, neither of the sample-and-hold devicesare updated, and the integrator is immediatelyreset by the pulse at the output of U8 being ap-plied to Ql. Similar responses are generated inthe case of a P-P sequence by the devices U7, U9,Ull. U12, and U13. Thus, whenever two consec-utive R triggered pulses or two consecutive Ptriggered pulses are presented to the respectiveinputs, the integrator is reset and the analog out-puts hold their previous values. An indicationthat such consecutive R or P waves have beendetected is provided by the circuit illustrated inFigure 2c. Whenever there is a continuous alter-nating sequence of P waves and R waves there isno output from this portion of the circuit. Theamplitudes of the pulses may be changed by theadjustment of R53 and R54. The duration ofthese pulses may be adjusted by selecting timingcomponent values based on the relationship:
t = 0.69 RCwhere C is the value of C22 or C23, and R is thevalue of R46 or R47, respectively.
Results
The results will be described under threeheadings: bench testing, clinical testing during
normal sinus rhythm, and clinical testing duringparoxysmal supraventricular tachycardia.
Bench Testing
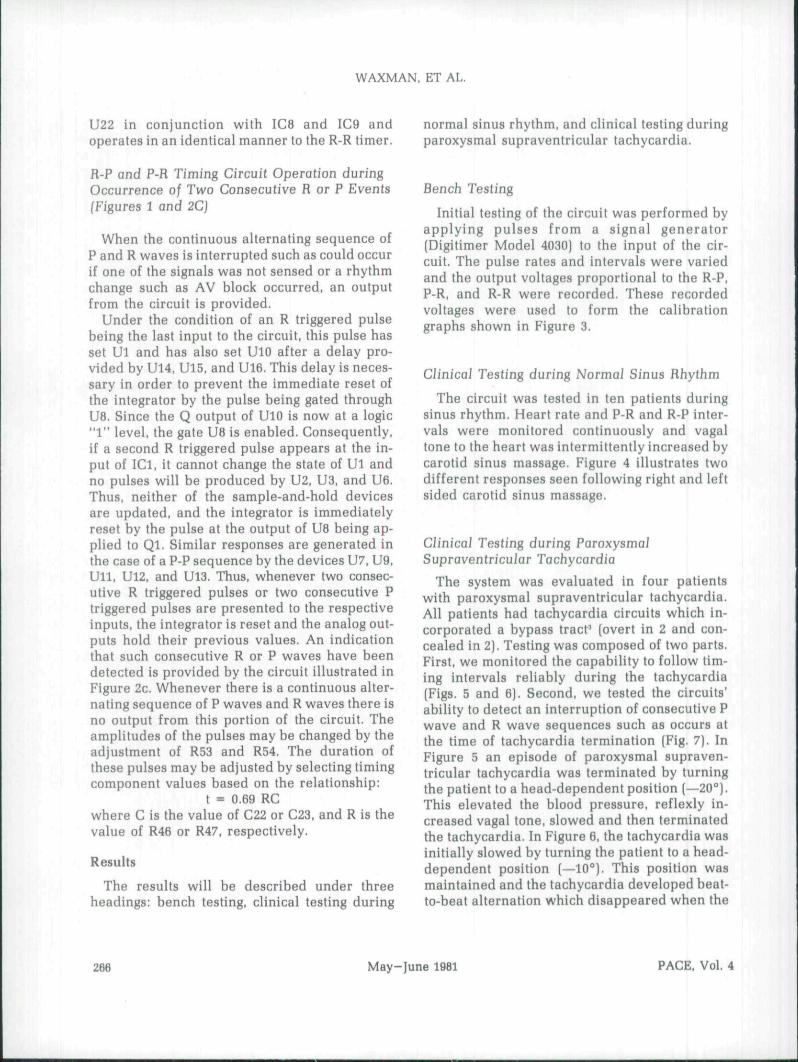
Initial testing of the circuit was performed byapplying pulses from a signal generator(Digitimer Model 4030) to the input of the cir-cuit. The pulse rates and intervals were variedand the output voltages proportional to the R-P.P-R, and R-R were recorded. These recordedvoltages were used to form the calibrationgraphs shown in Figure 3.
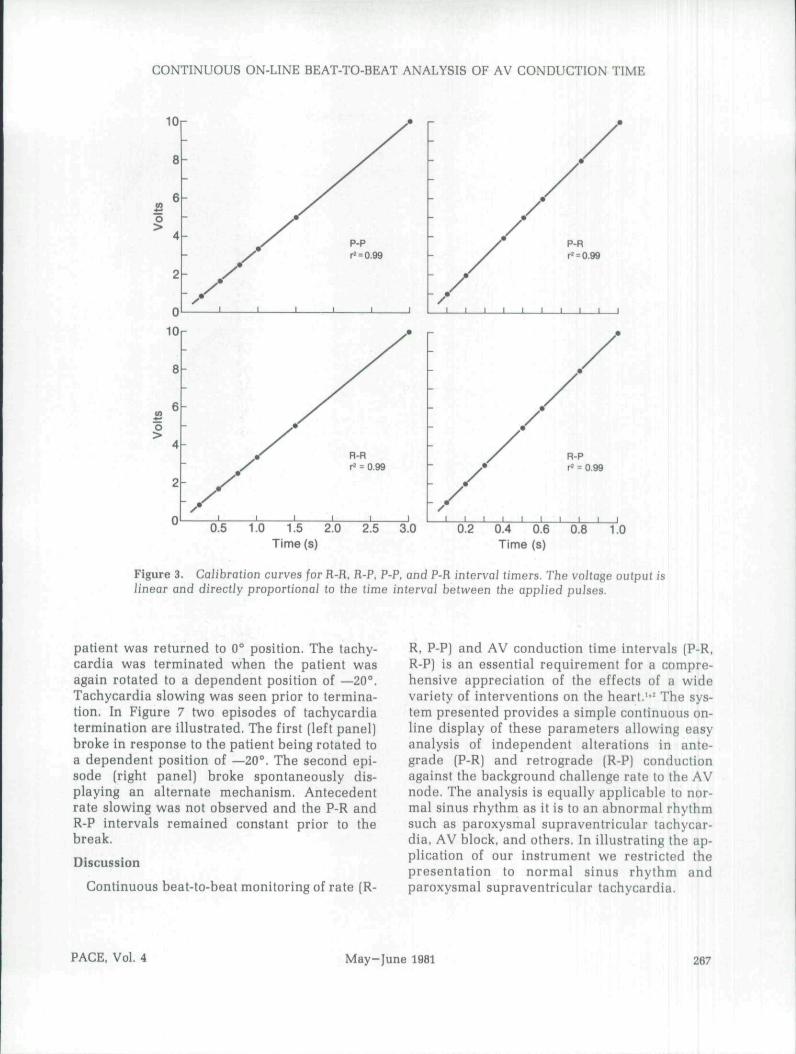
CJinicaJ Testing during Normai Sinus Rhythm
The circuit was tested in ten patients duringsinus rhythm. Heart rate and P-R and R-P inter-vals were monitored continuously and vagaltone to the heart was intermittently increased bycarotid sinus massage. Figure 4 illustrates twodifferent responses seen following right and leftsided carotid sinus massage.
CJinicaJ Testing during ParoxysmaJSupraventricuiar Tachycardia
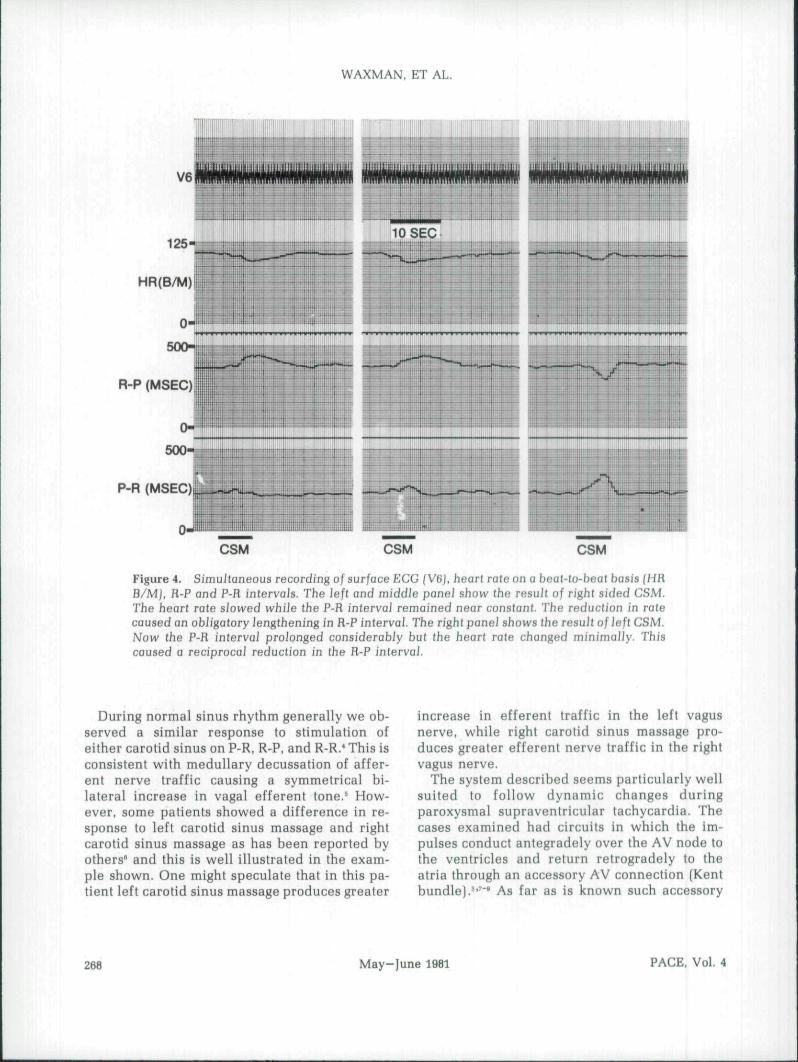
The system was evaluated in four patientswith paroxysmal supraventricular tachycardia.All patients had tachycardia circuits which in-corporated a bypass tract' (overt in 2 and con-cealed in 2). Testing was composed of two parts.First, we monitored the capability to follow tim-ing intervals reliably during the tachycardia(Figs. 5 and 6). Second, we tested the circuits'ability to detect an interruption of consecutive Pwave and R wave sequences such as occurs atthe time of tachycardia termination (Fig. 7). InFigure 5 an episode of paroxysmal supraven-tricular tachycardia was terminated by turningthe patient to a head-dependent position (—20").This elevated the blood pressure, reflexly in-creased vagal tone, slowed and then terminatedthe tachycardia. In Figure 6, the tachycardia wasinitially slowed by turning the patient to a head-dependent position (—10"). This position wasmaintained and the tachycardia developed beat-to-beat alternation which disappeared when the
268 May-June 1981 PACE, Vol. 4
CONTINUOUS ON-LINE BEAT-TO-BEAT ANALYSIS OF AV CONDUCTION TIME
0.5 1.0 1.5 2.0 2.5 3.0Time(s)
0.2 0.4 0.6 0.8 1.0Time (s)
Figure 3. Calibration curves for R-R, R-P, P-P, and P-R interval timers. The vo/tage output islinear and directly proportiona] to the time interval between the applied pulses.
patient was returned to 0" position. The tachy-cardia was terminated when the patient wasagain rotated to a dependent position of —20".Tachycardia slowing was seen prior to termina-tion. In Figure 7 two episodes of tachycardiatermination are illustrated. The first (left panel)broke in response to the patient being rotated toa dependent position of —20*". The second epi-sode (right panel) broke spontaneously dis-playing an alternate mechanism. Antecedentrate slowing was not observed and the P-R andR-P intervals remained constant prior to thebreak.
Discussion
Continuous beat-to-beat monitoring of rate (R-
R, P-P] and AV conduction time intervals (P-R,R-P) is an essential requirement for a compre-hensive appreciation of the effects of a widevariety of interventions on the heart.''' The sys-tem presented provides a simple continuous on-line display of these parameters allowing easyanalysis of independent alterations in ante-grade (P-R) and retrograde (R-P) conductionagainst the background challenge rate to the AVnode. The analysis is equally applicable to nor-mal sinus rhythm as it is to an abnormal rhythmsuch as paroxysmal supraventricular tachycar-dia, AV block, and others. In illustrating the ap-plication of our instrument we restricted thepresentation to normal sinus rhythm andparoxysmal supraventricular tachycardia.
PACE, Vol. 4 May-June 1981 267
WAXMAN, ET AL.
125-10 SEC
0-
500-
R-P (MSEC)
0-
500-
P-R (MSEC), •t-Su.*^, ,hHh. .r
0-ii
CSM CSM GSM
Figure 4. SimuJtaneous recording of surface ECG (V6), heart rate on a beat-Io-beat basis (HRB/M), R-P and P-R intervals. The left and middle panel show the resull of right sided CSM,The heart rate sJowed whiie the P-R intervai remained near coasfanf. The reduction in ratecaused an obiigatory lengthening in H-P interval. The right panel shows the result of Jeft CSM.Now the P-R interval proionged considerably but the heart rate changed minimally. Thiscaused a reciprocaJ reduction in the R-P interval. ,
During normal sinus rhythm generally we ob-served a similar response to stimulation ofeither carotid sinus on P-R, R-P, and R-R.* This isconsistent with medullary decussation of affer-ent nerve traffic causing a symmetrical bi-lateral increase in vagal efferent tone.^ How-ever, some patients showed a difference in re-sponse to left carotid sinus massage and rightcarotid sinus massage as has been reported byothers' and this is well illustrated in the exam-ple shown. One might speculate that in this pa-tient left carotid sinus massage produces greater
increase in efferent traffic in the left vagusnerve, while right carotid sinus massage pro-duces greater efferent nerve traffic in the rightvagus nerve.
The system described seems particularly wellsuited to follow dynamic changes duringparoxysmal supraventricular tachycardia. Thecases examined had circuits in which the im-pulses conduct antegradely over the AV node tothe ventricles and return retrogradely to theatria through an accessory AV connection (Kent
-'"̂ As far as is known such accessory
268 May-June 1981 PACE, Vol 4
CONTINUOUS ON-LINE BEAT-TO-BEAT ANALYSIS OF AV CONDUCTION TIME
BAEi
0" TO -20°
Figure 5. Simu/taneous recording from above downward of a bipo/ar right atrial electro-gram (BAE), ECG lead VI, P-R intervai, R-P interval, P-P intervai. R-R intervai, heart rate fHRB/Mj, and biood pressure in a patient during an episode of paroxysmal supraventricuiartachycardia. All measurements are on a beat-to-beat basis. At the arrow the bed was rotatedfrom 0° to a dependent position of -20°. This caused the biood pressure to rise and (he tachy-cardia slowed from 220 to 145 beats/min and terminated. The siowing was expressed as P-Pand R-R proiongation from 270 to 410 ms. The siowing was exciusiveiy traceabie to P-R inter-val proJongation from 120 to 260 ms while the R-P interval did not change untiJ the tachycar-dia broke.
PACE. Vol. 4 May-June 1981 269
WAXMAN. ET AL.
0" TO -10" -IO" TO 0° U" 10-20°
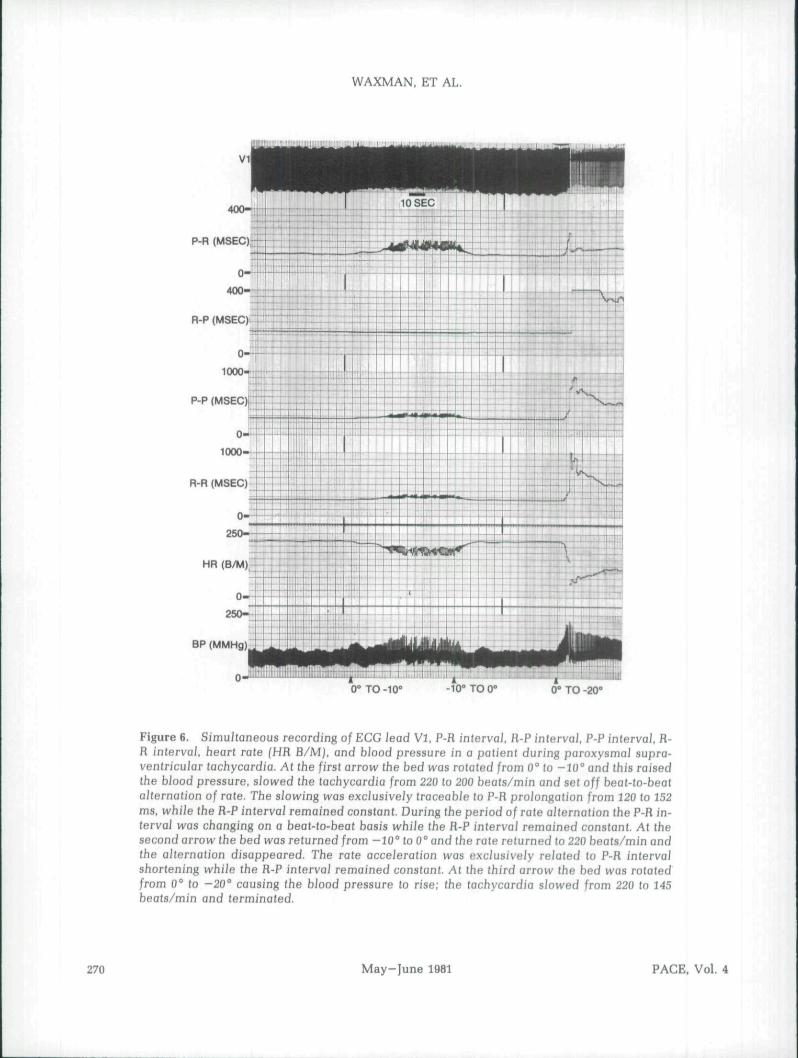
Figure 6. Simultaneous recording of EGG lead VI. P-R intervai, R-P interval. P-P interval. R-R intervai, heart rate (HR B/M), and blood pressure in a patient during paroxysmai supra-ventricular tachycardia. At tiie first arrow the bed was rototed from 0° to -10° and this raisedthe blood pressure, slowed the tachycardia from 220 lo 200 bea!s/min and set off beat-to-beatalternation of rate. The slowing was excJusively traceable to P-R prolongation from 120 to 152ms, while ihe R-P interval remained constant. During the period of rate alternation the P-R in-terval was changing on a beat-to-beat basis while the R-P interval remained con9tanl. At Ihesecond arrow the bed was returned from -10° to 0° and Ihe rate returned to 220 beats/min andthe alternation disappeared. The rate acceleration was exclusively related to P-R inlerva]shortening while the R-P interval remained constant. At the third arrow the bed was rotatedfrom 0° to -20" causing the hlood pressure to rise; the tachycardia slowed from 220 to 145beats/min and terminated,
270 May-June 1981 PACE, Vol, 4
CONTINUOUS ON-LINE BEAT-TO-BEAT ANALYSIS OF AV CONDUCTION TIME
BAE
0" TO -20
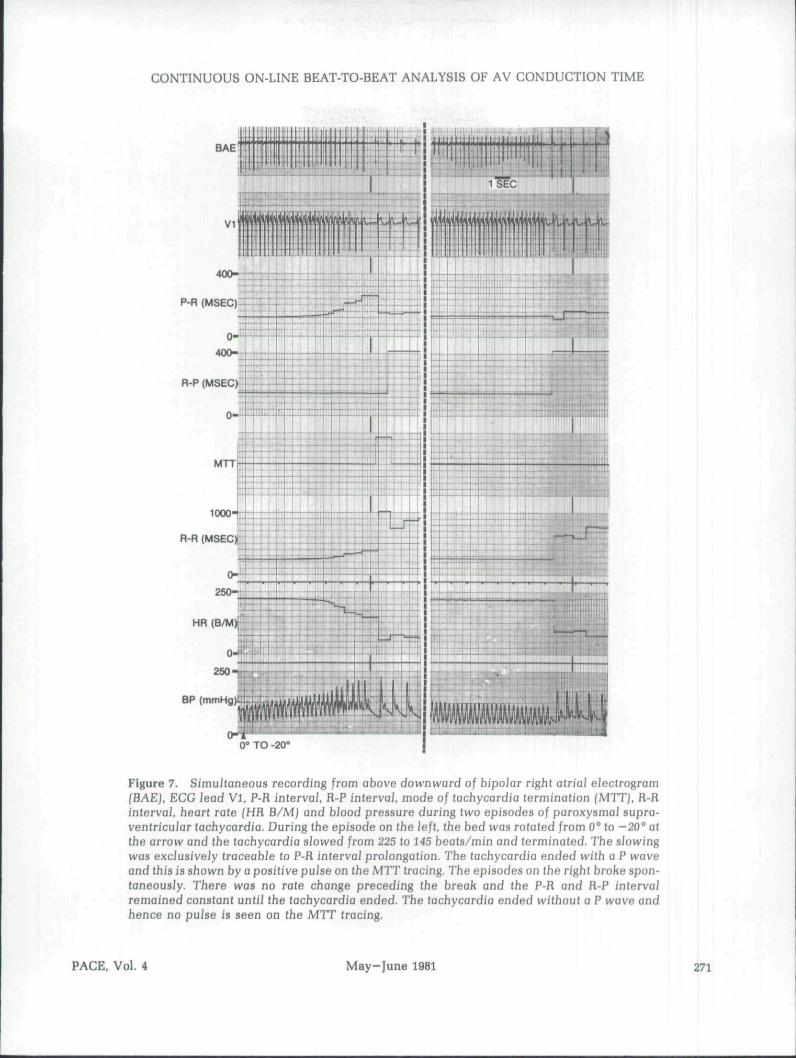
Figure 7. SimuJtaneous recording from above downward of bipolar right atriaJ eiectrogram{BAE}. ECG lead VI, P-R interval R-P interval, mode of tachycardia termination (MTTJ, R-Rinterval, heart rale (HR B/M] and blood pressure during two episodes of paroxysmal supra-ventricuiar tachycardia. During the episode on !he left, the bed was rotated from 0° to -20° atthe arrow and the tachycardia slowed from 225 to 145 beats/min and terminated. The slowingwas exciusiveiy traceabie to P-fl intervai proiongation. The tachycardia ended with a P waveand this is shown by a positive puJse on the MTT tracing. The episodes on the right broke spon-taneousJy, There was no rate change preceding (he break and the P-R and R-P intervalremained constant untii the tachycardia ended. The tachycardia ended without a P wave andhence no puise is seen on the MTT tracing.
PACE. Vol. 4 May-June 1981 271
WAXMAN, ET AL.
connections are insensitive to increases in vagaltone'" while AV nodal conduction is influencedby vagal tone."''^ During the tachycardia the P-Rand R-P intervals monitor antegrade conductionover the AV node and retrograde conductionover the bypass tract, respectively.
Placing the patients in a dependent positionelevated the blood pressure and this reflexly in-creased vagal tone."''* This produced tachycar-dia slowing which was exclusively traceable toAV nodal conduction time (P-R interval) pro-longation. Bypass tract conduction time(reflected by the R-P interval) showed nochange confirming the fact that vagal tone doesnot influence this region of the heart. Whenbeat-to-beat alternation in the tachycardia ratedeveloped during a period of slowing, again thisvariation was exclusively related to AV nodalconduction time alternation. The bypass tractconduction time (R-P) remained constant.Similar beat-to-beat alternation in tachycardiainterval has been noted by others most com-monly just prior to tachycardia termination fol-lowing intravenous verapamil administration.""" The alternation seen by others has been con-fined to the antegrade limb of the tachycardiacircuit.
An increase in vagal tone terminates paroxys-mal supraventricular tachycardia when AVnode block occurs.'*"^" Hence a tachycardia in-corporating a bypass tract ends with a P waveand there is a missing R wave. This results in twoconsecutive P waves (i.e., the last P wave of thetachycardia and the first sinus P wave) withoutan R wave intervening. This condition was indi-cated by a positive pulse by the MTT circuit (seeleft panel of Figure 7). In Figure 7 (right panel)we also illustrated the type of result seen whenthe tachycardia termination was due to a suddenfailure of conduction in the bypass tract. Theepisode shown ends without a P wave implyingthat conduction failed in the bypass tract. Therewas sudden spontaneous termination of thetachycardia without any prior R-R or P-R pro-longation. The tachycardia ended with an R
wave and then sinus rhythm resumed. Thus theconsecutively alternating R and P wave se-quence was not interrupted and the MTT outputof the circuit does not emit a pulse in this cir-cumstance. One can easily appreciate that inthis case the tachycardia did not end as a resultof AV node conduction failure since P-R pro-longation and rate slowing did not precede thebreak. Antecedent slowing is a universal fea-ture of vagal depression of AV node conduc-tion,'" but by contrast conduction in a bypasstract may fail without antecedent conductionslowing.^'"'^
Obviously the proper operation of the systemdepends on accurate and consistent P wave andR wave sensing. At present, reliable P wavesensing requires an intracardiac or esophageallead. Since the actual trigger points on the Pwave and R wave do not coincide with theearliest deflection of these signals, the P-R andR-P measured do not reflect the absolute totalintervals. However, provided the signal sourceand trigger points remain constant, changes in P-R and R-P intervals can be followed very accur-ately. The measurements are useful not only in alaboratory environment but could be of enor-mous help in a clinical monitoring setting.
The use of commercially available intervalcounters to accomplish the described task wouldbe costly and involve special adaptation. First,commercial units generally make only a singleinterval measurement while our unit performsfour simultaneous measurements. Second, com-mercial units usually have only light emittingdiode displays. Thus, digital to analog conver-sion kits and appropriate amplification wouldneed to be built to provide analog outputs ap-propriate for a chart recorder. Third, commer-cial units depending on quality and manufac-turer cost a minimum of at least five hundredU.S. dollars and this would be multiplied four-fold to provide all the desired measurements.The instrument described was constructed andtested for under two hundred U.S. dollars.
272 May-June 1981 PACE, Vol. 4
CONTINUOUS ON-LINE BEAT-TO-BEAT ANALYSIS OF AV CONDUCTION TIME
References
10.
11,
12,
13.
Levy. M.N., Martin, P.]., Zieske. H,, Adier, D.:Role of positive feedback in the atrioventricularnodal Wenckebach phenomenon. Circ. Res., 14.34:697, 1974.Billette, ].: Preceding His-atrial inlerval as adeterminant of atrioventricular nodal conduc-tion time in the human and rabbil heart. Am, /.Cardiol. 38:880, 1976. 15.Barold, S.S,, and Coumel, P,: Mechanisms ofatrioventricular junctional tachycardia. Am, /.Cardio]., 39:97, 1977,Bellet, S,: Clinical Disorders of the Heart Beat, 16,3rd edition, Philadelphia, Lea & Febiger, 1971. p,1165,Kirchheim, H.R.: Systemic arterial baroreceplorreflexes. Physio]. Rev,, 56:100, 1976.Heidorn, G.H. and McNamara, A.P,: Effect of 17.carotid sinus stimulation on the electrocardio-grams of clinically normal individuals. Circula-tion, 14:1104, 1956,Wu, D,, and Denes, P,: Mechanisms of paroxys- 18.mal supraventricular tachycardia. Arch. Intern.Med.. 135:437, 1975.losephson, M.E, and Kastor, ],A.: Supraventricu-lar tachycardia: Mechanisms and management. 19.Ann. Intern. Med., 87:346, 1977.Wellens, H.J.J. and Durrer, D.: The role of an ac-cessory alrioventricular pathway in reciprocal 20,tachycardia. Observations in patients with andwithout Wolff-Parkinson-White syndrome. Cir-cuiation. 52:58, 1975,Josephson, M.E., and Seides, S.F.: CJinical Car- 21.diac Eiectrophysiology: Techniques and Inter-pretations. Philadelphia, Lea & Febiger, 1979, p.176.Hamlin, R,L, and Smith, C.R,: Effects of vagalstimulation on SA and AV nodes. Am, /, PhysioJ., 22.215:560, 1968.Spear, J.F. and Moore, E,N,: Influence of briefvagal and stellate nerve stimulation on pace-maker activity and conduction within the atrio-ventricular conduction system of the dog. Circ, 23.Hes,, 32:27, 1973.Waxman, M.B., Bonet, f.F,, Finley, J.P.. Wald,R.W.; Effects of respiration and posture on
paroxysmal supraventricular tachycardia. Cir-culation, 62:1011, 1980.Curry, P,V.L,. Rowland, E,, Fox, K.M,, Krikler,D.M.: The relationship between posture, bloodpressure and electrophysioiogical properties inpatients with paroxysmal supraventriculartachycardia. Arch, Mai, Coeur. 71:293, 1978.Friedberg, H,D,, and Schamroth, L.: Three atrio-ventricular pathways: Reciprocating tachycar-dia with alternation of conduction times. J. EJec-trocardiol,. 6:159, 1973.Spurell, R.A.I,, Krikler. D,, and Sowton. E.: Twoor more intra AV nodal pathways in associationwith either James or Kent extranodal bypass inthree patients with paroxysmal supraventriculartachycardia, Br. Heart /,, 35:113, 1973.Vohra, J., Hunt. D.. Stuckey, J,. Slomen, C : Cyclelength alternation in supraventricular tachycar-dia after administration of verapamil, Brit,Heart /.. 36:570. 1974.Waxman, M,B,, Wald, R,W.. Sharma, A.D., et al.:Vagal techniques for termination of paroxysmalsupraventricular tachycardia. Am, /, Cardiol.,46:655. 1980.Goldreyer, B,N. and Bigger. J.T., Jr.: Site of re-entry in paroxysmal supraventricular tachy-cardia in man. Circulation, 43:15, 1971.Farshidi, A., Josephson. M.D.. and Horowitz,L.N.: Electrophysiologic characteristics of con-cealed bypass tracts: Clinical and electrocardio-graphic correlates. Am, /, Cardioi., 41:1052, 1978.Wu, D., Amat-y-Leon. F,. Simpson, R.J., Jr.. et al.:Electrophysiological studies with multiple drugsin patients with atrio-ventrlcular reentranttachycardias utilizing an extranodal pathway.Circuialion, 56:727, 1977,Wellens, H.J.].: Effect of drugs on the Wolff-Parkinson-White syndrome. In, 0,S. Narula(Ed.): His Bundle E/ectrocardiography and CUni-cal E/ectrophysioiogy. Philadelphia, F,A. DavisCo.. 1975, pp. 367-385,Gallagher, J.J,. Pritchett. E.L.C., Sealy, W,G., etal,: The preexcitation syndromes. Prog, Cardio-vasc, Dis., 20:285, 1978.
PACE, Vol. 4 May-June 1981 273