continuous improvement action plan - my baker - baker college
TRANSCRIPT

1
Annual Assessment Plan
Program: Associate of Business: Business Administration College Of: Business Name of person submitting: Dr. Amy Sue DeSonia, CPA Year: 2017 - 2018
Continuous Improvement Action Plan Improvement Goal #1: Ensure that DM assessments align with industry standards and with
both course and programmatic outcomes at the correct level of mastery.
1. Areas for improvement:
a. Assurance that DM assessments are appropriate –
i. Aligned with industry standards;
ii. Aligned with both course and programmatic outcomes;
iii. Assessed at the appropriate levels of mastery (Bloom’s taxonomy)
b. Ensuring consistent use of validated data to improve course design and delivery
c. Designing appropriate remediation measures for areas of concern highlighted in
review of student performance
2. Evidence of need for improvement:
a. Extreme fluctuations in performance measurement from year to year in some
areas
b. Faculty evaluations of courses (MGT 1010; MKT 1110; MGT 2210)
c. Overall performance on the MGT 2210 Final Presentation
d. Designation of courses that previously had DMs as “electives” rather than
required core courses – particularly the end-of-program DM.
3. Strategy:
a. Review core course SLOs for alignment with industry standards, and assessments
b. Consider administration of the NOCTI General Management exam as a
comprehensive end-of-program and mid-level Direct Measure of Assessment.
(replacing the Project in MGT 2210)
c. Review existing grading rubrics for clarity, alignment with desired levels of
mastery, and
d. Perform tests of inter-rater reliability on the grading rubrics for DMs.
e. Establish performance benchmarks and future targets for DMs to facilitate
comparative analysis and informed decision-making

2
f. Develop appropriate remediation for areas of concern highlighted in review of
student performance on DMs.
4. Expected results and metrics:
a. Alignment of assessments with industry standards at the appropriate levels of
mastery
b. Better data for decision-making, including course design, sequencing, and
delivery
Improvement Goal #2: Increase transfer-in rates and improve KPIs (persistence, retention,
and graduation/completion rates).
1. Areas for improvement:
a. Increasing new student enrollment
b. Expanding opportunities for transfer-in
c. Improving persistence, retention, and completion/graduation rates
2. Evidence of need for improvement:
a. Overall enrollment decline – demographics, and increased competition
b. KPI comparative analysis
3. Strategy:
a. Work with internal and external partners to identify and implement “best
practices”
i. Use of correspondence and Early Alert as interventions
ii. Strategic scheduling and cohort modeling
iii. Continue to increase opportunities for articulation and credit for prior
learning
iv. Use of tutoring and supplemental instruction
v. Continue to encourage students to take advantage of opportunities for
credit for prior learning (portfolio preparation)
vi. Expand transfer and articulation agreements
4. Expected results and metrics:
a. Increases in new student enrollment
b. Increases in retention, 1st year persistence, and graduation/completion rates
c. Increase in the number of articulation and transfer agreements

3
Supporting Data Summary of major findings Direct measures of assessment reviewed: FIN 1010 Personal Finance – Project, Part V (PSLOs: #1, and #4) MGT 1010 Introduction to Business – Project, Part IV (PSLOs: #1, #3, and #4) MKT 1110 Principles of Marketing – Project, Part IV (PSLOs: #1, #3, and #4) MGT 2210 Management Seminar – Final Presentation (PSLOs: #1, #2, #3, and #4) BUS 2910 Fundamental of Project Management – Case Study (PSLOs: #1, #2, and #4) NOTES: DM Assessments for MGT 1010 Introduction to Business and MKT 1110 Principles of Marketing have been, or will be revised to match the new course design – resultant grading rubrics should be tested for inter-rater reliability. Performance ratings in several areas showed significant fluctuation from year-to-year – also suggesting the need for review of clarity and inter-rater reliability of grading rubrics. Performance improvement targets were met for all of the areas being assessed on the FIN 1010 Personal Finance DM for the period under review. Because MGT 2210 and BUS 2910 are now elective courses – we might wish to consider the administration of the NOCTI General Management examination as a comprehensive end-of-program DM of assessment in BUS 2110 Business Analytics. 2017-18 was the first administration of the DM in BUS 2910 Fundamentals of Project Management – so there was no comparative data available. With specific regard to the DM in MGT 2210 Management Seminar – overall performance improvement targets were not met for any of the areas being assessed during the period under review. Indirect measures of assessment reviewed: First Destination Survey (2016-17) – knowledge rate = 56.0%; employment rate = 54.9%; related employment rate = 63.7%; employed at work experience site = 50.4%; salary summary = $36.037.38 Faculty course evaluations were reviewed for all of the following courses: (detail included later in this document)

4
MGT 1010 Introduction to Business
MGT 2210 Management Seminar
MKT 1110 Principles of Marketing NOTE: primary concern for all 3 was the lack of alignment between learning outcomes and assessments – particularly with regard to mastery levels (Bloom’s). It appears that the SLOs are written at a lower level than the assignments are assessing. Another concern was the lack of correspondence between the grading rubrics and the assessments. Students struggle with formulating problem statements (research hypotheses) and citations. End-of-program survey
73% of respondents would recommend the program, while 27% would not. Scores did not
exceed 3.2/5. Lowest scoring areas are noted:
Math skills (2.6)
Technical skills (2.6)
Knowledge and skills required for the job (2.6)
Opportunities for interaction with professionals in the field (2.6)
Several comments regarding a lack of prompt feedback.
KPIs reviewed: (2013-14 to 2016-17) New student enrollment – 20% increase for period under review: from 640 to 768 Total registrations – 27.5% decrease for the period under review: from 2,073 to 1,503 Retention rate – 5.4% increase for the period under review: from 50% to 5.4% 1st year persistence rate – 24.3% decrease for the period under review: from 34.4% to 10.1% Number of graduates – 15.4% decrease for the period under review: from 280 to 237 Graduation rate (150%) – 2.8% decrease for the period under review: 20.9% to 18.1% Progress Report on Previous Continuous Improvement Action Plan Course conversion for semesters completed for delivery beginning in the Fall of 2017. There was no plan submission in 2014-15.

5
OVERVIEW OF STUDENT LEARNING OUTCOMES BROAD-BASED STUDENT LEARNING OUTCOMES: COLLEGE OF BUSINESS:
1. BBSLO 1. Students will acquire the relevant disciplinary knowledge and competencies appropriate to their programs of study.
2. BBSLO 2. Students will demonstrate behaviors and attitudes that promote success in the workplace.
3. BBSLO 3. Students will demonstrate effective communication (both written and oral), including the use of technology, in various environment and situations.
4. BBSLO 4. Students will acquire critical thinking skills including analysis and synthesis both within the career field and for the purpose of life-long learning.
5. BBSLO 5. Students will acquire relevant knowledge, which includes an understanding of cultural, social, political, and global issues.
6. BBSLO 6. Students will acquire the knowledge and demonstrate the ability to follow and support the ethical standards of their profession.
PROGRAMMATIC OUTCOMES:
1. PSLO 1. Students will be able to describe the introductory concepts, basic theories, and fundamental practices in the principal functional areas of business. (associated Broad-Based SLOs: 1, 2, and 3)
2. PSLO 2. Students will be able to use current technology in support of business administration. (associated Broad-Based SLO: 3)
3. PSLO 3. Students will be able to use relevant information and individual judgment to determine
whether events or processes comply with laws, regulations, or standards. (associated Broad-
Based SLOs: 5, 6)
4. PSLO 4. Students will be able to produce and present effective written and oral
communications. (associated Broad-Based SLO: 3)
Data analysis Results: Direct Measures of Student learning Direct Measures of Assessment are included in the following core course: FIN 1010 Personal Finance
Financial Plan Project, Part V (PSLOs: #1, and #4) The grading rubric addresses the following elements:
1. Plan integration/consolidation 2. Critical thinking

6
3. Writing mechanics 4. Citations
The N for each year under review is as follows:
1. 2015-16 N = 1,126 2. 2016-17 N = 1,114 3. 2017-18 N = 577
Table 1.1 2014-15 (Base year)
N 267
Average: 1 2 3 4
Excellent (3) 54% 53% 67% 47%
Competent (2) 37% 29% 27% 18%
Unacceptable (1) 9% 18% 6% 35%
100% 100% 100% 100%
Table 1.2 2015-16
N 1126
Average: 1 2 3 4
Excellent (3) 53% 55% 66% 50%
Competent (2) 41% 33% 31% 20%
Unacceptable (1) 6% 12% 3% 30%
100% 100% 100% 100%

7
Table 1.3 2016-17 N 1114
Average: 1 2 3 4
Excellent (3) 57% 54% 69% 54%
Competent (2) 37% 30% 26% 20%
Unacceptable (1) 6% 16% 5% 26%
100% 100% 100% 100%
Table 1.4 2017-18
N 577
Average: 1 2 3 4
Excellent (3) 60% 60% 71% 60%
Competent (2) 34% 24% 27% 16%
Unacceptable (1) 6% 16% 2% 24%
100% 100% 100% 100%
Summary for this assessment Overall – there are no major areas of concern. Plan integration/consolidation (1) NOTE: targets based on 2014-15 performance; proposed targets based on 2017-18 performance The percentage of students scoring at the level of “Competent” and above met the current target of 90% or more, and the percentage of students scoring at the level of “Unacceptable” met the current target of 10% or less. In addition, the current goal of having 60% or more score at a level of “Excellent” was also met. Proposed new targets – “Excellent” = 65% or more; “Competent” and above = 95% or more; “Unacceptable” = 5% or less
1. The percentage of students scoring “Competent” and above has increased 3% from 91% in 2014-15 to 94% in 2017-18 (target = 90% or more)

8
a. The percentage of students scoring at the level of “Excellent” has increased 6% from 54% in 2014-15 to 60% in 2017-18 (target = 70% or more)
i. Decreased 1% between 2014-15 and 2015-16 from 54% to 53% ii. Increased 4% between 2015-16 and 2016-17 from 53% to 57%
iii. Increased 3% between 2016-17 and 2017-18 from 57% to 60% b. The percentage of students scoring at the level of “Competent” has decreased
3% from 37% in 2014-15 to 34% in 2017-18 i. Increased 4% between 2014-15 and 2015-16 from 37% to 41%
ii. Decreased 4% between 2015-16 and 2016-17 from 41% to 37% iii. Decreased 3% between 2016-17 and 2017-18 from 37% to 34%
2. The percentage of students scoring at the level of “Unacceptable” has decreased 3% from 9% in 2014-15 to 6% in 2017-18 (target = 10% or less)
a. Decreased 3% between 2014-15 and 2015-16 – from 9% to 6% b. Remained at 6% for the other periods
Critical thinking (2) NOTE: initial targets based on 2014-15 performance; proposed targets based on 2017-18 performance The percentage of students scoring at the level of “Competent” and above met the current target of 80% or more; and the current goal of having 60% or more score at a level of “Excellent was also met. However, the percentage of students scoring at the level of “Unacceptable” did not meet the initial target of 15% or less. Proposed new targets: “Excellent” = 65% or more; “Competent” and above = 85% or more; “Unacceptable” = 15% or less
1. The percentage of students scoring at the level of “Competent” and above has increased 2% from 82% in 2014-15 to 84% in 2017-18 (target = 80% or more)
a. The percentage of students scoring at the level of “Excellent” has increased 7% from 53% in 2014-15 to 60% in 2017-18 (target = 60% or more)
i. Increased 2% between 2014-15 and 2015-16 from 53% to 55% ii. Decreased 1% between 2015-16 and 2016-17 from 55% to 54%
iii. Increased 6% between 2016-17 and 2017-18 from 54% to 60% b. The percentage of students scoring at the level of “Competent” has decreased
5% from 29% in 2014-15 to 24% in 2017-18 i. Increased 4% between 2014-15 and 2015-16 from 29% to 33%
ii. Decreased 3% between 2015-16 and 2016-17 from 33% to 30% iii. Decreased 6% between 2016-17 and 2017-18 from 30% to 24%
2. The percentage of students scoring at the level of “Unacceptable” has decreased 2% from 18% in 2014-15 to 16% in 2017-18 (target = 15% or less)
a. Decreased 6% between 2014-15 and 2015-16 from 18% to 12%

9
b. Increased 4% between 2015-16 and 2016-17 from 12% to 16% c. Stayed the same between 2016-17 and 2017-18 at 16%
Writing mechanics (3) NOTE: initial targets based on 2014-15 performance; proposed targets based on 2017-18 performance The percentage of students scoring at the level of “Competent” and above met the current target of 90% or more; the percentage of students scoring at the level of “Unacceptable” met the current target of 5% or less; and the current goal of having 70% or more score at a level of “Excellent” was also met. Proposed new targets: “Excellent” = 75% or more; “Competent” or above = 95% or above; “Unacceptable” = 5% or below
1. The percentage of students scoring at the level of “Competent” or above has increased 4% from 94% in 2014-15 to 98% in 2017-18 (target = 90% or more)
a. The percentage of students scoring at the level of “Excellent” has increased 4% from 67% in 2014-15 to 71% in 2017-18 (target = 70% or more)
i. Decreased 1% between 2014-15 and 2015-16 from 67% to 66% ii. Increased 3% between 2015-16 and 2016-17 from 66% to 69%
iii. Increased 2% between 2016-17 and 2017-18 from 69% to 71% b. The percentage of students scoring at the level of “Competent” has remained
the same at 27% in 2014-15 and 27% in 2017-18 i. Increased 4% between 2014-15 and 2015-16 from 27% to 31%
ii. Decreased 5% between 2015-16 and 2016-17 from 31% to 26% iii. Increased 1% between 2016-17 and 2017-18 from 26% to 27%
2. The percentage of students scoring at the level of “Unacceptable” has decreased 4% from 6% in 2014-15 to 2% in 2017-18 (target = 5% or less)
a. Decreased 3% between 2014-15 and 2015-16 from 6% to 3% b. Increased 2% between 2015-16 and 2016-17 from 3% to 5% c. Decreased 3% between 2016-17 and 2017-18 from 5% to 2%
Citations (4) NOTE: initial targets based on 2014-15 performance; proposed targets based on 2017-18 performance The percentage of students scoring at the level of “Competent” and above met the current target of 70% or more; the percentage of students scoring at the level of “Unacceptable” met the current target of 30% or less; and the initial goal of having 50% or more score at a level of “Excellent” was also met.

10
Proposed new targets: “Excellent” = 65% or more; “Competent” and above = 75% or more; “Unacceptable” = 25% or less
1. The percentage of students scoring at the level of “Competent” and above has increased 12% from 65% in 2014-15 to 76% in 2017-18 (target = 70% or above)
a. The percentage of students scoring at the level of “Excellent” increased 13% from 47% in 2014-15 to 60% in 2017-18 (target = 50% or above)
i. Increased 3% between 2014-15 and 2015-16 from 47% to 50% ii. Increased 4% between 2015-16 and 2016-17 from 50% to 54%
iii. Increased 6% between 2016-17 and 2017-18 from 54% to 60% b. The percentage of students scoring at the level of “Competent” decreased 2%
from 18% in 2014-15 to 16% in 2017-18 i. Increased 2% between 2014-15 and 2015-16 from 18% to 20%
ii. Stayed the same between 2015-16 and 2016-17 iii. Decreased 4% between 2016-17 and 2017-18 from 20% to 16%
2. The percentage of students scoring at the level of “Unacceptable” has decreased 11% from 35% in 2014-15 to 24% in 2017-18 (target = 30% or less)
a. Decreased 5% between 2014-15 and 2015-16 from 35% to 30% b. Decreased 4% between 2015-16 and 2016-17 from 30% to 26% c. Decreased 2% between 2016-17 and 2017-18 from 26% to 24%
MGT 1010 Introduction to Business
Business Project, Part IV (PSLOs: 1, 3, and 4) The grading rubric addresses the following elements:
1. Required elements 2. Writing mechanics 3. Writing organization 4. Citations 5. Critical thinking
The N for each year under review is as follows:
2014-15 N = 158
2015-16 N = 1,000

11
Table 2.1 2014-15
1 2 3 4 5
Excellent 59% 57% 65% 47% 58%
Good 20% 23% 17% 12% 19%
Acceptable 11% 15% 13% 16% 15%
Developing 7% 5% 5% 11% 5%
Unacceptable 3% 0% 0% 14% 3%
100% 100% 100% 100% 100%
Table 2.2 2015-16 N 1000
1 2 3 4 5
Excellent 65% 64% 73% 52% 58%
Good 20% 25% 19% 20% 26%
Acceptable 9% 8% 7% 11% 11%
Developing 5% 3% 1% 10% 4%
Unacceptable 1% 0% 0% 7% 1%
100% 100% 100% 100% 100%
NOTE: data was only available for 2014-15 and 2015-16
Summary for this assessment Overall – no major areas of concern. However, the scores may indicate the need for tests of inter-rater reliability and review/revision of the grading rubric. Required elements (1) NOTE: targets based on 2014-15 performance; proposed targets based on 2015-16 performance The percentage of students scoring at the level of “Acceptable” and above met the current target of 90% or more; the percentage of students scoring at the level of “Developing” and “Unacceptable” met the current target of 10% or less; and the initial goal of having 60% or more score at a level of “Excellent” was also met.

12
Proposed new targets: “Excellent” = 65% or more; “Acceptable” and above = 95% or more; “Developing” or “Unacceptable” = 5% or less
The percentage of students scoring “Acceptable” or above increased 4% from 90% to 94% (target = 90% or more)
a. The percentage of students scoring “Excellent” increased 6% from 59% to 65% (target = 60% or more)
b. The percentage of students scoring “Good” stayed the same at 20% c. The percentage of students scoring “Acceptable” decreased 2% from 11% to 9%
The percentage of students scoring “Developing” and “Unacceptable” decreased 4% from 10% to 6% (target = 10% or less)
a. The percentage of students scoring “Developing” decreased 2% from 7% to 5% b. The percentage of students scoring “Unacceptable” decreased 2% from 3% to 1%
Writing mechanics (2) NOTE: initial targets based on 2014-15 performance; proposed targets based on 2015-16 performance The percentage of students scoring at the level of “Acceptable” and above met the current target of 95% or more; the percentage of students scoring at the level of “Developing” and “Unacceptable” met the current target of 10% or less; and the initial goal of having 60% or more score at a level of “Excellent” was also met. Proposed new targets: “Excellent” = 65% or more; “Acceptable” and above = 95% or more; “Developing” or “Unacceptable” = 5% or less
The percentage of students scoring “Acceptable” or above increased 2% from 95% to 97% (target = 95% or more)
a. The percentage of students scoring “Excellent” increased 7% from 57% to 64% (target = 60% or more)
b. The percentage of students scoring “Good” increased 2% from 23% to 25% c. The percentage of students scoring “Acceptable” decreased 7% from 15% to 8%
The percentage of students scoring “Developing” and “Unacceptable” decreased 4% from 10% to 6% (target = 10% or less)
a. The percentage of students scoring “Developing” decreased 2% from 5% to 3% b. The percentage of students scoring “Unacceptable” was 0% for both years
Writing organization (3) NOTE: initial targets based on 2014-15 performance; proposed targets based on 2015-16 performance

13
The percentage of students scoring at the level of “Acceptable” and above met the current target of 95% or more; the percentage of students scoring at the level of “Developing” and “Unacceptable” met the current target of 10% or less; and the initial goal of having 65% or more score at a level of “Excellent” was also met. Proposed new targets: “Excellent” = 65% or more; “Acceptable” and above = 95% or more; “Developing” or “Unacceptable” = 5% or less
The percentage of students scoring “Acceptable” or above increased 4% from 95% to 99% (target = 95% or more)
a. The percentage of students scoring “Excellent” increased 8% from 64% to 73% (target = 65% or more)
b. The percentage of students scoring “Good” increased 2% from 17% to 19% c. The percentage of students scoring “Acceptable” decreased 7% from 15% to 8%
The percentage of students scoring “Developing” and “Unacceptable” decreased 2% from 5% to 3% (target = 10% or less)
a. The percentage of students scoring “Developing” decreased 2% from 5% to 3% b. The percentage of students scoring “Unacceptable” was 0% for both years
Citations (4) NOTE: initial targets based on 2014-15 performance; proposed targets based on 2015-16 performance The percentage of students scoring at the level of “Acceptable” and above met the current target of 75% or more; the percentage of students scoring at the level of “Developing” and “Unacceptable” met the current target of 25% or less; and the initial goal of having 50% or more score at a level of “Excellent” was also met. Proposed new targets: “Excellent” = 55% or more; “Acceptable” and above = 85% or more; “Developing” or “Unacceptable” = 15% or less
The percentage of students scoring “Acceptable” or above increased 8% from 75% to 83% (target = 75% or more)
a. The percentage of students scoring “Excellent” increased 5% from 47% to 52% (target = 50% or more)
b. The percentage of students scoring “Good” increased 8% from 12% to 20% c. The percentage of students scoring “Acceptable” decreased 5% from 16% to 11%
The percentage of students scoring “Developing” and “Unacceptable” decreased 2% from 5% to 3% (target = 25% or less)
a. The percentage of students scoring “Developing” decreased 2% from 5% to 3% b. The percentage of students scoring “Unacceptable” was 0% for both years

14
Critical Thinking (5) NOTE: initial targets based on 2014-15 performance; proposed targets based on 2015-16 performance The percentage of students scoring at the level of “Acceptable” and above met the current target of 95% or more; the percentage of students scoring at the level of “Developing” and “Unacceptable” met the current target of 5% or less; but the initial goal of having 60% or more score at a level of “Excellent” was not met. Proposed new targets: “Excellent” = 60% or more; “Acceptable” and above = 95% or more; “Developing” or “Unacceptable” = 5% or less
The percentage of students scoring “Acceptable” or above increased 3% from 92% to 95% (target = 95% or more)
a. The percentage of students scoring “Excellent” stayed the same at 58% (target = 60% or more)
b. The percentage of students scoring “Good” increased 7% from 19% to 26% c. The percentage of students scoring “Acceptable” decreased 4% from 14% to 11%
The percentage of students scoring “Developing” and “Unacceptable” decreased 3% from 8% to 5% (target = 5% or less)
a. The percentage of students scoring “Developing” decreased 1% from 5% to 4% b. The percentage of students scoring “Unacceptable” decreased 2% from 3% to 1%
MGT 2220 Management Seminar
Final Presentation (PSLOs: 1, 2, 3, and 4) The grading rubric addresses the following elements:
1. Required research elements 2. Proposal 3. Format 4. Technical Aspects 5. Professionalism 6. Writing mechanics
The N for each year under review is as follows:
2015-16 N = 64
2016-17 N = 190
2017-18 N = 241

15
Table 3.1 2014-15
Average: 1 2 3 4 5 6
Competent (4) 63% 59% 66% 69% 75% 61%
Proficient (3) 23% 20% 19% 17% 16% 23%
Novice (2) 8% 15% 12% 8% 6% 12%
Not Observed (1) 6% 6% 3% 6% 3% 4%
100% 100% 100% 100% 100% 100%
Table 3.2 2015-16
N 64
Average: 1 2 3 4 5 6
Competent (4) 66% 77% 83% 91% 89% 83%
Proficient (3) 13% 16% 14% 5% 11% 13%
Novice (2) 16% 6% 3% 3% 0% 3%
Not Observed (1) 5% 1% 0% 1% 0% 1%
100% 100% 100% 100% 100% 100%
Table 3.3 2016-17
N 190
Average:
Competent (4) 56% 39% 65% 69% 72% 45%
Proficient (3) 26% 37% 25% 21% 20% 18%
Novice (2) 14% 16% 9% 9% 7% 18%
Not Observed (1) 4% 8% 1% 1% 1% 19%
100% 100% 100% 100% 100% 100%

16
Table 3.4 2017-18
N 251
Average:
Competent (4) 60% 44% 73% 69% 69% 57%
Proficient (3) 24% 27% 18% 21% 24% 22%
Novice (2) 10% 21% 8% 9% 6% 13%
Not Observed (1) 6% 8% 1% 1% 1% 8%
100% 100% 100% 100% 100% 100%
Summary for this assessment Overall – there are several areas for potential improvement. The “Not Observed” level of mastery on the grading rubric is somewhat confusing. There are several large fluctuations in the performance levels from year to year – which might also suggest some confusion. The rubric should be reviewed for clarity and revised, if necessary. There also appears to be a need for testing inter-rater reliability of the instrument. None of the performance targets, based on student performance in 2014-15 were met, for the following components of this assessment:
Required research elements
Proposal
Writing mechanics In addition to having large fluctuations in performance from year-to-year; certain performance targets, based on student performance in 2014-15 were not met, for the following components:
Format – percentage performing at “Competent”
Technical aspects – percentage performing at “Competent” Required research elements (1) NOTE: targets based on 2014-15 performance; proposed targets based on 2017-18 performance The percentage of students scoring at the level of “Proficient” + “Competent” did not meet the current target of 85% or more, and the percentage of students scoring at the level of “Novice” + “Not observed” did not meet the current target of 15% or less. In addition, the current goal of having 65% or more score at a level of “Competent” was also not met.

17
Proposed new targets – “Proficient” (highest) = 65% or more; “Competent” and above (“Competent” as second level + “Proficient”) = 85% or more; “Developing” (replace “Novice”) + “Missing or Unacceptable” (replace “Not Observed”) = 15% or less
1. The percentage of students scoring “Proficient” + “Competent” decreased 2% from 86% in 2014-15 to 84% in 2017-18 (target = 90% or more)
a. The percentage of students scoring at the level of “Competent” decreased 3% from 63% in 2014-15 to 60% in 2017-18 (target = 65% or more)
i. Increased 3% between 2014-15 and 2015-16 from 63% to 66% ii. Decreased 10% between 2015-16 and 2016-17 from 66% to 56%
iii. Increased 4% between 2016-17 and 2017-18 from 56% to 60% b. The percentage of students scoring at the level of “Proficient” increased 1% from
23% in 2014-15 to 24% in 2017-18 i. Decreased 10% between 2014-15 and 2015-16 from 23% to 13%
ii. Increased 13% between 2015-16 and 2016-17 from 13% to 26% iii. Decreased 2% between 2016-17 and 2017-18 from 26% to 34%
2. The percentage of students scoring at the level of “Novice” + “Not Observed” has increased 2% from 14% in 2014-15 to 16% in 2017-18 (target = 10% or less)
a. The percentage of students scoring at the level of “Novice” increased 2% from 8% in 2014-15 to 10% in 2017-18
i. Increased 8% between 2014-15 and 2015-16 from 8% to 16% ii. Decreased 2% between 2015-16 and 2016-17 from 16% to 14%
iii. Decreased 4% between 2016-17 and 2017-18 from 14% to 10% b. The percentage of students scoring at the level of “Not Observed” stayed the
same from 2014-15 to 2017-18 – 6% i. Decreased 1% between 2014-15 and 2015-16 from 6% to 5%
ii. Decreased 1% between 2015-16 and 2016-17 from 5% to 4% iii. Increased 2% between 2016-17 and 2017-18 from 4% to 6%
Proposal (2) NOTE: targets based on 2014-15 performance; proposed targets based on 2017-18 performance The percentage of students scoring at the level of “Proficient” + “Competent” did not meet the current target of 80% or more, and the percentage of students scoring at the level of “Novice” + “Not observed” did not meet the current target of 20% or less. In addition, the current goal of having 60% or more score at a level of “Competent” was also not met. Proposed new targets – “Proficient” (highest) = 60% or more; “Competent” and above (“Competent” as second level + “Proficient”) = 80% or more; “Developing” (replace “Novice”) + “Missing or Unacceptable” (replace “Not Observed”) = 20% or less

18
1. The percentage of students scoring “Proficient” + “Competent” decreased 8% from 79% in 2014-15 to 71% in 2017-18 (target = 80% or more)
a. The percentage of students scoring at the level of “Competent” decreased 15% from 59% in 2014-15 to 44% in 2017-18 (target = 60% or more)
i. Increased 18% between 2014-15 and 2015-16 from 59% to 77% ii. Decreased 38% between 2015-16 and 2016-17 from 77% to 39%
iii. Increased 5% between 2016-17 and 2017-18 from 39% to 44% b. The percentage of students scoring at the level of “Proficient” increased 1% from
23% in 2014-15 to 24% in 2017-18 i. Decreased 10% between 2014-15 and 2015-16 from 23% to 13%
ii. Increased 13% between 2015-16 and 2016-17 from 13% to 26% iii. Decreased 2% between 2016-17 and 2017-18 from 26% to 34%
2. The percentage of students scoring at the level of “Novice” + “Not Observed” has increased 2% from 14% in 2014-15 to 16% in 2017-18 (target = 10% or less)
a. The percentage of students scoring at the level of “Novice” increased 2% from 8% in 2014-15 to 10% in 2017-18
i. Increased 8% between 2014-15 and 2015-16 from 8% to 16% ii. Decreased 2% between 2015-16 and 2016-17 from 16% to 14%
iii. Decreased 4% between 2016-17 and 2017-18 from 14% to 10% b. The percentage of students scoring at the level of “Not Observed” stayed the
same from 2014-15 to 2017-18 – 6% i. Decreased 1% between 2014-15 and 2015-16 from 6% to 5%
ii. Decreased 1% between 2015-16 and 2016-17 from 5% to 4% iii. Increased 2% between 2016-17 and 2017-18 from 4% to 6%
Format (3) NOTE: targets based on 2014-15 performance; proposed targets based on 2017-18 performance The percentage of students scoring at the level of “Proficient” + “Competent” met the current target of 85% or more, and the percentage of students scoring at the level of “Novice” + “Not observed” met the current target of 15% or less. In addition, the current goal of having 70% or more score at a level of “Competent” was also met. Proposed new targets – “Competent” (highest) = 75% or more; “Proficient” and above = 90% or more; “Novice” + “Missing or Unacceptable” (replace “Not Observed”) = 10% or less
1. The percentage of students scoring “Proficient” + “Competent” increased 6% from 85% in 2014-15 to 91% in 2017-18 (target = 85% or more)
a. The percentage of students scoring at the level of “Competent” increased 7% from 66% in 2014-15 to 73% in 2017-18 (target = 70% or more)
i. Increased 17% between 2014-15 and 2015-16 from 66% to 83%

19
ii. Decreased 18% between 2015-16 and 2016-17 from 83% to 65% iii. Increased 8% between 2016-17 and 2017-18 from 65% to 73%
b. The percentage of students scoring at the level of “Proficient” decreased 1% from 19% in 2014-15 to 18% in 2017-18
i. Decreased 5% between 2014-15 and 2015-16 from 19% to 14% ii. Increased 11% between 2015-16 and 2016-17 from 14% to 25%
iii. Decreased 7% between 2016-17 and 2017-18 from 25% to 18% 2. The percentage of students scoring at the level of “Novice” + “Not Observed” has
decreased 6% from 15% in 2014-15 to 9% in 2017-18 (target = 15% or less) a. The percentage of students scoring at the level of “Novice” decreased 3% from
12% in 2014-15 to 9% in 2017-18 i. Decreased 8% between 2014-15 and 2015-16 from 12% to 3%
ii. Increased 6% between 2015-16 and 2016-17 from 3% to 9% iii. Decreased 1% between 2016-17 and 2017-18 from 9% to 8%
b. The percentage of students scoring at the level of “Not Observed” decreased 2% from 3% in 2014-15 to 1% in 2017-18
i. Decreased 3% between 2014-15 and 2015-16 from 3% to 0% ii. Increased 1% between 2015-16 and 2016-17 from 0% to 1%
iii. Stayed the same between 2016-17 and 2017-18 at 1% Technical Aspects (4) NOTE: targets based on 2014-15 performance; proposed targets based on 2017-18 performance The percentage of students scoring at the level of “Proficient” + “Competent” met the current target of 85% or more, and the percentage of students scoring at the level of “Novice” + “Not observed” met the current target of 15% or less. In addition, the current goal of having 70% or more score at a level of “Competent” was not met. Proposed new targets – “Competent” (highest) = 75% or more; “Proficient” and above = 90% or more; “Novice” + “Missing or Unacceptable” (replace “Not Observed”) = 10% or less
1. The percentage of students scoring “Proficient” + “Competent” increased 4% from 86% in 2014-15 to 90% in 2017-18 (target = 85% or more)
a. The percentage of students scoring at the level of “Competent” stayed the same at 69% in 2014-15 and in 2017-18 (target = 70% or more)
i. Increased 22% between 2014-15 and 2015-16 from 69% to 91% ii. Decreased 22% between 2015-16 and 2016-17 from 91% to 69%
iii. Stayed the same between 2016-17 and 2017-18 at 69% b. The percentage of students scoring at the level of “Proficient” increased 4% from
17% in 2014-15 to 21% in 2017-18 i. Decreased 12% between 2014-15 and 2015-16 from 17% to 5%

20
ii. Increased 16% between 2015-16 and 2016-17 from 5% to 21% iii. Stayed the same between 2016-17 and 2017-18 at 21%
2. The percentage of students scoring at the level of “Novice” + “Not Observed” has decreased 4% from 14% in 2014-15 to 10% in 2017-18 (target = 15% or less)
a. The percentage of students scoring at the level of “Novice” increased 1% from 8% in 2014-15 to 9% in 2017-18
i. Decreased 5% between 2014-15 and 2015-16 from 8% to 3% ii. Increased 6% between 2015-16 and 2016-17 from 3% to 9%
iii. Stayed the same between 2016-17 and 2017-18 at 9% b. The percentage of students scoring at the level of “Not Observed” decreased 4%
from 6% in 2014-15 to 1% in 2017-18 i. Decreased 5% between 2014-15 and 2015-16 from 6% to 1%
ii. Stayed the same between 2015-16 and 2016-17 at 1% iii. Stayed the same between 2016-17 and 2017-18 at 1%
Professionalism (5) NOTE: targets based on 2014-15 performance; proposed targets based on 2017-18 performance The percentage of students scoring at the level of “Proficient” + “Competent” met the current target of 90% or more, and the percentage of students scoring at the level of “Novice” + “Not observed” met the current target of 10% or less. However, the current goal of having 75% or more score at a level of “Competent” was not met. Proposed new targets – “Competent” (highest) = 75% or more; “Proficient” and above = 90% or more; “Novice” + “Missing or Unacceptable” (replace “Not Observed”) = 10% or less
1. The percentage of students scoring “Proficient” + “Competent” increased 4% from 91% in 2014-15 to 93% in 2017-18 (target = 90% or more)
a. The percentage of students scoring at the level of “Competent” decreased from 75% in 2014-15 to 69% in 2017-18 (target = 75% or more)
i. Increased 14% between 2014-15 and 2015-16 from 75% to 89% ii. Decreased 17% between 2015-16 and 2016-17 from 89% to 72%
iii. Decreased 3% between 2016-17 and 2017-18 from 72% to 69% b. The percentage of students scoring at the level of “Proficient” increased 4% from
16% in 2014-15 to 24% in 2017-18 i. Decreased 5% between 2014-15 and 2015-16 from 16% to 11%
ii. Increased 9% between 2015-16 and 2016-17 from 11% to 20% iii. Increased 4% between 2016-17 and 2017-18 from 20% to 24%
2. The percentage of students scoring at the level of “Novice” + “Not Observed” has decreased 2% from 9% in 2014-15 to 7% in 2017-18 (target = 10% or less)

21
a. The percentage of students scoring at the level of “Novice” stayed the same at 6% in 2014-15 and in 2017-18
i. Decreased 6% between 2014-15 and 2015-16 from 6% to 0% ii. Increased 7% between 2015-16 and 2016-17 from 0% to 7%
iii. Decreased 1% between 2016-17 and 2017-18 from 7% to 6% b. The percentage of students scoring at the level of “Not Observed” decreased 2%
from 3% in 2014-15 to 1% in 2017-18 i. Decreased 3% between 2014-15 and 2015-16 from 3% to 0%
ii. Increased 1% between 2015-16 and 2016-17 from 0% to 1% iii. Stayed the same between 2016-17 and 2017-18 at 1%
Writing mechanics (6) NOTE: targets based on 2014-15 performance; proposed targets based on 2017-18 performance The percentage of students scoring at the level of “Proficient” + “Competent” did not meet the current target of 85% or more, and the percentage of students scoring at the level of “Novice” + “Not observed” did not meet the current target of 15% or less. In addition, the current goal of having 75% or more score at a level of “Competent” was not met. Proposed new targets – “Competent” (highest) = 75% or more; “Proficient” and above = 85% or more; “Novice” + “Missing or Unacceptable” (replace “Not Observed”) = 15% or less
1. The percentage of students scoring “Proficient” + “Competent” decreased 5% from 84% in 2014-15 to 79% in 2017-18 (target = 90% or more)
a. The percentage of students scoring at the level of “Competent” decreased from 75% in 2014-15 to 69% in 2017-18 (target = 75% or more)
i. Increased 14% between 2014-15 and 2015-16 from 75% to 89% ii. Decreased 17% between 2015-16 and 2016-17 from 89% to 72%
iii. Decreased 3% between 2016-17 and 2017-18 from 72% to 69% b. The percentage of students scoring at the level of “Proficient” decreased 1%
from 23% in 2014-15 to 22% in 2017-18 i. Decreased 10% between 2014-15 and 2015-16 from 23% to 13%
ii. Increased 5% between 2015-16 and 2016-17 from 13% to 18% iii. Increased 4% between 2016-17 and 2017-18 from 18% to 22%
2. The percentage of students scoring at the level of “Novice” + “Not Observed” has increased 2% from 16% in 2014-15 to 21% in 2017-18 (target = 15% or less)
a. The percentage of students scoring at the level of “Novice” increased 1% from 12% in 2014-15 to 13% in 2017-18
i. Decreased 9% between 2014-15 and 2015-16 from 12% to 3% ii. Increased 15% between 2015-16 and 2016-17 from 3% to 18%
iii. Decreased 5% between 2016-17 and 2017-18 from 18% to 13%

22
b. The percentage of students scoring at the level of “Not Observed” increased 4% from 4% in 2014-15 to 8% in 2017-18
i. Decreased 3% between 2014-15 and 2015-16 from 4% to 1% ii. Increased 1% between 2015-16 and 2016-17 from 1% to 19%
iii. Decreased 11% between 2016-17 and 2017-18 from 19% to 8% MKT 1110 Principles of Marketing
Marketing Project, Part IV (PSLOs: 1, and 4) The grading rubric addresses the following elements:
1. Required content elements 2. Writing mechanics 3. Writing organization 4. Citations 5. Critical thinking
The N for each year under review is as follows:
2015-16 N = 961
2016-17 N = 1,112
2017-18 N = 502
Table 4.1 2014-15
1 2 3 4 5
Excellent 46% 56% 68% 38% 44%
Good 37% 26% 19% 49% 43%
Acceptable 16% 15% 12% 7% 9%
Developing 1% 2% 1% 5% 3%
Unacceptable 0% 1% 0% 1% 1%
100% 100% 100% 100% 100%

23
Table 4.2 2015-16 N 961
1 2 3 4 3
Excellent 69% 70% 74% 57% 55%
Good 22% 22% 21% 19% 32%
Acceptable 6% 6% 4% 12% 10%
Developing 2% 2% 1% 3% 2%
Unacceptable 1% 0% 0% 9% 1%
100% 100% 100% 100% 100%
Table 4.3 2016-17
N 1112
1 2 3 4 5
Excellent 70% 70% 73% 58% 59%
Good 20% 21% 20% 16% 27%
Acceptable 7% 6% 4% 10% 10%
Developing 2% 2% 2% 8% 3%
Unacceptable 1% 1% 1% 8% 1%
100% 100% 100% 100% 100%
Table 4.4 2016-17
N 502
1 2 3 4 5
Excellent 71% 74% 76% 61% 60%
Good 20% 20% 18% 17% 28%
Acceptable 8% 4% 5% 7% 8%
Developing 1% 2% 1% 5% 3%
Unacceptable 0% 1% 0% 10% 1%
100% 101% 100% 100% 100%
Summary for this assessment Overall – no major areas of concern. Students’ ability to appropriately use and cite references is an area for improvement.

24
Required elements (1) NOTE: targets based on 2014-15 performance; proposed targets based on 2015-16 performance The percentage of students scoring at the level of “Acceptable” and above met the current target of 95% or more; the percentage of students scoring at the level of “Developing” and “Unacceptable” met the current target of 5% or less; and the initial goal of having 50% or more score at a level of “Excellent” was also met. Proposed new targets: “Excellent” = 70% or more; “Acceptable” and above = 90% or more; “Developing” or “Unacceptable” = 10% or less
The percentage of students scoring “Acceptable” or above stayed the same at 99% in 2014-15 and in 2017-18 (target = 95% or more)
a. The percentage of students scoring “Excellent” increased 25% from 46% in 2014-15 to 71% in 2017-18 (target = 50% or more) – annual fluctuations as follow:
i. Increased from 23% in 2014-15 to 69% in 2015-16 ii. Increased 1% from 69% in 2015-16 to 70% in 2016-17
iii. Increased 1% from 70% in 2016-17 to 71% in 2017-18 b. The percentage of students scoring “Good” decreased from 37% in 2014-15 to
20% in 2017-18 – annual fluctuations as follow: i. Decreased 15% from 37% in 2014-15 to 22% in 2015-16
ii. Decreased 2% from 22% in 2015-16 to 20% in 2016-17 iii. Stayed the same at 20% from 2016-17 to 2017-18
c. The percentage of students scoring “Acceptable” decreased 8% from 16% in 2014-15 to 8% in 2017-18 – annual fluctuations as follow:
i. Decreased 10% from 16% in 2014-15 to 6% in 2015-16 ii. Increased 1% from 6% in 2015-16 to 7% in 2016-17
iii. Increased 1% from 7% in 2016-17 to 8% in 2017-18
The percentage of students scoring “Developing” and “Unacceptable” stayed the same at 1% (target = 10% or less)
a. The percentage of students scoring “Developing” stayed the same at 1% -- annual fluctuations as follow:
i. Increased 1% from 1% in 2014-15 to 2% in 2015-16 ii. Stayed the same at 2% from 2015-16 to 2016-17
iii. Decreased 1% from 2% in 2016-17 to 1% in 2017-18 b. The percentage of students scoring “Unacceptable” stayed the same at 0% --
with annual fluctuations as follow: i. Increased 1% from 0% in 2014-15 to 1% in 2015-16
ii. Stayed the same at 1% between 2015-16 and 2016-17 iii. Decreased 1% from 1% in 2016-17 to 0% in 2017-18

25
Writing mechanics (2) NOTE: initial targets based on 2014-15 performance; proposed targets based on 2015-16 performance The percentage of students scoring at the level of “Acceptable” and above met the current target of 95% or more; the percentage of students scoring at the level of “Developing” and “Unacceptable” met the current target of 10% or less; and the initial goal of having 60% or more score at a level of “Excellent” was also met. Proposed new targets: “Excellent” = 75% or more; “Acceptable” and above = 95% or more; “Developing” or “Unacceptable” = 5% or less
The percentage of students scoring “Acceptable” or above stayed the same at 97% (target = 95% or more)
a. The percentage of students scoring “Excellent” increased 22% from 56% to 74% (target = 60% or more) – with annual fluctuations as follow:
i. Increased 14% from 56% in 2014-15 to 70% in 2015-16 ii. Stayed the same between 2015-16 and 2016-17 at 70%
iii. Increased 4% from 70% in 2016-17 to 74% in 2017-18 b. The percentage of students scoring “Good” decreased 6% from 26% to 20% --
with annual fluctuations as follow: i. Decreased 4% from 26% in 2014-15 to 22% in 2015-16
ii. Decreased 1% from 22% in 2015-16 to 21% in 2016-17 iii. Decreased 1% from 21% in 2016-17 to 20% in 2017-18
c. The percentage of students scoring “Acceptable” decreased 11% from 15% to 4% -- with annual fluctuations as follow:
i. Decreased 9% from 15% in 2014-15 to 6% in 2015-16 ii. Stayed the same at 6% between 2015-16 and 2016-17
iii. Decreased 2% from 6% in 2016-17 to 4% in 2017-18
The percentage of students scoring “Developing” and “Unacceptable” decreased from 3% in 2014-15 to 2% in 2017-18 (target = 10% or less)
a. The percentage of students scoring “Developing” decreased 1% from 2% to 1% -- with annual fluctuations as follow:
i. Stayed the same at 2% between 2014-15 and 2015-16 ii. Stayed the same at 2% between 2015-16 and 2016-17
iii. Decreased 1% from 2% to 1% between 2016-17 and 2017-18 b. The percentage of students scoring “Unacceptable” was 1% for both years – with
annual fluctuations as follow: i. Decreased 1% from 1% in 2014-15 to 0% in 2015-16
ii. Increased 1% from 0% in 2015-16 to 1% in 2016-17 iii. Stayed the same at 1% between 2016-17 and 2017-18

26
Writing organization (3) NOTE: initial targets based on 2014-15 performance; proposed targets based on 2015-16 performance The percentage of students scoring at the level of “Acceptable” and above met the current target of 95% or more; the percentage of students scoring at the level of “Developing” and “Unacceptable” met the current target of 10% or less; and the initial goal of having 65% or more score at a level of “Excellent” was also met. Proposed new targets: “Excellent” = 75% or more; “Acceptable” and above = 95% or more; “Developing” or “Unacceptable” = 5% or less
The percentage of students scoring “Acceptable” or above stayed the same at 99% (target = 95% or more)
a. The percentage of students scoring “Excellent” increased 8% from 68% to 76% (target = 65% or more) – with annual fluctuations as follow:
i. Increased 6% from 68% in 2014-15 to 74% in 2015-16 ii. Decreased 1% from 74% in 2015-16 to 73% in 2016-17
iii. Increased 3% from 73% in 2016-17 to 76% in 2017-18 b. The percentage of students scoring “Good” decreased 1% from 19% to 18% --
with annual fluctuations as follow: i. Increase of 2% from 19% in 2014-15 to 21% in 2015-16
ii. Decrease of 1% from 21% in 2015-16 to 20% in 2016-17 iii. Decrease of 2% from 20% in 2016-17 to 18% in 2017-18
c. The percentage of students scoring “Acceptable” decreased 7% from 12% to 5% -- with annual fluctuations as follow:
i. Decreased 8% from 12% in 2014-15 to 4% in 2015-16 ii. Stayed the same at 4% between 2015-16 and 2016-17
iii. Increased 1% from 4% in 2016-17 to 5% in 2017-18
The percentage of students scoring “Developing” and “Unacceptable” stayed the same at 1% (target = 10% or less)
a. The percentage of students scoring “Developing” stayed the same at 1%, with a 1% increase to 2% in 2016-17 and a 1% decrease back to 1% in 2017-18
b. The percentage of students scoring “Unacceptable” was 0% for both years – with an increase to 1% in 2016-17 and decrease back to 0% in 2017-18
Citations (4) NOTE: initial targets based on 2014-15 performance; proposed targets based on 2015-16 performance The percentage of students scoring at the level of “Acceptable” and above did not meet the current target of 90% or more; the percentage of students scoring at the level of “Developing”

27
and “Unacceptable” did not meet the current target of 10% or less; but the initial goal of having 40% or more score at a level of “Excellent” was exceeded. Proposed new targets: “Excellent” = 60% or more; “Acceptable” and above = 85% or more; “Developing” or “Unacceptable” = 15% or less
The percentage of students scoring “Acceptable” or above decreased 11% from 94% to 83% (target = 90% or more) – breakdown by category as follows:
a. The percentage of students scoring “Excellent” increased 5% from 38% to 61% (target = 40% or more) – with annual fluctuations as follow:
i. Increased from 38% in 2014-15 to 57% in 2015-16 ii. Increased 1% from 57% in 2015-16 to 58% in 2016-17
iii. Increased 3% from 58% in 2016-17 to 61% in 2017-18 b. The percentage of students scoring “Good” decreased 32% from 49% to 17% --
with annual fluctuations as follow: i. Decreased 30% from 49% in 2014-15 to 19% in 2015-16
ii. Decreased 3% from 19% in 2015-16 to 16% in 2016-17 iii. Increased 1% from 16% in 2016-17 to 18% in 2017-18
c. The percentage of students scoring “Acceptable” stayed the same at 7% -- with annual fluctuations as follow:
i. Increased 5% from 7% in 2014-15 to 12% in 2015-16 ii. Decreased 2% from 12% in 2015-16 to 10% in 2016-17
iii. Decreased 3% from 10% in 2016-17 to 7% in 2017-18
The percentage of students scoring “Developing” and “Unacceptable” increased 9% from 6% to 15% (target = 10% or less)
a. The percentage of students scoring “Developing” stayed the same at 5% -- with annual fluctuations as follow:
i. Decreased 2% from 5% in 2014-15 to 3% in 2015-16 ii. Increased 5% from 3% in 2015-16 to 8% in 2016-17
iii. Decreased 2% from 8% in 2016-17 to 5% in 2017-18 b. The percentage of students scoring “Unacceptable” increased from 1% in 2014-
15 to 10% in 2017-18 – with annual fluctuations as follow: i. Increased 8% from 1% in 2014-15 to 9% in 2015-16
ii. Decreased 1% from 9% in 2015-16 to 8% in 2016-17 iii. Increased 2% from 8% in 2016-17 to 10% in 2017-18
Critical Thinking (5) NOTE: initial targets based on 2014-15 performance; proposed targets based on 2015-16 performance The percentage of students scoring at the level of “Acceptable” and above met the current target of 95% or more; the percentage of students scoring at the level of “Developing” and

28
“Unacceptable” met the current target of 5% or less; but the initial goal of having 50% or more score at a level of “Excellent” was not met. Proposed new targets: “Excellent” = 60% or more; “Acceptable” and above = 95% or more; “Developing” or “Unacceptable” = 5% or less
The percentage of students scoring “Acceptable” or stayed the same at 96% (target = 95% or more) – with a breakdown as follows:
a. The percentage of students scoring “Excellent” increased 16% from 44% in 2014-15 to 60% in 2017-18 (target = 50% or more) – with annual fluctuations as follow:
i. Increased 11% from 44% in 2014-15 to 55% in 2015-16 ii. Increased 4% from 55% in 2015-16 to 59% in 2016-17
iii. Increased 1% from 59% in 2016-17 to 60% in 2017-18 b. The percentage of students scoring “Good” decreased 15% from 43% to 28% --
with annual fluctuations as follow: i. Decrease of 11% from 43% in 2014-15 to 32% in 2015-16
ii. Decreased 5% from 32% in 2015-16 to 27% in 2016-17 iii. Increased 1% from 27% in 2016-17 to 28% in 2017-18
c. The percentage of students scoring “Acceptable” decreased 1% from 9% to 8% -- with annual fluctuations as follow:
i. Increased 1% from 9% in 2014-15 to 10% in 2015-16 ii. Stayed the same between 2015-16 and 2016-17
iii. Decreased 2% from 10% in 2016-17 to 8% in 2017-18
The percentage of students scoring “Developing” and “Unacceptable” stayed the same at 4% (target = 5% or less)
a. The percentage of students scoring “Developing” stayed the same at 3%, with a decrease of 1% from 3% in 2014-15 to 2% in 2015-16 and an increase of 1% back to 3% in 2016-17
b. The percentage of students scoring “Unacceptable” stayed the same at 1% throughout
BUS 2910 Fundamentals of Project Management
Case Study (PSLOs: 1, 3, and 4) 2017-18 N = 189
1 2 3 4 5 6
Exceeds: 82% 72% 75% 67% 62% 63%
Meets: 16% 21% 19% 26% 15% 19%
Below: 1% 3% 4% 5% 4% 4%
Missing: 1% 4% 3% 2% 6% 2%

29
This was the initial administration of the Case Study as a DM of assessment. Additional data would be needed to provide a comparative analysis. Results: Indirect Measures of Student Learning First Destination Survey (2016-17) – knowledge rate = 56.0%; employment rate = 54.9%; related employment rate = 63.7%; employed at work experience site = 50.4%; salary summary = $36.037.38
Faculty course evaluations from Qualtrics:
MGT 1010 Introduction to Business – overall score: 3.25/5
Notes on concerns
o Lowest overall score on “Students seem to have the pre-requisite knowledge and
skills to succeed in this class”
o Requiring a research paper presented in APA format in a 1000-level course,
before they may have taken English Composition II
o Instructions for the comprehensive project are confusing
o Project parts are not easily integrated into a final product
o Lack of alignment between the level of mastery denoted in the SLOs and the
level of mastery required in the completion of the assessments
o Lack of alignment between the grading rubrics and the requirements of the
assessments
MGT 2210 Management Seminar – overall score: 3.25/5
Notes on concerns
o Lowest overall score on “Students seem to have the pre-requisite knowledge and
skills to succeed in this class”
o Text and other materials may be outdated
MKT 1110 Principles of Marketing – overall score: 3.45/5
Notes on concerns
o Lowest overall score on “Students seem to have the pre-requisite knowledge and
skills to succeed in this class”
o Requiring a research paper presented in APA format in a 1000-level course,
before they may have taken English Composition II
o Project part sequencing – part 3 should come later
o Project does not align with text

30
End-of-program survey
73% of respondents would recommend the program, while 27% would not. Scores did not
exceed 3.2/5. Lowest scoring areas are noted:
Math skills (2.6)
Technical skills (2.6)
Knowledge and skills required for the job (2.6)
Opportunities for interaction with professionals in the field (2.6)
Several comments regarding a lack of prompt feedback.
Results: Key Performance Indicators KPIs – excluding Faculty credentials, and course/instructor retention data (detail on following pages)
2013-14 2014-15 2015-16 2016-17 2017-18
Total New
Students 640 551
774 768
Total Registered
Students 2,073 1,437
1,798 1,503
Retention Rate 50% 59.7% 62.5% 55.4%
1st Year
Persistence Rate 33.4% 24.3%
19.1% 10.1%
Total Graduates 280 265 192 237
Graduation Rate 20.9% 20.3% 7.9% 18.1%
Employment Rate 54.9%
/Related
Employment Rate
63.7%
**Note: In 2016 we aligned our employment rate calculations with NACE so employment numbers will
vary from previous years for that year and beyond
Above data is a compilation of students matriculating in the AB: BA (current program); the AB: MGT, AB: MKT, AB: CSMGT (charts included below) Observations on KPIs for the review period:
1. Total new students increased 20.0% from 640 in 2013-14 to 768 in 2016-17 a. Decreased 13.9% from 640 in 2013-14 to 551 in 2014-15 b. Increased 40.5% from 551 in 2014-15 to 774 in 2015-16 c. Decreased 0.1% from 774 in 2015-16 to 768 in 2016-2017

31
2. Total registered students decreased 27.5% from 2,073 in 2013-14 to 1,503 in 2016-17 a. Decreased 30.7% from 2,073 in 2013-14 to 1,437 in 2014-15 b. Increased 25.1% from 1,437 in 2014-15 to 1,798 in 2015-16 c. Decreased 16.4% from 1,798 in 2015-16 to 1,503 in 2016-17
3. The retention rate decreased 5.4% from 50% in 2013-14 to 55.4% in 2016-17 a. Increased 9.7% from 50% in 2013-14 to 59.7% in 2014-15 b. Increased 2.8% from 59.7% in 2014-15 to 62.5% in 2015-16 c. Decreased 7.1% from 62.5% in 2015-16 to 55.4% in 2016-17
4. The persistence rate decreased 23.3% from 33.4% in 2013-14 to 10.1% in 2016-17 a. Decreased from 33.4% in 2013-14 to 24.3% in 2014-15 b. 24.3% to 19.1% c. 19.1% to 10.1%
5. The number of graduates decreased 15.4% from 280 in 2013-14 to 237 in 2016-17 a. Decreased 5.4% from 280 in 2013-14 to 265 in 2014-15 b. Decreased 31.3% from 265 in 2014-15 to 192 in 2015-16 c. Increased 23.4% from 192 in 2015-16 to 237 in 2016-17
6. The graduation rate decreased 2.8% from 20.9% in 2013-14 to 18.1% in 2016-17 a. Decreased 0.6% from 20.9% in 2013-14 to 20.3% in 2014-15 b. Decreased 12.4% from 20.3% in 2014-15 to 7.9% in 2015-16 c. 7.9% to 18.1%
7. In 2016-17, 54.9% of program graduates were employed, with 63.7% of those jobs related to their program of study.
AB: Business Administration
Academic Year
2013 – 2014 2014 – 2015 2015 – 2016 2016 – 2017 2017 – 2018
Total new students
523 517
Total registered students
799 1,156
Retention rate
56.3% 63.9%
1st year persistence rate
34.6% 28.4%
Total graduates
4 69
Graduation rate (100%)
0.7% 13.2%

32
Employment rate
Related employment rate
AB: CSMGT, MGT, and MGTO
Academic Year
2013 – 2014 2014 – 2015 2015 – 2016 2016 – 2017 2017 – 2018
Total new students
474 CSMGT 0
MGT 404 MGTO 74
424 CSMGT 2 MGT 372 MGTO 50
188 CSMGT 0 MGT 187 MGTO 1
5 CSMGT 0 MGT 5 MGTO 0
Total registered students
1,582 CSMGT 1 MGT 1,281 MGTO 300
1,310 CSMGT 2 MGT 1,085 MGTO 223
756 CSMGT 3 MGT 675 MGTO 78
260 CSMGT 1 MGT 235 MGTO 24
Retention rate
39.5% CSMGT 0.0% MGT 60.2% MGTO 58.3%
62.0% CSMGT 66.7% MGT 59.5% MGTO 59.8%
59.3% CSMGT 50.0% MGT 60.6% MGTO 67.4%
48.5% CSMGT 0.0% MGT 70.6% MGTO 75.0%
1st year persistence rate
20.9% CSMGT 0.0%
MGT 33.2% MGTO 29.4%
20.4% CSMGT 0.0% MGT 42.0% MGTO 61.5%
9.8% CSMGT 0.0% MGT 29.4% MGTO 0.0%
0.0% CSMGT 0.0% MGT 0.0% MGTO 0.0%
Total graduates
213 CSMGT 0 MGT 172 MGTO 41
200 CSMGT 1 MGT 61 MGTO 38
147 CSMGT 2 MGT 116 MGTO 29
130 CSMGT 1 MGT 113 MGTO 14
3
Graduation rate (100%)
17.5% CSMGT 17.4% MGT 20.5% MGTO 14.5%
21.2% CSMGT 13.0% MGT 24.3% MGTO 26.2%
9.8% CSMGT 0.0% MGT 20.1% MGTO 9.3%
24.8% CSMGT 33.3% MGT 16.2% MGTO 25.0%
Employment rate
Related employment rate

33
AB: MKT and MKTO
Academic Year
2013 – 2014 2014 – 2015 2015 – 2016 2016 – 2017 2017 – 2018
Total new students
166 MKT 129 MKTO 37
127 MKT 111 MKTO 16
63 MKT 63 MKTO 0
2 MKT 1 MKTO 1
Total registered students
491
MKT 406
MKTO 85
404 MKT 348 MKTO 56
243 MKT 230 MKTO 13
87 MKT 80 MKTO 7
Retention rate
60.5% MKT 62.3% MKTO 58.8%
57.4% MKT 65.1% MKTO 49.6%
71.9% MKT 62.6% MKTO 81.3%
53.7% MKT 74.1% MKTO 33.3%
1st year persistence rate
45.8% MKT 46.1% MKTO 45.5%
28.2% MKT 39.7% MKTO 16.7%
21.7% MKT 43.4% MKTO 0.0%
0.0% MKT 0.0% MKTO 0.0%
Total graduates
67 MKT 55 MKTO 12
65 MKT 58 MKTO 7
41 MKT 36 MKTO 5
38 MKT 35 MKTO 3
Graduation rate (100%)
24.3% MKT 28.6% MKTO 20.0%
19.4% MKT 24.4% MKTO 14.3%
12.7% MKT 25.4% MKTO 0.0%
16.3% MKT 23.4% MKTO 9.1%
Employment rate
Related employment rate

1
Annual Assessment Plan
Program: Bachelor of Business Administrated: Accelerated College Of: Business Name of person submitting: Dr. Amy Sue DeSonia, CPA Year: 2017-18
Continuous Improvement Action Plan
Improvement Goal #1: Ensure curricular alignment with industry needs and standards and
proper sequencing of courses.
1. Areas for improvement:
a. Determine appropriate industry standards and align SLOs
b. Determine appropriate sequencing of courses
2. Evidence of need for improvement:
a. Students able to take programmatic core courses without having taken
introductory or foundational courses
b. Students not appropriately prepared for programmatic core coursework
c. Lack of “major” area of emphasis
3. Strategy:
a. Review sequencing for appropriate progression –
i. Ensure that pre-req “elective” core is completed prior to enrollment in
programmatic core
ii. consider making BUS 3110 a pre-requisite for BUS 3710; try to ensure
that BUS 4310 is the last course taken so that students are better
prepared for an end-of-program DM
4. Expected results and metrics:
a. Improved performance on both formative and summative assessments
Improvement Goal #2: Ensure that DM assessments align with both course and programmatic outcomes at the correct level of mastery.
1. Areas for improvement:
a. Increasing performance on all formative and summative assessments
b. Assurance that DM assessments are appropriate – (1) are they aligned with both
course and programmatic outcomes; (2) are they testing at the appropriate
levels of mastery?

2
c. Inter-rater reliability on all DM assessment rubrics
d. Increasing performance levels on DMs
e. Using data for decision-making
f. Ensuring appropriate formative assessment is in place, and an opportunity for
remediation or course/content revision is viable
2. Evidence of need for improvement:
a. DM assessments not in place for: finance; human resources; international
business; or marketing strategy
b. Peregrine exam scores in some areas
3. Strategy:
a. Review placement of Peregrine exam – put measures in place to ensure that
students have completed all of the other program core courses
b. Review grading rubrics and perform tests of inter-rater reliability
c. Review DM instructions for clarity
d. Set benchmarks and improvement targets for performance categories
e. Review areas of low performance for evidence of the need for remediation or
other intervention
f. Review performance on formative assessments in courses preceding the
capstone in the areas identified for performance improvement
4. Expected results and metrics:
a. Improved performance measurements – both formative and summative
b. Ability to develop plans for early remediation or intervention
c. Development of formative assessments as DMs in areas of concern
d. Improvements in student performance on both DMs and formative assessments
Improvement Goal #3: Work with external partners to improve transfer pathways.
1. Areas for improvement:
a. Options for majors
b. Increasing new enrollments
c. Improving persistence, retention, and completion/graduation rates
d. Considering a 5-year Master’s degree pathway?
2. Evidence of need for improvement:
a. First destination survey results indicate high related employment, generous
salary
b. KPI comparative analysis shows strong performance in the areas of new
enrollments, as well as persistence, retention, and graduation/completions

3
3. Strategy:
a. Work with internal and external partners to identify and implement “best
practices” in recruitment and retention
i. Continue to increase opportunities for articulation and credit for prior
learning
ii. Continue to encourage students to take advantage of opportunities for
credit for prior learning (portfolio preparation)
iii. Expand transfer agreements
b. Develop major pathways
c. Explore 5-year Master’s pathway
4. Expected results and metrics:
a. Increases in new student enrollment
b. Increases in retention, 1st year persistence, and graduation/completion rates
OVERVIEW OF STUDENT LEARNING OUTCOMES: BROAD-BASED STUDENT LEARNING OUTCOMES: COLLEGE OF BUSINESS
1. BBSLO 1. Students will acquire the relevant disciplinary knowledge and competencies appropriate to their programs of study.
2. BBSLO 2. Students will demonstrate behaviors and attitudes that promote success in the workplace.
3. BBSLO 3. Students will demonstrate effective communication (both written and oral), including the use of technology, in various environment and situations.
4. BBSLO 4. Students will acquire critical thinking skills including analysis and synthesis both within the career field and for the purpose of life-long learning.
5. BBSLO 5. Students will acquire relevant knowledge, which includes an understanding of cultural, social, political, and global issues.
6. BBSLO 6. Students will acquire the knowledge and demonstrate the ability to follow and support the ethical standards of their profession.
PROGRAMMATIC OUTCOMES
1. PSLO 1. Students will be able to distinguish between management and leadership and apply the principles and best practices of each as appropriate. (associated broad-based SLOs: 1, 4, 5, and 6)
2. PSLO 2. Students will be able to demonstrate practical knowledge of the functional areas of business, including: accounting, marketing, finance, and human resources, and the interrelationship among them. (associated broad-based SLOs: 1, 4)

4
3. PSLO 3. Students will be able to analyze and evaluate the environment in which business operates, and the role each component of the environment plays in strategy development, decision-making, and day-to-day operations. (associated broad-based SLOs: 2, 4)
4. PSLO 4. Students will be able to analyze, interpret, and manage financial and operational data and information. (associated broad-based SLOs: 1, 4)
5. PSLO 5. Students will be able to identify, evaluate, and discuss practical resolutions to ethical dilemmas and issues of corporate social responsibility. (associated broad-based SLOs: 5, 6)
6. PSLO 6. Students will be able to formulate and implement strategic objectives that enhance organizational effectiveness and operational performance. (associated broad-based SLOs: 3, 4)
DATA COLLECTION AND ANALYSIS:
Summary of major findings Direct measures of assessment reviewed: BUS 3110 Accounting for Managers – first year administration, base-line data (also should note that course focus and content was changed in Fall 2017 as was the DM) BUS 4310 Management Strategy – first year administration, base-line data FIN 1010 Personal Finance – Project, Part V MGT 1010 Introduction to Business MKT 1110 Principles of Marketing NOTES: There are areas that indicate the need for further review: rubric clarity and inter-rater reliability; alignment of assessments with SLOs at the appropriate level of mastery Performance improvement targets were met for all of the areas being assessed on the FIN 1010 Personal Finance DM for the period under review. Indirect measures of assessment reviewed: First Destination Survey (2016-17) – knowledge rate = 41.8%; employment rate = 81.3%; related employment rate = 63.5%; employed at work experience site = 9.5%; salary summary = $47,344.72 WRK Supervisor evaluation – N/A as a work experience is not a program requirement. Faculty course evaluations were reviewed for all of the following courses:
BUS 3110 Accounting for Managers

5
o N = 1 o Overall grade = ¾ o No comments were provided, but all areas scored 100%
BUS 3710 o N = 3 o Overall grade = 3.67/4 o Lower overall scores on the following items: even distribution of assignments
throughout course; scaffolding; student preparation for course; opportunities for promotion of student-student interaction; alignment of assessments with SLOs; clarity of rubrics; rubrics designed to allow substantive feedback
BUS 4010 International Business o N = 1 o Overall grade = 4/4 o All elements scored at 100% o No comments
BUS 4110 Human Resources and Employment Law o N = 2 o Overall grade = 2.5/4 o Low scores in all areas: even distribution of assignments throughout the course;
scaffolding; student preparation for the course; opportunities for promotion of student-student and/or instructor-student interaction; alignment of assessments with SLOs; promotion of high expectations for student learning; support of diverse ways of learning; lack of formative assessment
o Comments on heavy workload for students and “busywork”
BUS 4210 Marketing Strategy o N = 1 o Overall grade = 3/4 o Low scores on the following: even distribution of assignments; clarity of
instructions for the research project
BUS 4310 Strategic Management o N=4 o Overall grade = 4/4 o Low scores on the following: student preparation for the course; clarity of
instructions for assessments; even distribution of assignments throughout the course
End-of-program survey
N = 45. 91% of respondents would recommend the program, while 9% would not. Scores did
not exceed 3.6/4. Scores as noted:

6
Courses in the program encouraged me to question ideas and concepts (3.5)
Courses were appropriately sequenced (3.5)
Adequacy of available supporting resources (3.6)
Internship was a valuable component (3.5) – not a required component, perhaps they
are referring to their experiences at work?
Interaction with professionals in the field (2.6)
Program requirements clearly stated in published materials (3.6)
Adequacy of technology and equipment (3.6)
Relevant content (3.4)
Adequate preparation for internship (3.4) – again, not a required component
Currency of program design (3.3)
Preparation for:
Employment or promotion (3.2)
Fundamental technological skills (3.4)
Critical thinking (3.0)
Customer service (2.6)
Global/cultural diversity (2.8)
Human relations/interpersonal skills (2.7)
Information literacy (2.7)
Available services:
Academic advising (3.2)
Tutoring and learning support (3.5)
KPIs reviewed: (summary 2013-14 to 2016-17 – detail included later in the report)
1. Total new students has increased from 106 in 2013-14 to 350 in 2016-17 2. Total registered students has increased from 476 in 2013-14 to 1,596 in 2016-17 3. The retention rate decreased from 76.3% in 2013-14 to 68.1% in 2016-17 4. The persistence rate decreased from 56.9% in 2013-14 to 43.1% in 2016-17 5. The number of graduates increased from 90 in 2013-14 to 407 in 2016-17 6. The graduation rate increased from 65.6% in 2013-14 to 68.2% in 2016-17
Progress Report on Previous Continuous Improvement Action Plan

7
Course conversion for semesters completed for delivery beginning in the Fall of 2017. Base report submitted in 2014-15 did not include an improvement plan.
1. Results: Direct Measures of Student Learning As of academic year 2017-18 -- there are Direct Measures of Assessment in both of the following courses – the results of which are included below:
BUS 3110 Accounting for Managers – Comprehensive Case
BUS 4310 Management Strategy -- Comprehensive Case Because these are base-year DMs – there is no comparative analysis. Also – the content and focus of BUS 3110 Accounting for Managers was revised during the Fall of 2017 with delivery of the new course beginning online in Spring 2018 and on-ground in Fall 2018. As a result, new elements were added to the Comprehensive Case. BUS 3110 Comprehensive Case – Problem Section The grading rubric covers all of the following elements:
Vertical analysis of the income statement
Significant trends identified in vertical analysis of the income statement
Calculation of liquidity ratios
Calculation of asset management ratios
Calculation of the debt management ratios
Vertical analysis of the balance sheet
Significant trends identified in vertical analysis of the balance sheet
Horizontal analysis of the income statement
Significant trends identified in horizontal analysis of the income statement
Horizontal analysis of the balance sheet
Significant trends identified in horizontal analysis of the balance sheet
Calculation of profitability ratios
Calculation of market value ratios 2017-18
Average: 1 2 3 4 5 6 7 8 9 10 11 12 13
Proficient (3) 55% 71% 75% 65% 73% 73% 71% 68% 40% 43% 47% 43% 61%
Competent (2) 33% 18% 13% 21% 22% 15% 18% 18% 48% 41% 42% 42% 27%
Novice (1) 13% 12% 13% 14% 5% 13% 12% 14% 12% 16% 11% 15% 12%

8
BUS 3110 Analytic Report – Comprehensive Case The grading rubric covers all of the following elements:
Evaluation of results from Section 2
Evaluation of results from Section 3
Evaluation of results from Section 4
Organization and formatting
Writing mechanics 2017-18
Average: 1 2 3 4 5
Exceeds Expectations (4) 17% 16% 19% 22% 13%
Meets Expectations (3) 13% 14% 13% 10% 2%
Below Expectations (2) 8% 27% 21% 6% 14%
Section Missing (1) 62% 43% 48% 62% 71%
BUS 4310 Comprehensive Case The grading rubric covers the following elements:
Overview and mission of company
Internal and external environment
Citations
Critical thinking
Additional internal and external environmental analysis
Implications for strategy
Goals and long-term objectives
Strategy selection
Recommendations and implications
Appendices
Writing mechanics
Writing organization
Average: 1 2 3 4 5 6 7 8 9 10 11 12
Exceeds Expectations (4) 90% 83% 74% 74% 70% 82% 69% 74% 75% 73% 75% 82%
Meets Expectations (3) 1% 1% 2% 2% 2% 1% 1% 2% 2% 2% 2% 0%
Below Expectations (2) 2% 4% 7% 5% 8% 2% 10% 6% 7% 7% 9% 9%
Section Missing (1) 0% 1% 2% 2% 6% 1% 6% 3% 2% 2% 1% 4%
Average: 1 2 3 4 5 6 7 8 9 10 11 12

9
Excellent (5) 67% 69% 62% 56% 59% 62% 67% 54% 49% 64% 44% 64%
Good (4) 26% 23% 21% 31% 23% 21% 23% 5% 41% 28% 26% 26%
Acceptable (3) 8% 8% 10% 8% 10% 10% 5% 5% 8% 8% 5% 3%
Developing (2) 0% 0% 5% 0% 0% 3% 0% 33% 3% 0% 23% 3%
Unacceptable (1) 0% 0% 3% 5% 8% 5% 5% 3% 0% 0% 3% 5%
Direct Measures of Assessment are included in all of the following pre-requisite core courses – these results were reviewed in the Assessment Report for the AB: BA (Associate of Business: Business Administration) program and included as an Appendix to this report:
FIN 1010 Personal Finance o Financial Plan Project, Part V
MGT 1010 Introduction to Business o Business Project, Part IV
MKT 1110 Principles of Marketing o Marketing Project, Part IV
In addition – students take the Peregrine end-of-program examination in BUS 4310 Management Strategy. FIN 1010 Personal Finance
Financial Plan Project, Part V (PSLOs: #1, and #4) The grading rubric addresses the following elements:
1. Plan integration/consolidation 2. Critical thinking 3. Writing mechanics 4. Citations
The N for each year under review is as follows:
1. 2015-16 N = 1,126 2. 2016-17 N = 1,114 3. 2017-18 N = 577
Table 1.1 2014-15 (Base year)
N 267
Average: 1 2 3 4
Excellent (3) 54% 53% 67% 47%

10
Competent (2) 37% 29% 27% 18%
Unacceptable (1) 9% 18% 6% 35%
100% 100% 100% 100%
Table 1.2 2015-16
N 1126
Average: 1 2 3 4
Excellent (3) 53% 55% 66% 50%
Competent (2) 41% 33% 31% 20%
Unacceptable (1) 6% 12% 3% 30%
100% 100% 100% 100%
Table 1.3 2016-17
N 1114
Average: 1 2 3 4
Excellent (3) 57% 54% 69% 54%
Competent (2) 37% 30% 26% 20%
Unacceptable (1) 6% 16% 5% 26%
100% 100% 100% 100%
Table 1.4 2017-18
N 577
Average: 1 2 3 4
Excellent (3) 60% 60% 71% 60%
Competent (2) 34% 24% 27% 16%
Unacceptable (1) 6% 16% 2% 24%
100% 100% 100% 100%

11
Summary for this assessment Overall – there are no major areas of concern. Plan integration/consolidation (1) NOTE: targets based on 2014-15 performance; proposed targets based on 2017-18 performance The percentage of students scoring at the level of “Competent” and above met the current target of 90% or more, and the percentage of students scoring at the level of “Unacceptable” met the current target of 10% or less. In addition, the current goal of having 60% or more score at a level of “Excellent” was also met. Proposed new targets – “Excellent” = 65% or more; “Competent” and above = 95% or more; “Unacceptable” = 5% or less
1. The percentage of students scoring “Competent” and above has increased 3% from 91% in 2014-15 to 94% in 2017-18 (target = 90% or more)
a. The percentage of students scoring at the level of “Excellent” has increased 6% from 54% in 2014-15 to 60% in 2017-18 (target = 70% or more)
i. Decreased 1% between 2014-15 and 2015-16 from 54% to 53% ii. Increased 4% between 2015-16 and 2016-17 from 53% to 57%
iii. Increased 3% between 2016-17 and 2017-18 from 57% to 60% b. The percentage of students scoring at the level of “Competent” has decreased
3% from 37% in 2014-15 to 34% in 2017-18 i. Increased 4% between 2014-15 and 2015-16 from 37% to 41%
ii. Decreased 4% between 2015-16 and 2016-17 from 41% to 37% iii. Decreased 3% between 2016-17 and 2017-18 from 37% to 34%
2. The percentage of students scoring at the level of “Unacceptable” has decreased 3% from 9% in 2014-15 to 6% in 2017-18 (target = 10% or less)
a. Decreased 3% between 2014-15 and 2015-16 – from 9% to 6% b. Remained at 6% for the other periods
Critical thinking (2) NOTE: initial targets based on 2014-15 performance; proposed targets based on 2017-18 performance The percentage of students scoring at the level of “Competent” and above met the current target of 80% or more; and the current goal of having 60% or more score at a level of “Excellent was also met. However, the percentage of students scoring at the level of “Unacceptable” did not meet the initial target of 15% or less.

12
Proposed new targets: “Excellent” = 65% or more; “Competent” and above = 85% or more; “Unacceptable” = 15% or less
1. The percentage of students scoring at the level of “Competent” and above has increased 2% from 82% in 2014-15 to 84% in 2017-18 (target = 80% or more)
a. The percentage of students scoring at the level of “Excellent” has increased 7% from 53% in 2014-15 to 60% in 2017-18 (target = 60% or more)
i. Increased 2% between 2014-15 and 2015-16 from 53% to 55% ii. Decreased 1% between 2015-16 and 2016-17 from 55% to 54%
iii. Increased 6% between 2016-17 and 2017-18 from 54% to 60% b. The percentage of students scoring at the level of “Competent” has decreased
5% from 29% in 2014-15 to 24% in 2017-18 i. Increased 4% between 2014-15 and 2015-16 from 29% to 33%
ii. Decreased 3% between 2015-16 and 2016-17 from 33% to 30% iii. Decreased 6% between 2016-17 and 2017-18 from 30% to 24%
2. The percentage of students scoring at the level of “Unacceptable” has decreased 2% from 18% in 2014-15 to 16% in 2017-18 (target = 15% or less)
a. Decreased 6% between 2014-15 and 2015-16 from 18% to 12% b. Increased 4% between 2015-16 and 2016-17 from 12% to 16% c. Stayed the same between 2016-17 and 2017-18 at 16%
Writing mechanics (3) NOTE: initial targets based on 2014-15 performance; proposed targets based on 2017-18 performance The percentage of students scoring at the level of “Competent” and above met the current target of 90% or more; the percentage of students scoring at the level of “Unacceptable” met the current target of 5% or less; and the current goal of having 70% or more score at a level of “Excellent” was also met. Proposed new targets: “Excellent” = 75% or more; “Competent” or above = 95% or above; “Unacceptable” = 5% or below
1. The percentage of students scoring at the level of “Competent” or above has increased 4% from 94% in 2014-15 to 98% in 2017-18 (target = 90% or more)
a. The percentage of students scoring at the level of “Excellent” has increased 4% from 67% in 2014-15 to 71% in 2017-18 (target = 70% or more)
i. Decreased 1% between 2014-15 and 2015-16 from 67% to 66% ii. Increased 3% between 2015-16 and 2016-17 from 66% to 69%
iii. Increased 2% between 2016-17 and 2017-18 from 69% to 71% b. The percentage of students scoring at the level of “Competent” has remained
the same at 27% in 2014-15 and 27% in 2017-18

13
i. Increased 4% between 2014-15 and 2015-16 from 27% to 31% ii. Decreased 5% between 2015-16 and 2016-17 from 31% to 26%
iii. Increased 1% between 2016-17 and 2017-18 from 26% to 27% 2. The percentage of students scoring at the level of “Unacceptable” has decreased 4%
from 6% in 2014-15 to 2% in 2017-18 (target = 5% or less) a. Decreased 3% between 2014-15 and 2015-16 from 6% to 3% b. Increased 2% between 2015-16 and 2016-17 from 3% to 5% c. Decreased 3% between 2016-17 and 2017-18 from 5% to 2%
Citations (4) NOTE: initial targets based on 2014-15 performance; proposed targets based on 2017-18 performance The percentage of students scoring at the level of “Competent” and above met the current target of 70% or more; the percentage of students scoring at the level of “Unacceptable” met the current target of 30% or less; and the initial goal of having 50% or more score at a level of “Excellent” was also met. Proposed new targets: “Excellent” = 65% or more; “Competent” and above = 75% or more; “Unacceptable” = 25% or less
1. The percentage of students scoring at the level of “Competent” and above has increased 12% from 65% in 2014-15 to 76% in 2017-18 (target = 70% or above)
a. The percentage of students scoring at the level of “Excellent” increased 13% from 47% in 2014-15 to 60% in 2017-18 (target = 50% or above)
i. Increased 3% between 2014-15 and 2015-16 from 47% to 50% ii. Increased 4% between 2015-16 and 2016-17 from 50% to 54%
iii. Increased 6% between 2016-17 and 2017-18 from 54% to 60% b. The percentage of students scoring at the level of “Competent” decreased 2%
from 18% in 2014-15 to 16% in 2017-18 i. Increased 2% between 2014-15 and 2015-16 from 18% to 20%
ii. Stayed the same between 2015-16 and 2016-17 iii. Decreased 4% between 2016-17 and 2017-18 from 20% to 16%
2. The percentage of students scoring at the level of “Unacceptable” has decreased 11% from 35% in 2014-15 to 24% in 2017-18 (target = 30% or less)
a. Decreased 5% between 2014-15 and 2015-16 from 35% to 30% b. Decreased 4% between 2015-16 and 2016-17 from 30% to 26% c. Decreased 2% between 2016-17 and 2017-18 from 26% to 24%
MGT 1010 Introduction to Business
Business Project, Part IV (PSLOs: 1, 3, and 4)

14
The grading rubric addresses the following elements:
1. Required elements 2. Writing mechanics 3. Writing organization 4. Citations 5. Critical thinking
The N for each year under review is as follows:
2014-15 N = 158
2015-16 N = 1,000
Table 2.1 2014-15
1 2 3 4 5
Excellent 59% 57% 65% 47% 58%
Good 20% 23% 17% 12% 19%
Acceptable 11% 15% 13% 16% 15%
Developing 7% 5% 5% 11% 5%
Unacceptable 3% 0% 0% 14% 3%
100% 100% 100% 100% 100%
Table 2.2 2015-16
N 1000
1 2 3 4 5
Excellent 65% 64% 73% 52% 58%
Good 20% 25% 19% 20% 26%
Acceptable 9% 8% 7% 11% 11%
Developing 5% 3% 1% 10% 4%
Unacceptable 1% 0% 0% 7% 1%
100% 100% 100% 100% 100%
NOTE: data was only available for 2014-15 and 2015-16
Summary for this assessment

15
Overall – no major areas of concern. However, the scores may indicate the need for tests of inter-rater reliability and review/revision of the grading rubric. Required elements (1) NOTE: targets based on 2014-15 performance; proposed targets based on 2015-16 performance The percentage of students scoring at the level of “Acceptable” and above met the current target of 90% or more; the percentage of students scoring at the level of “Developing” and “Unacceptable” met the current target of 10% or less; and the initial goal of having 60% or more score at a level of “Excellent” was also met. Proposed new targets: “Excellent” = 65% or more; “Acceptable” and above = 95% or more; “Developing” or “Unacceptable” = 5% or less
The percentage of students scoring “Acceptable” or above increased 4% from 90% to 94% (target = 90% or more)
a. The percentage of students scoring “Excellent” increased 6% from 59% to 65% (target = 60% or more)
b. The percentage of students scoring “Good” stayed the same at 20% c. The percentage of students scoring “Acceptable” decreased 2% from 11% to 9%
The percentage of students scoring “Developing” and “Unacceptable” decreased 4% from 10% to 6% (target = 10% or less)
a. The percentage of students scoring “Developing” decreased 2% from 7% to 5% b. The percentage of students scoring “Unacceptable” decreased 2% from 3% to 1%
Writing mechanics (2) NOTE: initial targets based on 2014-15 performance; proposed targets based on 2015-16 performance The percentage of students scoring at the level of “Acceptable” and above met the current target of 95% or more; the percentage of students scoring at the level of “Developing” and “Unacceptable” met the current target of 10% or less; and the initial goal of having 60% or more score at a level of “Excellent” was also met. Proposed new targets: “Excellent” = 65% or more; “Acceptable” and above = 95% or more; “Developing” or “Unacceptable” = 5% or less
The percentage of students scoring “Acceptable” or above increased 2% from 95% to 97% (target = 95% or more)

16
a. The percentage of students scoring “Excellent” increased 7% from 57% to 64% (target = 60% or more)
b. The percentage of students scoring “Good” increased 2% from 23% to 25% c. The percentage of students scoring “Acceptable” decreased 7% from 15% to 8%
The percentage of students scoring “Developing” and “Unacceptable” decreased 4% from 10% to 6% (target = 10% or less)
a. The percentage of students scoring “Developing” decreased 2% from 5% to 3% b. The percentage of students scoring “Unacceptable” was 0% for both years
Writing organization (3) NOTE: initial targets based on 2014-15 performance; proposed targets based on 2015-16 performance The percentage of students scoring at the level of “Acceptable” and above met the current target of 95% or more; the percentage of students scoring at the level of “Developing” and “Unacceptable” met the current target of 10% or less; and the initial goal of having 65% or more score at a level of “Excellent” was also met. Proposed new targets: “Excellent” = 65% or more; “Acceptable” and above = 95% or more; “Developing” or “Unacceptable” = 5% or less
The percentage of students scoring “Acceptable” or above increased 4% from 95% to 99% (target = 95% or more)
a. The percentage of students scoring “Excellent” increased 8% from 64% to 73% (target = 65% or more)
b. The percentage of students scoring “Good” increased 2% from 17% to 19% c. The percentage of students scoring “Acceptable” decreased 7% from 15% to 8%
The percentage of students scoring “Developing” and “Unacceptable” decreased 2% from 5% to 3% (target = 10% or less)
a. The percentage of students scoring “Developing” decreased 2% from 5% to 3% b. The percentage of students scoring “Unacceptable” was 0% for both years
Citations (4) NOTE: initial targets based on 2014-15 performance; proposed targets based on 2015-16 performance The percentage of students scoring at the level of “Acceptable” and above met the current target of 75% or more; the percentage of students scoring at the level of “Developing” and “Unacceptable” met the current target of 25% or less; and the initial goal of having 50% or more score at a level of “Excellent” was also met. Proposed new targets: “Excellent” = 55% or more; “Acceptable” and above = 85% or more;

17
“Developing” or “Unacceptable” = 15% or less
The percentage of students scoring “Acceptable” or above increased 8% from 75% to 83% (target = 75% or more)
a. The percentage of students scoring “Excellent” increased 5% from 47% to 52% (target = 50% or more)
b. The percentage of students scoring “Good” increased 8% from 12% to 20% c. The percentage of students scoring “Acceptable” decreased 5% from 16% to 11%
The percentage of students scoring “Developing” and “Unacceptable” decreased 2% from 5% to 3% (target = 25% or less)
a. The percentage of students scoring “Developing” decreased 2% from 5% to 3% b. The percentage of students scoring “Unacceptable” was 0% for both years
Critical Thinking (5) NOTE: initial targets based on 2014-15 performance; proposed targets based on 2015-16 performance The percentage of students scoring at the level of “Acceptable” and above met the current target of 95% or more; the percentage of students scoring at the level of “Developing” and “Unacceptable” met the current target of 5% or less; but the initial goal of having 60% or more score at a level of “Excellent” was not met. Proposed new targets: “Excellent” = 60% or more; “Acceptable” and above = 95% or more; “Developing” or “Unacceptable” = 5% or less
The percentage of students scoring “Acceptable” or above increased 3% from 92% to 95% (target = 95% or more)
a. The percentage of students scoring “Excellent” stayed the same at 58% (target = 60% or more)
b. The percentage of students scoring “Good” increased 7% from 19% to 26% c. The percentage of students scoring “Acceptable” decreased 4% from 14% to 11%
The percentage of students scoring “Developing” and “Unacceptable” decreased 3% from 8% to 5% (target = 5% or less)
a. The percentage of students scoring “Developing” decreased 1% from 5% to 4% b. The percentage of students scoring “Unacceptable” decreased 2% from 3% to 1%
2. Results: Indirect Measures of Student Learning
First Destination Survey (2016-17) – knowledge rate = 41.8%; employment rate = 81.3%; related employment rate = 63.5%; employed at work experience site = 9.5%; salary summary = $47,344.72

18
WRK Supervisor evaluation – N/A as a work experience is not a program requirement. Faculty course evaluations were reviewed for all of the following courses:
BUS 3110 Accounting for Managers o N = 1 o Overall grade = ¾ o No comments were provided, but all areas scored 100%
BUS 3710 o N = 3 o Overall grade = 3.67/4 o Lower overall scores on the following items: even distribution of assignments
throughout course; scaffolding; student preparation for course; opportunities for promotion of student-student interaction; alignment of assessments with SLOs; clarity of rubrics; rubrics designed to allow substantive feedback
BUS 4010 International Business o N = 1 o Overall grade = 4/4 o All elements scored at 100% o No comments
BUS 4110 Human Resources and Employment Law o N = 2 o Overall grade = 2.5/4 o Low scores in all areas: even distribution of assignments throughout the course;
scaffolding; student preparation for the course; opportunities for promotion of student-student and/or instructor-student interaction; alignment of assessments with SLOs; promotion of high expectations for student learning; support of diverse ways of learning; lack of formative assessment
o Comments on heavy workload for students and “busywork”
BUS 4210 Marketing Strategy o N = 1 o Overall grade = 3/4 o Low scores on the following: even distribution of assignments; clarity of
instructions for the research project
BUS 4310 Strategic Management o N=4 o Overall grade = 4/4 o Low scores on the following: student preparation for the course; clarity of
instructions for assessments; even distribution of assignments throughout the course

19
End-of-program survey
N = 45. 91% of respondents would recommend the program, while 9% would not. Scores did
not exceed 3.6/4. Scores as noted:
Courses in the program encouraged me to question ideas and concepts (3.5)
Courses were appropriately sequenced (3.5)
Adequacy of available supporting resources (3.6)
Internship was a valuable component (3.5) – not a required component, perhaps they
are referring to their experiences at work?
Interaction with professionals in the field (2.6)
Program requirements clearly stated in published materials (3.6)
Adequacy of technology and equipment (3.6)
Relevant content (3.4)
Adequate preparation for internship (3.4) – again, not a required component
Currency of program design (3.3)
Preparation for:
Employment or promotion (3.2)
Fundamental technological skills (3.4)
Critical thinking (3.0)
Customer service (2.6)
Global/cultural diversity (2.8)
Human relations/interpersonal skills (2.7)
Information literacy (2.7)
Available services:
Academic advising (3.2)
Tutoring and learning support (3.5)

20
3. Results: Key Performance Indicators
2013-14 2014-15 2015-16 2016-17 2017-18
Total New
Students 106 374
446 350
Total Registered
Students 476 1,060
1,564 1,596
Retention Rate 76.3% 69.9% 71.5% 68.1%
1st Year
Persistence Rate 56.9% 54.0%
77.6% 43.1%
Total Graduates 90 136 217 407
Graduation Rate 65.6% 54.1% 59.3% 68.2%
Employment Rate 81.3%
Related
Employment Rate
63.5%
**Note: In 2016 we aligned our employment rate calculations with NACE so employment numbers will
vary from previous years for that year and beyond
Observations on KPIs for the period under review:
7. Total new students has increased from 106 in 2013-14 to 350 in 2016-17 a. Increased between 2013-14 and 2014-15 from 106 to 374 (252.8% increase) b. Increased between 2014-15 and 2015-16 from 374 to 446 (19.3% increase) c. Decreased between 2015-16 and 2016-17 from 446 to 350 (21.5% decrease)
8. Total registered students has increased from 476 in 2013-14 to 1,596 in 2016-17 a. Increased between 2013-14 and 2014-15 from 476 to 1,060 (122.7% increase) b. Increased between 2014-15 and 2015-16 from 1,060 to 1,564 (47.5% increase) c. Increased slightly between 2015-16 and 2016-16 from 1,564 to 1,596 (1.9%
increase) 9. The retention rate decreased from 76.3% in 2013-14 to 68.1% in 2016-17
a. Decreased between 2013-14 and 2014-15 from 76.3% to 69.9% (6.6% decrease) b. Increased between 2014-15 and 2015-16 from 69.9% to 71.5% (1.6% increase) c. Decreased between 2015-16 and 2016-17 from 71.5% to 68.1% (3.4% decrease)
10. The persistence rate decreased from 56.9% in 2013-14 to 43.1% in 2016-17 a. Decreased between 2013-14 and 2014-15 from 56.9% to 54.0% b. Increased between 2014-15 and 2015-16 from 54.0% to 77.6% c. Decreased between 2015-16 and 2016-17 from 77.6% to 43.1%
11. The number of graduates increased from 90 in 2013-14 to 407 in 2016-17

21
a. Increased between 2013-14 and 2014-15 from 90 to 136 b. Increased between 2014-15 and 2015-16 from 136 to 217 c. Increased between 2015-16 and 2016-17 from 217 to 407
12. The graduation rate increased from 65.6% in 2013-14 to 68.2% in 2016-17 a. Decreased between 2013-14 and 2014-15 from 65.6% to 54.1% b. Increased between 2014-15 and 2015-16 from 54.1% to 59.3% c. Increased between 2015-16 and 2016-17 from 59.3% to 68.2%
13. In 2016-17, 81.3% of graduates were employed, with 63.5% of the jobs being related to the field of study.

ADI
Assessment Report and Process Overview
The ADI and programs under the auspices of the ADI umbrella embraces a philosophy of continuous quality improvement and requires program directors in each discipline to implement formative and summative evaluations to ensure the stated mission and program goals are aligned with the ASE Education Foundation requirements. Additionally, direct measure results from I-CAR for the Auto Body program and the American Welding Society (AWS) practical exams results are also included. The ADI program assessment process is designed to evaluate data from 3 areas: 1) Direct measures of student learning outcome, 2) indirect measures and 3) key performance indicators.
Faculty members, in collaboration with instructional designers are responsible for developing standardized assessment materials to be used within courses for both formative and summative evaluation. Authentic assessment materials are designed to evaluate student capabilities as they relate to program and institutional outcomes. These standardized assessments become a part of each course and provide positive feedback for both students and faculty. The assessment materials are designed to support faculty members in their classrooms and provide students detailed feedback on performance as it related to student learning outcomes.
In addition to the direct measures, data are collected using indirect measures, including surveys of program graduates, employer surveys, and/or accrediting agency reports. This data is combined with direct measures to complete the assessment data set.
The following are Key Performance Indicators (KPIs) for evaluating the success of the ADI technical programs:
- Graduation Rates - Employment rates of Graduates - Faculty Credentials
These KPIs provide data for analysis and evaluation on metrics beyond teaching and learning. These metrics provide the primary operational data necessary for evaluating the stability of the program as well as for planning, budgeting, high level assessment of operation, and how the program contributed to the mission and guiding principles of the institution.
Annually, the program administrator has the responsibility of compiling the data, discussing and analyzing the data and collaboratively developing a continuous improvement plan. The continuous improvement plan is designed to identify the steps necessary for improving student learning. To address specific findings, the plan may include identifying actions such as redevelopment of a course, seeking additional data to clarify student achievement, or identifying adjustments to teaching strategies for meeting student learning outcomes. Results and analysis of the data may also identify the need for additional staff professional development as well as technical training.

In addition to a review of data collected, the program administrator and faculty members will undertake an annual review of the program assessment plan to determine the effectiveness of the plan, and the quality and usefulness of the data collected. As a portion of this annual review, it is anticipated that the assessment plan for each program will remain a dynamic document, continuing to evolve as the faculty become more experienced in the process of program assessment.
Results: Direct Measures of Student Learning
Auto Service Technology and Diesel Service Technology Diesel Service
The 2017-2018 Academic year is the first year ASE Certification Tests have been used to provide Direct Measure data. ASE Certification Exams are nationally recognized tests taken by technicians throughout the country to help ensure automotive and heavy duty truck dealerships and independent repair shops are hiring the most knowledgeable technicians available to work on today’s technically advanced vehicles. In addition, Michigan is one of the only states requiring licensed / certified technicians to work on customer vehicles. ASE Certification tests may be used in the State of Michigan as an optional test for receiving state licenses in each technical area (i.e. brakes; suspension steering; engine performance). While few colleges and technical schools use ASE testing as part of their curriculum, Baker College and the Auto/Diesel Institute (ADI) have identified ASE testing as one of the best Direct Measures used in the industry today. Therefore, as we have just completed our first year collecting data and analyzing our efforts, our plans are to continue to review the data, adjust our curriculum and identify our best practice for using and reporting the information collected. Each exam testing area is broken down into categories that may also be used to provide instructional staff and program officials a clear indication of areas of strength as well as areas for needed improvement. The use of gap analysis for identifying areas of needed improvement and adjusting the curriculum to ensure we are meeting the Student Learning Outcomes is a valuable benefit for using this series of tests. In an effort to use comparative results with national standards and pass rates for ASE testing, we contacted ASE to discuss national norms. After discussions with the ASE Education Foundation Testing Director, we were told that ASE does not collect data to identity national norms for technicians taking the tests for the first time. This is true for students entering into the career along with technicians working in the field for at least one year. ASE’s Testing Director also indicated that few colleges use ASE Certification Testing as a program benchmark or for direct measure results. Instead, more secondary and post-secondary institutions use the ASE Student Testing to provide practice for taking ASE

exams and to become more familiar with the ASE question format that uses a two-tiered True/False style test banks. ASE Certification tests questions are developed and based on application as opposed to ASE Student Testing banks that are theory based questions and developed for students who most likely do not have a great deal of technical experience. The following ASE test results for Auto Service Technology, Diesel Service Technology and Auto Body are the first series of results collected by each of the programs. The overall results for each of the areas were anticipated as most formative evaluations focus on theory based questions with many of our students experiencing hands-on lab activities for the first time. Our newly developed cohort platform is designed for traditional students coming directly from high school as opposed to non-traditional students who may enter the program with a continuum of technical experiences with a greater likelihood of possessing some application knowledge and skill-sets. ASE / ADI Assessment
Automotive Service Technology ASE Results
2017/2018 Fall and Spring Semesters
ASE Test Code Test Name Percent Pass Rate A3 Manual Drive Trains 15% A4 Suspension and Steering 40% A5 Brakes 10% A6 Electrical/Electronics 33% A7 HVAC 23% A8 Engine Performance 15%
2018 Summer Semester
ASE Test Code Test Name Percent Pass Rate A2 Automatic Transmission 10% A3 Engine Performance 0%
Diesel Service technology ASE Results 2017/2018
ASE Test Code Test Name Percent Pass Rate T2 Engine Repair 42% T4 Brakes 45% T5 Steering and Suspension 41% T6 Electrical / Electronics 50% T7 Maintenance 58%
2018 Summer Semester
ASE Test Code Test Name Percent Pass Rate T3 Drive Trains 33% T7 HVAC 48%

Auto Body Technology
In addition to ASE testing, the Auto Body Technology program also uses I-CAR testing for the following major areas of instruction: Painting, Refinishing, and Non-Structural Analysis and Repair. I-CAR is a similar program in many ways to ASE, and although ASE and I-CAR share the same SLOs for Auto Body and Collision repair industry, I-CAR’s sole focus is on Auto Body and Collision Repair only. ASE, on the other hand, tests for a number of areas in the automotive and medium/heavy-duty truck industry including Auto Body. I-CAR was originally established as an information conduit from the manufacturers to the repair industry to help ensure that collision damaged vehicle repairs are made to “pre-accident condition” specifications. I-CAR is also highly regarded by the insurance industry as a source for certifying shops and their technicians in areas such as welding and structural repair.
ADI Assessment ASE Test Results - B4 Structural Analysis and Repair
Test Category
Areas for Structural Analysis
and Repair
Questions Answered Correctly
Test
Number of Scored
Questions
Percentage
Correct
Frame inspection and
repair
8, 11, 10 (10)
16
63
Unibody and Unitized Structural Inspection,
Measurement and Repair
10, 12, 9 (10.3)
18
64
Stationary Glass
0, 2, 3 (1.6)
4
26.5
Welding, Cutting and
Joining
5, 5, 7 (5.6)
12
47
Total 26.9 50 54

2017-2018 Academic Year
(Students – 7)
I-CAR Test Results 2017-2018 Academic Year
Welding
AWS practical exams and teacher developed summative written exams have been used to provide Direct Measure data. AWS Certification Exams are nationally recognized tests taken by welders and fabricators throughout the country to help ensure the most knowledgeable welding professionals are available to work in today’s welding trades.
Baker College / ADI Welding Program located on the Owosso Campus does employ a Certified Welding Instructor (CWI). The CWI does offer students the opportunity to test in a number of areas, including SMAW (Stick Welding), GTAW (TIG Welding) and GMAW (MIG Welding).
ADI Assessment Summative Evaluations Welding Owosso 2017/2018
The following Summative Assessment was used for the 2017-2018 Certificate students enrolled in the Welding Program. Each question includes the appropriate response and the percentage of students answering each question correctly.
W2960 Direct Measurement Assessment
2018 Student Results in Percentages
Parenthesis are student Numbers
1. What is a WPS? 100%(7)
Answer: Welding Procedure Specification.
2. What information should be included in a WPS? 85.7%(6)
Answer: All of the parameters required to produce a sound weld to the specific code, specifications, or definition including specific parameters
Test Category Cohort Average Test Result
Percentage Painting and Refinish 78%
Non-Structural 65.25%

such as: welding process, technique, electrode or filler, current, amperage, voltage, preheat, postheat, etc 3. Why is it important to select the correct welding code or standard?
Answer: Safety issues, cost, longevity 71.4%(5)
4. What is the form called that records the parameters used to produce a test weld?
Answer: Procedure Qualification Record (PQR) 57%(4)
5. Why is it possible to do more than one nondestructive test on a weld?
Answer: Because the parts are not destroyed, more than one testing method can be used on the same part. 100%(7) 6. Which nondestructive test is most commonly used?
Answer: Visual 71.4%(5)
7. What part of a “fillet weld break test” is examined?
Answer: The ruptured weld and fusion joint 71.4%(5)
8. What are some sources of hydrogen that can contaminate a weld?
Answer: Any hydrocarbon, paint, rust, moisture, air, oil, dirt. 57.1%(4)
9. What two beneficial effects does preheating do?
Answer: Increases welding speed and limits the possibility of cracking. 42%(3)
10. What does the term weldability involve?
Answer: Weldability means that almost any process may be used to produce acceptable welds and that little effort is needed to control the procedures. 57.1%(4) 11. What is the heat affected zone?
Answer: The area next to the weld, in which the properties have been altered due to the weld heat. 42%(3)
12. What must be done to steels before welding and after welding if they contain more than 0.40% carbon?
Answer: For steels containing more than 0.40% carbon, preheating and subsequent heat treatments generally are required to produce a satisfactory weld. 71.4%(5)

13. Why must cast iron weld metal be ductile?
Answer: Because of the weld, it is critical due to the brittleness of the cast iron itself. Therefore, the weld metal must be ductile. 71.4%(5) 14. Why should stainless steel not be held at a temperature between 800°F and 1500°F? Answer: The quicker the metal is heated and cooled through this range, the less time that chromium carbides can form. 42.85%(3) 15. Why are aluminum welds likely to cause distortion and cracking? Answer: Because aluminum shrinks between 6 and 10 percent as it cools. 57.1%(4)
ADI Assessment AWS Testing Owosso 2017/2018
The following are the AWS testing results for the Certificate Program welding students enrolled for the 2018-2018 Schools Year for both GMAW and SMAW tests.
WELD 2960 Gas Metal Arc Welding
Certification Direct Measures
Parenthesis are actual student numbers
GMAW
Assessment of student abilities to regulations of the A.W.S. acceptable rejected
Safety expectations for Lab operations / AWS D1.1 100
GMAW-AWS D1.1 Material prep of A-36 3/8 plate 100
Knowledge of the Structural Steel Code ( Discontinuities ) 85.7(6) 14.28(1)

3G plate test
Ability to comprehend the W.P.S. 85.7(6) 14.28(1)
Review all parameters on WPS and adjust the equip. settings 71.4(5) 28.5(2)
Mounting of test plate to WPS position 100
Followed the WPS as per volts, wire speed, gas cfh 100
Root Pass
Uniform and acceptable to proceed 85.7(6) 14.28(1)
Free of porosity 100
Free of undercutting 85.7(6) 14.28(1)
Minimum spatter 100
Cover Pass
Uniform and acceptable to proceed to bend testing 100
Free of porosity 85.7(6) 14.28(1)
Free of undercutting 85.7(6) 14.28(1)
Crown height to code parameters 100
CERTIFICATION BEND TEST, ROOT
Passed the bend test without breaking or tearing 85.7(6) 14.28(1)
Free of improper fusion 85.7(6) 14.28(1)
Free of undercuts 71.4(5) 28.5(2)
Free of porosity 85.7(6) 14.28(1)
CERTIFICATION BEND TEST, FACE
Passed the bend test without breaking or tearing 85.7(6) 14.28(1)
Free of improper fusion 100
Free of undercuts 100
Free of porosity 85.7(6) 14.28(1)

AWS GMAW 3G Plate Test 3/8” A-36
Passed 85.7(6) 14.28(1)
2018 Direct Measures Percentages
WELD 2960 Shielded Metal Arc Welding
Certification Direct Measures
Parenthesis are actual student numbers
SMAW
Assessment of student abilities to regulations of the A.W.S. acceptable rejected
Safety expectations for Lab operations / AWS D1.1 100
SMAW-AWS D1.1 Material prep of A-36 3/8 plate 100
Knowledge of the Structural Steel Code ( Discontinuities ) 85.7(6) 14.28(1)
3G plate test
Ability to comprehend the W.P.S. 71.4(5) 28.5(2)
Review all parameters on WPS and adjust the equip. settings 71.4(5) 28.5(2)
Mounting of test plate to WPS position 100
Followed the WPS 85.7(6) 14.28(1)
Root Pass
Uniform and acceptable to proceed 100
Free of slag and undercut 85.7(6) 14.28(1)
Free of outside arc strikes 100

Minimum spatter 100
Cover Pass
Uniform and acceptable to proceed to bend testing 85.7(6) 14.28(1)
Free of slag and undercut 85.7(6) 14.28(1)
Free of outside arc strikes 100
Crown height to code parameters 100
CERTIFICATION BEND TEST, ROOT
Passed the bend test without breaking or tearing 100
Free of slag or elongations 71.4(5) 28.5(2)
Free of undercuts 71.4(5) 28.5(2)
Free of porosity 85.7(6) 14.28(1)
CERTIFICATION BEND TEST, FACE
Passed the bend test without breaking or tearing 85.7(6) 14.28(1)
Free of slag or elongations 71.4(5) 28.5(2)
Free of undercuts 100
Free of porosity 71.4(5) 28.5(2)
AWS SMAW 3G Plate Test 3/8” A-36
Passed 85.7(6) 14.28(1)

Results: Key Performance Indicators
Faculty Credentials
All faculty are required to have ASE Certification (Auto Service Technology, Diesel Service Technology, Auto Body technology) or AWS (welding) certification in the specific area they are scheduled to teach. For example, instructors teaching Electrical/Electronics must have ASE Certification A6 for Auto or T6 for Medium/Heavy Truck. Similarly, a welding instructor scheduled to teach MIG welding is required to have passed the AWS test in all positions for GMAW (Gas Metal Arc Welding).
ADI - Career Services Assessment Report Data
Combined totals for CT and OW for ABT, AST, DSL, and WELD
2015-2016 2016-2017
Total Graduates 87 117
Employment Rate 94.80% 94.30%
Related Employment Rate 78% 76.10%
Unrelated Employment by Choice NA NA
Totals for CT for ABT and AST
2015-2016 2016-2017
Total Graduates 18 14
Employment Rate 100% 100%
Related Employment Rate 68.70% 50%
Unrelated Employment by Choice NA NA
Totals for OW for AST, DSL, and WELD
2015-2016 2016-2017
Total Graduates 69 103
Employment Rate 93.40% 93.9%
Related Employment Rate 80.70% 78.60%
Unrelated Employment by Choice NA NA

Initial Report for the continuous Improvement plan
The 2017-2018 Academic year is the first year for Auto Service Technology, Auto Body Technology
and Diesel Service Technology and Welding unified under the ADI brand. It is also the first year
for using the ASE professional test series for Direct Measure in AST, DSL and ABT. In addition,
we are adding a summative evaluation and AWS practical testing for welding along with the I-
CAR test series in ABT for Non-Structural Repair and Refinishing.
Test results collected for all areas using ASE exams are entered into the BlackBoard Learning
Management System so that access to the test results help to generate an overview of each
program and begin to produce a baseline to use for gap-analysis. Within each test area, ASE
reports out sub-categories results that will provide information for areas of needed improvement.
Presently, we are also developing an in-house product using Qualtrics that provides an easier
means of collecting, recording and storing test results in each discipline. The results will be
accessible to all ADI faculty and staff as well as the Assessment Committee Director at the System
level.
The following Continuous Improvement goals and plans are listed below for the 2018-2019
academic year.
2018-2019 Continuous Improvement Action Plan
Areas Identified for Improvement
Goal #1: Due to the small number of post-secondary schools across the country presently using
the ASE Certification Exams for direct measure, a comparative program or set of students /
technicians, need to be identified for program analysis and pass rate for benchmarking ADI
programs
Goal#2: Using the collected data from the 2017-2018 academic year ASE Certification Exams,
develop a process for analyzing the data to determine what changes in the AST, ABT and Diesel
programs may be required.
Goal #3: Upon completion of the revised curriculum for the change to semesters, review and align
rubrics and program outcomes with all AWS and ASE standards.
Evidence of Goals
Evidence 1: Identify post-secondary schools who are using ASE certification exams. Record pass
rates, and identify their criteria for using the ASE Certification exams.
Evidence 2: By the end of the 2018-2019 academic year, a process will be in place for reviewing
data from the ASE Certification exams for identifying any changes or modifications to course
curriculum.

Evidence 3: Additions and changes to rubrics will be made in AST, DSL, ABT and Welding with
course shells for Data Collection by the end of the 2018-2019 academic year.
Improvement Strategy
Strategy 1: Establish a review team within ADI to identify, contact and record information from
peer institutions using the ASE certification Exams for direct measure purposes.
Strategy 2: ADI directors and full-time faculty will review, analyze and identify a process for
implementing course modifications based on ASE Certification Test results collected from the
2017-2018 academic year and 2018-2019 academic year.
Strategy 3: ADI Program Directors and FT faculty will review rubrics to ensure alignment with all
program outcomes and ASE standards for implementation into AST, ABT, Welding and DSL
course shells.
Expected Results:
Goal 1: Peer institutions who use ASE Certification Testing will be identified and a set of
comparative ASE Certification Test results will be available for review.
Goal 2: A review process will be developed for analyzing and implementing gap analysis to
identify changes required for improving course delivery.
Goal 3: Course rubrics will be updated for alignments of program outcomes with ASE/AWS
standards.

Annual Assessment Plan
Assessment Process Overview Baker College embraces a philosophy of continuous quality improvement and requires program administrators to use a variety of robust assessments to ensure that the stated mission and goals are achieved. Both internal and external assessments are utilized to monitor and evaluate the program, allocate resources, create professional development, and update processes as part of the continuous quality improvement cycle. Specifically, the program assessment process is designed to evaluate data from three areas: 1) direct measures of student learning outcomes, 2) indirect measures and 3) key performance indicators. Faculty members, in collaboration with instructional designers, are responsible for developing standardized assessment materials to be used within courses. Authentic assessment materials are designed to evaluate student capabilities as they relate to program and institutional outcomes. These standardized assessment instruments become a part of the course, and all faculty members teaching the course are required to administer the instruments. It should be noted that all standardized assessment instruments are developed with the intent to embed the assessment process within the course. In this manner, students are not asked to complete additional assignments or assessments beyond those that are a part of the normal educational process. This embedding of assessment measures is important to Baker College, who believe that assessment should be an integral piece of the educational process, not an addition to it. The assessment materials are designed to support faculty members in their classroom assessment and evaluation, present students with clear expectations and performance parameters, and provide students detailed feedback on performance as it relates to learning outcomes. In addition to the direct measures, data are collected through the use of indirect measures, including surveys of program graduates, employer surveys, and/or accrediting agency reports. These data are combined with direct measures to complete the assessment data set Key Performance Indicators (KPI) have been developed to complete the assessment plan. These KPI are intended to measure programs in relation to priorities that have been set by the Institution based on our mission and values. Baker College has identified the following as key performance indicators for evaluating the success of graduate programs:
● Enrollments ● Retention ● Graduation rates ● Employment rates of graduates ● Faculty credentials ● Course and Instructor retention information
1

These KPIs provide data for analysis and evaluation on metrics beyond teaching and learning. These metrics provide the primary operational data necessary for evaluating the stability of the program as well as for planning, budgeting, high level assessment of operations, and how the program contributes to the mission and guiding principles of the institution. Additionally, these metrics are compared across graduate programs developing benchmarks, internal targets, and minimum performance standards. Annually, the program has the responsibility of compiling the data, discussing and analyzing the data with the faculty council, and collaboratively developing a continuous improvement plan. The continuous improvement plan is designed to identify the steps necessary for improving student learning in the designated areas. To address specific findings, the plan may include identifying actions such as redevelopment of a course, seeking additional data to clarify student achievement, or requesting alteration of specific assignments or teaching strategies to improve attainment of learning outcomes. Based on the findings, the plan may also include operational alterations to such areas as student services or faculty development. In addition to a review of data collected, the program will undertake an annual review of the program assessment plan to determine the effectiveness of the plan, and the quality and usefulness of the data collected. As a portion of this annual review, it is anticipated that the assessment plan for each program will remain a dynamic document, continuing to evolve as the faculty become more experienced in the process of program assessment.
2

Annual Assessment Plan
Instructions: Please be sure to name your files (template and supporting documents) correctly so we can tell who the report and documents belong to. You will want to include the program name and the academic year that you are submitting for. Program: Legal Studies College Of: Business Name of person submitting: Melissa F. Manela, J.D. Year: 2017-18 Assessment Process:
1. Collect data regarding: a. Student learning (direct measures/course embedded assessments) b. Indirect measures c. Key performance indicators
2. Review and analyze data with the following stakeholders: a. Assessment Community members b. Baker College Assessment Committee
3. Develop a Continuous Improvement Action Plan in collaboration with faculty 4. Submit assessment report to required location 5. Implement Continuous Improvement Action Plan 6. Review progress on the Continuous Improvement Action Plan of the prior year
assessment report
Results: Direct Measures of Student learning Provide summary of results. Include relevant graphs or charts. Direct measure summary results
should be aligned to each of your program outcomes and/or institutional outcomes. Your
summary should be written reporting the performance of those outcomes rather than
reporting the performance of a rubric. Direct measures include identified DM assessments,
certification pass rates and other assessments from external providers (Peregrine, NOCTI etc.)
Direct Measures were conducted in the Legal Studies capstone course PAR 4910 in the form of
a Mock Trial. A rubric was used to measure seven different categories, including presentation of
evidence, subject knowledge, spelling and grammar, format and organization of written
product, eye contact, professional attire, and oral presentation. These direct measures touched
on all ISLOs and POs. In terms of the Program Outcomes for Legal Studies, the following is a
summary of direct measure outcome for 2017-18. Regarding PO1 - Conduct, organize, and
evaluate legal research, as well as assemble necessary legal documents in order to adequately
assist in the litigation process: The students performed well demonstrating this program
3

outcome. Students had to compile a trial notebook in the preparation of their mock trial
exercise. 100% of students received maximum scores for format and organization or written
product. 56% of students received maximum scores for spelling and grammar, while 44%
received satisfactory scores in this regard. Regarding PO2 - Evaluate and apply appropriate
court rules, including rules of civil procedure and rules of evidence; and PO3 - Examine and
develop an understanding of legal processes as they relate to various substantive areas of law.
All students displayed at least above average scores demonstrating these program outcomes.
100% of students received maximum scores for presentation of the evidence. 100% of students
also received maximum scores for oral presentation. 67% of students received maximum
scores for subject knowledge, while 33% received above average scores in this regard.
Regarding PO4 - Develop and apply a command of the ethical guidelines and rules of
professional responsibility necessary to demonstrate competence as a paralegal: All students
demonstrated excellent understanding of the ethical and professional requirements.
Results: Indirect Measures of Student Learning Provide results here. Include relevant graphs and charts. Indirect measures of student learning include all of the following:
○ Student Evaluations of Faculty - SmartEvals ■ Review and report the performance of the following questions from the
Student Evaluation of Faculty evaluation results. ● Check to see that you understood the material?
In reviewing all of the Legal Studies SmartEval reports, the overwhelming majority of faculty either Met or Exceeded expectations in this regard. Only one of eleven instructors had a Did Not Meet response for this question.
● Would you recommend this instructor to others? In reviewing all of the Legal Studies SmartEval reports, the students would recommend the great majority of faculty in this regard. Only two of eleven instructors received a “no” response for this question, and those were from one respondent per survey.
Faculty course evaluation - Qualtrics ■ Summarize and report the results
All faculty surveyed agreed with every category in the course evaluation in each class. Out of 4 legal studies courses surveyed, all 4 courses were rated an A. Any comments were noted and reviewed.
4

○ First Destination Survey/Graduate Reporting Survey/End of Program Survey results - All of these results are together in Qualtrics as this is one survey with multiple sections
■ Summarize and report the results No legal studies data was reported. Three paralegal respondents answered the survey in 2017. All three were considered successful outcomes, with two continuing their education and one working as a law clerk.
○ Summary of FGEP results for the Legal Studies program within the College of Business by the DAA/IES Only one instructor was evaluated within the Legal Studies program during 2017-18. That instructor was evaluated in PAR 4310 and scored as follows:
■ Planning and preparation - did not meet ■ Professional Expertise - met ■ Learning Environment - did not meet ■ Learning Facilitation - did not meet
○ WRK Supervisor Evaluation (if not a DM) - Handshake/Career Services provided
■ Summarize and report the results ● Traditionally, the WRK 2150 work experience course is completed as part of the
paralegal program. The results are based on data collected from the 2017-18 academic year. All students listed in the WRK 2150 Experience Supervisor Survey Results received a yes in all 15 categories surveyed. Comments, where included, were all positive.
Results: Key Performance Indicators Provide results here. Include relevant graphs and charts. (KPI data will be provided to each Assessment Community.)
● Number of students See chart below ● Retention See chart below ● Graduation Rate Not available ● Faculty Credentials: 100% (10 of 10) of faculty teaching in the Legal Studies
program had Juris Doctorate degrees. For the entire College of Business, all faculty had appropriate credentials as follows:
● F2017 o 222 faculty
▪ 76 (34.23%) – Doctorate ▪ 117 (52.70) – Masters
5

▪ 20 (9.01%) – Bachelor ▪ 9 (4.05%) – Associate
● Spring 2018 o 204 faculty
▪ 70 (34.31%) – Doctorate ▪ 130 (63.73%) – Masters ▪ 4 (1.96%) - Bachelor
● Employment: As indicated on the chart below, for 2016-17, the most recent year of data, 71.4% of students responding to the Career Services survey reported being employed, with 80% reporting being employed in a related field. Data from our most recent American Bar Association (ABA) interim approval application submitted in January 2018 indicated that for 2016-17, 80% of Legal Studies graduates reported being employed, with 80% reporting being employed in a related field; for 2015-16, 71.4% of Legal Studies graduates reported being employed, with 71.4% reporting being employed in a related field, and for 2014-15, 88.9% of Legal Studies graduates reported being employed, with 77.8% reporting being employed in a related field.
● Course/Instructor Retention Data (Carina Resources/Archived Reports/Instructor or Course Retention Report)
2014-15 2015-16 2016-17 2017-18
Total New
Students 3 10 6 N/A
Total Registered
Students 60 54 42 N/A
Retention Rate 76.9 77.7 76.4 N/A
1st Year
Persistence Rate 100.0 80.0 N/A N/A
Total Graduates 14 10 12 N/A
Graduation Rate N/A N/A
Employment Rate 71.4 N/A
Related
Employment Rate 80.0 N/A **Note: In 2016 we aligned our employment rate calculations with NACE so employment numbers will
vary from previous years for that year and beyond
Progress Report on Previous Continuous Improvement Action Plan Review the continuous improvement goals from 2013-2014 and 2014-2015 that the program has been working toward and share the progress that has been made. (Not all programs will have these goals in place)
6

2018-2019 Continuous Improvement Action Plan All of the following items are be required to be included for each improvement goal that is set below:
● Identified Improvement Area:
Provide the specific area targeted for improvement. Examples include (but are not
limited to) program outcomes, institutional outcomes, inter-rater reliability on specific
assessments, low faculty completion of direct measures.
As this program is beginning a teach-out, the main goal is to assist students in competing their
program within the teach-out time frame while maintaining the standards of rigor set forth by
the ABA-approval process. We will focus on meeting program outcomes.
● Evidence:
Provide the existing data that indicates this is an identified area for improvement.
Examples include (but are not limited to) low scores on assessments, unexpected
disparity among faculty grading/rubric scores, poor ratings on indirect measures
(student perception surveys, employer feedback, external standards.)
As this program is beginning a teach-out, the main goal is to assist students in competing their
program within the teach-out time frame while maintaining the standards of rigor set forth by
the ABA-approval process. We will look at both direct and indirect measures to make sure
program outcomes are met.
● Improvement Strategy:
Provide a detailed explanation of the strategy selected to address the identified
improvement area. Possible strategies include (but are not limited to) changes to
academic processes, changes to curriculum, changes to assessment plan.
As this program is beginning a teach-out, the main goal is to assist students in competing their
program within the teach-out time frame while maintaining the standards of rigor set forth by
the ABA-approval process. We will look at both direct and indirect measures to make sure
program outcomes are met.
● Expected Results:
Provide a measurement for expected results. It is recognized that we have little
experience in this area. The goal is to build capacity is setting benchmarks and
measuring results. Initially we will rely on “Best guess” and estimations.
7

As this program is beginning a teach-out, the main goal is to assist students in competing their
program within the teach-out time frame while maintaining the standards of rigor set forth by
the ABA-approval process. Expected results are that each student currently in the Legal Studies
program will complete the program within the teach-out time frame while meeting the
program goals.
Improvement Goal #1:
As this program is beginning a teach-out, the main goal is to assist students in competing their
program within the teach-out time frame while maintaining the standards of rigor set forth by
the ABA-approval process.
Improvement Goal #2:
*Please add additional goals as needed
8

Annual Assessment Plan
Assessment Process Overview Baker College embraces a philosophy of continuous quality improvement and requires program administrators to use a variety of robust assessments to ensure that the stated mission and goals are achieved. Both internal and external assessments are utilized to monitor and evaluate the program, allocate resources, create professional development, and update processes as part of the continuous quality improvement cycle. Specifically, the program assessment process is designed to evaluate data from three areas: 1) direct measures of student learning outcomes, 2) indirect measures and 3) key performance indicators. Faculty members, in collaboration with instructional designers, are responsible for developing standardized assessment materials to be used within courses. Authentic assessment materials are designed to evaluate student capabilities as they relate to program and institutional outcomes. These standardized assessment instruments become a part of the course, and all faculty members teaching the course are required to administer the instruments. It should be noted that all standardized assessment instruments are developed with the intent to embed the assessment process within the course. In this manner, students are not asked to complete additional assignments or assessments beyond those that are a part of the normal educational process. This embedding of assessment measures is important to Baker College, who believe that assessment should be an integral piece of the educational process, not an addition to it. The assessment materials are designed to support faculty members in their classroom assessment and evaluation, present students with clear expectations and performance parameters, and provide students detailed feedback on performance as it relates to learning outcomes. In addition to the direct measures, data are collected through the use of indirect measures, including surveys of program graduates, employer surveys, and/or accrediting agency reports. These data are combined with direct measures to complete the assessment data set Key Performance Indicators (KPI) have been developed to complete the assessment plan. These KPI are intended to measure programs in relation to priorities that have been set by the Institution based on our mission and values. Baker College has identified the following as key performance indicators for evaluating the success of graduate programs:
● Enrollments ● Retention ● Graduation rates ● Employment rates of graduates ● Faculty credentials ● Course and Instructor retention information
1

These KPIs provide data for analysis and evaluation on metrics beyond teaching and learning. These metrics provide the primary operational data necessary for evaluating the stability of the program as well as for planning, budgeting, high level assessment of operations, and how the program contributes to the mission and guiding principles of the institution. Additionally, these metrics are compared across graduate programs developing benchmarks, internal targets, and minimum performance standards. Annually, the program has the responsibility of compiling the data, discussing and analyzing the data with the faculty council, and collaboratively developing a continuous improvement plan. The continuous improvement plan is designed to identify the steps necessary for improving student learning in the designated areas. To address specific findings, the plan may include identifying actions such as redevelopment of a course, seeking additional data to clarify student achievement, or requesting alteration of specific assignments or teaching strategies to improve attainment of learning outcomes. Based on the findings, the plan may also include operational alterations to such areas as student services or faculty development. In addition to a review of data collected, the program will undertake an annual review of the program assessment plan to determine the effectiveness of the plan, and the quality and usefulness of the data collected. As a portion of this annual review, it is anticipated that the assessment plan for each program will remain a dynamic document, continuing to evolve as the faculty become more experienced in the process of program assessment.
2

Annual Assessment Plan
Instructions: Please be sure to name your files (template and supporting documents) correctly so we can tell who the report and documents belong to. You will want to include the program name and the academic year that you are submitting for. Program: Paralegal College Of: Business Name of person submitting: Melissa F. Manela, J.D. Year: 2017-18 Assessment Process:
1. Collect data regarding: a. Student learning (direct measures/course embedded assessments) b. Indirect measures c. Key performance indicators
2. Review and analyze data with the following stakeholders: a. Assessment Community members b. Baker College Assessment Committee
3. Develop a Continuous Improvement Action Plan in collaboration with faculty 4. Submit assessment report to required location 5. Implement Continuous Improvement Action Plan 6. Review progress on the Continuous Improvement Action Plan of the prior year
assessment report
Results: Direct Measures of Student learning Provide summary of results. Include relevant graphs or charts. Direct measure summary results
should be aligned to each of your program outcomes and/or institutional outcomes. Your
summary should be written reporting the performance of those outcomes rather than
reporting the performance of a rubric. Direct measures include identified DM assessments,
certification pass rates and other assessments from external providers (Peregrine, NOCTI etc.)
Direct Measures were conducted in the Paralegal capstone courses PAR 2150 and PAR 2910.
PAR 2150 direct measures consisted of a Written Brief with rubric, an Oral Argument with
rubric, and Westlaw Certification. In PAR 2150, the Brief rubric showed that almost all students
scored excellent or good across all 7 categories assessed. A few students scored in the needs
improvement range in 2 categories, predominantly in application of law to facts. The Oral
Argument rubric showed that all students scored excellent or good across the board except in
the area of eye contact, where some students scored a satisfactory mark. Out of 17 students,
16 (94%) received their Westlaw certification and scored excellent and 1 student (6%) did not
3

complete it. PAR 2910 direct measures consisted of 13 Assignments throughout the course,
each with corresponding rubrics.
Regarding PO1 The graduate will demonstrate career-ready knowledge and skills to be
employable as a paralegal. The students performed well demonstrating this program outcome.
Both PAR 2150 and PAR 2910 assessments indicate that the students have learned and
demonstrated basic entry-level paralegal skills.
Regarding PO2 The graduate will be able to conduct legal and factual investigation using
traditional and technological methodologies. The students performed well demonstrating this
program outcome. Both PAR 2150 and PAR 2910 assessments indicate that the students
showed strength in investigation techniques and were able to conduct research. The strength
of research skills varied among campuses.
Regarding PO3 The graduate will demonstrate knowledge of the court system and the process
a case takes from inception through post-trial. The graduate will be able to conduct legal and
factual investigation using traditional and technological methodologies. The majority students
performed well demonstrating this program outcome. Both PAR 2150 and PAR 2910
assessments indicate that the students grasped the concepts covered by PO3. Again, there was
some discrepancies among various assignments and campuses.
Regarding PO4 The graduate will apply legal reasoning by identifying legal issues, finding and
interpreting the legal rule, applying the rule to factual situations, and drawing conclusions.
Overall, the students had a little more difficulty demonstrating this program outcome. Both PAR
2150 and PAR 2910 assessments indicate that the students were generally able to identify the
legal issues and rule, but had a harder time applying the rule of law to the facts. This has
generally been one of the hardest areas in prior years as well.
Regarding PO5 The graduate will practice organizational and life skills that enhance the
paralegal’s ability to succeed in the legal or business environment. The students performed
well demonstrating this program outcome. Both PAR 2150 and PAR 2910 assessments indicate
that the students would fare well in this regard.
Regarding PO6 The graduate will demonstrate an understanding of the evolving role of
paralegals in the delivery of legal services and the need to continue educational experiences
through networking with professional organizations and pursuing continuing education. The
students performed well demonstrating this program outcome. Both PAR 2150 and PAR 2910
assessments indicate that the students would fare well in this regard.
4

Regarding PO7 The graduate will model ethical and professional responsibilities applicable to
paralegals. The students performed well demonstrating this program outcome. Both PAR 2150
and PAR 2910 assessments indicate that the students understood the importance of ethical and
professional responsibilities and all students demonstrated knowledge in this regard on direct
measures.
Regarding PO8 The graduate will demonstrate the ability to effectively communicate ideas in
both written and oral forms, including the preparation of legal documents. Overall, the
students performed well demonstrating this program outcome. Both PAR 2150 and PAR 2910
assessments indicate that the students generally performed at least satisfactorily in
communication. A review of the direct measure data indicates that oral skills were slightly
higher than written skills, but most written work scored at least at a satisfactory level, with the
majority of documents scoring excellent or good.
Results: Indirect Measures of Student Learning Provide results here. Include relevant graphs and charts. Indirect measures of student learning include all of the following:
○ Student Evaluations of Faculty - SmartEvals ■ Review and report the performance of the following questions from the
Student Evaluation of Faculty evaluation results. ● Check to see that you understood the material?
In reviewing all of the Paralegal SmartEval reports, the majority of faculty either Met or Exceeded expectations in this regard. Three of fifteen instructors had a Did Not Meet response for this question and those were from one respondent per survey.
● Would you recommend this instructor to others? In reviewing all of the Paralegal SmartEval reports, the students would recommend the majority of faculty in this regard. Four of fifteen instructors received a “no” response for this question.
○ Faculty course evaluation - Qualtrics ■ Summarize and report the results
The vast majority of faculty agreed with every category in the course evaluation in each class. Out of 11 paralegal courses, 7 courses were rated an A with faculty agreeing in every category, while 4 courses were rated a B with a few somewhat agree categories. Of those 4 courses, 2
5

were independent studies offered through AP and JK. Comments were noted and reviewed.
○ First Destination Survey/Graduate Reporting Survey/End of Program Survey results - All of these results are together in Qualtrics as this is one survey with multiple sections
■ Summarize and report the results Three respondents answered the survey in 2017. All three were considered successful outcomes, with two continuing their education and one working as a law clerk.
○ Summary of FGEP results for the College of - DAA/IES Only one instructor was evaluated within the Paralegal program during 2017-18. That instructor was evaluated in PAR 1410 and scored as follows:
● Planning and preparation - met ● Professional Expertise - exceeds ● Learning Environment - met ● Learning Facilitation - met
○ WRK Supervisor Evaluation (if not a DM) - Handshake/Career Services
provided ■ Summarize and report the results
● The results are based on data collected from the 2017-18 academic year. All students listed in the WRK 2150 Experience Supervisor Survey Results received a yes in all 15 categories surveyed. Comments, where included, were all positive.
Results: Key Performance Indicators Provide results here. Include relevant graphs and charts. (KPI data will be provided to each Assessment Community.)
● Number of students See chart below ● Retention See chart below ● Graduation Rate Not available ● Faculty Credentials For the three campuses with the Paralegal program in
2017-18, 80% (12 of 15) of faculty teaching in the Paralegal program had Juris Doctorate degrees and 20% (3 of 15) had Masters degrees. Broken down by campus, 100% at AH had Juris Doctorate degrees, 75% at AP had Juris Doctorate degrees, and 71.4% at JK had Juris Doctorate degrees. For the entire College of Business, all faculty had appropriate credentials as follows:
● F2017 o 222 faculty
▪ 76 (34.23%) – Doctorate ▪ 117 (52.70) – Masters
6

▪ 20 (9.01%) – Bachelor ▪ 9 (4.05%) – Associate
● Spring 2018 o 204 faculty
▪ 70 (34.31%) – Doctorate ▪ 130 (63.73%) – Masters ▪ 4 (1.96%) - Bachelor
● Employment As indicated on the chart below, for 2016-17, the most recent year of data, 50% of students responding to the Career Services survey reported being employed, with 55.6% reporting being employed in a related field. While these numbers consist of graduates reporting in from all three campuses running the program in 2016-17, AH also collected data as part of its most recent American Bar Association (ABA) interim approval application submitted in January 2018. This data indicated that for 2016-17, 90% of AH Paralegal graduates reported being employed, with 70.8% reporting being employed in a related field; for 2015-16, 82.6% of AH Paralegal graduates reported being employed, with 73.9% reporting being employed in a related field, and for 2014-15, 93.3% of AH Paralegal graduates reported being employed, with 86.7% reporting being employed in a related field.
● Course/Instructor Retention Data (Carina Resources/Archived Reports/Instructor or Course Retention Report)
2013-14 2014-15 2016-17 2017-18
Total New
Students 108 82 30 N/A
Total Registered
Students 285 215 118 N/A
Retention Rate 64.8 66.4 55.1 N/A
1st Year
Persistence Rate 46.4 40.5 N/A N/A
Total Graduates 32 N/A
Graduation Rate N/A N/A
Employment Rate 50.0 N/A
Related
Employment Rate 55.6 N/A **Note: In 2016 we aligned our employment rate calculations with NACE so employment numbers will
vary from previous years for that year and beyond
Progress Report on Previous Continuous Improvement Action Plan
7

Review the continuous improvement goals from 2013-2014 and 2014-2015 that the program has been working toward and share the progress that has been made. (Not all programs will have these goals in place) 2018-2019 Continuous Improvement Action Plan All of the following items are be required to be included for each improvement goal that is set below:
● Identified Improvement Area:
Provide the specific area targeted for improvement. Examples include (but are not
limited to) program outcomes, institutional outcomes, inter-rater reliability on specific
assessments, low faculty completion of direct measures.
We have identified written communication skills and competencies as our target
improvement area.
● Evidence:
Provide the existing data that indicates this is an identified area for improvement.
Examples include (but are not limited to) low scores on assessments, unexpected
disparity among faculty grading/rubric scores, poor ratings on indirect measures
(student perception surveys, employer feedback, external standards.)
A review of both the direct measure assessment and indirect measure data indicates
that some students still have difficulty with written communication skills and
competencies, which is considered one of the most vital skills for a paralegal and is
incorporated into both program and institutional outcomes.
● Improvement Strategy:
Provide a detailed explanation of the strategy selected to address the identified
improvement area. Possible strategies include (but are not limited to) changes to
academic processes, changes to curriculum, changes to assessment plan.
Improvement strategy at this time includes reviewing and providing practical
assignments designed to both meet the guidelines set forth by our ABA-approval as well
as improve and reinforce written communication skills and competencies.
● Expected Results:
Provide a measurement for expected results. It is recognized that we have little
experience in this area. The goal is to build capacity is setting benchmarks and
measuring results. Initially we will rely on “Best guess” and estimations.
8

It is expected that as students continue to complete appropriate practical assignments
designed to both meet the guidelines set forth by our ABA-approval as well as improve
and reinforce written communication skills and competencies, that we should see
improvement in both assignment scores and rubric data assessing these skills.
Improvement Goal #1:
As the Paralegal program is now only offered at the Auburn Hills campus, the Improvement
Goal set for Paralegal for 2018-2019 is to continue to advance written communication skills and
competencies through the use of practical assignments in accordance with the guidelines set
forth by our ABA-approval.
Improvement Goal #2:
*Please add additional goals as needed
9

1
Annual Assessment Plan
Assessment Process Overview Baker College embraces a philosophy of continuous quality improvement and requires program administrators to use a variety of robust assessments to ensure that the stated mission and goals are achieved. Both internal and external assessments are utilized to monitor and evaluate the program, allocate resources, create professional development, and update processes as part of the continuous quality improvement cycle. Specifically, the program assessment process is designed to evaluate data from three areas: 1) direct measures of student learning outcomes, 2) indirect measures and 3) key performance indicators. Faculty members, in collaboration with instructional designers, are responsible for developing standardized assessment materials to be used within courses. Authentic assessment materials are designed to evaluate student capabilities as they relate to program and institutional outcomes. These standardized assessment instruments become a part of the course, and all faculty members teaching the course are required to administer the instruments. It should be noted that all standardized assessment instruments are developed with the intent to embed the assessment process within the course. In this manner, students are not asked to complete additional assignments or assessments beyond those that are a part of the normal educational process. This embedding of assessment measures is important to Baker College, who believe that assessment should be an integral piece of the educational process, not an addition to it. The assessment materials are designed to support faculty members in their classroom assessment and evaluation, present students with clear expectations and performance parameters, and provide students detailed feedback on performance as it relates to learning outcomes. In addition to the direct measures, data are collected through the use of indirect measures, including surveys of program graduates, employer surveys, and/or accrediting agency reports. These data are combined with direct measures to complete the assessment data set
Key Performance Indicators (KPI) have been developed to complete the assessment plan. These KPI are intended to measure programs in relation to priorities that have been set by the Institution based on our mission and values. Baker College has identified the following as key performance indicators for evaluating the success of graduate programs:
● Enrollments ● Retention ● Graduation rates ● Employment rates of graduates ● Faculty credentials ● Course and Instructor retention information

2
These KPIs provide data for analysis and evaluation on metrics beyond teaching and learning. These metrics provide the primary operational data necessary for evaluating the stability of the program as well as for planning, budgeting, high level assessment of operations, and how the program contributes to the mission and guiding principles of the institution. Additionally, these metrics are compared across graduate programs developing benchmarks, internal targets, and minimum performance standards. Annually, the program has the responsibility of compiling the data, discussing and analyzing the data with the assessment communities, and collaboratively developing a continuous improvement plan. The continuous improvement plan is designed to identify the steps necessary for improving student learning in the designated areas. To address specific findings, the plan may include identifying actions such as redevelopment of a course, seeking additional data to clarify student achievement, or requesting alteration of specific assignments or teaching strategies to improve attainment of learning outcomes. Based on the findings, the plan may also include operational alterations to such areas as student services or faculty development. In addition to a review of data collected, the program will undertake an annual review of the program assessment plan to determine the effectiveness of the plan, and the quality and usefulness of the data collected. As a portion of this annual review, it is anticipated that the assessment plan for each program will remain a dynamic document, continuing to evolve as the faculty become more experienced in the process of program assessment.

3
Annual Assessment Plan Instructions: Please be sure to name your files (template and supporting documents) correctly so we can tell who the report and documents belong to. You will want to include the program name and the academic year that you are submitting for. Program: Baking and Pastry Arts College Of: CIM Name of person submitting: Tom Recinella for CIM Assessment Community Team Year: 2017/2018 Assessment Process:
1. Collect data regarding: a. Student learning (direct measures/course embedded assessments)
Milestone BAK 1310 Classic Pastry Fundamentals Final Practical Exam Capstone BAK 1710 Café and Bakery Operations Final Practical Exam
b. Indirect measures Student Evaluation of Faculty - (Smart Evals) Faculty Course Evaluations (Qualtrics) First Destination Survey/Graduate Survey/End of Program Survey (Qualtrics) FGEP -Faculty Evaluations (Annual or per Union Contract)
c. Key performance indicators 2. Review and analyze data with the following stakeholders:
a. Assessment Community members b. Baker College Assessment Committee
3. Develop a Continuous Improvement Action Plan in collaboration with faculty 4. Submit assessment report to required location 5. Implement Continuous Improvement Action Plan 6. Review progress on the Continuous Improvement Action Plan of the prior year
assessment report Direct Measures of Student learning:

4
Milestone BAK 1310 Classic Pastry Fundamentals 2017/2018
We are considering changing the milestone course from BAK 1310 Classic Pastry Fundamentals
to BAK 1410 Petit Fours and Plated Desserts. This will be an agenda item that will be covered
with both CIM Advisory Boards at their annual fall meetings on October 1st for Muskegon and
October 25th for Port Huron.
After running the new classes now for multiple semesters, the feedback we are receiving from
our baking and pastry faculty is that the milestone direct measure would be better placed at
BAK 1410 then where it is now at BAK 1310.

5
Milestone BAK 1310 Classic Pastry Fundamentals , outcomes align to Program Outcomes and
Institutional Student Learning Outcomes as illustrated below:
Milestone BAK 1310 Classic Pastry Fundamentals 2017/2018 Required Knowledge and Skills Competency PO/SLOs/ISOs
Mise en Place/Organization POs 1, 6 / SLOs 2b / IOs 1
Baking and Pastry Techniques/Proper Execution POs 1, 2, 3, 6 / SLOs 3a - 3k / IOs 1
Proper Utilization of Ingredients POs 4 / SLOs 2c, 2d / IOs 1
Serving Methods and Presentation POs 1, 6 / SLOs 3i, 4d / IOs 1
Portion Size and Nutritional Balance POs 3, 5/ SLOs 3c / IOs 1
Creativity, Menu and Ingredient Compatibility POs 1, 2, 3, 6 / SLOs 3a - 3k / IOs 1
Flavor, Taste, Texture, and Doneness POs 2, 6 / SLOs 3a, 3d, 3i, 3k, 4c, / IOs 1
Recipe and Requisition of Final Exam Items POs 1, 2, 3, 6 / SLOs 2b, 2c, 3c / IOs 1, 3
Sanitation/Food Handling POs 5 / SLOs 1a, 2a, 2c
Timing/Workflow SLO 2b

6
Capstone BAK 1710 Café and Bakery Operations 2017/2018
Capstone BAK 1710 Café and Bakery Operations, outcomes align to Program Outcomes and
Institutional Student Learning Outcomes as illustrated below:

7
Capstone BAK 1710 Café and Bakery Operations Required Knowledge and Skills Competency PO/SLOs/ISOs
Mise en Place/Organization POs 1, 6 / SLOs 2b / IOs 1
Baking and Pastry Techniques/Proper Execution POs 1, 2, 3, 6 / SLOs 3a - 3k / IOs 1
Proper Utilization of Ingredients POs 4 / SLOs 2c, 2d / IOs 1
Serving Methods and Presentation POs 1, 6 / SLOs 3i, 4d / IOs 1
Portion Size and Nutritional Balance POs 3, 5/ SLOs 3c / IOs 1
Creativity, Menu and Ingredient Compatibility POs 1, 2, 3, 6 / SLOs 3a - 3k / IOs 1
Flavor, Taste, Texture, and Doneness POs 2, 6 / SLOs 3a, 3d, 3i, 3k, 4c, / IOs 1
Recipe and Requisition of Final Exam Items POs 1, 2, 3, 6 / SLOs 2b, 2c, 3c / IOs 1, 3
Sanitation/Food Handling POs 5 / SLOs 1a, 2a, 2c
Timing/Workflow SLO 2b
Milestone Capstone Milestone Capstone Milestone Capstone
Course BAK 1310 BAK 1710 CUL 1520 CUL2510 FBM 2610 FBM 2810
Overall
Average 86% 89% 78.69% 79.72% 93.64% 92%
PH average -------- 92.26% 81.91% 81.01% 91.42% 88.25%
MUS
average 86% 87.41% 76.4% 78.59% 95.2% 92%

8
Tracking Certified Pastry Culinarian for Accreditation:
Historically we have not tracked Baking and Pastry graduates who earn their Certified Pastry
Culinarian (CPC) Certification. However, this is now, required by the American Culinary
Federation Education Foundation Accrediting Commission (ACFEFAC) and we will be tracking it.
We have implemented a faculty mentor program that will help to ensure that students
graduating from the Baking and Pastry Arts Program will, upon graduation, complete the
necessary steps to become a Certified Pastry Culinarian (CPC). We are required to submit the
number of graduates who do so to the American Culinary Federation Education Foundation
Accrediting Commission (ACFEFAC) each year in our annual report.
Results: Indirect Measures of Student Learning Student Evaluation of Faculty (this data was pulled for our Spring 2018 self-study for the Baking and Pastry program in Port Huron prior to the report being renamed to CIM)

9

10
Faculty course evaluation – Qualtrics
We have not had a great deal of response from faculty to the faculty course evaluation. Some
faculty have stated that they filled one out and submitted yet it is not showing up. Of the
responses that we have we have gleaned that we need to rework some curriculum. A good
example is FBM 2210 Menu Planning and Analysis. We are doing a complete rewrite of this
course to be effective Fall, 2019. We have already met with the Instructional design team (on 9-
5-18) regarding this course and all other areas that we need to tweak.
First Destination Survey/Graduate Reporting Survey/End of Program Survey results: - All
of these results are together in Qualtrics as this is one survey with multiple sections
Response from students on the First Destination report has not been good. CIM Program
directors and full time faculty did spend a great deal of time contacting recent graduates. It
seems to have not been as successful as we hoped. We will continue our efforts. Having the no
response information at our, fingertips will assist us in this. We eagerly await PD having access
to Qualtric data.
Summary of FGEP results:
WRK Supervisor Evaluation: (if not a DM) - Handshake/Career Services provided
■ Summarize and report the results
○ Advisory Board Minutes – we had excellent feedback from our advisory board.
The board was extremely pleased with the implementation of their suggestions
into the curriculum during the Q 2 S process.

11
○ The Baking and Pastry Arts Program is in good standing with the American
Culinary Federation Education Foundation Accrediting Commission (ACFEFAC).
The BAK program in Port Huron received a seven year grant of accreditation this
past July 2018, Muskegon’s BAK program is currently within its five year grant
from 2014.
○ While working on the Port Huron BAK program self-study it was discovered that
the BAK certificate program in Muskegon should not have applied for
accreditation and should not have received accreditation. The Dean contacted
the American Culinary Federation Education Foundation Accrediting Commission
(ACFEFAC) immediately. CIM Program officials have to review the BAK Certificate
and decide whether, or not we will adapt it to contain the required knowledge
and skills competencies to be, accredited when the time comes for our next self-
study/site visit for renewal.
Results: Key Performance Indicators Number of students: CIM performance numbers for 2017/2018 are not currently available below is the data reported to the American Culinary Federation Education Foundation Accrediting Commission (ACFEFAC) and reflected on our website. Muskegon
2016-2017
REGISTERED/NEW
STUDENTS GRADUATES % EMPLOYED
Baking and Pastry (AAS/CER) 103/34 AAS - 26/CER - 1 AAS - 72.2%/CER - 100%
Port Huron
2016-2017
REGISTERED/NEW
STUDENTS GRADUATES % EMPLOYED
Baking and Pastry (AAS/CER) 57/22 AAS - 22/CER - 2 AAS - 66.7%/CER - 0%
Employment: CIM employment numbers for 2017/2018 are not currently available below is the data reported to the American Culinary Federation Education Foundation Accrediting Commission (ACFEFAC) in our annual report.
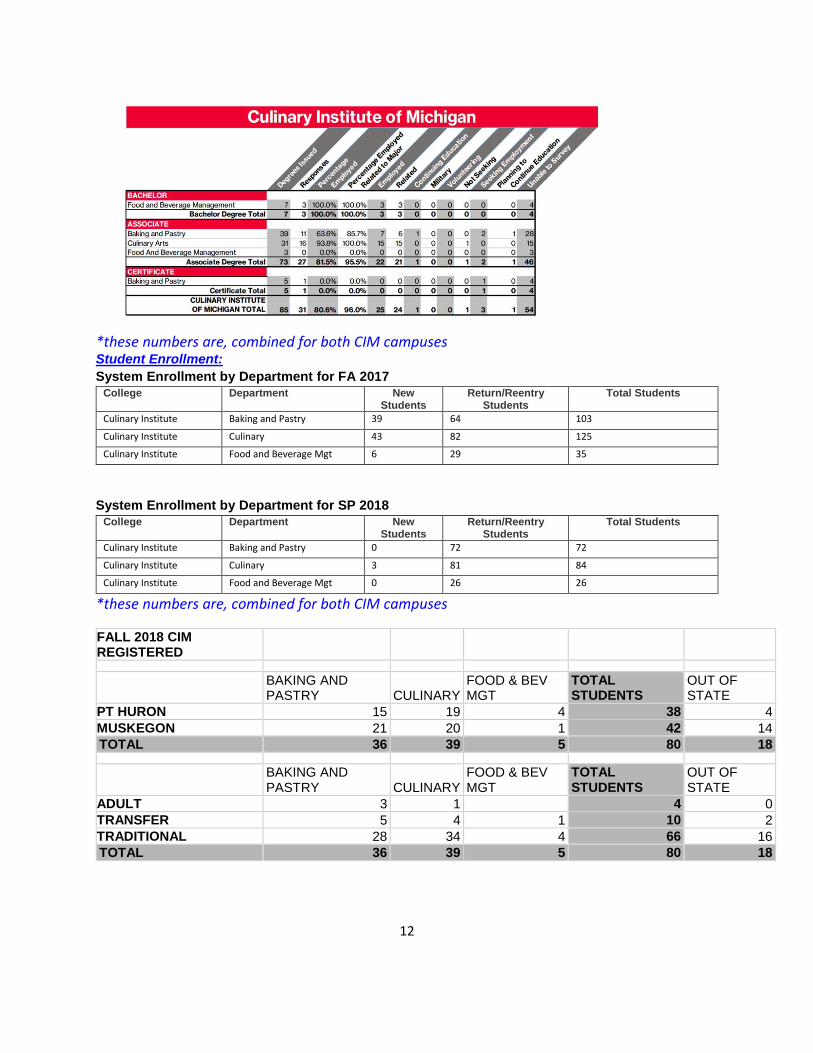
12
*these numbers are, combined for both CIM campuses Student Enrollment:
System Enrollment by Department for FA 2017
College Department New Students
Return/Reentry Students
Total Students
Culinary Institute Baking and Pastry 39 64 103
Culinary Institute Culinary 43 82 125
Culinary Institute Food and Beverage Mgt 6 29 35
System Enrollment by Department for SP 2018
College Department New Students
Return/Reentry Students
Total Students
Culinary Institute Baking and Pastry 0 72 72
Culinary Institute Culinary 3 81 84
Culinary Institute Food and Beverage Mgt 0 26 26
*these numbers are, combined for both CIM campuses
FALL 2018 CIM REGISTERED
BAKING AND PASTRY CULINARY
FOOD & BEV MGT
TOTAL STUDENTS
OUT OF STATE
PT HURON 15 19 4 38 4
MUSKEGON 21 20 1 42 14
TOTAL 36 39 5 80 18
BAKING AND PASTRY CULINARY
FOOD & BEV MGT
TOTAL STUDENTS
OUT OF STATE
ADULT 3 1 4 0
TRANSFER 5 4 1 10 2
TRADITIONAL 28 34 4 66 16
TOTAL 36 39 5 80 18

13
Faculty Credentials: All CIM faculty are, credentialed in compliance with faculty credential policy for CIM and meet or exceed the American Culinary Federation Education Foundation Accrediting Commission (ACFEFAC) minimum Standard 4.04 for faculty. (must be certifiable at the Sous Chef Level/equivalent or higher)
Level One
Meets minimum ACF Accreditation Commission Standard 4.4 for Post-Secondary Technical Faculty *Regardless of Certification Level Lab Instructors must hold the minimum of an Associate’s Degree and be ServSafe Certified at the Manager level.
Level Two
Exceeds minimum ACF Accreditation Commission Standard 4.4 for Post-Secondary Technical Faculty: Certified at the Working Chef Level or its equivalent: CSC/CCC/CWPC/PCC/CDRA/CJB/CD
Level Three
Exceeds minimum ACF Accreditation Commission Standard 4.4 for Post-Secondary Technical Faculty: Certified at Executive Chef Level or its equivalent : CEC/CEPC/CCA/CCE/CHE/CDRP/PCEC/RD/RS/CDM/CB
Level Four Exceeds minimum ACF Accreditation Commission Standard 4.4 for Post-Secondary Technical Faculty: Certified at the Master chef Level or its equivalent : CMC/CMPC/CMS/CDRM/CMB
FYFE: As of the latest KPI report all CIM faculty are compliant with all FYFE standards. Instructional Cost/Credit Hour: This data is not available at this time other than a number of $81.37, which is a combined number for both Clinton TWP and Port Huron and $64.23, which is a combined number for Muskegon main campus and CIM Muskegon. Our goal would be to drill down to acquire the specific cost for CIM on each campus. We are currently exploring some options of creating some CIM lectures for On Line delivery. This could provide a significant cost savings while also allowing us to offer some CIM lectures online. Average Course Size: We need to establish a reasonable average class size for CIM labs we still have not implemented this yet. Having our own lab metric for class average would give us a much more accurate picture of average class size for the CIM operations. Direct Measurers: All CIM faculty are compliant although we continue to experience some hiccups with the data entry from some faculty as described below in the Continuous Improvement Action Plan. LMS Professional Expectations: We had one instance of a faculty member removing a direct measure from the course shell this spring. The Dean and the campus president met with that faculty member to reaffirm that this is not acceptable and will not occur again. We continue to have issues with the professional expectation of faculty adding items to their shells. This for whatever reason gives faculty the impression that they can also delete items and add whatever they want. In some cases faculty have used this to change curriculum and SLO’s claiming academic freedom in doing so. It has, been made clear in written correspondence that this is not acceptable. We will continue to work on this with CIM faculty. FGEP: All CIM faculty are up to date on the FGEP process. American Culinary Federation Education Foundation Accrediting Commission (ACFEFAC) has stated their approval of the current process as a best practice.

14
Progress Report on Previous Continuous Improvement Action Plan Although there were no specific items for CIM on the continuous improvement action plan, we reviewed Program Outcomes. We determined with our advisory boards input that the Program Outcomes should remain the same. 2018-2019 Continuous Improvement Action Plan For the Baking and Pastry Arts Program we have identified two goals:
Identified Improvement Area:
Direct Measure completion. We have a few faculty who consistently miss an entry or
two in the DM rubric. The DM is, done, but looks non-compliant at audit time. We are
going to work on this.
Discuss the merit of changing the Direct Measure for the milestone course. As
mentioned above.
● Evidence:
At the end of the semester we have Direct Measures that are done but missing boxes
that were not filled in correctly.
For the milestone course we will explore the possibility and merit of changing the
milestone course. As stated our key faculty leaders in the program strongly recommend
that we do so. We just want to discuss with our advisory board members before making
a final decision.
Improvement Strategy:
For the DM we are going to work with the faculty especially those who are habitual in
this particular area and reaffirm that they need to be more vigilant when completing the
DM in their course.
For the milestone course once the final determination has been made to change the
milestone we will meet with the ID team and Director of Assessment and change the
rubric appropriately with the plan of this changing for Fall of 2019, which will be the next
time we run BAK 1410 Petit Fours and Plated Desserts.
● Expected Results:
○ For the DM issue. We will fix the issue.
○ For the milestone course, we expect that our assessment of the program
competencies in the earliest stage of the Baking and Pastry Arts program will be
more effective and more accurate. Changing to BAK 1410 will allow an additional
eight, week lab for the students to develop their skills and knowledge. Students
will also have more of an opportunity to develop the many soft skills that are

15
critical in professional kitchens, situational leadership, sense of urgency,
organizational etc. We can have a more accurate accounting of all of these areas
by assessing them in BAK 1410 as a Direct Measure than we can assessing them
in BAK 1310.
Improvement Goal #1:
100% compliance on all DM
Improvement Goal #2:
If our advisory board recommends and agrees with our assessment we would change the Baking
and Pastry Arts Program milestone direct measure.
*Please add additional goals as needed

1
Annual Assessment Plan
Assessment Process Overview Baker College embraces a philosophy of continuous quality improvement and requires program administrators to use a variety of robust assessments to ensure that the stated mission and goals are achieved. Both internal and external assessments are utilized to monitor and evaluate the program, allocate resources, create professional development, and update processes as part of the continuous quality improvement cycle. Specifically, the program assessment process is designed to evaluate data from three areas: 1) direct measures of student learning outcomes, 2) indirect measures and 3) key performance indicators. Faculty members, in collaboration with instructional designers, are responsible for developing standardized assessment materials to be used within courses. Authentic assessment materials are designed to evaluate student capabilities as they relate to program and institutional outcomes. These standardized assessment instruments become a part of the course, and all faculty members teaching the course are required to administer the instruments. It should be noted that all standardized assessment instruments are developed with the intent to embed the assessment process within the course. In this manner, students are not asked to complete additional assignments or assessments beyond those that are a part of the normal educational process. This embedding of assessment measures is important to Baker College, who believe that assessment should be an integral piece of the educational process, not an addition to it. The assessment materials are designed to support faculty members in their classroom assessment and evaluation, present students with clear expectations and performance parameters, and provide students detailed feedback on performance as it relates to learning outcomes. In addition to the direct measures, data are collected through the use of indirect measures, including surveys of program graduates, employer surveys, and/or accrediting agency reports. These data are combined with direct measures to complete the assessment data set
Key Performance Indicators (KPI) have been developed to complete the assessment plan. These KPI are intended to measure programs in relation to priorities that have been set by the Institution based on our mission and values. Baker College has identified the following as key performance indicators for evaluating the success of graduate programs:
● Enrollments ● Retention ● Graduation rates ● Employment rates of graduates ● Faculty credentials ● Course and Instructor retention information

2
These KPIs provide data for analysis and evaluation on metrics beyond teaching and learning. These metrics provide the primary operational data necessary for evaluating the stability of the program as well as for planning, budgeting, high level assessment of operations, and how the program contributes to the mission and guiding principles of the institution. Additionally, these metrics are compared across graduate programs developing benchmarks, internal targets, and minimum performance standards. Annually, the program has the responsibility of compiling the data, discussing and analyzing the data with the assessment communities, and collaboratively developing a continuous improvement plan. The continuous improvement plan is designed to identify the steps necessary for improving student learning in the designated areas. To address specific findings, the plan may include identifying actions such as redevelopment of a course, seeking additional data to clarify student achievement, or requesting alteration of specific assignments or teaching strategies to improve attainment of learning outcomes. Based on the findings, the plan may also include operational alterations to such areas as student services or faculty development. In addition to a review of data collected, the program will undertake an annual review of the program assessment plan to determine the effectiveness of the plan, and the quality and usefulness of the data collected. As a portion of this annual review, it is anticipated that the assessment plan for each program will remain a dynamic document, continuing to evolve as the faculty become more experienced in the process of program assessment.
3
Annual Assessment Plan Instructions: Please be sure to name your files (template and supporting documents) correctly so we can tell who the report and documents belong to. You will want to include the program name and the academic year that you are submitting for. Program: Culinary Arts College Of: CIM Name of person submitting: Tom Recinella for CIM Assessment Community Team Year: 2017/2018 Assessment Process:
1. Collect data regarding: a. Student learning (direct measures/course embedded assessments)
Milestone CUL 1520 Culinary Skills Two Final Practical Exam Capstone CUL 2510 Restaurant Techniques Final Practical Exam
b. Indirect measures Student Evaluation of Faculty - (Smart Evals) Faculty Course Evaluations (Qualtrics) First Destination Survey/Graduate Survey/End of Program Survey (Qualtrics) FGEP -Faculty Evaluations (Annual or per Union Contract)
c. Key performance indicators 2. Review and analyze data with the following stakeholders:
a. Assessment Community members b. Baker College Assessment Committee
3. Develop a Continuous Improvement Action Plan in collaboration with faculty 4. Submit assessment report to required location 5. Implement Continuous Improvement Action Plan 6. Review progress on the Continuous Improvement Action Plan of the prior year
assessment report Direct Measures of Student learning:

4
Milestone CUL 1520 Culinary Skills Two 2017/2018
We will be changing the Milestone Direct Measure from CUL 1520 SKILLS Two, to CUL 1530
Global Cuisine and Buffet Production. Currently progression looks like this for kitchen labs:
CUL 1510, CUL 2160, CUL 1520 Milestone, CUL 1530, CUL 2310, CUL 1410, and CUL 2510 Capstone
Below is what the rotation will look like with the change:
CUL 1510, CUL 2160, CUL 1520, CUL 1530 Milestone, CUL 2310, CUL 1410, and CUL 2510 Capstone
This will give us a better measurement of the first half of the labs and the practical assessment
of Required Knowledge and Skill Competencies (RKSC) required by our American Culinary
Federation Education Foundation Accrediting Commission (ACFEFAC). We will measure
essentially the same competencies as we currently do, Knife Skills/Protein
Fabrication/Sanitation/Food Handling/Mise en Place/Organization Culinary and Cooking
Techniques/Proper Execution/Proper Utilization of Ingredients/Serving Methods and
Presentation/Portion Size and Nutritional Balance/Menu and Ingredient Compatibility/Flavor,
Taste, Texture, and Doneness /Requisition Sheets and Final Recipes. However doing so one
course further in the program will allow for a more accurate measure of these competencies.
Milestone CUL 1520 Culinary Skills Two, outcomes align to Program Outcomes and Institutional
Student Learning Outcomes as illustrated below:

5
Milestone CUL 1520 Culinary Skills Two Required Knowledge and Skills Competency PO/SLOs/ISOs
Knife Skills POs 1, 2, 9 / SLOs 1b, 3l / IOs 1
Protein Fabrication POs 1, 2, 9 / SLOs 1b, 4d / IOs 1
Mise en Place/Organization POs 1, 9 / SLOs 2b, 5b / IOs 1
Culinary and Cooking Techniques/Proper Execution
POs 3, 4, 5, 9 / SLOs 3a, 3b, 3c, 3d, 3e, 3f, 3g, 3h, 3i, 3j, 3k, 5a, 5b / IOs 1
Proper Utilization of Ingredients POs 1, 9 / SLOs 2d, 4h / IOs 1
Serving Methods and Presentation POs 9 / SLOs 5a / IOs 1
Portion Size and Nutritional Balance POs 5, 9 / SLOs 4i / IOs 1, 6
Menu and Ingredient Compatibility POs 1, 9 / SLOs 4a, 4h, / IOs 1
Flavor, Taste, Texture, and Doneness
POs 3, 9 / SLOs 2b, 3a - 3l, 4a - 4i, / IOs 1
Requisition Sheets and Final Recipes POs 4, 9 / SLOs 2b, 2d, 4a - 4i / IOs 1, 3, 5
Timing/Workflow SLO 2b
Sanitation/Food Handling POs 5 / SLOs 1a, 2a, 2c, 2d / IOs 1

6
Capstone CUL 2510 Restaurant Techniques 2017/2018
Capstone CUL 2510 Restaurant Techniques, outcomes align to Program Outcomes and
Institutional Student Learning Outcomes as illustrated below:
Capstone CUL 2510 Restaurant Techniques Required Knowledge and Skills Competency PO/SLOs/ISOs
Mise en Place/Organization POs 1 / SLOs 2b, 3a/ IOs 1
Culinary and Cooking Techniques/Proper Execution
POs 3, 4, 9/ SLOs 2a, 2b, 3b, 3d / IOs 1
Proper Utilization of Ingredients
POs – 3 / SLOs 2d, 3b / IOs 1
Serving Methods and Presentation
POs 9 / SLOs 3b, 3d / IOs 1
Portion Size and Nutritional Balance POs 5 / SLOs 3d / IOs 1
Creativity, Menu and Ingredient Compatibility
POs 4, 9 / SLOs 3a, 3d / IOs 1, 5
Flavor, Taste, Texture, and Doneness POs 3, 9 / SLOs 3a, 3d / IOs 1
Requisition of Final Exam Items POs 9 / SLOs 2b, 2c, 2d 3b, 3c, / IOs 1, 3, 5
Recipes POs 4, 9 / SLOs 3a, 3b, 3c / IOs 1, 3, 5
Sanitation/Food Handling POs 5 / SLOs 1a, 1b, 2a, 2c, 2d / IOs 1

7
Milestone Capstone Milestone Capstone Milestone Capstone
Course BAK 1310 BAK 1710 CUL 1520 CUL2510 FBM 2610 FBM 2810
Overall
Average 86% 89% 78.69% 79.72% 93.64% 92%
PH average -------- 92.26% 81.91% 81.01% 91.42% 88.25%
MUS
average 86% 87.41% 76.4% 78.59% 95.2% 92%
Tracking Certified Culinarian for Accreditation:
Historically we have not tracked Culinary Arts graduates who earn their Certified Culinarian (CC)
Certification. However, this is now, required by the American Culinary Federation Education
Foundation Accrediting Commission (ACFEFAC) and we will be tracking it. We have implemented
a faculty mentor program that will help to ensure that students graduating from the Culinary
Arts Program will, upon graduation, complete the necessary steps to become a Certified
Culinarian (CC). We are required to submit the number of graduates who do so to the American
Culinary Federation Education Foundation Accrediting Commission (ACFEFAC)each year in our
annual report.
Results: Indirect Measures of Student Learning Student Evaluation of Faculty ( this data was pulled for our Spring 2018 self-study for the Baking and Pastry program in Port Huron prior to the report being renamed to CIM)

8
Faculty course evaluation – Qualtrics

9
We have not had a great deal of response from faculty to the faculty course evaluation. Some faculty
have stated that they filled one out and submitted yet it is not showing up. Of the responses that we
have we have gleaned that we need to rework some curriculum. A good example is FBM 2210 Menu
Planning and Analysis. We are doing a complete rewrite of this course to be effective Fall, 2019. We have
already met with the Instructional design team (on 9-5-18) regarding this course and all other areas that
we need to tweak.
First Destination Survey/Graduate Reporting Survey/End of Program Survey results: - All
of these results are together in Qualtrics as this is one survey with multiple sections
Response from students on the First Destination report has not been good. CIM Program directors and
full time faculty did spend a great deal of time contacting recent graduates. It seems to have not been as
successful as we hoped. We will continue our efforts. Having the no response information at our,
fingertips will assist us in this. We eagerly await PD having access to Qualtric data.
Summary of FGEP results:
WRK Supervisor Evaluation: (if not a DM) - Handshake/Career Services provided
■ Summarize and report the results
○ Advisory Board Minutes – we had excellent feedback from our advisory board.
The board was extremely pleased with the implementation of their suggestions
into the curriculum during the Q 2 S process.
○ The Culinary Arts Program is in good standing with the American Culinary
Federation Education Foundation Accrediting Commission (ACFEFAC). We have
submitted two annual reports since receiving our five, year grant of accreditation
on the initial site visit in Spring, of 2016 in Port Huron, and received a five year
grant of re-accreditation in Muskegon in December of 2017.
Results: Key Performance Indicators Number of students: CIM performance numbers for 2017/2018 are not currently available below is the data reported to the American Culinary Federation Education Foundation Accrediting Commission (ACFEFAC) and reflected on our website. Muskegon

10
2016-2017
REGISTERED/NEW
STUDENTS GRADUATES % EMPLOYED
Culinary Arts (AAS) 119/40 AAS - 27 AAS - 89.9%
Port Huron
2016-2017
REGISTERED/NEW
STUDENTS GRADUATES % EMPLOYED
Culinary Arts (AAS) 91/48 AAS - 11 AAS - 80%
Employment: CIM employment numbers for 2017/2018 are not currently available below is the data reported to the American Culinary Federation Education Foundation Accrediting Commission (ACFEFAC) in our annual report.
*these numbers are, combined for both CIM campuses
Student Enrollment:
System Enrollment by Department for FA 2017
College Department New Students
Return/Reentry Students
Total Students
Culinary Institute Baking and Pastry 39 64 103
Culinary Institute Culinary 43 82 125
Culinary Institute Food and Beverage Mgt 6 29 35

11
System Enrollment by Department for SP 2018
College Department New Students
Return/Reentry Students
Total Students
Culinary Institute Baking and Pastry 0 72 72
Culinary Institute Culinary 3 81 84
Culinary Institute Food and Beverage Mgt 0 26 26
*these numbers are, combined for both CIM campuses
FALL 2018 CIM REGISTERED
BAKING AND PASTRY CULINARY
FOOD & BEV MGT
TOTAL STUDENTS
OUT OF STATE
PT HURON 15 19 4 38 4
MUSKEGON 21 20 1 42 14
TOTAL 36 39 5 80 18
BAKING AND PASTRY CULINARY
FOOD & BEV MGT
TOTAL STUDENTS
OUT OF STATE
ADULT 3 1 4 0
TRANSFER 5 4 1 10 2
TRADITIONAL 28 34 4 66 16
TOTAL 36 39 5 80 18
Faculty Credentials: All CIM faculty are, credentialed in compliance with faculty credential policy for CIM and meet or exceed the American Culinary Federation Education Foundation Accrediting Commission (ACFEFAC) minimum Standard 4.04 for faculty. (must be certifiable at the Sous Chef Level/equivalent or higher)
Level One
Meets minimum ACF Accreditation Commission Standard 4.4 for Post-Secondary Technical Faculty *Regardless of Certification Level Lab Instructors must hold the minimum of an Associate’s Degree and be ServSafe Certified at the Manager level.
Level Two
Exceeds minimum ACF Accreditation Commission Standard 4.4 for Post-Secondary Technical Faculty: Certified at the Working Chef Level or its equivalent: CSC/CCC/CWPC/PCC/CDRA/CJB/CD
Level Three
Exceeds minimum ACF Accreditation Commission Standard 4.4 for Post-Secondary Technical Faculty: Certified at Executive Chef Level or its equivalent : CEC/CEPC/CCA/CCE/CHE/CDRP/PCEC/RD/RS/CDM/CB
Level Four Exceeds minimum ACF Accreditation Commission Standard 4.4 for Post-Secondary Technical Faculty: Certified at the Masterchef Level or its equivalent : CMC/CMPC/CMS/CDRM/CMB
FYFE: As of the latest KPI report all CIM faculty are compliant with all FYFE standards. Instructional Cost/Credit Hour: This data is not available at this time other than a number of $81.37, which is a combined number for both Clinton TWP and Port Huron and $64.23, which is a combined number for Muskegon main campus and CIM Muskegon. Our goal would be to drill down to acquire the specific cost for CIM on each campus. We are currently exploring some

12
options of creating some CIM lectures for On Line delivery. This could provide a significant cost savings while also allowing us to offer some CIM lectures Average Course Size: We need to establish a reasonable average class size for CIM labs we still have not implemented this yet. Having our own lab metric for class average would give us a much more accurate picture of average class size for the CIM operations. Direct Measurers: All CIM faculty are compliant although we continue to experience some hiccups with the data entry from some faculty as described below in the Continuous Improvement Action Plan. LMS Professional Expectations: We had one instance of a faculty member removing a direct measure from the course shell this spring. The Dean and the campus president met with that faculty member to reaffirm that this is not acceptable and will not occur again. We continue to have issues with the professional expectation of faculty adding items to their shells. This for whatever reason gives faculty the impression that they can also delete items and add whatever they want. In some cases faculty have used this to change curriculum and SLO’s claiming academic freedom in doing so. It has, been made clear in written correspondence that this is not acceptable. We will continue to work on this with CIM faculty. FGEP: All CIM faculty are up to date on the FGEP process. American Culinary Federation Education Foundation Accrediting Commission (ACFEFAC) has stated their approval of the current process as a best practice. Progress Report on Previous Continuous Improvement Action Plan Although there were no specific items for CIM on the continuous improvement action plan, we reviewed Program Outcomes and both Direct Measurers. We determined with our advisory boards input that the Program Outcome should remain the same. We determined that the milestone direct measure should be changed from CUL 1520 Skills Two to CUL 1530 Global Cuisine and Buffet Production. 2018-2019 Continuous Improvement Action Plan For the Culinary Program we have identified two goals:
Identified Improvement Area:
Direct Measure completion. We have a few faculty who consistently miss an entry or
two in the DM rubric. The DM is, done, but looks non-compliant at audit time. We are
going to work on this.
Change Direct Measure for milestone course. As mentioned above.
● Evidence:
At the end of the semester we have Direct Measures that are done but missing boxes
that were not filled in correctly.

13
For the milestone course we identified with our advisory board that it would be
beneficial to our data collection/assessment if we reposition the milestone course so
that it is central in the programs practical lab sequence.
Improvement Strategy:
For the DM we are going to work with the faculty especially those who are habitual in
this particular area and reaffirm that they need to be more vigilant when completing the
DM in their course.
For the milestone course we are going to meet with the ID team and Director of
Assessment and change the rubric appropriately with the plan of this changing for Fall of
2019, which will be the next time we run CUL 1530 Global Cuisine and Buffet Production.
● Expected Results:
○ For the DM issue. We will fix the issue.
○ For the milestone course, we expect that our assessment of the program
competencies in the earliest stage of the Culinary Arts program will be more
effective and more accurate. Changing to CUL 1530 will allow an additional eight,
week lab for the students to develop their skills and knowledge. Students will also
have more of an opportunity to develop the many soft skills that are critical in
professional kitchens, situational leadership, sense of urgency, organizational etc.
We can have a more accurate accounting of all of these areas by assessing them
in CUL 1530 as a Direct Measure than we can assessing them in CUL 1520.
Improvement Goal #1:
100% compliance on all DM
Improvement Goal #2:
Change the Culinary Program milestone direct measure.
*Please add additional goals as needed

1
Annual Assessment Plan
Assessment Process Overview Baker College embraces a philosophy of continuous quality improvement and requires program administrators to use a variety of robust assessments to ensure that the stated mission and goals are achieved. Both internal and external assessments are utilized to monitor and evaluate the program, allocate resources, create professional development, and update processes as part of the continuous quality improvement cycle. Specifically, the program assessment process is designed to evaluate data from three areas: 1) direct measures of student learning outcomes, 2) indirect measures and 3) key performance indicators. Faculty members, in collaboration with instructional designers, are responsible for developing standardized assessment materials to be used within courses. Authentic assessment materials are designed to evaluate student capabilities as they relate to program and institutional outcomes. These standardized assessment instruments become a part of the course, and all faculty members teaching the course are required to administer the instruments. It should be noted that all standardized assessment instruments are developed with the intent to embed the assessment process within the course. In this manner, students are not asked to complete additional assignments or assessments beyond those that are a part of the normal educational process. This embedding of assessment measures is important to Baker College, who believe that assessment should be an integral piece of the educational process, not an addition to it. The assessment materials are designed to support faculty members in their classroom assessment and evaluation, present students with clear expectations and performance parameters, and provide students detailed feedback on performance as it relates to learning outcomes. In addition to the direct measures, data are collected through the use of indirect measures, including surveys of program graduates, employer surveys, and/or accrediting agency reports. These data are combined with direct measures to complete the assessment data set
Key Performance Indicators (KPI) have been developed to complete the assessment plan. These KPI are intended to measure programs in relation to priorities that have been set by the Institution based on our mission and values. Baker College has identified the following as key performance indicators for evaluating the success of graduate programs:
● Enrollments ● Retention ● Graduation rates ● Employment rates of graduates ● Faculty credentials ● Course and Instructor retention information

2
These KPIs provide data for analysis and evaluation on metrics beyond teaching and learning. These metrics provide the primary operational data necessary for evaluating the stability of the program as well as for planning, budgeting, high level assessment of operations, and how the program contributes to the mission and guiding principles of the institution. Additionally, these metrics are compared across graduate programs developing benchmarks, internal targets, and minimum performance standards. Annually, the program has the responsibility of compiling the data, discussing and analyzing the data with the faculty council, and collaboratively developing a continuous improvement plan. The continuous improvement plan is designed to identify the steps necessary for improving student learning in the designated areas. To address specific findings, the plan may include identifying actions such as redevelopment of a course, seeking additional data to clarify student achievement, or requesting alteration of specific assignments or teaching strategies to improve attainment of learning outcomes. Based on the findings, the plan may also include operational alterations to such areas as student services or faculty development. In addition to a review of data collected, the program will undertake an annual review of the program assessment plan to determine the effectiveness of the plan, and the quality and usefulness of the data collected. As a portion of this annual review, it is anticipated that the assessment plan for each program will remain a dynamic document, continuing to evolve as the faculty become more experienced in the process of program assessment.

3
Annual Assessment Plan
Instructions: Please be sure to name your files (template and supporting documents) correctly so we can tell who the report and documents belong to. You will want to include the program name and the academic year that you are submitting for. Program: Early Childhood Education College Of: Education & Early Childhood Education Name of persons submitting: Kathy Clapp, Carol Dowsett, Liz Garman Year: 2017-2018 Assessment Process:
1. Collect data regarding: a. Student learning (direct measures/course embedded assessments) b. Indirect measures c. Key performance indicators
2. Review and analyze data with the following stakeholders: a. Assessment Community members b. Baker College Assessment Committee
3. Develop a Continuous Improvement Action Plan in collaboration with faculty 4. Submit assessment report to required location 5. Implement Continuous Improvement Action Plan 6. Review progress on the Continuous Improvement Action Plan of the prior year
assessment report
Results: Direct Measures of Student learning Please refer to the “Tables for Direct Measure Assignments Student Success Rates” document and to Baker College ECE Program Direct Measure Data Results for this section. Highlights of 2016-2017 ECE Program Direct Measure Data 34.5% of the ECE 165 students scored a 95% success rate or higher on their Special Needs Information Search Assignment, and just over 30% scored between a 90% and 94% success rate. It is academically heartening to see that the bulk of 2016-2017 ECE Students understood the course content and Student Learning Outcomes tied to this assignment. ECE 165 was/is, after all, a first-year course in the ECE Program. Similarly, just under 41% of the ECE 165 students scored at a 95% success rate or higher in their end-of-the-quarter Child Portfolio Assignment. Out of all the 2016-2017 direct measure assignment, these two also had the highest percentages of students who scored at/less than a 74% success rate—12.7% for the Special

4
Needs Information Search Assignment, and 7.4% for the Child Portfolio Assignment. Are these statistics tied to this particular student cohort? To the nature of being a 100 level ECE Student? A combination thereof? An interesting data question, to be sure! Just under 46% of the ECE 271B students scored at a 95% or higher success rate on their Professional Journal Assignment; 48.5% of them scored at this rate on their Learning Experiences Assignment. Although these two assignments are quite different from one another, they both address the ECE 271B Student Learning Outcome focusing on self-reflection and professionalism. It is heartening to see how many students grasp this important element of the ECE Profession. Approximately 82% of the ECE 281 students scored at a 95% success rate or higher on their Family Resource Binder Assignment. Wow! Student comprehension of course content and ECE 281 SLOs appears exceptionally strong. Final note: Given that there are many differences between the 2016-2017 and the 2017-2018 academic years, the ECE Program hesitates to intricately compare/contrast direct measure assignments between these two time frames. Highlights of the 2017-2018 ECE Program Direct Measure Data Success Percentages Comparisons between 2016-2017 & 2017-2018 Direct Measure Courses 2017-2018 ECE 1650 Special Needs Information Search student success at the 95% and higher, and 90—94%, were remarkably similar to this 2016-2017 ECE 165 assignment Just over 50% of the ECE 1650 students scored at a 95% or higher success rate on their Child Portfolio Direct Measure Assignment—10% above the previous year’s success rate. Kudos to these first year students—and their instructors—in navigating the assignments in their semester format! ECE 2710/ECE 271B Learning Experiences Assignment success rate comparisons point to less success overall. This year 4% less students scored 95% and above; 5% less students scored at the 90-94% success rate; 10% less students scored at the 80-84% success rate; and 8% more students scored at 74% or below. The ECE program is well aware that ECE 2710 needs to be revised and has begun the revision process. We will be able to provide this information when it is appropriate to provide it to Baker College System Course Builders. The ECE 2810 Family Resource Binder Direct Measure Assignment continues to be a “shining star” for the ECE 100/200 level direct measure courses. Although 10% less students scored at a 95% or higher success rate in 2017-2018, 5% more of them scored at the success rate of 90-94%. 3% more scored at 85-89%, and 2% more scored at 80-84%.

5
Comparison conclusions: The ECE Program has appeared to weather the proverbial quarter-to-semester-transition storm. We continue to identify areas needing improvement and work together to address them. Frequency Distributions & Averages in 2017-2018 ECE Direct Measure Assignments ECE Program Assessment Representatives engaged in the following tasks for each ECE Program Direct Measure Assignment and its corresponding course. --We examined the frequency distribution and average results (Exceeds Expectations, Meets Expectations, Does Not Meet Expectations). --We read assignment descriptions/information. --We reviewed SLOs/EOs and LOAA Tables. --We reviewed relevant standards from our program’s accrediting organization—NAEYC. --We reviewed ECE Program Outcomes. Course-specific conclusions are provided below. ECE 1650 Direct Measure data from the ECE 1650 indicate solid and consistent understanding of course content, regardless of the specific direct measure assignment (there are two). ECE 1650 Students exceeded expectations—an 88% success rate--with regards to SLOs/EOs 1a (Special Needs Information Search), 3a (Child Portfolio)—an 86% success rate--and 4a (Special Needs Information Search)—an 80/82% success rate. NAEYC Standards 1a, 1c, 2c and 3a-d appear particularly well represented in this year’s results. AAS ECE Program Outcomes 2, 4 and 7-8 appear to be well-represented in this cohort’s work. ECE 2710 The proverbial painting of ECE 2710 is incomplete this year, as no direct measure data is listed for the Journal Reflections, only the learning Experiences. In addition, ECE Program Representative are in hearty agreement that the ECE 2710 Learning Experience Plan Rubric needs to be revised. Despite these setbacks, ECE 2710 Students grasped critical components of this course and the NAEYC Standards interwoven into it. 66% of the students exceeded expectations in their comprehension of what developmentally appropriate learning environments looks like, and how to go about creating them. 62% of “our” students exceeded expectations in identifying effective ECE approaches when working with young learners; this same percentage also exceeded in their ability to create and implement curriculum. 60% exceeded expectations when it comes to understanding assessment goals/benefits/uses, and understanding quality content knowledge/resources. NAEYC Standards 1a-c, 2a-c and 3a-b are quite strongly represented, as are AAS ECE Program Outcomes 2-5 and 8.

6
ECE 2810 ECE 2810 Students appear to have a solid and consistent grasp of the concepts covered in this course and in their understanding of applicable NAEYC Standards. 84% of them, for example, exceeded expectations in collecting/organizing relevant family resource information (ECE 2810 SLO 4) and promoting child development/learning (NAEYC Standard 1b). 86% of them exceeded expectations in understanding how to cultivate respectful, reciprocal relationships with families, and why doing so is critical (ECE 2810 SLOs 1a-c and 2a-d) (NAEYC Standards 2a-b). AAS ECE Program Outcomes 2, 6 and 7 are particularly strong this academic year. ECE 3650 This course is new to the ECE Program, and it was created to address specific needs of ECE communities, regardless of their location. The ECE Program Assessment Community hypothesizes that, as more ECE Instructors and Students become aware of its existence, they will be able to integrate elements of it into other ECE courses. “First time marks” are pretty good! The majority of students met expectations with regards to the following topics: comprehending the overarching concept of trauma (63%); identifying appropriate trauma screening tools (42%); creating an appropriate learning environment (42%); and identifying appropriate community resources (47%). ECE 3650 SLOs/EOs 2a and 4a-c appear solid this year, and NAEYC Standards 1b, 2a and c, 3b-c and 5c are clearly addressed in this assignment. BS ECE Program Outcomes 1-2, 7-8, 10-11 and 13 are addressed. ECE 3710 This year’s ECE 3710 students appear to understand the importance of social development in the ECE Profession and how best to promote its development. 96% of the students exceeded expectations when engaged in conflict resolution, pro-social skill-building, and providing appropriate group guidance techniques. 96% also exceeded expectations when working to build quality relationships with lead teaching staff. Future areas of focus should include students’ ability to link curriculum and goals to assessment (only 70% at “Exceeds Expectations”), elements of professionalism (70%), and demonstrating the value of maintaining confidentiality (72%). ECE 3710 SLOs/EOs 1a, 3b and 4a appear to be exceptionally strong, as do NAEYC Standards 4a-c. BS ECE Program Outcomes 1-3 and 8 are addressed solidly as well. ECE 4610 The majority of ECE 4610 Students have a thorough grasp of course content and its real-world applications. 88% of them described specific assessment tools, assessment support professionals, family roles, and action plans in ways that exceeded assignment expectations. Interestingly, this “assessment element” of the ECE Profession contrasts with the percentages of the ECE 3710 direct measure assignment that focuses on assessment. (the 70% identified in the previous paragraph). This tropic will be a good one to track over time! 92% of them were able exceeded expectations when identifying the myriad steps needed to help a differently

7
abled child transition from one learning environment to another. 92% of the students also exceeded expectations when crafting genuinely meaningful reflections about the Case Study Assignment. ECE 4610 SLOs/EOs 2c, 2d and 5a appear to be exceptionally well represented, as do NAEYC 0Standards 3c and 3d and BS ECE Program Outcomes 7—11 and 13. 2017-2018 Overall Conclusions The ECE Program has weathered the “semester storm” in good stead. Students appear to have solid grasps on best practices and how to implement them regardless of quarter-to-semester transition hiccups. ECE Program Assessment Representatives are already actively engaged in improving ECE 2710. They also will encourage ECE Instructors to help students make connections between one ECE course and another—in general, and specifically between assessment components of ECE 3710 and ECE 4610. Provide summary of results. Include relevant graphs or charts. Direct measure summary results
should be aligned to each of your program outcomes and/or institutional outcomes. Your
summary should be written reporting the performance of those outcomes rather than
reporting the performance of a rubric. Direct measures include identified DM assessments,
certification pass rates and other assessments from external providers (Peregrine, NOCTI etc.)
Results: Indirect Measures of Student Learning Provide results here. Include relevant graphs and charts. Indirect measures of student learning include all of the following:
○ Student Evaluations of Faculty – SmartEvals
ECE Program required scores for 2017 Fall ECE Courses are as follows:
4.389/5.000 Check to make sure you understood material
0.904/1.000 Would you recommend this instructor?
Other FA 17data points of interest:
4.219/.5.000 Return work and post grades promptly
0.983/1.000 Instructor post student grades for all assignments
0.987/1.000 Did your instructor post the Syllabus in the Course Information
Folder in Blackboard?
ECE Program required scores for 2018 Spring Courses are as follows:
4.320/5.000 Check to make sure you understood material
0.944/1.000 Would you recommend this instructor?
Other SP 18 data points of interest:
4.256/5.000 Return work and post grades promptly
1.000/1.000 Instructor post student grades for all assignments
0.990/1.000 Did your instructor post the Syllabus in the Course Information
Folder in Blackboard?

8
Conclusions: ECE Instructors fulfilled elementary and supplementary teaching
tasks on Blackboard during the 2017-2018 academic year. Only one category—
Check to make sure you understood material—dropped between the fall and
spring semesters, and only by 0.050. All other categories rose between FA17
and SP18. ECE Instructors are to be commended for attending to their students’
academic needs—in general, and in particular due to the switch to semester
format FA 17.
○ Faculty course evaluation - Qualtrics
■ Summarize and report the results
■ Please refer to “2017-2018 ECE Program Faculty Course Evaluations
Highlights” document and the ECE Faculty Course Evaluation
Spreadsheet for this section.
Highlights
Despite inevitable glitches instructors experienced during the ECE Program’s
initial foray into semester teaching, ECE Instructors’ overall opinions and
assessments of their 2017-2018 courses appear consistent, and consistently
positive.19 instructors awarded their classes a “B” grade, and 17 deemed them
worthy of an “A”—remarkably close numbers. Numbers were also quite close
when examining how many ECE Instructors agreed that course-specific
SLOs/EOs were met (37), and ISLOs were met (38).
The majority of ECE Instructors were also in agreement/somewhat agreement
about the various topics posed to them in the 2017-2018 ECE Course
Evaluation. Four instructors clicked “disagree” for only four evaluation categories:
“Course assignments and activities are appropriately distributed throughout the
course modules” (ECE 1410, ECE 2710, ECE 4610); “Overall instructions for
assessments are clear and detailed” (ECE 2510, ECE 2710 twice, ECE 3750);
“Overall textbooks provide recent, relevant support for course outcomes” (ECE
2710 twice, ECE 3010 twice). And “Overall the supplemental resources provide
recent, relevant support for course outcomes” (ECE 2210, ECE 2810, ECE 3610,
ECE 4710).
Similarly, only five ECE Instructors clicked “None Do” for the following evaluation
categories: “To what extent do the rubrics in this course provide clear and
detailed criteria.” (ECE 2510 Instructor and ECE 2710 Instructor); “To what
extent do the rubrics in this course allow you to provide prompt feedback to
students?” (ECE 2710 Instructor); and “To what extent do the rubrics in this
course allow you to include…” (two ECE 2710 Instructors). All other ECE
Instructors either clicked “All do” or “Some do” when responding to these three
questions.

9
Many of the comments summarized in the “2017-2018 ECE Program Faculty
Course Evaluations Highlights” document mirror those provided of the Baker
College ECE Community in the GoogleDocs Folder “ECE Semester Courses:
Questions, Comments, Concerns”—a folder created at the start of the 2017-2018
academic year for all ECE Instructors to use when documenting
questions/comments/concerns about their courses during this first year of
teaching in a semester format. Consistency is once again apparent.
Conclusions
It’s readily apparent that ECE 2710 has posed the biggest challenge for ECE
Instructors—a consistent ‘theme” for this year’s ECE Program Annual
Assessment, to be sure! Hopefully the changes currently being made to this
course will prove to be positive and productive ones for both students and
faculty.
Despite prolonged troubles with this particular course, it appears that ECE
Instructors have been able to weather the proverbial “semester storm”.
Perceptions of 2017-2018 ECE Courses were consistently positive, and
comments provided are constructive, and responsive rather than reactive.
Perhaps this positivity can in part be attributed to ECE Instructors’ consistent
involvement, and awareness of, the Q2S Transition process and progress. It can
also be attributed to ECE Professionals’ ability to be flexible, and constructive,
and supportive of the lifelong learning process.
Final Thoughts
It is imperative that instructors’ comments about and suggestions for their
courses are sincerely acknowledged and utilized. Baker College’s current shift
from Blackboard to Canvas has delayed the implementation of some ECE
Course revisions to be put in place for the impending academic year. The ECE
Assessment Community Representatives urge their colleagues to share “2017-
2018 ECE Program Faculty Course Evaluations Highlights” with their campus-
specific ECE Instructors. Doing so shows instructors that their voices do indeed
matter, and make a difference—a key component of quality education.
○ First Destination Survey/Graduate Reporting Survey/End of Program Survey
results - All of these results are together in Qualtrics as this is one survey
with multiple sections
■ Summarize and report the results
■ Please note that the ECE Program Assessment Representatives have
focused only on ECE-specific degrees. Doing so reflects our current and
only ECE program degrees being offered. All information has been

10
retrieved from Qualtrics’ 2016/2017 First Destination Survey/Graduation
Reporting Survey/End of Program Survey.
■ Highlights
During this time frame Baker College awarded a total of 136 ECE degrees—
54% at the associate level and 46% at the bachelor level. Members of this
assessment team believe that this data is an accurate reflection of the needs
of the ECE Profession, which consistently has many job opportunities for both
two year and four year degree holders.
74.2% of our graduates are employed (65.15% full-time and 9.09% part-
time), 83.7% of whom are employed within the ECE profession. This data
highlights both the high employability of Baker College’s ECE Program
graduates and the profession’s consistent need for members in its work force.
What do “our” students know/think they know about their chosen profession,
and their ability to function effectively in it? The knowledge rate is 48.5% for
the ECE Program, and 48.6% across all Baker College terms, colleges,
campuses and programs. The knowledge rate is 50% for both ZS
Endorsements—the program closest to ECE within the College of Education
and ECE. It is, frankly, disappointing that ECE graduates’ knowledge (and/or
their perception of it) is so low. Boosting this percentage rate should be a
goal for the ECE Program.
While this assessment team also examined campus-specific enrollment data,
they readily recognized that this information does not reflect current Baker
College decisions. The ECE Program is being actively taught out at the
Auburn Hills, Cass City and Flint Campuses; the Jackson Campus is in the
beginning stages of the teach-out process. It will be “interesting” to track
campus-specific enrollment in the years to come.
■ Conclusions
ECE graduates consistently obtain/retain jobs tied to their profession—a true-
blue strength of the ECE Program and hopefully a feather in Baker College’s
proverbial cap. The ECE Program should continue to highlight this point to its
students; it should also begin grappling with how to bridge the knowledge
gap.

11
○ Summary of FGEP results for the College of - DAA/IES
○ 2017-2018 Highlights
Data collected on the six instructors who engaged in the observation/evaluation
process (no evaluations-only this academic year) points to a balanced skill set. Three
instructors exceeded expectations and three met expectations in both the Planning &
Preparation and Professional Expertise Sections of the FGEP Evaluation. Four
instructors exceeded expectations, and two met expectations, in the Learning
Environment Section. Two instructors exceeded expectations—with four meeting
expectations—in the Learning Environment Section.
Moving forward: ECE Program Assessment Representatives recognize that this
year’s FGEP data population and campuses represented (Cadillac, Clinton
Township/Port Huron, Owosso) are small. We are hopeful that the results accurately
reflect the overall skill sets of the entire program. We look forward to future FGEP
report results.
○ WRK Supervisor Evaluation (if not a DM) - Handshake/Career Services
provided
○ Baker College Institutional Student Learning Outcomes for the 2016-2017
academic year indicated that ECE 271B Students have a solid grasp of our
college’s “touchstones”. Practicum I students exceeded expectations in the
following categories: Communications, Written Communications, Avoids
Frequent Absences, Positive Interactions with Others, Professional Appearance,
Interpersonal Skills, makes Appropriate Ethical Decisions, Critical Thinking,
Improvement and Growth, Reports Promptly as Scheduled, and Personal
Knowledge and Skills.
Supervisor comments gleaned from the Handshake include: “…great addition to
our classroom…”; “…taken on more responsibility…”; “…positive and effective
way of communicating…”; “…became better at problem solving…”; “…helped
with students…taught lessons…was open to advice and changes…; “… brings
new ideas, good energy, and a positive attitude!”; “…students really enjoyed her
presence…”; and “…I would not hesitate to hire a Baker student/graduate..”..
How might the ECE Program improve? Bolster student’s
understanding/implantation of the ISLO topic Technical Understanding, as it was
the only topic in which ECE 271B Students met expectations, as opposed to
exceeding them. The program should also heed to following comments from
placement supervisors: “I really like this evaluation and think that the ones for
the courses need to be improved!”; and “I was a little disappointed when it came
to planning activities, I was not given the activities until the day of. Also, there

12
was only a day’s notice before the supervisor was coming out (to) observe the
student.”
ECE Program Assessment Community Representatives look forward to
comparing/contrasting the 2016-2017 data results with that of 2017-2018.
Results: Key Performance Indicators Provide results here. Include relevant graphs and charts. (KPI data will be provided to each Assessment Community.)
● Number of students Please note that ECE Program Assessment Community Representatives have only provided AAS ECE, BEC ECE and BS ECE information, as those reflect our current and only ECE Program degrees offered. Information has been obtained from Qualtrics 2016-2017-- First Destination Survey Results, Qualtrics Fall 2017/Spring 2018/ Summer 2018—Student Credit Load and Program Enrollment Data, and the following Google Drive—Baker College Assessment Communities Folders: 14-15 Academic Year, 15-16 Academic Year, 16-17 Academic Year, and 17-18 KPI/Employment Reports.
● Retention ● Graduation Rate ● Faculty Credentials ● Employment ● Course/Instructor Retention Data (Carina Resources/Archived Reports/Instructor
or Course Retention Report)
2013-14 2014-15 2016-17 2017-18
Total New
Students
256 (182 AAS ECE & 39 BEC ECE)
210 (154 AAS ECE, 35
BEC ECE, 4 BS ECE)
91 (63
FA16, 12 W17, 12 SP17, & 4 SU17)
24 (FA17 13
AAS, 6 BS/BEC; SP18 1 AAS, 4
BS/BEC)
Total Registered
Students
965 (594 AAS ECE & 334 BEC ECE)
843 (497 AAS ECE, 330
437 (FA16 63
new & 437
246 (FA17 108 AAS & 138

13
BEC ECE, 9 BS ECE)
returning)
BS/BEC new and returning)
Retention Rate
71.2% quarter average
(68.8 % AAS ECE &
78.5% BEC ECE)
70.0% quarter average (66.1%
AAS ECE, 78.2 %
BEC ECE, 75.0% BS
ECE)
Data currently unavailable. DCU 7/16/23
DCU
1st Year
Persistence Rate
38.2% (41.5% AAS ECE & 47.6 % BEC ECE)
38.7 % (39.8%
AAS ECE, 52.0%
BEC ECE)
DCU
DCU
Total Graduates
154 (96 AAS ECE
& 35 BEC ECE)
149 (82 AAS ECE, 59
BEC ECE)
136 (74 AAS ECE & 62 BEC/BS
ECE)
DCU
Graduation Rate
265 students (211 AAS ECE & 10 BEC ECE)
236 students (169 AAS ECE, 18
BEC ECE)
100%
100%
Employment Rate
64.1% AAS ECE & 88.9% BEC ECE
DCU
Related
Employment Rate
91.6% AAS ECE & 97.6% BEC ECE
97.7 % AAS ECE & 98.2% BEC ECE
76.0% AAS ECE & 91.7% BEC ECE
DCU
**Note: In 2016 we aligned our employment rate calculations with NACE so employment numbers will
vary from previous years for that year and beyond

14
Progress Report on Previous Continuous Improvement Action Plan Review the continuous improvement goals from 2013-2014 and 2014-2015 that the program has been working toward and share the progress that has been made. (Not all programs will have these goals in place) 2014-2015 Annual Assessment Report, ECE Program Modifications to ECE 165 and ECE 271B were implemented based on data gleaned from these classes, both of which are direct measure courses for Baker College and AAS ECE accreditor NAEYC. The results of the 2015-2016 Continuous Improvement Action Plan are as follows: **Continue BS ECE alignment: Task completed during the Q2S Transition, refined during the 2017-2018 academic year. **Identify and Implement a direct measure for CER CDAA: ECE 151 assignment identified but was not fully implemented due to CER CDAA teach-out status. **Realign ECE program to new NAEYC Standards: Task completed during the Q2S Transition, and verified during the 2017-2018 academic year. 2015-2016 Annual Assessment Report, ECE program Please note that an annual assessment report was also submitted for the CER CDAA—an ECE Program degree no longer being offered by Baker College and therefore will not be covered in this year’s Annual Assessment Report highlights. Responses for AAS ECE and BEC ECE Degrees are as follows: **Disaggregate data for identified ECE 165 Direct measure Assignment: Task completed during Q2S Transition process. Clearer connections between ECE 165 and pre-requisite ECE 110 were also addresses during this transition time. **Identify capstone and milestone assignments: Capstone assignments and milestone assignments were identified for both the AAS ECE and BS (BEC) ECE Degrees. Current direct measure assignments (100/1000 and 200/2000 levels) were used for the AAS ECE. New assignments (3000 and 4000 level) were identified for the BS ECE. Course-specific results can be found in “Results: Direct Measures of Student learning”, pages 3-7 of this document.
2018-2019 Continuous Improvement Action Plan All of the following items are be required to be included for each improvement goal that is set below:
● Identified Improvement Area:
Provide the specific area targeted for improvement. Examples include (but are not
limited to) program outcomes, institutional outcomes, inter-rater reliability on specific
assessments, low faculty completion of direct measures.

15
● Evidence:
Provide the existing data that indicates this is an identified area for improvement.
Examples include (but are not limited to) low scores on assessments, unexpected
disparity among faculty grading/rubric scores, poor ratings on indirect measures
(student perception surveys, employer feedback, external standards.)
● Improvement Strategy:
Provide a detailed explanation of the strategy selected to address the identified
improvement area. Possible strategies include (but are not limited to) changes to
academic processes, changes to curriculum, changes to assessment plan.
● Expected Results:
Provide a measurement for expected results. It is recognized that we have little
experience in this area. The goal is to build capacity is setting benchmarks and
measuring results. Initially we will rely on “Best guess” and estimations.
Improvement Goal #1: Proper Direct Measure Collection
The ECE Program needs to make sure that all direct measures are properly identified, and that
data is collected on them for both Baker College and NAEYC AAS ECE Accreditation purposes
(ECE 2710 Journal Reflection Assignment). Co-ordinating and communicating with Anne
Lansberry is paramount for this task, and ECE Department Chair Liz Garman is happy to engage
in this endeavor.
Improvement Goal #2: Addressing ECE Student Knowledge Gaps
It is in the best interest of the ECE Program to determine how to “bridge the knowledge gap”
between what is taught/covered in ECE courses, and student perceptions of what they
know/have learned. How might we tackle this task? Firstly, share and discuss this year’s
Qualtrics results on this topic with ECE Program Representatives during our monthly phone
conferences. This information can then be disseminated to representatives’ home campuses
and shared with campus-specific ECE Instructors, who should use their positive relationships
with students and knowledge of campus-specific ECE cohorts to address this gap. Some
students will, presumably, need boosts in confidence from their ECE Instructors. Other
students may need ECE Instructors to devote more time to ECE SLOs (and Baker College ISLO,
next paragraph). ECE Instructors may employ—and then share!--other ways to address this
gap. Addressing the gap identified between ECE 3710 and ECE 4610 (page 6, italicized
comment in ECE 4610 summary) also needs to be taken into consideration; communication
between instructors for these courses is paramount. An analysis of next year’s Qualtrics Surveys

16
results on this topic and comparison of them with those from this year will, hopefully, point to
“bridge-building”.
This approach is equally applicable to bolstering ECE Student grasp of Baker College’s Technical
Understanding ISLO—a concept that may very well overlap with the concept covered in the
previous paragraph.
Improvement goal #3: Quality Communication and Collaboration Amongst ECE Program
Representatives
Although this goal is nebulous with regards to evidence and expected results, it is imperative
that ECE Program Representatives continue to communicate effectively, and engage in genuine
and meaningful collaboration, with one another. Baker College has experienced a series of
monumental changes in a relatively short period of time—with more changes looming on the
proverbial horizon. The ECE Program is being taught out in four campuses. Monthly phone
conferences for our program are imperative, as are quality communication lines between
campus-specific ECE Program Representatives and “their” ECE Instructors. Given that the ECE
Profession is one that particularly values face-to-face time, perhaps additional cross-campus
ECE Program meetings can occur during the 2018-2019 academic year.
Please note that this goal is equally applicable to the looming NAEYC AAS ECE Re-Accreditation
process.
*Please add additional goals as needed

1
Annual Assessment Plan
Assessment Process Overview Baker College embraces a philosophy of continuous quality improvement and requires program administrators to use a variety of robust assessments to ensure that the stated mission and goals are achieved. Both internal and external assessments are utilized to monitor and evaluate the program, allocate resources, create professional development, and update processes as part of the continuous quality improvement cycle. Specifically, the program assessment process is designed to evaluate data from three areas: 1) direct measures of student learning outcomes, 2) indirect measures and 3) key performance indicators. Faculty members, in collaboration with instructional designers, are responsible for developing standardized assessment materials to be used within courses. Authentic assessment materials are designed to evaluate student capabilities as they relate to program and institutional outcomes. These standardized assessment instruments become a part of the course, and all faculty members teaching the course are required to administer the instruments. It should be noted that all standardized assessment instruments are developed with the intent to embed the assessment process within the course. In this manner, students are not asked to complete additional assignments or assessments beyond those that are a part of the normal educational process. This embedding of assessment measures is important to Baker College, who believe that assessment should be an integral piece of the educational process, not an addition to it. The assessment materials are designed to support faculty members in their classroom assessment and evaluation, present students with clear expectations and performance parameters, and provide students detailed feedback on performance as it relates to learning outcomes. In addition to the direct measures, data are collected through the use of indirect measures, including surveys of program graduates, employer surveys, and/or accrediting agency reports. These data are combined with direct measures to complete the assessment data set
Key Performance Indicators (KPI) have been developed to complete the assessment plan. These KPI are intended to measure programs in relation to priorities that have been set by the Institution based on our mission and values. Baker College has identified the following as key performance indicators for evaluating the success of graduate programs:
● Enrollments ● Retention ● Graduation rates ● Employment rates of graduates ● Faculty credentials ● Course and Instructor retention information

2
These KPIs provide data for analysis and evaluation on metrics beyond teaching and learning. These metrics provide the primary operational data necessary for evaluating the stability of the program as well as for planning, budgeting, high level assessment of operations, and how the program contributes to the mission and guiding principles of the institution. Additionally, these metrics are compared across graduate programs developing benchmarks, internal targets, and minimum performance standards. Annually, the program has the responsibility of compiling the data, discussing and analyzing the data with the assessment communities, and collaboratively developing a continuous improvement plan. The continuous improvement plan is designed to identify the steps necessary for improving student learning in the designated areas. To address specific findings, the plan may include identifying actions such as redevelopment of a course, seeking additional data to clarify student achievement, or requesting alteration of specific assignments or teaching strategies to improve attainment of learning outcomes. Based on the findings, the plan may also include operational alterations to such areas as student services or faculty development. In addition to a review of data collected, the program will undertake an annual review of the program assessment plan to determine the effectiveness of the plan, and the quality and usefulness of the data collected. As a portion of this annual review, it is anticipated that the assessment plan for each program will remain a dynamic document, continuing to evolve as the faculty become more experienced in the process of program assessment.

3
Annual Assessment Plan
Instructions: Please be sure to name your files (template and supporting documents) correctly so we can tell who the report and documents belong to. You will want to include the program name and the academic year that you are submitting for. Program: Teacher Preparation College Of: Education Name of person submitting: Chris Schram Year: 2018 Assessment Process:
1. Collect data regarding: a. Student learning (direct measures/course embedded assessments) b. Indirect measures c. Key performance indicators
2. Review and analyze data with the following stakeholders: a. Assessment Community members b. Baker College Assessment Committee
3. Develop a Continuous Improvement Action Plan in collaboration with faculty 4. Submit assessment report to required location 5. Implement Continuous Improvement Action Plan 6. Review progress on the Continuous Improvement Action Plan of the prior year
assessment report
Results: Direct Measures of Student learning EDU 3310
EDU 3310
Exceptional Learner
Meets or Exceeds
2018
Meets or Exceeds
2017
Meets or Exceeds
2016
Components
Introduction NA 96% 100%
Findings NA 88% 94%

4
Implications NA 100% 90%
Personal Reaction NA 97% 92%
Organization NA 92% 100%
Mechanics NA 92% 98%
Format NA 92% 88%
Oral Presentation:
Content
NA 88% 94%
Oral Presentation:
Presentation
NA 96% 96%
NA N=26 N=50
Note: The 2018 data is not available because only one student appears to have turned in the direct measure. This is being investigated. EDU 3460
EDU 3460
Integrate Technology Into
21th century Learning
Meets or Exceeds
2018
Meets or Exceeds
2017
Meets or Exceeds
2016
Components
Selection of Artifacts 100% 100% 100%
Reflection/Critique 91% 95% 100%
Use of Multimedia 95% 100% 100%
Digital Citizenship (citations,
sources, credits, etc.) 100% 97% 100%

5
Ease of use (site design) 95% 82% 100%
Quality of Writing and
Proofreading 100% 100% 100%
Professionalism and Creativity 95% 82% 100%
N=22 N=11 N=6
EDU 4310
EDU 4310
Meets or Exceeds
2018
Meets or Exceeds
2017
Meets or Exceeds
2016
Components
Standards 100% 100% 100%
Materials & Resources 100% 100% 99%
Summary, Integration, &
Reflection
100% 100% 98%
Cohesiveness, Clarity &
Flow
100% 97% 89%
Objectives 100% 100% 93%
Essential Questions 100% 100% 94%
Inclusion Activity 100% 92% 93%
Sequence 100% 100% 98%
Strategies 100% 97% 98%

6
Assessment-Formative 92% 100% 75%
Assessment-Summative 100% 100% 96%
Differentiation 100% 100% 96%
N=12 N=36 N=45
EDU 4410
EDU 4410
Classroom Development
Meets or Exceeds
2018
Meets or Exceeds
2017
Meets or Exceeds
2016
Components
Content 100% 100% 100%
Rationale 100% 100% 100%
Clarity 100% 95% 100%
N=32 N=21 N=20
EDU 4450
EDU 4450
Meets or Exceeds
2018
Components
Educational Philosophy 100%

7
Resume, Cover Letter, Two
Letters of Recommendation
83%
Standard 1 Learner
Development SLO 5a, PO 1
97%
Standard 2 Learning
Differences SLO 5a, PO 2
100%
Standard 3 Learning
Environments SLO 5a, PO 3
97%
Standard 4 Content
Knowledge SLO 5a, PO 4
97%
Standard 5 Application of
Content SLO 5a, PO 5
97%
Standard 6 Assessment
SLO 5a, PO 6
93%
Standard 7 Planning for
Instruction SLO 5a, PO
97%
Standard 8 Instructional
Strategies SLO 5a, PO 8
93%
Standard 9 Professional
Learning and Ethical
Practice SLO 5a, PO 9
100%
Standard 10 Leadership and
Collaboration SLO 5a, PO
10
100%

8
Standard 11 Technology
Use SLO 5a, PO
97%
N = 30
EDU 4810
EDU 4810
Proficient or Basic
2018
Proficient or Basic
2017
Proficient or Basic
2016
Outcomes
Domain 1
Planning and Preparation
1a Knowledge of content
and pedagogy
100% 100% 100%
1b Knowledge of students 100% 100% 100%
1c Setting instructional
outcomes
100% 100% 100%
1d Knowledge of resources 100% 100% 100%
1e Designing coherent
instruction
100% 100% 100%
1f Designing student
assessments
100% 100% 100%
Domain 2
The Classroom
Environment

9
2a Creating an
environment of respect
and rapport
100% 100% 100%
2b Culture for learning 100% 100% 100%
2c Managing classroom
procedures
100% 100% 100%
2d Managing student
behavior
100% 100% 100%
2e Organizing physical
space
100% 100% 100%
Domain 3
Instruction
3a Communicating with
students
100% 100% 100%
3b Questioning and
discussion techniques
100% 100% 100%
3c Engaging students in
learning
100% 100% 100%
3d Using assessment in
instruction
100% 100% 100%
3e Flexibility and
responsiveness
100% 100% 100%
Domain 4
Professional
Responsibilities
4a Reflecting on teaching 100% 100% 100%

10
4b Maintaining accurate
records
100% 100% 100%
4c Communicating with
families
100% 100% 100%
4d Participating in the
professional community
100% 100% 100%
4e Growing and developing
professionally
100% 100% 100%
4f Showing professionalism 100% 100% 100%
Technology
Using technology tools,
operations, and concepts
to enhance learning
100% 100% 100%
N=31 N=23 N=53
Summary Direct Measure results indicate that students are progressing as expected with proficiency meeting or exceeding 90% in most components. Students are achieving high levels of proficiency. Teacher preparation is conducting inter-rater reliability with all direct measures in summer 2018. The results of these dialogs will be used to make necessary changes to the rubrics and assignments as necessary.
Results: Indirect Measures of Student Learning
○ Student Evaluations of Faculty - SmartEvals
■ Review and report the performance of the following questions from the
Student Evaluation of Faculty evaluation results.
● Check to see that you understood the material?
○ Average Spring 2018 4.19/5
○ Fall 2017 4.12/5
○ Spring 2017 4.05/5
○ Winter 2017 4.22/5

11
○ Fall 2016 4.32/5
● Would you recommend this instructor to others?
○ Average Spring 2018 88.9%
○ Fall 2017 92.1%
○ Spring 2017 89.4%
○ Winter 2017 94.6%
○ Fall 2016 88.2%
Faculty Evaluations of the Courses (n=47)
Question Percent Agree
Course assignments and activities are appropriately distributed throughout the course modules
80%
The course content and assessments are scaffolded to promote progression of learning
96%
The students seem to have the prerequisite knowledge and skills to succeed in this course
49%
Overall instructions for assessments are clear and detailed 79%
Overall the course content and activities are congruent with student learning outcomes
94%
Overall the course content and activities promote high expectations for student learning
98%
Overall the course content and activities promote student to student collaboration
85%
Overall the course content and activities promote instructor and student engagement
96%
Overall the course content and activities are grounded in learner centered instruction
94%
Overall the course content supports students’ diverse ways of learning through varied activities
96%
Overall the student learning outcomes are inclusive of the primary concepts and relevant content and skills
98%
Overall the textbook(s) provide recent, relevant support for course outcomes 83%
Overall the supplemental resources provide recent, relevant support for course outcomes
89%
Overall the assessments are effective measures for the student learning outcomes
94%
Overall the assessments promote high expectations for student learning 100%
There is evidence of formative assessment in the course that allow practice and feedback.
94%
Rubric feedback

12
Question Percent “all do”
To what extent do the major assignments in the course include rubrics? 94%
To what extent do the rubrics in the course provide clear and detailed criteria? 91%
To what extent do the rubrics in the course allow you to provide prompt feedback?
94%
To what extent do the rubrics all you to include individualized feedback? 91%
● There is one final question, “to what extent does this course support our ISLOs”? The
responses indicate that 96% of instructors believe the course they taught strongly supports the ISLOs.
○ First Destination Survey/Graduate Reporting Survey/End of Program Survey results - All
of these results are together in Qualtrics as this is one survey with multiple
sections *Winter and Spring 2017 data
■ Employed- 91.4%
■ Related Employment- 100%
■ Average salary- $33,716.73
■ Employed at career experience site- 31%
○ Summary of FGEP results for the College of - DAA/IES-
■ 100% School of Education faculty meets or exceeds according to FGEP
results
○ WRK Supervisor Evaluation (if not a DM) - Handshake/Career Services
provided *Winter and Spring 2017 data
■ Communication 100% met or exceeded
■ Written communication 96% met or exceeded
■ Avoids frequent absences 100% met or exceeded
■ Positive interaction with others 100% met or exceeded
■ Professional appearance 100% met or exceeded
■ Interpersonal skills 100% met or exceeded
■ Technical understanding 100% met or exceeded
■ Makes appropriate ethical decisions 100% met or exceeded
■ Critical thinking 100% met or exceeded
■ Attitude 100% met or exceeded
■ Improvement and growth 100% met or exceeded
■ Reports promptly as scheduled 100% met or exceeded
■ Personal knowledge and skills 96% met or exceeded
■ Of Note: Over 70% Exceeds- Professional appearance, Communication,
and technical understanding
○ Advisory Board Minutes -
■ Comments from AB members and community partners frequently include
praise for the final student teaching year format (Fall courses and
fieldwork moving into full time student teaching experience)

13
○ Other program based surveys/accreditation survey results
■ Program Assessment Data- Direct Link
Results: Key Performance Indicators
2014-15 2015-16 2016-17 2017-18
Total New
Students 201
Total Registered
Students 811
Retention Rate 69.9%
1st Year
Persistence Rate 48.0%
Total Graduates 94
Graduation Rate 76.5% 87.0%
Employment Rate 99.6% 94.1% 100%
Related
Employment Rate 95.7% 89.4%
**Note: In 2016 we aligned our employment rate calculations with NACE so employment numbers will
vary from previous years for that year and beyond
***No new KPI data as of 7/23/18
Progress Report on Previous Continuous Improvement Action Plan 2018-2019 Continuous Improvement Action Plan Improvement Goal #1: Increase teacher candidate proficiency for using student data to make
instructional decisions
Identified Improvement Area:
Increase teacher candidate proficiency for using student data to make instructional decisions
Evidence:
1. Survey data from the employers of our recent graduates indicated that graduate
manipulation of assessment data (analysis, modifications to instruction) was an area of
improvement. In the chart below, assessment data is broken into smaller components of the
Instructional Practice question. Sub-categories can be identified from the original question
below.

14
2. Within the survey responses from this same survey, the following comment
was noted:
○ “Overall, this graduate was well-prepared. I am finding that not enough emphasis has been put on
teaching teachers HOW to write quality assessments and analyze the data from them to inform
instruction. I put my entire team (gym teacher included) into a study on "assessment literacy."”

15
Improvement Strategy:
In EDU 4450 student teaching seminar (Module 5), we will request students to access local
assessments from placements. In cases where this is not an option, we will provide local
assessment data. Teacher candidates will then work together during seminar to use the data to
create actionable next steps for their student groups. Ideally, students would then be able to
follow through with those next steps and observe the outcome. There will be times when this
is not possible. Student assessment data analysis and action plans will be reviewed by
supervisors, cooperating teachers, and the EDU 4450 instructor for determination of
proficiency.
Expected Results:
A Google Form will be used in the class to capture the proficiency data from teacher
candidates. Since the supervisor, the instructor, and the cooperating teacher are all expected
to determine proficiency, it is expected that 100% of teacher candidates will reach proficiency
in this area. The pre and post assessments can be found by following these links:
Pre-assessment: https://goo.gl/forms/0pyebf605yEdpI8j1 Post-assessment: https://goo.gl/forms/Sv69M5vqsVrrbRaJ2
Improvement Goal #2: Increase teacher candidate proficiency for planning instruction for
diverse student learners
Identified Improvement Area:
Increase teacher candidate proficiency for planning instruction for diverse student learners
Evidence:
1. Employer survey results indicate that graduates are in need of support in meeting the needs
of diverse learners. Survey question and results chart are located below.

16
2. Satisfaction of Graduates, one year after leaving college (CAEP Standard 4.4)
I feel my teaching experience during this year 2013 Graduates
2014 Graduates
2015 Graduates
2016 Graduates
was positively affected by the field experiences and clinical practice I had through my preparation program
100% 90.9% 100% 100%
included the ability to work with diverse students at my certificate grade level, including students with disabilities and English language learners, because of the preparation I received.
100% 90.9% 100% 75%
was shaped by the regular, constructive feedback provided by my college/university supervisor.
100% 100% 100% 100%
was better because of the opportunities I had to voice concerns and issues to my college/university supervisor.
66.7% 81.2% 100% 100%
was a product of the high expectations for my clinical practice and field experiences held by my college/university supervisor during my preparation
100% 100% 100% 100%
Overall Efficacy 93.3% N=6
92.7% N=11
100% N=2
95% N=4
Improvement Strategy:
Change the Cultural Experience Reflection ACE assignment to include teacher candidate
exposure to teaching English Language Learners (ELLs). Changes will include students spending
10-15 hours observing and interacting with currently practicing teachers of ELLs during the fall
before student teaching (EDU 4410 and 4510). Students will reflect on the experience within
the amended ACE assignment.

17
Expected Results:
Increase in survey ratings for the Year Out and the Principal Surveys.

1
Annual Assessment Plan
Assessment Process Overview Baker College embraces a philosophy of continuous quality improvement and requires program administrators to use a variety of robust assessments to ensure that the stated mission and goals are achieved. Both internal and external assessments are utilized to monitor and evaluate the program, allocate resources, create professional development, and update processes as part of the continuous quality improvement cycle. Specifically, the program assessment process is designed to evaluate data from three areas: 1) direct measures of student learning outcomes, 2) indirect measures and 3) key performance indicators. Faculty members, in collaboration with instructional designers, are responsible for developing standardized assessment materials to be used within courses. Authentic assessment materials are designed to evaluate student capabilities as they relate to program and institutional outcomes. These standardized assessment instruments become a part of the course, and all faculty members teaching the course are required to administer the instruments. It should be noted that all standardized assessment instruments are developed with the intent to embed the assessment process within the course. In this manner, students are not asked to complete additional assignments or assessments beyond those that are a part of the normal educational process. This embedding of assessment measures is important to Baker College, who believe that assessment should be an integral piece of the educational process, not an addition to it. The assessment materials are designed to support faculty members in their classroom assessment and evaluation, present students with clear expectations and performance parameters, and provide students detailed feedback on performance as it relates to learning outcomes. In addition to the direct measures, data are collected through the use of indirect measures, including surveys of program graduates, employer surveys, and/or accrediting agency reports. These data are combined with direct measures to complete the assessment data set
Key Performance Indicators (KPI) have been developed to complete the assessment plan. These KPI are intended to measure programs in relation to priorities that have been set by the Institution based on our mission and values. Baker College has identified the following as key performance indicators for evaluating the success of graduate programs:
● Enrollments ● Retention ● Graduation rates ● Employment rates of graduates ● Faculty credentials ● Course and Instructor retention information

2
These KPIs provide data for analysis and evaluation on metrics beyond teaching and learning. These metrics provide the primary operational data necessary for evaluating the stability of the program as well as for planning, budgeting, high level assessment of operations, and how the program contributes to the mission and guiding principles of the institution. Additionally, these metrics are compared across graduate programs developing benchmarks, internal targets, and minimum performance standards.
Annually, the program has the responsibility of compiling the data, discussing and analyzing the data with the faculty council, and collaboratively developing a continuous improvement plan. The continuous improvement plan is designed to identify the steps necessary for improving student learning in the designated areas. To address specific findings, the plan may include identifying actions such as redevelopment of a course, seeking additional data to clarify student achievement, or requesting alteration of specific assignments or teaching strategies to improve attainment of learning outcomes. Based on the findings, the plan may also include operational alterations to such areas as student services or faculty development.
In addition to a review of data collected, the program will undertake an annual review of the program assessment plan to determine the effectiveness of the plan, and the quality and usefulness of the data collected. As a portion of this annual review, it is anticipated that the assessment plan for each program will remain a dynamic document, continuing to evolve as the faculty become more experienced in the process of program assessment.
Annual Assessment Plan
Instructions: Please be sure to name your files (template and supporting documents) correctly so we can tell who the report and documents belong to. You will want to include the program name and the academic year that you are submitting for.
Program: Associate in Applied Science in Computer Aided Design College Of: College of Engineering Name of person submitting: Russell L. Rhoton Year: 2017-2018 Assessment Process:
1. Collect data regarding: a. Student learning (direct measures/course embedded assessments) b. Indirect measures c. Key performance indicators
2. Review and analyze data with the following stakeholders: a. Assessment Community members b. Baker College Assessment Committee
3. Develop a Continuous Improvement Action Plan in collaboration with faculty 4. Submit assessment report to required location 5. Implement Continuous Improvement Action Plan 6. Review progress on the Continuous Improvement Action Plan of the prior year
assessment report

3
Results: Direct Measures of Student learning
The Direct Assessment measures instituted by the AAS CAD department are part of the wider process of collecting Direct Assessment data at the level of the entire Baker College System. Due to the relatively small number of students in the AAS CAD program, the Direct Assessment datasets are collected every time each of the targeted courses is taught. The Direct Assessment measures fall into the following categories:
1. Naming conventions 2. Technical correctness of the Model 3. Technical correctness of the 2D Drawing 4. Proper use of annotation to describe the part 5. Correct submission format
The target percentage levels for performance were set at or above 60%.
Courses examined during the 2017-2018 period (categories) were: CAD2310 ProEngineer Basic (1-5) All assessment instruments (1-5) were used. The results indicate that the goal set by the program was achieved. A percentage of 75 to 100%% of students performed above the Acceptable level.
CAD2360 SolidWorks Basic (1-5) All assessment instruments (1-5) were used. The results indicate that the goal set by the program was achieved. A percentage of 75 to 100%% of students performed above the Acceptable level.
Results: Indirect Measures of Student Learning Indirect measures of student learning include several metrics across the learning experience. These metrics are comprised of several parts; they are:
Student Evaluations of Faculty Faculty course evaluations (2017-2018) First Destination Survey/Graduate Reporting Survey/End of Program Survey Summary of FGEP results for the College of - DAA/IES WRK Supervisor Evaluations
This survey examined several areas of faculty performance over two semesters, FA17 and SP18, the response rate was 28% for FA17 (5 responses) and 35% for SP18 (22 responses), and this reporting concentrated on two questions:
Did Instructor check to see that you understood the material?
Data show a slight increase in student perception of faculty engagement leading up to the change from Quarters to Semesters in SP18 this question showed a low score (4.3/5.0) possibly due to concern and/or anxiety surrounding the change.

4
Significant hiring of new instructors has lowered the teaching-experience levels of the staff in the engineering program. Training and mentoring of new faculty in both teaching strategies, and lab teaching methods as well as the standardization of lab materials are expected to increase the scores during the succeeding semesters.
Would you recommend this Instructor?
Again, data shows an increase in willingness to recommend an instructor as the change
approached, reaching a high (0.95/1) in SP18. We expect to increase these scores as a result of
planned training and mentoring as described above.
Faculty course evaluations (2017-2018)
Results were positive overall; responses fell between the Agree and Somewhat Agree choices
on the Likert Scale survey (several sections used differing point scales).

5
First Destination Survey/Graduate Reporting Survey/End of Program Survey
First Destination Survey/Graduate Reporting Survey/End of Program Survey results are supplied
in Qualtrics as sections of one survey. The First Destination Survey portion (Fig. 3) shows that
graduates (18) from the College of Engineering (AAS-100%) during the 2016-2017 were made
up of members of the CAD (61%) and CAD1 (39%) programs. Graduates were from the AH-22%,
CA-17, Other campuses-11%, and JK-28%.
Career outcomes portion of the survey indicated that all (100%) of students were employed at
their Career Experience Site full time after graduation. The average wage was reported as
$41,594.00

6
The Student End of Program Evaluation was presented as an exit-interview metric and asked
the eight (8) graduating students (100% response) in the Engineering program questions about
program-provided teaching/learning equipment and facilities, preparedness.
In the portion of the survey (4-point Likert-approval) concerned with how well Baker prepared
the students in various areas of their experience ranging from leadership, teamwork, problem
solving to math and technical skills. Respondents felt that their Baker experiences fell between
2 and 3.5 on the 4.0 point scale with questions about courses and course content generally
receiving the highest score (3.5/4.0), and exposure to and the ability to interact with different
groups and concerns about the types of General education courses offered showing the least
satisfaction (2.0/4.0).
In the second portion, examining how well Baker prepared students for different career
attributes the following: leadership, Teamwork, and Cultural/Global Diversity Skills ranked
lowest (1.5-2.0) while professional behavior, technical skills, math skills, and lifelong learning
ranked highest (3.0).
Summary of FGEP and WRK Evaluation
Baker Faculty Growth and Evaluation Process (FGEP) summary analysis results are shown
below. The survey of all campuses offering Engineering (ME, EE, CE) or related (CAD, AMT, CNC)
courses, showed that all faculty surveyed (evaluation-86.7% and observation-13.3%) met or
exceeded expectations in the four areas of concern, namely, planning and preparation,
professional expertise, learning environment, and learning facilitation.
WRK Supervisor Evaluation provided by Handshake/Career Services indicate the relative success of Baker Computer Aided Design (CAD) students while serving their internships (WRK201). Students were divided between campuses offering AAS in CAD (AH-22%, CA-11%, FL-22%, JK-17%, and MU-28%. Students fulfilled the requirement in most part (53%) during the summer semester with the remainder divided between the winter (12%) and spring (35%) semesters. All 46 to 38% of interns met the expectations of their employers and 54 to 62% of interns exceeded expectations. Average salary was $41,594.00.

7
Results: Key Performance Indicators
2013-14 2014-15 2016-17 2017-18
Total New
Students 59 55 53 3
Total Registered
Students 165 169 154 52
Retention Rate 78.1% 50%
1st Year
Persistence Rate 55.6% 74.4%
Total Graduates 17 28 18 4
Graduation Rate 26% 31.4%
Employment Rate n/a n/a 100% 100%
Related
Employment Rate n/a n/a 100% 100%
**Note: In 2016 we aligned our employment rate calculations with NACE so employment numbers will
vary from previous years for that year and beyond
Faculty Credentials
Faculty Credential reports for the College of Engineering as a whole are provided for both the
FA17 and SP18 semesters. Total faculty in the College of Engineering was 56 in FA17 and 59 in
SP18, or an increase of 3.57%. Of those faculty members, both FT and ADJ, we saw both
increases/decreases in faculty credentials: Doctoral (-8.05%), Master (+3.03%), Bachelor
(+5.57%), No degree (-3.57%). In addition, four instructors continued their pursuit of advanced
degrees from FA17 to SP18.
Table 1. Faculty in College of Engineering divided by FT/ADJ, and by degree earned.
The number of credit hours taught by faculty in the College of Engineering was 269 FA17 and
303 in the SP18 semester. Credit hours are broken down (Fig.4) showing a general increase in
hours taught by instructors holding Bachelor, Master, and Associate degrees, with a decrease in
those taught by faculty having Doctoral or No degrees.
FA17 SP18
Total 56 59
Full time (%) 7 (12.5%) 7 (11.86%)
Adjunct (%) 49 (87.50) 52 (88.4)
Credential
Doctoral (%) 14 (25) 10 (16.95)
Master (%) 32 (57.14) 37 (62.71)
Bachelor (%) 4 (7.14) 6 (10.17)
No Degree (%) 2 (3.57) 0 (0)

8
The system total of Lab and Independent Study (IS) sections was also reported for FA17 and
SP18, showing a total of 370 and 429 respectively.
FA17 SP18
Doctoral (%) 61 (21.11) 58 (18.48)
Master (%) 175 (60.55) 191 (63.04)
Bachelor (%) 22 (7.61) 27 (8.91)
Associate (%) 16 (5.54) 26 (8.58)
No Degree (%) 15 (5.19) 3 (0.99)
From FA17-SP18 faculty report slides.
Table 2 Total number of credit hours on Course Schedule and number taught by faculty and by degree.
FA17 SP18
FT Lab (%) 58 (15.68) 115 (28.1)
ADJ Lab (%) 181
(48.92) 186 (43.36)
FT IS (%) 10 (11.91) 15 (16.13)
ADJ IS (%) 47 (55.95) 58 (62.37)
Table 3. Total number of Lab classes on Course Schedule showing number of lab classes taught by faculty and degrees.
Taken from FA17-SP18 faculty report slides
Lab hours
FA17 SP18
Zero Credit 41 43
FT 6 (14.63) 4 (9.30)
ADJ 28 (68.29) 22 (51.16)
Independent study
FA17 SP18
Total Courses 9 14
FT 2 (16.67) 4 (28.57)
ADJ 6 (50.0) 10 (71.43)
IS credits
FA17 SP18
Total Courses 32 (11.07) 44 (14.52)
From FA17-SP18 faculty report slides.
Table 1. . Showing total lab hours, independent study courses and Independent study credits FA17 to SP18

1
2018-2019 Continuous Improvement Action Plan
Improvement Goal #1:
Increase ‘detailing’ skills of AAS CAD students in response to industry requests.
Identified Improvement Area:
Increase portion of instructional time spend on detailing of mechanical parts and assemblies.
Evidence:
Feedback from local industry contacts indicates that program graduates (not entirely Baker),
are not proficient in portions of the CAD skill-set, i.e., detailing of mechanical parts and
assemblies.
Improvement Strategy:
Addition of a pool of drawings and parts, to detail throughout the semester, to the coursework.
The pool can be tailored to the course level (basic, intermediate, advanced) with expected skill-
levels increasing with the course difficulty.
Expected Results:
Increased practice and assessment at the detail drawing level will serve to increase competence
in the skills required by CAD detailers required in local industry.
Improvement Goal #2:
Increase assessment within the AAS CAD program, and normalize the software suites used in FL
and JK campuses
Identified Improvement Area:
Add assessment instruments at each level of coursework (basic, intermediate, advanced) to
verify the increase in student mastery of the central skillset (CAD operation) of the AAS CAD
degree. Trim the number of software options available to the student.
Evidence:
CAD2310 ProEngineer Basic and CAD2360 SolidWorks Basic are the only AAS CAD courses to be
assessed during the 2017-2018 period. In addition, ProEngineer is often taught at the JK campus
program. JK employers do not use ProE, and are not interested in hiring someone with that
skill.
Improvement Strategy:
Add assessment instruments at each level of coursework (basic, intermediate, advanced) to
verify the increase in student mastery of the central skillset (CAD operation) of the AAS CAD
degree. Trim the number of software options available to the student.
Expected Results:
Expected outcome is graduates better trained in CAD software operation, with assessments
along the way (during the program) to ensure progress and measureable attainment of skills.

1
Annual Assessment Plan
Assessment Process Overview Baker College embraces a philosophy of continuous quality improvement and requires program administrators to use a variety of robust assessments to ensure that the stated mission and goals are achieved. Both internal and external assessments are utilized to monitor and evaluate the program, allocate resources, create professional development, and update processes as part of the continuous quality improvement cycle. Specifically, the program assessment process is designed to evaluate data from three areas: 1) direct measures of student learning outcomes, 2) indirect measures and 3) key performance indicators. Faculty members, in collaboration with instructional designers, are responsible for developing standardized assessment materials to be used within courses. Authentic assessment materials are designed to evaluate student capabilities as they relate to program and institutional outcomes. These standardized assessment instruments become a part of the course, and all faculty members teaching the course are required to administer the instruments. It should be noted that all standardized assessment instruments are developed with the intent to embed the assessment process within the course. In this manner, students are not asked to complete additional assignments or assessments beyond those that are a part of the normal educational process. This embedding of assessment measures is important to Baker College, who believe that assessment should be an integral piece of the educational process, not an addition to it. The assessment materials are designed to support faculty members in their classroom assessment and evaluation, present students with clear expectations and performance parameters, and provide students detailed feedback on performance as it relates to learning outcomes. In addition to the direct measures, data are collected through the use of indirect measures, including surveys of program graduates, employer surveys, and/or accrediting agency reports. These data are combined with direct measures to complete the assessment data set
Key Performance Indicators (KPI) have been developed to complete the assessment plan. These KPI are intended to measure programs in relation to priorities that have been set by the Institution based on our mission and values. Baker College has identified the following as key performance indicators for evaluating the success of graduate programs:
● Enrollments ● Retention ● Graduation rates ● Employment rates of graduates ● Faculty credentials ● Course and Instructor retention information

2
These KPIs provide data for analysis and evaluation on metrics beyond teaching and learning. These metrics provide the primary operational data necessary for evaluating the stability of the program as well as for planning, budgeting, high level assessment of operations, and how the program contributes to the mission and guiding principles of the institution. Additionally, these metrics are compared across graduate programs developing benchmarks, internal targets, and minimum performance standards. Annually, the program has the responsibility of compiling the data, discussing and analyzing the data with the faculty council, and collaboratively developing a continuous improvement plan. The continuous improvement plan is designed to identify the steps necessary for improving student learning in the designated areas. To address specific findings, the plan may include identifying actions such as redevelopment of a course, seeking additional data to clarify student achievement, or requesting alteration of specific assignments or teaching strategies to improve attainment of learning outcomes. Based on the findings, the plan may also include operational alterations to such areas as student services or faculty development. In addition to a review of data collected, the program will undertake an annual review of the program assessment plan to determine the effectiveness of the plan, and the quality and usefulness of the data collected. As a portion of this annual review, it is anticipated that the assessment plan for each program will remain a dynamic document, continuing to evolve as the faculty become more experienced in the process of program assessment.

3
Annual Assessment Plan
Program: AAS Mechanical Technology College Of: Engineering Name of person submitting: Dr. Pattabhi Sitaram Year: 2017-18 Results: Direct Measures of Student learning Two courses, EET1610 Introduction to Robotics and EGR2990 Capstone Project were considered for assessment. The assessment for EET1610 included a project demonstration. A project and presentation were included in the assessment of EGR2990. For the Project Report assessment, the goal is to have at least 60% of students with an average score at the Excellent or Good level. Similar goas was targeted for the Presentation assessment. Both courses were not assessed in the year 2017-18, but will be assessed in the next academic year.
Results: Indirect Measures of Student Learning
● Student Evaluations of Faculty – the rate of response was 28%. There were a total of 17
responses for Fall 2017 and Spring 2018.
○ Check to see that you understood the material?
■ The result for this question, 3.98/5, is good. However, we would like to
bring this to at least 4.5 in the academic year 2018-19.
○ Would you recommend this instructor to others?
■ The score here was 0.89/1, which is excellent. We would want to either
maintain or better this score in future years.
● Faculty course evaluation
○ The results were very positive overall. There were comments that supplemental
resources were not provided. There was also a comment that rubrics are not the
best way to evaluate assignments that included solving electrical engineering
problems.
● First Destination Survey/Graduate Reporting Survey/End of Program Survey results
○ There were 8 graduates and 4 participated in the First Destination Survey. Two of
the survey participants were employed, with both working in the related field.
○ The End of Program Survey results indicated that students strongly agree that
externship/internship was a valuable component of the program. Overall,
students agreed on the effectiveness of many components of the program.
● Summary of FGEP results for the College of Engineering

4
○ There were 14 FGEP results for the Mechanical Technology program in 2017-18. All faculty evaluated met expectations in all four categories, with two faculty exceeding the expectations in the Professional Expertise category.
● WRK Supervisor Evaluation
○ All students met or exceeded the expectations of their supervisors in all categories.
Results: Key Performance Indicators The Key Performance Indicators for recent 4 years are shown below.
2014-15 2015-16 2016-17 2017-18
Total New
Students 26 16 8 4
Total Registered
Students 50 64 37 30
Retention Rate
1st Year
Persistence Rate
Total Graduates 4 4 8 8
Graduation Rate
Employment
Rate 0% 75% 50% 50%
Related Employment
Rate NA 66.7% 100% 100%
**Note: In 2016 we aligned our employment rate calculations with NACE so employment
numbers will vary from previous years for that year and beyond
Progress Report on Previous Continuous Improvement Action Plan Review the continuous improvement goals from 2014-2015 and 2015-2016 that the program has been working toward and share the progress that has been made. (Not all programs will have these goals in place) 2014-15 Goals 2015-16 “Students need to write better lab reports and become more proficient with design problems.”

5
2018-2019 Continuous Improvement Action Plan All of the following items are required to be included for each improvement goal that is set below:
● Identified Improvement Area:
Provide the specific area targeted for improvement. Examples include (but are not
limited to) program outcomes, institutional outcomes, inter-rater reliability on specific
assessments, low faculty completion of direct measures.
● Evidence:
Provide the existing data that indicates this is an identified area for improvement.
Examples include (but are not limited to) low scores on assessments, unexpected
disparity among faculty grading/rubric scores, poor ratings on indirect measures
(student perception surveys, employer feedback, external standards.)
● Improvement Strategy:
Provide a detailed explanation of the strategy selected to address the identified
improvement area. Possible strategies include (but are not limited to) changes to
academic processes, changes to curriculum, changes to assessment plan.
● Expected Results:
Provide a measurement for expected results. It is recognized that we have little
experience in this area. The goal is to build capacity is setting benchmarks and
measuring results. Initially we will rely on “Best guess” and estimations.
Improvement Goal #1: Student Evaluations of Faculty
o According to the student surveys, faculty need to check more often to ensure
students understand the course material. Also, we would like students to be
more likely to recommend our faculty to other students. This can be measured
with the student surveys already in place, and additional surveys administered
mid-semester. The main strategy to improve these scores is to assign more in-
class problems, with associated discussion.
o More in class programs/activities to improve student understanding of the
material.
Improvement Goal #2: Curriculum development
We have identified the need to update few lab activities and manuals.

6
o Development of additional lab activities and supplemental materials for ME2710
Pneumatics and Hydraulics.
o Inclusion of supplemental materials in relevant courses.
Improvement Goal #3: Assessment
o We want to replace the assessment in CAD 1410, and develop and administer the
assessment in ISE 2110 Manufacturing Processes.
o The assessments in courses EET 1610 and EGR 2990 will be administered also.

1
Annual Assessment Plan
Assessment Process Overview Baker College embraces a philosophy of continuous quality improvement and requires program administrators to use a variety of robust assessments to ensure that the stated mission and goals are achieved. Both internal and external assessments are utilized to monitor and evaluate the program, allocate resources, create professional development, and update processes as part of the continuous quality improvement cycle. Specifically, the program assessment process is designed to evaluate data from three areas: 1) direct measures of student learning outcomes, 2) indirect measures and 3) key performance indicators. Faculty members, in collaboration with instructional designers, are responsible for developing standardized assessment materials to be used within courses. Authentic assessment materials are designed to evaluate student capabilities as they relate to program and institutional outcomes. These standardized assessment instruments become a part of the course, and all faculty members teaching the course are required to administer the instruments. It should be noted that all standardized assessment instruments are developed with the intent to embed the assessment process within the course. In this manner, students are not asked to complete additional assignments or assessments beyond those that are a part of the normal educational process. This embedding of assessment measures is important to Baker College, who believe that assessment should be an integral piece of the educational process, not an addition to it. The assessment materials are designed to support faculty members in their classroom assessment and evaluation, present students with clear expectations and performance parameters, and provide students detailed feedback on performance as it relates to learning outcomes. In addition to the direct measures, data are collected through the use of indirect measures, including surveys of program graduates, employer surveys, and/or accrediting agency reports. These data are combined with direct measures to complete the assessment data set
Key Performance Indicators (KPI) have been developed to complete the assessment plan. These KPI are intended to measure programs in relation to priorities that have been set by the Institution based on our mission and values. Baker College has identified the following as key performance indicators for evaluating the success of graduate programs:
● Enrollments ● Retention ● Graduation rates ● Employment rates of graduates ● Faculty credentials ● Course and Instructor retention information

2
These KPIs provide data for analysis and evaluation on metrics beyond teaching and learning. These metrics provide the primary operational data necessary for evaluating the stability of the program as well as for planning, budgeting, high level assessment of operations, and how the program contributes to the mission and guiding principles of the institution. Additionally, these metrics are compared across graduate programs developing benchmarks, internal targets, and minimum performance standards. Annually, the program has the responsibility of compiling the data, discussing and analyzing the data with the faculty council, and collaboratively developing a continuous improvement plan. The continuous improvement plan is designed to identify the steps necessary for improving student learning in the designated areas. To address specific findings, the plan may include identifying actions such as redevelopment of a course, seeking additional data to clarify student achievement, or requesting alteration of specific assignments or teaching strategies to improve attainment of learning outcomes. Based on the findings, the plan may also include operational alterations to such areas as student services or faculty development. In addition to a review of data collected, the program will undertake an annual review of the program assessment plan to determine the effectiveness of the plan, and the quality and usefulness of the data collected. As a portion of this annual review, it is anticipated that the assessment plan for each program will remain a dynamic document, continuing to evolve as the faculty become more experienced in the process of program assessment.

3
Annual Assessment Plan
Instructions: Please be sure to name your files (template and supporting documents) correctly so we can tell who the report and documents belong to. You will want to include the program name and the academic year that you are submitting for. Program: Bachelor of General Studies College Of: Interdisciplinary Studies Name of person submitting: Chris Schram Year: 2017-18 Assessment Process:
1. Collect data regarding: a. Student learning (direct measures/course embedded assessments) b. Indirect measures c. Key performance indicators
2. Review and analyze data with the following stakeholders: a. Assessment Community members b. Baker College Assessment Committee
3. Develop a Continuous Improvement Action Plan in collaboration with faculty 4. Submit assessment report to required location 5. Implement Continuous Improvement Action Plan 6. Review progress on the Continuous Improvement Action Plan of the prior year
assessment report
Results: Direct Measures of Student learning For the bachelor of general studies, there is only one direct measure, the capstone portfolio. While this rubric and assignment was revised for fall 2018, the data on the old rubric is provided below. There were 25 students who completed the portfolio in 2017-18.
ISLO Assessed Number of Scores in Rubric Aligned to ISLO
Percent Competent or Above (Average score out of 3)
#1 Career ready knowledge and skills 2 96.0% (2.82)
#2 Attitudes and behaviors that promote success in the workplace and effective social interactions with diverse people.
2 100.0% (2.92)
#3 Information literacy, which includes recognizing the need for
1 96.0% (2.88)

4
information and identifying, locating, evaluating, and effectively using that information.
#4 Effective communication in various academic and career settings, using technology as appropriate.
5 98.4% (2.92)
#5 Critical thinking – including analysis, syntheses, and problem solving – which is applicable to all fields of study, workplaces, and other everyday life situations.
2 96.0% (2.84)
#6 Broad-based knowledge, which includes an understanding of cultural, ethical, social, political, and global issues.
2 100% (2.98)
Results: Indirect Measures of Student Learning The data for the bachelor of general studies are taken from the College of Interdisciplinary Studies. This is a bit misleading, as the students in the bachelor degree do not always take their general education courses at Baker College.
Student Evaluations Fall 2016
Winter 2017
Spring 2017
Fall 2017
Spring 2018
Check for understanding 4.15 4.21 4.26 4.08 4.09
Would you recommend instructor? 86.9% 88.7% 89.2% 85.8% 85.4%
These numbers are typically below that of the other Colleges. While the numbers are strong, there is a bit of a downward trend with the change to semesters. This change will be monitored. There are no faculty evaluations of the capstone course on file. In general, across the COIS, we see the following:
Question Percent Agree
Course assignments and activities are appropriately distributed throughout the course modules
77%
The course content and assessments are scaffolded to promote progression of learning
84%

5
The students seem to have the prerequisite knowledge and skills to succeed in this course
65%
Overall instructions for assessments are clear and detailed 70%
Overall the course content and activities are congruent with student learning outcomes
91%
Overall the course content and activities promote high expectations for student learning
90%
Overall the course content and activities promote student to student collaboration
73%
Overall the course content and activities promote instructor and student engagement
89%
Overall the course content and activities are grounded in learner centered instruction
88%
Overall the course content supports students’ diverse ways of learning through varied activities
81%
Overall the student learning outcomes are inclusive of the primary concepts and relevant content and skills
93%
Overall the textbook(s) provide recent, relevant support for course outcomes 80%
Overall the supplemental resources provide recent, relevant support for course outcomes
78%
Overall the assessments are effective measures for the student learning outcomes
84%
Overall the assessments promote high expectations for student learning 91%
There is evidence of formative assessment in the course that allow practice and feedback.
85%
Rubric feedback
Question Percent “all do”
To what extent do the major assignments in the course include rubrics? 80%
To what extent do the rubrics in the course provide clear and detailed criteria? 76%
To what extent do the rubrics in the course allow you to provide prompt feedback?
86%
To what extent do the rubrics all you to include individualized feedback? 84%
There is one final question, “to what extent does this course support our ISLOs”? The responses indicate that 88% of instructors believe the course they taught strongly supports the ISLOs. Graduates

6
There were 33 degrees issued in 2016-17. Of those, 11 have responded to the first destination survey. Seventy-three percent are employed, and 75.0% are employed in a related field. Because there is no work experience required in the BS General Studies, no ISLO/work experience data can be provided. FGEP Results There were 94 evaluations and 13 observations for faculty in the College of Interdisciplinary Studies during 2017-18. The table below shows the percentage of the 107 faculty members who met or exceeded our expectations.
Area Percent Meeting or Exceeding Expectations (COIS n=107)
Percent Meeting or Exceeding Expectations (all n=381)
Planning and Preparation 97.2% 92.7%
Professional Expertise 95.3% 97.1%
Learning Environment 89.7% 92.1%
Learning Facilitation 86.9% 87.9%
While all metrics are strong, the lowest area is learning facilitation. Also note that 100% of
COIS faculty have a master’s degree or higher.
Results: Key Performance Indicators
2013-14 2014-15 2016-17 2017-18
Total New
Students 46 4
Total Registered
Students 318 46
Retention Rate
1st Year
Persistence Rate
Total Graduates 70
Graduation Rate
Employment Rate
Related
Employment Rate
**Note: In 2016 we aligned our employment rate calculations with NACE so employment numbers will
vary from previous years for that year and beyond

7
Progress Report on Previous Continuous Improvement Action Plan The 205-16 goal was to better define the concentrations in this program. The change proposed in the report was not implemented.
2018-2019 Continuous Improvement Action Plan Improvement Goal #1:
- To revise and implement a new capstone assessment in COL 4910.
● Identified Improvement Area:
The previous capstone was not well-defined, and really did not push students to
integrate their coursework with an employment plan. Instead, students simply
addressed their knowledge of each ISLO in isolation. There was also a need to
incorporate the ACE assignments. The course and capstone assessment will be revised
to improve the overall experience for students.
● Evidence:
The scores on the previous assessment were high, but meaningless in terms of
understanding how skills learned would help the student become employable. The old
assessment had no direct link to skills. With the high scores, no usable data existed
upon which to make improvements.
● Improvement Strategy:
The new assignment asks students to solve a problem, and in doing so, demonstrate the
ISLOs in a real world context. Faculty will revised the assignment, and pilot the new
version during fall 2018. Review and feedback from this pilot should allow for minor
revisions as needed.
● Expected Results:
The results of the capstone assessment may actually decrease, but they should provide
us with the ability to drill down and focus on gaps where improvement can take place.
Improvement Goal #2:
- To consider adding milestone assessments to this program.
● Identified Improvement Area: Currently there are no milestone assessments, and no
real place to add one. The common courses besides COL 4910 are often taken prior to

8
coming to Baker College, so adding a milestone assessment may be a challenge.
● Evidence: No courses exist, however, having a milestone may help identify
weaknesses in student preparation prior to the capstone.
● Improvement Strategy: A group of interested faculty will be convened to discuss the
possibilities for adding assessments to this program during the 2018-19 academic
year. If a solution is agreed upon, the assessment will be created during 2018-19 for
2019-20 implementation. However, this is dependent on the approval and revisions
due to the change to the ISLOs.
● Expected Results: The production of at least one milestone assessment is expected.
Once that is in place, actual assessment results should be produced, and strengths and
weaknesses will be noted and tracked.

1
Baker College - Master of Business Administration (MBA) Program Annual Assessment Plan 2017-2018
Annual Assessment Plan
Assessment Process Overview Baker College embraces a philosophy of continuous quality improvement and requires program administrators to use a variety of robust assessments to ensure that the stated mission and goals are achieved. Both internal and external assessments are utilized to monitor and evaluate the program, allocate resources, create professional development, and update processes as part of the continuous quality improvement cycle. Specifically, the program assessment process is designed to evaluate data from three areas: 1) direct measures of student learning outcomes, 2) indirect measures and 3) key performance indicators. Faculty members, in collaboration with instructional designers, are responsible for developing standardized assessment materials to be used within courses. Authentic assessment materials are designed to evaluate student capabilities as they relate to program and institutional outcomes. These standardized assessment instruments become a part of the course, and all faculty members teaching the course are required to administer the instruments. It should be noted that all standardized assessment instruments are developed with the intent to embed the assessment process within the course. In this manner, students are not asked to complete additional assignments or assessments beyond those that are a part of the normal educational process. This embedding of assessment measures is important to Baker College, who believe that assessment should be an integral piece of the educational process, not an addition to it. The assessment materials are designed to support faculty members in their classroom assessment and evaluation, present students with clear expectations and performance parameters, and provide students detailed feedback on performance as it relates to learning outcomes. In addition to the direct measures, data are collected through the use of indirect measures, including surveys of program graduates, employer surveys, and/or accrediting agency reports. These data are combined with direct measures to complete the assessment data set
Key Performance Indicators (KPI) have been developed to complete the assessment plan. These KPI are intended to measure programs in relation to priorities that have been set by the Institution based on our mission and values. Baker College has identified the following as key performance indicators for evaluating the success of graduate programs:
● Enrollments ● Retention ● Graduation rates ● Employment rates of graduates ● Faculty credentials ● Course and Instructor retention information

2
Baker College - Master of Business Administration (MBA) Program Annual Assessment Plan 2017-2018
These KPIs provide data for analysis and evaluation on metrics beyond teaching and learning. These metrics provide the primary operational data necessary for evaluating the stability of the program as well as for planning, budgeting, high level assessment of operations, and how the program contributes to the mission and guiding principles of the institution. Additionally, these metrics are compared across graduate programs developing benchmarks, internal targets, and minimum performance standards. Annually, the program has the responsibility of compiling the data, discussing and analyzing the data with the assessment communities, and collaboratively developing a continuous improvement plan. The continuous improvement plan is designed to identify the steps necessary for improving student learning in the designated areas. To address specific findings, the plan may include identifying actions such as redevelopment of a course, seeking additional data to clarify student achievement, or requesting alteration of specific assignments or teaching strategies to improve attainment of learning outcomes. Based on the findings, the plan may also include operational alterations to such areas as student services or faculty development. In addition to a review of data collected, the program will undertake an annual review of the program assessment plan to determine the effectiveness of the plan, and the quality and usefulness of the data collected. As a portion of this annual review, it is anticipated that the assessment plan for each program will remain a dynamic document, continuing to evolve as the faculty become more experienced in the process of program assessment.

3
Baker College - Master of Business Administration (MBA) Program Annual Assessment Plan 2017-2018
Annual Assessment Plan
Program: Master of Business Administration (MBA) College: Center for Graduate Studies Name of person submitting: Dr. Na “Lina” Li Year: 2017-2018 Assessment Process:
1. Collect data regarding: a. Student learning (direct measures/course embedded assessments) b. Indirect measures c. Key performance indicators
2. Review and analyze data with the following stakeholders: a. Assessment Community members b. Baker College Assessment Committee
3. Develop a Continuous Improvement Action Plan in collaboration with faculty 4. Submit assessment report to required location 5. Implement Continuous Improvement Action Plan 6. Review progress on the Continuous Improvement Action Plan of the prior year
assessment report
Results: Direct Measures of Student learning
1. Course Embedded Direct Measures Results
The MBA program has twelve (12) student learning outcomes (see Appendix A). All these outcomes are assessed using direct measures (i.e., assignments, projects, papers, presentations and exams) that are embedded in multiple courses, shown in Table 1 below.
Table 1. MBA Program Outcomes (POs) Direct Measures
Course Direct Measure MBA PO Measured
BUS5720 Case Analysis Project 1, 9, 12
BUS6150 Application Assignment (Leadership Interview) 1, 8
BUS6150 Teamwork Final Report 9
BUS6150 Instructor Evaluation of Student Contributions 9
BUS6200 Final Project Report 11
BUS6400 Final Exam 4, 7
BUS6780 Final Exam 3
BUS6900 Decision Analysis Dilemma 4 in Business Simulation 2
BUS6900 Decision Analysis Memo 2 in Business Simulation 2

4
Baker College - Master of Business Administration (MBA) Program Annual Assessment Plan 2017-2018
Course Direct Measure MBA PO Measured
BUS6900 Financial Performance Scorecard in Business Simulation 2
BUS6900 Professional Development Essay 10
BUS6900 Strategic Assessment in Business Simulation 1, 5
BUS6900 Strategic Recommendations in Business Simulation 1, 4, 5, 6
MIS5110 Graduate Research Paper 1, 11
MIS5110 Topic Report – Oral Presentation 1
The performance objectives for these direct measures are: on the rubrics (1 = below expectations, 2 = approach expectations, 3 = satisfactory, 4 = accomplished, 5 = exemplary), at least 80% of students will achieve a performance rating of “satisfactory” or higher on each of the MBA program outcomes. The 2017-2018 assessment results are shown in Table 2 and Figure 1 below. The performance objectives on all outcomes have been met. Indeed, ninety percent (90%) of students or more achieved a satisfactory or higher level on all but one outcomes (PO#4). On PO#4, almost 90% (89.8%) of students achieved a satisfactory or higher level.
Table 2. Student Performance on MBA Program Outcomes 2017-2018
Exemplary Accomplished Satisfactory Approaches expectations
Below expectations
Satisfactory or above
PO1 72.2% 11.8% 13.2% 2.8% 0.0% 97.2% PO2 92.5% 4.1% 1.5% 0.0% 1.8% 98.2% PO3 76.7% 0.0% 13.7% 6.5% 3.1% 90.4% PO4 73.3% 11.1% 5.3% 5.8% 4.8% 89.8% PO5 80.0% 8.8% 3.8% 3.8% 3.8% 92.5% PO6 79.5% 9.0% 5.1% 4.5% 1.9% 93.6% PO7 76.4% 13.2% 4.3% 3.5% 2.6% 93.9% PO8 72.2% 11.8% 13.2% 2.8% 0.0% 97.2% PO9 73.2% 15.2% 7.7% 2.5% 2.2% 96.0% PO10 94.4% 5.6% 0.0% 0.0% 0.0% 100.0% PO11 78.2% 18.4% 2.6% 0.3% 0.5% 99.2% PO12 55.0% 30.0% 7.3% 5.8% 1.9% 92.3% Mean 77.0% 11.6% 6.5% 3.2% 1.9% 95.0%

5
Baker College - Master of Business Administration (MBA) Program Annual Assessment Plan 2017-2018
Figure 1. Student Performance on MBA Program Outcomes 2017-2018
2. Peregrine Exam Results
The MBA program had been using the IVY test as an external measure of student learning achievements for a long period. However, we were not satisfied with it as the test topics were not appropriately shared with academic programs and the test results were not appropriately reported. The test was discontinued at the end of the fall semester of 2017.
Based on the IACBE’s recommendation and careful research, the MBA program adopted the Peregrine exam as a direct measure of student learning outcomes in the spring semester of 2018. The exam is a Business Administration Common Professional Component (CPC) based comprehensive exam designed for Masters (MBA, MS, or MA) level students. It covers the following ten topics and sub-topics. Each exam is unique as 10 questions are randomly selected from the test bank of over 200-400 questions per topic for each student. This exam has business content expert support on testing validity and provides external comparisons to similar programs.

6
Baker College - Master of Business Administration (MBA) Program Annual Assessment Plan 2017-2018
1. Accounting
2. Business Ethics
3. Business Finance
4. Business Integration and Strategic Management
5. Business Leadership
6. Economics
Macroeconomics
Microeconomics
7. Information Management Systems
8. Management
Human Resource Management
Operations Management
Organizational Behavior
9. Marketing
10. Quantitative Techniques/Statistics
All MBA program students are required to take the Peregrine Exam in the MBA capstone
course. Sixty-five (65) students took the exam in the spring and summer semesters of 2018. The
results are shown in Figure 2 below. On average, Baker College MBA students scored 63.15%
overall. This is higher than the averages of our peers who took this exam in the masters
programs in the AACSB accredited institutions, ACBSP accredited institutions, HLC accredited
institutions, IACBE accredited institutions, and MBA programs in general.
Figure 2. Peregrine Exam Results

7
Baker College - Master of Business Administration (MBA) Program Annual Assessment Plan 2017-2018
Results: Indirect Measures of Student Learning
1. Student Evaluations of Faculty - SmartEvals
Student Evaluation of Faculty survey was conducted using a tool called SmartEvals in
Blackboard. It was administrated in the end of each course section in Fall 2017 and Spring 2018.
Two questions from this survey were analyzed to evaluate the teaching performance of all the
MBA faculty who taught MBA courses in these two semesters.
Question 1. Did the instructor check to make sure you understood the material?
A total of 438 students answered this question. The results are shown in Figure 3 below. More
than sixty percent (60.9%) of the survey respondents rated their instructors as “exceeds
expectations”. A third (34.9%) rated the instructors as “meets expectations”. Only 4.1% of the
respondents rated the instructors as “does not meet expectations”.
Figure 3. Check to Make Sure You Understood the Material
Question 2. Would you recommend this instructor?
A total of 426 students answered this question. The results are shown in Figure 4 below. Nine
out of ten (91.5%) of the survey respondents would recommend the instructors to others. One
person or less (8.5%) would not recommend them.

8
Baker College - Master of Business Administration (MBA) Program Annual Assessment Plan 2017-2018
Figure 4. Would You Recommend This Instructor?
Instructors who received lower evaluation ratings were primarily teaching several courses that
were discontinued in the end of Spring 2018. These included the graduate program orientation
course (CGS5010) and a few marketing major courses. Professional development opportunities
have been and will continue to be provided to the faculty on an on-going base in order to
improve teaching performance and ultimately to improve learning experiences.
2. Summary of FGEP Results for the MBA Program - IES
During Fall 2017 – Summer 2018, a total of 12 faculty who taught MBA courses went through
the Faculty Growth and Evaluation Process (FGEP) with the Instructional Effectiveness
Specialists (IES). The review included faculty self-assessment, in-class observation of four
primary quality teaching indicators, Operational Responsibility indicators, and student
evaluations. The quality teaching indicators included Planning and Preparation, Professional
Expertise, Learning Environment, and Learning Facilitation. A Professional Growth Plan (PGP)
was also created to identify continuous improvement goals to foster faculty growth and
development, as well as help faculty ensure they are meeting the institution's teaching
expectations. A summary of the data is shown in Table 3 below.
Table 3. FGEP Summary Results
FGEP Category Exceeds Meets Does Not Meet
Planning and Preparation 12 (100%)
Professional Expertise 1 (8.3%) 10 (83.3%) 1 (8.3%)

9
Baker College - Master of Business Administration (MBA) Program Annual Assessment Plan 2017-2018
Learning Environment 2 (16.7%) 9 (75.0%) 1 (8.3%)
Learning Facilitation 11 (91.7%) 1 (8.3%)
Most faculty met or exceeded expectations in all four indicators. One “does not meet
expectations” rating was identified in three indicators. The coaching and mentoring process will
continue through the upcoming semesters.
3. Faculty Course Evaluation - Qualtrics
During the 2017-2018 academic year, faculty were given the opportunity to evaluate the curriculum of the courses they taught. In addition to providing qualitative feedback, faculty provided an overall rating of the course using the scale below:
● 4 points = A: This course deserves an A because the course is set up well, has quality assignments, and meets stated objectives.
● 3 points = B: This course deserves a B because it is set up well, has reasonable assignments, meets most stated objectives. Needs minor revisions.
● 2 points = C: This course deserves a C because it has some good points, but needs revision to meet several of the stated revisions. Needs major revisions.
● 1 point = D: This course deserves a D because it has significant issues that prevent quality learning by students, does not meet most objectives. Needs an overhaul.
The evaluation results are available in the Qualtrics system. A total of 30 course evaluations by faculty were completed in the Fall 2017, Spring 2018, and Summer 2018 semesters. Twenty-nine (96.7%) rated the course taught as an A, one (3.3%) rated the course as a B, and zero faculty rated a course as a C or D. The average overall rating for courses was 3.97 on the 4 point scale.
4. First Destination Survey – Graduate Employment Data
Graduate employment data are collected using the First Destination Employment Survey. The results are available in the Qualtrics system. The following data were collected from the MBA alumni who graduated in the Summer 2016, Fall 2016, Winter 2017 or Spring 2017 quarters. During this period, 145 degrees were issued. 67 alumni responded to survey. The response rate was 46.2%. The survey results were:
- The employment rate was 86.6%. - The related employment rate was 77.6%. - The average reported annual salary for those employed was $59,738.

10
Baker College - Master of Business Administration (MBA) Program Annual Assessment Plan 2017-2018
Among the 67 alumni who provided responses: - 83.6% are employed full time (30 hours or more per week) - 3.0% are employed part time (less than 30 hours per week) - 9.0% are seeking employment - 3.0% are enrolled in a program of continuing education. - 1.5% are not seeking employment or continuing education at this time.
5. 2017-2018 End of Program Survey
Along with the First Destination Survey, an End of Program Survey is administrated using the same channel at the same time. The results are available in the Qualtrics system. Survey invitations were sent to the MBA alumni who graduated in Summer 2017, Fall 2017, or Spring 2018. A total of 21 students completed this survey*. The results are shown in Table 4 below. The average rating for all the questions was 3.2 on a 1-4 scale, indicating agreement or strong agreement. When asked if they would recommend this program to other potential students, 95% of the respondents indicated they would. This data provides an initial baseline to add to and compare with data sets from future years. * 2017/2018 First destination survey is in progress until 12/31/2018, so data is subject to change until that time. Data for this report was pulled on 10/5/2018. Final results will be reported in next year’s report.
Table 4. Ratings of Questions on End of Program Survey
Questions Average Rating (on 1-4 scale)
Courses in this program encouraged me to question ideas and concepts. 3.6 Courses in this program were sequenced appropriately from introductory to advanced levels. 3.6
Informational resources to support learning were available 3.5
My externship/internship was a valuable component of this program. 2.8
Opportunities for exposure to and interaction with professionals in this field 2.6
The opportunities available for academic advising met my needs. 3.3
The program has prepared me for employment or promotion in my chosen field. 3.4
The types of general education courses were appropriate. 3.3
This program provided the opportunity to develop fundamental technological skills. 3.3 Tutoring, Learning Support Services and/or Academic Support Center were adequate and appropriate. 3.5
Requirements for this program were clearly stated in the college publications. 3.7
Technology and equipment were adequate and appropriate for this program. 3.4 The content of the major courses in this program was appropriate for my career needs. 3.4

11
Baker College - Master of Business Administration (MBA) Program Annual Assessment Plan 2017-2018
The coursework in this program prepared me for my externship/internship experience. 2.8
The design of this program reflected the latest findings in this field of study. 3.6
Knowledge and Skills Required for the Job 3.1
Leadership 3.3
Lifelong Learning 3.1
Math Skills 2.6
Oral Communication 2.5
Problem Solving 3.2
Professional Behavior 3.3
Teamwork 2.9
Technical Skills 2.6
Written Communication 3.3
Critical Thinking 3.4
Customer Service 2.9
Global/Cultural Diversity Skills 2.8
Human Relations/Interpersonal Skills 3.2
Information Literacy Skills 2.9
6. SkyFactor Survey Results
The SkyFactor Survey (formerly EBI Survey) was again utilized to understand student perceptions of the MBA Program in the 2017-2018 academic year. Due to staff member illness, the survey was only administrated in the Fall 2017 semester. Fifty-six (56) graduates were invited to participate in the survey. Twenty-six (26) completed it. The response rate was 46.4%. Table 5 shows the results of this indirect measurement of the MBA Program outcomes. Caution needs to be taken as data were not collected for the entire 2017-2018 academic year. EBI provides external comparisons on MBA Program Outcomes (PO) #2, #3, #4, #6, #7, # 8 and #11. Our graduates’ ratings were equal to or higher than the means of all survey participating institutions on PO #2, #3, #4 and #11. Our ratings were slightly lower than the national averages on PO #6, #7, and #8. But the differences were small and may not be statistically significant. In previous years, our ratings on these outcomes were always higher than the averages of all the institutions that took this survey. We will continue to monitor them in the coming years. No external comparison was provided on MBA Program Outcomes #1, #9 or #10. We do have preset expectations on these outcomes (i.e., >=5 on a 7-point Likert scale or <=3 on a reversed Likert scale). Our graduates’ perceptions on the three outcomes met the expectations.

12
Baker College - Master of Business Administration (MBA) Program Annual Assessment Plan 2017-2018
PO#5 and PO#12 were not measured by this survey as there were no space in the questionnaire to add questions to measure them. This issue has been solved. Corresponding assessment questions have been added to the survey, to be deployed in Fall 2018.
Table 5. EBI Survey Results on MBA Program Outcomes (POs)
Measured by Results
PO1 Written and Oral Communication Skills questions
Average rating of Baker College MBA graduates (5.40) > 5.0 on a 7-point Likert scale.
PO2 Ethics and Legal Issues questions
Average rating of Baker College MBA graduates (6.04) > national average of participating institutions (5.70).
PO3 Data-Driven Decision-Making questions
Average rating of Baker College MBA graduates (6.07) > national average of participating institutions (5.63).
PO4 Domestic and Global Economies questions
Average rating of Baker College MBA graduates (5.65) > national average of participating institutions (5.57).
PO5 N/A N/A
PO6 Critical Thinking and Problem Solving questions
Average rating of Baker College MBA graduates (5.62) < national average of participating institutions (5.70).
PO7 Financial Information questions
Average rating of Baker College MBA graduates (5.52) < national average of participating institutions (5.53).
PO8 Organizational Behaviors questions
Average rating of Baker College MBA graduates (5.73) < national average of participating institutions (5.74).
PO9 Multicultural and Diversity questions
Average rating of Baker College MBA graduates (5.79) > 5.0 on a 7-point Likert scale.
PO10 Professional Development questions
Average rating of Baker College MBA graduates (1.89) < 3.0 on a reversed 7-point Likert scale.
PO11 Use and Manage Technology questions
Average rating of Baker College MBA graduates (5. 61) > national average of participating institutions (5.19).
PO12 N/A N/A
Figure 5 shows student ratings of the MBA Program in three overarching categories, student overall satisfaction, overall learning, and overall program effectiveness. All three measures continued to fall in the more satisfied area, with ratings of 6.12, 6.17, and 5.99 on 1-7 Likert

13
Baker College - Master of Business Administration (MBA) Program Annual Assessment Plan 2017-2018
scales. All three ratings were not significantly different than the selected six peer institutions or all institutions that took this survey.
Figure 5. Baker College MBA Program Overall Ratings
Results: Key Performance Indicators The MBA program’ enrollment has been decreasing in the last few years due to multiple factors including increased competition and shrinkage of the adult student market. Nevertheless, the program continues to be the largest graduate program at the Center for Graduate Studies and maintains sufficient registrations to remain more than viable and productive. Table 6 shows the key performance indicators of the MBA program for the recent years. The 2017-2018 data were not 100% accurate or not available as they were retrieved from the OASIS system, which has been sun setting and replaced by the Jenzabar system at Baker College.
Table 6. MBA Program Key Performance Indicators
MBA Program 2014-15 2015-16 2016-17 2017-18
Total New Students 182 219 151 96
Total Registered Students 596 560 441 351
Retention Rate 80.5% 79.7% 82.7% N/A
1st Year Persistence Rate 56.4% 65.9% 68.2% 74.1%
Total Graduates 163 164 138 24
Graduation Rate 59.4% 67.5% 71.4% 52.4%
Employment Rate 99.5% 87.6% 86.6%* N/A
Related Employment Rate 83.2% 88.7% 77.6%* N/A *Note: In 2016 we aligned our employment rate calculations with NACE. So employment numbers will vary from
previous years for that year and beyond.

14
Baker College - Master of Business Administration (MBA) Program Annual Assessment Plan 2017-2018
Faculty Credentials: In the 2017-2018 academic year, 37 full-time and adjunct faculty taught courses for the MBA program. Most faculty members hold terminal degrees in their teaching fields or a related field. The rest of the faculty hold master degrees in their teaching fields. All faculty have extensive industrial experiences in their teaching fields. 100% of these faculty met the credential requirements. Progress Report on Previous Continuous Improvement Action Plan In the 2017-2018 academic year, the following continuous improvement strategies have been implemented. The statuses of these projects are summarized below. 1. To Evaluate the Effectiveness of Online Labs in Finance & Economics Dr. Johnston will collect more data to measure the effectiveness of the online labs in Finance and Economics courses in the 2017-2018 academic year. Status: The goal has been met. Qualitative and quantitative data have been collected via in-class feedback on discussion boards and end-of-class survey in all finance and economics classes in Fall 2017 and Spring 2018. Student comments provided very positive comments regarding “if using an online learning lab was interesting and helped to improve learning”. In the end-of-class survey, students were asked to rate on five questions regarding the online labs on 1-5 Liker scales. Twenty-four (24) students answered the survey. The results are shown in Table 7 below. At least 3 in 4 (75% or more) of the respondents agree or strongly agree that the lab tools were easy to use, improved learning efficiency, reduced anxiety, improved confidence, and would recommend it.
Table 7. Online Labs Survey Results
Student Response Strongly Disagree
Disagree Neutral Agree Strongly
Agree
The tool was easy to use. 4.2% 0.0% 4.2% 54.2% 37.5%
The tool improved my learning efficiency.
4.2% 0.0% 20.8% 29.2% 45.8%
The tool helped reduce my anxiety in this class.
8.3% 4.2% 12.5% 45.8% 29.2%
The tool helped improve my confidence in this class.
4.2% 8.3% 12.5% 37.5% 37.5%
I would recommend using this type of online lab tool in other courses.
4.2% 8.3% 4.2% 33.3% 50.0%

15
Baker College - Master of Business Administration (MBA) Program Annual Assessment Plan 2017-2018
2. To Improve Student Learning in Statistics and Research In order to improve student performance on the MBA Program Outcome PO#3 (Collect, interpret and analyze existing and/or original research, using quantitative and statistical tools, and use in the decision making process), BUS6780 will be examined. Gaps will be identified. Improvement strategies will be proposed, implemented, and evaluated. Status: The goal has been partially met. Based on research and exploration of multiple methods, it has been decided that a textbook that includes an online lab will be adopted for BUS6780 in the summer of 2019. This method will allow students to practice on solving problems, receive instant feedback, and refer back to textbook and other resources whenever needed. It will also allow instructors to spend more time on providing more individualized help to students. 3. To Find a Test to Replace the IVY Test The MBA Dean is searching for new tests to replace the IVY test. Peregrine test has been identified as a great candidate tool for program assessment and benchmarking based on evaluations by the Dean and MBA faculty. The Dean is working with the Baker System’s School of Business Dean to complete the onboarding process of the test. The Peregrine test will be first administrated in the spring semester of 2018. Status: The goal has been met. The Peregrine Exam was adopted and implemented in Spring 2018. Exam results are presented in the “Results: Direct Measures of Student learning” section of this report. 4. To Complete Self-Report for IACBE Accreditation Reaffirmation The MBA Program is accredited by IACBE through 2018. In order to reaffirm the accreditation, a site visit has been scheduled for September 2018. The program’s self-study year is 2016-2017. Self-report is due to IACBE in May 2018. Final report is due in July 2018. Status: The goal has been met. The MBA Dean coordinated the self-study. She collaborated with the MBA faculty, senior leadership and many staff members to develop the self-study report and supporting materials. The report was submitted on time. The self-study site visit was conducted on September 6-7, 2018. It was very successful. The site visit finding letter provides the following recognition:
1. The site visit team recognizes the Center for Graduate Studies for their commitment to the consistent pursuit of quality assurance measure across all curriculum as evidenced by their investment in the training of both full- and part-time faculty to meet the quality standards.
2. The site visit team recognizes the Center for Graduate Studies for including adjunct and part-time instructors as integral members in all areas of the program and the

16
Baker College - Master of Business Administration (MBA) Program Annual Assessment Plan 2017-2018
institution. All faculty are included in curriculum evaluation, changes in course design, and committee work.
3. The site visit team recognizes the Center for Graduate Studies for considering the needs of all students regardless of the learning modality. For example, they held a virtual career fair that reached employers across the United States.
The site visit team did not have any active finding relating to the specific actions that the MBA program must take to meet the requirements associated with the IACBE’s Accreditation Principles. They provided the following suggestion for us to consider:
The site visit team recommends that the Center for Graduate Studies consider simplifying and streamlining their outcomes assessment plan. The plan currently contains 12 intended student learning outcomes and uses 11 direct measures. To simplify the plan, the Center could reduce the number of intended student learning outcomes and review the direct measures to determine if, by reworking some of the instruments, measures all of the outcomes with fewer direct measures.
5. To Evaluate the Impacts of New Marketing Firm and Marketing Strategies MBA Program enrollment will continue to be monitored to evaluate the impacts of the marketing firm and marketing strategies.
Status: The MBA program’s enrollment continues to decline. It will continue to be monitored.
2018-2019 Continuous Improvement Action Plan Improvement Goal #1: Develop a process and timeline to ensure courses are reviewed deeply and thoroughly and revised accordingly on a rotation base to maintain relevance to the field and align with the College’s learning model.
● Identified Improvement Area and Evidence: The MBA program has established a process for frequent and regular course review and revision. However, there is not a clearly defined process or schedule for deep and thorough review of courses.
● Improvement Strategy: Create and implement a program development process and supporting guides/documents that will provide a structured and consistent approach to program curriculum review and revision.

17
Baker College - Master of Business Administration (MBA) Program Annual Assessment Plan 2017-2018
● Expected Results: ○ A clearly defined schedule for deep and thorough course review and revision will
be established. ○ A structured process along with supporting documents for deep and thorough
course review and revision will be established. ○ Whether deep and thorough course review and revision timeline is met will be
used as a measure of the program in future annual assessment reports. ○ Effectiveness of new curriculum resulted from this process will be evaluated by
specifically designed surveys, student in-class feedback, and faculty feedback. It may also be reflected in faculty evaluations of courses, student evaluations of courses, and alumni or end of program surveys.

18
Baker College - Master of Business Administration (MBA) Program Annual Assessment Plan 2017-2018
Appendix A. MBA Program Outcomes
Graduates of the MBA program will be able to:
1. Communicate using the advanced oral and written communication skills necessary for success in the business environment.
2. Apply standards of ethical and legal behaviors in a professional environment.
3. Collect, interpret and analyze existing and/or original research, using quantitative and statistical tools, and use in the decision making process.
4. Analyze the interrelatedness of market, economic, social and political trends, and their impact on a global environment.
5. Analyze the strategic planning process, and develop and assess strategic plans.
6. Apply critical thinking skills to solve business problems.
7. Analyze financial reports, risk management strategies and their impact on the decision making process.
8. Evaluate various leadership strategies and the implications of their use.
9. Discuss problems from diverse perspectives and analyze the impact of individual and cultural differences on the business environment.
10. Illustrate commitment to personal and professional development, community service and life-long learning.
11. Analyze the impact of information systems and technology on a business and demonstrate the ability to make effective information management decisions.
12. Analyze the strategic impact of human resource development and management on a
business.

1
Annual Assessment Plan
Assessment Process Overview Baker College embraces a philosophy of continuous quality improvement and requires program administrators to use a variety of robust assessments to ensure that the stated mission and goals are achieved. Both internal and external assessments are utilized to monitor and evaluate the program, allocate resources, create professional development, and update processes as part of the continuous quality improvement cycle. Specifically, the program assessment process is designed to evaluate data from three areas: 1) direct measures of student learning outcomes, 2) indirect measures and 3) key performance indicators. Faculty members, in collaboration with instructional designers, are responsible for developing standardized assessment materials to be used within courses. Authentic assessment materials are designed to evaluate student capabilities as they relate to program and institutional outcomes. These standardized assessment instruments become a part of the course, and all faculty members teaching the course are required to administer the instruments. It should be noted that all standardized assessment instruments are developed with the intent to embed the assessment process within the course. In this manner, students are not asked to complete additional assignments or assessments beyond those that are a part of the normal educational process. This embedding of assessment measures is important to Baker College, who believe that assessment should be an integral piece of the educational process, not an addition to it. The assessment materials are designed to support faculty members in their classroom assessment and evaluation, present students with clear expectations and performance parameters, and provide students detailed feedback on performance as it relates to learning outcomes. In addition to the direct measures, data are collected through the use of indirect measures, including surveys of program graduates, employer surveys, and/or accrediting agency reports. These data are combined with direct measures to complete the assessment data set
Key Performance Indicators (KPI) have been developed to complete the assessment plan. These KPI are intended to measure programs in relation to priorities that have been set by the Institution based on our mission and values. Baker College has identified the following as key performance indicators for evaluating the success of graduate programs:
● Enrollments ● Retention ● Graduation rates ● Employment rates of graduates ● Faculty credentials ● Course and Instructor retention information

2
These KPIs provide data for analysis and evaluation on metrics beyond teaching and learning. These metrics provide the primary operational data necessary for evaluating the stability of the program as well as for planning, budgeting, high level assessment of operations, and how the program contributes to the mission and guiding principles of the institution. Additionally, these metrics are compared across graduate programs developing benchmarks, internal targets, and minimum performance standards. Annually, the program has the responsibility of compiling the data, discussing and analyzing the data with the faculty council, and collaboratively developing a continuous improvement plan. The continuous improvement plan is designed to identify the steps necessary for improving student learning in the designated areas. To address specific findings, the plan may include identifying actions such as redevelopment of a course, seeking additional data to clarify student achievement, or requesting alteration of specific assignments or teaching strategies to improve attainment of learning outcomes. Based on the findings, the plan may also include operational alterations to such areas as student services or faculty development. In addition to a review of data collected, the program will undertake an annual review of the program assessment plan to determine the effectiveness of the plan, and the quality and usefulness of the data collected. As a portion of this annual review, it is anticipated that the assessment plan for each program will remain a dynamic document, continuing to evolve as the faculty become more experienced in the process of program assessment.

3
Annual Assessment Plan
Program: Master of Science - Industrial Organizational Psychology Center for Graduate Studies Name of person submitting: Dr. Joanna Palmer Year: 2017-2018 Assessment Process:
1. Collect data regarding: a. Student Learning (direct measures/course embedded assessments) b. Indirect Measures c. Key Performance Indicators
2. Review and analyze data with the following stakeholders: a. Assessment Community members b. Baker College Assessment Committee
3. Develop a Continuous Improvement Action Plan in collaboration with faculty 4. Submit assessment report to required location 5. Implement Continuous Improvement Action Plan 6. Review progress on the Continuous Improvement Action Plan of the prior year
assessment report
Results: Direct Measures of Student learning In Fall 2017, Baker College transitioned from quarter based to semester based curriculum and programs. As part of that process, programs were reviewed, revised, and converted to align with a semester format. The Guidelines for Education and Training in Industrial-Organizational Psychology (2016) from the Society of Industrial Organizational Psychology were used as a guide to review the Master of Science in Industrial Organizational Psychology (MSIOP) program outcomes and coursework. Due to this conversion and review, program outcome language was updated and several courses were revised, consolidated, removed, or added. Additionally, direct measure alignments in the capstone course were reviewed and updated. As part of aligning with the SIOP guidelines as well as converting to the semester format, the History of Psychology course was removed and appropriate historical events, key theorists, and landmark studies were incorporated as student learning outcomes in several courses. The Tests and Measurements course and Assessment in the Workplace course were streamlined to align with SIOP guidelines and consolidated into one Tests, Measurements, and Assessments in the Workplace course. Per SIOP’s guidelines, a separate course on Social Psychology was not required, so in lieu of keeping the Social Psychology course which was more broad, a new Individual and Group Factors in the Workplace course was created to focus specifically on social psychology as it applies to the workplace. To fill a gap in content that was recommended by SIOP, the previous Consulting Psychology course was discontinued, and a new Organizational Development, Change, and Consultation course was developed. Remaining courses in the

4
program were reviewed to ensure they aligned with the SIOP guidelines as well as fit the requirements to be three-credit semester based courses rather than four-credit quarter based courses. The table below shows both the 2017-2018 data summary for program outcomes as well as a comparison to the similar quarter version outcome(s) from the previous two years. Due to the conversion timeline, many students chose to accelerate their pace through the program in 2016-2017 to complete their program before the College transitioned to semesters. For this reason, the PSY6990 capstone course was only offered during the Fall semester, rather than Fall and Spring. Data was collected from a total of four students, so it should be used cautiously and compared with data from the following years to determine patterns.
MS Psychology Program Outcome Mastery
MS Industrial Psychology Program Outcome
2017-2018 Met or
Exceeded Expectations
Quarter Based Program Outcome Equivalent for Comparison Used Prior
to 2017-2018
2016-2017 Met or
Exceeded Expectations
2015-2016 Met or
Exceeded Expectations
1. Describe the psychological underpinnings, theories, foundations, structure, and concepts within the discipline of I/O psychology.
92.9%
Assess the psychological underpinnings (theories, foundations, structure, and concepts within the discipline of I/O psychology.
89.7% 84.5%
2. Apply ethical principles, legal standards, and APA guidelines to assess professional behavior and practice.
75%
Reason analytically and apply ethical principles and APA standards to assess professional behavior and practice.
88% 81%
3. Demonstrate awareness of how culture and diversity affect thoughts, behaviors, attitudes, and decisions within the workplace.
83.3%
Demonstrate awareness of multicultural perspectives of self and others and its influence on professional behavior.
66.3% 59.4%
4. Apply I/O psychology principles within individual, group, organizational, and global contexts.
78.9%
Apply psychological principles within a global context.
68% 68.8%
5. Analyze scholarly literature to critically assess relevant theory and research, to support positions, and to inform decisions.
92.9%
Analyze the scientific merit of scholarly literature in order to critically assess organizational needs.
94.5% 76.4%
6. Critically analyze psychological theories, models, and concepts to develop effective responses to industrial/organizational needs, issues, and concerns.
82.4%
Critically analyze and apply theory to develop effective responses to industrial/organizational needs, issues, and concerns.
81.4% 80.2%
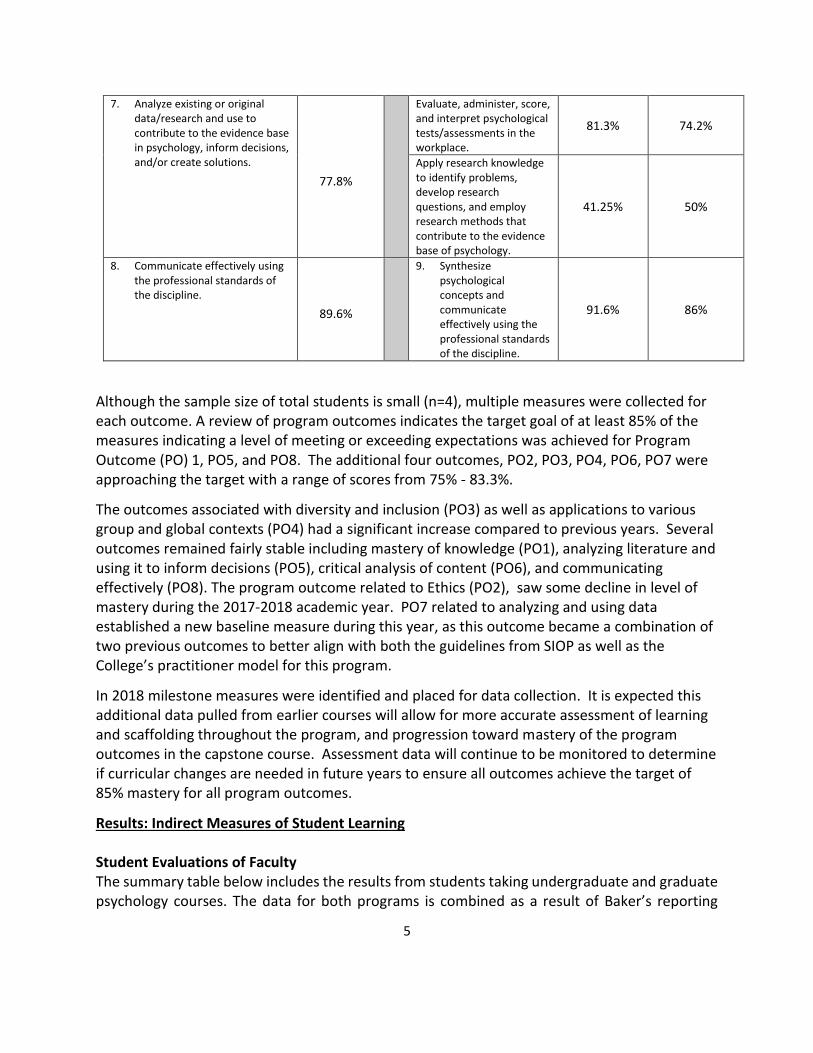
5
7. Analyze existing or original data/research and use to contribute to the evidence base in psychology, inform decisions, and/or create solutions.
77.8%
Evaluate, administer, score, and interpret psychological tests/assessments in the workplace.
81.3% 74.2%
Apply research knowledge to identify problems, develop research questions, and employ research methods that contribute to the evidence base of psychology.
41.25% 50%
8. Communicate effectively using the professional standards of the discipline.
89.6%
9. Synthesize
psychological concepts and communicate effectively using the professional standards of the discipline.
91.6% 86%
Although the sample size of total students is small (n=4), multiple measures were collected for each outcome. A review of program outcomes indicates the target goal of at least 85% of the measures indicating a level of meeting or exceeding expectations was achieved for Program Outcome (PO) 1, PO5, and PO8. The additional four outcomes, PO2, PO3, PO4, PO6, PO7 were approaching the target with a range of scores from 75% - 83.3%.
The outcomes associated with diversity and inclusion (PO3) as well as applications to various group and global contexts (PO4) had a significant increase compared to previous years. Several outcomes remained fairly stable including mastery of knowledge (PO1), analyzing literature and using it to inform decisions (PO5), critical analysis of content (PO6), and communicating effectively (PO8). The program outcome related to Ethics (PO2), saw some decline in level of mastery during the 2017-2018 academic year. PO7 related to analyzing and using data established a new baseline measure during this year, as this outcome became a combination of two previous outcomes to better align with both the guidelines from SIOP as well as the College’s practitioner model for this program.
In 2018 milestone measures were identified and placed for data collection. It is expected this additional data pulled from earlier courses will allow for more accurate assessment of learning and scaffolding throughout the program, and progression toward mastery of the program outcomes in the capstone course. Assessment data will continue to be monitored to determine if curricular changes are needed in future years to ensure all outcomes achieve the target of 85% mastery for all program outcomes.
Results: Indirect Measures of Student Learning Student Evaluations of Faculty The summary table below includes the results from students taking undergraduate and graduate psychology courses. The data for both programs is combined as a result of Baker’s reporting

6
program. The psychology student sample size for Fall 2017 was 397 out of a possible 1150 students (35% response rate), Spring 2018 was 355/1068 (33% response rate). The response rate for psychology is comparable to the average response rate for the larger College of Interdisciplinary Studies, which was 32% during 2017 and 2018.
Student Evaluations of Faculty Teaching Psychology Courses
Survey Question College of Interdisciplinary Studies Average
Fall 2017 Psychology Average
Spring 2018 Psychology Average
Check to make sure you understand material (on a 1 do not agree - 5 strongly agree scale)
3.928 3.949 4.057
Return and post grades promptly (1 do not agree - 5 strongly agree scale)
4.063 4.074 4.087
Would you recommend this instructor? (Yes/No)
83.5% 80.6% 85.5%
As indicated on the table, the psychology department average was slightly higher than the College of Interdisciplinary Studies’ average in the first two categories. Although lower in the Fall of 2017, the psychology faculty’s average was higher than the College of Interdisciplinary Studies’ average for recommending the instructor in the Spring of 2018. A new data collection program will provide further variety and depth of data in the Fall of 2018. This will allow for a better assessment of the program goals. Evaluations of Courses by Faculty During the 2017-2018 academic year, faculty were given the opportunity to evaluate the curriculum in the courses taught. In addition to providing qualitative feedback as well as specific items needing correction or attention, faculty provided an overall rating of the course using the scale below. The average overall rating for courses was 3.44 on a 4 point scale as indicated below.
● 4 points = A: This course deserves an A because the course is set up well, has quality assignments, and meets stated objectives.
● 3 points = B: This course deserves a B because it is set up well, has reasonable assignments, meets most stated objectives. Needs minor revisions.
● 2 points = C: This course deserves a C because it has some good points, but needs revision to meet several of the stated revisions. Needs major revisions.
● 1 point = D: This course deserves a D because it has significant issues that prevent quality learning by students, does not meet most objectives. Needs an overhaul.

7
A total of seven course evaluations by faculty were completed during the Fall 2017 and Spring 2018 semesters. Three (42.8%) rated the course taught as an A, 3 (42.8%) rated the course as a B, 1 (14.3%) rated the course as a C, and zero faculty rated a course as a D. Due to the low number of surveys received, and no clear patterns of courses identified in need, course revision decisions cannot be made based on this information at this time. Additional course evaluation surveys will be collected during 2018-2019 to determine what revisions may be necessary in upcoming years. Faculty Growth and Evaluations Process During Fall 2017 and Spring 2018, a total of five graduate faculty teaching for the MSIOP program went through the Faculty Growth and Evaluation Process (FGEP) with an Instructional Effectiveness Specialist (IES). The review included faculty self-assessment along with IES observation of completed online classes to determine rankings on four primary quality and teaching indicators including Planning and Preparation, Professional Expertise, Learning Environment, and Learning Facilitation. A Professional Growth Plan (PGP) was also created to identify continuous improvement goals to foster faculty growth and development, as well as help faculty ensure they are meeting the institution's teaching expectations. A summary of the data is below.
2017-2018 Faculty Growth and Evaluation Data for Psychology Faculty
FGEP Category Exceeds Meets Does Not Meet
Planning and Preparation 2 (40%) 3 (60%) 0 (0%)
Professional Expertise 2 (40%) 3 (60%) 0 (0%)
Learning Environment 2 (40%) 2 (40%) 1 (20%)
Learning Facilitation 1 (20%) 3 (60%) 1 (20%)
All but one faculty member met or exceeded expectations in all four areas of the FGEP. The faculty member who did not meet in Learning Environment and Learning Facilitation was the same individual and has been actively working with an IES to set performance growth goals and receive coaching and mentoring to improve performance in those areas. The coaching and mentoring process will continue through upcoming semesters. 2017-2018 End of Program Survey A total of 2 students completed the end of program survey. Although a small sample, it is a fair return rate based on the size of the program. This data provides an initial baseline to add to and compare with data sets from future years (see table below). Average responses for all questions earned the target threshold, a rating of a 3 or higher on a 4 point scale, indicating

8
agreement or strong agreement. When asked if they would recommend this program to other potential students, 100% of the respondents indicated they would.
Ratings of Questions on End of Program Survey
Average Rating (on a 4 point
scale)
Survey Items
4 - Courses in this program encouraged me to question ideas and concepts - The types of general education courses were appropriate - Courses in this program were sequenced appropriately from introductory to
advanced levels - Knowledge and skills required for the job - Leadership - Information literacy skills - Written communication - Critical thinking - Problem solving
3.5 - The program has prepared me for employment or promotion in my chosen field - The design of this program reflected the latest finding sin this field of study - Requirements for this program were clearly stated in the college publications - The content of the major courses in this program was appropriate for my career
needs - Informational resources to support learning were available - Technology and equipment were adequate and appropriate for this program - This program provided the opportunity to develop fundamental technological skills - Human relations/interpersonal skills - Global/cultural diversity skills - Professional behavior - Lifelong learning
3.0 - Academic advising met my needs - Tutoring, Learning Support Services and/or ARC services were adequate and
appropriate - Opportunities for exposure to and interaction with professionals in the field - Customer service - Teamwork - Math Skills - Technical skills - Oral communication
First Destination- Graduate Employment Survey Based on the First Destination Employment Survey deployed to graduates annually, the following information was gathered. Out of 16 degrees issued, 5 alumni responded to survey with the following dispositions.
- 40% are employed full time (30 hours or more per week) - 20% are planning to continue education, but not yet enrolled

9
- 20% are seeking employment - 20% are serving in the US military
The average reported annual salary for those employed was $55,500. 2017-2018 Data* Of the two respondents in the reporting cycle thus far, one (50%) report being employed full time (on average of 30 hours or more per week) and one (50%) was seeking employment at time of survey. The average reported salary was $65,000. * 2017/2018 First destination survey is in progress until 12/31/2018, so data is subject to change until that time. Data for this report was pulled on 9/21/2018. Final results will be reported in next year’s report.
Results: Key Performance Indicators Review of enrollment credit data for the MSIOP program indicated that on average students took six credit hours, with a range from three to nine credits per session. The average of cumulative earned credits for the year was 17.85, which puts the average student on track to complete graduate program in two years or less. The average GPA for MSIOP students was 3.45. Progress Report on Previous Continuous Improvement Action Plan There were three primary areas identified for improvement in the 2016-2017 annual assessment report.
1. Remap outcomes and review assessment achievement levels due to changes in curriculum from quarter to semester transition to ensure program is at Diamond Achievement level by September 2018. Outcome: Goal has been met. All assessment items have been updated for Bronze, Silver, and Gold. Platinum level was completed and program achieved Diamond Assessment level during Summer 2018.
2. Establish milestone assessments within revised curriculum and align rubrics to program outcomes so data can start to be collected on these measures during 2018-2019. Outcome: Goal has been met. Milestone assessments have been identified and data will be pulled from assessments during the 2018-2019 academic year for inclusion in next year’s annual assessment report.
3. Because there is not a standardized exam, licensure, or national measure that exists for graduates of a Masters in Industrial Organizational Psychology, another method is needed to determine appropriate benchmarking and validity of program outcome mastery. Finalize process to establish a list of outside reviewers of Capstone case studies, and establish review process and timelines. Outcome: Goal is partially met. A process was established to identify a list of outside reviewers. Networking occurred at the Society for Industrial Organizational Psychology

10
conference in April 2018. Project will continue into 2018-2019 academic year with target of implementing review of Capstone case studies during Spring 2019.
2018-2019 Continuous Improvement Action Plan Improvement Goal #1: Complete cycle of Diamond Assessment Achievement level by finalizing process to establish a list of outside reviewers of Capstone case studies, establish review process and timelines, as well as review first set of data from external reviewers.
● Evidence: Program is currently starting Diamond Assessment Achievement Level. Because there is not a standardized exam, licensure, or national measure that exists for graduates of a Masters in Industrial Organizational Psychology, another method is needed to determine appropriate benchmarking and validity of program outcome mastery.
● Improvement Strategy: Review and contact credible external reviewers to review capstone case studies from those networked with and solicited at SIOP 2018 conference. If additional solicitation is needed, use listservs and social media outlets associated with Industrial Organizational Psychology practitioners. Assessment community will establish review process, supporting documents, and frequency of implementation, as well as review data once completed. Implement first review cycle in Spring/Summer 2019.
● Expected Results: By end of Summer 2019, initial data set from external reviewers will be reviewed.
Improvement Goal #2: Create a process to ensure courses are reviewed regularly and in depth to maintain relevance to the field, align with the College’s learning model, and promote academic integrity.
● Evidence: Currently there is no clearly defined schedule or process established to consistently and frequently review curriculum in a program.
● Improvement Strategy: Create and implement a program development process and supporting guides/documents that will provide a structured and consistent approach to program curriculum review and revision.
● Expected Results: Courses will be on a clearly defined schedule of review using a consistent model to make revision recommendations. Courses will exemplify relevance to the field and requisite skills and abilities needed by graduates, align with the College’s learning model, and promote academic integrity. Course review timeline targets established during process creation will be met and become a measure for future annual assessment reports. Future data points after implementation of revisions (starting 2019-2020 and beyond) would be improved scores on faculty evaluations of courses and student evaluations of courses. Lagging indicators from well developed and continuously improved curriculum could include increased retention and increases on preparedness indicated on future graduate end of program studies.

1
Annual Assessment Plan
Assessment Process Overview Baker College embraces a philosophy of continuous quality improvement and requires program administrators to use a variety of robust assessments to ensure that the stated mission and goals are achieved. Both internal and external assessments are utilized to monitor and evaluate the program, allocate resources, create professional development, and update processes as part of the continuous quality improvement cycle. Specifically, the program assessment process is designed to evaluate data from three areas: 1) direct measures of student learning outcomes, 2) indirect measures and 3) key performance indicators. Faculty members, in collaboration with instructional designers, are responsible for developing standardized assessment materials to be used within courses. Authentic assessment materials are designed to evaluate student capabilities as they relate to program and institutional outcomes. These standardized assessment instruments become a part of the course, and all faculty members teaching the course are required to administer the instruments. It should be noted that all standardized assessment instruments are developed with the intent to embed the assessment process within the course. In this manner, students are not asked to complete additional assignments or assessments beyond those that are a part of the normal educational process. This embedding of assessment measures is important to Baker College, who believe that assessment should be an integral piece of the educational process, not an addition to it. The assessment materials are designed to support faculty members in their classroom assessment and evaluation, present students with clear expectations and performance parameters, and provide students detailed feedback on performance as it relates to learning outcomes. In addition to the direct measures, data are collected through the use of indirect measures, including surveys of program graduates, employer surveys, and/or accrediting agency reports. These data are combined with direct measures to complete the assessment data set
Key Performance Indicators (KPI) have been developed to complete the assessment plan. These KPI are intended to measure programs in relation to priorities that have been set by the Institution based on our mission and values. Baker College has identified the following as key performance indicators for evaluating the success of graduate programs:
● Enrollments ● Retention ● Graduation rates ● Employment rates of graduates ● Faculty credentials ● Course and Instructor retention information

2
These KPIs provide data for analysis and evaluation on metrics beyond teaching and learning. These metrics provide the primary operational data necessary for evaluating the stability of the program as well as for planning, budgeting, high level assessment of operations, and how the program contributes to the mission and guiding principles of the institution. Additionally, these metrics are compared across graduate programs developing benchmarks, internal targets, and minimum performance standards. Annually, the program has the responsibility of compiling the data, discussing and analyzing the data with the assessment communities, and collaboratively developing a continuous improvement plan. The continuous improvement plan is designed to identify the steps necessary for improving student learning in the designated areas. To address specific findings, the plan may include identifying actions such as redevelopment of a course, seeking additional data to clarify student achievement, or requesting alteration of specific assignments or teaching strategies to improve attainment of learning outcomes. Based on the findings, the plan may also include operational alterations to such areas as student services or faculty development. In addition to a review of data collected, the program will undertake an annual review of the program assessment plan to determine the effectiveness of the plan, and the quality and usefulness of the data collected. As a portion of this annual review, it is anticipated that the assessment plan for each program will remain a dynamic document, continuing to evolve as the faculty become more experienced in the process of program assessment.

3
Annual Assessment Plan
Instructions: Please be sure to name your files (template and supporting documents) correctly so we can tell who the report and documents belong to. You will want to include the program name and the academic year that you are submitting for. Program: Sciences for Health College Of: Health Sciences Name of person submitting: Becky Voelker Year: 17-18 Assessment Process:
1. Collect data regarding: a. Student learning (direct measures/course embedded assessments) b. Indirect measures c. Key performance indicators
2. Review and analyze data with the following stakeholders: a. Assessment Community members b. Baker College Assessment Committee
3. Develop a Continuous Improvement Action Plan in collaboration with faculty 4. Submit assessment report to required location 5. Implement Continuous Improvement Action Plan 6. Review progress on the Continuous Improvement Action Plan of the prior year
assessment report
Results: Direct Measures of Student learning Currently there are no direct measures in the HSC courses. Baseline informal review noted that in HSC 1210 and HSC 1220, students may have had inflated grades moving into the final exam. OW campus reported the first semester of HSC 120 that students’ average grade on the final exam was 64.4% and students’ average course grade dropped 5% after the final exam grade was applied. Discussion involved the creation of a midterm and final exam for HSC 1210 and HSC 1220 for fall 2019. Results: Indirect Measures of Student Learning
○ Student Evaluations of Faculty - SmartEvals
Summer 2018 39% response rate for all CoHS courses. 40% response rate Spring 2018 and
37% response rate for Fall 2017.

4
○ Faculty course evaluation – Qualtrics
Each course is evaluated on a scale from 0-4 with 4 being the highest. All HSC courses score a
3.0 or above for 17-18 with the exception of HSC 2150 Patho and HSC 2650 Cardiovascular
Pharm. The HSC Program directors will work to review and update the curriculum for HSC 2150.
Some of the issue lies in that the curriculum is a co-req with HSC 1220/1221 Anatomy and
PhysiologyII. The HSC directors do not believe this is the best way to teach these courses. HSC
2650 will be absorbed into the core curriculum in the VAS program and will no longer be a stan
alone course.
■ HSC 1010 3.44
■ HSC 1110 3.00
■ HSC 1210 3.17
■ HSC 1211 3.50
■ HSC 1220 3.00
■ HSC 1250 4.00
■ HSC 1810 4.00
■ HSC 1850 4.00
■ HSC 2150 2.67
■ HSC 2210 4.00
■ HSC 2210 4.00
■ HSC 2410 4.00
■ HSC 2411 3.00
■ HSC 2650 1.50
■ HSC 2710 3.40
■
It has been noted that we had very few faculty complete a faculty course review for the above courses. Assessment plan goals for this year would be to strongly encourage our faculty to complete the faculty course evaluation. A score of 3.0 or above demonstrates a solid curriculum.
○
○ First Destination Survey/Graduate Reporting Survey/End of Program Survey
results - Not applicable for Sciences for Health
○ Summary of FGEP results for the College of - DAA/IES The FGEP results are not
broken down for the HSC specific courses.
●

5
○ WRK Supervisor Evaluation (if not a DM) - Handshake/Career Services
provided - Not applicable for Sciences for Health
○
Advisory Board Minutes - feedback/suggestions Not applicable for Sciences for
Health
Progress Report on Previous Continuous Improvement Action Plan Nothing to report
2018-2019 Continuous Improvement Action Plan
● Identified Improvement Area:
Direct measure creation for the HSC core classes. HSC 1210, 1220 and 2150 will be the
the core courses for all limited enrollment programs.
● Evidence: The HSC directors have discussed and revisited the format for the Anatomy
and Physiology courses that separated the Anatomy and the Physiology instead of the
format taught in semesters that split the course content into body systems.
●
● Improvement Strategy:
Assessment plan creation for the 3 core HSC courses. This will help identify gaps in the
curriculum as well as grading schemas.
● Expected Results:
Improved student outcomes and preparedness for the TEAS and the Kaplan.

1
Annual Assessment Plan Health Information Technology Assessment Process Overview
Baker College embraces a philosophy of continuous quality improvement and requires program administrators to use a variety of robust assessments to ensure that the stated mission and goals are achieved. Both internal and external assessments are utilized to monitor and evaluate the program, allocate resources, create professional development, and update processes as part of the continuous quality improvement cycle. Specifically, the program assessment process is designed to evaluate data from three areas: 1) direct measures of student learning outcomes, 2) indirect measures and 3) key performance indicators. Faculty members, in collaboration with instructional designers, are responsible for developing standardized assessment materials to be used within courses. Authentic assessment materials are designed to evaluate student capabilities as they relate to program and institutional outcomes. These standardized assessment instruments become a part of the course, and all faculty members teaching the course are required to administer the instruments. It should be noted that all standardized assessment instruments are developed with the intent to embed the assessment process within the course. In this manner, students are not asked to complete additional assignments or assessments beyond those that are a part of the normal educational process. This embedding of assessment measures is important to Baker College, who believe that assessment should be an integral piece of the educational process, not an addition to it. The assessment materials are designed to support faculty members in their classroom assessment and evaluation, present students with clear expectations and performance parameters, and provide students detailed feedback on performance as it relates to learning outcomes. In addition to the direct measures, data are collected through the use of indirect measures, including surveys of program graduates, employer surveys, and/or accrediting agency reports. These data are combined with direct measures to complete the assessment data set
Key Performance Indicators (KPI) have been developed to complete the assessment plan. These KPI are intended to measure programs in relation to priorities that have been set by the Institution based on our mission and values. Baker College has identified the following as key performance indicators for evaluating the success of graduate programs:
● Enrollments ● Retention ● Graduation rates ● Employment rates of graduates ● Faculty credentials ● Course and Instructor retention information

2
These KPIs provide data for analysis and evaluation on metrics beyond teaching and learning. These metrics provide the primary operational data necessary for evaluating the stability of the program as well as for planning, budgeting, high level assessment of operations, and how the program contributes to the mission and guiding principles of the institution. Additionally, these metrics are compared across graduate programs developing benchmarks, internal targets, and minimum performance standards. Annually, the program has the responsibility of compiling the data, discussing and analyzing the data with the assessment communities, and collaboratively developing a continuous improvement plan. The continuous improvement plan is designed to identify the steps necessary for improving student learning in the designated areas. To address specific findings, the plan may include identifying actions such as redevelopment of a course, seeking additional data to clarify student achievement, or requesting alteration of specific assignments or teaching strategies to improve attainment of learning outcomes. Based on the findings, the plan may also include operational alterations to such areas as student services or faculty development. In addition to a review of data collected, the program will undertake an annual review of the program assessment plan to determine the effectiveness of the plan, and the quality and usefulness of the data collected. As a portion of this annual review, it is anticipated that the assessment plan for each program will remain a dynamic document, continuing to evolve as the faculty become more experienced in the process of program assessment.

3
Annual Assessment Plan
Instructions: Please be sure to name your files (template and supporting documents) correctly so we can tell who the report and documents belong to. You will want to include the program name and the academic year that you are submitting for. Program: Health Information Technology College Of: Health Science/Campuses - Allen Park, Clinton Township, Flint, Jackson Name of person submitting: Amy Savage Year: 2017-18 Assessment Process:
1. Collect data regarding: a. Student learning (direct measures/course embedded assessments) b. Indirect measures c. Key performance indicators
2. Review and analyze data with the following stakeholders: a. Assessment Community members b. Baker College Assessment Committee
3. Develop a Continuous Improvement Action Plan in collaboration with faculty 4. Submit assessment report to required location 5. Implement Continuous Improvement Action Plan 6. Review progress on the Continuous Improvement Action Plan of the prior year
assessment report

4
Results: Direct Measures of Student learning
Domains
% of
Questions
# of
Questions # Wrong # Right % Correct
Domain 1: Data Analysis &
Management 16% 16 161 607 79%
Domain 2: Coding 22% 22 245 811 77%
Domain 3: Compliance 16% 16 210 558 73%
Domain 4: Information Technology 12% 12 131 445 77%
Domain 5: Quality 12% 12 151 425 74%
Domain 6: Legal 11% 11 134 394 75%
Domain 7: Revenue Cycle 11% 11 158 370 70%
100 1190 3610
The above direct measure results are from the Spring 2018 HIT 2910 RHIT Review capstone course Mock Exam. We have a program goal (and have had it for several years) of achieving an 80% pass rate on the Mock exam, for each campus and as a system. The RHIT national exam pass rate is 70%, and all campuses have consistently achieved a pass rate far above the national pass rate. All individual domains are at or above the national rate, as well as the total Mock

5
exam pass rate result is 75%. This is also above the national rate. We see from the results, that although we met the national rate for individual domains, the Mock Exam results provides us information of where we need to focus for improvement. The following table shows a comparison of the actual RHIT exam results (not Mock Exam from our course) from the HIT program as a system to the National Domain results. We are consistently above the national from this perspective as well.
Domain AHIMA National
Domain % (2016-17)
HIT System Domain
%
(Spring 2018)
% Difference
1 63% 79% +16
2 68% 77% +9
3 62% 73% +11
4 65% 77% +12
5 56% 74% +18
6 69% 75% +6
7 69% 70% +1
Specifically, the Mock Exam results and our actual RHIT test results show that Domain 7: Revenue Cycle is pretty much at the same level as the national exam domain rate. The course that is aligned with this content area was reduced from a 4 credit course in the Quarter format to a 1 credit course for the Semester format. We have discovered, after the transition, that there is not enough time to adequately address this content. The national exam domains have been rewritten and reduced to a total of 6 (which occurred after we had written all the curriculum and transitioned to semesters), thus increasing the percentage of exam questions in this area from 11% to 14-18% and renamed to Revenue Cycle Management. An example to help understand this issue -comparing the new Domain 2, which contains Legal, Privacy and Security content, and is 12-16% of the exam questions, is aligned to our 3 credit

6
Legal course. The RHIT exam % of content between our Legal course and Reimbursement (Revenue cycle content) course is basically the same, yet the credits are not representative. We have discussed “re-combining” the reimbursement course (HIT2350) with the technology course (the new HIT2310) to cover data governance and reimbursement, and increasing the credits. This would be a goal for Spring 2020. Results: Indirect Measures of Student Learning Provide results here. Include relevant graphs and charts. Indirect measures of student learning include all of the following:
○ Student Evaluations of Faculty - SmartEvals
○
■ Review and report the performance of the following questions from the
Student Evaluation of Faculty evaluation results.
● Check to see that you understood the material?
● Would you recommend this instructor to others?
The following represents a SmartEval data compilation of the AP, CT, and FL
campuses with the HIT program.
There were a total of 35 courses taught between all 3 campuses from Fall 2017
to Spring 2018. The data collected from the SmartEvals responses indicated that
the majority of students responded that the instructors either Met or Exceeded
the expectation related to the “Check to see that you understood the material?”
question. Student comments indicate that “instructors kept things interesting”,
“used real-world examples throughout the course”, “instructors engaged with
their students”, and “frequently checked on the student understanding of present
material”.
In response to the question “Would you recommend this instructor to others?”,
majority of students had positive comments, however, there was a low
percentage in a couple of courses in which students commented they would not
recommend that particular instructor. The high percentage of positive comments
related to instructor professionalism, engagement with students, knowledgeable
about material, far outweighed the few negative comments. We find that there is
a direct correlation between “likability” of the instructor and how they are
evaluated by students. We are not concerned with the low percentage of
negative comments. It is expected, but not of any significance to impact
personnel changes.

7
○ Faculty course evaluation - Qualtrics
■ In review of Qualtrics data for Faculty Course Evals for all HIT courses,
they were evaluated on a scale of 0-4, with 4 being the highest. All 12 HIT
courses were rated a 3.5 or above. HIT2410 Organization and Leadership
comment noted some concern with the amount of assignments. The
group will review this course.
○ First Destination Survey/Graduate Reporting Survey/End of Program Survey
results - All of these results are together in Qualtrics as this is one survey
with multiple sections
■ According to the 16-17 First Destination Survey results: The AAS HIT had
56 degrees issues. Knowledge Rate 50%. Employed 67.9% and
Employed Related 68.4%. 36.8% of the graduates gained employment
from the Career Experience Site and the average salary reported was
$28,845.50.
■ Below is a graph the depicts the breakdown of Career Outcomes. Noting
53.57% of our grads are employed full time, 14.29% are employed part
time and 17.86% are seeking employment.

8
○ Summary of FGEP results for the College of HS
There were 4 evaluations for faculty in the College of Health Science HIT Program during 2017-
18. The table below shows the percentage of the 4 faculty members who met or exceeded our
expectations.
Area Percent Meeting or
Exceeding Expectations
Planning and Preparation 100%
Professional Expertise 100%
Learning Environment 100%
Learning Facilitation 100%

9
○ WRK Supervisor Evaluation (if not a DM) - Handshake/Career Services
provided
■ The 2016-17 data for HIT243A externship course, all students met or
exceeded expectations on all supervisor evaluation questions, and all
supervisor comments were very positive. We did review the 2017-18 data
for HIT2510 externship course to date, and the positive trend seems to be
continuing.
○ Advisory Board Minutes - feedback/suggestions
■ Advisory board members across the system are supportive of our
program and continue to hire our graduates and participate in the
externship process.
○ Other program based surveys/accreditation survey results
■ None to report
Results: Key Performance Indicators The following table is from the Bronze mapping document. It represents AP, CT, FL, and JK campuses, however, not all information was provided across the board by all campuses.
2014-15 2015-16 2016-17
Total New Students
Total Registered Students 100 111 47
Retention Rate
1st Year Persistence Rate
Total Graduates 45 43 38
Employment Rate 84.0% 94.0% 81.0%
Related Employment Rate 100.0% 67.0% 83.0%
Program Pass Rate 92.0% 80.0% 96.0%
National/State Pass Rate 70.0% 67.0% 70.0%

10
**Note: In 2016 we aligned our employment rate calculations with NACE so employment numbers will
vary from previous years for that year and beyond
Progress Report on Previous Continuous Improvement Action Plan Health Information Technology does not currently have any formal goals in place. Due to the transition to semesters and revised accreditation competencies occurring simultaneously, we were focused on updating our curriculum to align with those changes. We continue to focus on curriculum mapping to our current standards and also anticipation of competency revisions mandated by the accrediting body (CAHIIM), expected to be effective in 2021. 2018-2019 Continuous Improvement Action Plan Improvement Goal #1:
Identified Area: Mock Exam results and our actual RHIT test results show that Domain 7: Revenue Cycle is pretty much at the same level as the national exam domain rate. However, it is the weakest domain reported for our students. Evidence: The course that is aligned with this content area was reduced from a 4 credit course
in the Quarter format to a 1 credit course for the Semester format. We have discovered, after
the transition, that there is not enough time to adequately address this content. The national
exam domains have been rewritten and reduced to a total of 6 (which occurred after we had
written all the curriculum and transitioned to semesters), thus increasing the percentage of
exam questions in this area from 11% to 14-18% and renamed to Revenue Cycle Management.
Improvement Strategy: We have discussed “re-combining” the reimbursement course
(HIT2350) with the technology course (the new HIT2310) to cover data governance and
reimbursement, and increasing the credits to align more appropriately with the percentage
range of exam questions in this content area. This would be a goal for Spring 2020. We would
also take into consideration the revised standards that are expected to be in place by 2021.
Those revisions are not yet approved by the accrediting body (CAHIIM).
Expected Results: This would allow more time to cover this important content area and re-align
strategies for teaching the course.

1
Criminal Justice CRJ2810/CRJ4810 Associate of Applied Science and Bachelor of Science
Criminal Justice Annual Assessment Plan
Assessment Process Overview
Baker College embraces a philosophy of continuous quality improvement and requires program administrators to use a variety of robust assessments to ensure that the stated mission and goals are achieved. Both internal and external assessments are utilized to monitor and evaluate the program, allocate resources, create professional development, and update processes as part of the continuous quality improvement cycle. Specifically, the program assessment process is designed to evaluate data from three areas: 1) direct measures of student learning outcomes, 2) indirect measures and 3) key performance indicators. Faculty members, in collaboration with instructional designers, are responsible for developing standardized assessment materials to be used within courses. Authentic assessment materials are designed to evaluate student capabilities as they relate to program and institutional outcomes. These standardized assessment instruments become a part of the course, and all faculty members teaching the course are required to administer the instruments. It should be noted that all standardized assessment instruments are developed with the intent to embed the assessment process within the course. In this manner, students are not asked to complete additional assignments or assessments beyond those that are a part of the normal educational process. This embedding of assessment measures is important to Baker College, who believe that assessment should be an integral piece of the educational process, not an addition to it. The assessment materials are designed to support faculty members in their classroom assessment and evaluation, present students with clear expectations and performance parameters, and provide students detailed feedback on performance as it relates to learning outcomes. In addition to the direct measures, data are collected through the use of indirect measures, including surveys of program graduates, employer surveys, and/or accrediting agency reports. These data are combined with direct measures to complete the assessment data set
Key Performance Indicators (KPI) have been developed to complete the assessment plan. These KPI are intended to measure programs in relation to priorities that have been set by the Institution based on our mission and values. Baker College has identified the following as key performance indicators for evaluating the success of graduate programs:
● Enrollments ● Retention ● Graduation rates ● Employment rates of graduates

2
● Faculty credentials ● Course and Instructor retention information
These KPIs provide data for analysis and evaluation on metrics beyond teaching and learning. These metrics provide the primary operational data necessary for evaluating the stability of the program as well as for planning, budgeting, high level assessment of operations, and how the program contributes to the mission and guiding principles of the institution. Additionally, these metrics are compared across graduate programs developing benchmarks, internal targets, and minimum performance standards. Annually, the program has the responsibility of compiling the data, discussing and analyzing the data with the faculty council, and collaboratively developing a continuous improvement plan. The continuous improvement plan is designed to identify the steps necessary for improving student learning in the designated areas. To address specific findings, the plan may include identifying actions such as redevelopment of a course, seeking additional data to clarify student achievement, or requesting alteration of specific assignments or teaching strategies to improve attainment of learning outcomes. Based on the findings, the plan may also include operational alterations to such areas as student services or faculty development. In addition to a review of data collected, the program will undertake an annual review of the program assessment plan to determine the effectiveness of the plan, and the quality and usefulness of the data collected. As a portion of this annual review, it is anticipated that the assessment plan for each program will remain a dynamic document, continuing to evolve as the faculty become more experienced in the process of program assessment.

3
Criminal Justice Annual Assessment Plan
Program: Criminal Justice AAS and BS College Of: College of Social Science Name of person submitting: Michael A. Picerno Department Chair Year: 2017-2018 Assessment Process:
1. Collect data regarding: a. Student learning (direct measures/course embedded assessments) b. Indirect measures c. Key performance indicators
2. Review and analyze data with the following stakeholders: a. Assessment Community members b. Baker College Assessment Committee
3. Develop a Continuous Improvement Action Plan in collaboration with faculty 4. Submit assessment report to required location 5. Implement Continuous Improvement Action Plan 6. Review progress on the Continuous Improvement Action Plan of the prior year
assessment report
Results: Direct Measures of Student learning Direct Measure are employed at the end of every semester for the Associate and Bachelor
Criminal justice Program. The direct measure address each of the specific outcomes and
measure the behaviors and knowledge of each student. In all cases, the direct address each
program outcome and require each student to demonstrate competency in knowledge and
skills in the Criminal Justice field. Faculty assigned to teach the capstone courses, which
includes the direct measures are reviewed by program directors and field work coordinators on
a regular basis.
CThe direct measure requires students to produce work and site supervisors to observe and
evaluate the student’s skills so that the instructor can assess how well students meet
expectations. The strength of direct measurement is that faculty members are capturing a
representation of what students can do, which is strong evidence of student learning. A
weakness of direct measure is that not everything can be demonstrated in a direct way, such as
values, perceptions, feelings and attitudes, Content is demonstrated through knowledge of
subject matter (Cognitive Learning). Some examples include reports and evaluations and

4
assessments in the field. Skill acquisition is demonstrated by a comprehension of topics,
demonstrations of competency, etc. Awareness, interest, concerns, (affected learning) is
demonstrated by supervisor evaluation and coursework. Some examples include supervisor
evaluation and assessment and assessment of student progress and demonstrated knowledge;
students pre and post understanding and changes in attitude, values or beliefs as evident in
their reflection paper. According to the data provided by site supervisors, our students exceed
expectations when it comes to categories such as professionalism, positive interactions with
others and critical thinking.
Direct measures are an essential element of our program as it provides accountability to others,
but also the thoughtfulness that we give to the learning environment we provide to our
students, the interest we have in our students and the extent that staff become in our
discipline, program, institution and community. The CRJ program is regularly assessed in order
to improve the quality of our students learning experience. Many of these overarching
inclusions are fostered during advisory board meetings at the campuses to ensure the latest
needs are learned to emplace in the curriculum when possible.
CRJ2810 and CRJ 4810 are the current capstones of all CRJ Associate of Applied Science and
Bachelor of Science. The reflection paper includes writing organization and writing mechanics
of the reflection paper assignment. The results of that measure show 91% exceeds the
student’s expectations while meeting 9% of remaining students, there were no lower scores
submitted. The respondent numbers were small in number.
Evidence Project Name Course ID Rubric Name
Content of Paper
Writing Organization
Writing Mechanics
Overall Score
Rubric Max
CRJ2810 2017-2018
crj2810-s2018-ol-u-a1.001
Reflection Paper Rubric 4 4 4 95 100
CRJ2810 2017-2018
crj2810-s2018-ol-u-a1.001
Reflection Paper Rubric 4 4 4 95 100
CRJ2810 2017-2018
crj2810-s2018-ol-u-a1.001
Reflection Paper Rubric 4 4 4 95 100

5
CRJ2810 2017-2018
crj2810-s2018-ol-u-a1.001
Reflection Paper Rubric 4 4 4 95 100
CRJ2810 2017-2018
crj2810-s2018-ol-u-a1.001
Reflection Paper Rubric 4 4 3 94 100
CRJ2810 2017-2018
crj2810-s2018-ol-u-a1.001
Reflection Paper Rubric 4 4 4 95 100
CRJ2810 2017-2018
crj2810-s2018-ol-u-a1.001
Reflection Paper Rubric 4 4 3 94 100
CRJ2810 2017-2018
crj2810-s2018-ol-u-a1.001
Reflection Paper Rubric 3 4 3 86 100
CRJ2810 2017-2018
crj2810-s2018-ol-u-a1.001
Reflection Paper Rubric 4 4 4 95 100
CRJ2810 2017-2018
crj2810-s2018-ol-u-a1.001
Reflection Paper Rubric 4 4 3 94 100
CRJ2810 2017-2018
crj2810-s2018-ol-u-a1.001
Reflection Paper Rubric 4 4 4 95 100
Frequency Distribution:
Exceeds Expectations
(4) 10 11 7 94
Meets Expectations
(3) 1 0 4
Below Expectations
(2) 0 0 0
Section Missing (1) 0 0 0
Average:
Exceeds Expectations
(4) 91% 100% 64%

6
Meets Expectations
(3) 9% 0% 36%
Below Expectations
(2) 0% 0% 0%
Section Missing (1) 0% 0% 0%
Results: Indirect Measures of Student Learning
○ Student Evaluations of Faculty - SmartEvals
■ Review and report the performance of the following questions from the
Student Evaluation of Faculty evaluation results.
● Check to see that you understood the material?
● Would you recommend this instructor to others?
○ Faculty course evaluation - Qualtrics
■ Summarize and report the results
○ First Destination Survey/Graduate Reporting Survey/End of Program Survey
results - All of these results are together in Qualtrics as this is one survey
with multiple sections
■ Summarize and report the results
○ Summary of FGEP results for the College of - DAA/IES
○ WRK Supervisor Evaluation (if not a DM) - Handshake/Career Services
provided
■ Summarize and report the results
● 2017/2018 Experience Supervisor Sur...
● CRJ 2810
● Y ● Filters ● Course Label: crj2810 - criminal justice (associate)
● Campus
● The student follows organizational policies and procedures.
● Yes (85%)
● Allen Park (20%)
● Jackson (5%)
● The student understands and adheres to safety standards and requirements.

7
● Yes (100%)
● The student retains information without the need for repeated explanation.
● Online (10%)
● Owosso (10%) Cadillac (10%)
● Yes (90%) Yes (90%)
● Flint (20%)
● The student exhibits situational awareness when faced with challenges in the Criminal Justice field.
● Yes (85%) Yes (85%)
● Muskegon (10%) Auburn Hills (5%)
● The student respects professional boundaries.
● Yes (95%)
● Additional Supervisor Comments ● Carissa Alcala Allen Park Mrs. Alcala stated that she wants to go into probation.
In essence the position of police officer and detective bureau is the first stage in the criminal justice system leading to her career choice in probation. She has expressed that she did not know what to expect coming into this intern and seems surprised that it consists mostly of paperwork and documentation instead of exciting police work. She has been exposed to detective work and road patrol. I do not know her exact feelings on her experience. At the beginning of the internship I told her to keep a written log on her experience and what she learned, likes or dislikes. The last report I received was the first initial one of May 27th thru June 16th. I have not, or anyone else receive any update reports on her experience. I am not sure if she reports her hours directly to the school but I advised her at the beginning to keep a log on her hours. To this date I have received no log and have no idea what or how many hours she has actually attended. These requests are her responsibility. She is a quiet and respectful person but overall I don't see the enthusiasm and excitement towards this field of work.

8
Results: Key Performance Indicators Provide results here. Include relevant graphs and charts. (KPI data will be provided to each Assessment Community.)
● Number of students ● Retention ● Graduation Rate ● Faculty Credentials ● Employment ● Course/Instructor Retention Data (Carina Resources/Archived Reports/Instructor
or Course Retention Report)
2013-14 2014-15 2016-17 2017-18
Total New
Students
Total Registered
Students
Retention Rate
1st Year
Persistence Rate
Total Graduates
Graduation Rate
Employment Rate
Related
Employment Rate
**Note: In 2016 we aligned our employment rate calculations with NACE so employment numbers will
vary from previous years for that year and beyond
Progress Report on Previous Continuous Improvement Action Plan N/A
2018-2019 Continuous Improvement Action Plan
Annual Assessment Report Review Guide:
Program: Criminal Justice
Team Leader(s): Michael Picerno
Team Members: Jon Johnston, June Rogers

9
Meeting Date: January 23, 2018
The intent of this guide is to assist the assessment community group through the review of assessment achievement levels, processes, and steps which will enable the group to draft their annual assessment report for the second assessment community meeting that will be scheduled for June/July 2018. This guide will allow the group to create a work plan as to who will complete which parts of the review process. It is recommended that this guide be updated on an ongoing basis to ensure progress toward report completion. The System Assessment Committee will ask for periodic updates regarding progress to help groups stay on track and ensure they have the information needed to continue to develop their annual report. NOTES & TIPS:
● Goal is to have all groups on Diamond achievement level by August 2018. To do this, programs will need to review previous items from quarter versions of programs as well as put in place any items needed to be on Diamond level.
● Final drafts of Annual Assessment Reports are due by the end of September 2018 (see template of report for all sections needing to be addressed).
● A draft of the report is due prior to the second assessment community meeting to be held in June/July 2018.
● Groups can request the Data Integrity and Reliability Team (DIRT) review any information or schedule a time to meet with your group between the first and second Assessment Community meetings to assist with data review.
Goal #1: Review Assessment Achievement Levels to update and ensure accuracy with conversion to semesters.
Task #1
Bronze: Program Mapping to Semester Courses - Even if your program conducted mapping at one point, this information will need to be
updated and reworked to align to semester courses (use Bronze Level Evidence Spreadsheet to update this level of Assessment Achievement Levels)
Task ID Task Description Deliverable Responsibility Due Date Status
1.1 Mapping Found Update Picerno March
1.2 Compare Quarter SLOs to Semester SLOs
Identify Discrepancies for Mapping Document
Rogers March
Etc.
Task #2
Silver/Gold: Program Outcomes & Capstone Assessment - Did any of your program outcomes change from quarters to semester? - Does your program have a capstone assessment(s) (direct measures being collected for each
outcome)? ● If no, you will need to develop capstone assessment(s) and rubrics to be implemented
no later than Fall 2018. ● If yes, does the current capstone assessment(s) cover all new program outcomes?

10
● Compare their pre semester capstone assessment/rubric. Did it stay the same? Did it change (if so, will want to note how this affects comparison of data sets from pre and post semesters)? Revisions needed?
- Action plans should include review of this data to make data driven decisions regarding program development.
Task ID Task Description Deliverable Responsibility Due Date Status
2.1 Review Capstone Assessments and Rubrics for all new program outcomes; compare pre-semester capstone assessment to determine if same and provide recommendation for action plan.
March June Rogers March
2.2
Etc.
Task #3
Platinum: Milestone Data - Does your program have milestone assessments (direct measures being collected) for each
program outcome throughout the program? ● If yes, compare and contrast the milestone assessments from prior to and after
semesters? Did the milestone assessments change with the shift to semesters? If there is change, how does this affect comparison of data sets from pre and post semesters? Are there additional milestones necessary based on program mapping?
● If your program does not have milestone assessments/rubrics/direct measures, you will need to develop them to be implemented no later than Fall 2018.
- Action plans should include review of this data to make data driven decisions regarding program development.
Task ID Task Description Deliverable Responsibility Due Date Status
3.1 Review courses, especially CRJ 2210 for milestone consideration.
March June Rogers March
3.2 CRJ2510 selected as milestone Spring 2019 M. Picerno September 28, 2018
Etc.
Task #4
Diamond: Key Performance Indicators, Accreditation, and External Benchmarks - Review the requirements for this level. - Ensure you include the elements of this level that are relevant to your program and speak to
those within your Annual Assessment Report. - Share any data and discuss any elements already in place.

11
- Ensure your Action goals for 2018-2019 include discussion of progression within the Diamond level.
Task ID Task Description Deliverable Responsibility Due Date Status
4.1 Additional Assessment DM CRJ2510
Spring 2019 M. Picerno 09-28-2018
Completed
4.2 Too late for Spring Offering
Etc.
Goal #2: Ensure access to all data needed for each section of the annual assessment report and identify who will work on analysis and draft of each section of report (see template of report for all sections needing to be addressed).
Task #5
-
Task ID Task Description (Data Set and Section or Report)
Deliverable Responsibility Due Date Status
5.1 Additional Assessment DM CRJ2510
Summer M. Picerno Fall 2018 Re-writing RACS
5.2
Etc.
CRJ 2510 – Milestone Course Direct Measure Assessment
Discussion
Student Evaluation Survey Data from CRJ 2510 suggests that students perceive that the semester
version of the course has too many assignments. In fact, currently there are 24 assignments and a mid-
term exam (take-home). With this proposed change, there would be 20 assignments, the mid-term and
a direct-measure final open-book examination.
The 110-point Final Examination is possible by eliminating Ethics Scenarios 10, 11 and 12, which were 20
points each, and The Law Enforcement Consent Decree Paper which was worth 50 points. The remaining
Ethical Scenarios will be spaced out more. The Consent Decree Paper can be moved into instructor
resources for as an optional assignment.
The Final Examination incorporates knowledge students will acquire in other assignments such as the
nine Ethics Scenarios, the Describing Ethics Paper, and the Paper on Ethical Codes of Conduct and
Standards.
Based on a survey of the AP CRJ Advisory Board, one of the most common ethical issues currently
trending among professionals in the field involves social media and technical transmission such as text

12
messaging. Accordingly, you will note that the scenarios where each segment of the criminal justice
system is represented includes a social media or technical component. However, just as the cyber-world
is inherently neutral, ethical dilemmas have been intertwined in each scenario.
Final Examination
Due: Week 16
Points: 110
Read the four scenarios listed below. Select only one of the scenarios for your response. Choose the
scenario you believe you can provide the best response. You may wish to take into consideration the
scenario which most interests you or that more closely matches your career choice. After selecting your
scenario, hand-write your answers to the following questions.
Note: this is an open-book exam. You may also use your device to explore resources to identify codes or
standards of conduct relating to the ethical dilemma.
Exam Questions
• Identify the scenario number and provide an ethical answer to the situation using a criminal
justice professional’s perspective. Be sure to include the following (60 points):
· What are at least two factors that classify the situation as an ethical dilemma for you, a person
who has knowledge about the co-worker’s conduct?
· Describe in detail why you consider the conduct described (of the co-worker) as ethical or
unethical.
• Relate your answer to an appropriate professional code or standard of conduct (be sure to spell
out the code/standard of conduct. Include organization’s name and website address). – 30 Points
• Considering outcomes identify one consequence from a societal standpoint if the situation is not
handled properly. – 10 Points
• Considering outcomes identify one consequence from an agency standpoint if this scenario is
mishandled. 10 Points
Ethical Scenarios (Remember choose only one)
Scenario #1 – The Probation Officer
You are Facebook friends with Casey a fellow probation officer. (The Facebook page is not restricted to
work; Casey has several people who access the information who are not probation officers). You have
adopted a habit of reading Casey’s posts first thing in the morning because they are usually inspirational.

13
However, not today. When you log in at 7:00 am, you notice that Casey is in a bad mood and has posted
about an incident taking place last night. Here is what was posted:
“I am so sick of giving these probationers a second chance! It’s like baby-sitting! Then when you
catch them in the act, and try to violate their probation – the judge goes and gives them a third, fourth
or even fifth chance! Last night I almost caught John Dillinger dealing drugs. I know he had a gun, but I
just couldn’t find it. He lives at 123 Castle Street. I’m naming names, so you my friends know who to
avoid and I want everyone to know that when J.D. goes and hurts somebody, they can’t blame me.”
Scenario #2 – The Police Officer
Police officers have access to several computerized information systems they can search for official
purposes to determine if an individual has a criminal history. Your good friend and fellow officer, Shawn,
tells you that he queried one of these databases to check a professional football player nicknamed
Refrigerator George, who is also his ex-wife’s new love interest. Armed with the knowledge that the
individual has past arrests (no convictions) for aggravated assault, Shawn found a picture of a random
woman with a black eye that he just texted this to a news tip-line at a local television station with the
following caption:
“Refrigerator George doesn’t just hit hard on the field…..”
Scenario #3 – The Prosecutor
Your fellow prosecutor Jesse is known for negotiating some of the strictest plea deals on behalf of the
county. It is unusual that she enters into any deal unless there is a recommendation that the defendant
receives at least one-year incarceration. That is why it seemed odd when Jesse cut a deal for Bonnie
Parker to receive probation after she shot and wounded someone during a road-rage incident. Now
several weeks later as you look for a pen on Jesse’s desk, you notice that Bonnie Parker’s picture and her
name pop-up on display when Jesse’s cell phone rings. When Jesse returns to her desk, you hear her
place a call and say this in a hushed tone:
“Hey, we’ve been friends long enough that you should remember not to call me during work hours – just
text me or something. Okay, yeah I’m free tonight. See you later.”
Scenario #4 – The Corrections Officer
Due to you and your co-worker’s first initial and last name being the same, your email addresses are
only one character off. Not surprisingly, you sometimes receive Dan’s emails in error. In addition, he has
had to forward to you some of your emails that he got by mistake. You have just opened the email
described below that you are certain is not meant for you.

14
“Dan. It’s a shame couldn’t take any pictures of the fun we had last week. But I got someone on the
outside to forward you this picture of me during my free days.
-Signed – your favorite “in-mate” – get it, ha ha….”
(SLO 1a and 1c, SLO 2b, 2c, 2d, SLO 3a and 3c and SLO 4a and 4b and SLO 6c)
CRJ 2510 – Milestone Course Direct Measure Assessment Discussion Student Evaluation Survey Data from CRJ 2510 suggests that students perceive that the semester version of the course has too many assignments. In fact, currently there are 24 assignments and a mid- term exam (take-home). With this proposed change, there would be 20 assignments, the mid-term and a direct-measure final open-book examination. The 110-point Final Examination is possible by eliminating Ethics Scenarios 10, 11 and 12, which were 20 points each, and The Law Enforcement Consent Decree Paper which was worth 50 points. The remaining Ethical Scenarios will be spaced out more. The Consent Decree Paper can be moved into instructor resources for as an optional assignment. The Final Examination incorporates knowledge students will acquire in other assignments such as the nine Ethics Scenarios, the Describing Ethics Paper, and the Paper on Ethical Codes of Conduct and Standards. Based on a survey of the AP CRJ Advisory Board, one of the most common ethical issues currently trending among professionals in the field involves social media and technical transmission such as text messaging. Accordingly, you will note that the scenarios where each segment of the criminal justice system is represented includes a social media or technical component. However, just as the cyber-world is inherently neutral, ethical dilemmas have been intertwined in each scenario. Final Examination Due: Week 16 Points: 110 Read the four scenarios listed below. Select only one of the scenarios for your response. Choose the scenario you believe you can provide the best response. You may wish to take into consideration the scenario which most interests you or that more closely matches your career choice. After selecting your scenario, hand-write your answers to the following questions. Note: this is an open-book exam. You may also use your device to explore resources to identify codes or standards of conduct relating to the ethical dilemma. Exam Questions • Identify the scenario number and provide an ethical answer to the situation using a criminal justice professional’s perspective. Be sure to include the following (60 points):

15
· What are at least two factors that classify the situation as an ethical dilemma for you, a person who has knowledge about the co-worker’s conduct? · Describe in detail why you consider the conduct described (of the co-worker) as ethical or unethical. • Relate your answer to an appropriate professional code or standard of conduct (be sure to spell out the code/standard of conduct. Include organization’s name and website address). – 30 Points • Considering outcomes identify one consequence from a societal standpoint if the situation is not handled properly. – 10 Points • Considering outcomes identify one consequence from an agency standpoint if this scenario is mishandled. 10 Points Ethical Scenarios (Remember choose only one) Scenario #1 – The Probation Officer You are Facebook friends with Casey a fellow probation officer. (The Facebook page is not restricted to work; Casey has several people who access the information who are not probation officers). You have adopted a habit of reading Casey’s posts first thing in the morning because they are usually inspirational. However, not today. When you log in at 7:00 am, you notice that Casey is in a bad mood and has posted about an incident taking place last night. Here is what was posted: “I am so sick of giving these probationers a second chance! It’s like baby-sitting! Then when you catch them in the act, and try to violate their probation – the judge goes and gives them a third, fourth or even fifth chance! Last night I almost caught John Dillinger dealing drugs. I know he had a gun, but I just couldn’t find it. He lives at 123 Castle Street. I’m naming names, so you my friends know who to avoid and I want everyone to know that when J.D. goes and hurts somebody, they can’t blame me.” Scenario #2 – The Police Officer Police officers have access to several computerized information systems they can search for official purposes to determine if an individual has a criminal history. Your good friend and fellow officer, Shawn, tells you that he queried one of these databases to check a professional football player nicknamed Refrigerator George, who is also his ex-wife’s new love interest. Armed with the knowledge that the individual has past arrests (no convictions) for aggravated assault, Shawn found a picture of a random woman with a black eye that he just texted this to a news tip-line at a local television station with the following caption: “Refrigerator George doesn’t just hit hard on the field…..” Scenario #3 – The Prosecutor Your fellow prosecutor Jesse is known for negotiating some of the strictest plea deals on behalf of the county. It is unusual that she enters into any deal unless there is a recommendation that the defendant receives at least one-year incarceration. That is why it seemed odd when Jesse cut a deal for Bonnie Parker to receive probation after she shot and wounded someone during a road-rage incident. Now several weeks later as you look for a pen on Jesse’s desk, you notice that Bonnie Parker’s picture and her name pop-up on display when Jesse’s cell phone rings. When Jesse returns to her desk, you hear her place a call and say this in a hushed tone: “Hey, we’ve been friends long enough that you should remember not to call me during work hours – just text me or something. Okay, yeah I’m free tonight. See you later.”

16
Scenario #4 – The Corrections Officer Due to you and your co-worker’s first initial and last name being the same, your email addresses are only one character off. Not surprisingly, you sometimes receive Dan’s emails in error. In addition, he has had to forward to you some of your emails that he got by mistake. You have just opened the email described below that you are certain is not meant for you. “Dan. It’s a shame couldn’t take any pictures of the fun we had last week. But I got someone on the outside to forward you this picture of me during my free days. -Signed – your favorite “in-mate” – get it, ha ha….” (SLO 1a and 1c, SLO 2b, 2c, 2d, SLO 3a and 3c and SLO 4a and 4b and SLO 6c)

17
●

1 9/2018
Annual Assessment Plan
Assessment Process Overview Baker College embraces a philosophy of continuous quality improvement and requires program administrators to use a variety of robust assessments to ensure that the stated mission and goals are achieved. Both internal and external assessments are utilized to monitor and evaluate the program, allocate resources, create professional development, and update processes as part of the continuous quality improvement cycle. Specifically, the program assessment process is designed to evaluate data from three areas: 1) direct measures of student learning outcomes, 2) indirect measures and 3) key performance indicators. Faculty members, in collaboration with instructional designers, are responsible for developing standardized assessment materials to be used within courses. Authentic assessment materials are designed to evaluate student capabilities as they relate to program and institutional outcomes. These standardized assessment instruments become a part of the course, and all faculty members teaching the course are required to administer the instruments. It should be noted that all standardized assessment instruments are developed with the intent to embed the assessment process within the course. In this manner, students are not asked to complete additional assignments or assessments beyond those that are a part of the normal educational process. This embedding of assessment measures is important to Baker College, who believe that assessment should be an integral piece of the educational process, not an addition to it. The assessment materials are designed to support faculty members in their classroom assessment and evaluation, present students with clear expectations and performance parameters, and provide students detailed feedback on performance as it relates to learning outcomes. In addition to the direct measures, data are collected through the use of indirect measures, including surveys of program graduates, employer surveys, and/or accrediting agency reports. These data are combined with direct measures to complete the assessment data set
Key Performance Indicators (KPI) have been developed to complete the assessment plan. These KPI are intended to measure programs in relation to priorities that have been set by the Institution based on our mission and values. Baker College has identified the following as key performance indicators for evaluating the success of graduate programs:
● Enrollments ● Retention ● Graduation rates ● Employment rates of graduates ● Faculty credentials ● Course and Instructor retention information
These KPIs provide data for analysis and evaluation on metrics beyond teaching and learning. These metrics provide the primary operational data necessary for evaluating the stability of the

2 9/2018
program as well as for planning, budgeting, high level assessment of operations, and how the program contributes to the mission and guiding principles of the institution. Additionally, these metrics are compared across graduate programs developing benchmarks, internal targets, and minimum performance standards. Annually, the program has the responsibility of compiling the data, discussing and analyzing the data with the assessment communities, and collaboratively developing a continuous improvement plan. The continuous improvement plan is designed to identify the steps necessary for improving student learning in the designated areas. To address specific findings, the plan may include identifying actions such as redevelopment of a course, seeking additional data to clarify student achievement, or requesting alteration of specific assignments or teaching strategies to improve attainment of learning outcomes. Based on the findings, the plan may also include operational alterations to such areas as student services or faculty development. In addition to a review of data collected, the program will undertake an annual review of the program assessment plan to determine the effectiveness of the plan, and the quality and usefulness of the data collected. As a portion of this annual review, it is anticipated that the assessment plan for each program will remain a dynamic document, continuing to evolve as the faculty become more experienced in the process of program assessment.

3 9/2018
Human Services Annual Assessment Plan
Instructions: Please be sure to name your files (template and supporting documents) correctly so we can tell who the report and documents belong to. You will want to include the program name and the academic year that you are submitting for. Program: Human Service College Of: Social Sciences Name of person submitting: Kristina Marshall, Program Chair Year: 2018 Assessment Process:
1. Collect data regarding: a. Student learning (direct measures/course embedded assessments) b. Indirect measures c. Key performance indicators
2. Review and analyze data with the following stakeholders: a. Assessment Community members b. Baker College Assessment Committee
3. Develop a Continuous Improvement Action Plan in collaboration with faculty 4. Submit assessment report to required location 5. Implement Continuous Improvement Action Plan 6. Review progress on the Continuous Improvement Action Plan of the prior year
assessment report
Results: Direct Measures of Student learning Direct Measures are employed at the end of every semester for the Bachelor’s in Human
Service Program. The direct measures address each of the specific outcomes and measure
specific behaviors and knowledge of each student. In all cases, the direct measures address
each program outcome, and require the students to demonstrate competency in knowledge
and skills in the Human Services field. Faculty assigned to teach the capstone course, which
includes the direct measures, regularly meet to assess the progress of the students and the
relevance of the direct measures. Furthermore, direct measures are reviewed by program
directors and field work coordinators on a regular basis.
The direct measure requires students to produce work and site supervisors to observe and
evaluate the students skills so that the instructor can assess how well students meet
expectations. The strength of direct measurement is that faculty members are capturing a
representation of what students can do, which is strong evidence of student learning. A
possible weakness of direct measurement is that not everything can be demonstrated in a

4 9/2018
direct way, such as values, perceptions, feelings, and attitudes. Content is demonstrated
through knowledge of a subject matter (Cognitive learning). Some examples include projects,
reports, evaluations, and assessment of student work in the field. Skill Acquisition is
demonstrated by a comprehension of topics, demonstration of a competency, etc. Some
examples include assignments and coursework in capstone course. Awareness, interest,
concerns, etc (affective learning) is demonstrated by supervisor evaluation and coursework.
Some examples include supervisor evaluation and assessment of student progress and
demonstrated knowledge; students pre and post understanding and changes in attitudes,
values or beliefs as evident in their reflection paper. According the data provided by site
supervisors, our students exceed expectations when it comes to all categories such as
professionalism, positive interactions with others, critical thinking, attitudes, etc.
Direct measures are an essential element of our program as it provides accountability to others,
but also the thoughtfulness that we give to the learning environment we provide to our
students, the interest we have in our students and the extent that we become involved in our
discipline, program, institution and community. We regularly assess our program in order to
improve the quality of our students’ learning experience.
Results: Indirect Measures of Student Learning The average score of faculty evaluations across campuses for all 21 human services courses is a
3.48 out 4. According to our faculty, 91% agree that our course content and activities are
necessary in the human services field. Approximately 90% of our faculty conclude that our
courses support the larger institutional learning outcomes.
In 2016/2017, there were 321 degrees issued in human services across campuses. According to
our First Destination Survey, we received a 56.1% response rate, in which 35% reported that
they were continuing their education and 61.4% reported being employed in the field. These
results included graduated from both the associate and bachelor degrees. Of the 321 degrees
issued during this time, 151 of those degrees were bachelor level. The survey response rate of
these graduates was 45% and 68.9% reported being employed in the field.
In 2017/2018, which is currently still in progress, as of September 2018, graduates report 64.5%
employment and of that 64.5%, 75.7% report being employed in the human services field.

5 9/2018
Qualtrics results indicate that students within the College of Social Science, which includes the
Human Services program, have an average GPA of 3.22. Therefore one can conclude that
students within the College of Social Science are above average in their academic performance.
For more specific results and data related to faculty evaluations, graduate employment, and
internship site supervisor evaluations, please use this link:
https://baker.az1.qualtrics.com/vocalize/#/dashboard/default?pageId=Page_2611eb75-9cd3-
4a9d-ad18-c99df93dc2f4
Results: Key Performance Indicators In 2016, we aligned our employment rate calculations with NACE so employment numbers will
vary from previous years. If we look at the career outcomes rate as opposed to the
employment rate for 2017/2018 for both bach and assoc. our career outcome is 83.9%. The
career outcome rate is a combination of the employed, continuing education, volunteering and
serving in the military. This is the outcome that is recommended by NACE. This is also
benchmarked against other institutions. This is a better gauge of our outcome success.
Additionally, from our graduate surveys, we can report that approximately 3 out of 10
graduates are employed where they interned.
Progress Report on Previous Continuous Improvement Action Plan Due to the change in our institutional structure from quarters to semesters, previous data does not reflect our current program performance or student outcomes. There have been many steps taken to improve the human services program, which include:
● Accreditation awarded in May 2015 ● Process has begun for the accreditation renewal for 2020 ● Curriculum revisions were made for the quarters to semesters transition ● Program milestones were identified ● Assessment steps have been evaluated to provide a more robust appraisal of the
program 2018-2019 Continuous Improvement Action Plan Improvement Goal #1: Establish reliability and validity of the Direct Measure #1 (Work
Experience Student Evaluation/Internship Evaluation).

6 9/2018
● Evidence: In the previous evaluation tool prior to Fall 2017, the evaluation tool
used a likert-type scale that resulted in too much subjectivity, broad range
results, and did not meet our expectations. The previous scale was used for at
least 3 years. A committee of at least 10 people was then formed to reassess the
instrument. The committee consisted of the Provost, instructional design team,
career services, deans, the assessment department, instructors, and a
statistician. The first 13 questions on the new evaluation tool are standardized
throughout all programs at Baker College and are based on the institutional
learning outcomes. The final 13 questions on the new evaluation are specific to
the Human Services Program. Those questions address each program outcome,
and require the students to demonstrate knowledge, competency, and skills in
the Human Services field. This is a new tool therefore reliability and validity has
not been established.
● Improvement Strategy: We are gathering multiple evaluations on numerous
interns for purposes of establishing reliability and validity. We are asking that
two site supervisors independently fill out an evaluation on interns when
plausible.
● Expected results: Preliminary data has demonstrated good validity and reliability,
however our sample size is too small to establish statistical significance. Every
semester we will be collecting data from each campus until we reach the point of
statistical significance, ideally by the end of the 2018-2019 academic year.
Improvement Goal #2: Establish reliability and validity of the Direct Measure #2 (Reflection
Paper).
● Evidence: This tool addresses each program outcome, and requires the students
to demonstrate knowledge, competency, and skills in the Human Services field.
Data on reliability and validity has not been gathered on the semester revision of
this direct measure.
● Improvement Strategy: Content experts will convene during the 2018-19
academic year. They will be independently scoring random samples of the
Reflection Papers submitted by HUS 4710 students to establish validity and
reliability.
● Expected results: Preliminary data collection will begin in August 2018. Every
semester we will be collecting data from each campus until we reach the point of
statistical significance by the end of the 18-19 Academic year.
Improvement Goal #3: Establish and formally collect data on milestones for Human Services
program.

7 9/2018
● Evidence: Milestones are checkpoints within the Human Service program where
we assess student knowledge to assure they are making satisfactory progress
with program outcomes. We have identified existing assessments that will serve
as milestones to meet all program outcomes. The following are milestones:
○ HUS 1010 – History and Trends in Human Services Assignment (Fall)
○ HUS 2210 – Comprehensive Case Assessment (Spring)
○ HUS 2710 – Agency Paper, Supervisor Evaluation (Fall, Spring, Summer)
○ HUS 4210 – Standardized Project (Fall)
○ HUS 4310 – The Final Project (Spring)
● Improvement Strategy: We will be reviewing progress on a yearly basis, in which
we will identify any gaps in student knowledge, implementing any additional
milestones and/or curriculum as needed.
● Expected results: This will be an ongoing process as we look at our milestone
prior to each academic year to assess the validity and relevance within the field.
Improvement Goal #4: Continue to review curriculum for all program classes.
● Evidence: As we continue to listen to advisory boards and what is needed in the field,
we will continue to assess the current assignments, curriculum and course offerings.
● Improvement Strategy: To continue to review assignments and curriculum.
● Expected results: After every semester, we survey faculty and students for feedback on
curriculum for each course. We will have regular program director and advisory board
meetings to discuss feedback and potential necessary revisions. The expected results of
this process will be to strengthen student knowledge and skills to be current in the
Human Services field.
Improvement Goal #5: Explore potential other electives to encompass a broader scope of the
human services field.
● Evidence: Our students and faculty need to be current as the scope of the human
services field evolves and changes. Our program has a strong social work and
psychology focus. Based on the feedback from the accreditation agency, they would like
us to broaden the scope of our program. Based on that feedback, we did add non-profit
grant writing and fundraising electives.
● Improvement Strategy: To continue to broaden the scope of our program, we will be
evaluating additional elective options. We will continue to gather feedback from our
advisory boards and accrediting body to assess needed changes in curriculum and
electives.
● Expected results: Human Services and system-level leadership teams will continue to
have conversations with the goal of broadening the scope of the program.

8 9/2018

Annual Assessment Plan
Program: Game Software Development College Of: Information Technology Name of person submitting: Dr. Richard Bush Year: 2017-2018 The College of Information Technology (CoIT) embraces a philosophy of continuous quality improvement and requires all program officials and faculty to leverage the variety of assessment tools to ensure the stated mission and goals are achieved. Utilizing both internal and external assessments, the CoIT monitors, evaluates, and takes corrective action to ensure program quality, appropriate allocation of resources, development of professional development opportunities, and updates processes as part of a dynamic continuous quality improvement plan. The CoIT assessment process is designed to evaluate data from three broad areas of 1) direct measures of student learning outcomes, 2) indirect measures, and 3) key performance indicators. It is important to note that this is:
● the first year of collecting data for our semester versions of our courses and programs,
● the first year where there were more than 1 or 2 total DMA’s for the entire portfolio of
programs were collected,
● the resumption of data collection since 2012/2013, and
● the first year where an analysis and continuous improvement plan will be presented and
executed.
This report represents our NEW baseline for Game Software Development major and first
writing of the continuous quality improvement plan. The plan is heavily influenced by our
work toward ABET accreditation and alignment with ACM curriculum guidelines.
Assessment Process Outline 1. Collect data regarding:
a. Student learning b. Indirect measures c. Key performance indicators
2. Review and analyze data with the following stakeholders: a. Program Officials and Faculty b. Advisory Board
3. Develop a Continuous Improvement Action Plan in collaboration with Program Officials/Faculty
4. Submit assessment report 5. Publish assessment report:
a. Faculty consumption

b. Student consumption c. Staff and other stakeholders
6. Implement Continuous Improvement Action Plan/Process 7. Monitor progress on the Continuous Improvement Action Plan in the coming year for
assessment report 2018/2019 The College of Information Technology is pursuing ABET accreditation and using that framework along with the ACM Curriculum guidelines to proactively address curriculum and assessment of our programs. Results: Direct Measures of Student learning Over the course of AY2017/2018, data was collected through Blackboard on student achievement of outcomes in two milestone courses, CS2150 C++ Programming and CS4990 Senior Design Project in Game Software Development. CS4990 Senior Design Project in Game Software Development did not collect data during this period, only CS2150 C++ Programming was reviewed. It is important to note that CS2150 is shared as the first DMA with Computer Science. CS 2150
Frequency Distribution:
Program Level: Viability of program
Requirement Level: Satisfies assignment requirements
Style: Proper modularization, capitalization, indenting, spelling, etc.
Overall Score
Excellent (3) 47 51 86 82
Good (2) 38 38 11
Incomplete (1) 14 10 2
Average: Excellent (3) 47% 52% 87%
Good (2) 38% 38% 11%
Incomplete (1) 14% 10% 2%
The students demonstrated a good understanding of the body of knowledge for the course and program to this point at 86%. 90% of the students responding understood the assignment requirements, with 98% following proper techniques for their submission. Ideally, an analysis of multiple semesters would provide greater clarity into the gaps suggested
above. No earlier data was or is available, the last collection of information that could be found
was dated AY2012/2013, with pieces in AY2015/2016. There are a number of gaps in past data
and we are unable to make an accurate comparison to AY2017/2018’s data.
Results: Indirect Measures of Student Learning

Many of the indirect measures for Game Software Development are shared with Computer Science. Therefore, they are reported using the same data. Student Evaluations of Faculty
Check to make sure you understood the material. For the academic year 2017/2018 approximately 80% of students (using a scale of 1-5) felt their instructors were actively ensuring they understood the content and were successful. This particular item (Fall 17 to Summer 18) averaged a rating score of 4.026 or 80%. This score suggest that more attention could be given to provide additional individualized attention and communications with students. Would you recommend this instructor to others? On a scale of 0-1, 0 = No and 1 = Yes, instructors on average received a score of .89 or 89 to 90%. The score suggests the instructors are good at delivering the content, approachable, and overall performing well in the instructional environment. However, it does leave some question on how to improve this score through appropriate interventions. For both items above, it would be relevant to review the comments and grades of those providing lower scores to determine if a correlation exists between final grades and overall score for the instructor. Additionally, opportunities for professional development (PD) and collaboration through a community of practice (COP) are being developed to further improve these ratings by leveraging best practices within the Baker teaching community as well as input from external colleagues. Faculty course evaluation Overall courses in Computer Science received a 3.37 out of 4 star rating (84.25% B/B+) with an n=204. The majority of faculty felt the course assignments and activities were appropriately distributed throughout the course, with a few agreeing that the distribution was appropriate but

could be refined/improved. Additionally, faculty felt the courses were appropriately constructed, a few agreed the courses were good but could be improved by adding additional content and assessments. These statements and ratings remained consistent throughout those areas related to the courses, content, assignments, and clarity of instructions. For the majority of courses, faculty felt courses were the right level for the content. There are hints that some of the SLO’s were not addressed in a few of the courses and revisions to both the course in support of the SLO’s as well as the relevance of the current SLO’s need to be examined for update and possible revision. Student preparation was an area where only 67% of faculty felt the students were ready with another 24% feeling they were ready but could have been better prepared. This and related areas indicates the gap that was created when moving from quarters to semesters, transitioning students from the old programs, and not enough time for the new admissions criteria to take hold. CoIT will continue to monitor this and related areas to see if our new admissions practices have an impact on student readiness, if our semester courses are delivering the prerequisite knowledge (scaffolding) necessary for success. First Destination Survey/Graduate Reporting Survey/End of Program Survey Game Software Developmetn issued 13 degrees in AY2017/2018, only one graduates responded to the survey yielding an 7.7% response rate. The single respondent felt the program met their career outcomes, rating the program 7.0 of 10.0 to recommend the program to others. The average salary reported for this group is $8,320.00. Summary of FGEP results for the College of Information Technology - DAA/IES: Game Software Development WRK Supervisor Evaluation 10 Game Software Development students completed an internship during this reporting period. In several of the areas students were rated at 100%. 9 of the students were online with 1 student coming from Clinton Township. However, several areas (interpersonal skills, positive interaction, grooming, timeliness for work, absenteeism, and decision making, ) indicate a need for better preparedness of students before entering a work environment, knowing their obligations to the employer, and the importance of their interaction with fellow employees and clients. Soft-skills develop remains an issue. Results: Key Performance Indicators Provide results here. Include relevant graphs and charts. (KPI data will be provided to each Assessment Community.)
● Number of students ● Retention ● Graduation Rate ● Faculty Credentials

● Employment ● Course/Instructor Retention Data (Carina Resources/Archived Reports/Instructor
or Course Retention Report)
2013-14 2014-15 2016-17 2017-18
Total New
Students
Total Registered
Students
Retention Rate
1st Year
Persistence Rate
Total Graduates
Graduation Rate
Employment Rate
Related
Employment Rate **Note: In 2016 we aligned our employment rate calculations with NACE so employment numbers will
vary from previous years for that year and beyond
2017 Data
Progress Report on Previous Continuous Improvement Action Plan There are no records of continuous improvement action plans or goals, prior to this document. No information was found regarding any past analysis of DMA’s either. Leading up to and during the Fall 2017 semester, without the luxury of the data in this document, It became clear the impact of Q2S on course quality. The CoIT program officials and several faculty met weekly over WebEx to begin addressing the real-time observations and data coming out of Fall 2017 delivery of courses. CoIT started using the ABET framework for each subject area to address the concerns of faculty and students relative to the quality of instruction, content and delivery modality. These activities are continuous as part of our weekly ABET/Curriculum Review meetings.

2018-2019 Continuous Improvement Action Plan Leading up to and during the Fall 2017 semester, without the luxury of the data in this document, It became clear the impact of Q2S on course quality. The CoIT program officials and several faculty met weekly over WebEx to begin addressing the real-time observations and data coming out of Fall 2017 delivery of courses. This activity remained through Spring and Summer 2018. CoIT started using the ABET framework for each subject area to address the concerns of faculty and students relative to the quality of instruction, content and delivery modality.
● Identified Improvement Area:
○ Development and implementation of additional direct measures that support
the program educational outcomes
○ Student soft-skill development
○ Review of curriculum in relationship to the ACM Curriculum Guidelines for
Computer Science curriculum to align all courses with ABET recommendation
and improve overall curriculum quality.
● Evidence:
○ In addition to Student and Faculty Evaluations, Direct Measure Data, And Other
Institutional Data, direct feedback and observations of courses were used to
formulate our improvement plan.
● Improvement Strategy:
○ In AY2018/2019, the College of Information Technology will use the ACM
Curriculum guidelines, student and faculty evaluations, direct measure data, and
other institutional data to continuously improve the quality of our curriculum
regardless of modality of instruction. Leverage feedback from employers and
advisory board members.
○ Courses will be reviewed at the end of each semester with actions taken to
ensure content is up-to-date and of high quality.
● Expected Results:
○ Better alignment with ABET accreditation standards utilizing ACM curriculum
guidelines, along with improved student and faculty evaluations, and
improvements in DMA outcomes.

Annual Assessment Plan Program: Information Systems College Of: Information Technology Name of person submitting: Dr. Richard Bush Year: 2017-2018 The College of Information Technology (CoIT) embraces a philosophy of continuous quality improvement and requires all program officials and faculty to leverage the variety of assessment tools to ensure the stated mission and goals are achieved. Utilizing both internal and external assessments, the CoIT monitors, evaluates, and takes corrective action to ensure program quality, appropriate allocation of resources, development of professional development opportunities, and updates processes as part of a dynamic continuous quality improvement plan. The CoIT assessment process is designed to evaluate data from three broad areas of 1) direct measures of student learning outcomes, 2) indirect measures, and 3) key performance indicators. It is important to note that this is:
● the first year of collecting data for our semester versions of our courses and programs,
● the first year where there were more than 1 or 2 total DMA’s for the entire portfolio of
programs were collected,
● the resumption of data collection since 2012/2013, and
● the first year where an analysis and continuous improvement plan will be presented and
executed.
This report represents our NEW baseline for Information Systems major and first writing of the
continuous quality improvement plan. The plan is heavily influenced by our work toward ABET
accreditation and alignment with ACM curriculum guidelines.
Assessment Process Outline 1. Collect data regarding:
a. Student learning b. Indirect measures c. Key performance indicators
2. Review and analyze data with the following stakeholders: a. Program Officials and Faculty b. Advisory Board
3. Develop a Continuous Improvement Action Plan in collaboration with Program Officials/Faculty
4. Submit assessment report 5. Publish assessment report:
a. Faculty consumption 1

b. Student consumption c. Staff and other stakeholders
6. Implement Continuous Improvement Action Plan/Process 7. Monitor progress on the Continuous Improvement Action Plan in the coming year for
assessment report 2018/2019 The College of Information Technology is pursuing ABET accreditation and using that framework along with the ACM Curriculum guidelines to proactively address curriculum and assessment of our programs. Results: Direct Measures of Student learning Over the course of AY2017/2018, data was collected through Blackboard on student achievement of outcomes in two milestone courses, only CIS4990 Senior Project in Information Systems was offered and run during the evaluation period. CIS4990 Senior Project in Information Systems
Overall students demonstrated competence or proficiency in all areas. There were four areas
with students rated as novice (Critical Thinking, Powerpoint Presentation (x2) and Development Planning). The goal for the program is 100% of students in the competent and proficient rating. Results: Indirect Measures of Student Learning Check to make sure you understood the material. For the academic year 2017/2018 approximately 82% of students (using a scale of 1-5) felt their instructors were actively ensuring they understood the content and were successful. This particular item (Fall 17 to Summer 18) averaged a rating score of 4.09 or 82%. This score suggest that more attention could be given to provide additional individualized attention and communications with students.
2

Would you recommend this instructor to others? On a scale of 0-1, 0 = No and 1 = Yes, instructors on average received a score of .91 or 91%. The score suggests the instructors are good at delivering the content, approachable, and overall performing well in the instructional environment. However, it does leave some question on how to improve this score through appropriate interventions. For both items above, it would be relevant to review the comments and grades of those providing lower scores to determine if a correlation exists between final grades and overall score for the instructor. Additionally, opportunities for professional development (PD) and collaboration through a community of practice (COP) are being developed to further improve these ratings by leveraging best practices within the Baker teaching community as well as input from external colleagues. Faculty course evaluation Overall courses in Information Systems received a 3.22 out of 4 star rating (80.5% B) with an n=68. The majority of faculty felt the course assignments and activities were appropriately distributed throughout the course, with a few agreeing that the distribution was appropriate but could be refined/improved. Additionally, faculty felt the courses were appropriately constructed, a few agreed the courses were good but could be improved by adding additional content and assessments. These statements and ratings remained consistent throughout those areas related to the courses, content, assignments, and clarity of instructions. For the majority of courses, faculty felt courses were the right level for the content. There are hints that some of the SLO’s were not addressed in a few of the courses and revisions to both the course in support of the SLO’s as well as the relevance of the current SLO’s need to be examined for update and possible revision. Student preparation was an area where only 70% of faculty felt the students were ready with another 24% feeling they were ready but could have been better prepared. This and related areas indicates the gap that was created when moving from quarters to semesters, transitioning students from the old programs, and not enough time for the new admissions criteria to take hold. CoIT will continue to monitor this and related areas to see if our new admissions practices have an impact on student readiness, if our semester courses are delivering the prerequisite knowledge (scaffolding) necessary for success. First Destination Survey/Graduate Reporting Survey/End of Program Survey Information Systems issued 23 degrees in AY2017/2018, 3 graduates responded to the survey yielding an 13.0% response rate. 66.7% of the respondents (n=3) felt the program met and helped their career outcomes. The average salary reported for this group is $57,500.00. With the average recommendation score of 7 out of 10.
3

Summary of FGEP results for the College of Information Technology - DAA/IES: Information Systems
WRK Supervisor Evaluation 5 Information Systems students completed an internship during this reporting period. 60-80% (and more) of students were rated very well in most areas. However, eleven of the areas (including positive interaction, grooming, timeliness for work, and absenteeism) indicate a need for better preparedness of students before entering a work environment, knowing their obligations to the employer, and the importance of their interaction with fellow employees and clients. Soft-skills develop remains an issue. Results: Key Performance Indicators Provide results here. Include relevant graphs and charts. (KPI data will be provided to each Assessment Community.)
● Number of students ● Retention ● Graduation Rate ● Faculty Credentials ● Employment ● Course/Instructor Retention Data (Carina Resources/Archived Reports/Instructor
or Course Retention Report)
2013-14 2014-15 2016-17 2017-18
Total New
Students 11
Total Registered
Students 4

Retention Rate
1st Year
Persistence Rate
Total Graduates 23
Graduation Rate
Employment Rate
Related
Employment Rate **Note: In 2016 we aligned our employment rate calculations with NACE so employment numbers will
vary from previous years for that year and beyond
2017 Data
Major M Degree
New Students
Return/Reentry Students Total Students
Information Systems ISB BIS 0 5 5 Information Systems ISB BS 0 15 15 Information Systems ISBM MBA 2 9 11 Information Systems ISM MBA 0 2 2 Information Systems ISM MSI 0 2 2 Information Systems ISM1 MSI 0 5 5 Information Systems ISO BIS 0 5 5 Information Systems ISSM MS 2 2 4 Information Systems ISSM MSI 0 2 2 Information Systems ISYB BS 11 51 62 Project Management and Planning PMB BS 0 5 5 Project Management and Planning PMOB BIS 0 3 3 Project Management and Planning PMOB BS 0 1 1 Web Development WDA AAS 0 5 5 Web Development WDAO AAS 0 2 2 Web Development WDB BS 0 9 9 Web Development WDBO BWD 0 10 10 Web Development WDCO CER 0 1 1 Web Development WEBB AAS 0 1 1 Web Development WEBB BS 0 16 16
Note: Will populate previous years’ data if needed. Progress Report on Previous Continuous Improvement Action Plan There are no records of continuous improvement action plans or goals, prior to this document. No information was found regarding any past analysis of DMA’s either. Leading up to and during the Fall 2017 semester, without the luxury of the data in this document, It became clear the impact of Q2S on course quality. The CoIT program officials and several faculty met weekly over WebEx to begin addressing the real-time observations and data coming out of Fall 2017 delivery of courses. CoIT started using the ABET framework for each subject area to address the concerns of faculty and students relative to the quality of
5

instruction, content and delivery modality. These activities are continuous as part of our weekly ABET/Curriculum Review meetings. 2018-2019 Continuous Improvement Action Plan Leading up to and during the Fall 2017 semester, without the luxury of the data in this document, It became clear the impact of Q2S on course quality. The CoIT program officials and several faculty met weekly over WebEx to begin addressing the real-time observations and data coming out of Fall 2017 delivery of courses. This activity remained through Spring and Summer 2018. CoIT started using the ABET framework for each subject area to address the concerns of faculty and students relative to the quality of instruction, content and delivery modality.
● Identified Improvement Area:
○ Development and implementation of additional direct measures that support
the program educational outcomes
○ Student soft-skill development
○ Review of curriculum in relationship to the ACM Curriculum Guidelines to align
all courses with ABET recommendation and improve overall curriculum quality.
● Evidence:
○ In addition to Student and Faculty Evaluations, Direct Measure Data, And Other
Institutional Data, direct feedback and observations of courses were used to
formulate our improvement plan.
● Improvement Strategy:
○ In AY2018/2019, the College of Information Technology will use the ACM
Curriculum guidelines, student and faculty evaluations, direct measure data, and
other institutional data to continuously improve the quality of our curriculum
regardless of modality of instruction. Leverage feedback from employers and
advisory board members.
○ Courses will be reviewed at the end of each semester with actions taken to
ensure content is up-to-date and of high quality.
● Expected Results:
○ Better alignment with ABET accreditation standards utilizing ACM curriculum
guidelines, along with improved student and faculty evaluations, and
improvements in DMA outcomes.
6

1
Annual Assessment Plan
Assessment Process Overview Baker College embraces a philosophy of continuous quality improvement and requires program administrators to use a variety of robust assessments to ensure that the stated mission and goals are achieved. Both internal and external assessments are utilized to monitor and evaluate the program, allocate resources, create professional development, and update processes as part of the continuous quality improvement cycle. Specifically, the program assessment process is designed to evaluate data from three areas: 1) direct measures of student learning outcomes, 2) indirect measures and 3) key performance indicators. Faculty members, in collaboration with instructional designers, are responsible for developing standardized assessment materials to be used within courses. Authentic assessment materials are designed to evaluate student capabilities as they relate to program and institutional outcomes. These standardized assessment instruments become a part of the course, and all faculty members teaching the course are required to administer the instruments. It should be noted that all standardized assessment instruments are developed with the intent to embed the assessment process within the course. In this manner, students are not asked to complete additional assignments or assessments beyond those that are a part of the normal educational process. This embedding of assessment measures is important to Baker College, who believe that assessment should be an integral piece of the educational process, not an addition to it. The assessment materials are designed to support faculty members in their classroom assessment and evaluation, present students with clear expectations and performance parameters, and provide students detailed feedback on performance as it relates to learning outcomes. In addition to the direct measures, data are collected through the use of indirect measures, including surveys of program graduates, employer surveys, and/or accrediting agency reports. These data are combined with direct measures to complete the assessment data set
Key Performance Indicators (KPI) have been developed to complete the assessment plan. These KPI are intended to measure programs in relation to priorities that have been set by the Institution based on our mission and values. Baker College has identified the following as key performance indicators for evaluating the success of graduate programs:
● Enrollments ● Retention ● Graduation rates ● Employment rates of graduates ● Faculty credentials ● Course and Instructor retention information

2
These KPIs provide data for analysis and evaluation on metrics beyond teaching and learning. These metrics provide the primary operational data necessary for evaluating the stability of the program as well as for planning, budgeting, high level assessment of operations, and how the program contributes to the mission and guiding principles of the institution. Additionally, these metrics are compared across graduate programs developing benchmarks, internal targets, and minimum performance standards. Annually, the program has the responsibility of compiling the data, discussing and analyzing the data with the assessment communities, and collaboratively developing a continuous improvement plan. The continuous improvement plan is designed to identify the steps necessary for improving student learning in the designated areas. To address specific findings, the plan may include identifying actions such as redevelopment of a course, seeking additional data to clarify student achievement, or requesting alteration of specific assignments or teaching strategies to improve attainment of learning outcomes. Based on the findings, the plan may also include operational alterations to such areas as student services or faculty development. In addition to a review of data collected, the program will undertake an annual review of the program assessment plan to determine the effectiveness of the plan, and the quality and usefulness of the data collected. As a portion of this annual review, it is anticipated that the assessment plan for each program will remain a dynamic document, continuing to evolve as the faculty become more experienced in the process of program assessment.

3
Annual Assessment Plan
Instructions: Please be sure to name your files (template and supporting documents) correctly so we can tell who the report and documents belong to. You will want to include the program name and the academic year that you are submitting for. Program: Nursing, Pre-licensure BSN College Of: Nursing Name of person submitting: Lesley Morgan Year: 2017/2018 Assessment Process:
1. Collect data regarding: a. Student learning (direct measures/course embedded assessments) b. Indirect measures c. Key performance indicators
2. Review and analyze data with the following stakeholders: a. Assessment Community members b. Baker College Assessment Committee
3. Develop a Continuous Improvement Action Plan in collaboration with faculty 4. Submit assessment report to required location 5. Implement Continuous Improvement Action Plan 6. Review progress on the Continuous Improvement Action Plan of the prior year
assessment report
Results: Direct Measures of Student learning NCLEX TABLE
JUL 2017-JUN 2018 BSN
N=118
JUL-DEC 2017 JAN-JUN 2018 Aggregate JUL 2017-
JUN 2018
Auburn Hills N/A N/A
Cadillac 13/16 (82.5%) 17/17 (100%) 90.9%
Clinton Township 9/9 (100%) 17/22 (77%) 83.8%

4
Flint N/A 2/3 (66.66%) 66.6%
Jackson N/A N/A
Muskegon 10/14 (71.43%) 23/26 (88%) 82.5%
Owosso N/A 11/11 (100%) 100%
School of Nursing
Pre Licensure BSN
86.4%
For nursing the best representation of students achieving program outcome is success with the
National Council Licensure Examination for Registered Nurses (NLCEX-RN). As noted in the table
the aggregate for BSN pre licensure nursing students is 86.4% which is above the Michigan
Board of Nursing (MBON) and Commission on Collegiate Nursing Education (CCNE) benchmark
of 80%. The BSN aggregate was slightly lower than the national average of 92%.
PORTFOLIO
Student Learning Outcomes
N=107
Exceeds
Expectations
Meets
Expectations
Does Not Meet
Expectations
Apply the Nursing Process 94% 6%
Health Promotion & Safety 93% 6% 1%
Manage Information Technology 90% 10%
Evidence Based Research 95% 5%
Leadership Theories 80% 18% 2%
Current Issues in Nursing 90% 8% 2%
Communication 86% 11%

5
Professional Values & Ethics 86% 14%
Personal & Professional
Development
90% 10%
Synthesis of Knowledge 87% 12% 1%
Students in the pre licensure nursing program complete a portfolio where they document,
through course assignments, clinical experiences, etc. how they met the program student
learning outcomes. Data show the majority of students either meet or exceed expectation
indicating they are able to document successful competence in the program SLOs and are ready
for graduation as competent providers of nursing care.
Results: Indirect Measures of Student Learning Division Aggregate Student Evaluation of Faculty/Course
Ranking 1-5 Fall 2017 Spring 2018 Summer 2018
Scale 1-5 N=818 N=927 N=18
Make sure you
understood
material
4.337
4.241
3.826
Return work &
post grades
promptly
4.217
4.209
3.135
Provide useful
feedback
4.329
4.274
3.724

6
Require use of
technology to
enhance learning
4.394
4.298
3.829
Relate course
content to
practice
4.537
4.361
3.826
Improve & use
writing skills
4.396 4.314 3.626
Emphasis
importance of
lifelong learning
4.511
4.382
3.824
Challenge you to
meet high
standards
4.525
4.405
3.624
Students in the nursing program consistently rate nursing courses in the high range. These numbers represent all nursing courses for all programs, not just the pre licensure BSN. As the pre licensure BSN track does not offer courses in the summer, the summer results represent the post licensure BSN, MSN or ADN program. FGEP table FGEP Data for SON Didactic courses 17-18 (n=17)
FGEP category Exceeds Meets Does not meet
Planning &
Preparation
4 4 9
Professional
Expertise
5 12 0
Learning
Environment
2 13 2

7
Learning Facilitation 3 11 3
Data listed for didactic courses primarily represents full-time faculty. Of concern is the result that 9 member of the full-time faculty are not considered prepared for class. This is very surprising and will require a more detailed evaluation at the campus level by the program director. While noted less frequently additional follow-up on faculty who did not meet the standard for learning environment and learning facilitation also need further follow-up. FGEP Data for SON Lab courses 17-18 (n=2)
FGEP category Exceeds Meets Does not meet
Planning &
Preparation
0 2 0
Professional
Expertise
0 2 0
Learning
Environment
0 2 0
Learning Facilitation 1 1 0
Faculty assigned to lab is a combination of full-time and part-time faculty. As only two faculty were evaluated and not issues identified FGEP Data for SON Clinical courses 17-18 (n=10)
FGEP category Exceeds Meets Does not meet
Planning &
Preparation
3 7 0
Professional
Expertise
1 9 0
Learning
Environment
0 10 0

8
Learning Facilitation 3 7 0
Clinical assignments are primarily assigned to part-time faculty and FGEP evaluations are completed by the clinical coordinator or program director. As seen in the table clinical faculty are meeting expectations Faculty Evaluation Responses Faculty Evaluation Response Data for SON Didactic courses 17-18 (n=17)
N=57 4 3 2 1
If you had to give this course an
overall grade what grade would
it be?
82.46%
N=47
15.79%
N=9
1.75%
N=1
N=0
N=57
Agree Somewhat Agree Disagree
Course assignments & activities
are appropriately distributed
95% 5%
Course content & assessment are
scaffolded…
86% 4%
Students seem to have
prerequisite knowledge & skills
to succeed in this course
91% 9%
Overall instruction for
assessments are clear & detailed
95% 5%

9
Overall the course content &
activities are congruent with the
SLOs
98% 2%
Overall course content &
activities promote high
expectations for student learning
98% 2%
Overall course content &
activities promote student-to-
student collaboration
95% 4% 1%
Overall the course content &
activates are grounded in learner
centered instruction
96% 4%
Overall the course supports
students’ diverse ways of
learning through varied activities
95% 5%
Overall the SLOs are inclusive of
the primary concepts and
relevant concepts & relevant
content/skills
98% 2%
Textbooks provide recent,
relevant support for course
outcomes
86% 9% 5%
Supplemental resources provide
recent relevant support to the
course
89% 4% 7%
Overall assessments are effective
measures for SLOs
98% 2%
Assessments promote high
expectations for student learning
100%

10
There is evidence or formative
assessment in the course that
allows practice & feedback…
98% 2%
To what extent to the rubrics in
the course provide clear &
detailed criteria to assess student
learning
84% 14% 2%
To what extent do the rubrics in
the course allow you to provide
prompt feedback to students
95% 4% 2%
To what extent does the course
support our larger institutional
SLO
98% 2%
This table represents faculty evaluation of the course taught. These data are aggregate for all nursing courses, all programs. There is some concern regarding textbooks and supplemental material. Over the past year there has been some difficulty with the transition to Barnes and Nobles as the College bookstore. For nursing this includes some confusion regarding the bundles for specific courses and the additional learning resources that are a component of the course. Additionally, there was some concern regarding rubrics but represents 1-2 faculty so not a major issue. Results: Key Performance Indicators Provide results here. Include relevant graphs and charts. (KPI data will be provided to each Assessment Community.)
● Number of students ● Retention ● Graduation Rate ● Faculty Credentials ● Employment ● Course/Instructor Retention Data (Carina Resources/Archived Reports/Instructor
or Course Retention Report)
2013-14 2014-15 2016-17 2017-18
Total New
Students
Total Registered
Students

11
Retention Rate
1st Year
Persistence Rate
Total Graduates
Graduation Rate
Employment Rate
Related
Employment Rate
**Note: In 2016 we aligned our employment rate calculations with NACE so employment numbers will
vary from previous years for that year and beyond
Progress Report on Previous Continuous Improvement Action Plan
1. Canvas Training for all Faculty - In progress, will be completed prior to the 2018-2019 academic year
2. Assess SON Admission Requirements - in progress. Kaplan score of 66% no longer required for admission to the nursing program. Students scoring below 66% are not evaluated using the Meijer Decision Tree. This change was approved by Faculty in April 2018
3. Improve student completion of end of program survey - Done, the BSN pre licensure nursing program has much improved compliance
4. Simulation training workshops - On going. Faculty continue to receive training on high quality simulation.
2018-2019 Continuous Improvement Action Plan
● Identified Improvement Area:
1. Continue to evaluate admission requirements for the nursing
2. Align nursing pre admission requirements with those of other health programs
3. Develop early admission criteria for the nursing program, designed for High School
Graduates.
4. Develop curriculum for an Accelerated Nursing BSN track.
5. Continue with simulation training, especially to new faculty
6. Encourage national specialty simulation for faculty and program directors
7. Strive for NLCEX-RN first attempt pass rate of 90% or higher
8. Improve limited enrollment application & admission process
● Evidence:
1. Change in admission requirement will not increase attrition rate or decrease NCLEX-RN
first attempt pass rate

12
2. Pre Admission requirements for nursing will be consistent with health program
3. Approved criteria for High School seniors to be directly admitted to the nursing program
4. Accelerated BSN track curriculum developed and approved by faculty
5. Achieve 80%-90% of all full-time faculty who have been employed for over 1 year will
have participated in a simulation workshop
6. Full time faculty achieve 40%-50% attainment of national specialty certification over this
coming academic year.
7. NLCEX-RN first time pass rate of 90% or higher
8. Student applications are submitted one semester before requested admission semester,
letters are sent, students accept and all clinical requirements are completed.
● Improvement Strategy:
1. Each campus will implement a mentoring program for students admitted
conditionally to the nursing program. This mentoring program will be accessible to all
students but required for identified conditionally accepted students
2. Simulation nurse will conduct at least two workshops, one each semester, over the
next academic year
● Expected Results:
1. NLCEX - RN aggregate first time pass rate of 90% or higher
Improvement Goal #1:
Application process for pre licensure BSN students
Improvement Goal #2:
NCLEX-RN pass rate of over 90%

Annual Assessment Plan
Assessment Process Overview Baker College embraces a philosophy of continuous quality improvement and requires program administrators to use a variety of robust assessments to ensure that the stated mission and goals are achieved. Both internal and external assessments are utilized to monitor and evaluate the program, allocate resources, create professional development, and update processes as part of the continuous quality improvement cycle. Specifically, the program assessment process is designed to evaluate data from three areas: 1) direct measures of student learning outcomes, 2) indirect measures and 3) key performance indicators. Faculty members, in collaboration with instructional designers, are responsible for developing standardized assessment materials to be used within courses. Authentic assessment materials are designed to evaluate student capabilities as they relate to program and institutional outcomes. These standardized assessment instruments become a part of the course, and all faculty members teaching the course are required to administer the instruments. It should be noted that all standardized assessment instruments are developed with the intent to embed the assessment process within the course. In this manner, students are not asked to complete additional assignments or assessments beyond those that are a part of the normal educational process. This embedding of assessment measures is important to Baker College, who believe that assessment should be an integral piece of the educational process, not an addition to it. The assessment materials are designed to support faculty members in their classroom assessment and evaluation, present students with clear expectations and performance parameters, and provide students detailed feedback on performance as it relates to learning outcomes. In addition to the direct measures, data are collected through the use of indirect measures, including surveys of program graduates, employer surveys, and/or accrediting agency reports. These data are combined with direct measures to complete the assessment data set Key Performance Indicators (KPI) have been developed to complete the assessment plan. These KPI are intended to measure programs in relation to priorities that have been set by the Institution based on our mission and values. Baker College has identified the following as key performance indicators for evaluating the success of graduate programs:
● Enrollments ● Retention ● Graduation rates ● Employment rates of graduates ● Faculty credentials ● Course and Instructor retention information
1

These KPIs provide data for analysis and evaluation on metrics beyond teaching and learning. These metrics provide the primary operational data necessary for evaluating the stability of the program as well as for planning, budgeting, high level assessment of operations, and how the program contributes to the mission and guiding principles of the institution. Additionally, these metrics are compared across graduate programs developing benchmarks, internal targets, and minimum performance standards. Annually, the program has the responsibility of compiling the data, discussing and analyzing the data with the assessment communities, and collaboratively developing a continuous improvement plan. The continuous improvement plan is designed to identify the steps necessary for improving student learning in the designated areas. To address specific findings, the plan may include identifying actions such as redevelopment of a course, seeking additional data to clarify student achievement, or requesting alteration of specific assignments or teaching strategies to improve attainment of learning outcomes. Based on the findings, the plan may also include operational alterations to such areas as student services or faculty development. In addition to a review of data collected, the program will undertake an annual review of the program assessment plan to determine the effectiveness of the plan, and the quality and usefulness of the data collected. As a portion of this annual review, it is anticipated that the assessment plan for each program will remain a dynamic document, continuing to evolve as the faculty become more experienced in the process of program assessment.
2

Annual Assessment Plan
Instructions: Please be sure to name your files (template and supporting documents) correctly so we can tell who the report and documents belong to. You will want to include the program name and the academic year that you are submitting for. Program: Occupational Therapy Assistant College Of: School of Occupational Therapy Name of person submitting: Kathryn Potter and Evelyn Greaux Year: 2018/19 Assessment Process:
1. Collect data regarding: a. Student learning (direct measures/course embedded assessments)
i. OTA 2710 Level I Fieldwork A (Fall of Year 2) ii. OTA 2720 Level I Fieldwork B (Spring of Year 2)
iii. OTA 3720 Level II Fieldwork B (Fall of Year 3, Capstone Course) b. Indirect measures
i. Student Evaluation of Faculty - (Smart Evals) ii. Faculty Course Evaluations (Qualtrics)
iii. First Destination Survey/Graduate Survey/End of Program Survey (Qualtrics)
iv. FGEP -Faculty Evaluations (Annual or per Union Contract) c. Key performance indicators (See chart)
2. Review and analyze data with the following stakeholders:
a. Assessment Community members b. Baker College Assessment Committee
3. Develop a Continuous Improvement Action Plan in collaboration with faculty 4. Submit assessment report to required location 5. Implement Continuous Improvement Action Plan 6. Review progress on the Continuous Improvement Action Plan of the prior year
assessment report
Results: Direct Measures of Student learning Provide summary of results. Include relevant graphs or charts. Direct measure summary results
should be aligned to each of your program outcomes and/or institutional outcomes. Your
summary should be written reporting the performance of those outcomes rather than
reporting the performance of a rubric. Direct measures include identified DM assessments,
certification pass rates and other assessments from external providers (Peregrine, NOCTI etc.)
3

Direct Measure assignments are currently collected in the OTA curriculum during the Fieldwork courses only. The 2017/18 academic year was the first year for the OTA program to use a clickable rubric to obtain data. There were issues with the rubric setup within the Learning Management System (LMS) resulting in inconsistent data collection. Only Muskegon data for OTA 2710 was collected for the Level I Fieldwork courses and only Muskegon and Owosso data was collected for OTA 3720 for the Level II Fieldwork. No data was collected within OTA 2720. However, the issue limiting data submission has been identified (students must submit something online to open the rubric - even though the clinical evaluations are not provided directly to the students). During the 2018/19 academic year there will be switch to the LMS which may (or may not) eliminate the need for additional means to obtain the Direct Measure rubrics. Each Direct Measure has been reviewed to determine where it best aligned with Program Outcomes. Having 3 Direct Measures and 7 Program Outcomes, the Program Outcomes align as follows:
● OTA 2710 Level I Fieldwork A Program Outcome 2 (PO2) At the end of the program, graduate will demonstrate Basic tenets of Occupational Therapy through the philosophy, OT/OTA roles, and evidence based practice. Program Outcome 6 (PO6) At the end of the program, graduate will demonstrate Professional Behaviors through self-responsibility, response to feedback, work behaviors, time management, interpersonal skills, and cultural competence.
● OTA 2720 Level I Fieldwork B Program Outcome 3 (PO3) At the end of the program, graduate will Assist in the evaluation/screening process by gathering data, administering assessments, assisting with interpretation, reporting results and collaborating with OT to establish goals. Program Outcome 5 (PO5) At the end of the program, graduate will demonstrate Consistent professional level communication including verbal communication, non-verbal communication and written.
● OTA 3720 Level II Fieldwork B Program Outcome 1 (PO1) At the end of the program, graduate will demonstrate Fundamentals of OTA Practice through ethics and safety. Program Outcome 4 (PO4) At the end of the program, graduate will Perform interventions by planning, selecting, implementing, grading according to activity analysis, modifying intervention plans, and therapeutic use of self. No current Direct Measure assignments in place to meet: Program Outcome 7 (PO7) At the end of the program, graduate will demonstrate Readiness for the NBCOT exam. The Direct Measure used in OTA 2710 and OTA 2720 is the final Student Evaluation form completed by the clinical educator and then manually entered into the Baker College LMS.
4

Only the scores at Midterm and again at the Final week are collected. The purpose of collecting this data is to identify students at risk during this first fieldwork placement potentially requiring remediation in the areas related to Program Outcomes 2 & 6 which are the basic tenets of occupational therapy and professional behaviors. The method of comparing scores will demonstrate either an overall understanding of concepts or a need for remediation in these fundamentals. This direct measure is scored as follows: 4 = exceeds expectations, 3 = meets expectations, 2 = approaches expectations, 1= below expectations. Results are summarized for the 2018 cohort as follows:
● 19/19 student evaluation scores obtained. Overall scores at final week ranged from 98-100/100. 1% of scores were “Below expectations” and 2% of scores were “Approaches expectations”; 16% of scores were “Meets expectations” and the remaining 81% of scores were “Exceeds expectations”.
The Direct Measure used in OTA 3720 Level II Fieldwork B is a national evaluation form used by most OT and OTA programs throughout the United States called the Fieldwork Performance Evaluation (FPE) form. This evaluation is scored by the clinical educator, and then manually entered into the Baker College LMS by faculty. Only the scores at Midterm and again at the Final week are collected pertaining to the sections correlated with Program Outcomes # 1 and 4. The purpose of collecting this data is to identify students at risk during this final fieldwork placement, and capstone course, for being unable to demonstrate entry level performance in safety and ethics which would require immediate remediation prior to graduation. The purpose of including the data correlated to intervention planning and implementation is because this is 2/3rd of the COTA Examination by the National Board for Certification in Occupational Therapy and a student in need of remediation in this area may be at risk for failing
5

the national board exam following graduation. The method of comparing Midterm week to Final week will demonstrate either an increase or decrease in these fundamentals. This Direct Measure is scored as follows: 4 = exceeds standards, 3 = meets standards, 2 = needs improvement, 1= unsatisfactory. Results are summarized for the 2018 cohort as follows:
● At Midterm, scores totaled 36 points out of 100 total with a score of 54 being ‘satisfactory’. At Final, scores totaled 42 points out of 100 total with a score of 70 being ‘satisfactory’. The following results are from a total of 19 students.
Results: Indirect Measures of Student Learning Provide results here. Include relevant graphs and charts. Indirect measures of student learning include all of the following:
○ Student Evaluations of Faculty - SmartEvals ■ Review and report the performance of the following questions from the
Student Evaluation of Faculty evaluation results. ● Check to see that you understood the material? ● Would you recommend this instructor to others?
○ Faculty course evaluation - Qualtrics ■ Summarize and report the results
6

○ First Destination Survey/Graduate Reporting Survey/End of Program Survey results - All of these results are together in Qualtrics as this is one survey with multiple sections
■ Summarize and report the results ○ Summary of FGEP results for the College of - DAA/IES ○ WRK Supervisor Evaluation (if not a DM) - Handshake/Career Services
provided ■ Summarize and report the results
○ Advisory Board Minutes - feedback/suggestions ○ Other program based surveys/accreditation survey results
Indirect Measures Summaries for OTA Summary of Student Evaluations of Faculty for OTA Program: Data collected from Winter 2015 to Spring 2018. Three questions were the focus. First question related to the instructor posting grades; second question related to the instructor posting assignment links; and the third question asked if the student would recommend this instructor. In Fall 2017, 131 students responded for a 27% response rate. The first question scored 94.7%. The second question scored 98.5%. The third question scored 92.1% In Spring 2018, 154 students responded for a 34% response rate. The first question scored 96.1%. The second question scored 98%. The third question scored 86.3%
7

Summary of Faculty course evaluations for OTA Program: OTA Student Evaluations of Faculty Report requested. Awaiting report to analyze results. First Destination Survey/ Graduate Reporting Survey/ End of Program Survey for OTA: OTA End of Program Survey results provided the following data: Of the surveys completed: 14% from Allen Park campus; 43% from Muskegon campus; 43% from Owosso campus. Questions asked students to strongly disagree (1) to strongly agree (4) with several statements on how well Baker College prepared them and/or provided opportunities in multiple areas. No questions resulted below a score of “2”. Lowest scoring questions were in the areas of math skills, technical skills, and customer service. Highest scoring questions were in the areas of program preparation for employment, professional behavior, and oral communication. Focusing on the question “Would you recommend his program to a potential student?: 29% reports “no” and 71% reported “yes”
8

Advisory Board Feedback for OTA: Fall of 2017 was the first collaborative and interdisciplinary Advisory Boards for Health Science programs across the Baker System. No Minutes were reviewed for the Annual Report this year but overall positive feedback for new setup. Minutes to be included in the 2018/19 Annual Report. Summary of FGEP results for OTA Program: Total of FGEPs (5 Observations and 3 Evaluations) were completed in 2017/18 across 3 campuses for the OTA programs. The results were as follows: Overall Meets vs Does Not Meet= 7 Meets/ 1 Does Not Meet Planning and Preparation= 5 Meets/ 2 Does Not Meet/ 1 Exceeds Professional Expertise= 6 Meets/ 0 Does Not Meet/ 3 Exceeds Learning Environment= 6 Meets/ 1 Does Not Meet/ 1 Exceeds Learning Facilitation= 7 Meets/ 1 Does Not Meet
9

Results: Key Performance Indicators Provide results here. Include relevant graphs and charts. (KPI data will be provided to each Assessment Community.)
● Number of students ● Retention ● Graduation Rate ● Faculty Credentials ● Employment ● Course/Instructor Retention Data (Carina Resources/Archived Reports/Instructor
or Course Retention Report)
2014-15 2015-16 2016-17 2017-18
Total New
Students
Ap= 20 Mu=14 Ow=16
Total= 50
Ap= 19 Mu=19 Ow=20
Total= 59
Ap= 20 Mu=19 Ow=19
Total= 58
Ap= 13 Mu= 19 Ow=18
Total= 48
Total Registered
Students 100% 100% 100% 100%
10

Retention Rate
Ap=Not Available Mu=13 Ow=15
Total= NA
Ap= 74% Mu= 93% Ow=100% Total= 88%
Ap= 90% Mu=95%
Ow=100% Total= 95%
Not Available
1st Year
Persistence Rate
Ap=Not Available Mu=13 Ow=15
Total= NA
Ap= 74% Mu= 93% Ow=100% Total= 88%
Ap= 90% Mu=95%
Ow=100% Total= 95%
Not Available
Total Graduates
Ap=Not Available Mu=13 Ow=15
Total= NA
Ap= 14 Mu= 18 Ow=20
Total= 52
Ap= 18 Mu=18 Ow=19
Total= 55 Not Available
Graduation Rate
Ap= NA Mu= 96% Ow= 94% Total= NA
Ap= 74% Mu= 93% Ow=100% Total= 88%
Ap= 90% Mu=95%
Ow=100% Total= 95%
Not Available
Employment Rate
Ap= 100% Mu= 100% Ow= 100%
Total=
Ap= 100% Mu= 100% Ow= 74%
Total=
Ap=100% Mu=90% Ow= 70%
Total= Not
Available
Related
Employment Rate
Ap=100% Mu=100% Ow= 100%
Total=
Ap= 100% Mu=100% Ow= 74%
Total=
Ap= 100% Mu=90% Ow= 70%
Total= Not
Available
**Note: In 2016 we aligned our employment rate calculations with NACE so employment numbers will
vary from previous years for that year and beyond
Progress Report on Previous Continuous Improvement Action Plan Review the continuous improvement goals from 2017-2018 that the program has been working toward and share the progress that has been made. (Not all programs will have these goals in place) The OTA program has been working on developing Direct Measures for the past two academic years. The process started in the 2015/16 academic year and was delayed due to the transition from quarters to semesters curriculum development needed throughout 2016/17 and then implemented 2017/18. Three Direct Measures have been identified and placed directly into the LMS shell for Fall of year 2= OTA 2710 Level I Fieldwork A, Spring of Year 2= OTA 2720 Level I Fieldwork B, and Fall of Year 3= OTA 3720 Level II Fieldwork B.
11

The Fieldwork Performance Evaluation (FPE) tool required permission from AOTA to generate a clickable rubric for the purpose of internal data collection which was obtained in 2017. The clickable rubric was developed and implemented in Fall 2017. In Spring of 2018, 2 of the 3 OTA Program Directors met for the Annual Achievement Assessment meeting. The Program Outcomes, Institutional Learning Outcomes, and Student Learning Outcomes were updated and realigned to meet the changes made during the transition to semesters during the 2017/18. At that Spring 2018 meeting, the OTA Program Directors present agreed to the development of more Direct Measures outside of the clinical courses. Progress on these additional Direct Measures has been delayed due to the transition from the current Baker College LMS system, no new curriculum changes were recommended for Fall 2018. This goal has been added to the 2018/19 Plan. 2018-2019 Continuous Improvement Action Plan All of the following items are be required to be included for each improvement goal that is set below:
● Identified Improvement Area:
Provide the specific area targeted for improvement. Examples include (but are not
limited to) program outcomes alignments, institutional outcomes alignments, inter-rater
reliability on specific assessments, low faculty completion of direct measures.
● Evidence:
Provide the existing data that indicates this is an identified area for improvement.
Examples include (but are not limited to) low scores on assessments, unexpected
disparity among faculty grading/rubric scores, poor ratings on indirect measures
(student perception surveys, employer feedback, external standards.)
● Improvement Strategy:
Provide a detailed explanation of the strategy selected to address the identified
improvement area. Possible strategies include (but are not limited to) changes to
academic processes, changes to curriculum, changes to assessment plan.
● Expected Results:
Provide a measurement for expected results. It is recognized that we have little
experience in this area. The goal is to build capacity is setting benchmarks and
measuring results. Initially we will rely on “Best guess” and estimations.
Improvement Goal #1: Consistent Faculty completion of all Direct Measures.
Identified Improvement Area:
12

Due to an issue with the setup of the clickable rubric in the LMS system, not all campuses were
able to meet the data collection deadline in 2017/18.
Evidence:
OTA 2710: Missing AP and OW.
OTA 2720: Missing all campuses - possible error at System level not implementing the clickable
rubric into the shell.
OTA 3720: Missing AP.
Improvement Strategy:
Increased communication between AFWCs across campuses to complete Direct Measure
clickable rubrics.
Review LMS shell setup prior to Direct Measure deadline.
Expected Result:
Data from all 3 campuses to be collected for analysis by Summer 2019.
Improvement Goal #2: Development of Direct Measures to non clinical courses.
Identified Improvement Area:
Currently only the clinical education courses have Direct Measures. Academic courses will
benefit from the development of Direct Measures to allow the entire curriculum to better meet
Program Outcomes.
Evidence:
Six of the seven Program Outcomes have been correlated to three clinical courses in the
curriculum. In the MOT program, each Program Outcome has at least one Direct Measure in
order to analyze curriculum effectiveness in meeting each Program Outcome. This allows the
MOT program to analyze effectiveness of tools as well as the level of skill anticipated during
data collection.
Improvement Strategy:
Develop 4 more Direct Measures to be implemented into non-clinical academic courses.
13
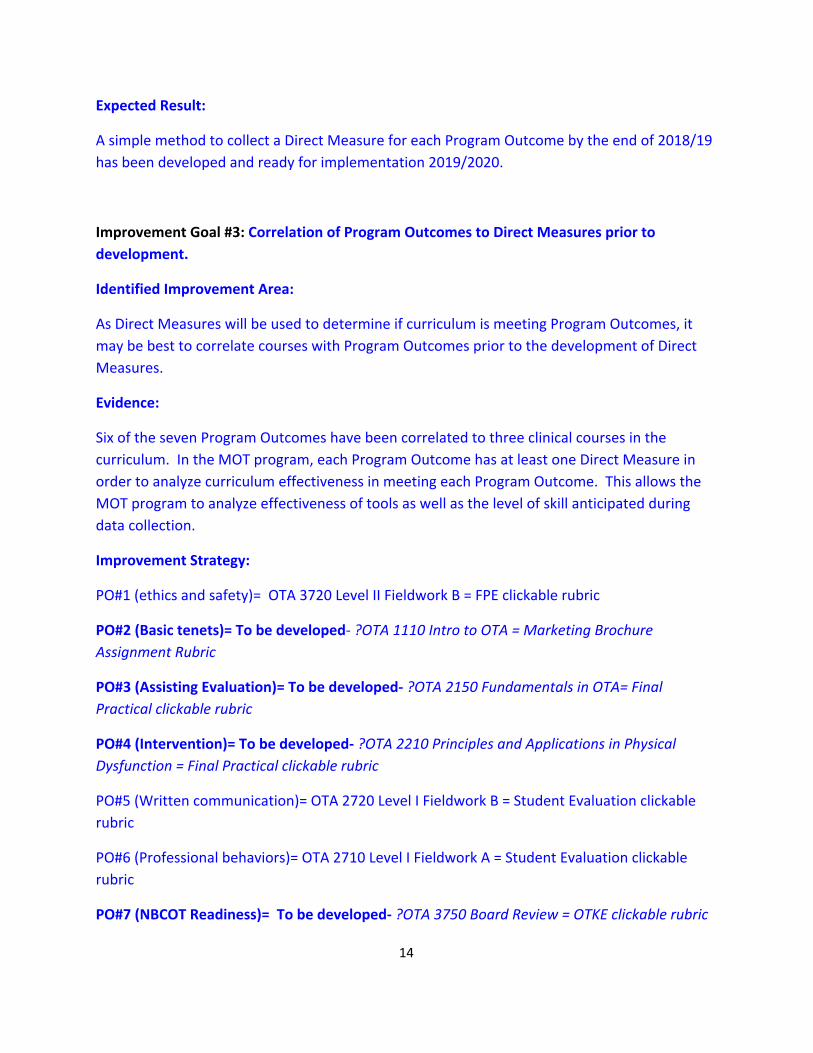
Expected Result:
A simple method to collect a Direct Measure for each Program Outcome by the end of 2018/19
has been developed and ready for implementation 2019/2020.
Improvement Goal #3: Correlation of Program Outcomes to Direct Measures prior to
development.
Identified Improvement Area:
As Direct Measures will be used to determine if curriculum is meeting Program Outcomes, it
may be best to correlate courses with Program Outcomes prior to the development of Direct
Measures.
Evidence:
Six of the seven Program Outcomes have been correlated to three clinical courses in the
curriculum. In the MOT program, each Program Outcome has at least one Direct Measure in
order to analyze curriculum effectiveness in meeting each Program Outcome. This allows the
MOT program to analyze effectiveness of tools as well as the level of skill anticipated during
data collection.
Improvement Strategy:
PO#1 (ethics and safety)= OTA 3720 Level II Fieldwork B = FPE clickable rubric
PO#2 (Basic tenets)= To be developed- ?OTA 1110 Intro to OTA = Marketing Brochure
Assignment Rubric
PO#3 (Assisting Evaluation)= To be developed- ?OTA 2150 Fundamentals in OTA= Final
Practical clickable rubric
PO#4 (Intervention)= To be developed- ?OTA 2210 Principles and Applications in Physical
Dysfunction = Final Practical clickable rubric
PO#5 (Written communication)= OTA 2720 Level I Fieldwork B = Student Evaluation clickable
rubric
PO#6 (Professional behaviors)= OTA 2710 Level I Fieldwork A = Student Evaluation clickable
rubric
PO#7 (NBCOT Readiness)= To be developed- ?OTA 3750 Board Review = OTKE clickable rubric
14

Expected Result:
A simple method to collect a Direct Measure for each Program Outcome by the end of 2018/19
has been developed and ready for implementation 2019/2020.
Improvement Goal #4: Compare OTA 3720 data to prior year’s data in order to maintain
integrity of student cohort data analysis
Identified Improvement Area:
Identifying areas of weakness and strength within the curriculum based upon Direct Measure
results will best be identified within a given cohort to begin the analysis process. Comparing
across cohorts may identify cohort issues and not curriculum issues.
Evidence:
OTA 3720 is the capstone course and second/final clinical placement in the OTA curriculum.
Obtaining this data is critical. Because it is collected in the Fall semester of the final year, for
purposes of analysis it should be compared to the prior year’s data from other courses in order
to maintain the integrity of the cohort. In other words, if the data in 2017/18 is only compared
against the data collected within that year, it is comparing two different student cohorts which
may skew the results.
Improvement Strategy:
In 2018/19, OTA programs will compare the data from 2017/18 specifically for OTA 3720.
Expected Result:
A strong potential for a recommended change or focus for data collection may be
recommended for implementation in 2019/20 based on results of the data analysis in 2018/19.
*Please add additional goals as needed
15

1
Annual Assessment Plan
Assessment Process Overview Baker College embraces a philosophy of continuous quality improvement and requires program administrators to use a variety of robust assessments to ensure that the stated mission and goals are achieved. Both internal and external assessments are utilized to monitor and evaluate the program, allocate resources, create professional development, and update processes as part of the continuous quality improvement cycle. Specifically, the program assessment process is designed to evaluate data from three areas: 1) direct measures of student learning outcomes, 2) indirect measures and 3) key performance indicators. Faculty members, in collaboration with instructional designers, are responsible for developing standardized assessment materials to be used within courses. Authentic assessment materials are designed to evaluate student capabilities as they relate to program and institutional outcomes. These standardized assessment instruments become a part of the course, and all faculty members teaching the course are required to administer the instruments. It should be noted that all standardized assessment instruments are developed with the intent to embed the assessment process within the course. In this manner, students are not asked to complete additional assignments or assessments beyond those that are a part of the normal educational process. This embedding of assessment measures is important to Baker College, who believe that assessment should be an integral piece of the educational process, not an addition to it. The assessment materials are designed to support faculty members in their classroom assessment and evaluation, present students with clear expectations and performance parameters, and provide students detailed feedback on performance as it relates to learning outcomes. In addition to the direct measures, data are collected through the use of indirect measures, including surveys of program graduates, employer surveys, and/or accrediting agency reports. These data are combined with direct measures to complete the assessment data set
Key Performance Indicators (KPI) have been developed to complete the assessment plan. These KPI are intended to measure programs in relation to priorities that have been set by the Institution based on our mission and values. Baker College has identified the following as key performance indicators for evaluating the success of graduate programs:
● Enrollments ● Retention ● Graduation rates ● Employment rates of graduates ● Faculty credentials ● Course and Instructor retention information

2
These KPIs provide data for analysis and evaluation on metrics beyond teaching and learning. These metrics provide the primary operational data necessary for evaluating the stability of the program as well as for planning, budgeting, high level assessment of operations, and how the program contributes to the mission and guiding principles of the institution. Additionally, these metrics are compared across graduate programs developing benchmarks, internal targets, and minimum performance standards. Annually, the program has the responsibility of compiling the data, discussing and analyzing the data with the faculty council, and collaboratively developing a continuous improvement plan. The continuous improvement plan is designed to identify the steps necessary for improving student learning in the designated areas. To address specific findings, the plan may include identifying actions such as redevelopment of a course, seeking additional data to clarify student achievement, or requesting alteration of specific assignments or teaching strategies to improve attainment of learning outcomes. Based on the findings, the plan may also include operational alterations to such areas as student services or faculty development. In addition to a review of data collected, the program will undertake an annual review of the program assessment plan to determine the effectiveness of the plan, and the quality and usefulness of the data collected. As a portion of this annual review, it is anticipated that the assessment plan for each program will remain a dynamic document, continuing to evolve as the faculty become more experienced in the process of program assessment.

3
Annual Assessment Plan
Instructions: Please be sure to name your files (template and supporting documents) correctly so we can tell who the report and documents belong to. You will want to include the program name and the academic year that you are submitting for. Program: Occupational Therapy College Of: School of Occupational Therapy Name of person submitting: Jo Anne Crain and Juliane Chreston Year: 2018-2019 Assessment Process:
1. Collect data regarding: a. Student learning (direct measures/course embedded assessments) ● OCC 2220 -Teaching and Learning Methods Assignment ● OCC 3130 - Group Protocol Assignment ● OCC 3210 - Level I Pediatric Site Evaluation ● OCC 3510 - Community Resource Assignment ● OCC 4030 - Treatment Session Assignment ● OCC 5010 - Competency Pediatric Treatment Assignment ● OCC 5050 - Symptom Assignment ● OCC 5110 - Critique Research Article Assignment ● OCC 5210- Anatomy Behind the Pathology Project ● OCC 5610 - Level I Adult Site Evaluation ● OCC 6310 - Evidence Based Research Assignment ● OCC 6310 - Final Practical Assignment ● OCC 6610 - Level I Psychosocial Site Evaluation ● OCC 6720 - Level II Site Evaluation
b. Indirect measures ● Student Evaluation of Faculty - (Smart Evals) ● Faculty Course Evaluations (Qualtrics) ● First Destination Survey/Graduate Survey/End of Program Survey (Qualtrics) ● FGEP -Faculty Evaluations (Annual or per Union Contract)
c. Key performance indicators (see chart below)
2. Review and analyze data with the following stakeholders:
a. Assessment Community members b. Baker College Assessment Committee
3. Develop a Continuous Improvement Action Plan in collaboration with faculty 4. Submit assessment report to required location

4
5. Implement Continuous Improvement Action Plan 6. Review progress on the Continuous Improvement Action Plan of the prior year
assessment report
Results: Direct Measures of Student learning Each current direct measure assignment was reviewed to determine where it aligned with Program Outcomes. Three levels of student skill were designated: Introductory, Intermediate, and Proficient. A chart was created to demonstrate this alignment and can be viewed at: https://docs.google.com/spreadsheets/d/1oSD0_HCWQH6hynxgVaKkFOlA-ftSoz5PIOM_K07db98/edit?usp=sharing All program outcomes except 1 and 10 are measured in the final clinical course of the program, OCC 6720 Level II Fieldwork. This direct measure is a national evaluation form used by most OT programs throughout the United States. This evaluation is scored by the clinical educator, providing an external measure separate from those previously scored by faculty. This direct measure is scored as 4 = exceeds standards, 3 = meets standards, 2 = needs improvement, 1= unsatisfactory. Results are summarized for the 2018 cohort as follows:

5
N = 39 PO2 = Item 13: Administers assessments PO3 = Item 14: Adjusts/modifies assessment procedures PO4 = Item 19: Utilizes evidence to make informed decisions PO5 = Item 22: Implements client-centered interventions PO6 = Item 31: Produces work in expected time frame PO7 = Item 41: Demonstrates positive interpersonal skills PO 8 = Item 39: Demonstrates consistent work behaviors PO 9 = Combined score for Items 1: Adheres to ethics; 2: Adheres to safety regulations; 3: Uses judgment in safety PO 11 = Item 42: Demonstrates respect for diversity Additional direct measure data was reviewed to determine if students progressed as expected. It is noted that some direct measures for Graduate level courses have no data available, primarily because the course has not yet been taught in the semester format. We prioritized four program outcomes to provide in-depth results. PO 2: Utilize critical thinking skills to administer assessments in a uniform manner to ensure findings are valid and reliable (establish needs and priorities for intervention).
● This program outcome is not assessed at the introductory skill level ● This program outcome is assessed at the intermediate skill level in OCC 4030, Treatment
Plan Part II. The spring 2018 cohort of 40 students met this direct measure by an average score of 4.16 out of 5 total points in their ability to accurately administer the Functional Independence Measure (FIM) utilizing case study data.
● This program outcome is assessed at the proficient skill level in OCC 6310, Final Practical Examination. This direct measure is scored as 4 = exceeds standards, 3 = meets standards, 2 = needs improvement, 1= unsatisfactory. Within the fall 2017 cohort, 37 students scored at level 3, three students scored at level 2 in their ability to administer and adjust/modify the assessment as needed.
● This program outcome is also assessed at the proficient skill level in OCC 5210 and 6610; however, these courses have not yet been taught in the semester format and therefore, no data is available for 2017/2018.
PO 4: Establish accurate and appropriate treatment plans based on the evaluation results, through integrating multiple factors such as client's priorities, context(s), theories, and evidence-based practice.
● This program outcome is not assessed at the introductory skill level ● This program outcome is assessed at the intermediate skill level in OCC 4030, Treatment
Plan Part II. The spring 2018 cohort of 40 students met this direct measure by an by an average score of 8.17 out of 10 total points in their ability to accurately identify

6
appropriate intervention goals based on information provided in the case study, which is necessary for treatment planning.
● This program outcome is assessed at the proficient skill level in OCC 5010, Competency in Pediatric Treatment. Fall 2017 data was not recorded as a direct measure.
● This program outcome is also assessed at the intermediate skill level in OCC 5110 and at the proficient skill level in OCC 5050; however, these courses have not yet been taught in the semester format and therefore, no data is available for 2017/2018.
PO 5: Implement intervention plans that are client-centered.
● This program outcome is assessed at the introductory skill level in OCC 2220, Teaching & Learning Lab. The fall 2017 cohort of 32 students received 100% on this assignment. It is noted that both sections were taught by a new faculty member and it is believed that there was some misinterpretation of the rubric. A more experienced faculty member may not have scored all students at this level.
● This program outcome is assessed at the intermediate skill level in OCC 4030, Treatment Plan Part II. Client-centeredness is interpreted in this assignment as the ability to choose an appropriate medium for the treatment session. The spring 2018 cohort of 40 students met this direct measure by an by an average score of 7.5 out of 10 total points in their ability to select an appropriate medium.
● This program outcome is also assessed at the intermediate skill level in OCC 3130, Group Treatment Protocol Assignment. However, data from Fall 2017 was not utilized because it is known that there were multiple issues with the rubric.
● This program outcome is assessed at the proficient skill level in OCC 6310, Final Practical Examination. This direct measure is scored as 4 = exceeds standards, 3 = meets standards, 2 = needs improvement, 1= unsatisfactory. Within the fall 2017 cohort, five students scored at level 4, 33 students scored at level 3 and two students scored at level 2 in their ability to implement client-centered and occupation-based interventions.
● This program outcome is also assessed at the proficient skill level in OCC 5010, Competency in Pediatric Treatment. Fall 2017 data was not recorded as a direct measure.
● This program outcome is also assessed at the proficient skill level in OCC 5050; however, this course has not yet been taught in the semester format and therefore, no data is available for 2017/2018.
PO 8: Demonstrate consistent work behaviors including initiative, preparedness, dependability, and work site maintenance.
● This program outcome is assessed at the introductory skill level in OCC 3210, Level I Fieldwork Evaluation. Four areas of the evaluation were analyzed for the spring 2018 cohort of 32 students: 31 scored “yes” on dependability (1 “needs improvement”); 32

7
scored “yes” on engagement; 32 scored “yes” on safety habits & work area neatness; 30 scored “yes” on professionalism (2 “needs improvement”). This program outcome is assessed at the proficient skill level in OCC 6310, Final Practical Examination. This direct measure is scored as 4 = exceeds standards, 3 = meets standards, 2 = needs improvement, 1= unsatisfactory. Within the fall 2017 cohort, 36 students scored at level 3, four students scored at level 2 in their ability to take responsibility to take responsibility for professional competence.
● This program outcome is also assessed at the intermediate skill level in OCC 5610 and at the proficient skill level in OCC 6610; however, these courses have not yet been taught in the semester format and therefore, no data is available for 2017/2018.
Results: Indirect Measures of Student Learning
Student Evaluations of Faculty: (SmartEvals) Two questions on the faculty evaluation by students analyzed were 1. Check to make sure you
understood the material and 2. Would you recommend this instructor to other?
Results were analyzed for 2017/2018, all OCC courses/instructors. Response rate was low, with 207 out of 703 possible respondents (30%).

8
In response to the question “Would you recommend this instructor to others?” only two of the 207 respondents stated “No.”
Faculty Course Evaluations: The Occupational Therapy program faculty consist of six full-time faculty, one clinical coordinator who all teach courses in the nine semester undergraduate and graduate curriculum. The summary results for course evaluations is divided into two sections: 1). Areas of satisfaction (average scores of 70% and above “agree” with the statement) and 2). Areas of concern (average scores of 69% and below “agree” with the statement) Overall average score for course grade was 3.67 out of 6.
70% and above 69% and below
Appropriate distribution of activities and assignments
Prerequisite knowledge and skills
Scaffolded content and assignments Instructions for assessments
Content and activities are congruent with SLOs
promote student collaboration
High expectations of student learning Relevant text
Content and activities promote instructor and student engagement
Rubrics provide clear and detailed criteria
Content and activities are grounded in student-centered learning
Rubrics allow for prompt feedback
Diverse ways of learning
Assessments promote high expectations, measure student learning, and allow for practice and feedback
Course supports larger ISLOs
First Destination Survey: The Pre-Occupational Therapy program graduates are not qualified for employment. 35 students graduated, 34 responded to the survey with only six employed and one employed in a

9
related field. 27 responded to continuing education to the Master of Science in Occupational Therapy program. The graduate students were not listed under the School of Occupational Therapy page but were listed with graduate programs. There were 33 graduates, 30 responses with 50% employed and 87% of those were employed in a related field. At the reporting period, not all graduates were licenced and eligible for employment but were still seeking employment while waiting to complete the requirements for licensure. Contacts with the program director at a later date indicated that all graduates were employed as occupational therapists at least on a part-time basis.
Summary of FGEP results: Master of Science Occupational Therapy Data Review/Summary - Faculty Evaluations (FGEP)– Jo
Anne Crain
During Fall 2017 a total of six faculty went through the Faculty Growth and Evaluation Process
(FGEP) with an Director of Academic Affairs (4 -undergraduate union faculty) or with the Dean
of the School of Occupational Therapy (2- graduate faculty) The review included faculty self-
assessment along with in-class observation of four primary quality and teaching indicators and
one Operational Responsibility indicator. These included Planning and Preparation,
Professional Expertise, Learning Environment, and Learning Facilitation. A Professional Growth
Plan (PGP) is also created to identify continuous improvement goals to foster faculty growth
and development, as well as help faculty ensure they are meeting the institution's teaching
expectations. A summary of the data is below.
FGEP Category Exceeds Meets Does Not Meet
Planning and Preparation 2 (33.2%) 4 (66.4%)
Professional Expertise 3 (50%) 3 (50%)
Learning Environment 2 (33.2%) 4 (66.4%)
Learning Facilitation 2 (33.2%) 4 (66.4%)
Operational Responsibilities 6 (100%)

10
All faculty members met or exceeded expectations in all areas of the FGEP. The coaching and
mentoring process will continue through the upcoming semesters.
WRK Supervisor Evaluation: For 2017 there were 33 students completing the final clinical experience. 100% of the evaluations were returned and all students met (“Yes” response) all 14 items on each survey.
Faculty Credentials: All faculty teaching occupational therapy courses meet the required credentials. Five faculty have doctoral degrees, two have master degrees, and one adjunct (co-teaches) has a bachelor degree with special qualifications as a Certified Hand Therapist. All faculty teach courses in their area of clinical expertise.
Results: Key Performance Indicators
2014-15 2015-16 2016-17 2017-18
Total New
Students 40 38 34 36
Total Registered
Students 100% 100% 100% 100%
Retention Rate 97% 100% 86%
1st Year
Persistence Rate 97% 100% 100% NA
Total Graduates 40 36 33 NA
Graduation Rate 100% 94% 97% NA
Employment Rate 100% 100 50%** NA
Related
Employment Rate 100% 100% 100% NA
** The survey results do not reflect the time frame that OT students are eligible for licensure
and qualify for employment. 95% of students were employed as occupational therapists within
six months of eligibility. (as reported to the program director by the students)
The data above indicates students entering the Center for Graduate Studies Master of OT
program. program.

11
Progress Report on Previous Continuous Improvement Action Plan The 2016-2017 Plan identified two areas for improvement:
1. Improvement measure for Outcome 1 (Program Outcome 2). The Student will utilize critical thinking skills to administer assessments in a uniform manner to ensure findings are valid and reliable. In 2017 the student scores on this measure for the Occupational Therapy Knowledge Examination (OTKE) indicated a 1 % gain over the 2016 score. The mean score of correct items on this examination for our students was 60 and the national mean score was also 60. The OTKE was not utilized in 2018 due to the transition of quarters to semesters. There will not be a 2019 graduating class, as this cohort of students had their graduation date extended one year with the Q2S transition. We will resume using this measure in 2020.
2. Improvement measure for Outcome V (Program Outcome 1). 80% of all Baker College Master of Occupational Therapy graduates will pass the NBCOT examination within one year of graduation.
● 2016 Pass rate 97% ● 2017 pass rate 94% ● 2018 not available until February 2019 - however six graduates have passed at the
time of this report.
2018-2019 Continuous Improvement Action Plan There are five areas of continuous improvement addressed in this action plan. Improvement Goal Outcome #1:
No usable data from the direct measure from OCC 3130 was available due to issues with
the rubric design. This direct measure will be reviewed and redesigned for future use.
● Identified Improvement Area:
Direct measure from OCC 3130 assignment.
● Evidence: Data was collected on the direct measure rubric for one of three sections.
Instructors reported issues with the rubric including: The points on the rubric do not match

12
up with the points listed on the assignment sheet (165 points on rubric vs. 100 points for actual
assignment), and the levels of achievement were not correct.
● Improvement Strategy:
Changes to assessment plan have been made for 2018/19. The program director and the
instructional designer made necessary corrections. The faculty will continue to evaluate
and submit corrections if necessary to better meet the intended outcome.
● Expected Results:
An appropriate rubric will allow consistent data collection on which to base future
quality improvement decisions.
Improvement Goal Outcome #2:
● Identified Improvement Area:
OCC 5010 data was collected but not input into rubric for analysis.
● Evidence:
No results were found in the assessment folder. Instructor verified that she had graded
on individual sheets and entered total points into Blackboard gradebook. This is because
assignment occurs in live format that does not directly allow data entry.
Improvement Strategy:
Conversion to Canvas should alleviate this issue as it allows rubric grading without
student submission.
Expected Results:
Data will be entered and available for analysis in 2018-2019 report.
Improvement Goal Outcome #3:
● Identified Improvement Area:
Alignment of data collection with program outcomes.
● Evidence:
Mapping reveals that there is extensive data (direct measures) for some program
outcomes and limited data for other outcomes. While we know that teaching strategies
are being utilized to address all outcomes, the direct measures do not always reflect
this. In some cases, the assignment chosen as the direct measure, is not the best choice;
in other cases, the wording on the rubric does not align clearly with the program
outcome.
○ Limited direct measures at earlier points in the OCC program for Program
Outcome 3, 6, & 11.

13
○ Initially, it appeared there were multiple direct measures for Program Outcome
#4 at the graduate level of the program; however, when data was analyzed at a
deeper level, it was difficult to locate items that very clearly measured this
program outcome.
● Improvement Strategy:
Assessment report will be shared with all faculty. A reassessment of the rubrics used as
direct measures will be conducted to determine if modifications are needed or different
assignments should be identified as the direct measure. This will take place at faculty
meetings or on an individual basis. Because this program is a stand alone program,
changes can be made at faculty meetings. Additionally, the faculty will discuss one
common assessment/direct measure that can be used across the program at different
points. For example a common professional behavior assessment or student survey to
assess oral or written communication skills.
● Expected Results:
Based on the improvement strategy identified above, a revised schedule of direct
measures will be discussed and submitted for modification.
Improvement Goals (based on results of Faculty Course Evaluations)
● Identified Improvement Area:
Student retention of prerequisite knowledge and skills
● Evidence:
Faculty course evaluations where average scores on “agree” were below 69%
● Improvement Strategy:
Discussion in faculty meetings to use “best practices” techniques. This was discussed at
the end of semester faculty meeting in spring 2018 and the following suggestions were
discussed: Day one Quiz, student generated tip sheets, watch review video prior to day
one of classes.
Faculty will report out use of strategies and data will be compared in future surveys for
results/effectiveness.
● Expected Results: Expectations that average scores will improve on faculty surveys.
● Identified Improvement Area:
Effective and accurate use of rubrics
● Evidence:
Multiple errors were found in course rubrics as they were uploaded into blackboard.
Faculty were required to use paper rubric until modifications were made. Several rubrics
had incorrect point distribution and narrative descriptions were incorrect.

14
● Improvement Strategy:
Faculty submitted corrections and will review Canvas conversion of rubrics. Will
continue to work with Instructional Design Team as needed.
● Expected Results: All rubrics will be corrected and utilized to collect accurate
assessment data.
*Please add additional goals as needed