context is everything: measuring institutional change in transition economies
TRANSCRIPT
CONTEXT IS EVERYTHING:
MEASURING INSTITUTIONAL CHANGE IN TRANSITION ECONOMIES*
Nauro F. CamposCERGE-EI
P.O. Box 882, Politických veznu 7111 21 Prague 1, Czech Republic.E-mail: [email protected]
This version: October 1999
Comments welcome.
* This paper was prepared while the author was a World Bank'sRobert S. McNamara Fellow. The findings, interpretations, andconclusions expressed here are entirely those of the author andshould not be attributed in any manner to the World Bank, to itsaffiliate organizations, or to members of its Board of Directorsor the countries they represent. The World Bank does not guaranteethe accuracy of the data included in this report and accepts noresponsibility whatsoever for any consequence of their use.Without implicating, the author thanks Jeffrey B. Nugent, VladimirPopov and seminar participants at the McNamara Workshop (inWashington) for valuable comments on earlier drafts. He alsothanks Aurelijus Dabusinskas for the superb research assistance.
The data set constructed for this project is available ashttp://home.cerge.cuni.cz/ncampos/teinst.txt The data descriptionis available as http://home.cerge.cuni.cz/ncampos/read1st.txt

1
ABSTRACT
The objective of this paper is to put forward a set of measures toallow a first mapping of institutional change during thetransition from centrally planned to a market economy. The conceptof governance and its five institutional dimensions guide the datacollection effort. The five institutional dimensions of governanceare the accountability of the executive, the quality of thebureaucracy, the rule of law, the character of the policy-makingprocess, and the strength of civil society. The paper details theconstruction of a panel set of yearly data covering 25 Central andEastern European and former Soviet Union countries from 1989 to1997. To evaluate the goodness of these constructed measures, thepaper assesses their ability to differentiate developmentperformance across transition economies over time. Developmentperformance is proxied by real per capita income (levels andrates), life expectancy and school enrolment. The set ofindicators seems to perform well. The rule of law is found to bethe most important institutional dimension (in terms of itseffects on per capita income and school enrolment). However,regarding life expectancy, the quality of the bureaucracy plays amore important role.
2
1. INTRODUCTION
In recent years, significant progresses have been made in the
economic analysis of institutional change. Chiefly among them is
the recognition that institutions are much more malleable than
initially thought.1 Although the institutional framework in the
developed world indeed does change very slowly over time, the same
holds not with respect to the experiences of developing and
transition countries (Lin and Nugent, 1995). These countries are
still in search of an institutional matrix that effectively solves
problems of “social conflict management” (Rodrik, 1997) or, from a
different perspective, they are still trying to find their ways
toward a “worked-out and generally accepted framework of property
rights” (Solow, 1997). That institutions matter for economic
growth and development is —and always was— hardly controversial,
but recent research is starting to point to answers to which
institutions matter, and why and how this is so.
If institutions encompass the players and the rules of the
game and if they evolve with detectable speed, then what is now
taking place in the former communist economies presents a unique
opportunity: the chance to observe large-scale institutional
change (Dewatripont and Roland, 1997). This opportunity would be
missed without efforts to identify the crucial elements of the
“institutional matrix,” to propose empirical measures that reflect
1 The empirical literature on the economic impact of institutions has draw muchcomfort from the proposition that institutions do not change, or that theychange so slowly that cross-sectional data provides an appropriaterepresentation. Campos and Nugent (1999) critically assess this proposition.Aron (1998) surveys this literature to find only one panel data study. Forempirical studies of the impact of institutions in transition, see Adelman andVujovic (1998), Brunetti, Kisunko and Weder (1997), Dethier, Ghanem and Zoli(1999), and Moers (1999).
3
their evolution over time and across countries, and to evaluate
whether (at least) some of them have detectable effects on various
dimensions of development performance. Today it is possible to
tell which countries have progressed further in the transition
towards a market economy (EBRD, various years), but we are still
unable to identify among the elements inside the “institutional
black box” which ones played prominent roles and why. For many
social sciences, the transition experience is unique and valuable.
For institutional economics, it is vital. Economists that believe
that institutions are central must work hard to put forward a set
of indicators that, as a group, is able to identify differences in
the national processes of institutional change and to distil their
implications in terms of the various development experiences.
The objective of this paper is to assemble a set of
indicators to allow a first mapping of institutional change during
the transition from centrally planned to a market economy.2 The
concept of governance and its five institutional dimensions (World
Bank, 1994) provide the basis for the data collection effort. The
paper details the construction of a panel set of yearly data
covering 25 Central and Eastern European and former Soviet Union
countries from 1989 to 1997.3 To evaluate the goodness of these
constructed measures of the institutional dimensions of
governance, the paper assess their ability to differentiate
2 Notice that the disregard for institutional reform at the outset of thetransition is being reversed: contrast for example Blanchard et al. (1991, pp.xxi-xxii) to Stiglitz (1999). See also Burki and Perry (1998) and North (1997).
3 The study focuses on the following countries: Albania, Armenia, Azerbaijan,Belarus, Bulgaria, Croatia, Czech Republic, Estonia, FYR Macedonia, Georgia,Hungary, Kazakstan, Kyrgyzstan, Latvia, Lithuania, Moldova, Poland, Romania,Russian Federation, Slovak Republic, Slovenia, Tajikistan, Turkmenistan,Ukraine, and Uzbekistan.
4
development performance across transition economies over time.
Development performance is measured by real per capita income
(levels and growth rates), life expectancy at birth and school
enrolment rates. Therefore, this paper offers answers to the
following three questions: (a) To what extent can the relevant
institutional dimensions be measured in terms of the data
available for transition economies? (b) To what extent do the
resulting measurements of these relevant dimensions vary among
these countries and over time? And (c) To what extent do the
differences in these dimensions, across countries and over time,
help explain variations in economic development performance?
It is important to note that these objectives exclude, inter
alia, an analysis of the relationship between institutional
building and liberalization, stabilization and privatization.4 It
will be only after data sets similar to the one constructed for
this paper are judged satisfactory that this will become a natural
(and arguably the most important) extension. Nonetheless, it is
important to note that the argument that the institutional vacuum
that followed the fall of socialism is at the root of the
successes and failures in economic reform has already been made.
For instance, Boone and Horder relate the institutional vacuum to
the inflation problems experienced by the transition countries in
the early 1990s: “[the breakdown of the one-party system] meant
4 This is a trivial issue under the assumption that government policies aredirectly related to institutional success or failure. The new institutionaleconomics has emphasized that the relationship between policies and institutionsis much more intricate than previously thought (Nugent, 1998, and Campos, Khanand Tessendorf, 1999). See Åslund (1999) for an analysis of the transitionfailure in Russia in terms of the relationship between policies and institutions(rapid elimination of government-induced distortions followed by complete andopen inattention to institutional reform).
5
that many of the checks and balances on political decision were
lost… In the vacuum that followed the political breakdown, the old
elites and rent seekers captured the political initiative in these
countries. To sustain their powers, and sequester incomes, they
issued credits and maintained distortionary policies and, as a
result, acquired enormous assets” (1998, p.43).
The major conclusion is that the panel data set constructed
for this paper seems to allow a good mapping of the process of
institution building and is quite able to highlight important
differences over time and between Central and Eastern European and
former Soviet Union countries. The rule of law is found to be the
most important institutional dimension of governance (in terms of
its effects on per capita income and school enrolment), both for
the sample as a whole and for differentiating Central and Eastern
European from former Soviet Union countries. However, vis-à-vis
life expectancy, the quality of the bureaucracy plays a more
important role than other institutional dimensions.
The organization of the paper is as follows: Section 2
distils the hypothesized links among the institutional dimensions
of governance and between them and the various indicators of
development performance. Section 3 identifies the data sources for
constructing measures of the different governance characteristics
and summarizes these differences across countries and over time.
Section 4 investigates whether differences in the constructed
indicators of the institutional dimensions of governance are
significant with respect to various aspects of development
performance. Section 5 concludes.
6
2. DEFINING THE INSTITUTIONAL DIMENSIONS OF GOVERNANCE
“Governance” is the central concept for this study.5 Although
there are many definitions available, the World Bank (1994, 1996,
1997) seems to have gone further in operationalizing it.6
Governance is thought of as having five critical institutional
dimensions: (1) the executive, (2) the bureaucracy, (3) the rule
of law, (4) the character of the policy-making process, and (5)
civil society. Corresponding to each one of these institutional
dimensions is a characteristic associated with “good governance.”
The executive branch of government (1a) should be accountable for
its actions. The quality of the bureaucracy (2a) should be high
(“imbued with a professional ethos”) such that it is efficient and
capable of adjusting to changing social needs. The legal framework
should be appropriate to the circumstances and command broad
consensus (3a). The policy-making process should be open and
transparent so that all affected groups may have inputs into the
decisions to be made (4a). And civil society should be strong so
as to enable it to participate in public affairs (5a). The
quantitative indicators that are found to reflect these five
dimensions form the basis of the data set constructed for this
paper.
There are, however, four observations that should be made up
front. First, the notion that these five dimensions should be
jointly satisfied implies that the different characteristics are
5 This section draws upon Campos and Nugent (1999).
6 For conceptual discussions of governance see Streeten (1996), Dethier (1999)and International Monetary Fund (1997). Examples of (cross-sectional) empiricalstudies on the issue are Olson, Sarna and Swamy (1997) and Kaufmann, Kraay andZoido-Libaton (1999).

7
thought of as complements to one another. Satisfying any one
dimension raises the probability that another will be satisfied
and/or its effect on development performance will be raised.
Second, all five components are multi-dimensional. For
example, regarding the rule of law, there are dimensions which
relate to the public sector and others pertaining to the private
sector and for each there are juridical, legislative, executive,
enforcement and acceptability issues, which may involve
perceptions of fairness and compatibility with informal social
norms.
Third, the fact that several dimensions may be involved in
any single institutional component and that no less than five
different characteristics are the basis for the notion of
governance implies that this latter concept is exceptionally
comprehensive.
Fourth and finally, although these characteristics are
institutionalized (i.e., are derived from institutions, their
rules and how well they work), their relevance for development
performance depend on the degree to which a given country’s
governance characteristics can be changed over time. While
improvements in governance may be reinforcing, institutional decay
and loss of capacity may also ensue when the governance conditions
in a country become adverse.
Thus far, analyses of the effects of governance
characteristics have taken quite different forms. Some, e.g.,
Pritchett, Isham and Kaufmann (1996), have investigated the issue
in detailed micro-level studies. Others have investigated the

8
effects at the macroeconomic level of a single characteristic of
governance at a time, e.g., the effect of bureaucratic quality on
the prospects for macroeconomic reform (Ball and Rausser, 1995).
Generally speaking, macro-level tests of the effects of these and
other institutional characteristics on economic development have
been almost exclusively limited to international cross-section
studies. As such, it is unclear that the results obtained from
such studies apply to individual countries over time. Indeed, it
is the potentially dynamic character and comprehensiveness of
governance characteristics that give this concept such importance.
However, for the reasons just discussed the various
characteristics have to be tested collectively and in a context in
which they may have changed considerably over time.7
The five characteristics of good governance have been
identified in (1a) - (5a) above. One important issue is to try to
relate these both to each other and to each indicator of economic
development performance. As suggested above, the relationships
among the various components of good governance are deemed by the
World Bank (1994) to be complementary. For example, when (2a) the
quality of bureaucracy (as defined above) is high, the government
may be better able to respond to the changing needs of its
citizenry. These needs can be better expressed when there is both
a strong civil society (5a) and the executive branch is
accountable for its actions (1a). The relevance and strength of
both (1a) and (5a), in turn, are increased when the policy-making
process is characterized by a high degree of transparency, i.e.,
7 As noted above, this has been the case in the Central and Eastern European andformer Soviet Union countries since 1989.
9
governance characteristic (4a) is fulfilled. The effects of all
the other governance characteristics would be undermined if
neither the public nor private sectors behave according to the
rule of law. Without transparency, narrow interest groups may
impede desirable changes. Yet, with transparency, civil society is
more likely to become involved in the policy-making debate. On the
other hand, the achievement of transparency requires pressures for
widespread participation from civil society. By the same token,
without transparency of the policy-making process, even well-
intentioned and constructive efforts by various groups will be
less likely to know how to succeed, and hence less successful in
affecting policy and governance characteristics in the desired
direction. The executive arm of the government must be accountable
for its actions if those actions are not to be “captured” by a
small, narrowly defined interest group more interested in rent
seeking than in broadly based development.
One might suspect that some of the institutional dimensions
of governance would have stronger effects on some elements of
development performance than on others (UNDP, 1995). For example,
(2a) and (4a) would seem to be most directly related to the level
of income per capita. On the other hand, characteristics (1a),
(3a) and (5a) might be relatively more important in determining
life expectancy and school enrolment rates. If there would seem to
be two or more different variables primarily responsible for
determining any development performance indicator, the necessity
of pure complementarity among the governance characteristics might
be questioned. Indeed, one could think of (1a) and (4a) as being
10
substitutes for one another, (2a), (3a) and (5a) as potential
substitutes for one another. Complementarity would be between each
of these sets. In the light of the previous discussion, strong
assertions of this type are risky without an empirical basis.
3. MEASURING THE INSTITUTIONAL DIMENSIONS OF GOVERNANCE
The measurement of the various characteristics of governance is no
easy matter. For one thing, several of these characteristics are,
in principle, multi-dimensional. To do justice to the multi-
dimensionality of these characteristics implies the need for
different measures for each dimension. Until full-fledged sample
surveys designed specifically to measure governance are developed,
studies will have to utilize existing data sets with less than
ideal data for the purpose. Given the importance of such issues,
the investments in new data that have been made in recently, and
the costs of collecting additional data, it is imperative to take
stock of the available data, use it to determine whether the
hypotheses have merit and, if so, whether further investments in
data collection are indeed desirable.
The purpose of this section is to identify available data
that may be relevant to each of the institutional dimensions of
governance (1a)-(5a), as discussed above. Three observations are
necessary. First, all variables were transformed from their
original scale to one from 0 to 10, and were inverted (when
needed) to have higher scores reflecting better institutional
performance. Second, after assembling the largest possible data
set of institutional indicators, coverage was found to be

11
unbalanced, that is, much better for characteristics (2a), (3a)
and (5a). Consequently, the transparency of the policy-making
process and the accountability of the executive were merged in a
single characteristic. Third, the country and time coverage from
all different sources varies quite a lot, so interpolations need
to be performed. These were supported by Banks (various years),
Gwartney, Lawson and Block(1996), Holmes, Johnson and Kirkpatrick
(1997, 1998) Karatnycky, Motyl and Shor (1998), Messick (1996),
and Taylor and Jodice (1993).
Let start describing the indicators used as the basis for
the measure of characteristic (2a), the quality of the
bureaucracy. This was constructed on the basis of two existing
indicators. The first, available from the International Country
Risk Guide (ICRG), is called “bureaucratic quality” and captures
the extent to which the national bureaucracy enjoys autonomy from
political pressure, has the strength and expertise to govern in a
stable manner without drastic changes in policy, and has an
effective mechanism for recruiting and training. The second such
indicator, from Holmes, Johnson and Kirkpatrick (1997, 1998) is
their “factor #9, regulation.” It measures, on a 1-5 scale, the
extent of licensing requirements to operate a business, the ease
to obtain a business license, the corruption within the
bureaucracy, and the extent and nature of labor, environmental,
consumer safety, and worker health regulations.
Characteristic (3a), the rule of law, was constructed on the
basis of three indicators, the first two focusing on enforcement
and the latter on the type and substance of the “law” itself. The
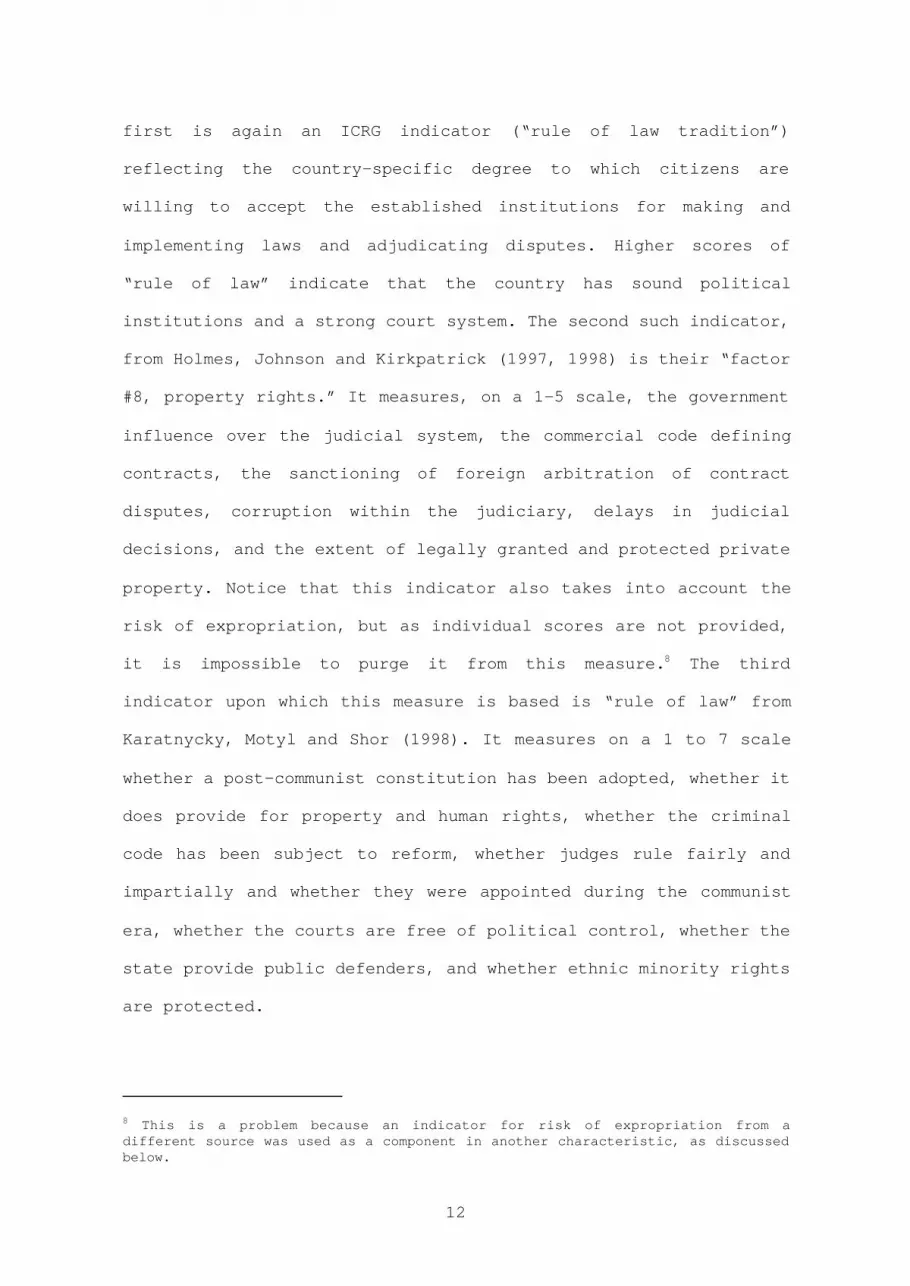
12
first is again an ICRG indicator (“rule of law tradition”)
reflecting the country-specific degree to which citizens are
willing to accept the established institutions for making and
implementing laws and adjudicating disputes. Higher scores of
“rule of law” indicate that the country has sound political
institutions and a strong court system. The second such indicator,
from Holmes, Johnson and Kirkpatrick (1997, 1998) is their “factor
#8, property rights.” It measures, on a 1-5 scale, the government
influence over the judicial system, the commercial code defining
contracts, the sanctioning of foreign arbitration of contract
disputes, corruption within the judiciary, delays in judicial
decisions, and the extent of legally granted and protected private
property. Notice that this indicator also takes into account the
risk of expropriation, but as individual scores are not provided,
it is impossible to purge it from this measure.8 The third
indicator upon which this measure is based is “rule of law” from
Karatnycky, Motyl and Shor (1998). It measures on a 1 to 7 scale
whether a post-communist constitution has been adopted, whether it
does provide for property and human rights, whether the criminal
code has been subject to reform, whether judges rule fairly and
impartially and whether they were appointed during the communist
era, whether the courts are free of political control, whether the
state provide public defenders, and whether ethnic minority rights
are protected.
8 This is a problem because an indicator for risk of expropriation from adifferent source was used as a component in another characteristic, as discussedbelow.
13
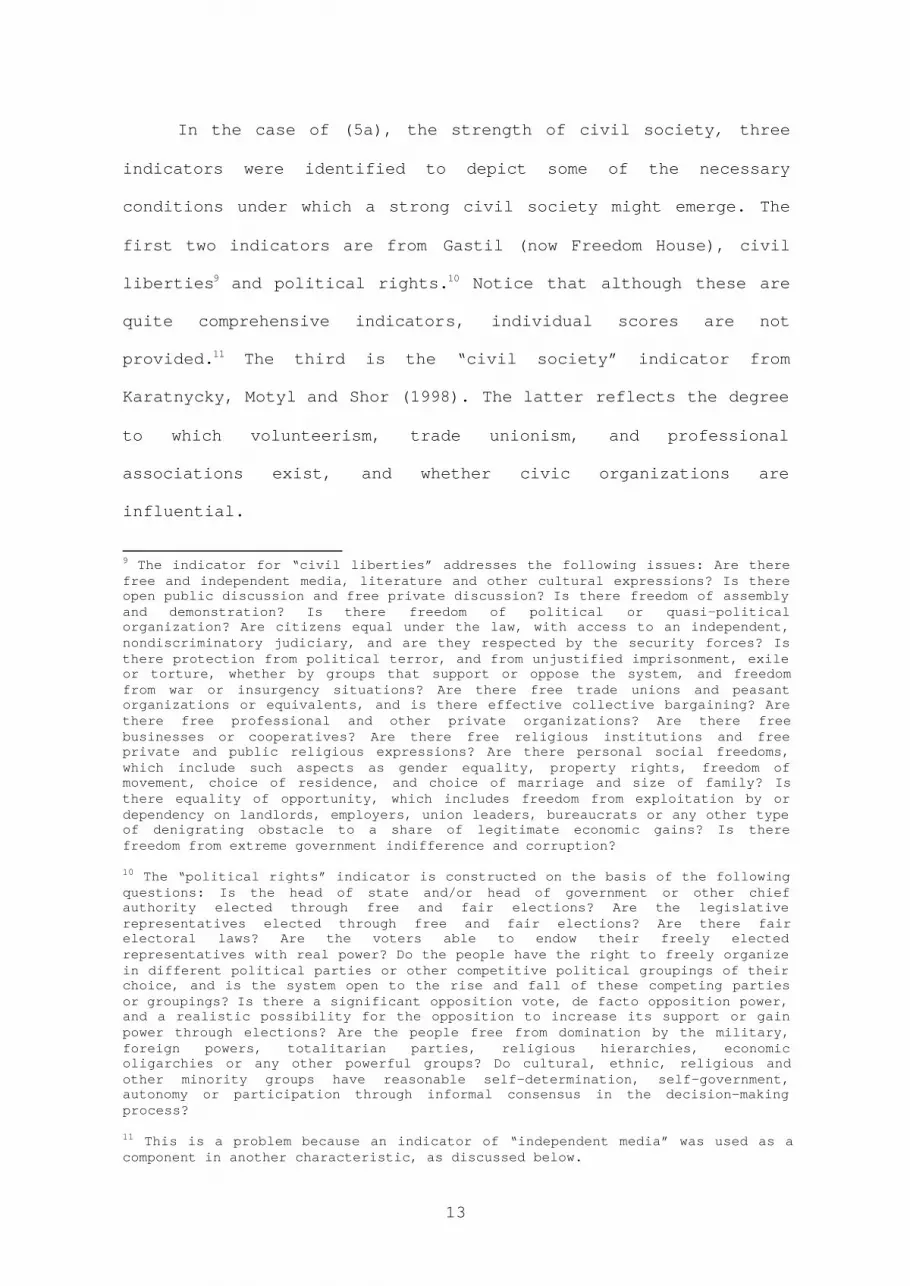
In the case of (5a), the strength of civil society, three
indicators were identified to depict some of the necessary
conditions under which a strong civil society might emerge. The
first two indicators are from Gastil (now Freedom House), civil
liberties9 and political rights.10 Notice that although these are
quite comprehensive indicators, individual scores are not
provided.11 The third is the “civil society” indicator from
Karatnycky, Motyl and Shor (1998). The latter reflects the degree
to which volunteerism, trade unionism, and professional
associations exist, and whether civic organizations are
influential.
9 The indicator for “civil liberties” addresses the following issues: Are therefree and independent media, literature and other cultural expressions? Is thereopen public discussion and free private discussion? Is there freedom of assemblyand demonstration? Is there freedom of political or quasi-politicalorganization? Are citizens equal under the law, with access to an independent,nondiscriminatory judiciary, and are they respected by the security forces? Isthere protection from political terror, and from unjustified imprisonment, exileor torture, whether by groups that support or oppose the system, and freedomfrom war or insurgency situations? Are there free trade unions and peasantorganizations or equivalents, and is there effective collective bargaining? Arethere free professional and other private organizations? Are there freebusinesses or cooperatives? Are there free religious institutions and freeprivate and public religious expressions? Are there personal social freedoms,which include such aspects as gender equality, property rights, freedom ofmovement, choice of residence, and choice of marriage and size of family? Isthere equality of opportunity, which includes freedom from exploitation by ordependency on landlords, employers, union leaders, bureaucrats or any other typeof denigrating obstacle to a share of legitimate economic gains? Is therefreedom from extreme government indifference and corruption?
10 The “political rights” indicator is constructed on the basis of the followingquestions: Is the head of state and/or head of government or other chiefauthority elected through free and fair elections? Are the legislativerepresentatives elected through free and fair elections? Are there fairelectoral laws? Are the voters able to endow their freely electedrepresentatives with real power? Do the people have the right to freely organizein different political parties or other competitive political groupings of theirchoice, and is the system open to the rise and fall of these competing partiesor groupings? Is there a significant opposition vote, de facto opposition power,and a realistic possibility for the opposition to increase its support or gainpower through elections? Are the people free from domination by the military,foreign powers, totalitarian parties, religious hierarchies, economicoligarchies or any other powerful groups? Do cultural, ethnic, religious andother minority groups have reasonable self-determination, self-government,autonomy or participation through informal consensus in the decision-makingprocess?
11 This is a problem because an indicator of “independent media” was used as acomponent in another characteristic, as discussed below.
14
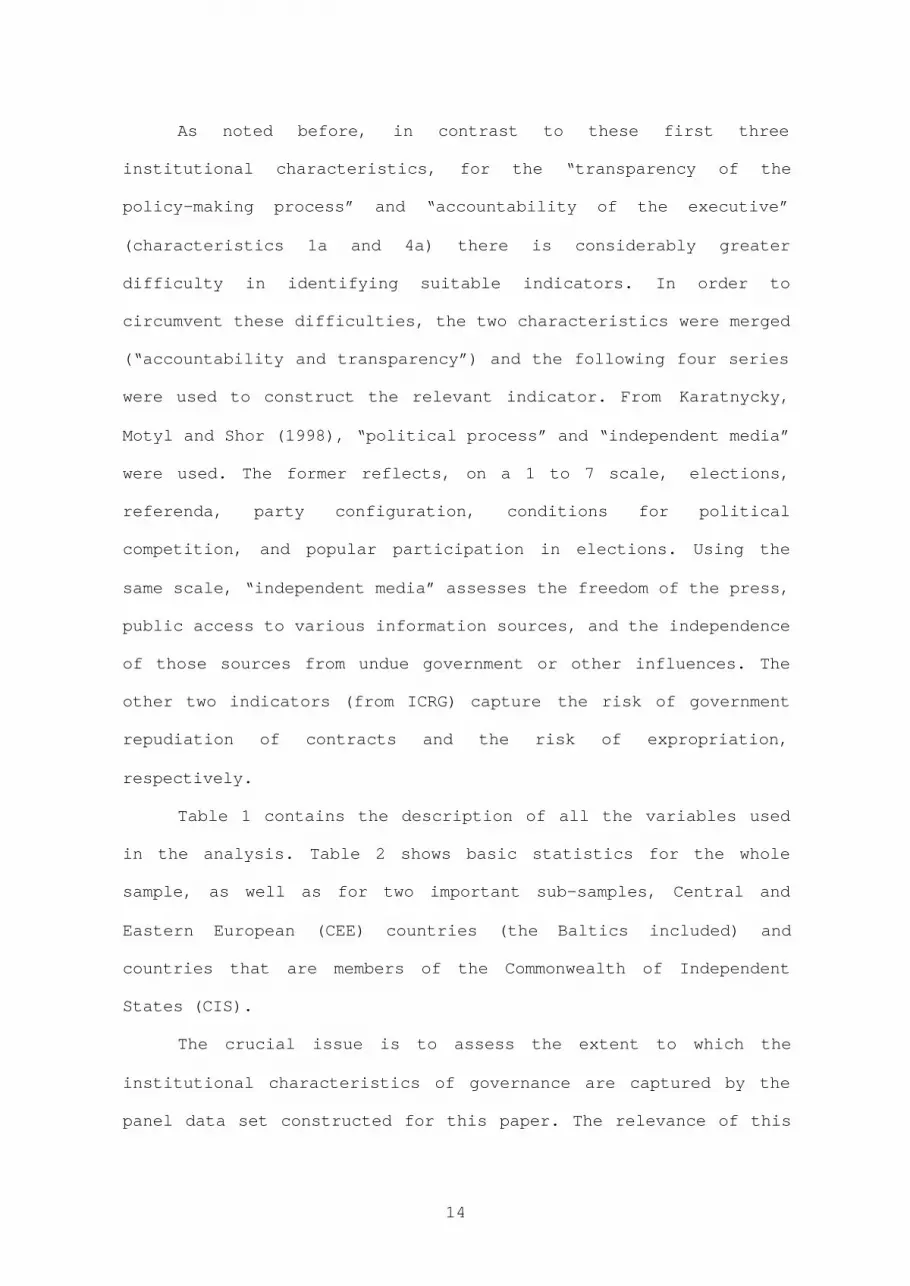
As noted before, in contrast to these first three
institutional characteristics, for the “transparency of the
policy-making process” and “accountability of the executive”
(characteristics 1a and 4a) there is considerably greater
difficulty in identifying suitable indicators. In order to
circumvent these difficulties, the two characteristics were merged
(“accountability and transparency”) and the following four series
were used to construct the relevant indicator. From Karatnycky,
Motyl and Shor (1998), “political process” and “independent media”
were used. The former reflects, on a 1 to 7 scale, elections,
referenda, party configuration, conditions for political
competition, and popular participation in elections. Using the
same scale, “independent media” assesses the freedom of the press,
public access to various information sources, and the independence
of those sources from undue government or other influences. The
other two indicators (from ICRG) capture the risk of government
repudiation of contracts and the risk of expropriation,
respectively.
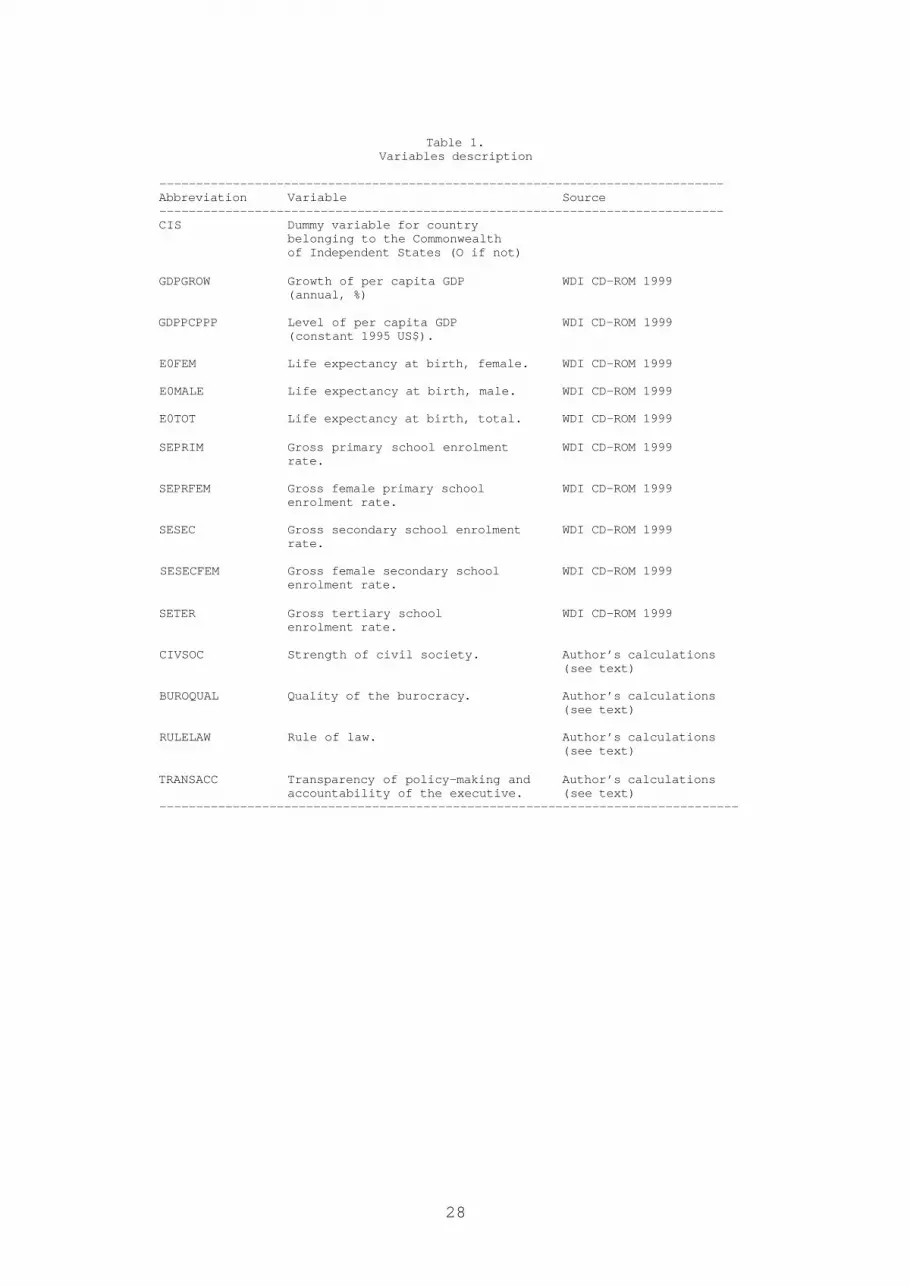
Table 1 contains the description of all the variables used
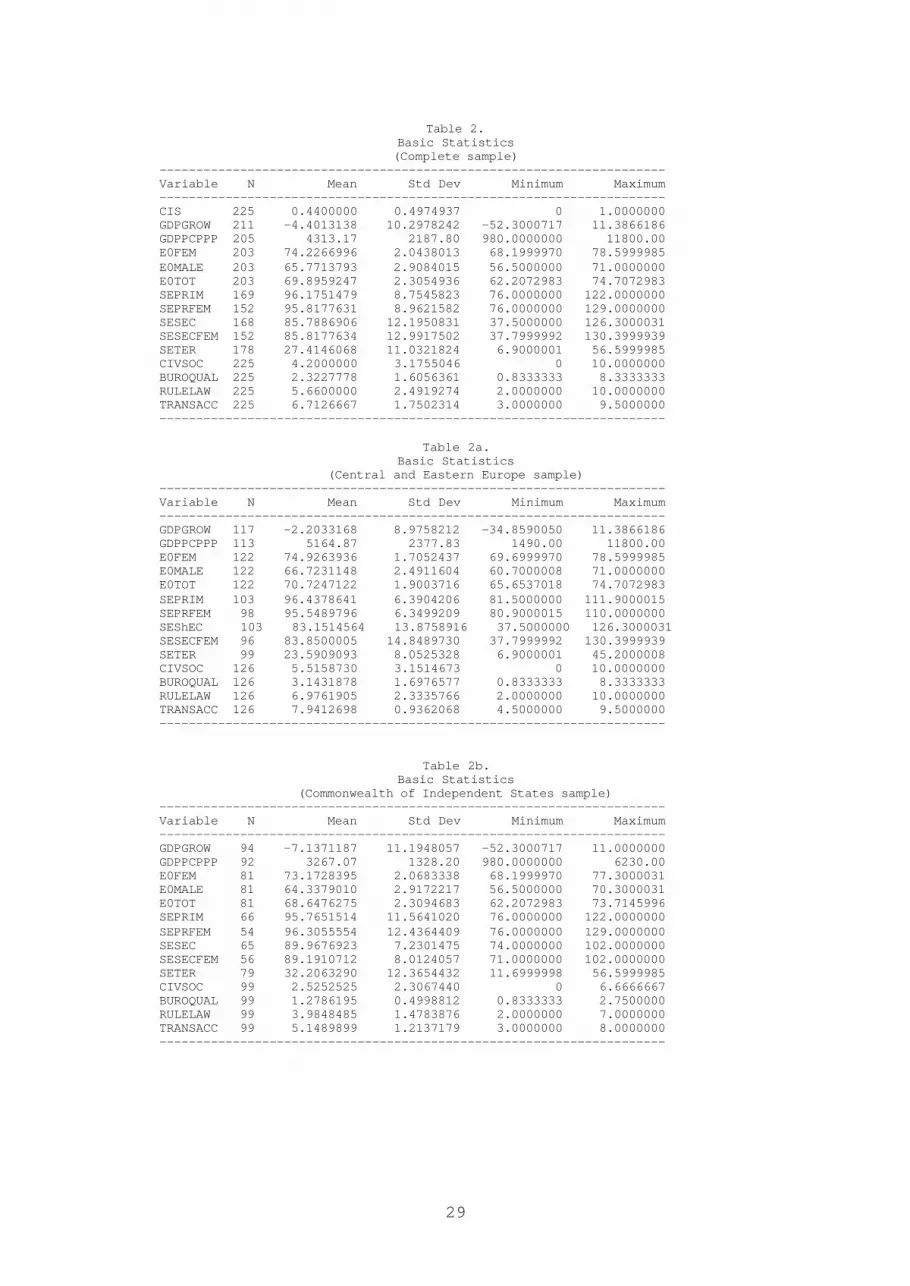
in the analysis. Table 2 shows basic statistics for the whole
sample, as well as for two important sub-samples, Central and
Eastern European (CEE) countries (the Baltics included) and
countries that are members of the Commonwealth of Independent
States (CIS).
The crucial issue is to assess the extent to which the
institutional characteristics of governance are captured by the
panel data set constructed for this paper. The relevance of this

15
exercise is given by the hypothesis that these five institutional
characteristics are complements to, not substitutes for, each
other. To start dealing with this issue, the pair-wise correlation
coefficients are examined. A low and statistically insignificant
correlation will suggest that the two underlying variables capture
different institutional characteristics of governance, and vice-
versa, a high and statistically significant correlation would
suggest that the two underlying variables capture the same
institutional characteristics of governance. The pair-wise
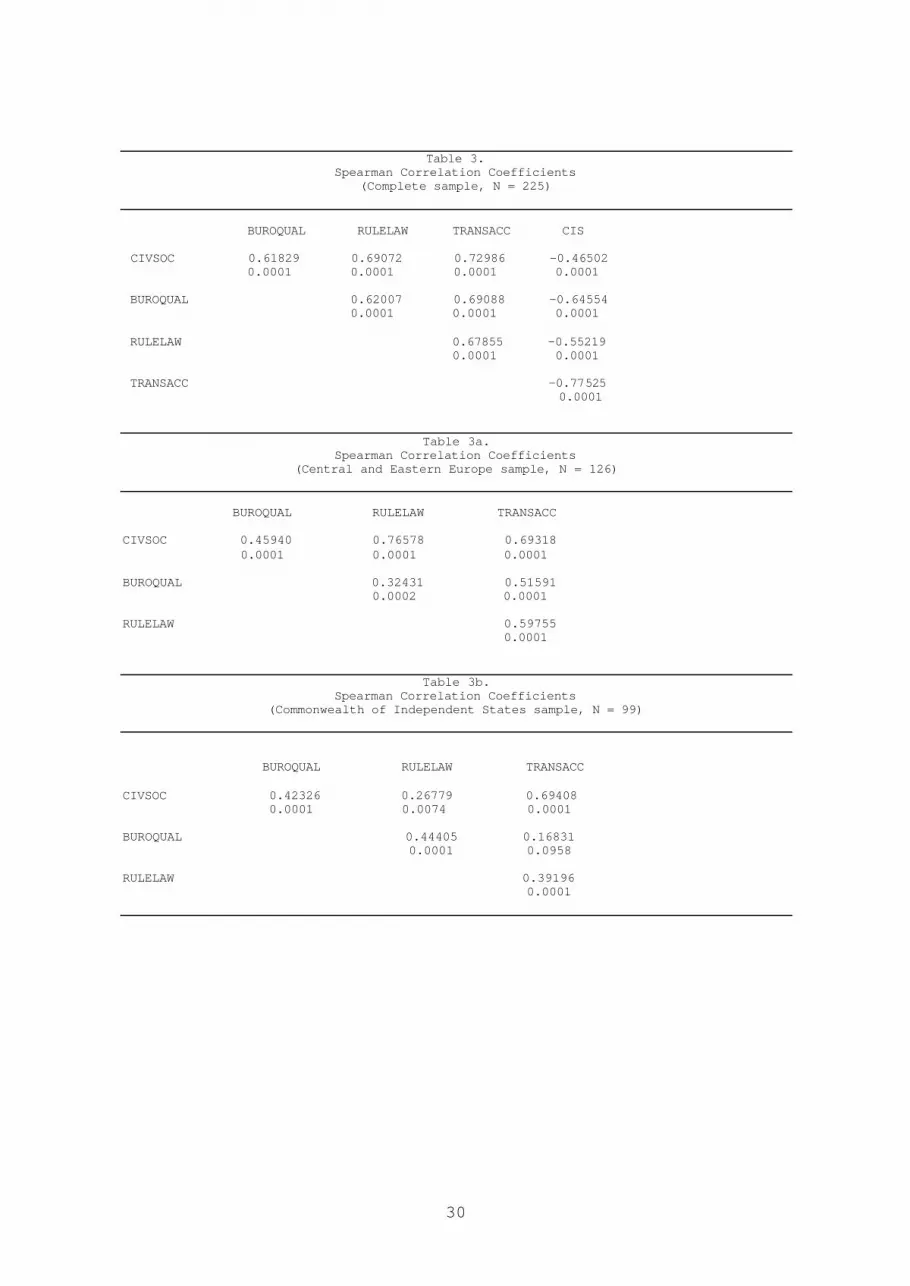
correlation coefficients are given in Table 3. Because of the
ordinal character of these institutional indicators, Spearman
(rank) correlations were deemed more appropriate.
There are a number of salient issues. The pair-wise
correlations for the whole sample are somewhat high, ranging from
0.61 between civil society and quality of the bureaucracy to 0.72
between civil society and “accountability and transparency.”
Notice also that the correlations between all four institutional
measures and the CIS dummy are negative. Closer examination for
the two sub-samples reveals that the correlation coefficients are
much lower, but the one between civil society and “accountability
and transparency” is still the largest. For the Central and
Eastern European countries, the lowest correlation is that between
the quality of the bureaucracy and the rule of law, while that for
the CIS countries it is the one between the rule of law and
“accountability and transparency.” The fact that breaking down the
sample significantly lowers the correlation coefficients suggests
that the data set capture different aspects of the institutional
16
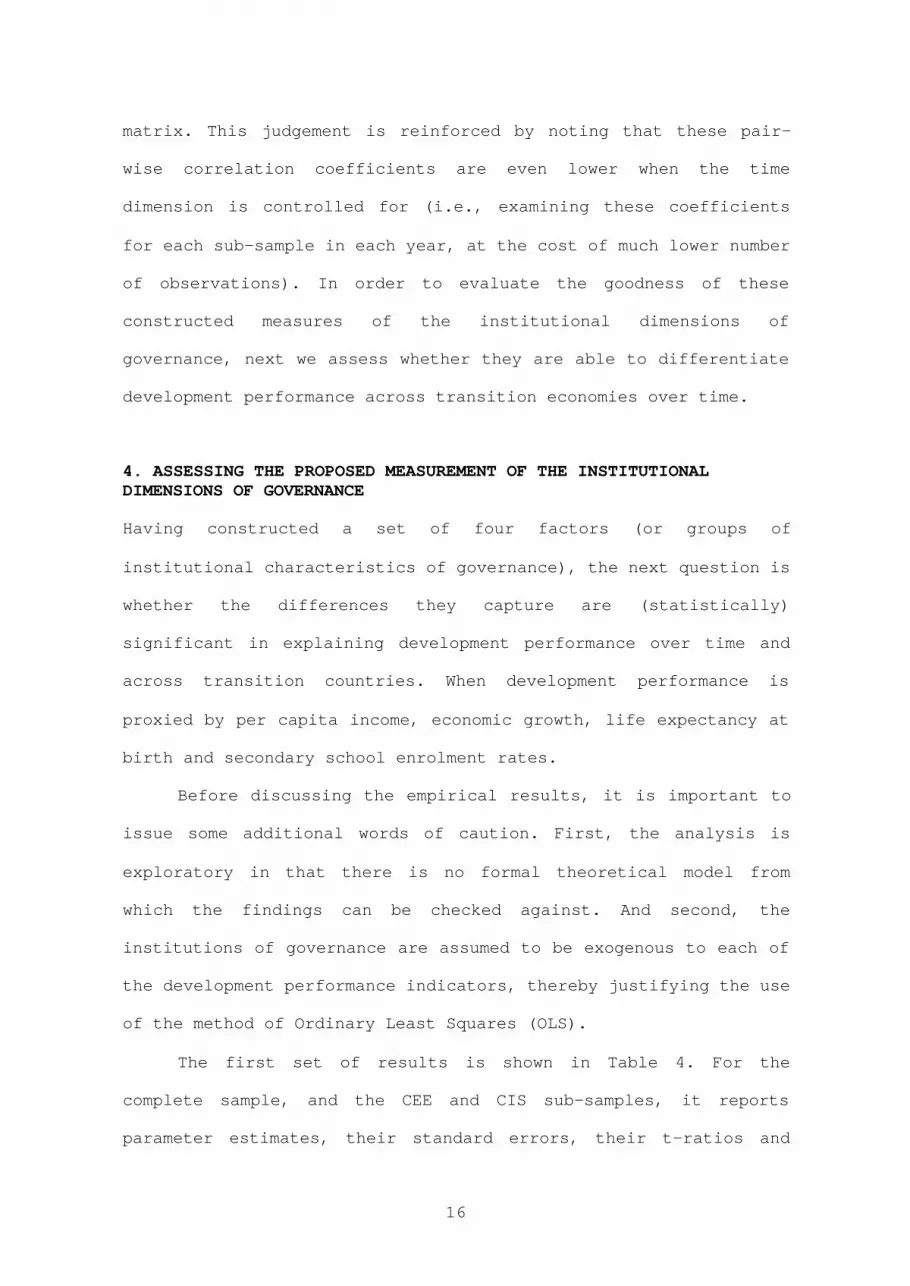
matrix. This judgement is reinforced by noting that these pair-
wise correlation coefficients are even lower when the time
dimension is controlled for (i.e., examining these coefficients
for each sub-sample in each year, at the cost of much lower number
of observations). In order to evaluate the goodness of these
constructed measures of the institutional dimensions of
governance, next we assess whether they are able to differentiate
development performance across transition economies over time.
4. ASSESSING THE PROPOSED MEASUREMENT OF THE INSTITUTIONALDIMENSIONS OF GOVERNANCE
Having constructed a set of four factors (or groups of
institutional characteristics of governance), the next question is
whether the differences they capture are (statistically)
significant in explaining development performance over time and
across transition countries. When development performance is
proxied by per capita income, economic growth, life expectancy at
birth and secondary school enrolment rates.
Before discussing the empirical results, it is important to
issue some additional words of caution. First, the analysis is
exploratory in that there is no formal theoretical model from
which the findings can be checked against. And second, the
institutions of governance are assumed to be exogenous to each of
the development performance indicators, thereby justifying the use
of the method of Ordinary Least Squares (OLS).
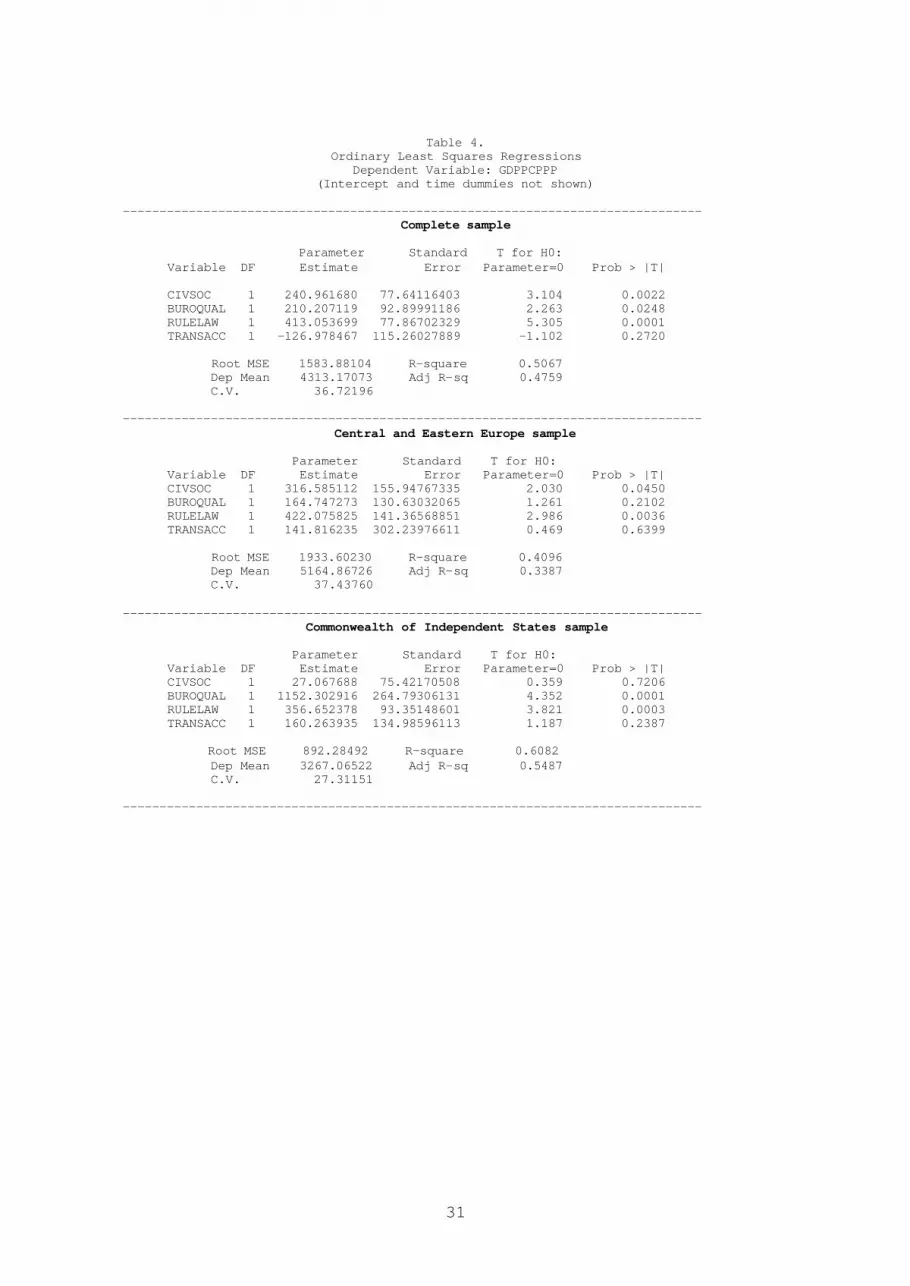
The first set of results is shown in Table 4. For the
complete sample, and the CEE and CIS sub-samples, it reports
parameter estimates, their standard errors, their t-ratios and
17
associated p-values, from OLS regressions of the average level of
per capita GDP on the set of four institutional indicators.12
Altogether, the set of governance characteristics captures a
satisfactory proportion of the intra-regional differences in the
level of per capita GDP over time. For the complete sample, three
out of the four institutional indicators are statistically
significant and have the correct sign (recall that all
institutional indicators were normalized and re-scaled so as to
justify the expectation of a positive effect of each institutional
characteristic on the various development performance indicators).
The only one that does not perform well is “accountability and
transparency.” Breaking down the sample into CIS and CEE brings a
number of differences to light. For the CEE countries, only rule
of law and civic society are statistically significant (at the 5
percent level), while the most important factors with respect to
differences among CIS countries are the quality of the bureaucracy
and rule of law.
Table 5 contains the results of similar regressions when the
dependent variable is the growth of income per capita, instead of
its level. It is remarkable that rule of law is the only
statistically significant institutional dimension of governance.
Moreover, none of the four perform satisfactorily for the CEE
countries, while only one (the quality of the bureaucracy) is not
statistically significant for the CIS sub-sample.
12 The reader should bear in mind that all regressions are run with year dummiesto purge the “time effect” out of a “pure institutional effect.” Thesecoefficients are not shown for the sake of space.
18
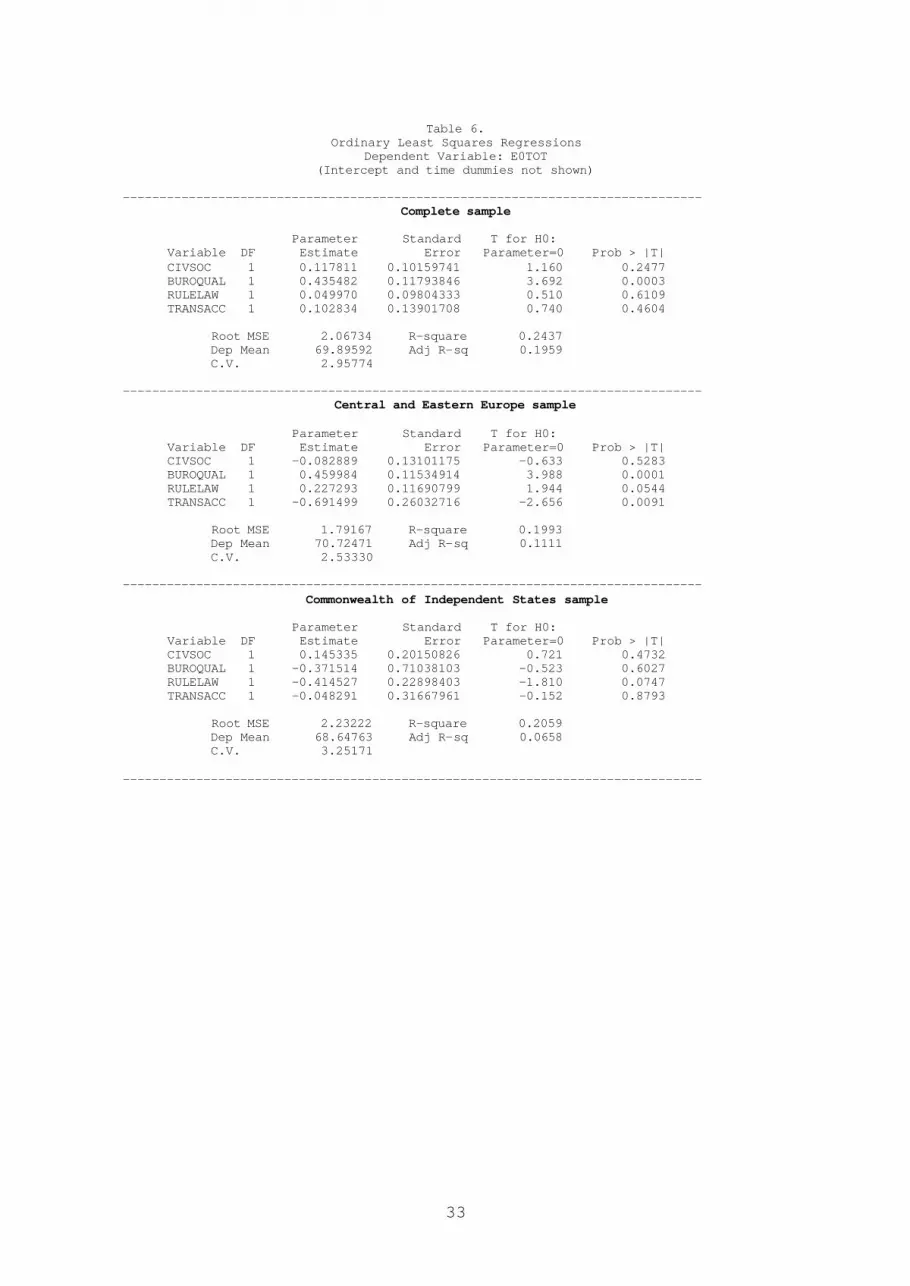
With respect to life expectancy at birth, as shown in Table
6, the institutional indicators capture a rather low proportion of
the intra-regional differences. Not surprisingly, the quality of
the bureaucracy is the only indicator showing statistical
significance (which is also true for the CEE sample). Notice that
the “accountability and transparency” dimension is statistically
significant but, surprisingly, carries a negative sign. For the
CIS countries, none of the coefficients is statistically
significant at the 5 percent level.
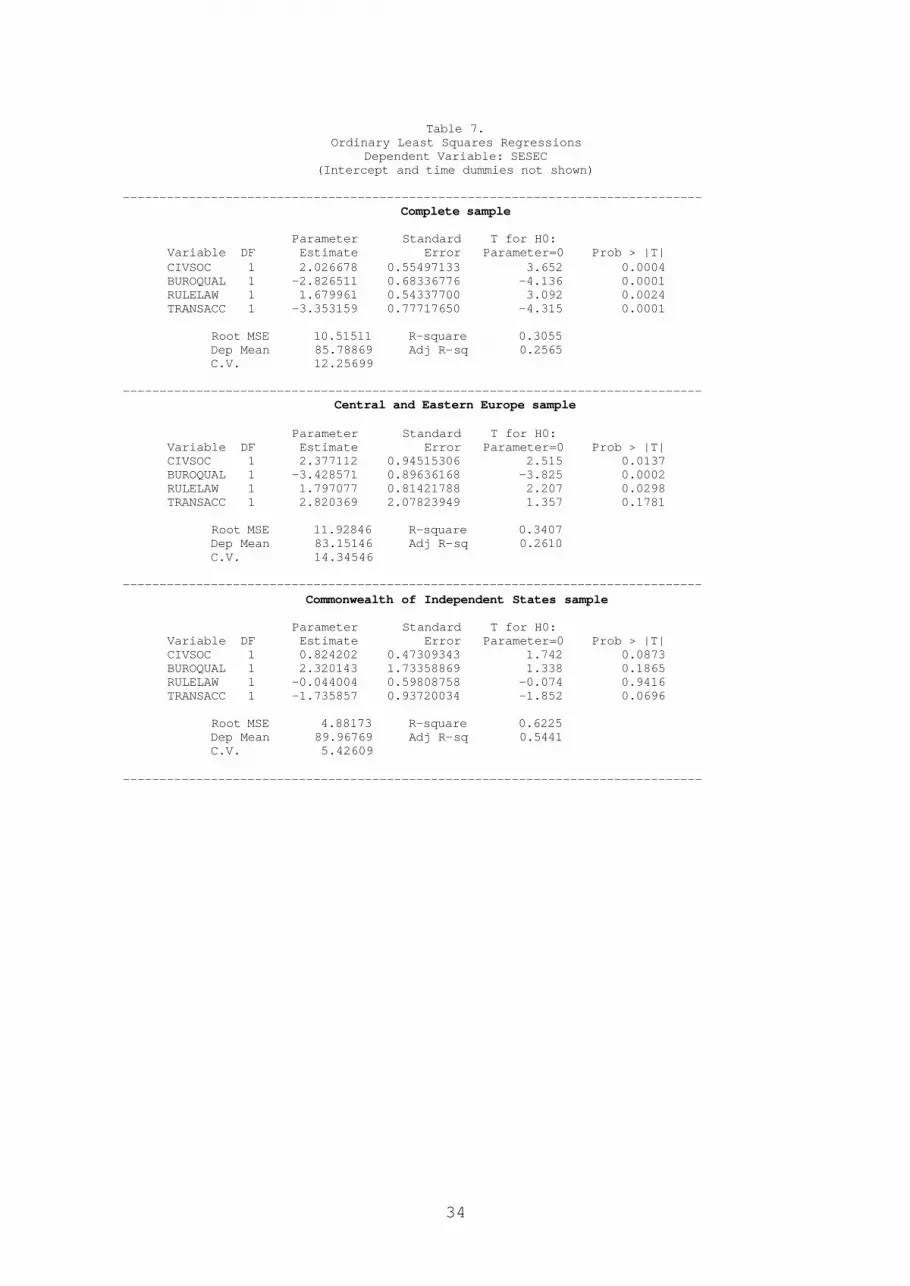
Finally, as shown in Table 7, the over time and cross-
country variation in the last measure of development performance,
secondary school enrolment rates, is better explained for the CIS
than for the pooled sample as all relevant coefficients are
significant in the former. While civil society and the rule of law
show a positive impact, the opposite can be seen for the quality
of the bureaucracy and for “accountability and transparency.”
Although for the CEE countries, “accountability and transparency”
is the only coefficient that is not statistically significant, the
sign pattern from the whole sample for the other three dimensions
is repeated. Once again, for the CIS countries, none of the
coefficients is statistically significant (at the 5 percent
level).
In light of these results, the data set put together for
this paper seems to perform quite reasonably. Yet, one concern is
the possibility that this performance is driven by
multicollinearity or by the aforementioned complementarity or
substitutability between the different institutional dimensions
19
vis-à-vis each development performance indicator. The method
chosen to investigate this issue was to enlarge the previous
specifications with the set of six possible interaction terms. And
then evaluate the significance and sign of the coefficients of the
interaction terms in order to assess whether any given pair of
institutional characteristics are complements to or substitutes
for each other (vis-à-vis the development performance indicator in
question).
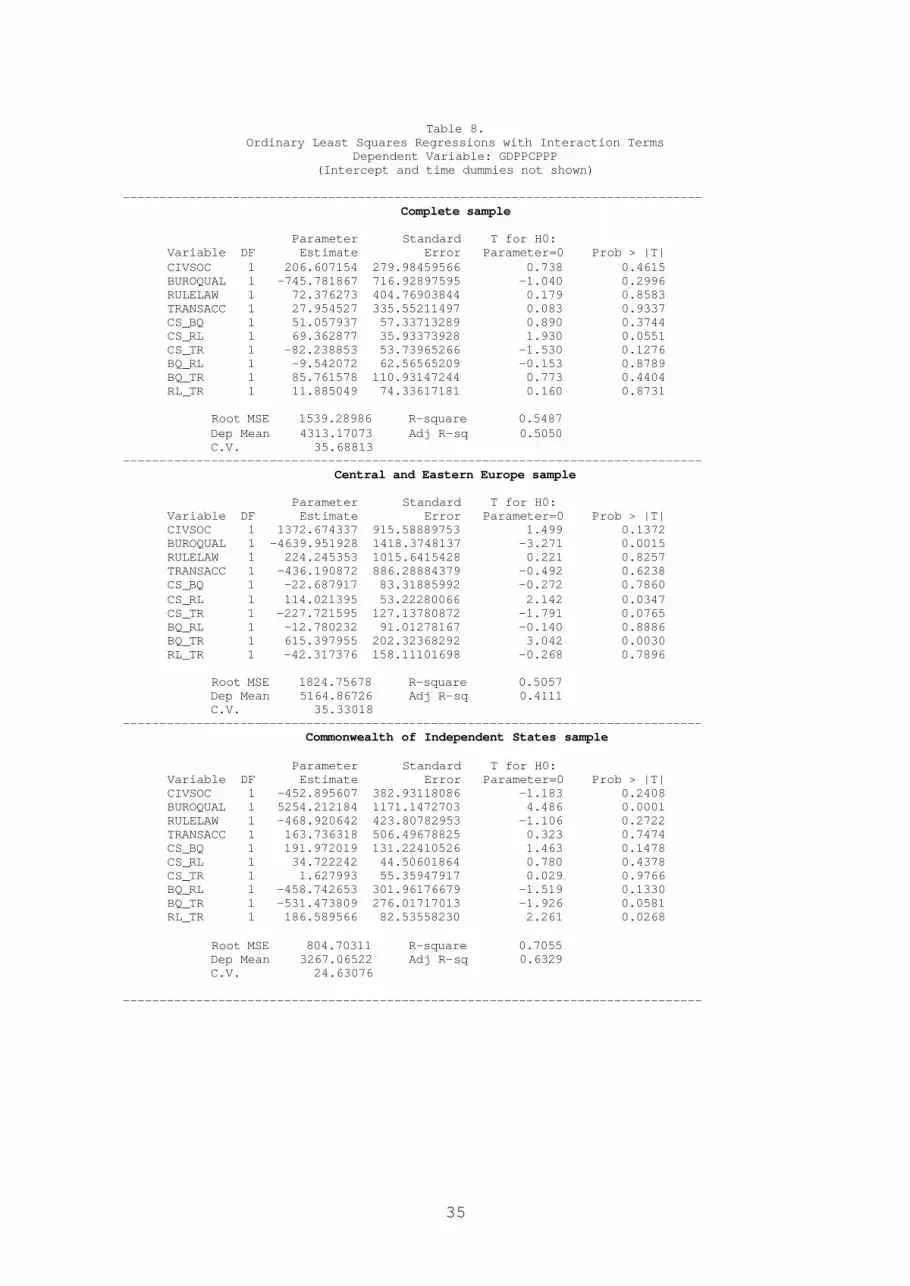
Table 8 reports the parameter estimates, their standard
errors, their t-ratios and p-values, from OLS regressions of the
average level of per capita GDP on both the set of four
institutional indicators and the set of six interaction terms.
Compared to the results in Table 4, all coefficients loose
statistical significance, for the complete sample. On the other
hand, clearer pictures emerge for the two sub-samples. Among CEE
countries, the coefficient on the quality of the bureaucracy is
negative and significant after taking into account that it is
complementary to “accountability and transparency” and that the
coefficient on the interaction term between civil society and rule
of law (the two other significant results in the regression in
Table 4) is positive, suggesting complementarity between them.
Similar results obtain for the CIS countries. The quality of the
bureaucracy seems to have an important positive impact, and the
same holds for the interaction between rule of law and
“accountability and transparency.”
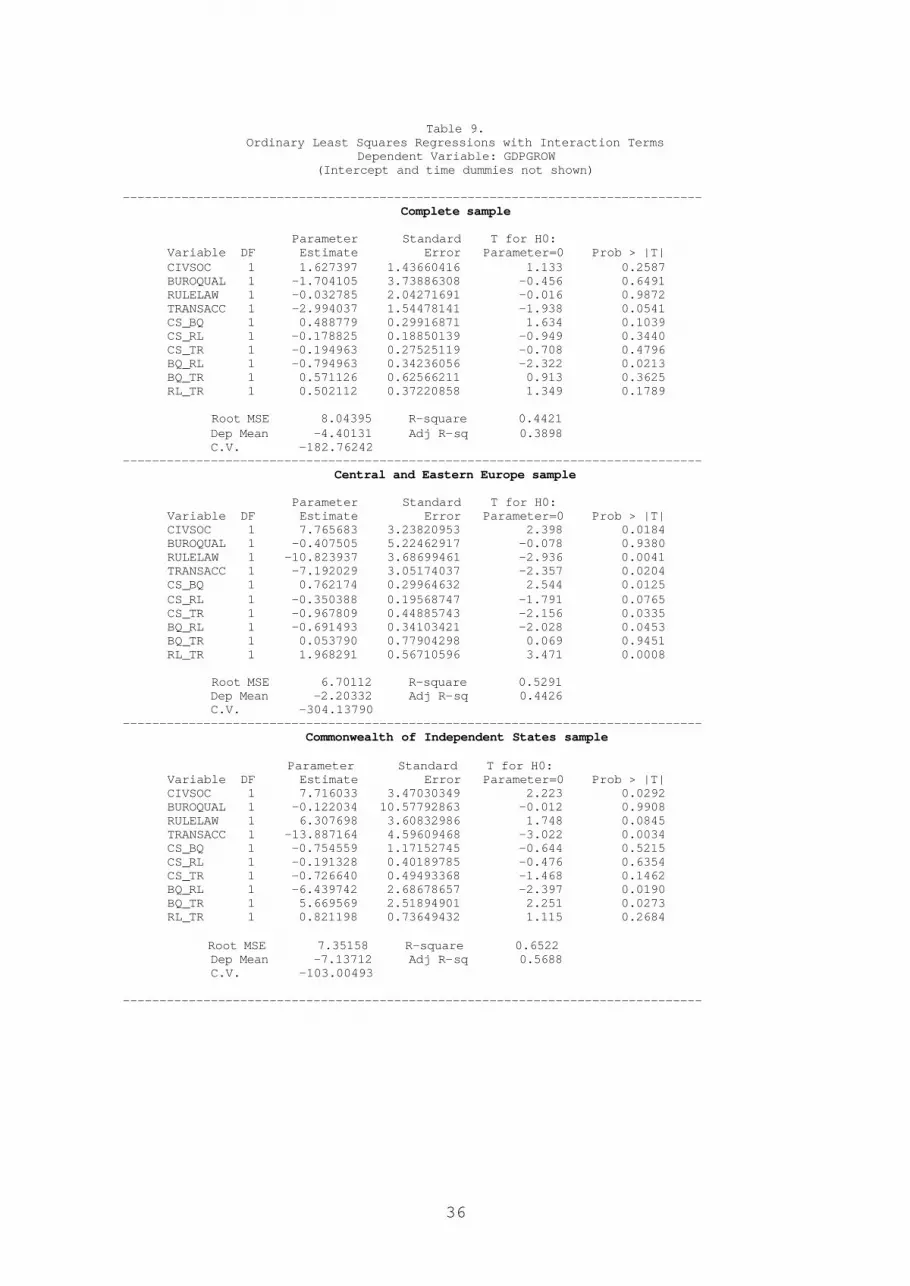
The results for economic growth improve after controlling
for the interaction terms (table 9). Notice that the role of rule

20
of law (prominent in the results in Table 5) is now replaced by a
relationship of substitutability between this institutional
dimension and the quality of the bureaucracy. Moreover,
“accountability and transparency” now gains statistical
significant but carries a negative sign. While without the
interaction terms there were no statistically significant
coefficients for the CEE sample, adding interaction terms makes
many of them so. Cases in point are civil society, rule of law and
“accountability and transparency” (note however that the first
shows a positive impact while the last two show negative effects).
Moreover, these obtain with some significant interaction terms:
civil society and the quality of the bureaucracy and
“accountability and transparency” and rule of law seem to be (both
pairs) complements, and civil society and “accountability and
transparency” seem substitutes (vis-à-vis economic growth). For
the CIS sample, civil society and “accountability and
transparency” remain statistically significant and carry the same
signs as before. As for the interaction terms, rule of law and the
quality of the bureaucracy are taken to be substitutes, while the
quality of the bureaucracy and “accountability and transparency”
are taken to be complements.
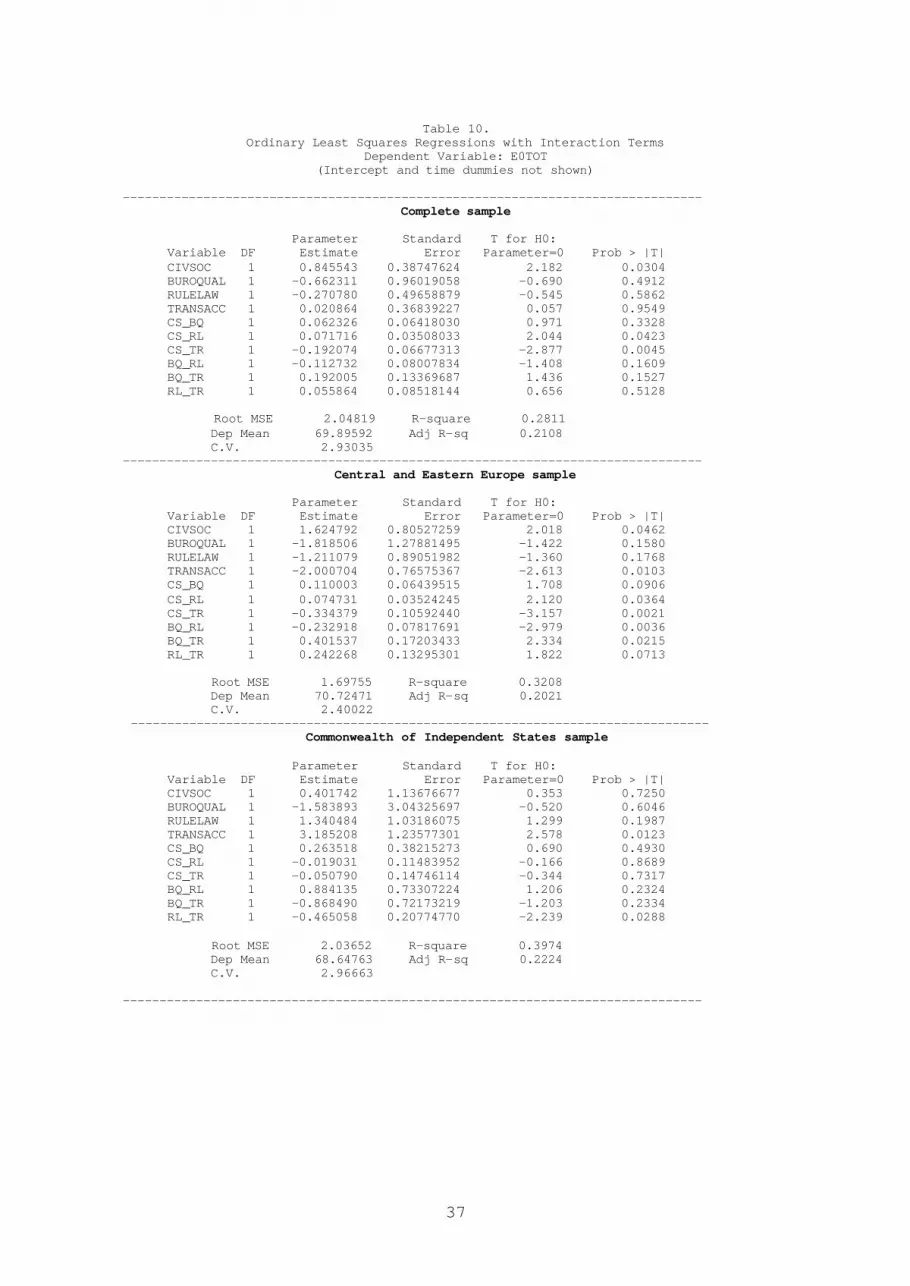
Table 10 shows the results for life expectancy at birth
enlarged by the set of interactions terms. Although previously for
the whole sample (table 6) only the quality of the bureaucracy
showed a significant impact, now only civil society does so. As
for the interaction terms, note that civil society and rule of law
seem complements vis-à-vis life expectancy, while civil society
21
and “accountability and transparency” are taken to be substitutes.
The negative impact of “accountability and transparency” for the
CEE countries remains, but the coefficient on civil society is now
statistically significant and positive. In addition to the two
significant interaction terms for the whole sample, for the CEE it
also obtains that the quality of the bureaucracy and rule of law
are substitutes while the quality of the bureaucracy and
“accountability and transparency” are complements. The major
change for the CIS is that the coefficient on “accountability and
transparency” is now statistically significant and positive.
Furthermore, this dimension is found to be a substitute for the
rule of law.
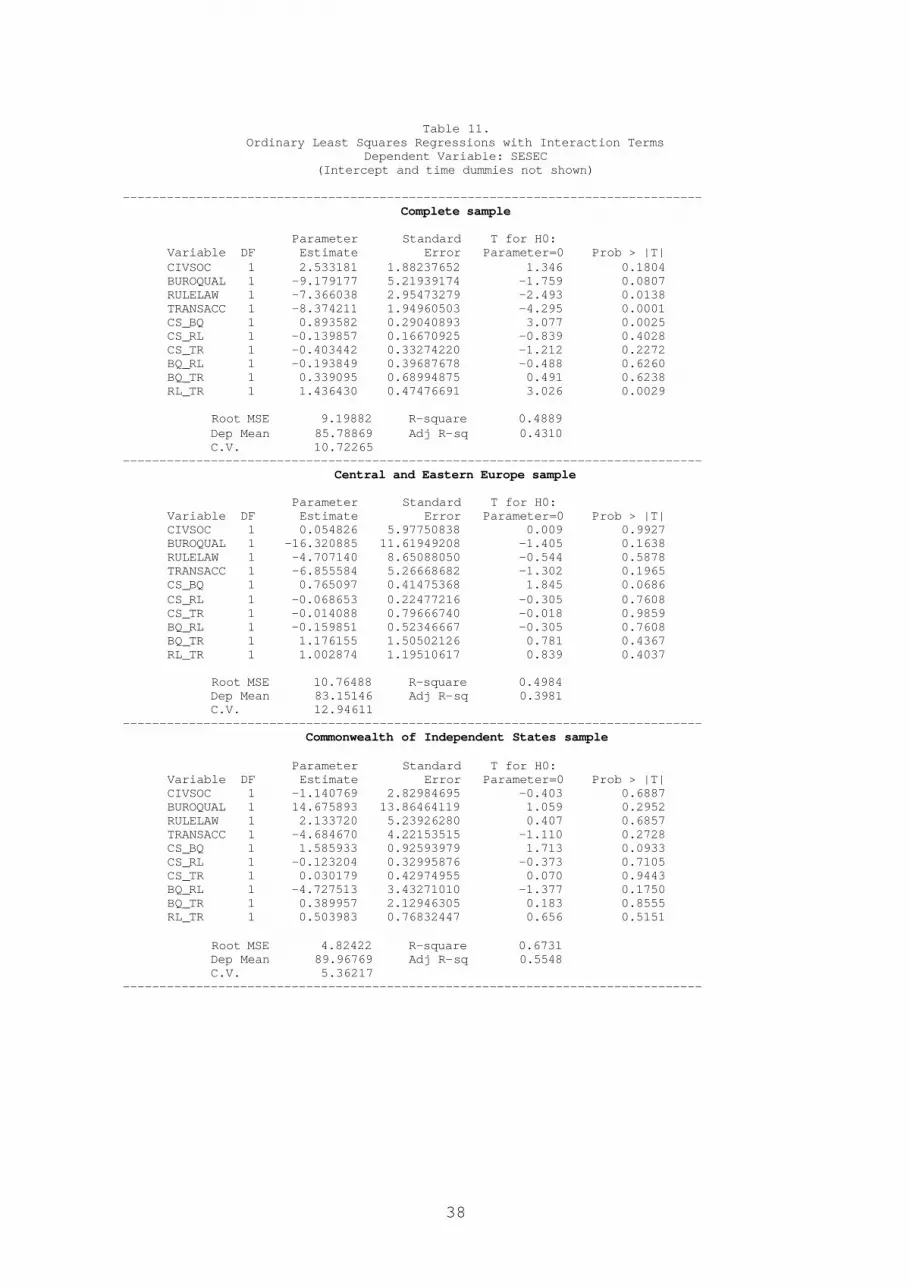
Finally, table 11 shows the results for the gross secondary
school enrolment rates. Despite the substantial improvements in
adjusted R2 (compared to table 7), many results diverge. While all
dimensions were previously statistically significant for the whole
sample, now only “accountability and transparency” and rule of law
remain so, but both coefficients carry negative signs. Moreover,
the quality of the bureaucracy and civil society and (not
surprisingly) “accountability and transparency” and rule of law
are complements. Notice also that with the addition of the
interaction terms, there are no statistically significant
coefficients left for the CEE sample. For the CIS countries, the
only important finding is that civil society and the quality of
the bureaucracy are complements.
Time is ripe for a summary. After accounting for the
possibility of interactions between the four institutional
22
dimensions of governance, for the complete sample the rule of law
is found to be the most important institutional dimension (in
terms of its effects on per capita income and school enrolment),
both for the sample as a whole and for its capacity to
differentiate Central and Eastern European from former Soviet
Union countries. Yet, vis-à-vis life expectancy, the quality of
the bureaucracy plays the crucial role.
5. CONCLUSIONS
The objective of this paper was to put forward a set of measures
to allow a first mapping of institutional building during the
transition from centrally planned to a market economy. It used the
concept of governance to guide the data collection and indicator
construction efforts. The panel data set constructed for this
paper does seem to allow a mapping of the process of institution
building, and seems able to highlight differences in this respect
over time and between Central and Eastern European and former
Soviet Union countries. The rule of law is found to be the most
important institutional dimension (in terms of its effects on per
capita income and school enrolment), both for the sample as a
whole and for its capacity to differentiate Central and Eastern
European from the former Soviet Union countries. However, with
respect to life expectancy, the quality of the bureaucracy plays
the crucial role.
A crucial suggestion for future research is that further
improvement of the measures used for the institutional dimensions
of governance is needed. Although accountability of the executive
23
and the transparency of the decision-making process should receive
priority, these efforts should not disregard the other three
indicators. Moreover, the four constructed measures should be put
to test by other researchers to provide an independent assessment
of their goodness and applicability.
Finally, one important message from these results is that
institutions do change over time. In contrast with the rather
pessimistic views of the path-dependency literature, this is a
more encouraging finding in that institutions are by no means as
immutable and unchangeable as that literature has suggested. This
implies that the feasibility space for policy choices (in
attempting to change institutions) may be much wider than often
assumed.
24
BIBLIOGRAPHY
Adelman, Irma and Dusan Vujovic, “Institutional and Policy Aspectsof the Transition: An Empirical Analysis”, in Amnon Levy-Livermore(ed) Handbook on the Globalization of the World Economy,Cheltenham, UK, Edward Elgar, 1998.
Aron, Janine, “Political, Economic and Social Institutions:AReview of Growth Evidence,” Oxford: Oxford University, Instituteof Economics and Statistics Working Papers Series No. 98-4, 1998.
Åslund, Anders, “Why Has Russia’s Economic Transformation Been SoArduous?” Paper presented at Annual World Bank Conference onDevelopment Economics, Washington, D.C., April 1999.
Ball, R. and Rausser, G., Governance Structures and the Durabilityof Economic Reforms: Evidence from Inflation Stabilizations. WorldDevelopment, 23 (6), 897-912, 1995.
Banks, A., Political Handbook of the World. New York:McGraw-Hill,(various years).
Barro, R. and J.Lee, “Data set for 138 Countries”, 1993. Availableby anonymous ftp from www.nber.org, at directory pub/barro.lee.
Blanchard, Olivier, The Economics of Post-Communist Transition,Oxford, Clarendon Press, 1997.
Blanchard, Olivier, Dornbush, Rudiger, Krugman, Paul, Layard,Richard, and Lawrence Summers, Reform in Eastern Europe,Cambridge: MIT Press, 1991.
Boone, Peter and Jakob Horder, “Inflation: Causes, Consequences,and Cures”, in Peter Boone, Stanislaw Gomulka an Richard Layard(eds) Emerging from Communism: Lessons from Russia, China, andEastern Europe, Cambridge: MIT Press, 1998.
Brunetti, Aymo, Gregory Kisunko and Beatrice Weder, “Institutionsin Transition: Reliability of Rules and Economic Performance inFormer Socialist Countries,” WPS 1809, Washington, D.C.: The WorldBank, 1997.
Burki, Shahid and Guillermo Perry (eds), Beyond the WashingtonConsensus: Institutions Matter, Washington, D.C.: World Bank,1998.
Business Environmental Risk Intelligence (various years), some ofit is available at the Economic Growth page fromwww.worldbank.org.
Campos, Nauro, “Back to the Future: The Growth Prospects ofTransition Economies Reconsidered,” Ann Arbor: William DavidsonInstitute Working Paper No. 229, 1999.

25
Campos, Nauro and Jeffrey Nugent, “Development Performance and theInstitutions of Governance: Evidence from East Asia and LatinAmerica,” World Development 27, 439-452, 1999.
Campos, Nauro, Khan, Feisal and Jennifer Tessendorf, “Can GoodInstitutions Substitute from Bad Policies? Evidence from RuralPakistan,” Los Angeles: University of Southern CaliforniaEconomics Department Working Paper No. 9905, 1999.
Dethier, Jean-Jacques, “Governance and Economic Performance: ASurvey,” Center for Development Research (ZEF), Discussion Paperon Development Policy No 5, April 1999.
Dethier, Jean-Jacques, Ghanem, Hafez and Edda Zoli, “DoesDemocracy Facilitate the Economic Transition? An Empirical Studyof Central and Eastern Europe and the Former Soviet Union,” WPS2194, Washington, D.C.: The World Bank, 1999.
Dewatripont, Mathias and Gerard Roland, “Transition as a Processof Large-Scale Institutional Change”, in D. Kreps and F. Wallis(eds) Advances in Economics and Econometrics: Theory andApplications (Volume 2), Cambridge: Cambridge University Press,1997.
Eggertson, Thrainn, “The Economics of Institutions in TransitionEconomies”, in S.Schiavo-Campo (ed), Institutional Change and thePublic Sector in Transitional Economies, World Bank DiscussionPapers 241, Washington, D.C.: World Bank, 1994.
European Bank for Reconstruction and Development (various years),Transition Report, London: EBRD.
Gwartney, J., Lawson, R. and Block, W., Economic Freedom of theWorld: 1975-1995. Fraser Institute, Vancouver, BC., 1996.
Holmes, K., Johnson, B. and Kirkpatrick, M. eds The 1997 Index ofEconomic Freedom. The Heritage Foundation, New York, NY, 1997.
Holmes, K., Johnson, B. and Kirkpatrick, M. eds The 1998 Index ofEconomic Freedom. The Heritage Foundation, New York, NY, 1998.
International Country Risk Guide (various years), some dataavailable at the Economic Growth page from www.worldbank.org.
International Monetary Fund, Good Governance: The IMF’s Role.International Monetary Fund, Washington DC, 1997.
Karatnycky, A., Motyl, A., and B. Shor, Nations in Transit 1997:Civil Society, Democracy and Markets in East Central Europe andthe Newly Independent States, New Brunswick, TransactionPublishers, 1998.
Kaufmann, Daniel, Kraay, Aart and Pablo Zoido-Lobaton, “GovernanceMatters,” WPS 2196, Washington, D.C.: The World Bank, 1999.

26
Lin, Justin and Jeffrey Nugent, “Institutions and EconomicDevelopment”, in T.N. Srinivasan and J. Behrman (eds), Handbook ofDevelopment Economics Vol 3A, Amsterdan: North-Holland, 1995.
Messick, R. ed, World Survey of Economic Freedom: 1995-1996.Transaction Books, New Brunswick, NJ, 1996.
Moers, Luc, “How Important are Institutions for Growth inTransition Countries?” Amsterdam, Tinbergen Institute DP 99004,1999.
North, Douglass, “The Contribution of the New InstitutionalEconomics to an Understanding of the Transition Problem”, paperpresented at UNU/WIDER, Helsinki, March 1997.
Nugent, Jeffrey, “Institutions, Markets and DevelopmentalOutcomes,” in R. Picciotto and E. Wiesner (eds) Evaluation andDevelopment: The Institutional Dimension, New Brunswick:Transaction Publishers, 1998.
Olson, Mancur, “Big Bills Left on the Sidewalk: Why Some NationsAre Rich, and Others Poor”,Journal of Economic Perspectives, Vol10, No. 2, pp. 3-24, 1996.
Olson, Mancur, Sarna, Naveen and Anand Swamy, “Governance andGrowth: A Simple Hypothesis Explaining Cross-country Differencesin Productivity Growth,” College Park, mimeo, IRIS Center, 1997.
Pritchett, L., Isham, J., and Kaufmann, D. “Civil Liberties,Democracy, and the Performance of Government Projects,” World BankEconomic Review, 11 (2), 219-242, 1997.
Rodrik, Dani, “Where Did All the Growth Go? External Shocks,Social Conflicts, and Growth Collapses”, Cambridge, HarvardUniversity, mimeo, September 1997.
Solow, Robert, Learning from ‘Learning by Doing’: Lessons forEconomic Growth, Palo Alto: Stanford University Press, 1997.
Stiglitz, Joseph, “Whither Reform? Ten Years of the Transition,”presented at the World Bank Annual Conference on DevelopmentEconomics, Washington D.C.: World Bank, 1999.
Streeten, Paul, “Governance,” in M. Quibria and J. Dowling (eds)Current Issues in Economic Development. Oxford University Press,New York, NY, 1996.
Taylor, C. and D. Jodice, World Handbook of Social and PoliticalIndicators, New Haven: Yale University Press, 1993.
United Nations Development Program, Human Development Report 1995.Oxford University Press, New York:, NY, 1995.
27
World Bank, Governance: The World Bank’s Experience. World Bank,Washington DC, 1994.
World Bank, World Development Report: From Plan to Market.Washington, D.C: World Bank, 1996.
World Bank, World Development Report: The State in a ChangingWorld. World Bank, Washington DC, 1997.
World Bank (various issues) Social Indicators of Development.World Bank, Washington DC.
World Bank (WDI CD ROM) World Development Indicators, World Bank,Washington DC, 1999.
28
Table 1.Variables description
----------------------------------------------------------------------------- Abbreviation Variable Source ----------------------------------------------------------------------------- CIS Dummy variable for country
belonging to the Commonwealthof Independent States (O if not)
GDPGROW Growth of per capita GDP WDI CD-ROM 1999 (annual, %)
GDPPCPPP Level of per capita GDP WDI CD-ROM 1999(constant 1995 US$).
E0FEM Life expectancy at birth, female. WDI CD-ROM 1999
E0MALE Life expectancy at birth, male. WDI CD-ROM 1999
E0TOT Life expectancy at birth, total. WDI CD-ROM 1999
SEPRIM Gross primary school enrolment WDI CD-ROM 1999rate.
SEPRFEM Gross female primary school WDI CD-ROM 1999enrolment rate.
SESEC Gross secondary school enrolment WDI CD-ROM 1999rate.
SESECFEM Gross female secondary school WDI CD-ROM 1999enrolment rate.
SETER Gross tertiary school WDI CD-ROM 1999enrolment rate.
CIVSOC Strength of civil society. Author’s calculations(see text)
BUROQUAL Quality of the burocracy. Author’s calculations(see text)
RULELAW Rule of law. Author’s calculations(see text)
TRANSACC Transparency of policy-making and Author’s calculationsaccountability of the executive. (see text)
-------------------------------------------------------------------------------
29
Table 2.Basic Statistics(Complete sample)
--------------------------------------------------------------------- Variable N Mean Std Dev Minimum Maximum --------------------------------------------------------------------- CIS 225 0.4400000 0.4974937 0 1.0000000 GDPGROW 211 -4.4013138 10.2978242 -52.3000717 11.3866186 GDPPCPPP 205 4313.17 2187.80 980.0000000 11800.00 E0FEM 203 74.2266996 2.0438013 68.1999970 78.5999985 E0MALE 203 65.7713793 2.9084015 56.5000000 71.0000000 E0TOT 203 69.8959247 2.3054936 62.2072983 74.7072983 SEPRIM 169 96.1751479 8.7545823 76.0000000 122.0000000 SEPRFEM 152 95.8177631 8.9621582 76.0000000 129.0000000 SESEC 168 85.7886906 12.1950831 37.5000000 126.3000031 SESECFEM 152 85.8177634 12.9917502 37.7999992 130.3999939 SETER 178 27.4146068 11.0321824 6.9000001 56.5999985 CIVSOC 225 4.2000000 3.1755046 0 10.0000000 BUROQUAL 225 2.3227778 1.6056361 0.8333333 8.3333333 RULELAW 225 5.6600000 2.4919274 2.0000000 10.0000000 TRANSACC 225 6.7126667 1.7502314 3.0000000 9.5000000 ---------------------------------------------------------------------
Table 2a.Basic Statistics
(Central and Eastern Europe sample) --------------------------------------------------------------------- Variable N Mean Std Dev Minimum Maximum --------------------------------------------------------------------- GDPGROW 117 -2.2033168 8.9758212 -34.8590050 11.3866186 GDPPCPPP 113 5164.87 2377.83 1490.00 11800.00 E0FEM 122 74.9263936 1.7052437 69.6999970 78.5999985 E0MALE 122 66.7231148 2.4911604 60.7000008 71.0000000 E0TOT 122 70.7247122 1.9003716 65.6537018 74.7072983 SEPRIM 103 96.4378641 6.3904206 81.5000000 111.9000015 SEPRFEM 98 95.5489796 6.3499209 80.9000015 110.0000000 SEShEC 103 83.1514564 13.8758916 37.5000000 126.3000031 SESECFEM 96 83.8500005 14.8489730 37.7999992 130.3999939 SETER 99 23.5909093 8.0525328 6.9000001 45.2000008 CIVSOC 126 5.5158730 3.1514673 0 10.0000000 BUROQUAL 126 3.1431878 1.6976577 0.8333333 8.3333333 RULELAW 126 6.9761905 2.3335766 2.0000000 10.0000000 TRANSACC 126 7.9412698 0.9362068 4.5000000 9.5000000 ---------------------------------------------------------------------
Table 2b.Basic Statistics
(Commonwealth of Independent States sample) --------------------------------------------------------------------- Variable N Mean Std Dev Minimum Maximum --------------------------------------------------------------------- GDPGROW 94 -7.1371187 11.1948057 -52.3000717 11.0000000 GDPPCPPP 92 3267.07 1328.20 980.0000000 6230.00 E0FEM 81 73.1728395 2.0683338 68.1999970 77.3000031 E0MALE 81 64.3379010 2.9172217 56.5000000 70.3000031 E0TOT 81 68.6476275 2.3094683 62.2072983 73.7145996 SEPRIM 66 95.7651514 11.5641020 76.0000000 122.0000000 SEPRFEM 54 96.3055554 12.4364409 76.0000000 129.0000000 SESEC 65 89.9676923 7.2301475 74.0000000 102.0000000 SESECFEM 56 89.1910712 8.0124057 71.0000000 102.0000000 SETER 79 32.2063290 12.3654432 11.6999998 56.5999985 CIVSOC 99 2.5252525 2.3067440 0 6.6666667 BUROQUAL 99 1.2786195 0.4998812 0.8333333 2.7500000 RULELAW 99 3.9848485 1.4783876 2.0000000 7.0000000 TRANSACC 99 5.1489899 1.2137179 3.0000000 8.0000000 ---------------------------------------------------------------------
30
Table 3.Spearman Correlation Coefficients
(Complete sample, N = 225)
BUROQUAL RULELAW TRANSACC CIS
CIVSOC 0.61829 0.69072 0.72986 -0.46502 0.0001 0.0001 0.0001 0.0001
BUROQUAL 0.62007 0.69088 -0.64554 0.0001 0.0001 0.0001
RULELAW 0.67855 -0.55219 0.0001 0.0001
TRANSACC -0.77525 0.0001
Table 3a.Spearman Correlation Coefficients
(Central and Eastern Europe sample, N = 126)
BUROQUAL RULELAW TRANSACC
CIVSOC 0.45940 0.76578 0.69318 0.0001 0.0001 0.0001
BUROQUAL 0.32431 0.51591 0.0002 0.0001
RULELAW 0.59755 0.0001
Table 3b.Spearman Correlation Coefficients
(Commonwealth of Independent States sample, N = 99)
BUROQUAL RULELAW TRANSACC
CIVSOC 0.42326 0.26779 0.69408 0.0001 0.0074 0.0001
BUROQUAL 0.44405 0.16831 0.0001 0.0958
RULELAW 0.39196 0.0001
31
Table 4.Ordinary Least Squares Regressions
Dependent Variable: GDPPCPPP(Intercept and time dummies not shown)
-------------------------------------------------------------------------------Complete sample
Parameter Standard T for H0: Variable DF Estimate Error Parameter=0 Prob > |T|
CIVSOC 1 240.961680 77.64116403 3.104 0.0022 BUROQUAL 1 210.207119 92.89991186 2.263 0.0248 RULELAW 1 413.053699 77.86702329 5.305 0.0001 TRANSACC 1 -126.978467 115.26027889 -1.102 0.2720
Root MSE 1583.88104 R-square 0.5067 Dep Mean 4313.17073 Adj R-sq 0.4759 C.V. 36.72196
-------------------------------------------------------------------------------Central and Eastern Europe sample
Parameter Standard T for H0: Variable DF Estimate Error Parameter=0 Prob > |T| CIVSOC 1 316.585112 155.94767335 2.030 0.0450 BUROQUAL 1 164.747273 130.63032065 1.261 0.2102 RULELAW 1 422.075825 141.36568851 2.986 0.0036 TRANSACC 1 141.816235 302.23976611 0.469 0.6399
Root MSE 1933.60230 R-square 0.4096 Dep Mean 5164.86726 Adj R-sq 0.3387 C.V. 37.43760
-------------------------------------------------------------------------------Commonwealth of Independent States sample
Parameter Standard T for H0: Variable DF Estimate Error Parameter=0 Prob > |T| CIVSOC 1 27.067688 75.42170508 0.359 0.7206 BUROQUAL 1 1152.302916 264.79306131 4.352 0.0001 RULELAW 1 356.652378 93.35148601 3.821 0.0003 TRANSACC 1 160.263935 134.98596113 1.187 0.2387
Root MSE 892.28492 R-square 0.6082 Dep Mean 3267.06522 Adj R-sq 0.5487 C.V. 27.31151
-------------------------------------------------------------------------------

32
Table 5.Ordinary Least Squares Regressions
Dependent Variable: GDPGROW(Intercept and time dummies not shown)
-------------------------------------------------------------------------------Complete sample
Parameter Standard T for H0: Variable DF Estimate Error Parameter=0 Prob > |T| CIVSOC 1 0.368824 0.39258362 0.939 0.3486 BUROQUAL 1 0.459084 0.48010794 0.956 0.3401 RULELAW 1 0.807679 0.39043671 2.069 0.0399 TRANSACC 1 -0.174854 0.56614734 -0.309 0.7578
Root MSE 8.10070 R-square 0.4166 Dep Mean -4.40131 Adj R-sq 0.3812 C.V. -184.05181
-------------------------------------------------------------------------------Central and Eastern Europe sample
Parameter Standard T for H0: Variable DF Estimate Error Parameter=0 Prob > |T| CIVSOC 1 0.174485 0.54222789 0.322 0.7483 BUROQUAL 1 0.317669 0.46590716 0.682 0.4969 RULELAW 1 0.415261 0.48029448 0.865 0.3892 TRANSACC 1 0.771568 1.05465538 0.732 0.4661
Root MSE 6.96615 R-square 0.4600 Dep Mean -2.20332 Adj R-sq 0.3977 C.V. -316.16644
-------------------------------------------------------------------------------Commonwealth of Independent States sample
Parameter Standard T for H0: Variable DF Estimate Error Parameter=0 Prob > |T| CIVSOC 1 2.092719 0.63334424 3.304 0.0014 BUROQUAL 1 -2.396760 2.16518563 -1.107 0.2716 RULELAW 1 2.947646 0.75792461 3.889 0.0002 TRANSACC 1 -4.473516 1.10853564 -4.036 0.0001
Root MSE 7.52697 R-square 0.6063 Dep Mean -7.13712 Adj R-sq 0.5479 C.V. -105.46230
-------------------------------------------------------------------------------
33
Table 6.Ordinary Least Squares Regressions
Dependent Variable: E0TOT(Intercept and time dummies not shown)
-------------------------------------------------------------------------------Complete sample
Parameter Standard T for H0: Variable DF Estimate Error Parameter=0 Prob > |T| CIVSOC 1 0.117811 0.10159741 1.160 0.2477 BUROQUAL 1 0.435482 0.11793846 3.692 0.0003 RULELAW 1 0.049970 0.09804333 0.510 0.6109 TRANSACC 1 0.102834 0.13901708 0.740 0.4604
Root MSE 2.06734 R-square 0.2437 Dep Mean 69.89592 Adj R-sq 0.1959 C.V. 2.95774
-------------------------------------------------------------------------------Central and Eastern Europe sample
Parameter Standard T for H0: Variable DF Estimate Error Parameter=0 Prob > |T| CIVSOC 1 -0.082889 0.13101175 -0.633 0.5283 BUROQUAL 1 0.459984 0.11534914 3.988 0.0001 RULELAW 1 0.227293 0.11690799 1.944 0.0544 TRANSACC 1 -0.691499 0.26032716 -2.656 0.0091
Root MSE 1.79167 R-square 0.1993 Dep Mean 70.72471 Adj R-sq 0.1111 C.V. 2.53330
-------------------------------------------------------------------------------Commonwealth of Independent States sample
Parameter Standard T for H0: Variable DF Estimate Error Parameter=0 Prob > |T| CIVSOC 1 0.145335 0.20150826 0.721 0.4732 BUROQUAL 1 -0.371514 0.71038103 -0.523 0.6027 RULELAW 1 -0.414527 0.22898403 -1.810 0.0747 TRANSACC 1 -0.048291 0.31667961 -0.152 0.8793
Root MSE 2.23222 R-square 0.2059 Dep Mean 68.64763 Adj R-sq 0.0658 C.V. 3.25171
-------------------------------------------------------------------------------
34
Table 7.Ordinary Least Squares Regressions
Dependent Variable: SESEC(Intercept and time dummies not shown)
-------------------------------------------------------------------------------Complete sample
Parameter Standard T for H0: Variable DF Estimate Error Parameter=0 Prob > |T| CIVSOC 1 2.026678 0.55497133 3.652 0.0004 BUROQUAL 1 -2.826511 0.68336776 -4.136 0.0001 RULELAW 1 1.679961 0.54337700 3.092 0.0024 TRANSACC 1 -3.353159 0.77717650 -4.315 0.0001
Root MSE 10.51511 R-square 0.3055 Dep Mean 85.78869 Adj R-sq 0.2565 C.V. 12.25699
-------------------------------------------------------------------------------Central and Eastern Europe sample
Parameter Standard T for H0: Variable DF Estimate Error Parameter=0 Prob > |T| CIVSOC 1 2.377112 0.94515306 2.515 0.0137 BUROQUAL 1 -3.428571 0.89636168 -3.825 0.0002 RULELAW 1 1.797077 0.81421788 2.207 0.0298 TRANSACC 1 2.820369 2.07823949 1.357 0.1781
Root MSE 11.92846 R-square 0.3407 Dep Mean 83.15146 Adj R-sq 0.2610 C.V. 14.34546
-------------------------------------------------------------------------------Commonwealth of Independent States sample
Parameter Standard T for H0: Variable DF Estimate Error Parameter=0 Prob > |T| CIVSOC 1 0.824202 0.47309343 1.742 0.0873 BUROQUAL 1 2.320143 1.73358869 1.338 0.1865 RULELAW 1 -0.044004 0.59808758 -0.074 0.9416 TRANSACC 1 -1.735857 0.93720034 -1.852 0.0696
Root MSE 4.88173 R-square 0.6225 Dep Mean 89.96769 Adj R-sq 0.5441 C.V. 5.42609
-------------------------------------------------------------------------------
35
Table 8.Ordinary Least Squares Regressions with Interaction Terms
Dependent Variable: GDPPCPPP(Intercept and time dummies not shown)
-------------------------------------------------------------------------------Complete sample
Parameter Standard T for H0: Variable DF Estimate Error Parameter=0 Prob > |T| CIVSOC 1 206.607154 279.98459566 0.738 0.4615 BUROQUAL 1 -745.781867 716.92897595 -1.040 0.2996 RULELAW 1 72.376273 404.76903844 0.179 0.8583 TRANSACC 1 27.954527 335.55211497 0.083 0.9337 CS_BQ 1 51.057937 57.33713289 0.890 0.3744 CS_RL 1 69.362877 35.93373928 1.930 0.0551 CS_TR 1 -82.238853 53.73965266 -1.530 0.1276 BQ_RL 1 -9.542072 62.56565209 -0.153 0.8789 BQ_TR 1 85.761578 110.93147244 0.773 0.4404 RL_TR 1 11.885049 74.33617181 0.160 0.8731
Root MSE 1539.28986 R-square 0.5487 Dep Mean 4313.17073 Adj R-sq 0.5050 C.V. 35.68813-------------------------------------------------------------------------------
Central and Eastern Europe sample
Parameter Standard T for H0: Variable DF Estimate Error Parameter=0 Prob > |T| CIVSOC 1 1372.674337 915.58889753 1.499 0.1372 BUROQUAL 1 -4639.951928 1418.3748137 -3.271 0.0015 RULELAW 1 224.245353 1015.6415428 0.221 0.8257 TRANSACC 1 -436.190872 886.28884379 -0.492 0.6238 CS_BQ 1 -22.687917 83.31885992 -0.272 0.7860 CS_RL 1 114.021395 53.22280066 2.142 0.0347 CS_TR 1 -227.721595 127.13780872 -1.791 0.0765 BQ_RL 1 -12.780232 91.01278167 -0.140 0.8886 BQ_TR 1 615.397955 202.32368292 3.042 0.0030 RL_TR 1 -42.317376 158.11101698 -0.268 0.7896
Root MSE 1824.75678 R-square 0.5057 Dep Mean 5164.86726 Adj R-sq 0.4111 C.V. 35.33018-------------------------------------------------------------------------------
Commonwealth of Independent States sample
Parameter Standard T for H0: Variable DF Estimate Error Parameter=0 Prob > |T| CIVSOC 1 -452.895607 382.93118086 -1.183 0.2408 BUROQUAL 1 5254.212184 1171.1472703 4.486 0.0001 RULELAW 1 -468.920642 423.80782953 -1.106 0.2722 TRANSACC 1 163.736318 506.49678825 0.323 0.7474 CS_BQ 1 191.972019 131.22410526 1.463 0.1478 CS_RL 1 34.722242 44.50601864 0.780 0.4378 CS_TR 1 1.627993 55.35947917 0.029 0.9766 BQ_RL 1 -458.742653 301.96176679 -1.519 0.1330 BQ_TR 1 -531.473809 276.01717013 -1.926 0.0581 RL_TR 1 186.589566 82.53558230 2.261 0.0268
Root MSE 804.70311 R-square 0.7055 Dep Mean 3267.06522 Adj R-sq 0.6329 C.V. 24.63076
-------------------------------------------------------------------------------
36
Table 9.Ordinary Least Squares Regressions with Interaction Terms
Dependent Variable: GDPGROW(Intercept and time dummies not shown)
-------------------------------------------------------------------------------Complete sample
Parameter Standard T for H0: Variable DF Estimate Error Parameter=0 Prob > |T| CIVSOC 1 1.627397 1.43660416 1.133 0.2587 BUROQUAL 1 -1.704105 3.73886308 -0.456 0.6491 RULELAW 1 -0.032785 2.04271691 -0.016 0.9872 TRANSACC 1 -2.994037 1.54478141 -1.938 0.0541 CS_BQ 1 0.488779 0.29916871 1.634 0.1039 CS_RL 1 -0.178825 0.18850139 -0.949 0.3440 CS_TR 1 -0.194963 0.27525119 -0.708 0.4796 BQ_RL 1 -0.794963 0.34236056 -2.322 0.0213 BQ_TR 1 0.571126 0.62566211 0.913 0.3625 RL_TR 1 0.502112 0.37220858 1.349 0.1789
Root MSE 8.04395 R-square 0.4421 Dep Mean -4.40131 Adj R-sq 0.3898 C.V. -182.76242-------------------------------------------------------------------------------
Central and Eastern Europe sample
Parameter Standard T for H0: Variable DF Estimate Error Parameter=0 Prob > |T| CIVSOC 1 7.765683 3.23820953 2.398 0.0184 BUROQUAL 1 -0.407505 5.22462917 -0.078 0.9380 RULELAW 1 -10.823937 3.68699461 -2.936 0.0041 TRANSACC 1 -7.192029 3.05174037 -2.357 0.0204 CS_BQ 1 0.762174 0.29964632 2.544 0.0125 CS_RL 1 -0.350388 0.19568747 -1.791 0.0765 CS_TR 1 -0.967809 0.44885743 -2.156 0.0335 BQ_RL 1 -0.691493 0.34103421 -2.028 0.0453 BQ_TR 1 0.053790 0.77904298 0.069 0.9451 RL_TR 1 1.968291 0.56710596 3.471 0.0008
Root MSE 6.70112 R-square 0.5291 Dep Mean -2.20332 Adj R-sq 0.4426 C.V. -304.13790-------------------------------------------------------------------------------
Commonwealth of Independent States sample
Parameter Standard T for H0: Variable DF Estimate Error Parameter=0 Prob > |T| CIVSOC 1 7.716033 3.47030349 2.223 0.0292 BUROQUAL 1 -0.122034 10.57792863 -0.012 0.9908 RULELAW 1 6.307698 3.60832986 1.748 0.0845 TRANSACC 1 -13.887164 4.59609468 -3.022 0.0034 CS_BQ 1 -0.754559 1.17152745 -0.644 0.5215 CS_RL 1 -0.191328 0.40189785 -0.476 0.6354 CS_TR 1 -0.726640 0.49493368 -1.468 0.1462 BQ_RL 1 -6.439742 2.68678657 -2.397 0.0190 BQ_TR 1 5.669569 2.51894901 2.251 0.0273 RL_TR 1 0.821198 0.73649432 1.115 0.2684
Root MSE 7.35158 R-square 0.6522 Dep Mean -7.13712 Adj R-sq 0.5688 C.V. -103.00493
-------------------------------------------------------------------------------
37
Table 10.Ordinary Least Squares Regressions with Interaction Terms
Dependent Variable: E0TOT(Intercept and time dummies not shown)
-------------------------------------------------------------------------------Complete sample
Parameter Standard T for H0: Variable DF Estimate Error Parameter=0 Prob > |T| CIVSOC 1 0.845543 0.38747624 2.182 0.0304 BUROQUAL 1 -0.662311 0.96019058 -0.690 0.4912 RULELAW 1 -0.270780 0.49658879 -0.545 0.5862 TRANSACC 1 0.020864 0.36839227 0.057 0.9549 CS_BQ 1 0.062326 0.06418030 0.971 0.3328 CS_RL 1 0.071716 0.03508033 2.044 0.0423 CS_TR 1 -0.192074 0.06677313 -2.877 0.0045 BQ_RL 1 -0.112732 0.08007834 -1.408 0.1609 BQ_TR 1 0.192005 0.13369687 1.436 0.1527 RL_TR 1 0.055864 0.08518144 0.656 0.5128
Root MSE 2.04819 R-square 0.2811 Dep Mean 69.89592 Adj R-sq 0.2108 C.V. 2.93035-------------------------------------------------------------------------------
Central and Eastern Europe sample
Parameter Standard T for H0: Variable DF Estimate Error Parameter=0 Prob > |T| CIVSOC 1 1.624792 0.80527259 2.018 0.0462 BUROQUAL 1 -1.818506 1.27881495 -1.422 0.1580 RULELAW 1 -1.211079 0.89051982 -1.360 0.1768 TRANSACC 1 -2.000704 0.76575367 -2.613 0.0103 CS_BQ 1 0.110003 0.06439515 1.708 0.0906 CS_RL 1 0.074731 0.03524245 2.120 0.0364 CS_TR 1 -0.334379 0.10592440 -3.157 0.0021 BQ_RL 1 -0.232918 0.07817691 -2.979 0.0036 BQ_TR 1 0.401537 0.17203433 2.334 0.0215 RL_TR 1 0.242268 0.13295301 1.822 0.0713
Root MSE 1.69755 R-square 0.3208 Dep Mean 70.72471 Adj R-sq 0.2021 C.V. 2.40022 -------------------------------------------------------------------------------
Commonwealth of Independent States sample
Parameter Standard T for H0: Variable DF Estimate Error Parameter=0 Prob > |T| CIVSOC 1 0.401742 1.13676677 0.353 0.7250 BUROQUAL 1 -1.583893 3.04325697 -0.520 0.6046 RULELAW 1 1.340484 1.03186075 1.299 0.1987 TRANSACC 1 3.185208 1.23577301 2.578 0.0123 CS_BQ 1 0.263518 0.38215273 0.690 0.4930 CS_RL 1 -0.019031 0.11483952 -0.166 0.8689 CS_TR 1 -0.050790 0.14746114 -0.344 0.7317 BQ_RL 1 0.884135 0.73307224 1.206 0.2324 BQ_TR 1 -0.868490 0.72173219 -1.203 0.2334 RL_TR 1 -0.465058 0.20774770 -2.239 0.0288
Root MSE 2.03652 R-square 0.3974 Dep Mean 68.64763 Adj R-sq 0.2224 C.V. 2.96663
-------------------------------------------------------------------------------
38
Table 11.Ordinary Least Squares Regressions with Interaction Terms
Dependent Variable: SESEC(Intercept and time dummies not shown)
-------------------------------------------------------------------------------Complete sample
Parameter Standard T for H0: Variable DF Estimate Error Parameter=0 Prob > |T| CIVSOC 1 2.533181 1.88237652 1.346 0.1804 BUROQUAL 1 -9.179177 5.21939174 -1.759 0.0807 RULELAW 1 -7.366038 2.95473279 -2.493 0.0138 TRANSACC 1 -8.374211 1.94960503 -4.295 0.0001 CS_BQ 1 0.893582 0.29040893 3.077 0.0025 CS_RL 1 -0.139857 0.16670925 -0.839 0.4028 CS_TR 1 -0.403442 0.33274220 -1.212 0.2272 BQ_RL 1 -0.193849 0.39687678 -0.488 0.6260 BQ_TR 1 0.339095 0.68994875 0.491 0.6238 RL_TR 1 1.436430 0.47476691 3.026 0.0029
Root MSE 9.19882 R-square 0.4889 Dep Mean 85.78869 Adj R-sq 0.4310 C.V. 10.72265-------------------------------------------------------------------------------
Central and Eastern Europe sample
Parameter Standard T for H0: Variable DF Estimate Error Parameter=0 Prob > |T| CIVSOC 1 0.054826 5.97750838 0.009 0.9927 BUROQUAL 1 -16.320885 11.61949208 -1.405 0.1638 RULELAW 1 -4.707140 8.65088050 -0.544 0.5878 TRANSACC 1 -6.855584 5.26668682 -1.302 0.1965 CS_BQ 1 0.765097 0.41475368 1.845 0.0686 CS_RL 1 -0.068653 0.22477216 -0.305 0.7608 CS_TR 1 -0.014088 0.79666740 -0.018 0.9859 BQ_RL 1 -0.159851 0.52346667 -0.305 0.7608 BQ_TR 1 1.176155 1.50502126 0.781 0.4367 RL_TR 1 1.002874 1.19510617 0.839 0.4037
Root MSE 10.76488 R-square 0.4984 Dep Mean 83.15146 Adj R-sq 0.3981 C.V. 12.94611-------------------------------------------------------------------------------
Commonwealth of Independent States sample
Parameter Standard T for H0: Variable DF Estimate Error Parameter=0 Prob > |T| CIVSOC 1 -1.140769 2.82984695 -0.403 0.6887 BUROQUAL 1 14.675893 13.86464119 1.059 0.2952 RULELAW 1 2.133720 5.23926280 0.407 0.6857 TRANSACC 1 -4.684670 4.22153515 -1.110 0.2728 CS_BQ 1 1.585933 0.92593979 1.713 0.0933 CS_RL 1 -0.123204 0.32995876 -0.373 0.7105 CS_TR 1 0.030179 0.42974955 0.070 0.9443 BQ_RL 1 -4.727513 3.43271010 -1.377 0.1750 BQ_TR 1 0.389957 2.12946305 0.183 0.8555 RL_TR 1 0.503983 0.76832447 0.656 0.5151
Root MSE 4.82422 R-square 0.6731 Dep Mean 89.96769 Adj R-sq 0.5548 C.V. 5.36217-------------------------------------------------------------------------------