content validity to support the use of a computer-based phonological awareness screening and...
TRANSCRIPT

Full Terms & Conditions of access and use can be found athttp://www.tandfonline.com/action/journalInformation?journalCode=iasl20
Download by: [Flinders University of South Australia] Date: 24 November 2015, At: 02:46
International Journal of Speech-Language Pathology
ISSN: 1754-9507 (Print) 1754-9515 (Online) Journal homepage: http://www.tandfonline.com/loi/iasl20
Content validity to support the use of a computer-based phonological awareness screening andmonitoring assessment (Com-PASMA) in theclassroom
Karyn Carson, Therese Boustead & Gail Gillon
To cite this article: Karyn Carson, Therese Boustead & Gail Gillon (2015) Content validity tosupport the use of a computer-based phonological awareness screening and monitoringassessment (Com-PASMA) in the classroom, International Journal of Speech-LanguagePathology, 17:5, 500-510, DOI: 10.3109/17549507.2015.1016107
To link to this article: http://dx.doi.org/10.3109/17549507.2015.1016107
View supplementary material
Published online: 12 Mar 2015.
Submit your article to this journal
Article views: 54
View related articles
View Crossmark data

reading capabilities, while 24% of students fail to perform at an average reading level (Mullis et al., 2012). In some states, Australian educators can expect as many as one in three children to struggle to meet basic literacy standards after 1 year of schooling (DECD, 2012). Wide gaps in reading per-formance among children in the early school years appears to be a prevailing theme among developed countries (Australian Government, 2011; UNICEF, 2010), with particular groups of children, such as those with spoken language impairment, often being over-represented as bottom-end readers (Catts, Fey, Zhang, & Tomblin, 2001). Identifi cation of risk for reading diffi culties from school-entry through the use of highly predictive tools that are easily accessible and are able to differentiate between high- and low-ability students through adequate levels of content validity, may be one way in which educators can minimize or close gaps in reading performance in the early schooling years.
Introduction
Modern day educators are faced with the challenge of providing high-quality instruction suitably dif-ferentiated to meet the learning needs of an increas-ingly diverse population of students (Bender, 2012). In the area of reading acquisition, this diversity is well documented throughout international studies of reading achievement such as the Progress in International Reading Literacy Study (PIRLS) and the Program for International Student Assessment (PISA). For example, in New Zealand educators are confronted with an ongoing “ long tail ” of under-achievement in reading performance, where 14% of 10-year-old students perform at an advanced read-ing level and 25% of students fail to reach an aver-age reading level (Mullis, Martin, Foy, & Drucker, 2012). It is estimated that up to one in fi ve children in New Zealand classrooms struggle with reading development (Nicholson, 2009). In Australia, up to 10% of 10-year-old students show advanced
Correspondence: Dr Karyn Carson, School of Education, Faculty of Education, Humanities, and Law, Flinders University, GPO Box 2100, Adelaide 5001, South Australia. Email: karyn.carson@fl inders.edu.au
International Journal of Speech-Language Pathology, 2015; 17(5): 500–510
ISSN 1754-9507 print/ISSN 1754-9515 online © 2015 The Speech Pathology Association of Australia LimitedPublished by Informa UK, Ltd.DOI: 10.3109/17549507.2015.1016107
Content validity to support the use of a computer-based phonological awareness screening and monitoring assessment (Com-PASMA) in the classroom
KARYN CARSON 1 , THERESE BOUSTEAD 2 & GAIL GILLON 2
1 Flinders University, Adelaide, South Australia, and 2 University of Canterbury, Christchurch, New Zealand
Abstract Purpose . This study investigated the content validity of a computer-based phonological awareness (PA) screening and moni-toring assessment (Com-PASMA) designed to evaluate school-entry PA abilities. Establishing content validity by con-fi rming that test items suitably ‘ fi t ’ and sample a spectrum of diffi culty levels is critical for ensuring educators can deduce accurate information to comprehensively differentiate curricular reading instruction. Method . Ninety-fi ve children, inclusive of 21 children with spoken language impairment, participated in a 1-year longitudi-nal study whereby the Com-PASMA was administered at the start, middle and end of the school year. Result . Estimates of content validity using Rasch Model analysis demonstrated that: (1) rhyme oddity and initial phoneme identity tasks were most appropriate at school-entry and sampled a spectrum of diffi culty levels, (2) more challenging pho-neme level tasks (e.g. fi nal phoneme identity, phoneme blending, phoneme deletion and phoneme segmentation) became increasingly appropriate and differentiated between high- and low-ability students by the middle and end of the fi rst year of school and (3) letter-knowledge tasks were appropriate but declined in their ability to differentiate student ability as the year progressed. Conclusion . Findings demonstrate that the Com-PASMA has suffi cient content validity to measure and differentiate between the PA abilities of 5-year-old children on entry to school.
Keywords: Phonological awareness , classroom assessment , reading development , content validity , computer-based assessment
Dow
nloa
ded
by [
Flin
ders
Uni
vers
ity o
f So
uth
Aus
tral
ia]
at 0
2:46
24
Nov
embe
r 20
15
Computer-based phonological awareness assessment 501
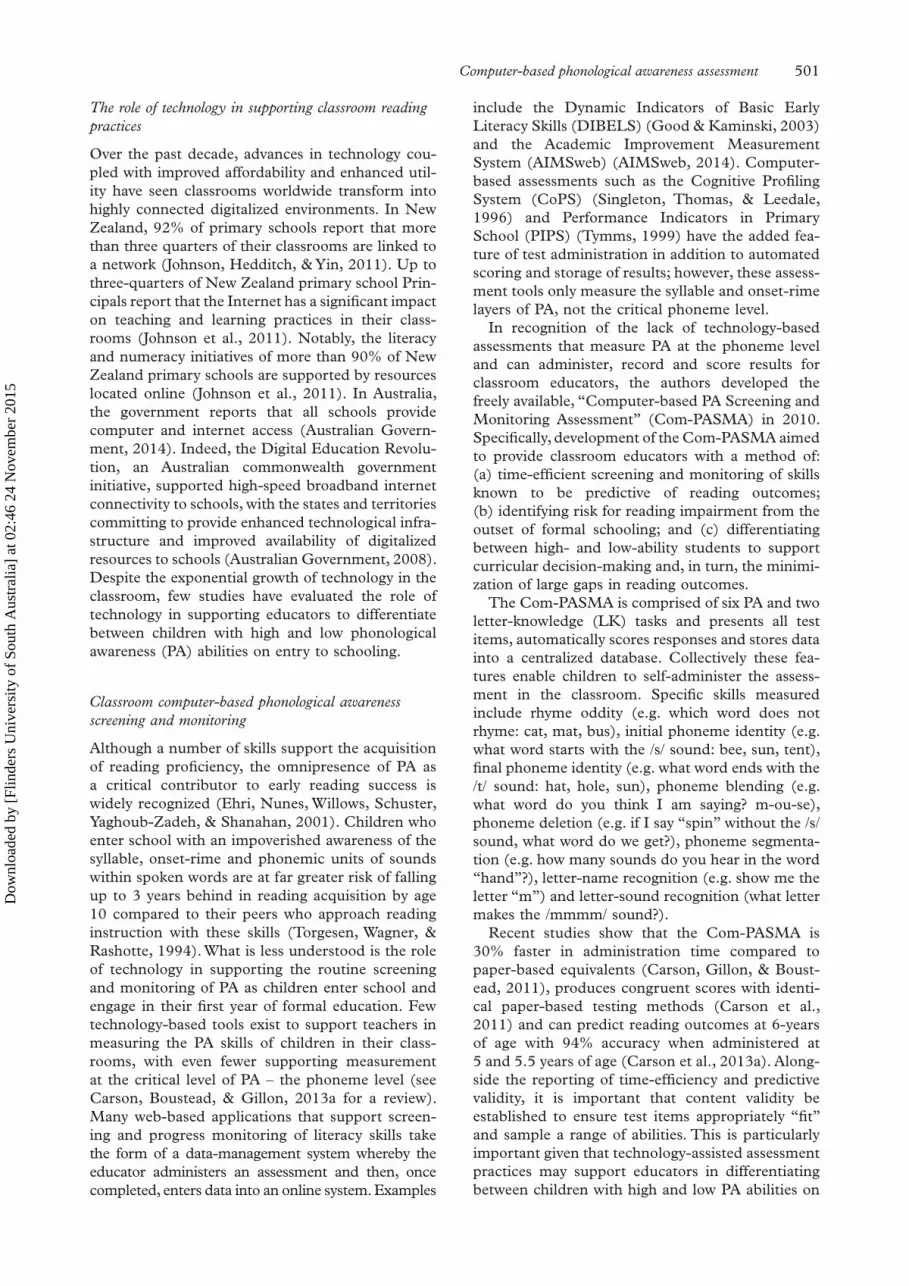
The role of technology in supporting classroom reading practices
Over the past decade, advances in technology cou-pled with improved affordability and enhanced util-ity have seen classrooms worldwide transform into highly connected digitalized environments. In New Zealand, 92% of primary schools report that more than three quarters of their classrooms are linked to a network (Johnson, Hedditch, & Yin, 2011). Up to three-quarters of New Zealand primary school Prin-cipals report that the Internet has a signifi cant impact on teaching and learning practices in their class-rooms (Johnson et al., 2011). Notably, the literacy and numeracy initiatives of more than 90% of New Zealand primary schools are supported by resources located online (Johnson et al., 2011). In Australia, the government reports that all schools provide computer and internet access (Australian Govern-ment, 2014). Indeed, the Digital Education Revolu-tion, an Australian commonwealth government initiative, supported high-speed broadband internet connectivity to schools, with the states and territories committing to provide enhanced technological infra-structure and improved availability of digitalized resources to schools (Australian Government, 2008). Despite the exponential growth of technology in the classroom, few studies have evaluated the role of technology in supporting educators to differentiate between children with high and low phonological awareness (PA) abilities on entry to schooling.
Classroom computer-based phonological awareness screening and monitoring
Although a number of skills support the acquisition of reading profi ciency, the omnipresence of PA as a critical contributor to early reading success is widely recognized (Ehri, Nunes, Willows, Schuster, Yaghoub-Zadeh, & Shanahan, 2001). Children who enter school with an impoverished awareness of the syllable, onset-rime and phonemic units of sounds within spoken words are at far greater risk of falling up to 3 years behind in reading acquisition by age 10 compared to their peers who approach reading instruction with these skills (Torgesen, Wagner, & Rashotte, 1994). What is less understood is the role of technology in supporting the routine screening and monitoring of PA as children enter school and engage in their fi rst year of formal education. Few technology-based tools exist to support teachers in measuring the PA skills of children in their class-rooms, with even fewer supporting measurement at the critical level of PA – the phoneme level (see Carson, Boustead, & Gillon, 2013a for a review). Many web-based applications that support screen-ing and progress monitoring of literacy skills take the form of a data-management system whereby the educator administers an assessment and then, once completed, enters data into an online system. Examples
include the Dynamic Indicators of Basic Early Literacy Skills (DIBELS) (Good & Kaminski, 2003) and the Academic Improvement Measurement System (AIMSweb) (AIMSweb, 2014). Computer-based assessments such as the Cognitive Profi ling System (CoPS) (Singleton, Thomas, & Leedale, 1996) and Performance Indicators in Primary School (PIPS) (Tymms, 1999) have the added fea-ture of test administration in addition to automated scoring and storage of results; however, these assess-ment tools only measure the syllable and onset-rime layers of PA, not the critical phoneme level.
In recognition of the lack of technology-based assessments that measure PA at the phoneme level and can administer, record and score results for classroom educators, the authors developed the freely available, “ Computer-based PA Screening and Monitoring Assessment ” (Com-PASMA) in 2010. Specifi cally, development of the Com-PASMA aimed to provide classroom educators with a method of: (a) time-effi cient screening and monitoring of skills known to be predictive of reading outcomes; (b) identifying risk for reading impairment from the outset of formal schooling; and (c) differentiating between high- and low-ability students to support curricular decision-making and, in turn, the minimi-zation of large gaps in reading outcomes.
The Com-PASMA is comprised of six PA and two letter-knowledge (LK) tasks and presents all test items, automatically scores responses and stores data into a centralized database. Collectively these fea-tures enable children to self-administer the assess-ment in the classroom. Specifi c skills measured include rhyme oddity (e.g. which word does not rhyme: cat, mat, bus), initial phoneme identity (e.g. what word starts with the /s/ sound: bee, sun, tent), fi nal phoneme identity (e.g. what word ends with the /t/ sound: hat, hole, sun), phoneme blending (e.g. what word do you think I am saying? m-ou-se), phoneme deletion (e.g. if I say “ spin ” without the /s/ sound, what word do we get?), phoneme segmenta-tion (e.g. how many sounds do you hear in the word “ hand ” ?), letter-name recognition (e.g. show me the letter “ m ” ) and letter-sound recognition (what letter makes the /mmmm/ sound?).
Recent studies show that the Com-PASMA is 30% faster in administration time compared to paper-based equivalents (Carson, Gillon, & Boust-ead, 2011), produces congruent scores with identi-cal paper-based testing methods (Carson et al., 2011) and can predict reading outcomes at 6-years of age with 94% accuracy when administered at 5 and 5.5 years of age (Carson et al., 2013a). Along-side the reporting of time-effi ciency and predictive validity, it is important that content validity be established to ensure test items appropriately “ fi t ” and sample a range of abilities. This is particularly important given that technology-assisted assessment practices may support educators in differentiating between children with high and low PA abilities on
Dow
nloa
ded
by [
Flin
ders
Uni
vers
ity o
f So
uth
Aus
tral
ia]
at 0
2:46
24
Nov
embe
r 20
15

502 K. Carson et al.
entry to school in an effort to help re-dress interna-tional issues related to widening gaps in reading achievement.
Establishing content validity of computer-based phonological awareness screening and monitoring
According to Guernsey, Levine, Chiong, and Severns (2012), the technological boom has resulted in a sig-nifi cant quantity of easy-to-download literacy-based applications claiming to support reading develop-ment with little evidence of validity, reliability, effi -cacy or effectiveness to support their claims. The purpose of the current investigation is to report the content validity of the Com-PASMA. Content valid-ity refers to the process of ensuring that test content accurately refl ects the knowledge being measured (Anastasi & Urbina, 1997). According to Lissitz and Samuelsen (2007), test items are the building blocks of any measurement tool and are, therefore, a critical source of content validity. Construction of a test with a suffi cient degree of content validity includes analysing items within a test to determine whether they are appropriate for the intended population and whether they sample a range of diffi culty to enable differentiation between high- and low-ability students (Crocker & Algina, 1986); a particularly important feature for classroom assessment, planning and the minimization of risk for future reading impairment.
A number of statistical methods can be applied to establish the content validity of an assessment tool; one of which is Rasch Model analysis (Bond & Fox, 2007). The Rasch Model is a measurement model whereby the “ fi t ” and diffi culty spectrum of test items to an intended population can be formally reviewed and was selected as the model of choice in the current investigation. This model provides a the-oretical range against which test developers can com-pare patterns of responses to determine whether items show a “ fi t ” or “ misfi t ” to the ability of test takers. Items deviating from the ideal range (i.e. showing a misfi t) require adaptation or removal from the measurement tool. The model evaluates a test item in terms of diffi culty (the item parameter) and people in terms of their ability (the person parame-ter) to score a correct or incorrect response on a particular test item. The Rasch Model is occasionally referred to as the One-Parameter Logistic Model under Item Response Theory (IRT). Despite sharing a mathematical similarity, these models differ on a conceptual level (Baker, 2001). In the Rasch Model, data must conform to the properties of the model for measurement to take place (Andrich, 2004). Items that do not conform to the model (i.e. show a model “ misfi t ” ) require careful investigation and an explanation as to why this is the case. In IRT, the importance of data-model fi t is emphasized. However, additional model parameters enable the model to adjust to refl ect the pattern of the data (Embretson & Reise, 2000).
To ensure the Com-PASMA contains satisfactory levels of content validity to support educators in accurately differentiating between children with high and low PA abilities, the following hypotheses were proposed:
(1) Test items within each task in the Com-PASMA will demonstrate an appropriate “ fi t ” to the abilities of 5-year-old children in the fi rst year of formal schooling.
(2) Test items within each task in the Com-PASMA will sample a range of diffi culty levels among 5-year-old children.
Method
Participants
The participants were 95 New Zealand children (39 boys, 56 girls) commencing their fi rst year of formal schooling and were aged between 5 years 0 months and 5 years 2 months ( M � 60.41, SD � 0.59). Of this group, 74 children presented with typical spoken language skills (TD) and 21 children presented with spoken language impair-ment (SLI). Inclusion of children with (i.e. SLI) and without risk (i.e. TD) for reading problems purposefully enabled the authors to evaluate whether test items in each task of the Com-PASMA demonstrated an appropriate “ fi t ” to the ability spectrum of the intended population and sampled a wide spectrum of diffi culty. All participants pre-sented with typical cognitive, hearing and physical development and attended a mainstream school. The participants formulated a control sample for another larger study evaluating the effectiveness of teacher-directed classroom PA instruction (see Carson, Gillon, & Boustead, 2013b).
Classifi cation of SLI and TD
To be classifi ed as having TD, children needed to score within or above the average range on the following assessments: (a) Clinical Evaluations of Language Fundamentals — Preschool, Second Edition (CELF-P2) (Wiig, Secord, & Semel, 2006) receptive and expressive language indices, where a composite score of 85 – 115 is considered the average range; (b) Preschool and Primary Inventory of PA (PIPA) (Dodd, Crosbie, McIntosh, Teitzel, & Ozanne, 2000) rhyme oddity, initial phoneme identity and letter-sound knowledge sub-tests, where a standard score of 7 – 13 is considered the average range; (c) Primary Test of Non-verbal Intelligence (PTONI) (Ehrler & McGhee, 2008), where a score of 85 – 115 is consid-ered the average range; and (d) New Zealand Artic-ulation Test (NZAT) (Ministry of Education, 2004) single consonants and consonant blends sub-tests, where a PCC above 93% for 5-year-old children is considered satisfactory (Shriberg, Austin, Lewis, McSweeny, & Wilson, 1997).
Dow
nloa
ded
by [
Flin
ders
Uni
vers
ity o
f So
uth
Aus
tral
ia]
at 0
2:46
24
Nov
embe
r 20
15
Computer-based phonological awareness assessment 503
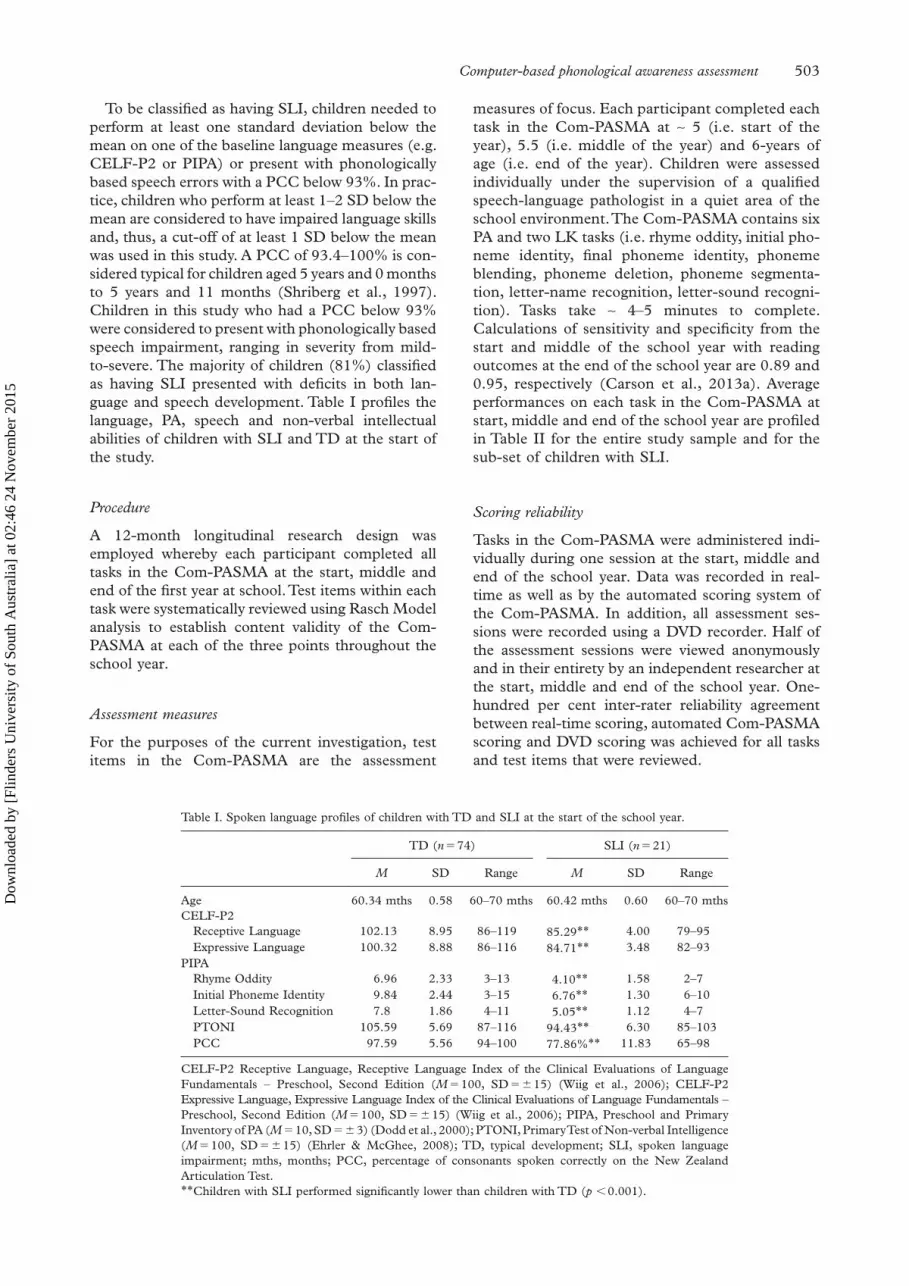
To be classifi ed as having SLI, children needed to perform at least one standard deviation below the mean on one of the baseline language measures (e.g. CELF-P2 or PIPA) or present with phonologically based speech errors with a PCC below 93%. In prac-tice, children who perform at least 1 – 2 SD below the mean are considered to have impaired language skills and, thus, a cut-off of at least 1 SD below the mean was used in this study. A PCC of 93.4 – 100% is con-sidered typical for children aged 5 years and 0 months to 5 years and 11 months (Shriberg et al., 1997). Children in this study who had a PCC below 93% were considered to present with phonologically based speech impairment, ranging in severity from mild-to-severe. The majority of children (81%) classifi ed as having SLI presented with defi cits in both lan-guage and speech development. Table I profi les the language, PA, speech and non-verbal intellectual abilities of children with SLI and TD at the start of the study.
Procedure
A 12-month longitudinal research design was employed whereby each participant completed all tasks in the Com-PASMA at the start, middle and end of the fi rst year at school. Test items within each task were systematically reviewed using Rasch Model analysis to establish content validity of the Com-PASMA at each of the three points throughout the school year.
Assessment measures
For the purposes of the current investigation, test items in the Com-PASMA are the assessment
measures of focus. Each participant completed each task in the Com-PASMA at ∼ 5 (i.e. start of the year), 5.5 (i.e. middle of the year) and 6-years of age (i.e. end of the year). Children were assessed individually under the supervision of a qualifi ed speech-language pathologist in a quiet area of the school environment. The Com-PASMA contains six PA and two LK tasks (i.e. rhyme oddity, initial pho-neme identity, fi nal phoneme identity, phoneme blending, phoneme deletion, phoneme segmenta-tion, letter-name recognition, letter-sound recogni-tion). Tasks take ∼ 4 – 5 minutes to complete. Calculations of sensitivity and specifi city from the start and middle of the school year with reading outcomes at the end of the school year are 0.89 and 0.95, respectively (Carson et al., 2013a). Average performances on each task in the Com-PASMA at start, middle and end of the school year are profi led in Table II for the entire study sample and for the sub-set of children with SLI.
Scoring reliability
Tasks in the Com-PASMA were administered indi-vidually during one session at the start, middle and end of the school year. Data was recorded in real-time as well as by the automated scoring system of the Com-PASMA. In addition, all assessment ses-sions were recorded using a DVD recorder. Half of the assessment sessions were viewed anonymously and in their entirety by an independent researcher at the start, middle and end of the school year. One-hundred per cent inter-rater reliability agreement between real-time scoring, automated Com-PASMA scoring and DVD scoring was achieved for all tasks and test items that were reviewed.
Table I. Spoken language profi les of children with TD and SLI at the start of the school year.
TD ( n � 74) SLI ( n � 21)
M SD Range M SD Range
Age 60.34 mths 0.58 60 – 70 mths 60.42 mths 0.60 60 – 70 mthsCELF-P2
Receptive Language 102.13 8.95 86 – 119 85.29 * * 4.00 79 – 95Expressive Language 100.32 8.88 86 – 116 84.71 * * 3.48 82 – 93
PIPARhyme Oddity 6.96 2.33 3 – 13 4.10 * * 1.58 2 – 7Initial Phoneme Identity 9.84 2.44 3 – 15 6.76 * * 1.30 6 – 10Letter-Sound Recognition 7.8 1.86 4 – 11 5.05 * * 1.12 4 – 7PTONI 105.59 5.69 87 – 116 94.43 * * 6.30 85 – 103PCC 97.59 5.56 94 – 100 77.86% * * 11.83 65 – 98
CELF-P2 Receptive Language, Receptive Language Index of the Clinical Evaluations of Language Fundamentals – Preschool, Second Edition ( M � 100, SD � � 15) (Wiig et al., 2006); CELF-P2 Expressive Language, Expressive Language Index of the Clinical Evaluations of Language Fundamentals – Preschool, Second Edition ( M � 100, SD � � 15) (Wiig et al., 2006); PIPA, Preschool and Primary Inventory of PA ( M � 10, SD � � 3) (Dodd et al., 2000); PTONI, Primary Test of Non-verbal Intelligence ( M � 100, SD � � 15) (Ehrler & McGhee, 2008); TD, typical development; SLI, spoken language impairment; mths, months; PCC, percentage of consonants spoken correctly on the New Zealand Articulation Test. * * Children with SLI performed signifi cantly lower than children with TD ( p � 0.001).
Dow
nloa
ded
by [
Flin
ders
Uni
vers
ity o
f So
uth
Aus
tral
ia]
at 0
2:46
24
Nov
embe
r 20
15

504 K. Carson et al.
Analysis procedure
Rasch Model analysis was conducted on the responses of the 95 children to each test item at the start, middle and end of the school year by entering responses into a software programme called Win-steps (Version 3.70) (Linacre, 2010). This analysis provided information on: (a) which test items showed a signifi cant model “ fi t ” or “ misfi t ” and (b) how the test items in each task related to each other in terms of diffi culty. Using Winsteps “ simulate data ” option, a minimum sample of 64 participants was required to achieve a confi dence interval of 95% with a � ½ logit score.
Winsteps provides several types of statistical anal-yses to evaluate test items in relation to the latent trait being measured. For the purposes of our analy-sis, the “ outfi t statistics ” of mean-square and ZSTD for each test item were used to evaluate which items showed a “ fi t ” or signifi cant model “ misfi t ” . The rel-evance of using the mean-square statistic and the ZSTD statistic are described below:
• Mean-square statistic (MNSQ) : The mean-square statistic draws attention to the accu-racy of an item by providing an indication of the size of an item ’ s “ misfi t ” to the model. An item with a mean square close to 1.0 suggests that the item is accurate. An item with a mean square less than 1.0 is considered less accu-rate, but this does not cause any real problems (Linacre, 2010, p. 23). An item with a mean square greater than 2.0 is considered inaccu-rate and in need of attention. • ZSTD statistic : A ZSTD statistic is assigned to each mean-square statistic to indicate whether the size of the “ misfi t ” is statistically signifi -cant. The ZSTD is “ standardized like a Z -score ” (Linacre, 2010, p. 25). An item with a ZSTD statistic between - 2 and � 2 indicates a statistically signifi cant model “ fi t ” .
In line with Linacre (2010), test items with a mean-square statistic greater than 2.0 and a ZSTD statistic less than - 2 and greater than � 2 were inter-preted as showing a statistically signifi cant model “ misfi t ” . Items may show a “ misfi t ” for a number of reasons, including: (1) being too easy or diffi cult, (2) confusing or ambiguous instructions or (3) lack of image quality (i.e. animated or static graphics) or heightened linguistic complexity. Items demonstrat-ing a “ misfi t ” may require adaption or deletion from the instrument (Bond & Fox, 2007).
The point-measure correlation is another outfi t statistic. It provides an indication of an item ’ s dis-crimination ability. Positive correlations above 0.3 indicate that the item is well correlated to the ability being measured. Negative correlations or correla-tions close to zero suggest there is little relationship between the item and the ability being measured. This indicates that an item does not effectively dis-tinguish between individuals with more or less abil-ity, which is cause for concern.
Results
Using Rasch Model analysis, Tables III and IV pro-fi le examples of the mean-square statistic, ZSTD statistic and point-measure correlation for test items at the start of the school year in the rhyme oddity and phoneme segmentation tasks, respectively. Rhyme oddity was considered to be the easiest PA task, as well as appropriate for 5-year-old children. Therefore, it was anticipated that the majority of rhyme oddity test items would demonstrate a model “ fi t ” and point-measure correlation above 0.3. Pho-neme segmentation, however, was considered the hardest task and, according to the literature, is chal-lenging for 5-year-old children (Adams, 1990). Hence, it was expected that a number of phoneme segmentation items would demonstrate a signifi cant model “ misfi t ” at the start of the school year.
Table II. Mean (SD) performance on the Com-PASMA at the start, middle and end of the fi rst year of school for the entire sample ( n = 95) and the sub-set of children with SLI ( n � 21).
Phonological awareness * *
School-entry (5;0 – 5;2) *
Middle of year (5;5 – 5;7) *
End of year (5;11 – 6;01) *
Entire sample
Sub-set of children with SLI
Entire sample
Sub-set of children with SLI
Entire sample
Sub-set of children with SLI
- RO 5.3 (2.5) 2.2 (0.8) 7.5 (2.5) 5.1 (2.5) 8.6 (1.8) 7.3 (1.6)- IPI 5.3 (3.0) 1.5 (0.2) 7.6 (2.6) 4.3 (2.9) 8.5 (2.3) 5.5 (2.3)- FPI 0.6 (0.7) 0.1 (0.5) 4.8 (2.9) 1.2 (1.1) 6.4 (3.1) 2.8 (2.6)- PB 1.3 (1.2) 0.8 (0.3) 8.4 (5.2) 4.0 (2.1) 11.7 (3.74) 8.0 (3.4)- PD 0.5 (0.8) 0.2 (0.3) 6.2 (4.2) 3.2 (1.3) 8.8 (3.5) 5.2 (3.0)- PS 0.6 (0.9) 0.1 (0.1) 5.9 (4.1) 3.1 (0.8) 8.0 (4.0) 5.1 (2.9)- LN 13.4 (4.6) 5.1 (2.0) 15.8 (3.2) 10.1 (2.2) 16.7 (2.5) 12.3 (3.5)- LS 11.1 (5.4) 3.4 (1.5) 14.3 (4.5) 8.9 (3.4) 15.9 (3.4) 11.4 (2.9)
* Age range (years; months); * * Tasks in the Com-PASMA where RO � rhyme oddity, IPI � initial phoneme identity, FPI � fi nal phoneme identity, PB � phoneme blending, PD � phoneme deletion, PS � phoneme segmentation; LN � letter-name recognition; LS � letter-sound recognition; numbers in brackets � standard deviations.
Dow
nloa
ded
by [
Flin
ders
Uni
vers
ity o
f So
uth
Aus
tral
ia]
at 0
2:46
24
Nov
embe
r 20
15
Computer-based phonological awareness assessment 505
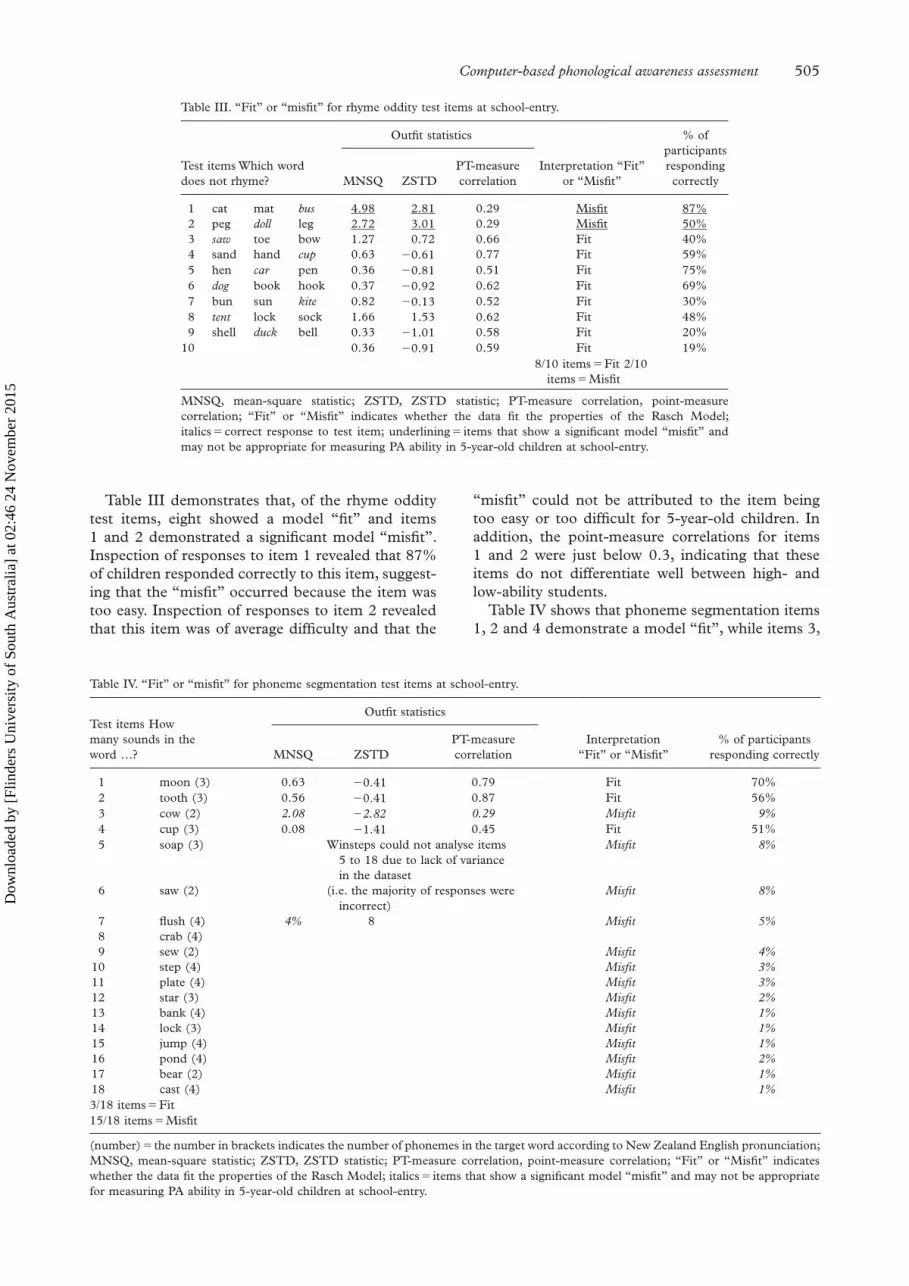
“ misfi t ” could not be attributed to the item being too easy or too diffi cult for 5-year-old children. In addition, the point-measure correlations for items 1 and 2 were just below 0.3, indicating that these items do not differentiate well between high- and low-ability students.
Table IV shows that phoneme segmentation items 1, 2 and 4 demonstrate a model “ fi t ” , while items 3,
Table III demonstrates that, of the rhyme oddity test items, eight showed a model “ fi t ” and items 1 and 2 demonstrated a signifi cant model “ misfi t ” . Inspection of responses to item 1 revealed that 87% of children responded correctly to this item, suggest-ing that the “ misfi t ” occurred because the item was too easy. Inspection of responses to item 2 revealed that this item was of average diffi culty and that the
Table III. “ Fit ” or “ misfi t ” for rhyme oddity test items at school-entry.
Test items Which word does not rhyme?
Outfi t statistics
Interpretation “ Fit ” or “ Misfi t ”
% of participants responding correctlyMNSQ ZSTD
PT-measure correlation
1 cat mat bus 4.98 2.81 0.29 Misfi t 87% 2 peg doll leg 2.72 3.01 0.29 Misfi t 50% 3 saw toe bow 1.27 0.72 0.66 Fit 40%4 sand hand cup 0.63 � 0.61 0.77 Fit 59%5 hen car pen 0.36 � 0.81 0.51 Fit 75%6 dog book hook 0.37 � 0.92 0.62 Fit 69%7 bun sun kite 0.82 � 0.13 0.52 Fit 30%8 tent lock sock 1.66 1.53 0.62 Fit 48%9 shell duck bell 0.33 � 1.01 0.58 Fit 20%
10 0.36 � 0.91 0.59 Fit 19%8/10 items � Fit 2/10
items � Misfi t
MNSQ, mean-square statistic; ZSTD, ZSTD statistic; PT-measure correlation, point-measure correlation; “ Fit ” or “ Misfi t ” indicates whether the data fi t the properties of the Rasch Model; italics � correct response to test item; underlining � items that show a signifi cant model “ misfi t ” and may not be appropriate for measuring PA ability in 5-year-old children at school-entry.
Table IV. “ Fit ” or “ misfi t ” for phoneme segmentation test items at school-entry.
Test items How many sounds in the word … ?
Outfi t statistics
Interpretation “ Fit ” or “ Misfi t ”
% of participants responding correctlyMNSQ ZSTD
PT-measure correlation
1 moon (3) 0.63 � 0.41 0.79 Fit 70%2 tooth (3) 0.56 � 0.41 0.87 Fit 56%3 cow (2) 2.08 � 2.82 0.29 Misfi t 9% 4 cup (3) 0.08 � 1.41 0.45 Fit 51%5 soap (3) Winsteps could not analyse items
5 to 18 due to lack of variance in the dataset
Misfi t 8%
6 saw (2) (i.e. the majority of responses were incorrect)
Misfi t 8%
7 fl ush (4) 4% 8 Misfi t 5% 8 crab (4)9 sew (2) Misfi t 4%
10 step (4) Misfi t 3% 11 plate (4) Misfi t 3% 12 star (3) Misfi t 2% 13 bank (4) Misfi t 1% 14 lock (3) Misfi t 1% 15 jump (4) Misfi t 1% 16 pond (4) Misfi t 2% 17 bear (2) Misfi t 1% 18 cast (4) Misfi t 1% 3/18 items � Fit15/18 items � Misfi t
(number) � the number in brackets indicates the number of phonemes in the target word according to New Zealand English pronunciation; MNSQ, mean-square statistic; ZSTD, ZSTD statistic; PT-measure correlation, point-measure correlation; “ Fit ” or “ Misfi t ” indicates whether the data fi t the properties of the Rasch Model; italics � items that show a signifi cant model “ misfi t ” and may not be appropriate for measuring PA ability in 5-year-old children at school-entry.
Dow
nloa
ded
by [
Flin
ders
Uni
vers
ity o
f So
uth
Aus
tral
ia]
at 0
2:46
24
Nov
embe
r 20
15
506 K. Carson et al.
5, 6, 7, 8, 9, 10, 11, 12, 13, 14, 15, 16, 17 and 18 demonstrate a signifi cant model “ misfi t ” . Items 1 ( “ moon ” ), 2 ( “ tooth ” ) and 4 ( “ cup ” ) were simple CVC words containing either long medial vowels, earlier developing sounds (e.g. /k/, /p/, /m/) or both. This may have increased the salience of the pho-nemes in these items, allowing 5-year-old children to segment them correctly at school-entry. Item 3 ( “ cow ” ) was thought to be easy during the construc-tion of the test. However, over 85% of children indi-cated that this item had three sounds, as opposed to two. From video observations, it was revealed that children often added a fi nal schwa phoneme when segmenting “ cow ” verbally (i.e. /ka ʊ ə /). Only 9% of children scored correctly on this item. The majority of phoneme segmentation items demonstrating a sig-nifi cant “ misfi t ” had a CCVC or CVCC syllable structure. Less than 10% of participants provided a correct response to phoneme segmentation items 5 – 18, indicating that these items showed a “ misfi t ” because they were extremely diffi cult.
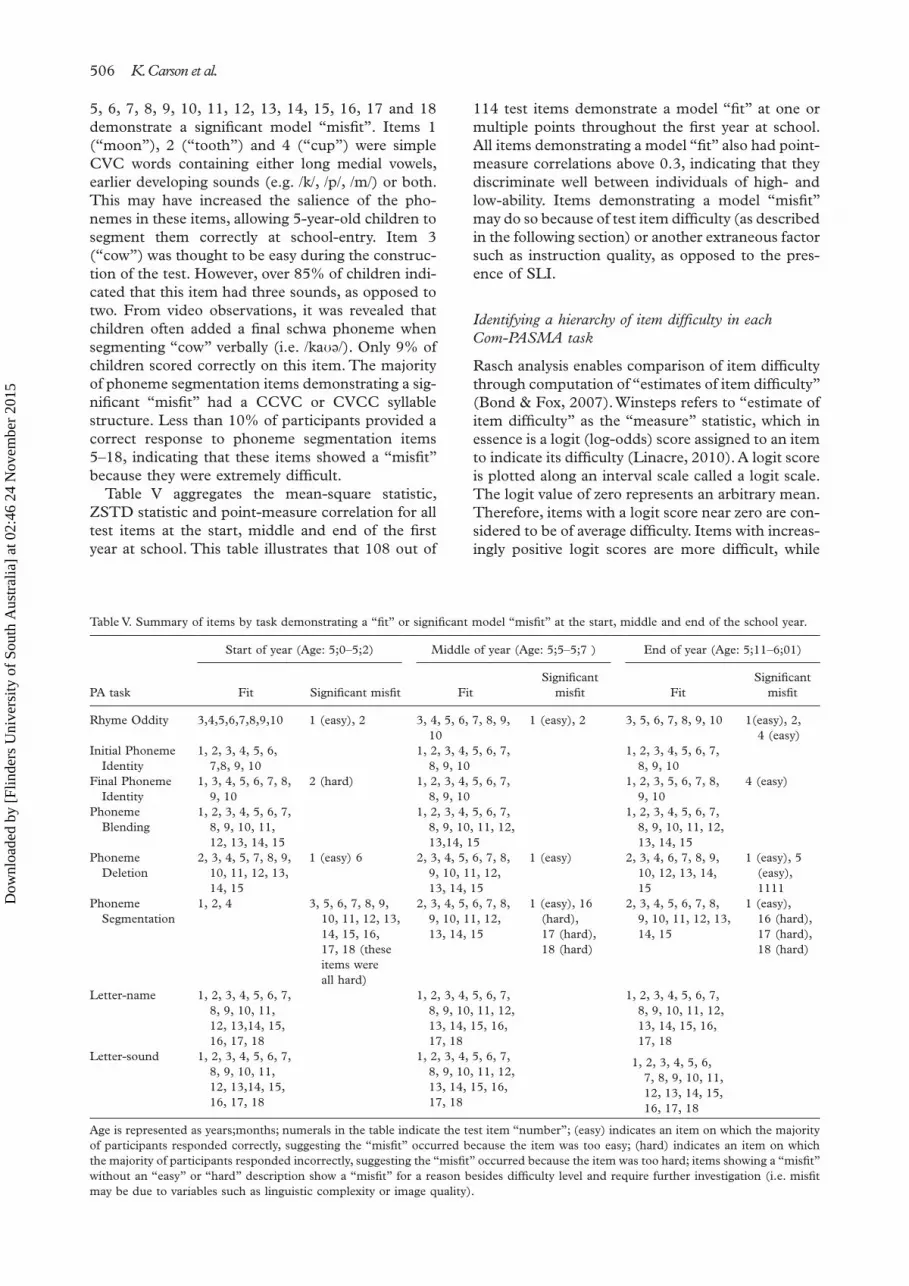
Table V aggregates the mean-square statistic, ZSTD statistic and point-measure correlation for all test items at the start, middle and end of the fi rst year at school. This table illustrates that 108 out of
114 test items demonstrate a model “ fi t ” at one or multiple points throughout the fi rst year at school. All items demonstrating a model “ fi t ” also had point-measure correlations above 0.3, indicating that they discriminate well between individuals of high- and low-ability. Items demonstrating a model “ misfi t ” may do so because of test item diffi culty (as described in the following section) or another extraneous factor such as instruction quality, as opposed to the pres-ence of SLI.
Identifying a hierarchy of item diffi culty in each Com-PASMA task
Rasch analysis enables comparison of item diffi culty through computation of “ estimates of item diffi culty ” (Bond & Fox, 2007). Winsteps refers to “ estimate of item diffi culty ” as the “ measure ” statistic, which in essence is a logit (log-odds) score assigned to an item to indicate its diffi culty (Linacre, 2010). A logit score is plotted along an interval scale called a logit scale. The logit value of zero represents an arbitrary mean. Therefore, items with a logit score near zero are con-sidered to be of average diffi culty. Items with increas-ingly positive logit scores are more diffi cult, while
Table V. Summary of items by task demonstrating a “ fi t ” or signifi cant model “ misfi t ” at the start, middle and end of the school year.
PA task
Start of year (Age: 5;0 – 5;2) Middle of year (Age: 5;5 – 5;7 ) End of year (Age: 5;11 – 6;01)
Fit Signifi cant misfi t FitSignifi cant
misfi t FitSignifi cant
misfi t
Rhyme Oddity 3,4,5,6,7,8,9,10 1 (easy), 2 3, 4, 5, 6, 7, 8, 9, 10
1 (easy), 2 3, 5, 6, 7, 8, 9, 10 1(easy), 2, 4 (easy)
Initial Phoneme Identity
1, 2, 3, 4, 5, 6, 7,8, 9, 10
1, 2, 3, 4, 5, 6, 7, 8, 9, 10
1, 2, 3, 4, 5, 6, 7, 8, 9, 10
Final Phoneme Identity
1, 3, 4, 5, 6, 7, 8, 9, 10
2 (hard) 1, 2, 3, 4, 5, 6, 7, 8, 9, 10
1, 2, 3, 5, 6, 7, 8, 9, 10
4 (easy)
Phoneme Blending
1, 2, 3, 4, 5, 6, 7, 8, 9, 10, 11, 12, 13, 14, 15
1, 2, 3, 4, 5, 6, 7, 8, 9, 10, 11, 12, 13,14, 15
1, 2, 3, 4, 5, 6, 7, 8, 9, 10, 11, 12, 13, 14, 15
Phoneme Deletion
2, 3, 4, 5, 7, 8, 9, 10, 11, 12, 13, 14, 15
1 (easy) 6 2, 3, 4, 5, 6, 7, 8, 9, 10, 11, 12, 13, 14, 15
1 (easy) 2, 3, 4, 6, 7, 8, 9, 10, 12, 13, 14, 15
1 (easy), 5 (easy), 1111
Phoneme Segmentation
1, 2, 4 3, 5, 6, 7, 8, 9, 10, 11, 12, 13, 14, 15, 16, 17, 18 (these items were all hard)
2, 3, 4, 5, 6, 7, 8, 9, 10, 11, 12, 13, 14, 15
1 (easy), 16 (hard), 17 (hard), 18 (hard)
2, 3, 4, 5, 6, 7, 8, 9, 10, 11, 12, 13, 14, 15
1 (easy), 16 (hard), 17 (hard), 18 (hard)
Letter-name 1, 2, 3, 4, 5, 6, 7, 8, 9, 10, 11, 12, 13,14, 15, 16, 17, 18
1, 2, 3, 4, 5, 6, 7, 8, 9, 10, 11, 12, 13, 14, 15, 16, 17, 18
1, 2, 3, 4, 5, 6, 7, 8, 9, 10, 11, 12, 13, 14, 15, 16, 17, 18
Letter-sound 1, 2, 3, 4, 5, 6, 7, 8, 9, 10, 11, 12, 13,14, 15, 16, 17, 18
1, 2, 3, 4, 5, 6, 7, 8, 9, 10, 11, 12, 13, 14, 15, 16, 17, 18
1, 2, 3, 4, 5, 6, 7, 8, 9, 10, 11, 12, 13, 14, 15, 16, 17, 18
Age is represented as years;months; numerals in the table indicate the test item “ number ” ; (easy) indicates an item on which the majority of participants responded correctly, suggesting the “ misfi t ” occurred because the item was too easy; (hard) indicates an item on which the majority of participants responded incorrectly, suggesting the “ misfi t ” occurred because the item was too hard; items showing a “ misfi t ” without an “ easy ” or “ hard ” description show a “ misfi t ” for a reason besides diffi culty level and require further investigation (i.e. misfi t may be due to variables such as linguistic complexity or image quality).
Dow
nloa
ded
by [
Flin
ders
Uni
vers
ity o
f So
uth
Aus
tral
ia]
at 0
2:46
24
Nov
embe
r 20
15
Computer-based phonological awareness assessment 507
items with increasingly negative logit scores are eas-ier. In theory, a logit scale can range from negative infi nity to positive infi nity (Bond & Fox, 2007). Therefore, for the purposes of this investigation, the following diffi culty descriptions were applied to logit values: 8 and above � very diffi cult; 5 – 7 � diffi cult; 2 – 4 � moderately diffi cult; 1 to - 1 � average diffi -culty; - 2 to - 4 � moderately easy; - 5 to - 7 � easy; and - 8 and below � very easy.
Supplementary Tables A, B and C to be found online at http://informahealthcare.com/doi/abs/10.3109/17549507.2015.1016107 summarize the hierarchy of diffi culty for test items in each task at the start, middle and end of the school year by plot-ting the “ measure ” statistic (i.e. logit score) for each item against a logit scale. From the start to the mid-dle of the school year (i.e. Supplementary Tables A and B to be found online at http://informahealthcare.com/doi/abs/10.3109/17549507.2015.1016107), items in the fi nal phoneme identity, phoneme blend-ing, phoneme deletion and phoneme segmentation tasks begin to sample a wider range of diffi culty lev-els. This is likely because tasks and items that were more diffi cult at school-entry became easier as chil-dren ’ s PA skills developed. From the middle to the end of the school year (i.e. Supplementary Tables B and C to be found online at http://informahealthcare.com/doi/abs/10.3109/17549507.2015.1016107), test items became increasingly easier for children to complete as they approached 6-years of age.
Ensuring test item “ fi t ” and diffi culty are supported by reliable test parameters
Internal consistency between items within each PA task at the start, middle and end of the fi rst year at school were calculated using Cronbach ’ s alpha to profi le stability at each assessment point as well as across time. Cronbach ’ s alpha scores above 0.7 indicate that the items within a task are internally consistent (Field, 2009). Table VI profi les the Cron-bach ’ s alpha scores for each task throughout the school year.
At school-entry, rhyme oddity and initial phoneme identity showed a high degree of internal consis-
tency, with Cronbach ’ s alpha scores of 0.81 and 0.89, respectively. In addition, the letter-name and letter-sound tasks achieved scores of 0.81 and 0.80, respectively. Unsatisfactory Cronbach ’ s alpha scores were calculated for fi nal phoneme identity, phoneme blending, phoneme deletion and phoneme segmen-tation at the start of the year. This is consistent with Rasch analysis fi ndings, indicating that these latter tasks are generally more diffi cult and less reliable at school-entry. By the middle and end of the school year, high Cronbach ’ s alpha scores were calculated for all tasks in the Com-PASMA.
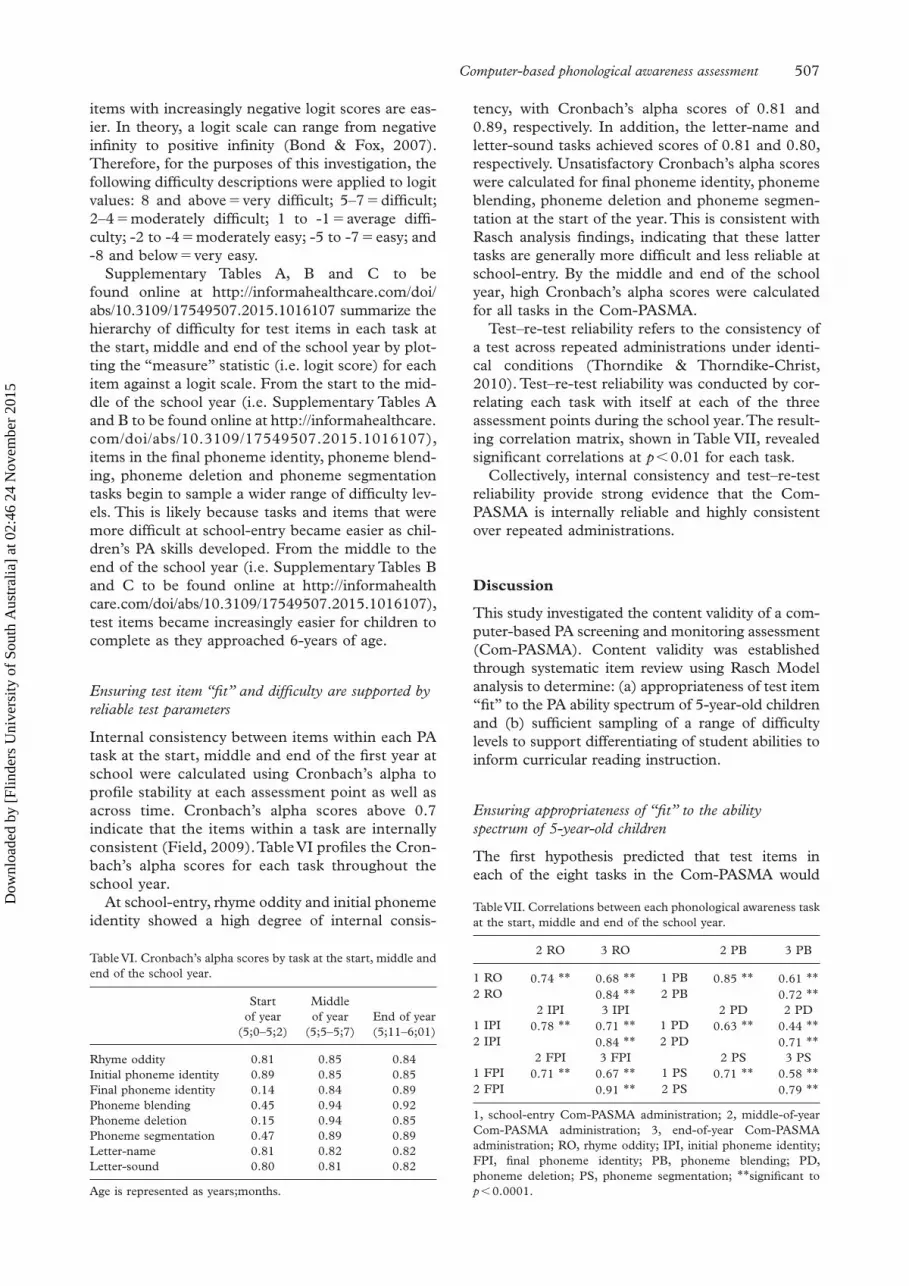
Test – re-test reliability refers to the consistency of a test across repeated administrations under identi-cal conditions (Thorndike & Thorndike-Christ, 2010). Test – re-test reliability was conducted by cor-relating each task with itself at each of the three assessment points during the school year. The result-ing correlation matrix, shown in Table VII, revealed signifi cant correlations at p � 0.01 for each task.
Collectively, internal consistency and test – re-test reliability provide strong evidence that the Com-PASMA is internally reliable and highly consistent over repeated administrations.
Discussion
This study investigated the content validity of a com-puter-based PA screening and monitoring assessment (Com-PASMA). Content validity was established through systematic item review using Rasch Model analysis to determine: (a) appropriateness of test item “ fi t ” to the PA ability spectrum of 5-year-old children and (b) suffi cient sampling of a range of diffi culty levels to support differentiating of student abilities to inform curricular reading instruction.
Ensuring appropriateness of “ fi t ” to the ability spectrum of 5-year-old children
The fi rst hypothesis predicted that test items in each of the eight tasks in the Com-PASMA would
Table VI. Cronbach ’ s alpha scores by task at the start, middle and end of the school year.
Start of year
(5;0 – 5;2)
Middle of year
(5;5 – 5;7)End of year (5;11 – 6;01)
Rhyme oddity 0.81 0.85 0.84Initial phoneme identity 0.89 0.85 0.85Final phoneme identity 0.14 0.84 0.89Phoneme blending 0.45 0.94 0.92Phoneme deletion 0.15 0.94 0.85Phoneme segmentation 0.47 0.89 0.89Letter-name 0.81 0.82 0.82Letter-sound 0.80 0.81 0.82
Age is represented as years;months.
Table VII. Correlations between each phonological awareness task at the start, middle and end of the school year.
2 RO 3 RO 2 PB 3 PB
1 RO 0.74 * * 0.68 * * 1 PB 0.85 * * 0.61 * * 2 RO 0.84 * * 2 PB 0.72 * *
2 IPI 3 IPI 2 PD 2 PD1 IPI 0.78 * * 0.71 * * 1 PD 0.63 * * 0.44 * * 2 IPI 0.84 * * 2 PD 0.71 * *
2 FPI 3 FPI 2 PS 3 PS1 FPI 0.71 * * 0.67 * * 1 PS 0.71 * * 0.58 * * 2 FPI 0.91 * * 2 PS 0.79 * *
1, school-entry Com-PASMA administration; 2, middle-of-year Com-PASMA administration; 3, end-of-year Com-PASMA administration; RO, rhyme oddity; IPI, initial phoneme identity; FPI, fi nal phoneme identity; PB, phoneme blending; PD, phoneme deletion; PS, phoneme segmentation; * * signifi cant to p � 0.0001.
Dow
nloa
ded
by [
Flin
ders
Uni
vers
ity o
f So
uth
Aus
tral
ia]
at 0
2:46
24
Nov
embe
r 20
15

508 K. Carson et al.
demonstrate an appropriate “ fi t ” to the abilities of 5-year-old children in the fi rst year of formal school-ing. Rasch Model analysis using the “ outfi t statistics ” of mean-square, ZSTD and point-measure correla-tion demonstrated that the majority of test items (i.e. 108 out of 114) across the eight tasks showed a model “ fi t ” at one or multiple points during the fi rst year at school. At school-entry, phoneme segmentation was the only task where the majority of test items (15 out of 18 test items) did not show a model “ fi t ” . This suggests that phoneme segmentation items, as part of the Com-PASMA, are less suitable for measuring the PA ability of 5-year-old children at school-entry. How-ever, by the middle and end of the school year, 14 out of 18 phoneme segmentation items demonstrated a “ fi t ” , indicating that these items become increasingly appropriate measures as children begin to interact with beginning classroom literacy instruction. This is consistent with research fi ndings showing that pho-neme segmentation is a diffi cult task at 5 years of age (Adams, 1990). Importantly, Rasch Model analysis demonstrated that, as PA tasks, including phoneme segmentation, became increasingly appropriate across the fi rst year of schooling, the capacity of those items to differentiate between high- and low-ability students increased, as evidenced through improved point-measure correlation statistics.
Of the 114 test items, six items demonstrated a signifi cant model “ misfi t ” at all three assessment points in the school year. These items were rhyme oddity items 1 and 2, phoneme deletion item 1 and phoneme segmentation items 16, 17 and 18. Other items demonstrated a “ misfi t ” at only one or two assessment points in the school year. These include rhyme oddity item 4, fi nal phoneme identity items 2 and 4, phoneme deletion items 6, 5 and 11 and pho-neme segmentation item 1. Adapting these “ misfi t ” items in terms of linguistic complexity (i.e. word familiarity, syllable structure and manner of articula-tion) and presentation (i.e. animated and static graph-ics or verbal instructions) at the point at which the “ misfi t ” occurred will be required in future investiga-tions. However, some items demonstrating a signifi -cant “ misfi t ” may not necessarily require adaption. This is because their low level of diffi culty is a pur-poseful part of test construction, to help ensure graded levels of diffi culty within tasks. For example, rhyme oddity item 1 was developed using a simple syllable structure, a high-frequency rhyme unit and salient contrasts in the manner of articulation between cor-rect and distractor options. This was done to ensure children ’ s success and familiarity with the responding procedure on what would usually be one of the fi rst tasks administered as part of the Com-PASMA.
Sampling a range of diffi culty levels among 5-year-old children
The second hypothesis stated that test items within each task in the Com-PASMA would sample a range
of diffi culty levels among 5-year-old children. Rasch Model analysis confi rmed this hypothesis. Using “ estimates of item diffi culty ” , results demonstrated that, at school-entry, test items in the Com-PASMA sampled a wide range of diffi culty levels (see Supple-mentary Table A to be found online at http://infor-mahealthcare.com/doi/abs/10.3109/17549507.2015.1016107). Rhyme oddity and initial phoneme iden-tity items provided an even spectrum of easier items to those that are more diffi cult. For example, rhyme oddity items ranged from moderately easy to mod-erately diffi cult and initial phoneme identity items ranged from easy to diffi cult. Final phoneme iden-tity, phoneme blending and phoneme deletion items predominantly sampled the moderately diffi cult to diffi cult range. For example, eight out of 10 fi nal phoneme identity items were classifi ed as diffi cult, while nine out of 15 phoneme blending and 10 out of 15 phoneme deletion items were considered mod-erately diffi cult. This suggests that, while the major-ity of test items in these tasks demonstrate a “ fi t ” at school-entry, their spectrum of diffi culty indicates they may be more appropriate later in the fi rst year of schooling. Only four out of 18 phoneme seg-mentation items could be analysed at school-entry; 14 items were extremely diffi cult and could not be analysed because the majority of respondents scored incorrectly. This suggests that these items do not adequately sample a range of diffi culty levels at this stage of schooling. The majority of letter-name items were moderately easy, whereas letter-sound items tended to be of average diffi culty and are considered appropriate at school-entry.
During the middle of the school year (see Supple-mentary Table B to be found online at http://informahealthcare.com/doi/abs/10.3109/17549507.2015.1016107) rhyme oddity and initial phoneme identity continued to sample a range of easy to mod-erately diffi cult ability levels, with initial phoneme identity items being less spread than at school-entry. While the majority of fi nal phoneme identity, pho-neme blending, phoneme deletion and phoneme segmentation items continued to be of greater dif-fi culty, they began to sample the moderately easy to easy range. For example, four out of 15 phoneme-blending items, fi ve out of 15 phoneme deletion items and fi ve out of 18 phoneme segmentation items were either moderately easy or easy by the middle of the school year. This is in comparison to one out of 15 phoneme blending items, one out of 15 phoneme deletion items and two out of 18 pho-neme segmentation items being classifi ed as moder-ately easy or easy at school-entry. Letter-name and letter-sound test items became easier to complete by the middle of the school year. By the end of the school year (see Supplementary Table C to be found online at http://informahealthcare.com/doi/abs/10.3109/17549507.2015.1016107), test items were more evenly spread across high to low logit scores, particularly for items in the fi nal phoneme
Dow
nloa
ded
by [
Flin
ders
Uni
vers
ity o
f So
uth
Aus
tral
ia]
at 0
2:46
24
Nov
embe
r 20
15

Computer-based phonological awareness assessment 509
identity, phoneme deletion and phoneme segmenta-tion tasks. Interestingly, phoneme deletion item 11, which was moderately diffi cult at the start and mid-dle of the school year, became very diffi cult by the end of the school year and will require further inves-tigation in future studies.
Implications for classroom assessment practices
Providing evidence of content validity through the use of Rasch Modal analysis has implications for classroom practices in that educators are informed of which PA tasks are appropriate at exactly which stages of the fi rst year at school. Specifi cally, aggrega-tion of test item “ fi t ” with “ estimates of test item diffi culty ” demonstrate that: (1) rhyme oddity and initial phoneme identity test items are most appro-priate at school-entry and sample a spectrum of dif-fi culty levels, (2) more challenging phoneme-level test items (e.g. fi nal phoneme identity, phoneme blending, phoneme deletion and phoneme segmen-tation) become increasingly appropriate and differ-entiate between high- and low-ability students by the middle and end of the fi rst year of school and (3) letter-knowledge test items are appropriate but decline in their ability to differentiate between high- and low-ability students as the fi rst year of schooling progresses. Such fi ndings are consistent with previ-ous research on the developmental progression of increasingly complex PA skills (Elbro, Borstrom, & Petersen, 1998; van Bon & van Leeuwe, 2003). Although the majority of test items in the Com-PASMA demonstrate a “ fi t ” to the ability spectrum of 5-year-old children, sample a range of diffi culty levels and discriminate well in the fi rst year of school-ing, educators should select those tasks within the Com-PASMA that are best suited to the age-level (i.e. 5-years, 5.5 years and 6-years) of their students when using this tool in the classroom.
Limitations
In light of the positive outcomes of this investigation, it is noteworthy to identify limitations that can be addressed by future research. First, the study con-sisted of a small sample size of 95 participants, all within the same age range. Future investigations could enhance the current investigation by increas-ing the sample size and measuring the PA abilities of children both prior to, during and after the fi rst year of schooling to identify where test items are appro-priate for a range of age-levels. Second, the Com-PASMA currently consists of a total of 114 test items over eight tasks. Future investigations should ideally focus on constructing a larger range of test items to help support the development of an adaptive version of the assessment. Computer-adaptive testing requires large banks of test items so that the com-puter is able to select appropriate test items when
adapting to the responses of the child. The number of test items in the current investigation that dem-onstrate a “ fi t ” at some stage in the school year and sample a range of diffi culty levels provide a starting point for the expansion of test items and the con-struction of an adaptive form of the Com-PASMA.
Ensuring all young children have the opportunity to develop profi ciency in reading is currently a key area of interest globally. Large gaps in reading out-comes between strong and weaker readers, particu-larly among developed countries, has created a need for researchers to investigate methods that support the early identifi cation and prevention of risk for reading impairment as part of daily curricular prac-tices. Providing educators with technology-based assessment methods that have demonstrated a robust ability to differentiate between children who enter school with high and low levels of skills, such as PA, that are known to predict later reading success, is perhaps on way in which educators, researchers and policymakers can help reduce the prevalence of large gaps in school-aged reading outcomes.
Acknowledgements
The authors extend thanks to the children, families and educators involved in this study. Gratitude is expressed towards the New Zealand Tertiary Educa-tion Commission for fi nancial support in the imple-mentation of this project.
Declaration of interest: The authors report no confl icts of interest. The authors alone are respon-sible for the content and writing of the paper.
References
Adams , M. J . (1990) . Beginning to read: Thinking and learning about print . Cambridge, MA: MIT Press .
AIMSweb . (2014) . AIMSweb – Always learning . Upper Saddle River, NJ: Pearson . Available online at: http://www.aimsweb.com/.
Anastasi , A. , & Urbina , S . (1997) . Psychological testing (7th ed.) . Upper Saddle River, NJ: Prentice Hall .
Andrich , D . (2004) . Controversy and the Rasch Model: A char-acteristic of incompatible paradigms? Medical Care , 42 , 1 – 16 .
Australian Government . (2008) . Success through partnership: Achieving a national vision for ICT in schools – Strategic plan to guide the implementation of the Digital Education Revolution initiative and related initiatives . Canberra, Australia: Australian Government . Available online at: http://www.teacherstandards.aitsl.edu.au/static/docs/hotTopics/Success_through_partner-ship_-_Achieving_a_national_vision_for_ICT_in_schools.pdf).
Australian Government . (2011) . Review of funding for schooling – Final report . Canberra, Australia: Author .
Australian Government . (2014) . Schools in Australia . Canberra, Australia: Australian Government . Available online at: http://www.studyinaustralia.gov.au/global/australian-education/schools.
Baker , F . (2001) . The basics of item response theory: ERIC clearing-house on assessment and evaluation . University of Maryland, College Park, MD: ERIC Clearinghouse on Assessment and Evaluation .
Dow
nloa
ded
by [
Flin
ders
Uni
vers
ity o
f So
uth
Aus
tral
ia]
at 0
2:46
24
Nov
embe
r 20
15

510 K. Carson et al.
Guernsey , L. , Levine , M. , Chiong , C. , and Severns , M . (2012) . Pioneering literacy in the digital wild west: Empowering parents and educators . Available online at: http://www.joanganzcooney-center.org/wp-content/uploads/2012/12/GLR_Technology-Guide_fi nal.pdf.
Johnson , M. , Hedditch , J. , & Yin , I . (2011) . ICT in schools report 2011: Information & communications technology in New Zealand schools 1993 – 2011. Research New Zealand . Wellington, New Zealand . Available online at: http://www.2020.org.nz/template/ict_2011_fi nal_report.pdf.
Linacre , M . (2010) . A user ’ s guide to Winsteps . Beaverton, Oregon . Available online at: http://www.winsteps.com/winman/index.htm?guide.htm.
Lissitz , R. W. , & Samuelsen , K . (2007) . A suggested change in terminology and emphasis regarding validity and education . Educational Researcher , 36 , 437 – 448 .
Ministry of Education . (2004) . New Zealand Articulation Test (NZAT) . Wellington, New Zealand: Ministry of Education .
Mullis , I. , Martin , M. O. , Foy , P. , & Drucker , K. T . (2012) . PIRLs 2011 International Results in Reading . Chestnut Hill, MA: TIMSS & PIRLS International Study Center .
Nicholson , T . (2009) . Should beginner readers rely on context clues or not: The case for and against . Paper presented at the Literacy Research Symposium , 1 – 2 October 2009, Christchurch, New Zealand .
Shriberg , L. D. , Austin , D. , Lewis , B. A. , McSweeny , J. L. , & Wilson , D. L . (1997) . The speech disorders classifi cation sys-tem (SDCS): Extensions and lifespan reference data . Journal of Speech, Language, and Hearing Research , 40 , 723 – 740 .
Singleton , C. H. , Thomas , K. V. , & Leedale , R. C . (1996) . Lucid CoPS Cognitive Profi ling System . Beverley, East Yorkshire: Lucid Research Ltd .
Thorndike , R. M. , & Thorndike-Christ , T . (2010) . Measurement and evaluation in psychology and education (8th ed.) . Boston, MA: Pearson Education Inc.
Torgesen , J. K. , Wagner , R. , & Rashotte , C . (1994) . Longitudinal studies of phonological processing and reading . Journal of Learning Disabilities , 27 , 276 – 286 .
Tymms , P. T . (1999) . Baseline assessment, value-added and the pre-diction of reading . Journal of Research in Reading , 22 , 27 – 36 .
UNICEF . (2010) . The children left behind: A league table of inequality in child well-being in the world ’ s rich countries (Vol. Innocenti Report Card 9) . Florence: Innocenti Research Centre .
van Bon , W. H. J. , & van Leeuwe , J. F. J . (2003) . Assessing phonemic awareness in kindergarten: The case for the phonemic recognition task . Applied Psycholinguistics , 24 , 195 – 219 .
Wiig , E. , Secord , W. , & Semel , E . (2006) . Clinical Evaluations of Language Fundamentals Preschool - Australian and New Zealand (2nd ed.) . San Antonio, TX: Psychological Corporation .
Bender , W. N . (2012) . Differentiating instruction for students with learning disabilities – New best practice for general and special educators . Thousand Oaks, CA: Corwin .
Bond , T. G. , & Fox , C. M . (2007) . Applying the Rasch Model: Fundamental measurement in the human sciences (2nd ed.) . London, UK: Erlbaum .
Catts , H. W. , Fey , M. E. , Zhang , X. , & Tomblin , J. B . (2001) . Estimating the risk of future reading diffi culties in kindergar-ten children: A research-based model and its clinical imple-mentation . Language, Speech, and Hearing Services in Schools , 32 , 38 – 50 .
Carson , K. , Boustead , T. , & Gillon , G . (2013a) . Predicting reading outcomes in the classroom using a computer-based phonological awareness screening and monitoring assessment (Com-PASMA) . International Journal of Speech-Language Pathology , 16 , 552 – 561.
Carson , K. , Gillon , G. , & Boustead , T . (2011) . Computer-administered versus paper-based assessment of school entry phonological awareness ability . Asia Pacifi c Journal of Speech, Language, and Hearing , 14 , 85 – 101 .
Carson , K. , Gillon , G. & Boustead , T . (2013b) . Classroom phonological awareness instruction and literacy outcomes in the fi rst year of school . Language, Speech, and Hearing Services in Schools , 44 , 147 – 160 .
Crocker , L. , & Algina , J . (1986) . Introduction to classical and mod-ern test theory . Philadelphia, PA: Harcourt Brace Jovanovich College Publishers .
DECD . (2012) . SA Strategic Plan – Target 14 Early Childhood . South Australia, Australia: Government of South Australia . Available online at: http://saplan.org.au/targets/14-early-childhood-year-1-literacy.
Dodd , B. , Crosbie , S. , McIntosh , B. , Teitzel , T. , & Ozanne , A . (2000) . Preschool and primary inventory of phonological awareness (PIPA) . London, UK: Psychological Corporation .
Ehri , L. C. , Nunes , S. R. , Willows , D. M. , Schuster , B. V. , Yaghoub-Zadeh , Z. , & Shanahan , T . (2001) . Phonemic awareness instruction helps children learn to read: Evidence from the national reading panel’s meta-analysis . Reading Research Quar-terly , 36 , 250 – 287, 311.
Ehrler , D. J. , & McGhee , R. L . (2008) . Primary Test of Nonverbal Intelligence (PTONI) . Austin, TX: Pro-Ed .
Elbro , C. , Borstrom , I. , & Peterson , D. K . (1998) . Predicting dyslexia from kindergarten: The importance of distinctness of phonological representations of lexical items . Reading Research Quarterly , 33 , 36 – 60 .
Embretson , S. , & Reise , S . (2000) . Item response theory for psychologists . Mahwah, NJ: Erlbaum .
Field , A . (2009) . Discovering statistics using SPSS (3rd ed.) . London, UK: Sage Publications .
Good , R. H. , III , & Kaminski , R. A . (2003) . DIBELS: Dynamic Indicators of Basic Early Literacy Skills (6th ed.) . Longmont, CO: Sopris West .
Supplementary material available online
Supplementary Tables A, B and C to be found online at http://informahealthcare.com/doi/abs/10.3109/17549507.2015.1016107.
Dow
nloa
ded
by [
Flin
ders
Uni
vers
ity o
f So
uth
Aus
tral
ia]
at 0
2:46
24
Nov
embe
r 20
15