contaminant monitoring programmes using marine organisms
TRANSCRIPT
neaiiionnn nigLLL CCE if nnAn9n9 is
UNITED NATIONS ENVIRONMENT PROGRAMME NOVEMBER 1990
Contaminant monitoring programmes using marine
organisms: Quality Assurance and Good Laboratory Practice
Reference Methods For Marine Pollution Studies No.57
Prepared in co-operation with
(4) /)\
IOC IAEA FAQ
UNEP 1990
NOTE: This document has been prepared jointly by the Intergovernmental Oceanogr, aphic Commission (bC), the International Atomic Energy Agency (IAEA), the Food and Agriculture Organization of the United Nations (FAO) and the United Nations Environment Programme (UNEP) under project FP. 5102-88-03.
For bibliographic purposes this document may be cited as:
UNEP/IOC/IAEA/FAO: Contaminant monitoring programmes using marine organisms: Quality Assurance and Good Laboratory Practice. Reference Methods for Marine Pollution Studies No. 57, UNEP 1990.
( ) ffIII 'l 4m
• _____ • ____
LI y • _ _
UNITED NATIONS ENVIRONMENT PROGRAMME NOVEMBER 1990
Con tam/nan t monitoring programmes using mar/ne
organisms: Quality Assurance and Good Laboratory Practice
Reference Methods For Marine Pollution Studies No.57
Prepared in co-operation with
(__ - 47~) (9)
bc IAEA FAO
UNEP 1990
-1-
PREFACE
The Regional Seas Programme was initiated by UNEP in 1974. Since then the Governing Council of UNEP has repeatedly endorsed a regional approach to the control of marine pollution and the management of marine and coastal resources and has requested the development of regional action plans. The Regional Seas Programme at present includes ten regions and has over 120 coastal States participating in it. (1), (2)
One of the basic components of the action plans sponsored by UNEP in the framework of the Regional Seas Programme is the assessment of the state of the marine environment and of its resources, and of the sources and trends of the pollution, and the impact of pollution on human health, marine ecosystems and amenities. In order to assist those participating in this activity and to ensure that the data obtained through this assessment can be compared on a world-wide basis and thus contribute to the Global Environment Monitoring System (GEMS) of UNEP, a set of Reference Methods and Guidelines for marine pollution studies are being developed as part of a programme of comprehensive technical support which includes the provision of expert advice, reference methods and materials, training and data quality assurance (3). The Methods recommended to be adopted by Governments participating in the Regional Seas Programme.
The methods and guidelines are prepared in co-operation with the relevant specialized bodies of the United Nations system as well as other organizations and are tested by a number of experts competent in the field relevant to the methods described.
In the description of the methods and guidelines the style used by the International Organization for Standardization (ISO) is followed as closely as possible.
The methods and guidelines, as published in UNEP's series of Reference Methods for Marine Pollution Studies, are not considered as final. They are planned to be periodically revised taking into account the development of our understanding of the problems, of analytical instrumentation and the actual need of the users. In order to facilitate these revisions the users are invited to convey their comments and suggestions to:
Marine Environmental Studies Laboratory International Atomic Energy Agency International Laboratory of Marine Radioactivity 19, Avenue des Castellans MC98000 MONACO
which is responsible for the technical co-ordination of the development, testing and intercalibration of Reference Methods.
UNEP: Achievements and planned development of the UNEP's Regional Seas Programme and comparable programmes sponsored by other bodies. UEP Regional Seas Reports and Studies No. 1 UNEP, 1982.
P. HUU4: A Stratery for the Seas. The Regional Seas Programme: Past and Future, UNEP, 1983.
UNEP/IAEA/IOC: Reference Methods and Materials: A programme of comprehensive support for regional and global marine pollution assessments. UNEP 1990.
- ii -
The present Reference Method provides guidelines for establishing Quality Assurance (QA) and Good Laboratory Practice (GLP) procedures in laboratories involved in the monitoring of contaminants in marine organisms. The guidelines are based on the experience of laboratories participating in large international monitoring programmes including those of IJNEP's Regional Seas Programme, the International Council for the Exploration of the Sea (ICES) and the various regional programmes of IOC. Quality Assurance is an essential part of any monitoring programme and is the only means to guarantee comparability of data - without such procedures data reports would be meaningless.
This first edition of the Reference Method for Marine Pollution Studies No. 57 was prepared in cooperation with the Intergovernmental Oceanographic Commission (lOG), the International Atomic Energy Agency (IAEA) and the Food and Agriculture Organization of the United Nations (FAO). It includes comments received from the joint IOC/IJNEP Group of Experts on Methods, Standards and Intercalibration (GEMSI) of GIPME who reviewed the guidelines. The assistance of all those who contributed to the preparation of this reference method is gratefully acknowledged.
- 111 -
CONTENTS
Pane
1. Scope and field of application 1
2. References 1
3. Introduction 2
4. Aims of monitoring programmes 3
5. Sampling strategy 4
6. Public health 5
7. Hot spots 6
8. Baseline and trends 7
9. Storage and pre-treatment of samples 9
10. Analytical quality assurance 11
11. Documentation and reporting of data 13
12. Appendix 1 - Selection of Organisms for Monitoring 15 Purposes
13. Appendix 2 - Accuracy, Precision and Limit of 16 Detection of Analytical Measurements
14. Appendix 3 - Reference Materials (RMs) 20
15. Appendix 4 - Intercomparison Exercises 23
16. Appendix 5 - Analytical Quality Control Charts (AQCC) 24
-1-
1. SCOPE AND FIELD OF APPLICATION
This publication provides guidelines for obtaining reliable and relevant data during monitoring programmes in which contaminants are measured in marine organisms. It describes the precautions to be taken in each of the procedural steps from planning and sampling to the publication of data reports.
2. REFERENCES
GORDON, M., KNAUER, G.A. AND MARTIN, J.H. (1980). Mytilus californianus as a bio-indicator of trace metal pollution: Variability and statistical considerations. Marine Pollution Bulletin 11: 195-198.
ISO (1981). Terms and definitions used in connection with reference materials. International Standards Organization Guide 30, ISO Geneva, 5pp.
ISO (1989). Uses of certified reference materials. International Standards Organization Guide 33, ISO Geneva, l2pp. (obtainable from ISO, Case Postale 56, CH-1211 Geneve 20, Switzerland).
KEITH, L.H., CRUMNETT, W., DEGAN, J., LIBBY, R.A., TAYLOR, J.K. AND WENTLER, C. (1983). Principles of environmental analysis. Analytical chemistry 55: 2210-2218.
STANDING COMMITTEE OF ANALYSTS (1980). General principles of sampling and accuracy of results. Standing Committee of Analysts, Methods for the examination of waters and associated materials. U.K. Dept. of the Environment, London. (obtainable from HMSO, 49 High Holborn, London WC1V 611B, UK).
TAYLOR, J.K. (1985). Standard Reference Materials: Handbook for SRM Users. NBS Special Publication 260-100, U.S. Dept. of Commerce, Washington D.C., USA. (Obtainable from National Institute of Science and Technology (formerly NBS), Office of Standard Reference Materials, Gaithersburg, MD 20899, USA).
-2-
UNEP/FAO/IAEA/IOC (1984). Sampling of selected marine organisms and sample preparation for trace metal analysis. Reference Methods for Marine Pollution Studies No. 7, Rev. 2, UNEP, Nairobi.
UNEP/FAO/IAEA (1984). Sampling of selected marine organisms and sample preparation for the analysis of chlorinated hydrocarbons. Reference Methods for Marine Pollution Studies No. 12, Rev. 1, UNEP, Nairobi.
VIJVERBERG, F.A.J.M. and W.P. COFINO (1988). Good Laboratory Practice and Quality Assurance. ICES Techniques in Marine Environmental Sciences No. 6, Copenhagen. (Obtainable from the International Council for the Exploration of the Seas, Paelgade 2-4, DK-1216, Copenhagen K. Denmark).
3. INTRODUCTION
Many laboratories are actively participating in marine pollution monitoring programmes under the auspices of the United Nations Environment Programme (UNEP), the Intergovernmental Oceanographic Commission (IOC) and the Food and Agriculture Organization of the United Nations (FAO). These organizations have expressed concern about the quality of data arising from such programmes, particularly the accuracy and comparability of data produced by individual laboratories. In order to deal with this problem they have encouraged laboratories to participate in intercomparison exercises, arranged for less experienced laboratories to attend analytical workshops and have arranged for reference analytical methods to be produced and distributed to participants in the various regional seas programmes.
It should be stressed, however, that the acquisition of reliable and relevant data of the appropriate quality, for contaminants in marine samples, is not solely dependant on the production of accurate analytical measurements. The overall quality of data is also dependent on three other factors, which are:
a representative and meaningful sampling programme;
a suitable storage and pre-treatment procedure for samples following collection and prior to analysis; and,
a data assessment procedure.
-3-
Unless all four factors are given adequate consideration before and during the monitoring programme, the aims of the programme may not be achieved and valuable time, staff, facilities and other resources may be wasted. The term used to describe the approach to this work is "quality assurance". Quality assurance involves all those steps which are required to guarantee the generation of data of suitable quality to address the defined aims of a monitoring programme.
The purpose of this document is to provide general guidance on quality assurance and to outline the approach that could be taken by laboratories to achieve the specific aim(s) for each marine pollution monitoring programme. Since most laboratories are currently focussing on programmes involving marine organisms, this document will be confined to this aspect.
Since quality assurance work starts from the time when a decision is taken to get involved with marine pollution monitoring it is appropriate to begin by discussing the different aims which laboratories might wish to pursue under this work.
4. AIMS OF MONITORING PROGRAMMES
Four main aims can be identified for programmes involving the collection and analysis of marine organisms for the three main groups of contaminants (metals, organochiorine compounds and petroleum hydrocarbons), these are:
(1) The measurement of contaminant levels in edible marine organisms in relation to public health
The identification of heavily contaminated areas of the sea ("hot spots") where levels of contaminants are at least an order of magnitude higher than levels in clean or uncontaminated areas.
The establishment of present levels of contaminants in marine organisms (i.e., a "baseline")
The assessment of changes in concentrations of contaminants in organisms over a period of time (trends).
Each of these programmes places a different demand on the laboratories regarding the method and care to be taken in the collection, storage and analysis of samples. These aspects are considered below in detail in the context of the main aims of each programme.

-4-
It is very important that the investigator should prepare a clear and unambiguous statement on the aims and objectives of the work before embarking on any monitoring programme. Only by doing this will It be clear what type of information will be required, and consequently what criteria should be laid down for the collection, storage and analysis of samples. Time spent on defining aims and objectives and the planning of the various parts of the field and laboratory work will always be rewarded by a more efficient and effective programme.
Good planning can avoid unnecessary sampling and analyses, i.e,, it is sensible to initially aim for a programme which satisfies essential rather than desirable objectives. It is easy to expand such a programme if the necessary resources are available. Also, if plans are made in advance as to how the data to be collected is to be used, this will assist in the design of field and laboratory work. Finally, there is a need to regularly review the programme of work to assess how well the aims are being met. Such reviews might lead to a reduction of sampling and analyses, and the time gained can be usefully employed elsewhere. Equally it might identify the need to put in more effort; early warning of such extra work can allow time to plan the necessary manpower and other resources.
5. SAMPLING STRATEGY
If the sampling strategy is not designed with great care, the data from the measurements may not meet the needs of the programme. On the basis of previous experience considerable effort needs to be devoted to long-term monitoring, so it is important to ensure that this is done in the most efficient and effective way.
Good planning needs considerable time and thought; never be persuaded to rush this aspect of the work and ensure that all disciplines involved are consulted before plans are finalized.
In designing a representative and meaningful sampling programme involving marine organisms there are a number of questions which have to be considered:
where should the samples be collected;
which organism(s) should be selected for study;
when should the sampling be done and what is the appropriate frequency of sample collection;
-5-
how many individual organisms should be collected on each sampling occasion and which size(s) should be included in each sample; and,
which tissue(s) of the organisms(s) should be taken for analysis.
Each of these points will be addressed below for each of the main aims referred to above, i.e., public health, hot spots, baseline and trend studies.
6. PUBLIC HEALTH
6.1 Since the aim of the programme is to assess the level of contaminants in edible species then samples should ideally be taken at the point of sale to the general public, i.e., at the fish market. Alternatively the scientist(s) can collect the fish/shellfish from the main fishing areas.
6.2 The selection of prganisms will be dictated by the eating patterns of the population. These can be identified by a survey of the species sold at the market, by obtaining information from colleagues in government departments who deal with such matters or in the absence of such information, by distributing a questionnaire to a representative section of the general public.
6.3 Unless there is a seasonal fishing pattern for some species, then samples may be taken at any time of the year. Ideally all species should be sampled at the same time so that a synoptic picture can be obtained for the contaminant levels. A typical monitoring programme might be a survey every 5 years. However, available resources may allow more frequent surveys to be conducted; assuming that the results indicate that this is required (i.e., if concentrations of contaminants in foodstuffs are found to exceed permissable limits). This increased sampling should be confirmed to species "which permissable limits of contaminants are exceeded.
6.4 The size(s) of organisms to be sampled should be based on information collected at the fish market. If small and large sizes are sold to the general public, this should be reflected in the sample. The number of individual organisms in each sample may partly be influenced

-6-
by the importance of the species as a foodstuff, by the availability of scientific manpower and by the need to sample sufficient of each species and of each size category to cover the range of values encountered in a typical population or catch. Generally, a sample of 5-10 individuals could be collected for each size range of fish and large shellfish (crabs, lobsters) and 50 individuals for smaller shellfish (e.g. mussels, shrimps).
6.5 Only edible tissue need be analysed for contaminants - usually this means muscle tissue for fish and large crustaceans and whole soft tissue (less vicera) for other shellfish.
6.6 Every opportunity should be taken to collect data on the size (or length) and age of the species. This may assist decision making at a later date if the programme is too focussed on a particular area and/or species.
7. HOT SPOTS
7.1 Hot spots are usually found close to estuarine and coastal areas where anthropogenic wastes are discharged. The only offshore areas where hot spots are likely to occur are those which are used for the dumping of wastes from ships (and sites where net deposition of fine material takes place).
7.2 Although one can theoretically select any type of organism to monitor hot spots, in practice the most useful organism for this purpose are the sessile invertebrates. These species, by virtue of their feeding behaviour, can reflect levels of contamination in the soluble phase, in the suspended particulate phase and in the sediment phase (see Appendix 1 for the list of characteristics for organisms to be used in monitoring studies). It should be noted, however, that levels of lipophilic organic compounds (and some inorganic compounds) are most considerably influenced by water: lipid distribution equilibria. This factor may be more important than feeding habits for such compounds.
It should be stated that no single organism can be used to monitor levels in the above three phases. It may be necessary to use a seaweed (macro algae) for the soluble phase, a filter feeder (e.g., mussels) for the particulate phase and a detritus feeder for the sediment phase. The investigator should therefore consult biologists to determine which species are best for the type of waste(s) and phase(s) under examination.
-7-
If a single preferred organism had to be nominated, the common mussel (Mytilus edulis or the equivalent local species), would be recommended.
7.3 Seasonal variations in food supply, and the spawning cycle, are known to cause changes in total body weight as well as lipid concentration and composition and consequently contaminant levels in the tissues of invertebrates. In order to minimise these variations it is suggested that sampling be undertaken at the pre-spawning period. Provided sampling covers the area under investigation is a representative manner, one survey is normally sufficient for the identification of hot spots.
7.4 Ideally the number of individuals collected should cover the size range of organisms encountered at the sampling site in order to establish the variations of contaminant levels with size. Although this approach need not be taken at each of the sampling sites, it should be carried out at least at one site in order to allow comparisons to be made with other sites where sampling should be restricted to a small size range. Depending on analytical resources, the organisms from each site can either be analysed individually or bulked. In the latter case, no information will be derived on the variation with size but in terms of the aim of the programme the results can be used to compare data from site to site with some level of confidence (this assumes that a number of replicate analyses are performed on the bulked sample to allow differences to be detected above and beyond those produced by sample variation).
7.5 Whole soft tissue, less vicera, should be taken for analysis. N.E. For the analysis of lipophilic contaminants it is important to measure the lipid content of each sample (e.g., n-hexane extract) in order to ensure that comparisons of data on a lipid basis can be made for different regions and times of sampling (i.e., in relation to the seasonal changes of lipid concentration in organisms).
8. BASELINE AND TRENDS
8.1 Sampling sites should include estuarine, coastal and offshore areas to ensure that both clean and contaminated areas are covered in this programme. Sampling at sea should be done by trained personnel operating from research or chartered vessels, rather than by fishermen, to ensure that contamination of the samples during and after collection is kept at an acceptable level.
-8-
8.2 Since the aim is to establish the current state of contamination of marine organisms generally, there are no restrictions on the species that can be included in such a study; other than that imposed by the resources available to the investigator. If the laboratory wishes to conduct trend monitoring or compare levels of contaminants at different sites, then it is necessary to include those organisms which will provide the data with which to achieve such aims, e.g. invertebrates.
8.3 Collections should be made over a short interval of time to ensure as synoptic a picture as possible for the baseline survey and to enable comparisons of concentrations of contaminants at different sites. This also ensures that organisms are in the same physiological state (i.e., lipid metabolism, spawning, etc.).
It is appropriate to repeat a baseline study every 5 years unless major changes in discharges occur or are anticipated in the intervening period, which are considered to influence levels of contaminants in organisms over the entire study area. In most cases the effects of increasing or decreasing inputs of contaminants are usually confined to the area in the immediate vicinity of the discharge. More frequent monitoring at these locations would fall under the category of trend studies.
For trend studies the minimum frequency of monitoring for fish and shellfish typically consist of an annual sampling whereas the maximum sampling for invertebrates might be as much as 4-12 times per year. Each laboratory will clearly establish the frequency of sampling which meets the aims of its programme. This frequency will reflect both the changes it wishes to measure over a particular period of time and the resources it has at its' disposal.
8.4 Baseline studies should attempt to cover all size ranges of the species under examination in order to produce a comprehensive picture for the state of the environment. A sample of 5-10 individuals for each size range would be an appropriate number for each fish and major shellfish species. A sample of 25-50 individuals is usually required for smaller shellfish.
Having established the relationship of contaminant levels with size of organisms it is usual to select a particular size or size range for trend studies to reduce variability. The numbers of individuals required for each sample will be determined by the differences in contaminant levels one wishes to be able to differentiate, i.e., the smaller the difference the greater the number of individuals required for each sample. In a recent study of trace metal variability in two populations of Mytilus californianus, through the random sampling of organisms at two
-9-
sites, Gordon et. al. found coefficients of variation of 18-40%. They concluded that a sample of 20-100 individuals/site was required to detect a concentration difference of 20% between sites. Differences of 40% could be detected by analysing about 1/3 fewer samples.
8.5 For fish, muscle is the most useful tissue for all purposes. However liver and kidney tissues have been used for both baseline and trend studies. Both hepatopancreas and muscle tissue have been used in studies of large crustaceans. In general, whole soft tissue is taken for smaller shellfish.
9. STORAGE AND PRE-TREATMENT OF SAMPLES
9.1 Practical guidelines
Guidelines and recommended procedures dealing with the storage and pre-treatment of samples following their collection are given in UNEP Reference Methods for Marine Pollution Studies 7 and 12 (which deal with metals and halogenated hydrocarbons respectively).
The guidelines cover the following:
The types of storage containers to be used to avoid contamination of samples in transit and the recommended temperature for storage prior to dissection and analysis.
The precautions to be taken during the removal of soft tissue from the organism and during the preparation of the sub-sample for analysis to avoid contamination from dissection tools, reagents, laboratory environment and the person carrying out these procedures.
Analysts should ensure that adequate time and effort are allowed for this work since improper storage of samples and poor sample handling prior to analysis will lead to the production of unacceptable data irrespective of how well the subsequent analytical measurements are carried out.
9.2 Planning and management
Good planning is essential if this work is to be done efficiently and effectively. The following guidance is given in this respect:
- 10 -
9.2.1 Sampling
- Staff involved in sampling work should be given clear written instructions concerning the methods of collection, particularly the precautions that have to be taken to avoid contamination of samples during the transfer from the site to the storage container.
- Experienced staff should accompany new staff on their first site visit and possibly on later visits to monitor their work.
- A check list of sampling and storage equipment should be compiled for each type of sampling and this should be used before each site visit.
- Adequate time should be allocated for each site visit to ensure that unexpected delays do not cause field staff to give less attention to sampling and storage.
- Log books should be provided to record essential details of samples and any site characteristics that are considered necessary. These logs should be checked on completion of this site visit.
- On arrival at the laboratory samples should be catalogued and securely stored in order to avoid loss of samples.
9.2.2 Dissection of samples
- Ideally dissection of samples should be done on fresh material (cooled but not deep frozen). If these samples cannot be analysed within one or two days they should be deep frozen until they can be analysed.
- If the above procedure cannot be followed, the samples should be deep frozen following collection and only removed for thawing and dissection when the chemical analyses of soft tissue can be done. Repeated freezing and thawing of samples can lead to loss of body fluids and water content. This can not only effect the form and concentration of contaminants in soft tissue but can make the determination of wet to dry weight conversion factors very difficult.
- The dissection of organisms by inexperienced staff, under poorly controlled laboratory conditions, can result in the production of unrepresentative and contaminated samples of soft tissue for analysis. Staff responsible for dissection must be given proper
- 11
training in dissection and sub-sampling. They must be issued with the appropriate dissection tools and must work in an area of the laboratory specially kept for this work. It is good practice to assign two people to this work - one to dissect and transfer tissue to the sub-sample container, the other to catalogue the sample and weight of tissue taken for each sub-sample.
N.B. Adequate time must be allowed for this work to avoid staff making errors.
10. ANALYTICAL QUALITY ASSURANCE
The earlier section of this document dealt with the collection of representative and meaningful samples of marine organisms and the pre-treatment and storage procedures which ensure that losses and additions of contaminants prior to chemical analysis are kept to a minimum. This section deals with the aspect of quality assurance concerned with the measurement of contaminants in biological tissue namely analytical quality control and assessment.
It is assumed that the analyst has chosen a suitable analytical procedure to provide the appropriate performance characteristics of precision, accuracy and limit of detection (see Appendix 2).
Before an analyst employes an analytical procedure on a regular basis for the measurement of contaminants in a sample of biological tissue it is essential to check its performance characteristics to ensure that the method will produce data of the required accuracy and precision. This applies equally to the Reference Methods for Marine pollution Studies published by UNEP (in cooperation with other UN Agencies) as well as to any methods developed by the laboratory or other published methods used by the laboratory.
This check on accuracy and precision is done by analysing certified reference materials (CRMs) of known matrix and composition. (A list of relevant CRMs is given in Appendix 3). In the absence of such materials the analyst should check the accuracy and precision by the method of "standard addition", i.e., the analysis of samples of the tissue to which known quantities of contaminants of interest have been added (i.e. "spikes"). Total recovery of "spikes" does not however guarantee that the method will produce accurate data for samples since the chemical form of the analyte in the sample and in the spike may not be the same or the concentration/extraction procedure may be inadequate to release the contaminant from its site in the sample. It is advisable, therefore,
- 12 -
whenever possible, to employ CRMs for the evaluation of analytical methods since this is the only true test for accuracy of a method for the sample and analyte(s) under examination. Analysts should choose the CR14 which is not only of a similar matrix to the sample but which also has a similar concentration of the analyte(s) under examination. In this respect it is often necessary to analyse two CRXs to cover the upper and lower ranges of concentrations likely to be encountered. This ensures that the method will provide accurate and precise data over the expected range of concentrations.
It must be emphasized, however, that the use of a validated method, suitable instrumentation, experienced personnel, etc. does not guarantee the regular production of reliable data. All analytical work should be done under a system of quality control (the steps taken to minimise errors) and a system of quality assessment (the procedure adopted to verify that the errors are within the acceptable limits).
10.1 Quality Control
The elements of good quality control are as follows:
- Consistent use of reliable qualified personnel, and well-maintained instrumentation.
- Appropriate calibrations and standards.
- Close supervision of all operations by senior personnel.
- Use of CRNs for evaluation methodology.
- Use of reference materials on a regular basis throughout the monitoring programme to check that analytical performance is maintained.
- Participation, encouraged by senior management, in interlaboratory checks of analytical performance (this is the only independent method available to check on a laboratory's analytical capability, see Appendix 4).
10.2 Quality Assessment
The establishment of a system of control charts is the main element of this assessment technique. Control charts are plots of the results of analyses of the same sample over a period of time (see Appendix 5). They allow analysts to check whether their results are falling within the acceptable limits of accuracy and precision.
- 13 -
Data for control charts may consist of the analyses of CRMs and other reference materials. The latter may include homogeneous materials based on real samples which have been prepared by the analyst (known as internal reference materials).
Regular analyses for control chart purposes are essential to avoid waste of valuable time and effort spent on analytical work. Ideally, daily analyses of such internal reference materials should be performed so that only one batch of analytical data is lost if the analysis gets Out of control. Many laboratories devote about 10% of their total routine effort to quality control and assessment (see also section 9).
11. DOCUMENTATION AND REPORTING OF DATA
The adoption of the following guidelines by a laboratory should provide adequate documentation: to support any data report or decisions on the results of its monitoring programmes, and to allow it to trace samples from the collection stage to the completion of its analyses by providing a record of the appropriate data in logbooks or in computer files.
11.1 Documentation
The following documentation is necessary for a laboratory participating in pollutant monitoring activities:
(1) Descriptions of the sampling strategy, methods of collection, procedures of storage, pre-treatment and analytical procedures.
Sample documentation (description of organisms, numbers or individuals collected for each sample, weights of tissue taken for analysis (individual tissue or homogenate).
Evidence of successful evaluation and testing of analytical procedures, including details of accuracy, precision and limit of detection.
The approach used for quality control and quality assessment and evidence that these procedures have been used and have provided acceptable data.
Calibration details, a description of working standards used on each occasion and calculations of results.
- 14 -
(vi) A secure system for the long term storage of data either in logbooks or in computer files is essential. It is therefore advisable to have a duplicate set of records in case one is lost, mislaid or accidently destroyed.
Advice should be sought on the correct method of storing computer tapes and/or discs to ensure the long-term stability of the data files.
11.2 Preliminary assessment, tabulation and storage of data
It has been shown that even the most experienced personnel can make simple arithmetic errors in calculating data. Thus a check should be made for such errors before compiling tables of results. Once this check has been carried out it is appropriate to carry out a preliminary assessment of the quality of the data, prior to its evaluation and publication, to ensure that no erroneous results are included in the data set. This assessment can include a comparison of the results with existing data (i.e., data previously collected by the laboratory or data published in the literature for the study area). Before consigning data to long term storage a final check should be made to ensure that no transcriptional errors have been made in transferring the data (i.e., the re-typing of data sets by typists or data processors can sometimes lead to such errors).
11.3 Publication of data
Data held in logbooks or on a computer which has not been published is effectively lost to the scientific community. Every effort should be made to evaluate and publish these results, even in the simple form of a report. In addition to the results, the contents of a data report would normally include a statement on the aims of the work, a description of the methods used to collect and analyse samples together with a statement on findings and conclusions.
In general it is inadvisable to supply a third party with a copy of your raw data, unless:
it is accompanied by information on its accuracy, precision and limits of determination and details of the sampling record;
or,
it is accompanied by a report from the analyst or principal investigator in which the results have been evaluated.
- 15 -
APPENDIX 1
SELECTION OF ORGANISMS FOR MONITORING PURPOSES
The ideal characteristics of organisms for use as indicators of marine contamination are:
- The organism should accumulate the contaminant without being affected by the levels encountered.
- The organism should be sedentary in order to be representative of the area of collection.
- The organism should be abundant in the study region.
- The organism should be sufficiently long-lived to allow sampling of more than one year class if desired.
- The organism should be of a reasonable size, given adequate tissue for analysis.
- The organism should be easy to sample and hardy enough to survive in the laboratory, allowing (if desired) defecation before analysis and laboratory studies of uptake of contaminants.
- The organism should tolerate brackish water.
- The organism should exhibit high concentration factors allowing direct analysis without pre-concentration.
- A simple relationship should exist between contamination residues in the organisms and the average concentration in the surrounding seawater.
These conditions restrict the useful organisms to a range of fairly large, abundant, widespread, inter-tidal organisms, mainly macro-algae and molluscs.
Filter-feeding molluscs are more likely to reflect conditions in the water column, whilst deposit feeders will respond to sediment chemistry. The concentration of contaminants in the water column, however, will largely reflect effluent discharges and dispersal conditions at the moment of sampling. Filter-feeders are therefore more likely to provide the information required to fulfill the objectives of the monitoring programme.
If a single preferred organism had to be nominated, the common mussel, Mytilis edulis, would be recommended. Othe bivalves (particularly mussels and oysters) may also fulfill the criteria indicated. Care must be taken with species identification as concentration factors of some contaminants vary widely between species.
- 16 -
APPENDIX 2
ACCURACY, PRECISION AND LIMIT OF DETECTION OF ANALYTICAL MEASUREMENTS
1. Accuracy
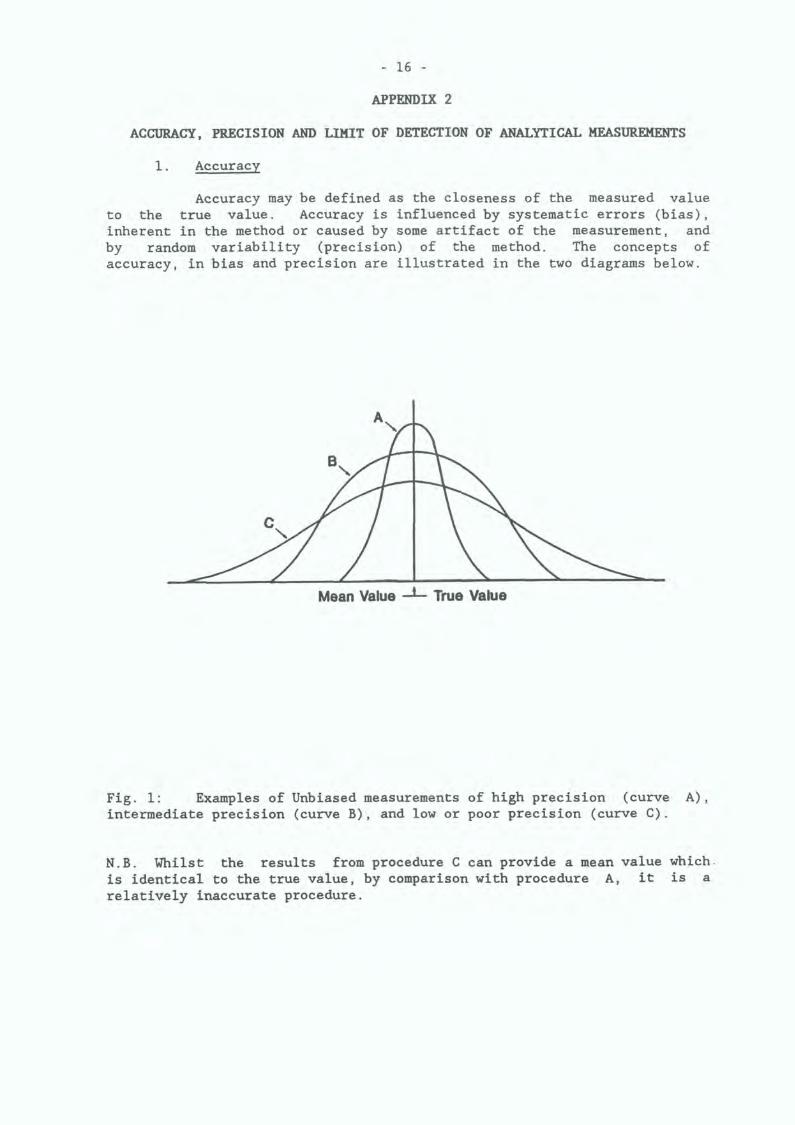
Accuracy may be defined as the closeness of the measured value to the true value. Accuracy is influenced by systematic errors (bias), inherent in the method or caused by some artifact of the measurement, and by random variability (precision) of the method. The concepts of accuracy, in bias and precision are illustrated in the two diagrams below.
Mean Value —i— True Value
Fig. 1: Examples of Unbiased measurements of high precision (curve A), intermediate precision (curve B), and low or poor precision (curve C).
N.B. Whilst the results from procedure C can provide a mean value which-is identical to the true value, by comparison with procedure A, it is a relatively inaccurate procedure.
- 17 -
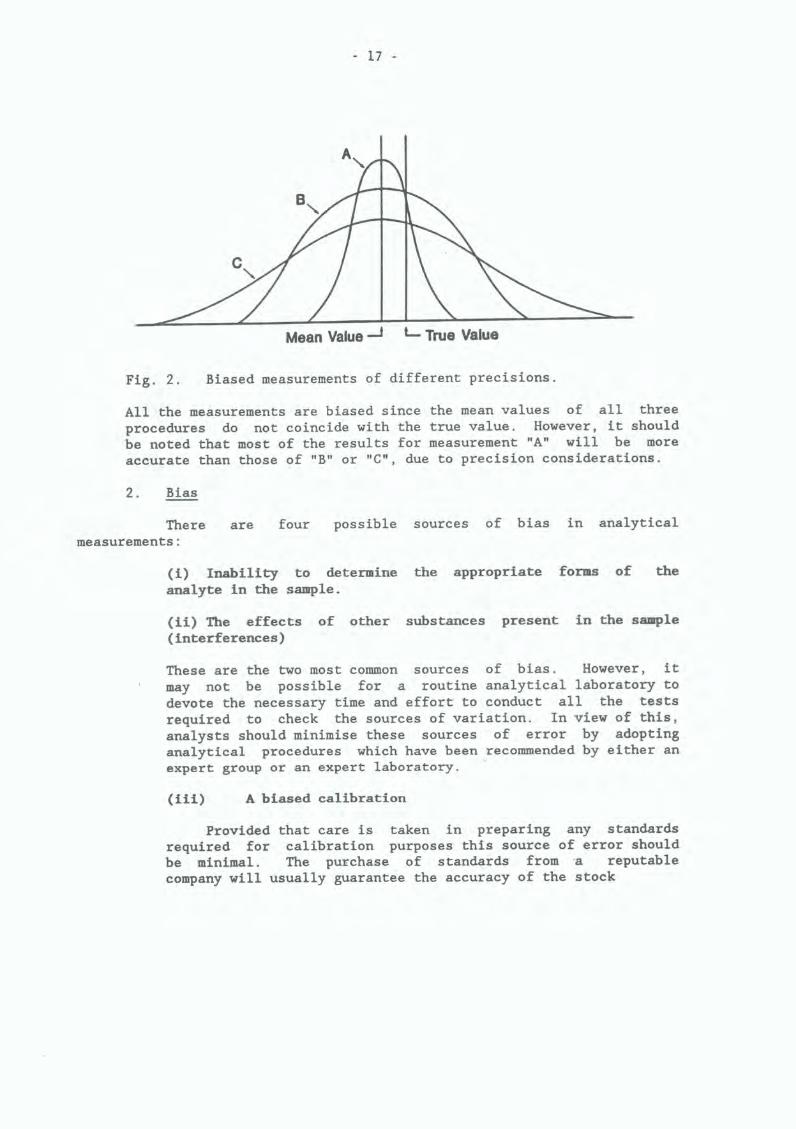
Mean Value - True Value
Fig. 2. Biased measurements of different precisions.
All the measurements are biased since the mean values of all three procedures do not coincide with the true value. However, it should be noted that most of the results for measurement "A" will be more accurate than those of "B" or "C", due to precision considerations.
2. Bias
There are four possible sources of bias in analytical measurements:
Inability to determine the appropriate forms of the analyte in the sample.
The effects of other substances present in the sample (interferences)
These are the two most common sources of bias. However, it may not be possible for a routine analytical laboratory to devote the necessary time and effort to conduct all the tests required to check the sources of variation. In view of this, analysts should minimise these sources of error by adopting analytical procedures which have been recommended by either an expert group or an expert laboratory.
A biased calibration
Provided that care is taken in preparing any standards required for calibration purposes this source of error should be minimal. The purchase of standards from a reputable company will usually guarantee the accuracy of the stock
- 18 -
standards. The accuracy of working standards (dilutions of the stock standards) will however be determined by the ability of the analyst to carefully carry out the necessary preparatory work, particularly with respect to the cleanliness of operations. Inattention to this aspect can lead to contaminated standards and therefore inaccurate calibrations.
N.B. Remember to double check dilutions of stock standards since simple errors (using the wrong size of pipette or making a mistake in the calculation of the dilution required) can lead to inaccurate standards.
If analytical instruments are not well maintained and serviced regularly the response of them will vary with time thus affecting calibrations.
(iv) A biased blank correction
In theory, a blank correction involves the analysis of a sample which contains negligible concentrations of the analytes in a matrix similar to the samples being analysed. This ideal situation is difficult to achieve in practice since "field blanks" are not easily obtained. Whenever possible, however, such blanks should be used and processed in exactly the same way as samples. The reduction or minimisation of a blank value and its variability can be achieved by:
ensuring that only high quality reagents and labware are used in the analytical procedure;
and
ensuring that all operations are conducted with rigorously cleaned labware and in laboratories which are free from sources of contamination.
3. Precision
Precision, which is defined as the random variability of the measurement procedure, can vary within and between batches of analyses. An estimate of precision from only one batch of analyses can therefore give an over-optimistic estimate of subsequent routine analytical results. Precision should be estimated from a series of analyses, on the same material, conducted over a period of time. This approach enables the total random error to be separated into the error arising from
- 19 -
variations within and between batches of analyses. This information can be useful in identifying the location and magnitude of sources of errors. e.g., a large value for between-batch standard deviation may indicate a changing calibration. Similarly a large value for within - batch standard deviation may inducate a contamination problem.
Since the precision of analytical results often depends on the concentration of the analyte, it is necessary to analyse samples which cover the upper and lower limits of the analytical method. This can be done by choosing the appropriate CRMs (see Appendix 3) to cover the range or by analysing spiked samples of different concentrations.
4. Limit of detection
Limit of detection (LOD) is that concentration at which the analyte can be quantified to a given accuracy with an agreed degree of confidence. The LOD of an analytical procedure can be calculated as follows:
St — Sb+constant . vSb+Kv
LOD is based on the relationship between the gross analytical signal (St), the field blank (Sb) and the variability in the field blank (v) measurements.
(Field blanks are samples that contain the analyte(s) at levels below the LOD. These are difficult to obtain so in most instances analysts substitute reagent blanks for them).
In practice most analysts define LOD using a K of 3.
i.e., LOD - Sb + 3v
Measurements below 3v should be reported as not detected (nd) with the limit of detection given in parenthesis. In the region 3v - lOv measurements should be reported as detected, again with the LOD being given in parenthesis.
- 20 -
APPENDIX 3
REFERENCE MATERIALS (RMs)
A comprehensive list of marine RMs can be found in the latest edition of "Standard and Reference Materials for Marine Science (NOAA Technical Memorandum NOS OMA 51)*" which is produced by the U.S. National Oceanic and Atmospheric Administration in cooperation with the IOC/IAEA/IJNEP Group of Experts on Standards and Reference Materials (CESREM). In this document a description is given of each RN (its preparation, its composition and in the case of CRMs the values for the analyte(s) in question) together with the name and address of the organisation from which the RM(s) can be purchased.
At the time of preparing this document there are five major organisations which are actively involved in the production of marine RMs for contaminants in biological tissue. They are:
National Institute of Standards, Science and Technology (NIST), Office of Standard Reference Materials, Gaithersburg, MD 20899 USA.
National Research Council of Canada (NRCC): Institute for Environmental Chemistry, Montreal Rd., Ottawa, Canada K1A OR6; or Institute for Marine Biosciences, 1411 Oxford St., Halifax, NS, Canada, B3H M.
National Institute for Environmental Studies (NIES), Yatabe-machi, Tsukuba, Ibarake 305, Japan.
International Atomic Energy Agency (IAEA), International Laboratory of Marine Radioactivity, Stade Louis II, 19 Avenue des Castellans, MC 98000, Principality of Monaco.
Community Bureau of Reference (BCR), Community of European Communities, 200 rue de la Loi, B-1049 Brussels, Belgium.
Some commonly used marine RNs are listed below together with the organisation that supply them.
Material Matrix Analyte(s) Supplier
TORT-i Lobster Metals (high conc) NRCC LUTS -1 hepatopancreas
DORN-1 dogfish muscle Metals (low conc) NRCC
* Document available from: Intergovernmental Oceanographic Commission (bC), 7, Place de Fontenoy, 75700 Paris, France.
- 21 -
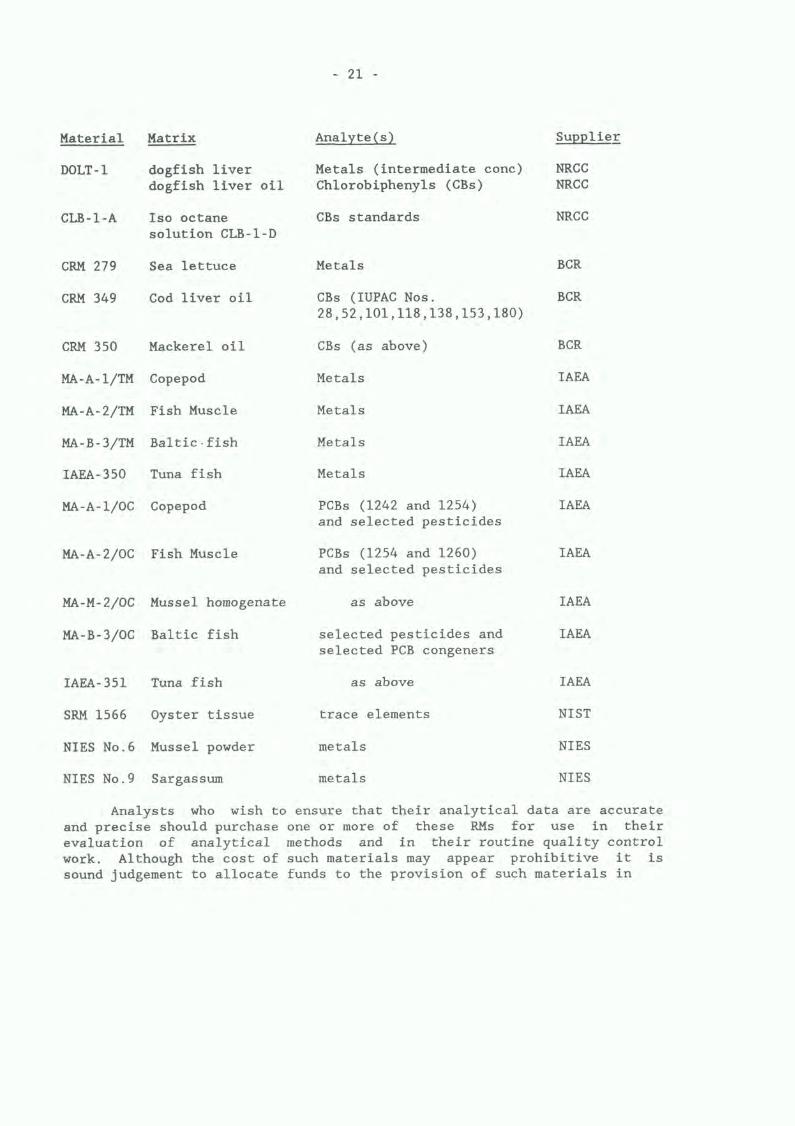
Material Matrix Analyte(s) Supplier
DOLT-i dogfish liver Metals (intermediate cone) NRCC dogfish liver oil Chlorobiphenyls (CBs) NRCC
CLB-l-A Iso octane CBs standards NRCC solution CLB-l-D
CRM 279 Sea lettuce Metals BCR
CRM 349 Cod liver oil CBs (IUPAC Nos. BCR 28,52,101,118,138,153,180)
CRM 350 Mackerel oil CBs (as above) BCR
MA-A-i/TM Copepod Metals IAEA
MA-A-2/TM Fish Muscle Metals IAEA
MA-B-3/TM Baitic.fish Metals IAEA
IAEA-350 Tuna fish Metals IAEA
MA-A-l/OC Copepod PCBs (1242 and 1254) IAEA and selected pesticides
MA-A-2/OC Fish Muscle PCBs (1254 and 1260) IAEA and selected pesticides
MA-M-2/OC Mussel homogenate as above IAEA
MA-B-3/OC Baltic fish selected pesticides and IAEA selected PCB congeners
IAEA-351 Tuna fish as above IAEA
SRM 1566 Oyster tissue trace elements NIST
NIES No.6 Mussel powder metals NIES
NIES No.9 Sargassum metals NIES
Analysts who wish to ensure that their analytical data are accurate and precise should purchase one or more of these RMs for use in their evaluation of analytical methods and in their routine quality control work. Although the cost of such materials may appear prohibitive it is sound judgement to allocate funds to the provision of such materials in
- 22 -
order to ensure that time and effort are used constructively and productively. Time devoted to quality assurance work (Ca 10% of an analysts time) is time that is well invested.
N.B. Analysts should not use non-marine RMs for validating analytical methods and quality control work associated with marine monitoring programmes. They should choose RN(s) which have matrices which are either identical, or very similar, to the samples under study and which cover the upper and lower range of concentration of contaminants being measured. Further information on the correct use of Reference Materials may be obtained from the literature cited in section 2 of these guidelines.
- 23 -
APPENDIX 4
INTERCOMPARI SON EXERCISES
These exercises provide analysts with an opportunity to obtain an independent assessment of the quality of analytical data produced by them. They also allow others, including coordinators of multi-laboratory monitoring programmes, to assess the comparability (and in some cases accuracy) of the data being produced by participants in these programmes. They provide a stimulous to improve methodology and encouragement to adopt state-of-the-art methodology. Whenever possible analysts should participate, and be encouraged to participate by their line managers, in such exercises.
The exercises are normally conducted using blind samples - homogenous substances which contain unknown concentrations of the analyte in a matrix identical, or similar, to that normally examined in the associated monitoring programme. Occasionally, analysts receive samples which contain known (but undisclosed to them) concentrations of analyte(s). In all cases these materials are specially prepared for such exercises.
Participants in such exercises are usually asked to analyse the materials by the analytical method(s) used in their normal monitoring work. Coordinators of exercises accept that the results submitted by participants will be the best data produced by them, since experience has shown that greater than usual care is taken by analysts during the analysis of such materials. Well designed exercises will usually include several materials to cover the range of concentrations of analytes and different matrices normally encountered in monitoring programmes in order to assess differences in analytical performance at the upper and lower ranges of concentration. Coordinators of exercises will try to ensure that a sufficient number of experts participate to provide some degree of standardisation or validation for the exercLse. The absence of experts automatically means that the results from participants can only be compared rather than assessed for bias.
It is essential that the quality of analytical work is maintained during and in between exercises. Only the analyst can ensure that this actually happens.
For further information on specific exercises, please contact the addresses given on the inside back cover of this document.

- 24 -
APPENDIX 5
ANALYTICAL QUALITY CONTROL CHARTS (AQCC)
1. Purpose of AQCCs
It has been recommended that a reference material should be analysed periodically to provide a check on the quality of analytical data. The simplist way to assess the results of these analyses is to examine them at the end of the analytical period and decide whether or not they are satisfactory, and thus whether or not the results for samples are acceptable. This approach is very subjective and a much better approach is to plot the results of the analysis of RMs on a simple chart, which contains guide lines that allow an objective decision to be made on the quality of the data. This chart is known as an analytical quality control chart (AQCC).
2.1 Construction of an AQCC
Analysts are reminded that before a method is used routinely for samples it must have been rigorously assessed to ensure that it will provide data of the required quality. Assuming that such a method is used the analyst should carry out the following procedure to construct an AQCC, along the lines of that given below in Fig. 1.
Analytical Quality Control Chart
C 0 n C
0 f
a n
y t e
n
R M
Periodic measurements of RM
Figure 1. Blank control chart
UCL
UWL
Mean
X LWL
LCL
- 25 -
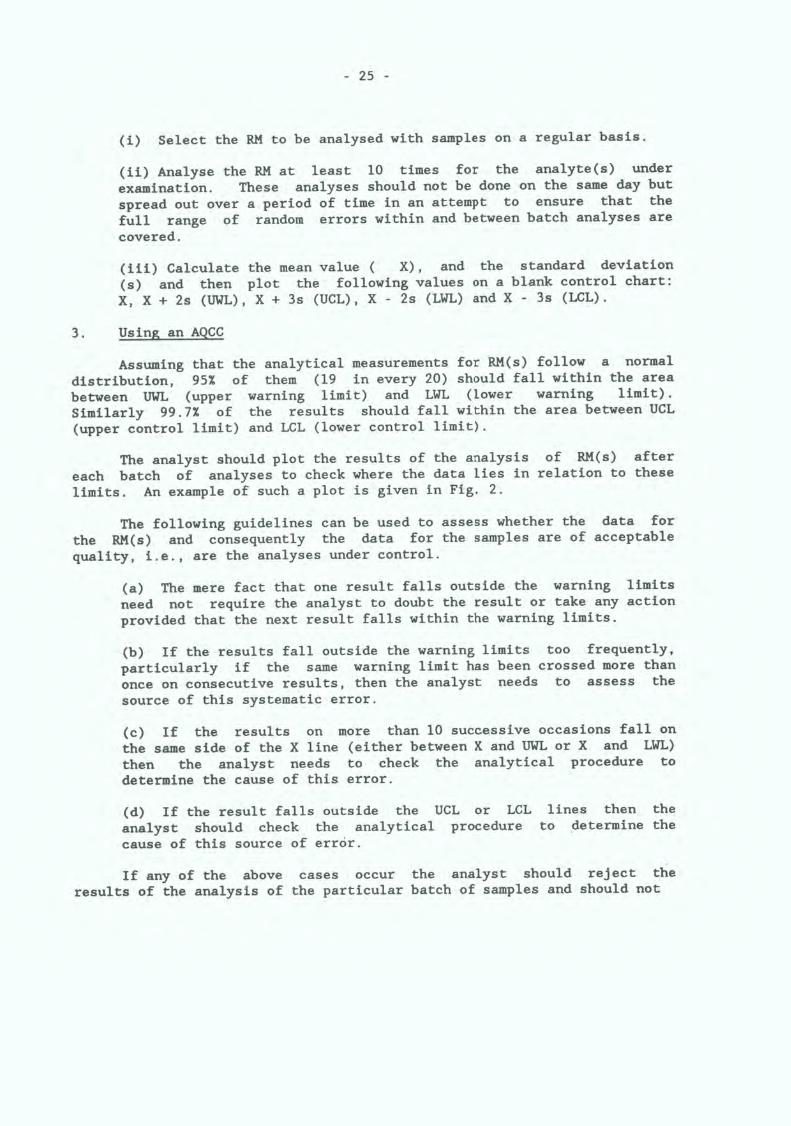
(1) Select the RM to be analysed with samples on a regular basis.
Analyse the RM at least 10 times for the analyte(s) under examination. These analyses should not be done on the same day but spread out over a period of time in an attempt to ensure that the full range of random errors within and between batch analyses are covered.
Calculate the mean value ( X), and the standard deviation (s) and then plot the following values on a blank control chart: X, X + 2s (UWL), X + 3s (UCL), X - 2s (LWL) and X - 3s (LCL).
3. Using an AQCC
Assuming that the analytical measurements for RM(s) follow a normal distribution, 95% of them (19 in every 20) should fall within the area
between UWL (upper warning limit) and LWL (lower warning limit). Similarly 99.7% of the results should fall within the area between UCL (upper control limit) and LCL (lower control limit).
The analyst should plot the results of the analysis of RN(s) after each batch of analyses to check where the data lies in relation to these limits. An example of such a plot is given in Fig. 2.
The following guidelines can be used to assess whether the data for the RN(s) and consequently the data for the samples are of acceptable quality, i.e., are the analyses under control.
The mere fact that one result falls outside the warning limits need not require the analyst to doubt the result or take any action provided that the next result falls within the warning limits.
If the results fall outside the warning limits too frequently, particularly if the same warning limit has been crossed more than once on consecutive results, then the analyst needs to assess the source of this systematic error.
If the results on more than 10 successive occasions fall on the same side of the X line (either between K and UWL or X and LWL) then the analyst needs to check the analytical procedure to determine the cause of this error.
If the result falls outside the UCL or LCL lines then the analyst should check the analytical procedure to determine the cause of this source of error.
If any of the above cases occur the analyst should reject the results of the analysis of the particular batch of samples and should not
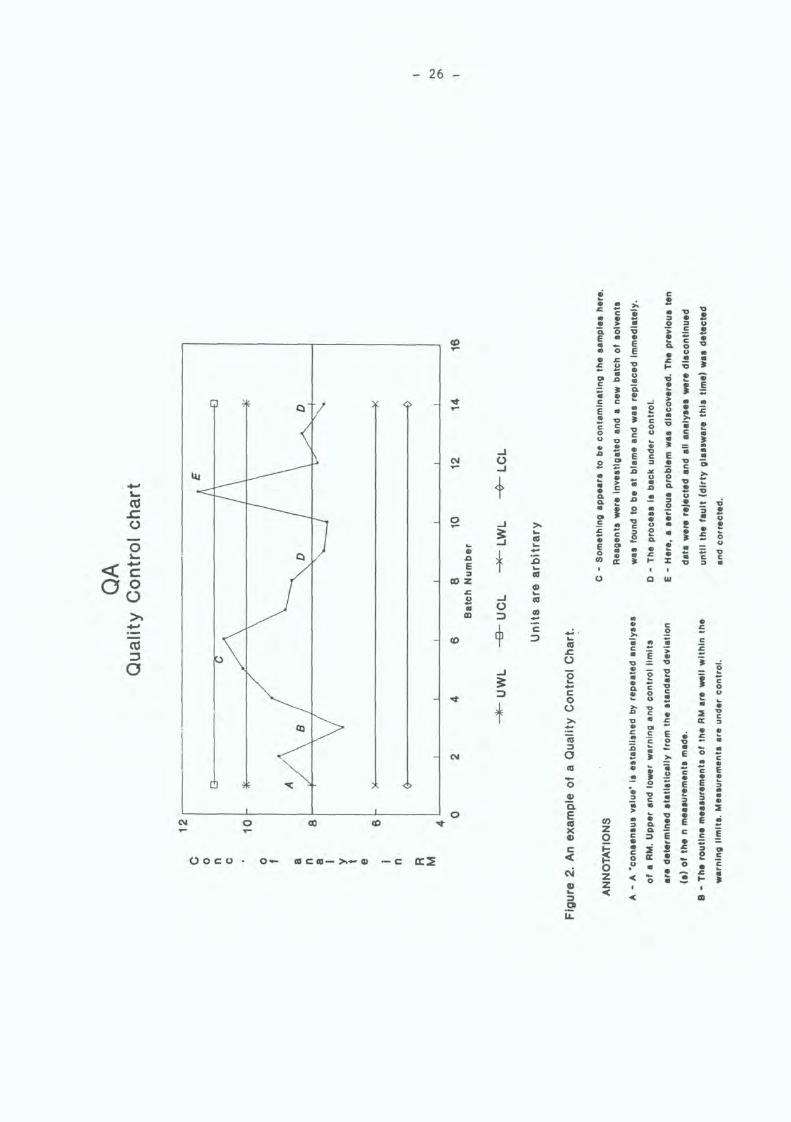
- 26 -
I co >
J.
01 0
QOCO 0 Ct—>..-Q) —C D
r
F
—I CM
+
0 —I > cc
-J I- cis ; a
I
0 th
C-) —j
4- C 0
cc
CL
to
04
LL
co -C C-)
0
WON EM
>1
co
0
C - 0 o
• 10 ci
o S
Si • • o I
2' a I- 0 IJ
I. 0 S 0 U V c I U
0
C,) z 0 I-
0 z z
V U
•
• • S
i I
0
V C S S C
:E • • S S
C U

- 27 -
carry out any further analysis of samples until the source(s) of the errors have been identified and he/she is satisfied that future analyses will be under control.
Use of Internal Reference Materials
The accuracy of a method can only be checked with an SRN or a CRM for which the mean values and standard deviations are well documented. Analysts who choose to use their own specially prepared RN (i.e., an internal RN, IRM) for quality control purposes should note that they are primarily checking the precision of measurements and not their accuracy. These IRMs are very convenient however, for analyses where large quantities of materials are required for each determination (e.g., analyses for organic contaminants) and where the cost of these materials for QC charts would be prohibitive. Full instructions on the preparation and calibration of IRMs will be given in another publication in the present series.
Further information
The relevant publications listed in Section 2 of these guidelines contain valuable information on the correct use of reference materials and the application of QC charts. They should form part of every analytical laboratory's reference collection.
Issued by:
Programme Activity Centre for Oceans and Coastal Areas United Nations Environment Programme
Additional copies of this publication can be obtained from:
Programme Activity Centre for Oceans and Coastal Areas United Nations Environment Programme
P.O. Box 30552 NAIROBI
Kenya
or from
Marine Environmental Studies Laboratory International Laboratory of Marine Radioactivity
IAEA 19, Avenue des Castellans
MC 98000 MONACO