consumer perceived value and consumer loyalty in the healthcare sector
TRANSCRIPT
Seediscussions,stats,andauthorprofilesforthispublicationat:https://www.researchgate.net/publication/260908835
ConsumerPerceivedValueandConsumerLoyaltyintheHealthcare,JournalofRelationshipMarketing,(2011),Vol.10,No.2,88-112
ArticleinJournalofRelationshipMarketing·February2011
CITATIONS
0
READS
27
1author:
Someoftheauthorsofthispublicationarealsoworkingontheserelatedprojects:
RoleofentrepreneurshipinhospitalsViewproject
HardeepChahal
UniversityofJammu
70PUBLICATIONS199CITATIONS
SEEPROFILE
AllcontentfollowingthispagewasuploadedbyHardeepChahalon17November2014.
Theuserhasrequestedenhancementofthedownloadedfile.Allin-textreferencesunderlinedinblue
arelinkedtopublicationsonResearchGate,lettingyouaccessandreadthemimmediately.
This article was downloaded by: [Hardeep Chahal]On: 07 September 2014, At: 10:48Publisher: RoutledgeInforma Ltd Registered in England and Wales Registered Number: 1072954 Registeredoffice: Mortimer House, 37-41 Mortimer Street, London W1T 3JH, UK
Journal of Relationship MarketingPublication details, including instructions for authors andsubscription information:http://www.tandfonline.com/loi/wjrm20
Consumer Perceived Value and ConsumerLoyalty in the Healthcare SectorHardeep Chahal a & Neetu Kumari aa Department of Commerce , University of Jammu , Jammu, Jammuand Kashmir, IndiaPublished online: 14 Jun 2011.
To cite this article: Hardeep Chahal & Neetu Kumari (2011) Consumer Perceived Value andConsumer Loyalty in the Healthcare Sector, Journal of Relationship Marketing, 10:2, 88-112, DOI:10.1080/15332667.2011.577729
To link to this article: http://dx.doi.org/10.1080/15332667.2011.577729
PLEASE SCROLL DOWN FOR ARTICLE
Taylor & Francis makes every effort to ensure the accuracy of all the information (the“Content”) contained in the publications on our platform. However, Taylor & Francis,our agents, and our licensors make no representations or warranties whatsoever as tothe accuracy, completeness, or suitability for any purpose of the Content. Any opinionsand views expressed in this publication are the opinions and views of the authors,and are not the views of or endorsed by Taylor & Francis. The accuracy of the Contentshould not be relied upon and should be independently verified with primary sourcesof information. Taylor and Francis shall not be liable for any losses, actions, claims,proceedings, demands, costs, expenses, damages, and other liabilities whatsoever orhowsoever caused arising directly or indirectly in connection with, in relation to or arisingout of the use of the Content.
This article may be used for research, teaching, and private study purposes. Anysubstantial or systematic reproduction, redistribution, reselling, loan, sub-licensing,systematic supply, or distribution in any form to anyone is expressly forbidden. Terms &Conditions of access and use can be found at http://www.tandfonline.com/page/terms-and-conditions
Journal of Relationship Marketing, 10:88–112, 2011Copyright © Taylor & Francis Group, LLCISSN: 1533-2667 print / 1533-2675 onlineDOI: 10.1080/15332667.2011.577729
Consumer Perceived Value and ConsumerLoyalty in the Healthcare Sector
HARDEEP CHAHAL and NEETU KUMARIDepartment of Commerce, University of Jammu, Jammu, Jammu and Kashmir, India
This study provides conceptual as well as empirical investigation ofconsumer perceived value (CPV) and consumer loyalty (CL) mea-sures in the healthcare sector. It also offers an insight regardingthe role of CPV in influencing CL. The data were collected from515 hospitalised patients of 2 tertiary hospitals, namely the Gov-ernment Medical College and Hospital (public) and Acharya ShriChander College of Medical Sciences and Hospital (private) sectoroperating in Jammu, North India, from July 2009 to October 2009.Exploratory factor analysis and confirmatory factor analysis wereused to analyse CPV and CL. The results suggest that CPV is a func-tion of acquisition value, transaction value, efficiency value, aes-thetic value, social interaction value, and self-gratification value.Similarly, CL is related to preference loyalty (i.e., using provideragain for same services, using provider again for different ser-vices), recommending provider to others, price indifference loyalty,and dissatisfaction response. The study underscores significant di-mensions of consumer value and CL and validates the relationshipbetween value and loyalty in healthcare service sector. The CPV andCL instruments include important aspects of patients’ perceptionsof healthcare services. The scales are psychometrically adequateand are recommended for evaluating patients’ experiences of thequality of healthcare services. The study is limited theoretically toassessing the relationship between CPV and CL. Their relationshipswith other measures, such as consumer experiences, quality, satis-faction, service dominant logic, and image, need to be assessed infurther works.
KEYWORDS consumer loyalty, consumer perceived value, health-care services
Address correspondence to Hardeep Chahal, Department of Commerce, University ofJammu, Jammu 180006, Jammu and Kashmir, India. E-mail: [email protected]
88
Dow
nloa
ded
by [
Har
deep
Cha
hal]
at 1
0:48
07
Sept
embe
r 20
14
Consumer Perceived Value and Consumer Loyalty 89
INTRODUCTION
During the past decade, the interest of both marketing practitioners andscholars regarding the notion of consumer value has increased (Cronin,Brady, & Hult, 2000; Fernandez & Bonillo, 2007). Researchers acknowledgethe importance of superior consumer value and consumer loyalty (CL) as im-portant factors for a company’s success in improving customer relationships(Day, 1994) and achieving a sustainable competitive performance (Gronroos,1994; Parasuraman, 1997; Zeithaml, Berry, & Parasuraman, 1996). Specifi-cally, studies on the value and satisfaction relationship (Gallarza & Saura,2004; Lovelock & Wirtz, 2006; Parasuraman, 1997; Sweeney & Soutar, 2001;Sweeney, Soutar, & Johnson, 1999) are available in the literature, but studieson value and loyalty (Parasuraman & Grewal, 2000; Rust & Oliver, 1994;Zeithaml, 1988) are rare, and the relationship between the two has yet tobe explored. Furthermore, the conceptualization of the notion of consumerperceived value (CPV) also remains quite divergent and unclear in the lit-erature. This lack of empirical investigation impedes understanding of therelationship between the value the company offers to its consumers andrelational outcomes, such as CL, that is, subsequent consumer behavioralintentions. Thus, the purpose of this study is to build and empirically testan integrated framework between CPV and CL in addition to focusing onsignificant dimensions of value and loyalty in healthcare sector. The articleis organized as follows. First, we present the conceptual framework under-pinning our study. Then we discuss and develop research hypotheses basedon the reviewed literature. Next, we present the research methodology wefollowed to conduct the study. This is followed by data analysis and test-ing of the hypotheses. Finally, the results, the limitations of the study, andsuggestions for future research are discussed.
RESEARCH GAP AND JUSTIFICATION OF THE STUDY
The studies reviewed highlight the need to work on the relationship betweenCPV and CL (Choi, Cho, Lee, Lee, & Kim, 2004; Cronin et al., 2000; Gallarza &Saura, 2004; Gounaris, Tzempelikos, & Chatzipanagiotou, 2007; Lam, Shakar,& Murthy, 2004). Most of the studies are focused on limited relationshipstrengths, for instance service quality and loyalty (Choi et al., 2004; Cronin &Taylor, 1994; Gross, 2003; Parasuraman, Zeithaml, & Berry, 1988; Sweeneyet al., 1999), satisfaction and loyalty (Corbin, Scott, Kelley, & Schwartz, 2001;de Ruyter, Wetzels, & Bloemer, 1998), and service quality and value (Choiet al., 2004; Cronin et al., 2000; Sweeney et al., 1999). Furthermore, althougha few studies such as Cronin et al. (2000), de Ruyter and Bloemer (1999),Gounaris et al. (2007), Sweeney and Soutar (2001), Parasuraman (1997),and Gallarza and Saura (2004) examined the relationship among value,
Dow
nloa
ded
by [
Har
deep
Cha
hal]
at 1
0:48
07
Sept
embe
r 20
14
90 H. Chahal and N. Kumari
satisfaction, and loyalty, the direct relationship between value and loyaltyhas rarely been assessed (Parasuraman & Grewal, 2000; Rust & Oliver, 1994).There are a few published instruments for evaluating CPV and CL in thehealthcare sector, but they cannot be used because consumer value and loy-alty are context-specific concepts, and perceptions of consumers vary fromplace to place and time to time. Hence, our research proposes a multidi-mensional concept to measure CPV and loyalty in the healthcare sector tofill this research gap.
LITERATURE REVIEW AND RESEARCH HYPOTHESES
CPV
Consumer value in the literature refers to consumers’ overall assessment ofproduct/services utility based on benefits and sacrifices (Zeithaml, 1988).This aspect is well accepted in healthcare services as well (Choi et al., 2004;Corbin et al., 2001; Ekrem & Kirkbir, 2007). Benefits in the healthcare sec-tor are primarily the outcome of good service quality (i.e., CV, satisfaction,loyalty, and image; Choi et al., 2004). In contrast, nonmonetary costs, suchas time spent, mental and physical stress, and monetary cost are elementsof the sacrifice component of perceived quality. Besides the cost–benefitanalysis concept, CPV is also defined from other perspectives. Gronroos(1994) considered emotional and cognitive features; Sweeney and Soutar(2001) considered emotional, social, quality, performance, and price/valuefor money dimensions; and Grewal, Monroe, and Krishan (1998) used trans-action and acquisition concepts to conceptualize CPV. Arnold and Reynolds(2003) added an aesthetic dimension to the social, emotional, functional,epistemic, and emotional value dimensions given by Sheth, Newman, andGross (1991). Similarly Burnis (1993) defined CPV in terms of product value,value-in-use, possession value, and overall value, whereas de Ruyter et al.(1998) used emotional, functional, and logical dimensions of CPV. However,the CPV framework of Mathwick, Malhotra, and Rigdon (2002) and Gal-larza and Saura (2004) is quite comprehensive. For instance, Mathwick et al.identified economic, efficiency, enjoyment, escapism, entertainment, visualappeal, and service excellence dimensions, whereas Gallarza and Saura usedefficiency, service quality, social value, play, aesthetics, perceived monetarycost, perceived ride, time, and effort spent to define CPV. Similarly, Sweeneyet al. (1999), Sweeney and Soutar (2001), and Sanchez et al. (2006) havefound value to be a combination of three dimensions, namely functionalvalue, social value, and emotional value. Ekrem and Kirkbir (2007) sup-ported these dimensions for healthcare services. More recently, Gounariset al. (2007) considered CPV as a function of six elements, namely productvalue, procedural value, personnel value, emotional value, social value, andperceived sacrifice.
Dow
nloa
ded
by [
Har
deep
Cha
hal]
at 1
0:48
07
Sept
embe
r 20
14
Consumer Perceived Value and Consumer Loyalty 91
Because different scholars define CPV in different ways, we considerCPV in the healthcare sector to be a function of six latent dimensions,namely transaction value, efficiency value, aesthetic value, social interac-tion value, self-gratification value, and acquisition value. Acquisition valuerefers to the perceived net gains accrued when products or services areacquired, which is commonly referred to as the tradeoff between benefitsand sacrifices (Mathwick et al., 2002). Past acquisition value based model(Zeithaml, 1988) considers CPV as the perceived net gains associated withthe products or services acquired. That is, the perceived acquisition value ofthe product is positively influenced by the benefits patients believe they aregetting by acquiring and using the services of the hospital and negativelyinfluenced by the money given up to acquire the services. Transaction valuerelates to psychological satisfaction or pleasure or relief gained from getting“services performed” (Grewal et al., 1998; Parasuraman & Grewal, 2000).The user of the services assesses the value of a deal by comparing thesale value to internal reference prices (Grewal et al., 1998). For example,in the healthcare setting the transaction value for a patient is feeling safein the hands of the doctors and receiving post-medical treatment, personalcare, and good medical advice. Therefore, upon examining the price of-fer, the patient might perceive additional value beyond that provided bythe acquisition value. Hence, perceived transaction value is the perceptionof psychological satisfaction obtained from taking advantage of the pricedeal (Grewal et al., 1998). Efficiency value refers to how efficiently and ef-fectively the treatment process is completed (Mathwick et al., 2002). Whenother things are controlled, the consumer selects the hospital (i.e., public orprivate) that is best or most efficient in comparison with others. Because theconsumer does not have a medical background, he or she judges the servicedelivery process based on interactions with service provider to determine theefficiency value. The evaluation may relate to things such as that the staff iswell equipped with necessary training; the doctors explain reasons for tests;they always diagnose the medical problem accurately; the technical supportstaff are careful while running tests, administering injections, and so on;nurses regularly discharge their duties relating to dressing, drips, administer-ing injections, and giving medicine. Furthermore, aesthetic value refers to thevisual appeal that is driven by the design, physical attractiveness, and beautyinherent in the hospital setting (Arnold & Reynolds, 2003). The conduciveinternal environment, neat and clean wards and corridors, hygienically cleanclothing, clean and functional bathrooms, proper ventilation in wards, andso on, contribute to the aesthetic value of the hospital. Social interactionvalue refers to the patient’s interaction with friends, family, staff, as wellas other patients during hospitalization (Sweeney & Soutar, 2001). Socialinteraction theory focuses on people being altruistic, being cohesive, andseeking acceptance and affection in interpersonal relationships. The last di-mension, that is, self-gratification value, refers to improvements in personal
Dow
nloa
ded
by [
Har
deep
Cha
hal]
at 1
0:48
07
Sept
embe
r 20
14
92 H. Chahal and N. Kumari
well-being, relief from stress, alleviation of negative mood, elimination ofloneliness, and giving oneself a special “treat” (Arnold & Reynolds, 2003).The gratification dimension suggests that people are motivated to act in sucha way so as to reduce tension, thereby maintaining inner equilibrium andreturning the self to a state of homeostasis. In the present study, treatment isacknowledged as a form of emotion-focused coping in response to stressfulevents or simply to get one’s mind off a problem. Based on this discussion,we propose the following hypothesis:
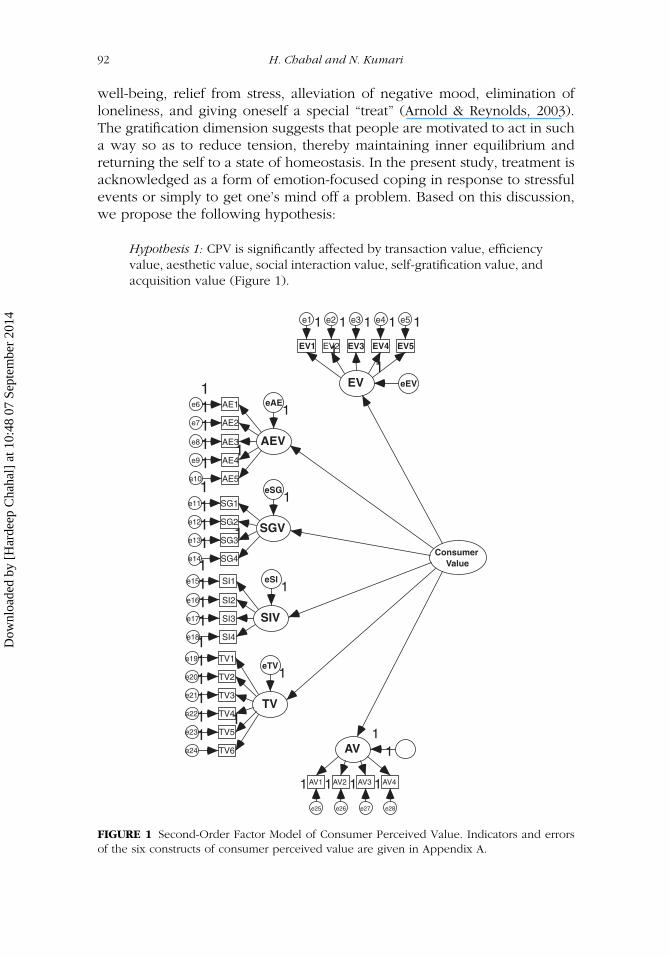
Hypothesis 1: CPV is significantly affected by transaction value, efficiencyvalue, aesthetic value, social interaction value, self-gratification value, andacquisition value (Figure 1).
ConsumerValue
AEV
SGV
SIV
EV
EV1
e1
1
1
EV2
e2 1
EV3
e3 1
EV4
e4 1
EV5
e5 1
AE5e10
11 AE4e9
1 AE3e8
1 AE2e7
1 AE1e6
1
SG4e14
11 SG3e13
1 SG2e12
1 SG1e11
1
SI2e16
1 SI1e15
1
SI3e17
1
SI4e18
1
TV
TV6e24
11 TV5e23
1 TV4e22
1 TV3e21
1 TV2e20
1 TV1e19
1
AV
AV4
e28
1
1AV3
e27
1AV2
e26
1AV1
e25
1
eEV
1
eAE1
eSG1
eSI1
eTV1
1
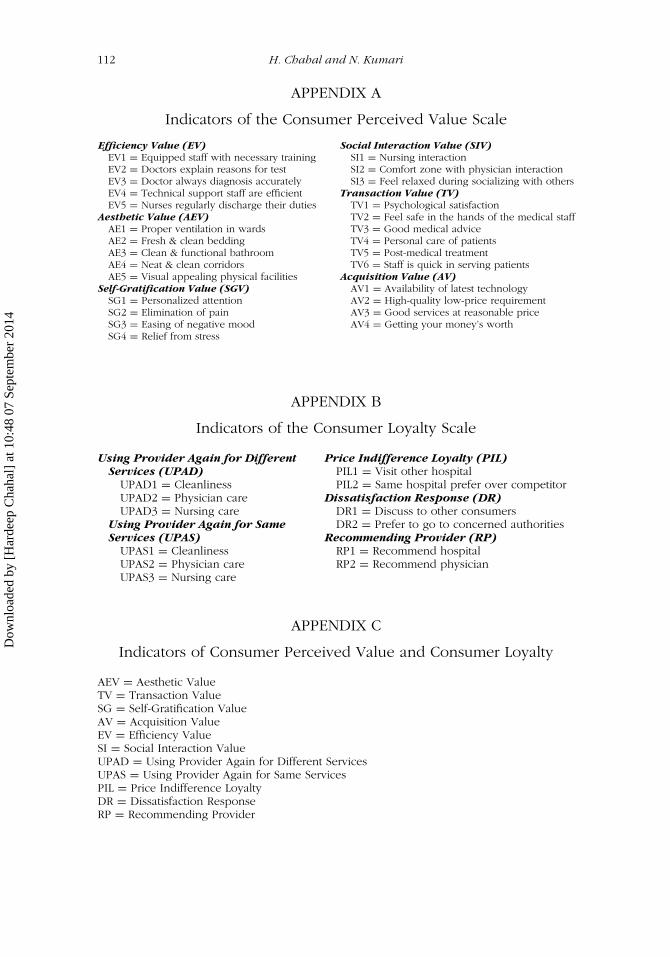
FIGURE 1 Second-Order Factor Model of Consumer Perceived Value. Indicators and errorsof the six constructs of consumer perceived value are given in Appendix A.
Dow
nloa
ded
by [
Har
deep
Cha
hal]
at 1
0:48
07
Sept
embe
r 20
14
Consumer Perceived Value and Consumer Loyalty 93
CL
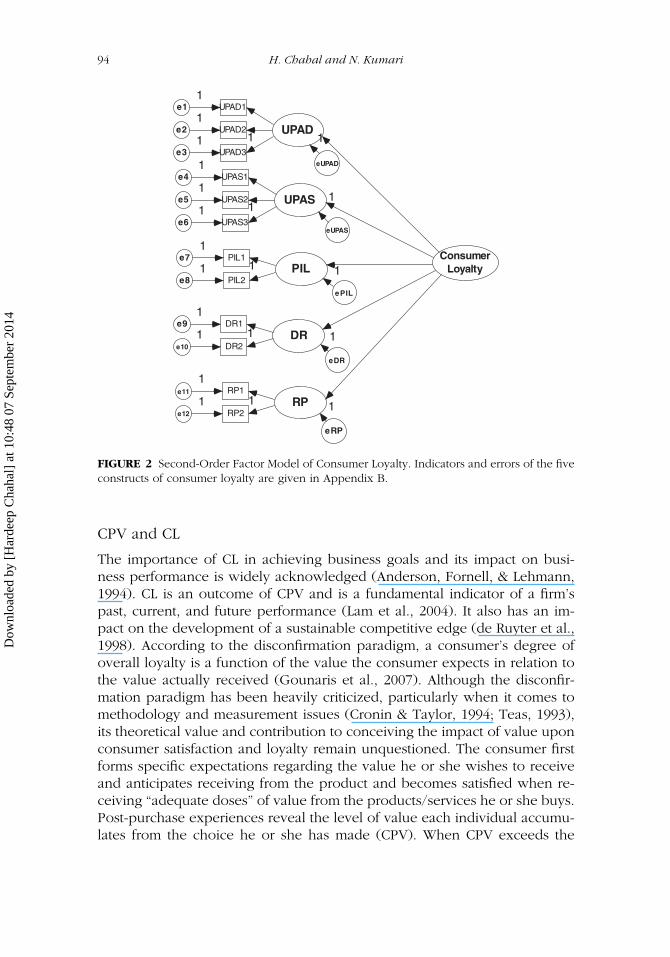
CL is approached as both an attitudinal and a behavioral concept. As anattitudinal concept, it denotes the degree to which a consumer’s disposi-tion toward a service is favorably inclined. This is reflected, for instance, inthe consumer’s willingness to recommend a service provider to other con-sumers consistently over a certain period. Similarly, as a behavioral concept,it reflects the consumer’s commitment to using a preferred service providerdespite the existence of financial and location barriers (de Ruyter et al.,1998). Peltier, Boyt, and Sehibrowsky (2000) considered using the provideragain for the same services (UPAS), using the provider again for differentservices (UPAD), and recommending provider to others (RPO) as three el-ements of patient loyalty. In contrast, de Ruyter et al. (1998) recognizedpreference loyalty, price indifference loyalty, and dissatisfaction response asimportant determinants of patient loyalty. Preference loyalty includes UPASand UPAD. Dissatisfaction response and price indifference loyalty are an-other two elements that relate to loyalty. Hirschman and Holbrook (1982)argued that a dissatisfied consumer has three options for responding to anegative (service) experience: communicate dissatisfaction (voice), continueusing the services without communicating to the concerned authority, ordiscontinue the relationship (exit). Consumers who voice dissatisfaction maycomplain to the service provider, its employees, or external agencies such asconsumer organizations and may remain with the organization if the problemis solved. In the healthcare sector, and especially in public healthcare units,the majority of consumers simply remain inactive and do not undertake anyaction following a negative service experience (Day, 1994). Furthermore, ithas been argued that actually responding to dissatisfaction (e.g., complainingdirectly to the company or complaining to a third party) is negatively relatedto the level of service quality (de Ruyter et al., 1998) and also affects laterloyalty. Lastly, price indifference loyalty is the willingness to pay a premiumprice for a service (de Ruyter et al., 1998). Zeithaml (1988) reported a posi-tive relationship between service quality and the willingness to pay a higherprice and the intention to remain loyal in case of a price increase. In thehealthcare sector, particularly private healthcare organizations, price indiffer-ence loyalty is preferred for the same hospital over competitors even if thefees for medical services/treatment are high. A five-factor model comprisingpreference loyalty, price indifference loyalty, dissatisfaction response, andrecommending provider was used to measure patient loyalty in the presentstudy. Thus, we hypothesised the following:
Hypothesis 2: Preference loyalty (UPAS and UPAD), price indifference loy-alty, dissatisfaction response, and recommending provider significantlyaffect CL (Figure 2).
Dow
nloa
ded
by [
Har
deep
Cha
hal]
at 1
0:48
07
Sept
embe
r 20
14
94 H. Chahal and N. Kumari
ConsumerLoyalty
UPAD
UPAS
PIL
DR
RP
UPAD3e3
11UPAD2e2
1UPAD1e1
1
UPAS3e6
11UPAS2e5
1UPAS1e4
1
PIL2e8
11PIL1e7
1
DR2e10
11DR1e9
1
RP2e12
11RP1e11
1
eUPAS
ePIL
eDR
eUPAD
eRP
1
1
1
1
1
FIGURE 2 Second-Order Factor Model of Consumer Loyalty. Indicators and errors of the fiveconstructs of consumer loyalty are given in Appendix B.
CPV and CL
The importance of CL in achieving business goals and its impact on busi-ness performance is widely acknowledged (Anderson, Fornell, & Lehmann,1994). CL is an outcome of CPV and is a fundamental indicator of a firm’spast, current, and future performance (Lam et al., 2004). It also has an im-pact on the development of a sustainable competitive edge (de Ruyter et al.,1998). According to the disconfirmation paradigm, a consumer’s degree ofoverall loyalty is a function of the value the consumer expects in relation tothe value actually received (Gounaris et al., 2007). Although the disconfir-mation paradigm has been heavily criticized, particularly when it comes tomethodology and measurement issues (Cronin & Taylor, 1994; Teas, 1993),its theoretical value and contribution to conceiving the impact of value uponconsumer satisfaction and loyalty remain unquestioned. The consumer firstforms specific expectations regarding the value he or she wishes to receiveand anticipates receiving from the product and becomes satisfied when re-ceiving “adequate doses” of value from the products/services he or she buys.Post-purchase experiences reveal the level of value each individual accumu-lates from the choice he or she has made (CPV). When CPV exceeds the
Dow
nloa
ded
by [
Har
deep
Cha
hal]
at 1
0:48
07
Sept
embe
r 20
14
Consumer Perceived Value and Consumer Loyalty 95
individual’s expectations, the consumer is satisfied (Anderson et al., 1994;Oliver, 1981), and the same thing over a period of time leads to loyalty(Ravald & Gronroos, 1996). Findings from Wang, Lo, Chi, and Yang (2004)and Gallarza and Saura (2004) show that satisfaction and loyalty are relatedto CPV. However, because CPV comprises elements that carry positive andnegative utility for the consumer, it follows that the former (positive utilityelements) will serve as satisfaction drivers, whereas the latter (negative utilityelements) will reduce the overall level of the consumer’s satisfaction withthe product. We thus hypothesised the following:
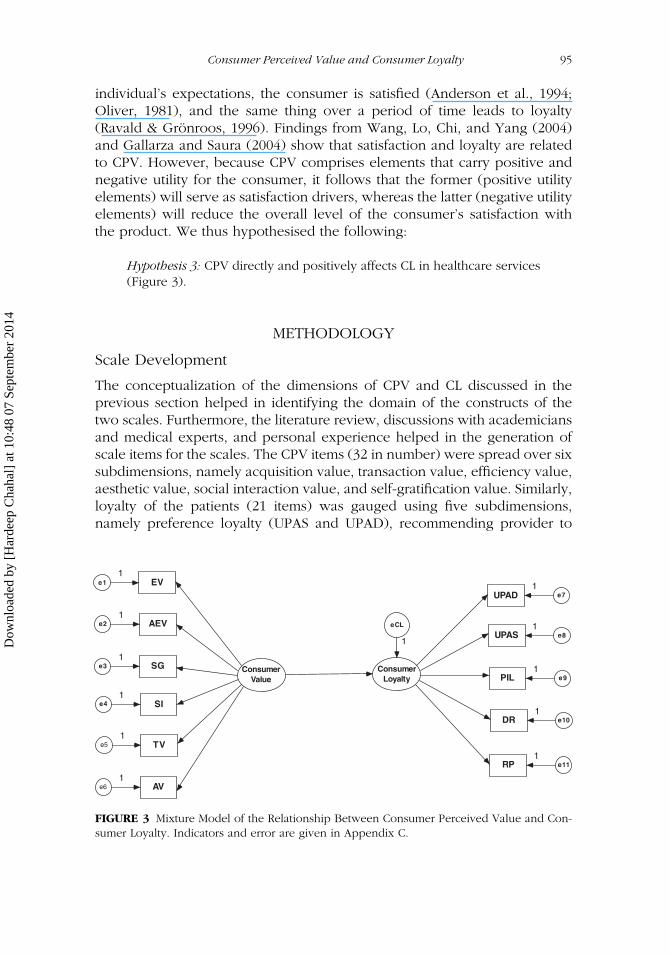
Hypothesis 3: CPV directly and positively affects CL in healthcare services(Figure 3).
METHODOLOGY
Scale Development
The conceptualization of the dimensions of CPV and CL discussed in theprevious section helped in identifying the domain of the constructs of thetwo scales. Furthermore, the literature review, discussions with academiciansand medical experts, and personal experience helped in the generation ofscale items for the scales. The CPV items (32 in number) were spread over sixsubdimensions, namely acquisition value, transaction value, efficiency value,aesthetic value, social interaction value, and self-gratification value. Similarly,loyalty of the patients (21 items) was gauged using five subdimensions,namely preference loyalty (UPAS and UPAD), recommending provider to
ConsumerValue
ConsumerLoyalty
EV
AEV
SG
SI
TV
AV
UPAD
UPAS
PIL
DR
RP
eCL
1
e11
e21
e31
e41
e51
e61
e71
e81
e91
e101
e111
FIGURE 3 Mixture Model of the Relationship Between Consumer Perceived Value and Con-sumer Loyalty. Indicators and error are given in Appendix C.
Dow
nloa
ded
by [
Har
deep
Cha
hal]
at 1
0:48
07
Sept
embe
r 20
14
96 H. Chahal and N. Kumari
others, dissatisfaction response, and price indifference loyalty. Each item inthe two scales was based on a 5-point Likert scale ranging from stronglyagree (5) to strongly disagree (1). The inclusion of a few negative itemshelped in checking for response bias.
Pretesting
Before proceeding with pretesting, we established the face and content va-lidities of the CPV and CL scales for items through deliberations with subjectexperts, doctors, and patients. The suggestions of the experts were incor-porated to make the items more clear and understandable. The scales werepretested on 70 inpatients. At the outset, inter-item analysis was conductedto identify items that were least correlated with the respective value andloyalty dimensions. Such items were later deleted from the final scale. Fur-thermore, the reliability test for the overall scales and subscales of CPV andCL yielded high Cronbach’s alpha scores ranging between .601 and .935,indicating moderate to excellent reliability.
Sample Size
The final sample size of inpatients was identified on the basis of the pretestresults. The total sample frame, including public and private hospitals,came out to 515. The public hospital sample (n = 280) comprised 90patients from medicine, 126 from surgery, 36 from orthopaedics, and 28from ophthalmology. The private hospital sample size (n = 235) included72 patients from medicine, 72 from surgery, 60 from orthopaedics, and 31from ophthalmology.
Data Collection
The data were collected in 2009 from patients using services from two bigreferral public and private hospitals using a personal contact approach fromthe four specialty departments, namely medicine, surgery, orthopaedics, andophthalmology. Hospitalized patients willing to participate in the survey andwith a minimum 4-day stay were considered for the sample.
Assessment of Measurement Scales
The CPV and CL measurement scales were purified in three stages, whichare exploratory factor analysis (EFA), inter-item correlation, and confirmatoryfactor analysis (CFA).
Dow
nloa
ded
by [
Har
deep
Cha
hal]
at 1
0:48
07
Sept
embe
r 20
14
Consumer Perceived Value and Consumer Loyalty 97
EFA
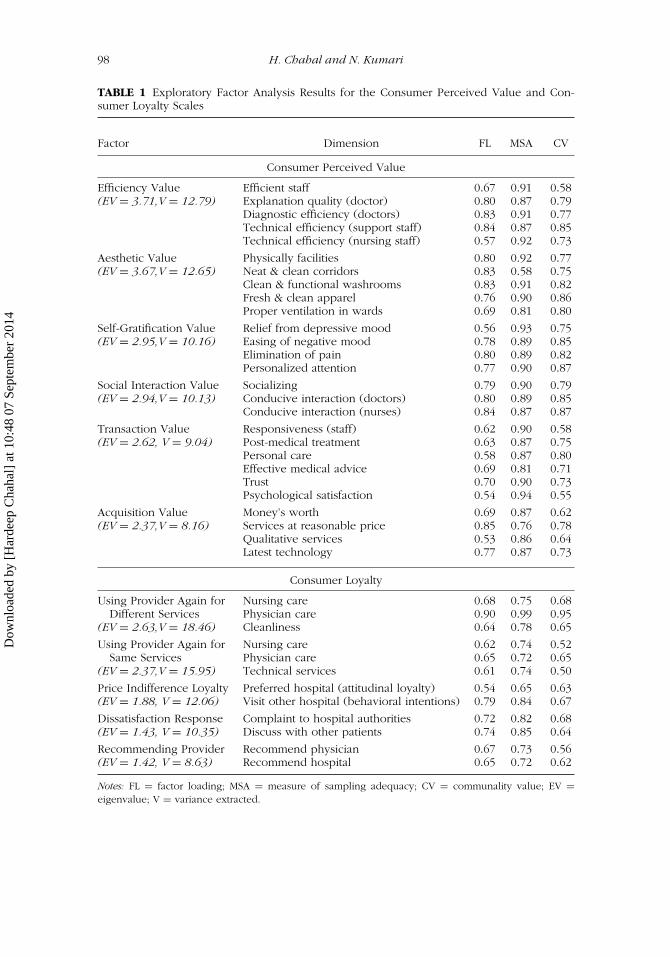
In the first step, EFA using varimax rotation with a focus onKaiser–Meyer–Olkin value greater than .70 and a measure of sampling ad-equacy greater than .50 was applied to identify the significant items formeasuring the value and loyalty constructs and also to examine their multi-dimensional characteristics. Items with low factor loadings and communalityvariance (< 0.50) and items that were poorly related to their hypothesisedfactors or that were associated with more than one factor were deleted be-cause they did not converge properly with the latent construct they weredesigned to measure (Hair, Anderson, Tatham, & Black, 1995). Lastly, anumber of factors were decided on the basis of an eigenvalue greater than1. The factor analysis was run in the first stage on 32 items of the CPV scale,and later different runs were performed until all of the set criteria were metfor the items and factors. The final run of the EFA resulted in six factorscomprising 29 items, namely efficiency, aesthetic, self-gratification, social in-teraction, transaction, and acquisition value as significant dimensions of CPV(see Table 1). The same procedure was undertaken for the CL scale on 21items. Five factors (14 items), that is UPAD, UPAS, price indifference loyalty,dissatisfaction response, and recommending provider resulted in the finalEFA run on the CL data (see Table 1).
INTER-ITEM ANALYSIS
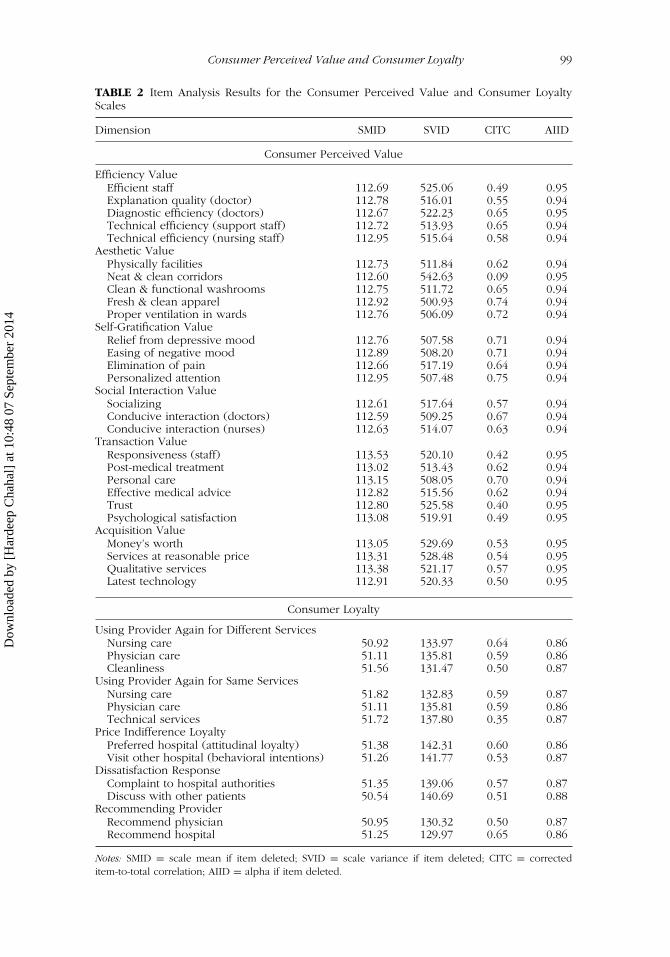
After applying EFA, the next step was to apply additional item analysis inwhich items having low item-to-total correlation coefficients (<0.30) wereeliminated. Alpha value if item deleted, scale mean if item deleted, scalevariance if item deleted, and average inter-item correlation were examinedto determine the impact of the items on the reliability of the scale (Netmeyer,Bearder, & Sharma, 2003). Lastly, as a standard for this assessment, the scalefor each construct had to achieve a minimum alpha of .70. All items acrossthe six constructs of the value scale (i.e., efficiency value, aesthetic value,self-gratification value, transaction value, social interaction value, and acqui-sition value) showed a slight variation in scale mean if item deleted and incorrected item–total correlation and showed average inter-item correlationsgreater than .3 (see Table 2). Thus, all of the items on the CPV scales se-lected after EFA were retained for further analysis. The procedure was alsoapplied to CL items. The Cronbach’s alpha of the value scale (.95) indicateda high degree of consistency of data. The item analysis resulted in 27 itemson the CPV scale and 12 items on the CL scale. The item analysis scores arepresented in Table 2.
Dow
nloa
ded
by [
Har
deep
Cha
hal]
at 1
0:48
07
Sept
embe
r 20
14
98 H. Chahal and N. Kumari
TABLE 1 Exploratory Factor Analysis Results for the Consumer Perceived Value and Con-sumer Loyalty Scales
Factor Dimension FL MSA CV
Consumer Perceived Value
Efficiency Value Efficient staff 0.67 0.91 0.58(EV = 3.71,V = 12.79) Explanation quality (doctor) 0.80 0.87 0.79
Diagnostic efficiency (doctors) 0.83 0.91 0.77Technical efficiency (support staff) 0.84 0.87 0.85Technical efficiency (nursing staff) 0.57 0.92 0.73
Aesthetic Value Physically facilities 0.80 0.92 0.77(EV = 3.67,V = 12.65) Neat & clean corridors 0.83 0.58 0.75
Clean & functional washrooms 0.83 0.91 0.82Fresh & clean apparel 0.76 0.90 0.86Proper ventilation in wards 0.69 0.81 0.80
Self-Gratification Value Relief from depressive mood 0.56 0.93 0.75(EV = 2.95,V = 10.16) Easing of negative mood 0.78 0.89 0.85
Elimination of pain 0.80 0.89 0.82Personalized attention 0.77 0.90 0.87
Social Interaction Value Socializing 0.79 0.90 0.79(EV = 2.94,V = 10.13) Conducive interaction (doctors) 0.80 0.89 0.85
Conducive interaction (nurses) 0.84 0.87 0.87
Transaction Value Responsiveness (staff) 0.62 0.90 0.58(EV = 2.62, V = 9.04) Post-medical treatment 0.63 0.87 0.75
Personal care 0.58 0.87 0.80Effective medical advice 0.69 0.81 0.71Trust 0.70 0.90 0.73Psychological satisfaction 0.54 0.94 0.55
Acquisition Value Money’s worth 0.69 0.87 0.62(EV = 2.37,V = 8.16) Services at reasonable price 0.85 0.76 0.78
Qualitative services 0.53 0.86 0.64Latest technology 0.77 0.87 0.73
Consumer Loyalty
Using Provider Again for Nursing care 0.68 0.75 0.68Different Services Physician care 0.90 0.99 0.95
(EV = 2.63,V = 18.46) Cleanliness 0.64 0.78 0.65
Using Provider Again for Nursing care 0.62 0.74 0.52Same Services Physician care 0.65 0.72 0.65
(EV = 2.37,V = 15.95) Technical services 0.61 0.74 0.50
Price Indifference Loyalty Preferred hospital (attitudinal loyalty) 0.54 0.65 0.63(EV = 1.88, V = 12.06) Visit other hospital (behavioral intentions) 0.79 0.84 0.67
Dissatisfaction Response Complaint to hospital authorities 0.72 0.82 0.68(EV = 1.43, V = 10.35) Discuss with other patients 0.74 0.85 0.64
Recommending Provider Recommend physician 0.67 0.73 0.56(EV = 1.42, V = 8.63) Recommend hospital 0.65 0.72 0.62
Notes: FL = factor loading; MSA = measure of sampling adequacy; CV = communality value; EV =eigenvalue; V = variance extracted.
Dow
nloa
ded
by [
Har
deep
Cha
hal]
at 1
0:48
07
Sept
embe
r 20
14
Consumer Perceived Value and Consumer Loyalty 99
TABLE 2 Item Analysis Results for the Consumer Perceived Value and Consumer LoyaltyScales
Dimension SMID SVID CITC AIID
Consumer Perceived Value
Efficiency ValueEfficient staff 112.69 525.06 0.49 0.95Explanation quality (doctor) 112.78 516.01 0.55 0.94Diagnostic efficiency (doctors) 112.67 522.23 0.65 0.95Technical efficiency (support staff) 112.72 513.93 0.65 0.94Technical efficiency (nursing staff) 112.95 515.64 0.58 0.94
Aesthetic ValuePhysically facilities 112.73 511.84 0.62 0.94Neat & clean corridors 112.60 542.63 0.09 0.95Clean & functional washrooms 112.75 511.72 0.65 0.94Fresh & clean apparel 112.92 500.93 0.74 0.94Proper ventilation in wards 112.76 506.09 0.72 0.94
Self-Gratification ValueRelief from depressive mood 112.76 507.58 0.71 0.94Easing of negative mood 112.89 508.20 0.71 0.94Elimination of pain 112.66 517.19 0.64 0.94Personalized attention 112.95 507.48 0.75 0.94
Social Interaction ValueSocializing 112.61 517.64 0.57 0.94Conducive interaction (doctors) 112.59 509.25 0.67 0.94Conducive interaction (nurses) 112.63 514.07 0.63 0.94
Transaction ValueResponsiveness (staff) 113.53 520.10 0.42 0.95Post-medical treatment 113.02 513.43 0.62 0.94Personal care 113.15 508.05 0.70 0.94Effective medical advice 112.82 515.56 0.62 0.94Trust 112.80 525.58 0.40 0.95Psychological satisfaction 113.08 519.91 0.49 0.95
Acquisition ValueMoney’s worth 113.05 529.69 0.53 0.95Services at reasonable price 113.31 528.48 0.54 0.95Qualitative services 113.38 521.17 0.57 0.95Latest technology 112.91 520.33 0.50 0.95
Consumer Loyalty
Using Provider Again for Different ServicesNursing care 50.92 133.97 0.64 0.86Physician care 51.11 135.81 0.59 0.86Cleanliness 51.56 131.47 0.50 0.87
Using Provider Again for Same ServicesNursing care 51.82 132.83 0.59 0.87Physician care 51.11 135.81 0.59 0.86Technical services 51.72 137.80 0.35 0.87
Price Indifference LoyaltyPreferred hospital (attitudinal loyalty) 51.38 142.31 0.60 0.86Visit other hospital (behavioral intentions) 51.26 141.77 0.53 0.87
Dissatisfaction ResponseComplaint to hospital authorities 51.35 139.06 0.57 0.87Discuss with other patients 50.54 140.69 0.51 0.88
Recommending ProviderRecommend physician 50.95 130.32 0.50 0.87Recommend hospital 51.25 129.97 0.65 0.86
Notes: SMID = scale mean if item deleted; SVID = scale variance if item deleted; CITC = correcteditem-to-total correlation; AIID = alpha if item deleted.
Dow
nloa
ded
by [
Har
deep
Cha
hal]
at 1
0:48
07
Sept
embe
r 20
14
100 H. Chahal and N. Kumari
CFA
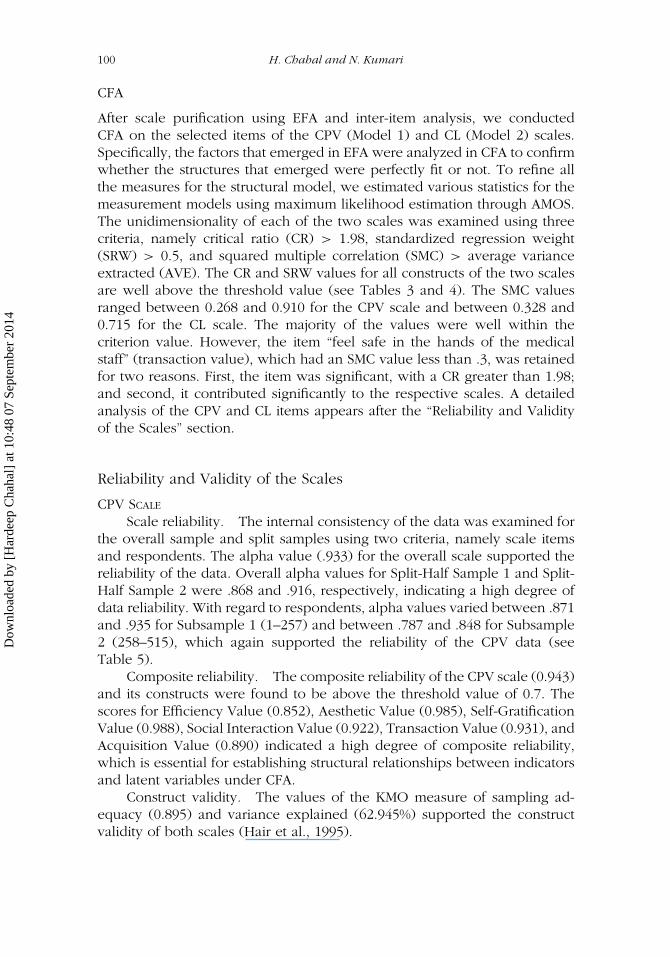
After scale purification using EFA and inter-item analysis, we conductedCFA on the selected items of the CPV (Model 1) and CL (Model 2) scales.Specifically, the factors that emerged in EFA were analyzed in CFA to confirmwhether the structures that emerged were perfectly fit or not. To refine allthe measures for the structural model, we estimated various statistics for themeasurement models using maximum likelihood estimation through AMOS.The unidimensionality of each of the two scales was examined using threecriteria, namely critical ratio (CR) > 1.98, standardized regression weight(SRW) > 0.5, and squared multiple correlation (SMC) > average varianceextracted (AVE). The CR and SRW values for all constructs of the two scalesare well above the threshold value (see Tables 3 and 4). The SMC valuesranged between 0.268 and 0.910 for the CPV scale and between 0.328 and0.715 for the CL scale. The majority of the values were well within thecriterion value. However, the item “feel safe in the hands of the medicalstaff” (transaction value), which had an SMC value less than .3, was retainedfor two reasons. First, the item was significant, with a CR greater than 1.98;and second, it contributed significantly to the respective scales. A detailedanalysis of the CPV and CL items appears after the “Reliability and Validityof the Scales” section.
Reliability and Validity of the Scales
CPV SCALE
Scale reliability. The internal consistency of the data was examined forthe overall sample and split samples using two criteria, namely scale itemsand respondents. The alpha value (.933) for the overall scale supported thereliability of the data. Overall alpha values for Split-Half Sample 1 and Split-Half Sample 2 were .868 and .916, respectively, indicating a high degree ofdata reliability. With regard to respondents, alpha values varied between .871and .935 for Subsample 1 (1–257) and between .787 and .848 for Subsample2 (258–515), which again supported the reliability of the CPV data (seeTable 5).
Composite reliability. The composite reliability of the CPV scale (0.943)and its constructs were found to be above the threshold value of 0.7. Thescores for Efficiency Value (0.852), Aesthetic Value (0.985), Self-GratificationValue (0.988), Social Interaction Value (0.922), Transaction Value (0.931), andAcquisition Value (0.890) indicated a high degree of composite reliability,which is essential for establishing structural relationships between indicatorsand latent variables under CFA.
Construct validity. The values of the KMO measure of sampling ad-equacy (0.895) and variance explained (62.945%) supported the constructvalidity of both scales (Hair et al., 1995).
Dow
nloa
ded
by [
Har
deep
Cha
hal]
at 1
0:48
07
Sept
embe
r 20
14
Consumer Perceived Value and Consumer Loyalty 101
TABLE 3 Critical Ratio (CR), Standardised Regression Weight (SRW), and Squared MultipleCorrelation (SMC) Values for the Consumer Perceived Value Scale
Relationship CR SRW SMC
Construct–Scale RelationshipsAesthetic Value 9.821 0.773 0.597Transaction Value 11.498 0.813 0.662Self-Gratification Value —a 0.606 0.368Aesthetic Value —a 0.704 0.496Efficiency Value —a 0.776 0.603Social Interaction Value 13.807 0.644 0.415
Item–Construct RelationshipsEfficiency Value
Well equipped staff with necessary training —a 0.757 0.573Doctors explain reasons for test 24.552 0.890 0.791Doctor always diagnosis accurately 22.806 0.847 0.717Technical support staff are efficient 27.289 0.954 0.910Nurses regularly discharge their duties 17.051 0.684 0.468
Aesthetic ValueProper ventilation in wards —a 0.831 0.690Fresh & clean bedding 31.040 0.944 0.891Clean & functional bathroom 23.344 0.805 0.649Neat & clean corridors Reference 0.544 0.396Visual appealing physical facilities 21.479 0.766 0.587
Self-Gratification ValuePersonalized attention —a 0.925 0.856Elimination of pain 23.127 0.775 0.600Easing of negative mood 30.553 0.895 0.802Relief from stress 17.817 0.662 0.438
Social Interaction ValueNursing interaction —a 0.940 0.884Comfort zone with physician interaction 33.320 0.915 0.837Feel relaxed during socializing with others 25.629 0.806 0.649
Transaction ValuePsychological satisfaction —a 0.567 0.321Feel safe in hands of medical staff 8.061 0.410 0.268Good medical advice 10.820 0.600 0.360Personal care of patients 13.643 0.890 0.792Post-medical treatment 13.207 0.826 0.682Staff is quick in serving patients 10.592 0.582 0.339
Acquisition ValueAvailability of latest technology —a 0.543 0.395High-quality low-price requirement 9.764 0.691 0.477Good services at reasonable price 8.685 0.550 0.302Getting your money’s worth 8.233 0.506 0.356
aReference.
AVE (Convergent validity). Structural equation modelling was used todetermine the AVE for the scale. The AVE is a measure of the amount of vari-ance captured by a construct from each scale. An AVE of 0.50 or higher pro-vides evidence of convergent validity. The AVE values were as follows: CPV(0.928), Efficiency Value (0.828), Aesthetic Value (0.934), Self-GratificationValue (0.957), Social Interaction Value (0.856), Transaction Value (0.866),
Dow
nloa
ded
by [
Har
deep
Cha
hal]
at 1
0:48
07
Sept
embe
r 20
14
102 H. Chahal and N. Kumari
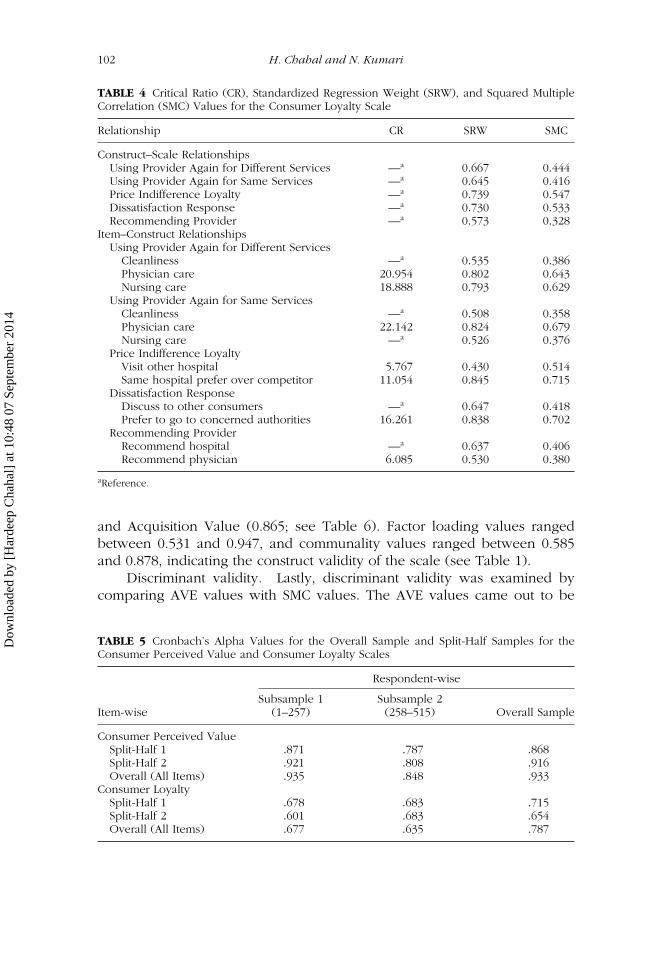
TABLE 4 Critical Ratio (CR), Standardized Regression Weight (SRW), and Squared MultipleCorrelation (SMC) Values for the Consumer Loyalty Scale
Relationship CR SRW SMC
Construct–Scale RelationshipsUsing Provider Again for Different Services —a 0.667 0.444Using Provider Again for Same Services —a 0.645 0.416Price Indifference Loyalty —a 0.739 0.547Dissatisfaction Response —a 0.730 0.533Recommending Provider —a 0.573 0.328
Item–Construct RelationshipsUsing Provider Again for Different Services
Cleanliness —a 0.535 0.386Physician care 20.954 0.802 0.643Nursing care 18.888 0.793 0.629
Using Provider Again for Same ServicesCleanliness —a 0.508 0.358Physician care 22.142 0.824 0.679Nursing care —a 0.526 0.376
Price Indifference LoyaltyVisit other hospital 5.767 0.430 0.514Same hospital prefer over competitor 11.054 0.845 0.715
Dissatisfaction ResponseDiscuss to other consumers —a 0.647 0.418Prefer to go to concerned authorities 16.261 0.838 0.702
Recommending ProviderRecommend hospital —a 0.637 0.406Recommend physician 6.085 0.530 0.380
aReference.
and Acquisition Value (0.865; see Table 6). Factor loading values rangedbetween 0.531 and 0.947, and communality values ranged between 0.585and 0.878, indicating the construct validity of the scale (see Table 1).
Discriminant validity. Lastly, discriminant validity was examined bycomparing AVE values with SMC values. The AVE values came out to be
TABLE 5 Cronbach’s Alpha Values for the Overall Sample and Split-Half Samples for theConsumer Perceived Value and Consumer Loyalty Scales
Respondent-wise
Subsample 1 Subsample 2Item-wise (1–257) (258–515) Overall Sample
Consumer Perceived ValueSplit-Half 1 .871 .787 .868Split-Half 2 .921 .808 .916Overall (All Items) .935 .848 .933
Consumer LoyaltySplit-Half 1 .678 .683 .715Split-Half 2 .601 .683 .654Overall (All Items) .677 .635 .787
Dow
nloa
ded
by [
Har
deep
Cha
hal]
at 1
0:48
07
Sept
embe
r 20
14
Consumer Perceived Value and Consumer Loyalty 103
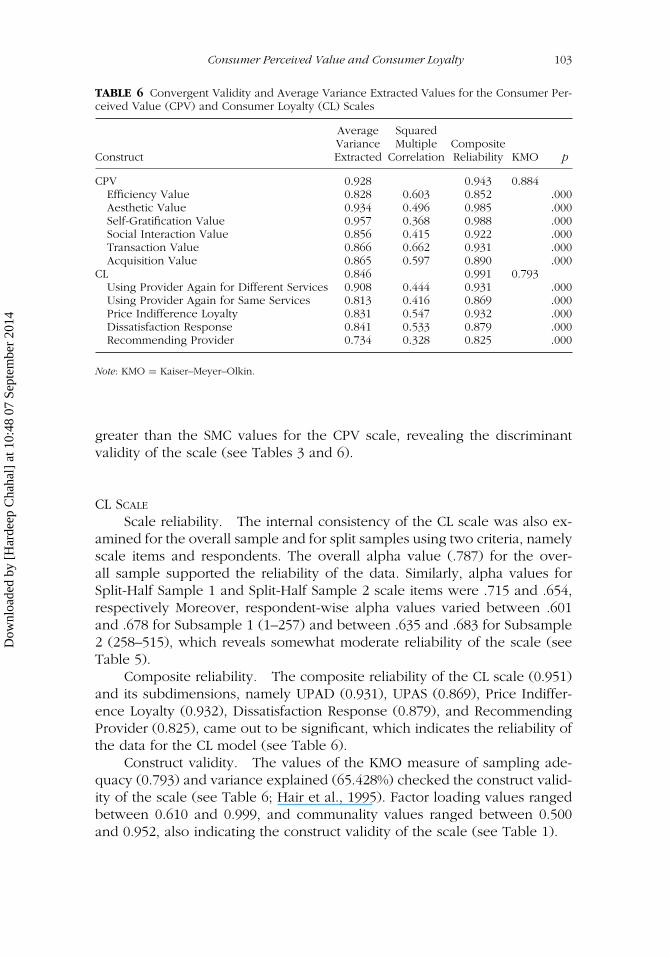
TABLE 6 Convergent Validity and Average Variance Extracted Values for the Consumer Per-ceived Value (CPV) and Consumer Loyalty (CL) Scales
Average SquaredVariance Multiple Composite
Construct Extracted Correlation Reliability KMO p
CPV 0.928 0.943 0.884Efficiency Value 0.828 0.603 0.852 .000Aesthetic Value 0.934 0.496 0.985 .000Self-Gratification Value 0.957 0.368 0.988 .000Social Interaction Value 0.856 0.415 0.922 .000Transaction Value 0.866 0.662 0.931 .000Acquisition Value 0.865 0.597 0.890 .000
CL 0.846 0.991 0.793Using Provider Again for Different Services 0.908 0.444 0.931 .000Using Provider Again for Same Services 0.813 0.416 0.869 .000Price Indifference Loyalty 0.831 0.547 0.932 .000Dissatisfaction Response 0.841 0.533 0.879 .000Recommending Provider 0.734 0.328 0.825 .000
Note: KMO = Kaiser–Meyer–Olkin.
greater than the SMC values for the CPV scale, revealing the discriminantvalidity of the scale (see Tables 3 and 6).
CL SCALE
Scale reliability. The internal consistency of the CL scale was also ex-amined for the overall sample and for split samples using two criteria, namelyscale items and respondents. The overall alpha value (.787) for the over-all sample supported the reliability of the data. Similarly, alpha values forSplit-Half Sample 1 and Split-Half Sample 2 scale items were .715 and .654,respectively Moreover, respondent-wise alpha values varied between .601and .678 for Subsample 1 (1–257) and between .635 and .683 for Subsample2 (258–515), which reveals somewhat moderate reliability of the scale (seeTable 5).
Composite reliability. The composite reliability of the CL scale (0.951)and its subdimensions, namely UPAD (0.931), UPAS (0.869), Price Indiffer-ence Loyalty (0.932), Dissatisfaction Response (0.879), and RecommendingProvider (0.825), came out to be significant, which indicates the reliability ofthe data for the CL model (see Table 6).
Construct validity. The values of the KMO measure of sampling ade-quacy (0.793) and variance explained (65.428%) checked the construct valid-ity of the scale (see Table 6; Hair et al., 1995). Factor loading values rangedbetween 0.610 and 0.999, and communality values ranged between 0.500and 0.952, also indicating the construct validity of the scale (see Table 1).
Dow
nloa
ded
by [
Har
deep
Cha
hal]
at 1
0:48
07
Sept
embe
r 20
14
104 H. Chahal and N. Kumari
AVE (Convergent validity). All AVE values came out above the rec-ommended value of 0.50, that is 0.908 for UPAD, .0813 for UPAS, .831 forPrice Indifference Loyalty, .841 for Dissatisfaction Response, and .734 forRecommending Provider, indicating the convergent validity of the CL scale(see Tables 4 and 6).
Discriminant validity. Lastly, discriminant validity was also establishedfor the CL scale, as AVE values came out to be greater than SMC values (seeTable 2).
ANALYSIS OF CPV AND CL
CPV
CPV as a level two-factor structure was examined through model fit indices.The various model fit indices, the chi-square statistics (CMIN)/degree offreedom (DF) = 3.625, normed fit index (NFI) = .963, relative fit index (RFI)= .941, Tucker–Lewis index (TLI) = .867, comparative fit index (CFI) = .887,and root mean square error of approximation (RMSEA) = 0.050 (see Table6), indicate the robustness of the relationship of the six components withthe CPV latent variable.
EFFICIENCY VALUE (FACTOR 1)
The Efficiency Value relates to how effectively and efficiently the serviceprovider delivers healthcare service products. In the healthcare sector itis found to be a function of five items: well-equipped staff with necessarytraining (SRW = 0.757); doctors explain reasons for test (CR = 24.552, SRW =0.890); doctor always diagnosis medical problem accurately (CR = 22.806,SRW = 0.847); technical support staff are careful while running tests (CR =27.289, SRW = 0.954); and nurses regularly discharge their duties regardinginjection, dressing (CR = 17.051, SRW = 0.684).
AESTHETIC VALUE (FACTOR 2)
The application of CFA came with five significant items, namely visual ap-pealing physical facilities (CR = 21.479, SRW = 0.766), neat and clean cor-ridors (SRW = 0.544), clean and functional bathroom (CR = 23.344, SRW= 0.805), proper ventilation in wards (SRW = 0.831), and fresh & cleanbedding (CR = 31.040, SRW = 0.944) in Aesthetic Value.
Dow
nloa
ded
by [
Har
deep
Cha
hal]
at 1
0:48
07
Sept
embe
r 20
14
Consumer Perceived Value and Consumer Loyalty 105
SELF-GRATIFICATION VALUE (FACTOR 3)
The third factor, Self-Gratification Value, contained four statements, all ofwhich had significant CR and SRW values: relief from stress (CR = 17.817,SRW = 0.662), easing of negative mood (CR = 30.553, SRW = 0.895), elimina-tion of pain (CR = 23.127, SRW = 0.775), and personalized attention (SRW =0.925).
SOCIAL INTERACTION VALUE (FACTOR 4)
The Social Interaction Value is important as it is the overall experience thatthe consumer perceives while interacting during hospitalization. It containedthree items: feel relaxed during socializing with other patients (CR = 25.629,SRW = 0.806), comfort zone with physician interaction (CR = 33.320, SRW =0.915), and nursing interaction (SRW = 0.940).
TRANSACTION VALUE (FACTOR 5)
The fifth factor, namely Transaction Value, contained six items: staff is quickin serving patients (CR = 10.592, SRW = 0.582), post-medical treatment(CR = 13.207, SRW = 0.826), personal care of patients (CR = 13.643,SRW = 0.890), good medical advice (CR = 10.820, SRW = 0.600), feel safe inthe hands of the medical staff (CR = 8.061, SRW = 0.510), and psychologicalsatisfaction (SRW = 0.567). All of these indicate the psychological satisfactiongained from the service encounter.
ACQUISITION VALUE (FACTOR 6)
The last factor, Acquisition Value, that is, overall net value, contained fourstatements: getting your money’s worth (CR = 8.233, SRW = 0.506), goodservices at reasonable price (CR = 8.685, SRW = 0.550), availability of latesttechnology (SRW = 0.543), and high-quality low-price requirement (CR =9.764, SRW = 0.691), all of which had significant CR and SRW values.
CL
The model fit indices for the one-factor CL model (i.e., CMIN/DF, NFI, RFI,TLI, CFI, and RMSEA), 5.624, 0.862, 0.820, 0.891, 0.800, and 0.072, respec-tively (see Table 3), confirmed CL as a one-factor structure comprising fivedimensions.
Dow
nloa
ded
by [
Har
deep
Cha
hal]
at 1
0:48
07
Sept
embe
r 20
14
106 H. Chahal and N. Kumari
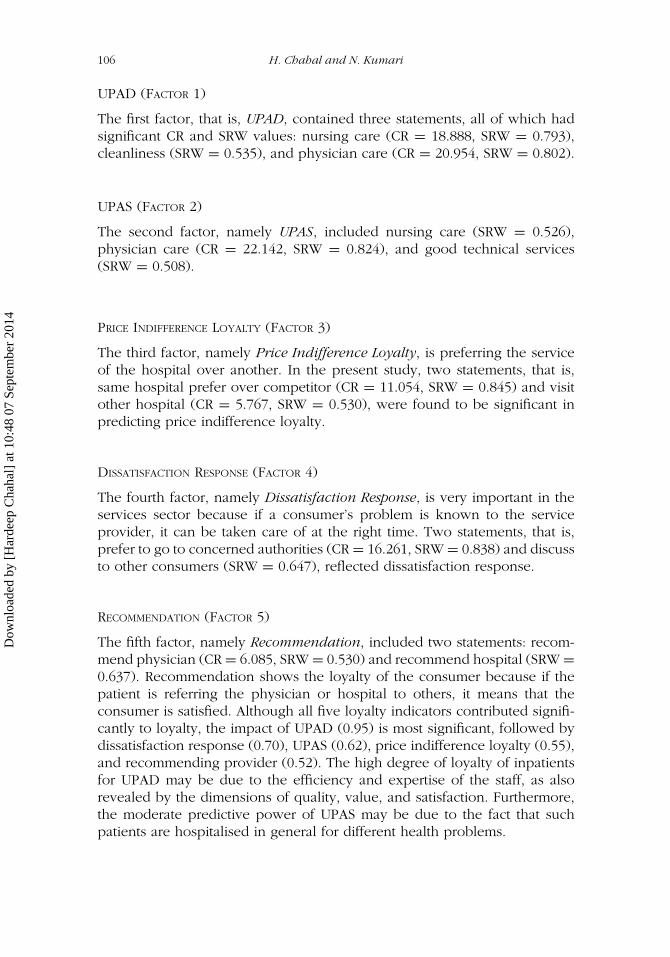
UPAD (FACTOR 1)
The first factor, that is, UPAD, contained three statements, all of which hadsignificant CR and SRW values: nursing care (CR = 18.888, SRW = 0.793),cleanliness (SRW = 0.535), and physician care (CR = 20.954, SRW = 0.802).
UPAS (FACTOR 2)
The second factor, namely UPAS, included nursing care (SRW = 0.526),physician care (CR = 22.142, SRW = 0.824), and good technical services(SRW = 0.508).
PRICE INDIFFERENCE LOYALTY (FACTOR 3)
The third factor, namely Price Indifference Loyalty, is preferring the serviceof the hospital over another. In the present study, two statements, that is,same hospital prefer over competitor (CR = 11.054, SRW = 0.845) and visitother hospital (CR = 5.767, SRW = 0.530), were found to be significant inpredicting price indifference loyalty.
DISSATISFACTION RESPONSE (FACTOR 4)
The fourth factor, namely Dissatisfaction Response, is very important in theservices sector because if a consumer’s problem is known to the serviceprovider, it can be taken care of at the right time. Two statements, that is,prefer to go to concerned authorities (CR = 16.261, SRW = 0.838) and discussto other consumers (SRW = 0.647), reflected dissatisfaction response.
RECOMMENDATION (FACTOR 5)
The fifth factor, namely Recommendation, included two statements: recom-mend physician (CR = 6.085, SRW = 0.530) and recommend hospital (SRW =0.637). Recommendation shows the loyalty of the consumer because if thepatient is referring the physician or hospital to others, it means that theconsumer is satisfied. Although all five loyalty indicators contributed signifi-cantly to loyalty, the impact of UPAD (0.95) is most significant, followed bydissatisfaction response (0.70), UPAS (0.62), price indifference loyalty (0.55),and recommending provider (0.52). The high degree of loyalty of inpatientsfor UPAD may be due to the efficiency and expertise of the staff, as alsorevealed by the dimensions of quality, value, and satisfaction. Furthermore,the moderate predictive power of UPAS may be due to the fact that suchpatients are hospitalised in general for different health problems.
Dow
nloa
ded
by [
Har
deep
Cha
hal]
at 1
0:48
07
Sept
embe
r 20
14
Consumer Perceived Value and Consumer Loyalty 107
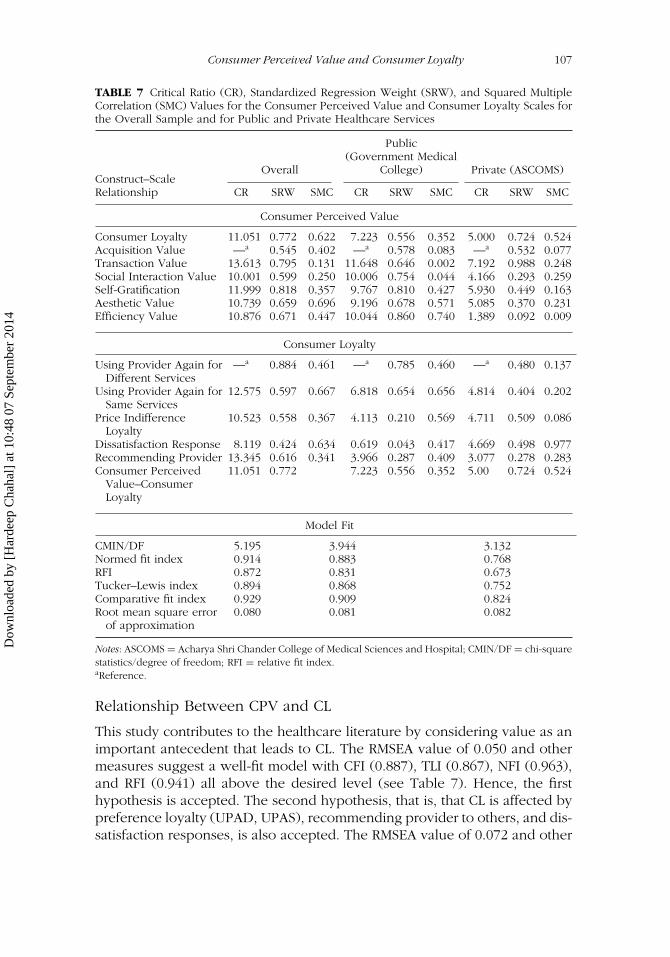
TABLE 7 Critical Ratio (CR), Standardized Regression Weight (SRW), and Squared MultipleCorrelation (SMC) Values for the Consumer Perceived Value and Consumer Loyalty Scales forthe Overall Sample and for Public and Private Healthcare Services
Overall
Public(Government Medical
College) Private (ASCOMS)Construct–ScaleRelationship CR SRW SMC CR SRW SMC CR SRW SMC
Consumer Perceived Value
Consumer Loyalty 11.051 0.772 0.622 7.223 0.556 0.352 5.000 0.724 0.524Acquisition Value —a 0.545 0.402 —a 0.578 0.083 —a 0.532 0.077Transaction Value 13.613 0.795 0.131 11.648 0.646 0.002 7.192 0.988 0.248Social Interaction Value 10.001 0.599 0.250 10.006 0.754 0.044 4.166 0.293 0.259Self-Gratification 11.999 0.818 0.357 9.767 0.810 0.427 5.930 0.449 0.163Aesthetic Value 10.739 0.659 0.696 9.196 0.678 0.571 5.085 0.370 0.231Efficiency Value 10.876 0.671 0.447 10.044 0.860 0.740 1.389 0.092 0.009
Consumer Loyalty
Using Provider Again forDifferent Services
—a 0.884 0.461 —a 0.785 0.460 —a 0.480 0.137
Using Provider Again forSame Services
12.575 0.597 0.667 6.818 0.654 0.656 4.814 0.404 0.202
Price IndifferenceLoyalty
10.523 0.558 0.367 4.113 0.210 0.569 4.711 0.509 0.086
Dissatisfaction Response 8.119 0.424 0.634 0.619 0.043 0.417 4.669 0.498 0.977Recommending Provider 13.345 0.616 0.341 3.966 0.287 0.409 3.077 0.278 0.283Consumer Perceived
Value–ConsumerLoyalty
11.051 0.772 7.223 0.556 0.352 5.00 0.724 0.524
Model Fit
CMIN/DF 5.195 3.944 3.132Normed fit index 0.914 0.883 0.768RFI 0.872 0.831 0.673Tucker–Lewis index 0.894 0.868 0.752Comparative fit index 0.929 0.909 0.824Root mean square error
of approximation0.080 0.081 0.082
Notes: ASCOMS = Acharya Shri Chander College of Medical Sciences and Hospital; CMIN/DF = chi-squarestatistics/degree of freedom; RFI = relative fit index.aReference.
Relationship Between CPV and CL
This study contributes to the healthcare literature by considering value as animportant antecedent that leads to CL. The RMSEA value of 0.050 and othermeasures suggest a well-fit model with CFI (0.887), TLI (0.867), NFI (0.963),and RFI (0.941) all above the desired level (see Table 7). Hence, the firsthypothesis is accepted. The second hypothesis, that is, that CL is affected bypreference loyalty (UPAD, UPAS), recommending provider to others, and dis-satisfaction responses, is also accepted. The RMSEA value of 0.072 and other
Dow
nloa
ded
by [
Har
deep
Cha
hal]
at 1
0:48
07
Sept
embe
r 20
14
108 H. Chahal and N. Kumari
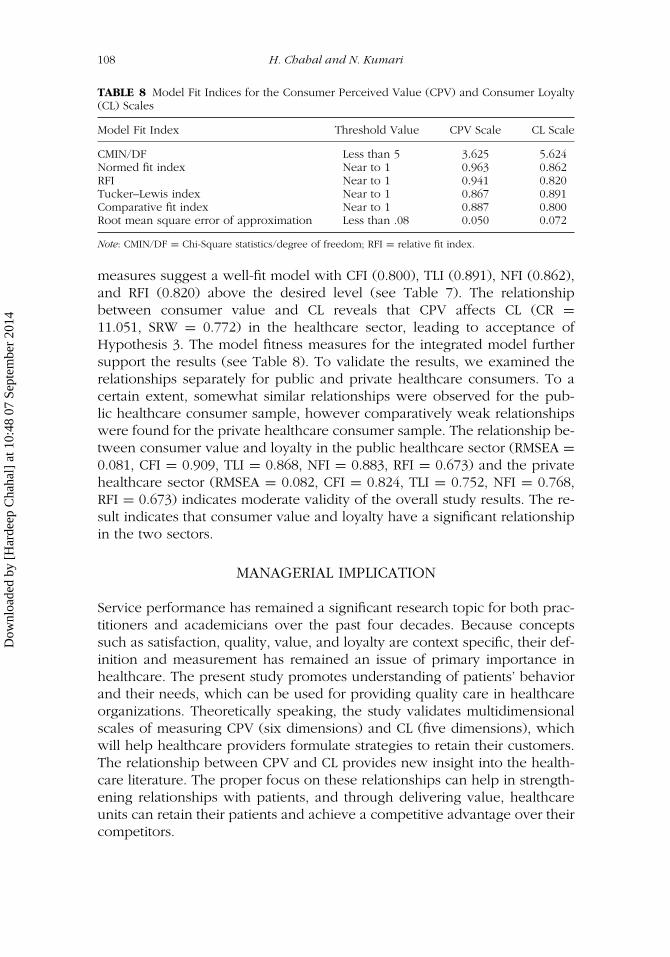
TABLE 8 Model Fit Indices for the Consumer Perceived Value (CPV) and Consumer Loyalty(CL) Scales
Model Fit Index Threshold Value CPV Scale CL Scale
CMIN/DF Less than 5 3.625 5.624Normed fit index Near to 1 0.963 0.862RFI Near to 1 0.941 0.820Tucker–Lewis index Near to 1 0.867 0.891Comparative fit index Near to 1 0.887 0.800Root mean square error of approximation Less than .08 0.050 0.072
Note: CMIN/DF = Chi-Square statistics/degree of freedom; RFI = relative fit index.
measures suggest a well-fit model with CFI (0.800), TLI (0.891), NFI (0.862),and RFI (0.820) above the desired level (see Table 7). The relationshipbetween consumer value and CL reveals that CPV affects CL (CR =11.051, SRW = 0.772) in the healthcare sector, leading to acceptance ofHypothesis 3. The model fitness measures for the integrated model furthersupport the results (see Table 8). To validate the results, we examined therelationships separately for public and private healthcare consumers. To acertain extent, somewhat similar relationships were observed for the pub-lic healthcare consumer sample, however comparatively weak relationshipswere found for the private healthcare consumer sample. The relationship be-tween consumer value and loyalty in the public healthcare sector (RMSEA =0.081, CFI = 0.909, TLI = 0.868, NFI = 0.883, RFI = 0.673) and the privatehealthcare sector (RMSEA = 0.082, CFI = 0.824, TLI = 0.752, NFI = 0.768,RFI = 0.673) indicates moderate validity of the overall study results. The re-sult indicates that consumer value and loyalty have a significant relationshipin the two sectors.
MANAGERIAL IMPLICATION
Service performance has remained a significant research topic for both prac-titioners and academicians over the past four decades. Because conceptssuch as satisfaction, quality, value, and loyalty are context specific, their def-inition and measurement has remained an issue of primary importance inhealthcare. The present study promotes understanding of patients’ behaviorand their needs, which can be used for providing quality care in healthcareorganizations. Theoretically speaking, the study validates multidimensionalscales of measuring CPV (six dimensions) and CL (five dimensions), whichwill help healthcare providers formulate strategies to retain their customers.The relationship between CPV and CL provides new insight into the health-care literature. The proper focus on these relationships can help in strength-ening relationships with patients, and through delivering value, healthcareunits can retain their patients and achieve a competitive advantage over theircompetitors.
Dow
nloa
ded
by [
Har
deep
Cha
hal]
at 1
0:48
07
Sept
embe
r 20
14
Consumer Perceived Value and Consumer Loyalty 109
FUTURE RESEARCH
The study provides a new and broader perspective for examining the directrelationship between CPV and loyalty measures that provide a roadmap forfuture researchers. Because the study is theoretically limited to assessingthe relationship between loyalty and value, the relationships need to beextended to include quality, satisfaction, and image from both patients’ andemployees’ perspectives to establish a sound theoretical framework. Futureresearch that replicates the study in different cultural contexts is necessarybefore the findings of this study can be generalized. Moreover, research indifferent service areas should also be examined to generalize the relationshipbetween consumer value and CL using the identified dimensions.
REFERENCES
Anderson, E. W., Fornell, C., & Lehmann, R. R. (1994). Customer satisfaction, marketshare, and profitability: Findings from Sweden. Journal of Marketing, 58(3),53–66.
Arnold, M. J., & Reynolds, K. E. (2003). Hedonic shopping motivations. Journal ofRetailing, 79, 77–95.
Burns, M. J. (1993). Value in exchange: The customer perspective. Knoxville: TheUniversity of Tennessee.
Choi, K.-S., Cho, W.-H., Lee, S., Lee, H., & Kim, C. (2004). The relationship amongquality, value, satisfaction and behavioral intention in health care providerchoice: A South Korean study. Journal of Business Research, 57, 913–921.
Corbin, C., Scott, L., Kelley, W., & Schwartz, R. W. (2001). Concepts in servicemarketing for healthcare professionals. American Journal of Surgery, 189, 1–7.
Cronin, J. J., Jr., Brady, M. K., & Hult, G. T. M. (2000). Assessing the effects of quality,value and customer satisfaction on consumer behavioral intentions in serviceenvironments. Journal of Retailing, 76, 193–218.
Cronin, J. J., & Taylor, S. A. (1994). SERVPERF versus SERVQUAL: Reconcilingperformance-based and perceptions–minus–expectations measurement of ser-vice quality. Journal of Marketing, 58(1), 125–131.
Day, G. (1994). The capabilities of market-driven organizations. Journal of Marketing,58(4), 37–52.
de Ruyter, K., & Bloemer, J. A. (1999). Customer loyalty in extended settings: Theinteraction between value attainments and positive mood. International Journalof Service Industry Management, 10, 320–336.
de Ruyter, K., Wetzels, M., & Bloemer, J. (1998). On the relationship between per-ceived service quality, service loyalty and switching costs. International Journalof Service Industry Management, 9, 436–453.
Ekrem, C., & Kirkbir, F. (2007). Customer perceived value: The development of amultiple item scale in hospitals. Problem and Perspectives in Management, 5,252–268.
Fernandez, R. S., & Bonillo, M. A. I. (2007). The concept of perceived value: Asystematic review of the research. Marketing Theory, 7, 427–451.
Dow
nloa
ded
by [
Har
deep
Cha
hal]
at 1
0:48
07
Sept
embe
r 20
14
110 H. Chahal and N. Kumari
Gallarza, M. G., & Saura, I. G. (2004). Value dimensions, perceived value, satisfactionand loyalty: An investigation of university students’ travel behaviour. TourismManagement, 27, 437–452.
Gounaris, S. P., Tzempelikos, N. A., & Chatzipanagiotou, K. (2007). The relation-ships of customer-perceived value, satisfaction, loyalty and behavioral inten-tions. Journal of Relationship Marketing, 6(1), 63–87.
Grewal, D., Monroe, K. B., & Krishan, R. (1988). The effects of price-comparisonadvertising on buyers’ perceptions of acquisition value, transaction value andbehavioral intentions. Journal of Marketing, 62(2), 46–59.
Gronroos, C. (1994). From marketing mix to relationship marketing—Towards aparadigm shift in marketing. Management Decision, 32(2), 4–32.
Gross, R. (2003). A consumer based tool for evaluating the quality of health servicesin the Israeli health care system following reform. Health Policy, 68, 143–158.
Hair, J. J., Anderson, R. E., Tatham, R. L., & Black, W. C. (1995). Multivariate dataanalysis with readings. Upper Saddle River, NJ: Prentice Hall.
Hirschman, E. C., & Holbrook, M. B. (1982). Hedonic consumption: Emerging con-cepts. Journal of Marketing, 46(3), 92–101.
Lam, S. Y., Shakar, V., & Murthy, M. K. E. B. (2004). Customer value, satisfaction,loyalty and switching costs: An illustration from a business-to-business servicecontext. Journal of the Academy of Marketing Science, 32, 293–311.
Lovelock, C., & Wirtz, J. (2006). Services marketing—People, technology and strategy.Delhi, India: Dorling Kindersley.
Mathwick, C., Malhotra, N. K., & Rigdon, E. (2002). The effect of dynamic retailexperiences on experiential perceptions of value: An Internet and catalog com-parison. Journal of Retailing, 78, 51–60.
Netmeyer, R. G., Bearder, W. O., & Sharma, S. (2003). Scaling procedures—Issuesand applications. Newbury Park, CA: Sage.
Oliver, R. L. (1981). Measurement and evaluation of satisfaction processes in retailsettings. Journal of Retailing, 57, 25–48.
Parasuraman, A. (1997). Reflections on gaining competitive advantage through cus-tomer value. Journal of the Academy of Marketing Science, 25, 154–161.
Parasuraman, A., & Grewal, D. (2000). The impact of technology on thequality–value–loyalty chain: A research agenda. Journal of the Academy of Mar-keting Science, 28, 168–174.
Parasuraman, A., Zeithaml, V. A., & Berry, L. L. (1988). SERVQUAL: A multiple-item scale for measuring customer perceptions of service quality. Journal ofRetailing, 64, 12–40.
Peltier, J. W., Boyt, T., & Sehibrowsky, J. A. (2000, Fall). Obstetrical care and patientloyalty. Marketing Health Services, 18, 5–12.
Ravald, A., & Gronroos, C. (1996). The value concept and relationship marketing.European Journal of Marketing, 30(2), 19–30.
Rust, R. T., & Oliver, R. L. (1994). Service quality: Insights and managerial implica-tions from the frontlines. In Rust, R. T., & Oliver, R. L. (Eds.), Service quality:New directions in theory and practice (pp. 1–19). Newbury Park, CA: Sage.
Sanchez, J., Callarisa, L. L. J., Rodriguez, R. H., & Moliner, M. A. (2006). Perceivedvalue of the purchase of tourism product. Tourism Management, 27, 394–409.
Sheth, J. N., Newman, B. I., & Gross, B. L. (1991). Why we buy what we buy: Atheory of consumption values. Journal of Business Research, 22, 159–170.
Dow
nloa
ded
by [
Har
deep
Cha
hal]
at 1
0:48
07
Sept
embe
r 20
14
Consumer Perceived Value and Consumer Loyalty 111
Sweeney, J. C., & Soutar, G. N. (2001). Consumer perceived value: The developmentof a multiple item scale. Journal of Retailing, 77, 203–220.
Sweeney, J. C., Soutar, G. N., & Johnson, L. W. (1999). The role of perceived riskin the quality-value relationships: A study in a retail environment. Journal ofRetailing, 75, 77–105.
Teas, R. K. (1993). Expectations, performance evaluation and consumers’ perceptionof quality. Journal of Marketing, 57(4), 18–34.
Wang, Y., Lo, H. P., Chi, R., & Yang, Y. (2004). An integrated framework for customervalue and customer-relationship–management performance: A customer-basedperspective from China. Managing Service Quality, 14, 169–182.
Zeithaml, V. A. (1988). Consumer perceptions of price, quality and value: Ameans–end model and synthesis of evidence. Journal of Marketing, 52(3), 2–22.
Zeithaml, V. A., Berry, L. L., & Parasuraman, A. (1996). The behavioral consequencesof service quality. Journal of Marketing, 60(2), 31–46.
Dow
nloa
ded
by [
Har
deep
Cha
hal]
at 1
0:48
07
Sept
embe
r 20
14
112 H. Chahal and N. Kumari
APPENDIX A
Indicators of the Consumer Perceived Value Scale
Efficiency Value (EV) Social Interaction Value (SIV)EV1 = Equipped staff with necessary training SI1 = Nursing interactionEV2 = Doctors explain reasons for test SI2 = Comfort zone with physician interactionEV3 = Doctor always diagnosis accurately SI3 = Feel relaxed during socializing with othersEV4 = Technical support staff are efficient Transaction Value (TV)EV5 = Nurses regularly discharge their duties TV1 = Psychological satisfaction
Aesthetic Value (AEV) TV2 = Feel safe in the hands of the medical staffAE1 = Proper ventilation in wards TV3 = Good medical adviceAE2 = Fresh & clean bedding TV4 = Personal care of patientsAE3 = Clean & functional bathroom TV5 = Post-medical treatmentAE4 = Neat & clean corridors TV6 = Staff is quick in serving patientsAE5 = Visual appealing physical facilities Acquisition Value (AV)
Self-Gratification Value (SGV) AV1 = Availability of latest technologySG1 = Personalized attention AV2 = High-quality low-price requirementSG2 = Elimination of pain AV3 = Good services at reasonable priceSG3 = Easing of negative mood AV4 = Getting your money’s worthSG4 = Relief from stress
APPENDIX B
Indicators of the Consumer Loyalty Scale
Using Provider Again for DifferentServices (UPAD)
UPAD1 = CleanlinessUPAD2 = Physician careUPAD3 = Nursing care
Using Provider Again for SameServices (UPAS)
UPAS1 = CleanlinessUPAS2 = Physician careUPAS3 = Nursing care
Price Indifference Loyalty (PIL)PIL1 = Visit other hospitalPIL2 = Same hospital prefer over competitor
Dissatisfaction Response (DR)DR1 = Discuss to other consumersDR2 = Prefer to go to concerned authorities
Recommending Provider (RP)RP1 = Recommend hospitalRP2 = Recommend physician
APPENDIX C
Indicators of Consumer Perceived Value and Consumer Loyalty
AEV = Aesthetic ValueTV = Transaction ValueSG = Self-Gratification ValueAV = Acquisition ValueEV = Efficiency ValueSI = Social Interaction ValueUPAD = Using Provider Again for Different ServicesUPAS = Using Provider Again for Same ServicesPIL = Price Indifference LoyaltyDR = Dissatisfaction ResponseRP = Recommending Provider
Dow
nloa
ded
by [
Har
deep
Cha
hal]
at 1
0:48
07
Sept
embe
r 20
14