consumer information materials for diagnostic breast tests: women's views on information and...
TRANSCRIPT
Consumer information materials for diagnosticbreast tests: women’s views on informationand their understanding of test results
Heather M Davey BPsych (Hons) MPH (Hons),* Jacqueline Lim BSc (Hons) MPsychol (Clinical)MAPS,� Phyllis N Butow BA (Hons) DipEd M Clin Psych MPH PhD,� Alexandra L Barratt MBBSMPH PhD FAFPHM,§ Nehmat Houssami MBBS (Hons) MPH MEd (Health) FASBP AFCHSE,–and Roberta Higginson**
*Research Assistant, Screening and Test Evaluation Program, School of Public Health, The University of Sydney, �ResearchAssistant, Department of Psychological Medicine, The University of Sydney and Royal North Shore Hospital, �AssociateProfessor, Director, Medical Psychology Research Unit, Department of Psychological Medicine, The University of Sydney and
Royal North Shore Hospital, §Senior Lecturer in Epidemiology, Screening and Test Evaluation Program, School of Public Health,
The University of Sydney, –Research Associate, Screening and Test Evaluation Program, School of Public Health, The University
of Sydney and **Consumer Representative, Breast Cancer Action Group New South Wales, Sydney, Australia
Correspondence
Heather M Davey
Screening and Test Evaluation Program
Room 319A
School of Public Health
Edward Ford Building, A27
The University of Sydney
NSW 2006
Australia
E-mail: [email protected]
Accepted for publication
28 March 2003
Keywords: breast cancer, diagnostictests, information preferences,
mammography
Abstract
Objective To explore women’s views on diagnostic breast test
information and elicit their preferences for this information.
Design In-depth, face-to-face interview.
Setting and Participants Thirty-seven women who had previously
participated in a population-based telephone survey.
Main outcome measure Qualitative thematic analysis.
Results Analysis of interview transcripts revealed information
about: (1) the wide range of information participants wanted about
diagnostic mammography; (2) general reactions to diagnostic breast
test information, including positive and negative reactions, views of
test accuracy information and perceived influences on information
preferences; (3) preferences for information content and presenta-
tion including the need for written information, the meaning of
statistical information, different views on a simple presentation style,
and variation in preferences; and (4) women’s understanding of
diagnostic test results.
Conclusion Women want a range of information about diagnostic
mammography, which is relevant at different times in the decision-
making and testing process. Many women have difficulty interpre-
ting test results.
Introduction
Information is necessary for patient involvement
in decision-making and informed choice.1–3 The
General Medical Council of the UK and the
American College of Physicians recommend that
doctors inform patients of the potential benefits
and harms of screening tests4–5 and treatment4,6
so that they can make an informed decision
about their health-care. While these recommen-
298 � Blackwell Publishing Ltd 2003 Health Expectations, 6, pp.298–311
dations do not explicitly refer to diagnostic tests,
it seems reasonable that they should also apply to
such tests. In addition to information being
necessary for patient involvement in decision-
making, providing pre-test or pre-treatment
information can help prepare patients7 and
reduce anxiety.8–11
Despite the potential benefits of information,
and its importance for informed patient decis-
ion-making, two recent reviews of consumer
information materials on breast tests concluded
that there are major problems with such infor-
mation.12,13 In particular, they found an
emphasis on incidence and relative risk reduc-
tion when mortality, absolute risk reduction and
number needed to treat are more appropriate;13
inconsistent information on benefits;13 inad-
equate information on potential side-effects and
test accuracy;12 and a lack of information on the
post-test probability of disease.12 However, nei-
ther review assessed women’s information needs
with regard to breast tests.
In addition, little is known about women’s
understanding of diagnostic test results. Such
understanding is crucial if women are to use
information about the post-test probability of
disease to make decisions about medical tests. A
search of the published literature revealed only one
study that specifically assessed patient under-
standing of diagnostic test results.14 This study
used vignettes to assess understanding, none of
which included diagnostic tests for breast disease.
These findings are a cause for concern, as a
recent population-based survey by our group
found that the majority of women want an equal
or more active role in decision-making about
diagnostic and screening tests.15 Although
women in the survey expressed a desire for
information about tests including the potential
benefits, side-effects and risks, and test accuracy,
this study, being a telephone survey using a
standardized questionnaire, could not explore
the level of detail women want, their under-
standing of the information or the best way to
present the information.
Thus, we decided to conduct in-depth, face-to-
face interviews with a subsample of women from
the population-based telephone survey to (a)
explore issues associated with information pro-
vision for diagnostic tests; (b) elicit women’s
preferences for the content and presentation of
such information; and (c) assess women’s
understanding of diagnostic test results.
Although the population-based survey15 inclu-
ded information needs and preferences in rela-
tion to both screening and diagnostic tests, we
decided to focus the interviews on diagnostic
breast tests, as little work has been carried out
on women’s information needs for, and under-
standing of, diagnostic breast tests.
Methods
Participants
The sample was taken from women aged 30–
69 years, who had previously participated in the
population survey telephone described above. A
description of the survey sample is provided
elsewhere.15 Participants included women who
had previously undergone breast tests and
women who had not.
Procedure
At the conclusion of the survey,15 interviewers
asked if the woman would be willing to receive a
mailed invitation to an in-depth, face-to-face
interview to find out her views on the best way of
presenting information about diagnostic breast
tests. Two hundred and eleven women (of the
652 surveyed) agreed to this. Women were ran-
domly selected from this list to receive a letter
inviting them to attend an interview at The
University of Sydney. No inducement was
offered but a small fee was paid to cover parking
and/or travel costs. Letters were despatched in
batches of 20, and recruitment stopped when
information redundancy was obtained.
Interview development
The researchers developed the initial interview
script using the available literature and results
from our population-based survey.15 Researchers
with experience in interview design and
Women’s views on information for diagnostic tests, H M Davey et al.
� Blackwell Publishing Ltd 2003 Health Expectations, 6, pp.298–311
299
qualitative research methodology, who were not
involved in the study, reviewed the interview
script. The script was then pilot tested with six
women who had previously participated in the
survey. Following this, the number of categories
of mammography results was changed from five
(normal, benign, indeterminate, suspicious,
malignant) to three (normal, inconclusive and
abnormal). Normal and benign were combined to
normal; indeterminate was renamed inconclusive;
and suspicious and malignant were combined for
abnormal. A breast clinician, experienced in the
diagnosis of breast disease, approved these
combinations and terminology as those com-
monly used in Australia to report the results of
diagnostic breast tests. In addition, a minor
adjustment was made to the question on under-
standing of test accuracy, with women asked to
interpret two test results instead of three.
The final interview script contained semi-
structured questions that elicited information on
desire for pre-decision information about diag-
nostic mammography; preferences for the con-
tent, presentation and timing of information
about mammography; understanding of test
results; and demographic characteristics. Infor-
mation was presented on coloured A4-sized cards.
Pre-decision information
Women were asked, hypothetically, what infor-
mation they would like about diagnostic mam-
mography before making a decision about
whether or not to have it. They were specifically
asked about practical issues, the doctor’s
assessment, side-effects, risks and accuracy of
the test, if they did not identify these issues
without prompting.
Preferences for information about the accuracy
of diagnostic mammography
Women were asked to consider the hypothetical
case of Mary, a 50-year-old women who had
discovered a lump in her breast for the first time.
They were shown six pieces of information about
diagnostic mammograms (pre-test probability of
disease, probability of a normal, inconclusive and
abnormal result; post-test probability of disease
(three cards) and test accuracy, (Fig. 1) and were
asked (as Mary) which pieces of information they
wanted, to rank them in the order of most to least
preferred, and to indicate whether they would
want the information before deciding to have a
mammogram or when receiving their results.
Reasons for their responses were explored. Post-
test probabilities were calculated using a pre-test
probability of 2%, which was derived from sta-
tistics from a diagnostic breast clinic in Sydney,
Australia and published likelihood ratios calcu-
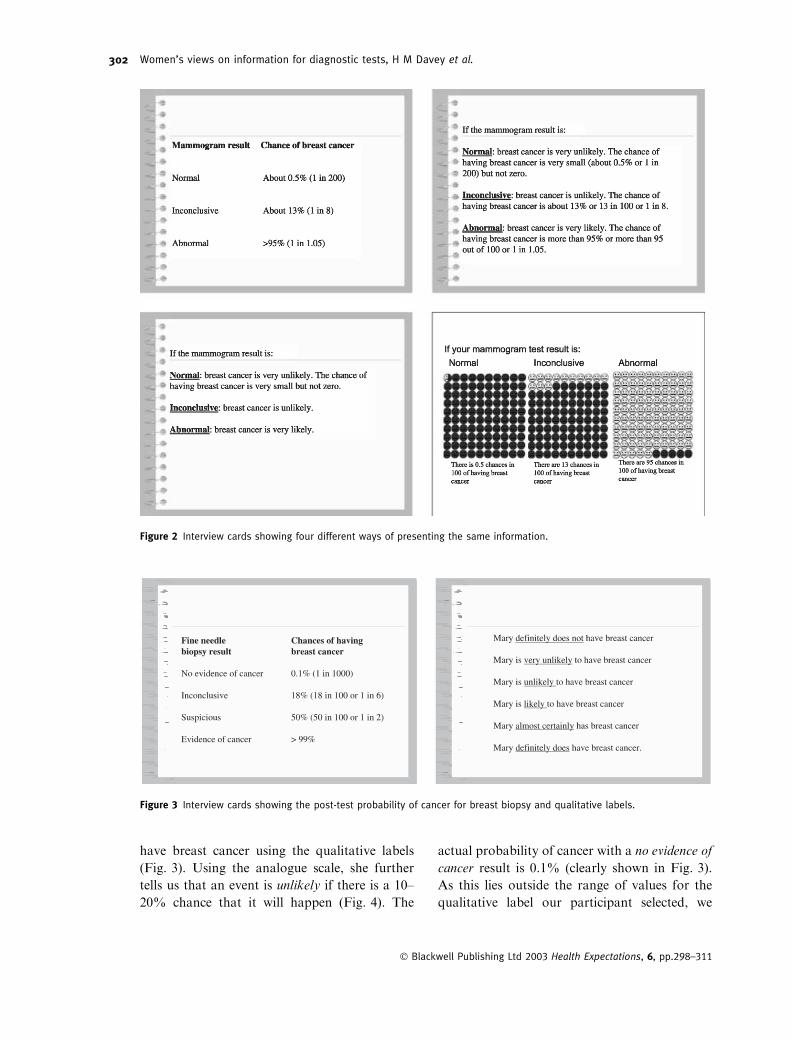
lated from Australian data.16 To elicit prefer-
ences for the presentation of information,
women were shown the same information pre-
sented in four different ways: numerical probab-
ility; qualitative probability labels; combined
numerical and qualitative probability; and 100
faces (Fig. 2). They were asked to rank these in
order of preference and to give their reasons for
this order.
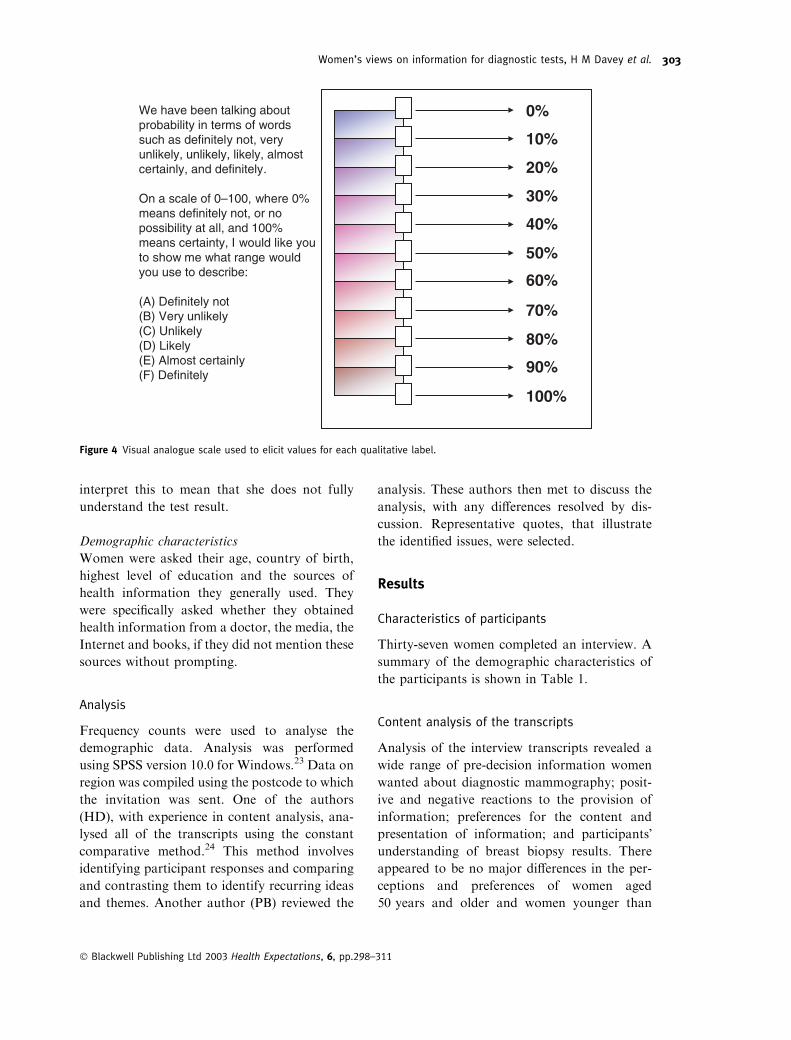
Understanding of test results
To assess women’s understanding of test results,
the scenario was further developed so that Mary
underwent breast biopsy. Women were shown a
card stating the probability of cancer with dif-
ferent fine needle biopsy results and asked to say
how likely cancer was if a biopsy result of no
evidence of cancer and an inconclusive result was
received (Fig. 3). We considered very unlikely to
be the correct interpretation of no evidence of
cancer and either unlikely or likely to be correct
interpretations of an inconclusive result.
Given that the literature has consistently
shown considerable variation in the way people
interpret qualitative labels,17–22 the women were
asked to assign numerical values to each of the
qualitative labels. We took this into account
when assessing whether women truly understood
a no evidence of cancer and an inconclusive result.
To do this, we checked whether the numerical
values of the qualitative labels chosen for the no
evidence of cancer result, and the inconclusive
result included the actual probability of cancer
for that result. For example, suppose we
want to assess a participant’s understanding of
the chance of having breast cancer with a no
evidence of cancer result (Fig. 3). Our participant
interprets this to mean that Mary is unlikely to
� Blackwell Publishing Ltd 2003 Health Expectations, 6, pp.298–311
Women’s views on information for diagnostic tests, H M Davey et al.300
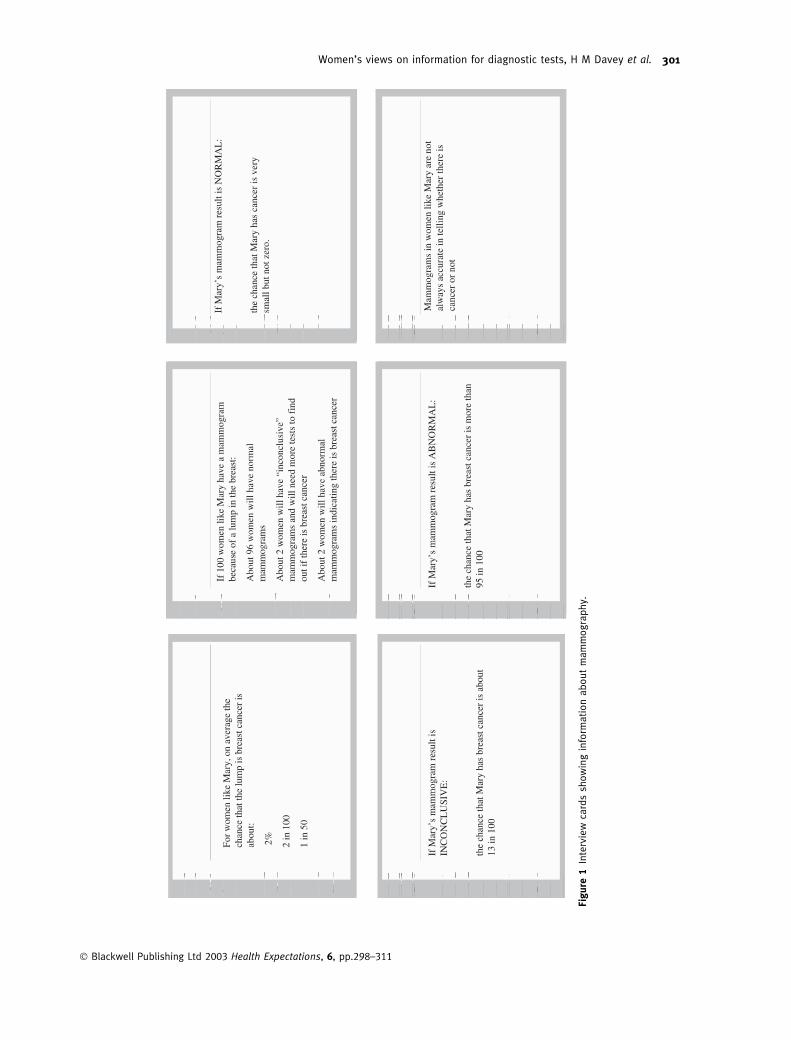
Figure
1Interviewcardsshowinginformationaboutmammography.
� Blackwell Publishing Ltd 2003 Health Expectations, 6, pp.298–311
Women’s views on information for diagnostic tests, H M Davey et al. 301
have breast cancer using the qualitative labels
(Fig. 3). Using the analogue scale, she further
tells us that an event is unlikely if there is a 10–
20% chance that it will happen (Fig. 4). The
actual probability of cancer with a no evidence of
cancer result is 0.1% (clearly shown in Fig. 3).
As this lies outside the range of values for the
qualitative label our participant selected, we
Figure 2 Interview cards showing four different ways of presenting the same information.
Figure 3 Interview cards showing the post-test probability of cancer for breast biopsy and qualitative labels.
� Blackwell Publishing Ltd 2003 Health Expectations, 6, pp.298–311
Women’s views on information for diagnostic tests, H M Davey et al.302
interpret this to mean that she does not fully
understand the test result.
Demographic characteristics
Women were asked their age, country of birth,
highest level of education and the sources of
health information they generally used. They
were specifically asked whether they obtained
health information from a doctor, the media, the
Internet and books, if they did not mention these
sources without prompting.
Analysis
Frequency counts were used to analyse the
demographic data. Analysis was performed
using SPSS version 10.0 for Windows.23 Data on
region was compiled using the postcode to which
the invitation was sent. One of the authors
(HD), with experience in content analysis, ana-
lysed all of the transcripts using the constant
comparative method.24 This method involves
identifying participant responses and comparing
and contrasting them to identify recurring ideas
and themes. Another author (PB) reviewed the
analysis. These authors then met to discuss the
analysis, with any differences resolved by dis-
cussion. Representative quotes, that illustrate
the identified issues, were selected.
Results
Characteristics of participants
Thirty-seven women completed an interview. A
summary of the demographic characteristics of
the participants is shown in Table 1.
Content analysis of the transcripts
Analysis of the interview transcripts revealed a
wide range of pre-decision information women
wanted about diagnostic mammography; posit-
ive and negative reactions to the provision of
information; preferences for the content and
presentation of information; and participants�understanding of breast biopsy results. There
appeared to be no major differences in the per-
ceptions and preferences of women aged
50 years and older and women younger than
Figure 4 Visual analogue scale used to elicit values for each qualitative label.
� Blackwell Publishing Ltd 2003 Health Expectations, 6, pp.298–311
Women’s views on information for diagnostic tests, H M Davey et al. 303
50 years, or between women who had undergone
breast tests and those who had not.
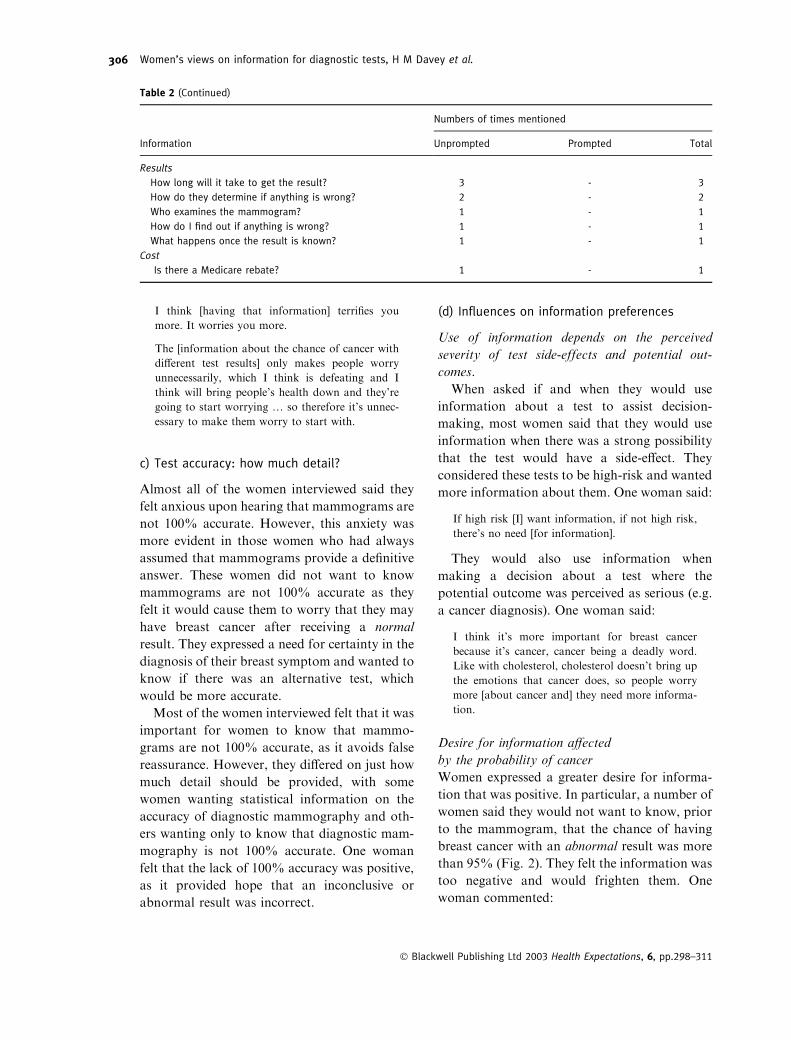
1) Types of information wanted
Women nominated a wide range of information
they would like to receive before deciding to
have a diagnostic mammogram. Table 2 shows
the eight categories of information women
wanted, the details they wanted within each
category and whether these details were
prompted or unprompted.
2) General reactions to information about
diagnostic mammography
Analysis of the transcripts revealed four main
themes; (a) positive and (b) negative responses to
information provision; (c) views on information
about the accuracy of diagnostic mammography;
and (d) influences on information preferences.
(a) Positive responses
Information as a coping mechanism
Information provided before a mammogram,
was seen as a coping mechanism by some
women. For them, this information provided
reassurance and hope. In addition, it prepared
them for having the test, for the potential
results and the implications of those results by
facilitating their understanding of the situ-
ation. For these women, the provision of pre-
decision information was necessary, if they
were going to make a good decision. One
woman said:
To see how you stand, what you’re in for, what the
prospect is, otherwise you’re going in with your
eyes closed.
Another said:
I guess to put it into another perspective that even
if you have a lump you don’t have to panic to the
point of falling to pieces.
Some women felt there was no decision to
make about having a mammogram; if they had
a breast lump they would certainly have a
mammogram.
One woman commented that the information
on post-test probability gave her the courage to
have the mammogram. She said:
Yes I do [want information that says the chance of
cancer is 13 out of 100] because it’s not such a high
number.
(b) Negative responses
Jumping the gun
Other women felt that pre-decision or pre-test
information on the meaning of test results was
jumping the gun. Reasons for this view inclu-
ded the belief that such information would
increase the anxiety and fear a woman would
feel having found a lump in her breast; the
perceived lack of relevance of information on
the post-test probability of disease at that
time; and a concern that the information could
falsely reassure women. They felt the potential
consequence of this was a woman refusing a
test because she did not perceive the risk as
serious. For these women, providing informa-
tion about the probability of cancer with dif-
ferent test results would be more useful when
they received the result of their mammogram.
Two women commented:
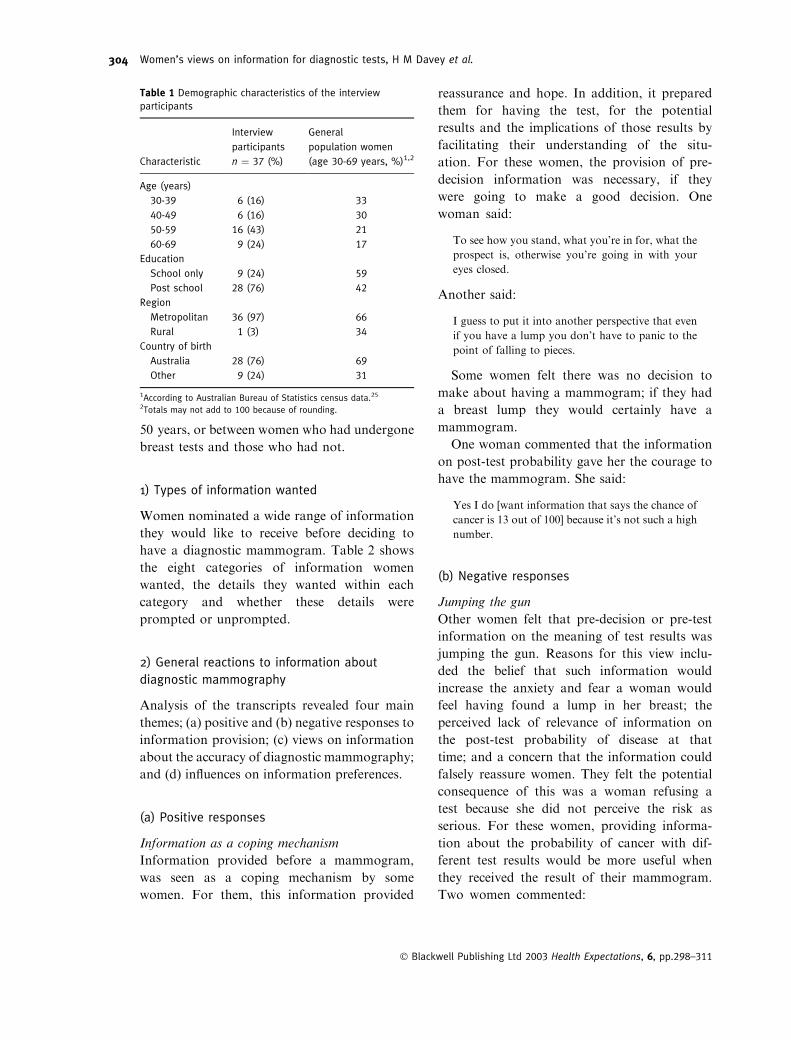
Table 1 Demographic characteristics of the interview
participants
Characteristic
Interview
participants
n ¼ 37 (%)
General
population women
(age 30-69 years, %)1,2
Age (years)
30-39 6 (16) 33
40-49 6 (16) 30
50-59 16 (43) 21
60-69 9 (24) 17
Education
School only 9 (24) 59
Post school 28 (76) 42
Region
Metropolitan 36 (97) 66
Rural 1 (3) 34
Country of birth
Australia 28 (76) 69
Other 9 (24) 31
1According to Australian Bureau of Statistics census data.25
2Totals may not add to 100 because of rounding.
� Blackwell Publishing Ltd 2003 Health Expectations, 6, pp.298–311
Women’s views on information for diagnostic tests, H M Davey et al.304
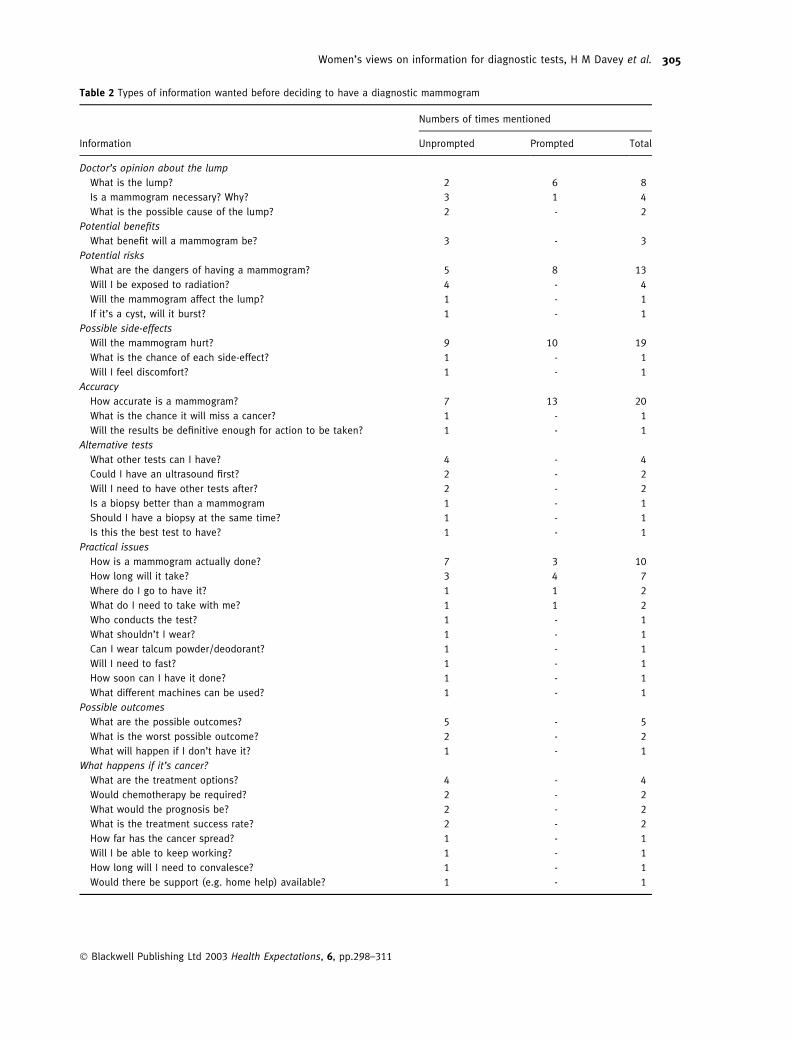
Table 2 Types of information wanted before deciding to have a diagnostic mammogram
Numbers of times mentioned
Information Unprompted Prompted Total
Doctor’s opinion about the lump
What is the lump? 2 6 8
Is a mammogram necessary? Why? 3 1 4
What is the possible cause of the lump? 2 - 2
Potential benefits
What benefit will a mammogram be? 3 - 3
Potential risks
What are the dangers of having a mammogram? 5 8 13
Will I be exposed to radiation? 4 - 4
Will the mammogram affect the lump? 1 - 1
If it’s a cyst, will it burst? 1 - 1
Possible side-effects
Will the mammogram hurt? 9 10 19
What is the chance of each side-effect? 1 - 1
Will I feel discomfort? 1 - 1
Accuracy
How accurate is a mammogram? 7 13 20
What is the chance it will miss a cancer? 1 - 1
Will the results be definitive enough for action to be taken? 1 - 1
Alternative tests
What other tests can I have? 4 - 4
Could I have an ultrasound first? 2 - 2
Will I need to have other tests after? 2 - 2
Is a biopsy better than a mammogram 1 - 1
Should I have a biopsy at the same time? 1 - 1
Is this the best test to have? 1 - 1
Practical issues
How is a mammogram actually done? 7 3 10
How long will it take? 3 4 7
Where do I go to have it? 1 1 2
What do I need to take with me? 1 1 2
Who conducts the test? 1 - 1
What shouldn’t I wear? 1 - 1
Can I wear talcum powder/deodorant? 1 - 1
Will I need to fast? 1 - 1
How soon can I have it done? 1 - 1
What different machines can be used? 1 - 1
Possible outcomes
What are the possible outcomes? 5 - 5
What is the worst possible outcome? 2 - 2
What will happen if I don’t have it? 1 - 1
What happens if it’s cancer?
What are the treatment options? 4 - 4
Would chemotherapy be required? 2 - 2
What would the prognosis be? 2 - 2
What is the treatment success rate? 2 - 2
How far has the cancer spread? 1 - 1
Will I be able to keep working? 1 - 1
How long will I need to convalesce? 1 - 1
Would there be support (e.g. home help) available? 1 - 1
� Blackwell Publishing Ltd 2003 Health Expectations, 6, pp.298–311
Women’s views on information for diagnostic tests, H M Davey et al. 305
I think [having that information] terrifies you
more. It worries you more.
The [information about the chance of cancer with
different test results] only makes people worry
unnecessarily, which I think is defeating and I
think will bring people’s health down and they’re
going to start worrying … so therefore it’s unnec-
essary to make them worry to start with.
c) Test accuracy: how much detail?
Almost all of the women interviewed said they
felt anxious upon hearing that mammograms are
not 100% accurate. However, this anxiety was
more evident in those women who had always
assumed that mammograms provide a definitive
answer. These women did not want to know
mammograms are not 100% accurate as they
felt it would cause them to worry that they may
have breast cancer after receiving a normal
result. They expressed a need for certainty in the
diagnosis of their breast symptom and wanted to
know if there was an alternative test, which
would be more accurate.
Most of the women interviewed felt that it was
important for women to know that mammo-
grams are not 100% accurate, as it avoids false
reassurance. However, they differed on just how
much detail should be provided, with some
women wanting statistical information on the
accuracy of diagnostic mammography and oth-
ers wanting only to know that diagnostic mam-
mography is not 100% accurate. One woman
felt that the lack of 100% accuracy was positive,
as it provided hope that an inconclusive or
abnormal result was incorrect.
(d) Influences on information preferences
Use of information depends on the perceived
severity of test side-effects and potential out-
comes.
When asked if and when they would use
information about a test to assist decision-
making, most women said that they would use
information when there was a strong possibility
that the test would have a side-effect. They
considered these tests to be high-risk and wanted
more information about them. One woman said:
If high risk [I] want information, if not high risk,
there’s no need [for information].
They would also use information when
making a decision about a test where the
potential outcome was perceived as serious (e.g.
a cancer diagnosis). One woman said:
I think it’s more important for breast cancer
because it’s cancer, cancer being a deadly word.
Like with cholesterol, cholesterol doesn’t bring up
the emotions that cancer does, so people worry
more [about cancer and] they need more informa-
tion.
Desire for information affected
by the probability of cancer
Women expressed a greater desire for informa-
tion that was positive. In particular, a number of
women said they would not want to know, prior
to the mammogram, that the chance of having
breast cancer with an abnormal result was more
than 95% (Fig. 2). They felt the information was
too negative and would frighten them. One
woman commented:
Table 2 (Continued)
Numbers of times mentioned
Information Unprompted Prompted Total
Results
How long will it take to get the result? 3 - 3
How do they determine if anything is wrong? 2 - 2
Who examines the mammogram? 1 - 1
How do I find out if anything is wrong? 1 - 1
What happens once the result is known? 1 - 1
Cost
Is there a Medicare rebate? 1 - 1
� Blackwell Publishing Ltd 2003 Health Expectations, 6, pp.298–311
Women’s views on information for diagnostic tests, H M Davey et al.306
Well I think if I was told that I had a 95 out of a
100 chance that the lump in my breast was cancer,
I don’t think I’d want to know.
3) Preferences for information content
and presentation
Need for written information
Written information was perceived as a useful
resource, given women are likely to be upset,
and therefore unable to take in any or all of the
information their doctor tells them. In addition,
many women felt written information would be
useful in assisting them to explain the situation
and mammography to their partners, family and
friends. One woman said:
I would like something in writing because the thing
is often [when] I’m particularly upset or thrown, I
don’t think clearly and I don’t understand and I’ll
say �yes� but I don’t understand and I want to take
away a sheet of paper which is clear or something
that, you know, that I can read at home in peace
and quiet or can give my sister to read.
Relevance of statistics for an individual
For a small number of women statistical infor-
mation about the probability of a lump being
cancer and the probability of cancer with dif-
ferent test results was irrelevant. They were only
interested in whether or not they had breast
cancer; they were not interested in statistics
about a group of women that did not include
them. One woman said:
I don’t want to know about all the other people.
It’s my body, my cancer, my breast, I want to
know just for me.
Type and detail of information varied between
women and according to time
While there was considerable variation between
women in their preference for type and detail of
information, three main groups were evident.
One group of women wanted only basic infor-
mation, citing a lack of interest in the actual
percentage of people to whom a certain statistic
applied. They were more interested that an event,
for example, test inaccuracy, was possible. A
second group of women wanted very specific
information, citing the reassuring nature of
knowing exactly what was going on. These
women said that they would filter out any infor-
mation they did not like or considered relevant.
The third group of women wanted basic
information to begin with, then more detailed
information at a later time. In particular, these
women were happy to know before making a
decision or undergoing a test, that mammo-
grams are not 100% accurate and to wait to
know the actual post-test probability of disease
until they received their result.
Present the information simply to facilitate
understanding
All of the women interviewed felt that informa-
tion should be presented as simply as possible, as
women consulting about a breast lump are
anxious and already overloaded with informa-
tion. However, what constituted a simple pres-
entation differed among participants. Most
women agreed that the use of mathematical
symbols such as �<� (less than) and �>� (greater
than) should be avoided and that numbers and
percentages should be put in context by attaching
to them a qualitative label, such as likely.
Women were divided in their views on whe-
ther written presentations such as plain text or
pictorial presentations such as faces were easier
to understand. Some women felt that percent-
ages were difficult to understand on their own.
These women preferred percentages in the con-
text of a qualitative label or information pre-
sented in a visual format (100 faces). They felt
the latter made the information easier to
understand, particularly for women with poor
literacy skills.
Preference for written or pictorial presentation
of information
Women were divided in their preference for
information presented as 100 faces, with the
applicable number coloured in (Fig. 2). Some
women felt that the faces made the information
clear and easy to understand. Those women who
disliked the faces, tended to do so because of
their emotional impact. They felt presenting the
� Blackwell Publishing Ltd 2003 Health Expectations, 6, pp.298–311
Women’s views on information for diagnostic tests, H M Davey et al. 307
information as faces made it confronting and
too sharp. One woman commented:
The little faces, [you] see all these chances, its
scarier, each chance looks like a human being.
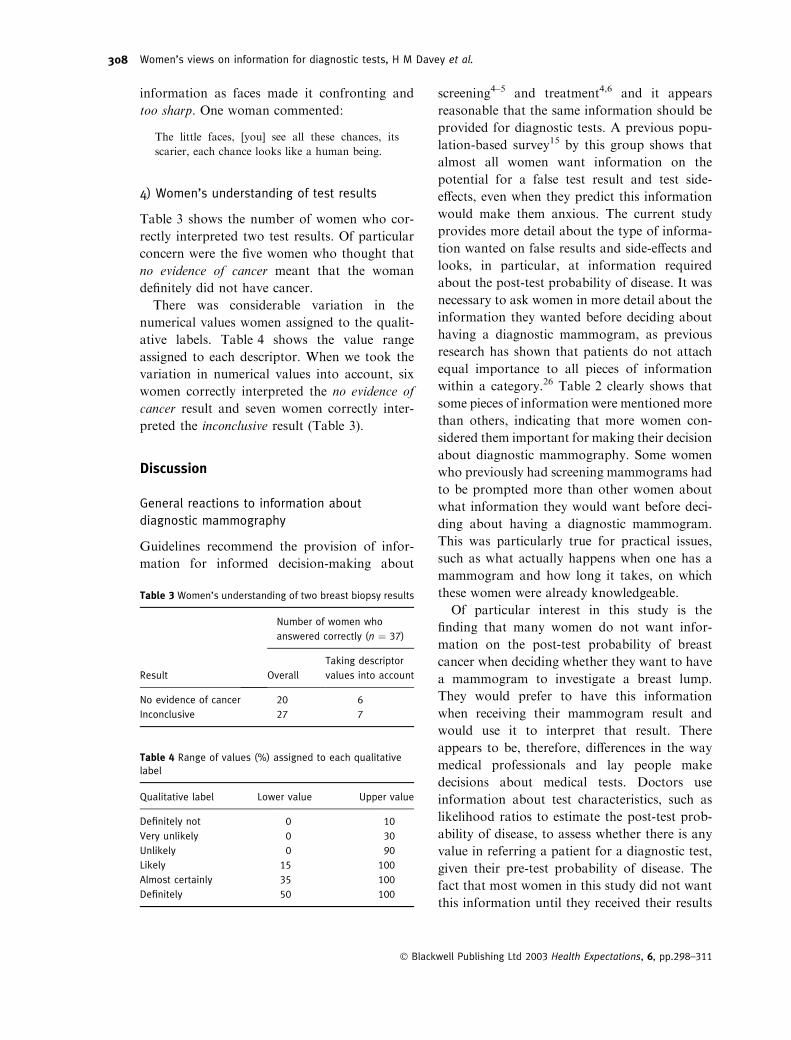
4) Women’s understanding of test results
Table 3 shows the number of women who cor-
rectly interpreted two test results. Of particular
concern were the five women who thought that
no evidence of cancer meant that the woman
definitely did not have cancer.
There was considerable variation in the
numerical values women assigned to the qualit-
ative labels. Table 4 shows the value range
assigned to each descriptor. When we took the
variation in numerical values into account, six
women correctly interpreted the no evidence of
cancer result and seven women correctly inter-
preted the inconclusive result (Table 3).
Discussion
General reactions to information about
diagnostic mammography
Guidelines recommend the provision of infor-
mation for informed decision-making about
screening4–5 and treatment4,6 and it appears
reasonable that the same information should be
provided for diagnostic tests. A previous popu-
lation-based survey15 by this group shows that
almost all women want information on the
potential for a false test result and test side-
effects, even when they predict this information
would make them anxious. The current study
provides more detail about the type of informa-
tion wanted on false results and side-effects and
looks, in particular, at information required
about the post-test probability of disease. It was
necessary to ask women in more detail about the
information they wanted before deciding about
having a diagnostic mammogram, as previous
research has shown that patients do not attach
equal importance to all pieces of information
within a category.26 Table 2 clearly shows that
some pieces of information were mentioned more
than others, indicating that more women con-
sidered them important for making their decision
about diagnostic mammography. Some women
who previously had screening mammograms had
to be prompted more than other women about
what information they would want before deci-
ding about having a diagnostic mammogram.
This was particularly true for practical issues,
such as what actually happens when one has a
mammogram and how long it takes, on which
these women were already knowledgeable.
Of particular interest in this study is the
finding that many women do not want infor-
mation on the post-test probability of breast
cancer when deciding whether they want to have
a mammogram to investigate a breast lump.
They would prefer to have this information
when receiving their mammogram result and
would use it to interpret that result. There
appears to be, therefore, differences in the way
medical professionals and lay people make
decisions about medical tests. Doctors use
information about test characteristics, such as
likelihood ratios to estimate the post-test prob-
ability of disease, to assess whether there is any
value in referring a patient for a diagnostic test,
given their pre-test probability of disease. The
fact that most women in this study did not want
this information until they received their results
Table 4 Range of values (%) assigned to each qualitative
label
Qualitative label Lower value Upper value
Definitely not 0 10
Very unlikely 0 30
Unlikely 0 90
Likely 15 100
Almost certainly 35 100
Definitely 50 100
Table 3 Women’s understanding of two breast biopsy results
Result
Number of women who
answered correctly (n ¼ 37)
Overall
Taking descriptor
values into account
No evidence of cancer 20 6
Inconclusive 27 7
� Blackwell Publishing Ltd 2003 Health Expectations, 6, pp.298–311
Women’s views on information for diagnostic tests, H M Davey et al.308
suggests our participants would use this infor-
mation to assist them to understand the test
results. This difference between doctors and
participants in this study highlights the need,
when providing information, to consider the
purpose for which people, in practice, would use
the information. It raises two important issues.
First, the extent to which patients can or want to
be, in practice, involved in decisions about
having a diagnostic test, given they may not
want relevant information before making a
decision. Second, the relationship between
diagnostic test, screening test and treatment
decisions. Are diagnostic tests so different from
screening tests and treatment that the same
issues about informed decision-making and
recommendations regarding what information
should be provided to patients, do not apply?
It may be that, as in this study, people do not
perceive there is a decision to make when they
have a symptom, as testing is considered the
only option. However with screening and treat-
ment people perceive there are at least two
options (to have or not have screening ⁄treatment), and therefore a decision to make.
However, this argument ignores the fact that the
majority of women want an equal or more active
role in test decision-making.15 Therefore, if they
want to be involved in decision-making, they
should be provided with the relevant informa-
tion, otherwise they are unable to make an
informed decision. This raises questions about
how to ensure patients obtain the necessary
information to enable them make an informed
decision while accommodating information
preferences. While this issue has been raised in
the context of diagnostic breast tests in this
study, it may not be confined to such tests.
The lack of relevance of statistical informa-
tion for some women poses a problem for their
involvement in decision-making. Health-related
decisions are commonly based on statistical
information with average values. For example,
the national breast screening program in Aus-
tralia uses statistics to provide reasons why
women aged 50–69 years should attend for
a screening mammogram every 2 years.27 If
women do not consider statistical information
relevant because it is group data that may not
represent them as an individual, on what basis
can they make an informed decision?
This is the first known study to assess women’s
understanding of breast biopsy results. A sub-
stantial proportion of women were unable to
correctly interpret a no evidence of cancer and an
inconclusive result. Some women found the lack
of a neutral category between likely and unlikely
difficult, but as the probabilities they were being
asked to interpret were 0.1% and 18%, their
difficulty suggests that women may not under-
stand the results. Consistent with the litera-
ture,17–22 there was considerable variation in the
numerical values women assigned to each of the
qualitative labels. When these differences were
taken into account, few women correctly inter-
preted the test results. Most women’s inability to
correctly interpret a diagnostic test result using
qualitative labels suggests such descriptors, often
used to describe probability in health-care, may
be inappropriate for health-care consumers.
Limitations
This was a qualitative study involving a sub-
sample of women who had completed a popu-
lation-based telephone survey on women’s
preferences for and experiences in decision-
making for tests and treatment and their need
for information. Compared with the general
population, interview participants were more
likely to be older, live in a metropolitan area and
have post-school qualifications. Our sample
includes women most and least likely to want to
participate in health-care decisions and to want
information.15 This study cannot provide any
information about the extent to which the pref-
erences for information content and presenta-
tion found in this study represent those of other
women in the community. Thus it would be
pertinent to assess the prevalence of the prefer-
ences found in this study in a larger represen-
tative sample of women.
This study elicited preferences for different
presentation formats. An assessment of the
understanding of information using different
presentation formats was outside the scope of
� Blackwell Publishing Ltd 2003 Health Expectations, 6, pp.298–311
Women’s views on information for diagnostic tests, H M Davey et al. 309
this study. However, given that the most pre-
ferred format may not be the best understood
format, there is a need to assess women’s
understanding of information using the formats
they selected as most preferred in this study.
Conclusion
This study builds on previous research with a
representative sample of women,15 which found
women want information on test accuracy and
test side-effects, by providing a valuable insight
into women’s preferences for the content and
presentation of information materials for, and
their understanding of, diagnostic breast test
results. In addition, it raises several important
issues that have the potential to impact on the
provision of information to consumers and
their involvement in health-care decisions: (1)
differences in the way health-care professionals
and consumers use information on the post-test
probability of disease and related questions
about consumers� ability to participate in diag-
nostic test decision-making; (2) the reconcili-
ation of the provision of information necessary
for informed decision-making with consumer
preferences; and (3) potential differences in the
way diagnostic tests, screening tests and treat-
ment are viewed by consumers.
Acknowledgements
This research was supported by a grant from the
National Health and Medical Research Council,
Australia.
References
1 Ward J. Population-based mammographic screening:
Does �informed choice� require any less than full
disclosure to individuals of benefits, harms, limita-
tions and consequences? Australian and New Zealand
Journal of Public Health, 1999; 23: 301–304.
2 Coulter A, Entwistle V, Gilbert D. Sharing decisions
with patients: is the information good enough?
British Medical Journal, 1999; 318: 318–322.
3 Fallowfield, L. Participation of patients in deci-
sions about treatment for cancer: Desire for
information is not the same as a desire to parti-
cipate in decision making. British Medical Journal,
2001; 323: 1144.
4 General Medical Council. Seeking Patients� Consent:
the Ethical Considerations. London: General
Medical Council, 1998.
5 American College of Physicians. Clinical Guideline
part III: screening for prostate cancer. Annals of
Internal Medicine, 1997; 126: 480–484.
6 American College of Physicians. Guidelines for
counselling postmenopausal women about preventive
hormone therapy. Annals of Internal Medicine, 1992;
117: 1038–1041.
7 Schofield MJ, Sanson-Fisher R. How to prepare
cancer patients for potentially threatening medical
procedures: consensus guidelines. Journal of Cancer
Education, 1996; 11: 153–158.
8 D’haese S, Vinh-Hung V, Bijdekerke P et al. The
effect of timing of the provision of information on
anxiety and satisfaction of cancer patients receiving
radiotherapy. Journal of Cancer Education, 2000; 15:
223–227.
9 Humphris GM, Ireland RS, Field EA. Randomised
trial of the psychological effect of information about
oral cancer in primary care settings. Oral Oncology,
2001; 37: 548–552.
10 Mainiero MB, Schepps B, Clements NC, Bird CE.
Mammography-related anxiety: effect of preproce-
dural patient education. Womens Health Issues, 2001;
11: 110–115.
11 Poroch D. The effect of preparatory patient educa-
tion on the anxiety and satisfaction of cancer patients
receiving radiation therapy. Cancer Nursing, 1995;
18: 206–214.
12 Croft E, Barratt A, Butow P. Information about tests
for breast cancer: what are we telling people? Journal
of Family Practice, 2002; 51: 858–860.
13 Slaytor EK, Ward JE. How risks of breast cancer and
benefits of screening are communicated to women:
analysis of 58 pamphlets. British Medical Journal,
1998; 317: 263–264.
14 Hamm RM, Smith SL. The accuracy of patients�judgments of disease probability and test sensitivity
and specificity. Journal of Family Practice, 1998; 47:
44–52.
15 Davey HM, Barratt AL, Davey E et al. Medical
tests: women’s reported and preferred decision
making roles and preferences for information on
benefits, side effects and false results. Health
Expectations, 2002; 5: 330–340.
16 Houssami N, Irwig L. Likelihood ratios for clinical
examination, mammography, ultrasound and fine
needle biopsy in women with breast problems. The
Breast, 1998; 7: 85–89.
17 Bryant GD, Norman GR. Expressions of probabil-
ity: words and numbers. New England Journal of
Medicine, 1980; 302: 411.
� Blackwell Publishing Ltd 2003 Health Expectations, 6, pp.298–311
Women’s views on information for diagnostic tests, H M Davey et al.310
18 Kong A, Barnett GO, Mosteller F, Youtz C. How
medical professionals evaluate expressions of prob-
ability. New England Journal of Medicine, 1986; 315:
740–744.
19 Mazur DJ, Hickam DH. Patients� interpretations of
probability terms. Journal of General Internal
Medicine, 1991; 6: 237–240.
20 Nakao MA, Axelrod S. Numbers are better than
words. Verbal specifications of frequency have no
place in medicine. American Journal of Medicine,
1983; 74: 1061–1065.
21 Robertson WO. Quantifying the meanings of words.
Journal of the American Medical Association, 1983;
249: 2631–2632.
22 Woloshin KK, Ruffin MT, IV, Gorenflo DW.
Patients� interpretation of qualitative probability
statements. Archives of Family Medicine, 1994; 3:
961–966.
23 SPSS Inc. SPSS Version 10.0.5 for Windows.
Chicago: SPSS Inc., 1999.
24 Glaser BG, Strauss Al. The Discovery of Grounded
Theory: Strategies for Qualitative Research. Aldine
Publishing Company: New York, 1967.
25 Australian Bureau of Statistics. Data provided on
request.
26 Feldman-Stewart D, Brundage MD, McConnell BA,
MacKillop WJ. Practical issues in assisting shared
decision-making. Health Expectations, 2000; 3: 46–54.
27 Why Should I Have A Mammogram? Available at:
http://www.breastscreen.info.au/why/index.htm
(Accessed 20 June 2002).
� Blackwell Publishing Ltd 2003 Health Expectations, 6, pp.298–311
Women’s views on information for diagnostic tests, H M Davey et al. 311