construction project risk assessment using existing database and project-specific information
TRANSCRIPT

Construction Project Risk Assessment Using ExistingDatabase and Project-Specific Information
Hyun-Ho Choi1 and Sankaran Mahadevan2
Abstract: This paper develops a risk assessment methodology for construction projects by combining existing large quantities of dataand project-specific information through updating approaches. Earlier studies have indicated that risk assessment is still difficult forpracticing engineers to use due to the requirement of data on too many input variables. However, the availability of existing largequantities of data and project-specific information makes it possible to simplify the risk assessment procedure. Two main ideas are pursuedin this paper to facilitate practical implementation: identify and evaluate the critical risk events, and develop a systematic updatingmethodology. Both epistemic and aleatory types of uncertainties in the data are considered, and corresponding updating procedures aredeveloped. The proposed methodology is illustrated for the construction risk assessment of a cable-stayed bridge.
DOI: 10.1061/�ASCE�0733-9364�2008�134:11�894�
CE Database subject headings: Construction management; Databases; Information management; Fuzzy sets; Risk management.
Introduction
A number of accidents including the collapse of large infrastruc-ture systems such as subways, bridges, and buildings have oc-curred during construction �Park 1995�. The large scale of thefacilities and the complexity of construction processes, equip-ment, and operations are important considerations. In the con-struction of large civil structures, it has been recognized thatfailures or collapse accidents are more likely to happen becauseof adverse or hazardous environments during construction. Forexample, the National Safety Council reported that despite em-ploying only 5% of the industrial workforce, construction ac-counted for 14% of all workplace deaths and 9% of disablinginjuries �Everett and Frank 1996�. Thus, systematic proceduresfor risk assessment and management of construction projects areincreasingly critical to minimize the disproportionate rate of ac-cidents in construction projects.
Risk analysis methods currently used in actual engineeringpractice usually employ a qualitative approach for handling vari-ous risks in construction projects and do not explicitly analyzerisk in quantitative terms that can provide helpful information formanaging the risk. Also, risk assessment of construction projectsis usually performed during the precontract phase or preconstruc-tion phase for use in cost estimation or risk reduction strategies.Quantitative risk analysis during the precontract phase has to con-tend with many uncertainties due to lack of data. In many practi-
1Senior Researcher, Highway Design Evaluation Office, KoreaExpressway Corp., 430, Daewang Pangyoro, Sujeong-gu, Seongnam,Kyungki, Korea. E-mail: [email protected], [email protected]
2Professor, Dept. of Civil and Environmental Engineering andMechanical Engineering, Vanderbilt Univ., VU Station B #351831,2301 Vanderbilt Place, Nashville, TN 37235-1831. E-mail: [email protected]
Note. Discussion open until April 1, 2009. Separate discussions mustbe submitted for individual papers. The manuscript for this paper wassubmitted for review and possible publication on August 12, 2005; ap-proved on April 23, 2007. This paper is part of the Journal of Construc-tion Engineering and Management, Vol. 134, No. 11, November 1,
2008. ©ASCE, ISSN 0733-9364/2008/11-894–903/$25.00.894 / JOURNAL OF CONSTRUCTION ENGINEERING AND MANAGEMENT
Downloaded 26 Jun 2009 to 218.49.21.53. Redistribution subject to
cal situations, it is difficult to obtain precise data. Thus,uncertainties in risk analysis may be attributed both to the inher-ent randomness in some variables and to inadequate as well asimprecise data. Imprecise information makes subjective judgmentbased on expert opinion important, and in such situations fuzzy-sets-based approaches for risk assessment may be useful.
A procedure for risk assessment of construction projects usingfuzzy sets concepts has been developed earlier by Cho et al.�2002� and Choi et al. �2004�. However, the earlier studies haveidentified two major problems. First, it may be possible for therisk assessment to lead to unreasonable results because the mostcommon mistake made by novice and experienced investigatorsalike is that they fail to consider all possible risk scenarios. Omis-sion of critical risks might lead to significant error in the total riskestimate. Second, the earlier method is difficult for practicingengineers to use due to the requirement of data on too many inputvariables.
The objective of this study is to propose a risk assessmentmethodology for construction projects by combining existinglarge quantities of data and project-specific information throughupdating approaches. That is, based on risk assessment and man-agement activities, inspection, maintenance, etc., on similar pre-vious projects, large quantities of data are stored; then, for a newproject, the risk estimate is updated based on information specificto the new project. In this methodology, it is important to keep theprocedure efficient by concentrating only on a few critical risksthat are the dominant cost items.
Handling Qualitative Information
Information Uncertainty Modeling
Uncertainties in information may arise due to live ambiguitycomponents—the experience of experts and statistical uncertain-ties. Therefore, the fuzzy membership curve is designed to con-sider the uncertainty range that combines the uncertainty insubjective judgment and probabilistic analysis methods.
• Subjective judgments: The fuzzy membership curves repre-© ASCE / NOVEMBER 2008
ASCE license or copyright; see http://pubs.asce.org/copyright
sented in the next section can be used to include the uncertain-ties in subjective judgments. The factors that influence theuncertainties in subjective judgments are divided into twomain classes: �1� the complexity of work/judgmental conditionand �2� the level of education, confidence, and experience. Ingeneral, there are four possible grades of uncertainties in thesetwo mean classes, which are usually described as “VerySmall,” “Small,” “Normal,” and “Large.” Table 1 shows theclassification of linguistic variables that represents the degreeof uncertainties according to different combinations of the twomain factors.
• Parameter statistics: The parameter statistics estimates basedon historical accident data are required to predict the occur-rence probability of the associated risk events. Such estimateshave uncertainties due to �1� unreliable/insufficient data or�2� approximation in statistical analysis methods. The combi-nation of uncertainties in both subjective judgment and statis-tical parameter estimates may be represented throughlinguistic variables such as “Small/Very Small,” etc., as shownin Table 1.
Fuzzy Membership Curves
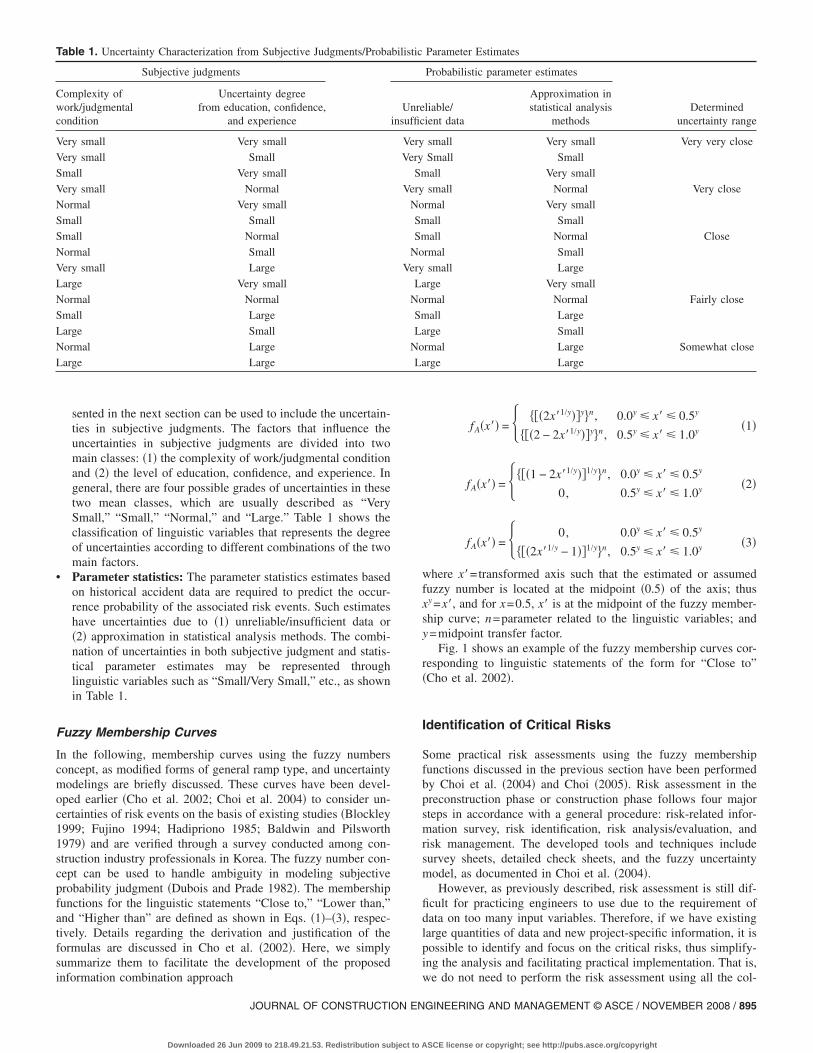
In the following, membership curves using the fuzzy numbersconcept, as modified forms of general ramp type, and uncertaintymodelings are briefly discussed. These curves have been devel-oped earlier �Cho et al. 2002; Choi et al. 2004� to consider un-certainties of risk events on the basis of existing studies �Blockley1999; Fujino 1994; Hadipriono 1985; Baldwin and Pilsworth1979� and are verified through a survey conducted among con-struction industry professionals in Korea. The fuzzy number con-cept can be used to handle ambiguity in modeling subjectiveprobability judgment �Dubois and Prade 1982�. The membershipfunctions for the linguistic statements “Close to,” “Lower than,”and “Higher than” are defined as shown in Eqs. �1�–�3�, respec-tively. Details regarding the derivation and justification of theformulas are discussed in Cho et al. �2002�. Here, we simplysummarize them to facilitate the development of the proposed
Table 1. Uncertainty Characterization from Subjective Judgments/Proba
Subjective judgments
Complexity ofwork/judgmentalcondition
Uncertainty degreefrom education, confidence,
and experience i
Very small Very small
Very small Small
Small Very small
Very small Normal
Normal Very small
Small Small
Small Normal
Normal Small
Very small Large
Large Very small
Normal Normal
Small Large
Large Small
Normal Large
Large Large
information combination approach
JOURNAL OF CONSTRUCTION EN
Downloaded 26 Jun 2009 to 218.49.21.53. Redistribution subject to
fA�x�� = � ���2x�1/y��y�n, 0.0y � x� � 0.5y
���2 − 2x�1/y��y�n, 0.5y � x� � 1.0y� �1�
fA�x�� = ����1 − 2x�1/y��1/y�n, 0.0y � x� � 0.5y
0, 0.5y � x� � 1.0y� �2�
fA�x�� = � 0, 0.0y � x� � 0.5y
���2x�1/y − 1��1/y�n, 0.5y � x� � 1.0y� �3�
where x�=transformed axis such that the estimated or assumedfuzzy number is located at the midpoint �0.5� of the axis; thusxy =x�, and for x=0.5, x� is at the midpoint of the fuzzy member-ship curve; n=parameter related to the linguistic variables; andy=midpoint transfer factor.
Fig. 1 shows an example of the fuzzy membership curves cor-responding to linguistic statements of the form for “Close to”�Cho et al. 2002�.
Identification of Critical Risks
Some practical risk assessments using the fuzzy membershipfunctions discussed in the previous section have been performedby Choi et al. �2004� and Choi �2005�. Risk assessment in thepreconstruction phase or construction phase follows four majorsteps in accordance with a general procedure: risk-related infor-mation survey, risk identification, risk analysis/evaluation, andrisk management. The developed tools and techniques includesurvey sheets, detailed check sheets, and the fuzzy uncertaintymodel, as documented in Choi et al. �2004�.
However, as previously described, risk assessment is still dif-ficult for practicing engineers to use due to the requirement ofdata on too many input variables. Therefore, if we have existinglarge quantities of data and new project-specific information, it ispossible to identify and focus on the critical risks, thus simplify-ing the analysis and facilitating practical implementation. That is,
Parameter Estimates
Probabilistic parameter estimates
Determineduncertainty range
liable/ient data
Approximation instatistical analysis
methods
small Very small Very very close
Small Small
all Very small
small Normal Very close
rmal Very small
all Small
all Normal Close
rmal Small
small Large
rge Very small
rmal Normal Fairly close
all Large
rge Small
rmal Large Somewhat close
rge Large
bilistic
Unrensuffic
Very
Very
Sm
Very
No
Sm
Sm
No
Very
La
No
Sm
La
No
La
we do not need to perform the risk assessment using all the col-
GINEERING AND MANAGEMENT © ASCE / NOVEMBER 2008 / 895
ASCE license or copyright; see http://pubs.asce.org/copyright
lected risk events again because only a few critical risks are im-portant cost items, affecting a large proportion of the total risk.
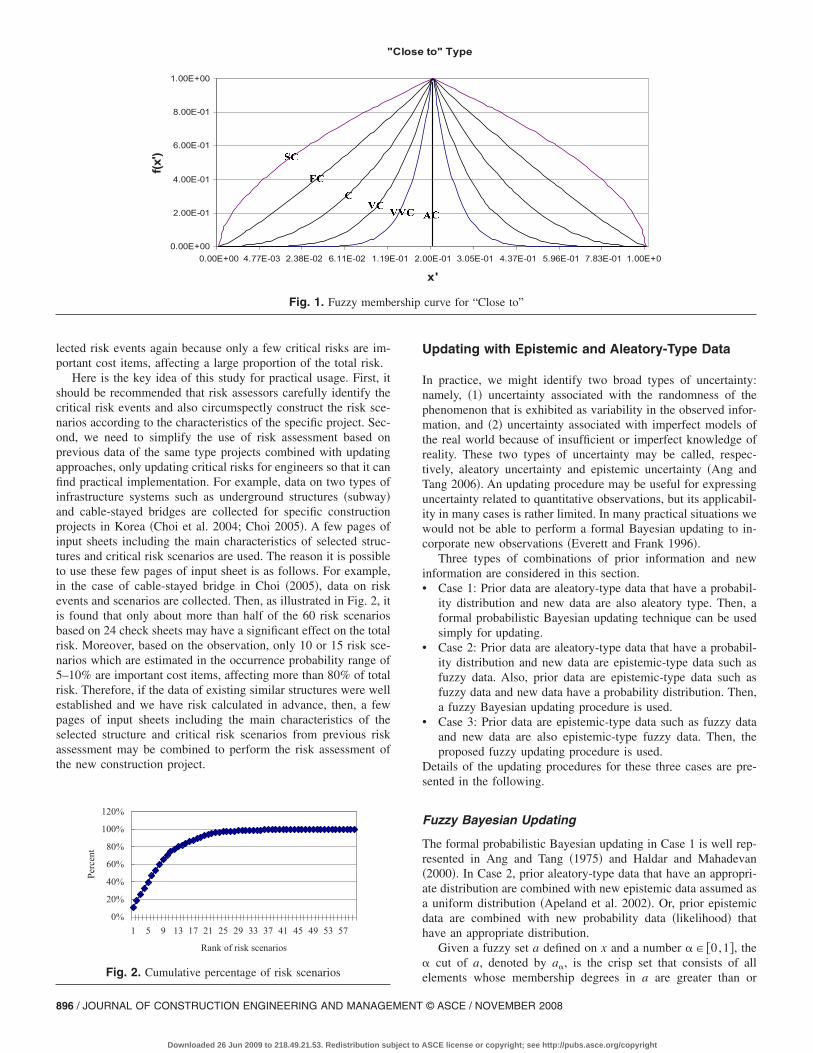
Here is the key idea of this study for practical usage. First, itshould be recommended that risk assessors carefully identify thecritical risk events and also circumspectly construct the risk sce-narios according to the characteristics of the specific project. Sec-ond, we need to simplify the use of risk assessment based onprevious data of the same type projects combined with updatingapproaches, only updating critical risks for engineers so that it canfind practical implementation. For example, data on two types ofinfrastructure systems such as underground structures �subway�and cable-stayed bridges are collected for specific constructionprojects in Korea �Choi et al. 2004; Choi 2005�. A few pages ofinput sheets including the main characteristics of selected struc-tures and critical risk scenarios are used. The reason it is possibleto use these few pages of input sheet is as follows. For example,in the case of cable-stayed bridge in Choi �2005�, data on riskevents and scenarios are collected. Then, as illustrated in Fig. 2, itis found that only about more than half of the 60 risk scenariosbased on 24 check sheets may have a significant effect on the totalrisk. Moreover, based on the observation, only 10 or 15 risk sce-narios which are estimated in the occurrence probability range of5–10% are important cost items, affecting more than 80% of totalrisk. Therefore, if the data of existing similar structures were wellestablished and we have risk calculated in advance, then, a fewpages of input sheets including the main characteristics of theselected structure and critical risk scenarios from previous riskassessment may be combined to perform the risk assessment ofthe new construction project.
"
0.00E+00
2.00E-01
4.00E-01
6.00E-01
8.00E-01
1.00E+00
0.00E+00 4.77E-03 2.38E-02 6.11E-02 1.19E
f(x')
Fig. 1. Fuzzy memb
0%
20%
40%
60%
80%
100%
120%
1 5 9 13 17 21 25 29 33 37 41 45 49 53 57
Rank of risk scenarios
Percent
Fig. 2. Cumulative percentage of risk scenarios
896 / JOURNAL OF CONSTRUCTION ENGINEERING AND MANAGEMENT
Downloaded 26 Jun 2009 to 218.49.21.53. Redistribution subject to
Updating with Epistemic and Aleatory-Type Data
In practice, we might identify two broad types of uncertainty:namely, �1� uncertainty associated with the randomness of thephenomenon that is exhibited as variability in the observed infor-mation, and �2� uncertainty associated with imperfect models ofthe real world because of insufficient or imperfect knowledge ofreality. These two types of uncertainty may be called, respec-tively, aleatory uncertainty and epistemic uncertainty �Ang andTang 2006�. An updating procedure may be useful for expressinguncertainty related to quantitative observations, but its applicabil-ity in many cases is rather limited. In many practical situations wewould not be able to perform a formal Bayesian updating to in-corporate new observations �Everett and Frank 1996�.
Three types of combinations of prior information and newinformation are considered in this section.• Case 1: Prior data are aleatory-type data that have a probabil-
ity distribution and new data are also aleatory type. Then, aformal probabilistic Bayesian updating technique can be usedsimply for updating.
• Case 2: Prior data are aleatory-type data that have a probabil-ity distribution and new data are epistemic-type data such asfuzzy data. Also, prior data are epistemic-type data such asfuzzy data and new data have a probability distribution. Then,a fuzzy Bayesian updating procedure is used.
• Case 3: Prior data are epistemic-type data such as fuzzy dataand new data are also epistemic-type fuzzy data. Then, theproposed fuzzy updating procedure is used.
Details of the updating procedures for these three cases are pre-sented in the following.
Fuzzy Bayesian Updating
The formal probabilistic Bayesian updating in Case 1 is well rep-resented in Ang and Tang �1975� and Haldar and Mahadevan�2000�. In Case 2, prior aleatory-type data that have an appropri-ate distribution are combined with new epistemic data assumed asa uniform distribution �Apeland et al. 2002�. Or, prior epistemicdata are combined with new probability data �likelihood� thathave an appropriate distribution.
Given a fuzzy set a defined on x and a number �� �0,1�, the� cut of a, denoted by a�, is the crisp set that consists of all
to" Type
00E-01 3.05E-01 4.37E-01 5.96E-01 7.83E-01 1.00E+0
x'
curve for “Close to”
Close
-01 2.
ership
elements whose membership degrees in a are greater than or
© ASCE / NOVEMBER 2008
ASCE license or copyright; see http://pubs.asce.org/copyright

equal to � �Klir 2004�. Thus, the new data are transformed tocrisp probability format. Then, it is easily subjected to a Bayesianupdating technique.
Bayesian updating is formulated as
f��x� =L�x�f��x�
L�x�f��x�dx�4�
where f��x�=prior density function; f��x�=posterior density func-tion; and L�x�=likelihood function.
It is assumed that x is a continuous random variable. If there isno information on x except epistemic-type data such as an ex-pert’s opinion, a uniform distribution may be assumed from the�-cut method. Thus
f��x� =1
a�U − a�
L �5a�
where the fuzzy number a corresponding to a �constant� can beinterpreted as “around a;” a�
U, a�L =upper and lower limits of a
with respect to � level.Similarly, if uniform distribution L�x� is assumed for the like-
lihood distribution, then
L�x� =1
a�U − a�
L �5b�
Fuzzy Updating
In Case 3, the proposed fuzzy updating procedure is presented.• Step 1: As prior data are fuzzy and new information �i.e., data�
is also fuzzy, fuzzy membership curves are used to representexpert opinion, as discussed earlier. Then, we choose the ap-propriate linguistic variable that represents the degree of un-certainty in subjective judgments in the uncertainty modeling.Depending on the linguistic variables, it can be indicatedwhether the expert opinion is valuable or not.
• Step 2: Generally, the strength or weight of the probabilitystatement is governed by the state of information. In thispaper, a weighting factor is proposed. The smaller the areaunder the membership curve for the corresponding linguisticvariable, the larger is the weight. For example, “VVC” hasmore weight than “FFC” because the amount of uncertaintydue to the complexity of the work and the assessor’s healthconditions, education, confidence, and experience is very
Table 2. Area Factors
Variables Close to Variables Lower/higher than
VVC 2.00E−01 VV L/H T 8.00E−01
VC 3.33E−01 V L/H T 6.67E−01
C 5.00E−01 L/H T 5.00E−01
FC 6.67E−01 S L/H T 3.33E−01
FFC 8.00E−01 VS L/H T 2.00E−01
small or small �Cho et al. 2002�.
JOURNAL OF CONSTRUCTION EN
Downloaded 26 Jun 2009 to 218.49.21.53. Redistribution subject to
The weight factor is represented as
Wj =i=1
5 0.0y1.0y
fA�i�x��dx�
0.0y1.0y
fA�j�x��dx��6�
where i=1 �VVC�, 2�VC�, 3�C�, 4�FC�, 5�FFC�.In case of combining, “Close to” type and “Lower/Higher
than” type curves, the areas of curves according to selectedlinguistic variables are different for each type. In this study,it is assumed that same weight factors are used only accordingto selected linguistic variables such as “VVC,” “FC,” “SHT,”“VLT,” etc., regardless of the type of curves. In the case of“Lower/Higher than” type curves, the meaning of area ofcurves is different. The larger the area of a curve accordingto selected linguistic variable, the more weight for the expert’sopinion; the corresponding defuzzied interval is smaller. Fora similar example, “VSHT” or “VLST” has more weightthan “VVHT” or “VVLT.” Table 2 shows the area factorsdescribed.
Membership functions corresponding to “Close to,” “Lowerthan,” and “Higher than” statements, multiplied with theweight function, are defined as shown in Eqs. �7�–�9� respec-tively. Fig. 3 presents these functions in x scale not x� for easyunderstanding �see the definition of x� following Eq. �3��
f�x�� = WifA�i�x�� = � Wi���2x�1/y��y�n, 0.0y � x� � 0.5y
Wi���2 − 2x�1/y��y�n, 0.5y � x� � 1.0y�
0.00E+00
2.00E-01
4.00E-01
6.00E-01
8.00E-01
1.00E+00
0.00E+00 2.00E-01 4.00E-01 6.00E-01 8.00E-01 1.00E+00
(a) Initial membership curve
0.00
0.20
0.40
0.60
0.80
1.00
0.00E+00 2.00E-01 4.00E-01 6.00E-01 8.00E-01 1.00E+00
New inform_1
New inform_2
(b) New information membership curves(b) New information membership curves
Fig. 3. Membership curves for initial and new multiple information
�7�
GINEERING AND MANAGEMENT © ASCE / NOVEMBER 2008 / 897
ASCE license or copyright; see http://pubs.asce.org/copyright

f�x�� = WifA�i�x�� = �Wi���1 − 2x�1/y��1/y�n, 0.0y � x� � 0.5y
0, 0.5y � x� � 1.0y��8�
f�x�� = WifA�i�x�� = � 0, 0.0y � x� � 0.5y
Wi���2x�1/y − 1��1/y�n, 0.5y � x� � 1.0y��9�
898 / JOURNAL OF CONSTRUCTION ENGINEERING AND MANAGEMENT
Downloaded 26 Jun 2009 to 218.49.21.53. Redistribution subject to
where Wi is the weight factor.• Step 3: Initial information and new information are combined.
A simple approach is generally the most attractive one. Thus,we just add the new membership curve with weight factors tothe initial membership curve and get the updated membershipcurves. If multiple pieces of new information are available,then more similar terms are added, as in
F�x�� = � WifA�i�x��dx� = � � W1���2x�1/y1��y1�n1dx� +� W2���2x�1/y2��y2�n2dx� + ¯ , 0.0y � x� � 0.5y
� W1���2 − 2x�1/y1��y1�n1dx� +� W2���2 − 2x�1/y2��y2�n2dx� + ¯ , 0.5y � x� � 1.0y �10�
In Eq. �10�, the first term on the right-hand side indicates the original membership curve, and the subsequent term�s� come from newinformation.
Similarly, a combination of “Close to” type and “Lower/Higher than” type statements is as follows:
F�x�� = � WifA�i�x��dx� = �� W1���2x�1/y1��y1�n1dx� +� W2���1 − 2x�1/y2��1/y2�n2dx� + ¯ , 0.0y � x� � 0.5y
� W1���2 − 2x�1/y1��y1�n1dx� + 0 + ¯ , 0.5y � x� � 1.0y �11�
F�x�� = � WifA�i�x��dx� = � � W1���2x�1/y1��y1�n1dx� + 0 + ¯ , 0.0y � x� � 0.5y
� W1���2 − 2x�1/y1��y1�n1dx� +� W2���2x�1/y2 − 1��1/y2�n2dx� + ¯ , 0.5y � x� � 1.0y �12�
• Step 4: The normalization factor c is computed as
c =1
max�F�x����13�
• Step 5: The uncertainty range in the normalized combinedmembership curves is then defuzzified by using an appropriatedefuzzification technique based on x� values. In this paper, the�-level cut method was selected, as it is relatively easy toapply.
0.00E+00
8.00E-01
1.60E+00
2.40E+00
3.20E+00
4.00E+00
0.00E+00 2.00E-01 4.00E-01 6.00E-01 8.00E-01 1.00E+00
x
f(x)
pre datanew inform_1new inform_2pre with w1new_1 with w2new_2 with w3
Fig. 4. Membership curves with weight factors
For example, defuzzied intervals of membership functions cor-responding to “Close to,” “Lower than,” and “Higher than” state-ments are defined as shown in Eqs. �14�–�16�, respectively
x�L = �� 1
2 ���1/n�1/y��y�, 0.0y � x�L � 0.5y
x�U = 1
2 ��2 − ���1/n�1/y��y�, 0.5y � x�U � 1.0y �14�
0.00E+00
2.00E-01
4.00E-01
6.00E-01
8.00E-01
1.00E+00
0.00 0.20 0.40 0.60 0.80 1.00
post data
pre data
Fig. 5. Normalized combined membership curve compared withinitial curve
© ASCE / NOVEMBER 2008
ASCE license or copyright; see http://pubs.asce.org/copyright

x�L = 1
2 ����1 − �1/n�y��y�, 0.0y � x�L � 0.5y
x�U = x�, 0.5y � x�
U � 1.0y �15�
�x�L = x�, 0.0y � x�
L � 0.5y
x�U = 1
2 ����1 + �1/n�y��y� , 0.5y � x�U � 1.0y� �16�
Illustrative Examples
As an example, consider updating with multiple sources of infor-mation. Suppose we have prior information as “Improper cableinstalling and stressing work occurs around two in ten cases,” andthe linguistic variable is determined as “FC” from the uncertaintymodeling in Step 1. And, new information is available such as“The occurrence probability of improper cable installing and
RiRisskk-- rr eellaatt eedd
iinnffoorrmmaatt iionon ssuurrvveyey
RiRisskk
idideenntt iif if iccaatt iioonn
Previous database of
r isk- re lated info rmat ion
Interview with
Experts
Add r isk
info rmation
CCooll llecectt aall ll rr iisskk-- rrelelaatteeddIInnfoforrmmaattiioonn oof nf neeww pprroojjeecctt
Previous database of
Risk identif icat ion
RRiisskk iiddeennttifificicaattiioonnooff nneeww pprroojjeecctt
SimSimppll iiff iieedd IInnppuutt SShhee
ffoorr sseelleectct eded pprrojoj ecec
Fig. 6. Risk assessment pr
formation survey. As described earlier, these data are collected
JOURNAL OF CONSTRUCTION EN
Downloaded 26 Jun 2009 to 218.49.21.53. Redistribution subject to
stressing work is higher than 0.1,” and then the linguistic variableis determined as “SHT” from uncertainty modeling. Also, wehave a second source of information as “Improper work has hap-pened in about one or two in ten cases in my experience,” and thelinguistic variable is determined as “VC” from uncertainty mod-eling. Now we have the following membership curves as shownin Fig. 3.
Then, go to Step 2. In Step 2, the membership functionwith weight factor is constructed using Eqs. �7� and �9�. Fig. 4shows all the membership curves with weight factors for thisexample.
In Step 3, Eqs. �10� and �12� are used to combine prior andnew membership functions, and the normalization is done inStep 4. Thus, the membership curves obtained with multiplepieces of information are shown in Fig. 5.
Finally, in Step 5, the defuzzified interval corresponding tomembership level � is calculated by solving F�x �=�
RiRisskk aannaallyyssiiss aanndd
evevalaluuaatt iioonn
RiRisskk
mamannaaggeemmeenntt
Previous database of
Risk analys is
RiRisskk aannaallyyssiissooff nneeww pprroojjeecctt
CoCommbbiinnee
RiRisskk
ofof
neneww
prprojoj eecctt
UUpdat ing with bothpdat ing with both
Epist emic and A leatoryEpist emic and A leatory
datadata
e combined with updating
�
� = �c � �W1���2x�1/y1��y1�n1 + 0 + W3���2x�1/y3��1/y3�n3� , 0.0y � x� � 0.5y
c � �W1���2x�1/y1��1/y1�n1 + W2���2x�1/y2 − 1��1/y2�n2 + W3���2x�1/y3��1/y3�n3� , 0.5y � x� � 1.0y� �17�
where yl=midpoint transfer factor of prior information; and y2,y3=midpoint transfer factor of new information 1 and 2.
The result in quantitative range of this event for �=0.8 is asfollows. Quantitative range of initial range with predata is calcu-lated as 0.13–0.29. And normalized updated range is calculated as0.13–0.22.
Practical Application
Risk Assessment Procedure Combined with Updating
The first step in the risk assessment process is a risk-related in-
based on previous experience. Then, risk assessors carefully addto or modify the risk events considering the characteristics of thenew construction project.
Risk identification is done in two main stages—the classifica-tion of critical risk events/risk scenarios and simplified detailedcheck sheets. Critical risk events/risk scenarios are determinedbased on the risk-related information survey. Then input sheetsdeveloped in Choi �2004� only consist of critical risk events/riskscenarios for the particular project. Historical data, if available,and detailed check points are used to develop the database, whichis updated for a particular project in the next step.
Risk analysis/evaluation is performed by using the proposedupdating approach. Significant project risks are analyzed in terms
eettss
tt
ocedur
of their probability and potential consequences to eventually
GINEERING AND MANAGEMENT © ASCE / NOVEMBER 2008 / 899
ASCE license or copyright; see http://pubs.asce.org/copyright

manage the risks and to devise response strategies. As describedearlier, updating with epistemic and aleatory-type data is carriedout based on the new information from the characteristics ofthe new construction project. Then, risks are calculated bymultiplying probability and expected cost. After analyzing and
Table 3. Critical Risk Events
Previous database
Construction-related Use
• Careless barge driving Up
• Poor working steel concentrations Co
• Improver design of temporary works �1�→R
• Improper work on shoe leveling at the end and key segment
• Improper cable installation and stressing work • Im
�2�
• Use of overweight material or equipment, etc.
�3�
�4�
• Design-related
• Incomplete design, etc. • Im
• Political and financial-related �6�stru
• Work stoppage by subcontractors
• Bankruptcy of subcontractors �7�fata
• Underbid, etc.
• P
Act of God �8�
• Typhoon
• Earthquake �9�
• Tsunami, etc.
• Im
�10
�11
• Im
�12
�13
Ac
• T
�14
�15
�16
Total 75 check sheets and 175 risk scenarios Tot
0.00E+00
2.00E-01
4.00E-01
6.00E-01
8.00E-01
1.00E+00
0.00E+00 2.00E-01 4.00E-01 6.00E-01 8.00E-01 1.00E+00
Fig. 7. Fuzzy membership curve of “Poor prestressing”
900 / JOURNAL OF CONSTRUCTION ENGINEERING AND MANAGEMENT
Downloaded 26 Jun 2009 to 218.49.21.53. Redistribution subject to
evaluating risks, a response strategy may be developed to reduceor prevent the critical risks. Fig. 6 summarizes the above-mentioned risk assessment procedure for a construction pro-ject using existing large quantities of data and project-specificinformation.
New construction project
ous database
itical risk scenarios as follows:
ion-related
per work of measurement→ Incorrect placement of well foundationgn
r design of temporary works
per design of temporary work→Collapse and damage of structure
per design of temporary work→Loss of material and equipment
per design of temporary work→ Injury and fatality
r elevating work of tower crane→Structural deficiency→Delay
per elevating work of tower crane→Structural deficiency→Damage of
per elevating work of tower crane→Structural deficiency→ Injury and
rk in steel connection
ork in steel connection→Falling of steel material→ Injury and fatality
ork in steel connections→Structural deficiency→Damage of structure
r work on shoe leveling at the end and key segment
oper work on shoe leveling→Reconstruction
oper work on shoe leveling→Reconstruction
r cable installation and stressing work
oper cable installation work→Delay
oper cable installation work→ Injury and fatality
d
oon→Loss of material and equipment
oon→ Injury and fatality
oon→Delay
eck sheets and 16 risk scenarios
0.00E+00
2.00E-01
4.00E-01
6.00E-01
8.00E-01
1.00E+00
0.00E+00 2.00E-01 4.00E-01 6.00E-01 8.00E-01 1.00E+00
Fig. 8. Fuzzy membership curve of “Delay”
previ
date cr
nstruct
Improedesi
prope
Impro
Impro
Impro
prope
Improcture
Improlity
oor wo
Poor w
Poor w
prope
� Impr
� Impr
prope
� Impr
� Impr
t of Go
yphoon
� Typh
� Typh
� Typh
al 7 ch
© ASCE / NOVEMBER 2008
ASCE license or copyright; see http://pubs.asce.org/copyright

JOURNAL OF CONSTRUCTION EN
Downloaded 26 Jun 2009 to 218.49.21.53. Redistribution subject to
Cable-Stayed Bridge Construction Project
In order to demonstrate the effectiveness and applicability of theproposed method for construction projects, it is applied to a cable-stayed bridge construction project. Although the model is appliedto a cable-stayed bridge, the method and procedure can be appliedto various other real structures, such as buildings, other types ofbridges, etc., with minor modifications according to characteris-tics of projects.
From the risk-related information and risk identification step,critical risk events are shown in Table 3. It is acknowledged thatthe previous data can be biased depending on the source. In thiscase, the data are based on projects in Korea.
Table 3 shows a partial list of critical risk events among a totalof 75 check sheets and 175 risk scenarios based on the previouslarge quantities of data for a typical cable-stayed bridge. First,we use all these data for initial risk assessment. Then, the up-dating for critical risks according to characteristics and project-specific information of new construction project is performed. Forexample, the risk events represented in an illustrative example areintegrated into the risk scenario including this event into an event
Cost range�min–max�
Mean risk �max�for one occurrence
of the scenario
9 37.87–62.13 3.57 �6.56�
147–450 15.28 �29.56�
2 37.87–62.13 2.95 �5.31�
8 147–450 12.47 �23.91�
Total risk �mean�from updatingof new project Note
5,563,557 7% reduce
37,550 —
36,280 —
1,256,300 12% reduce
6,893,687
0.58
Initial Quantitative Range
6.565.312.953.570.59
Updated Quantitative Range
(a) Scenario 1
1.01
Initial Quantitative Range
29.5623.9112.46 15.291.02
Updated Quantitative Range
(b) Scenario 2
Fig. 10. Quantitative ranges of risk scenarios
Table 4. Uncertainty Range of Each Path
Probabilitytype
Assumed orestimated
probabilityLinguisticvariables
Quantitativerange
�1� Initial 0.2 Fairly close 0.128–0.272
�1� Updated 0.1 /0.15 Slightly higher than/very close
0.100–0.197 /0.134–0.165
�2� Conditional 0.3 Close to high side 0.268–0.408
�3� Conditional 0.7 Fairly close 0.448–0.952
�4� Conditional 0.2 Higher than 0.200–0.592
Table 5. Uncertainty Range of Expected Cost �$ Thousands�
Path DescriptionExpected
costLinguisticvariable
Quantitativerange�cost�
1 Delay: 3 days 50 Very close 37.87–62.13
2 Dead: two people 450 Lower than 147–450
Injury: three people
Table 6. Risk of Each Scenario �$ Thousands�
Scenario PathProbability range
�min–max�
1 �Initial� �1��2��3� 0.015368–0.10564
2 �Initial� �1��2��4� 0.006861–0.065698
1 �Updated� �1��2��3� 0.015608–0.08545
2 �Updated� �1��2��4� 0.006968–0.05313
Table 7. Summarized Risk of Cable-Stayed Bridge �Unit: U.S. Dollar�
ClassificationTotal risk �mean�
from previous database
Construction-related 5,988,322
Design-related 37,550
Political and financial-related 36,280
Act of God 1,434,453
Total 7,496,605
0
0.2
0.4
0.6
0.8
1
0.00E+00 2.00E-01 4.00E-01 6.00E-01 8.00E-01 1.00E+00
Fig. 9. Fuzzy membership curve of “Injury/fatality”
GINEERING AND MANAGEMENT © ASCE / NOVEMBER 2008 / 901
ASCE license or copyright; see http://pubs.asce.org/copyright

tree analysis model. Similar to reference �2�, two simple riskscenarios �Paths 1 and 2� are described herein as an illustrationexample:
Path 1: �1� Improper work of cable installation and stressing�Pr=0.15�
→ �2� Poor prestressing�Pr=0.3�
→ �3� Delay�Pr=0.7�
Path 2: �1� Improper work of cable installation and stressing�Pr=0.15�
→ �2� Poor prestressing�Pr=0.3�
→ �4� Injury/Fatality�Pr�0.2�
The fuzzy membership curves of each event in these two pathsare shown in Figs. 7–9, respectively. Event �1� is already de-scribed in Fig. 5. Fig. 7 shows that the occurrence probability of“Poor prestressing �2�” is about 0.3 obtained from expert opinion,assuming that improper cable installation and stressing work hasoccurred. The linguistic variable is determined as “Close to highside of the given value.” Fig. 8 represents the fuzzy membershipcurve for the uncertainty of fuzzy number 0.7 obtained fromfrequency analysis. The fuzzy number 0.7 is the occurrenceprobability of “delay �3�,” assuming that “Poor prestressing”has occurred. The linguistic variable is determined as “FairlyClose” based on “Large” for �1� unreliable/insufficient data and“Small” for �2� use of inadequate statistical analysis methods �seeTable 1�. The fuzzy number 0.2 in Path 2 was analyzed by fre-quency analysis technique with sufficient data. However, if somesubcontractor has bad accident records with respect to “Injury/fatality �4�” and poor plan for preventing accidents during thecable installation, the linguistic variable for determining the un-certainty range is given as “Higher than 0.2” by the assessor, asshown in Fig. 9. It may be noted that 0.2 will be the lowest limitin this case. Table 4 shows the probability and linguistic variablefor Paths 1 and 2. Table 5 shows the expected cost in Scenarios 1and 2. For modeling of the costs, the uncertainty ranges of theexpected costs are also calculated by similar methods �Cho et al.2002�. The data on costs are obtained from KOSHA �2000�.
As a result, the analyzed risks of each scenario are shown inTable 6 in which risks and updated risks of each scenario arerepresented. The probability range for each scenario in Table 6 isobtained through the product of probabilities for the events in thatscenario calculated in Table 5. Based on the results from the casestudy, it may be stated that the uncertainty is reduced with updat-ing. That is, as the information increases the risk estimate becomemore precise. Therefore, the quantitative range is reduced asshown in Fig. 10.
This updating calculation is only one example of the riskevents in the seven risk assessment sheets for the new construc-tion project �see Table 3�. The updating of all the risks in theseven sheets is performed similarly. Table 7 summarizes the totalresults for four categories of the cable-stayed bridge constructionproject. It is assumed in this example that no new information ondesign-related and political and financial-related risks is available,so there is no change in these risk estimates. It is observed thatthe total risk of the new construction project is estimated to be 6.8million dollars, which is about 9.8% of the total project cost.
The results in Table 7 show the summarized risk of both pre-vious large quantities of data and updating for the new project.This paper does not intend to focus on the specific quantitativerisk values. The new construction structure considered in this ap-plication example is assumed very similar to the previous large
quantities of data. That is, it is assumed that the total length and902 / JOURNAL OF CONSTRUCTION ENGINEERING AND MANAGEMENT
Downloaded 26 Jun 2009 to 218.49.21.53. Redistribution subject to
width, bridge type, and project cost about 70 million are similar,hence the risk estimation in Table 7 is similar. The risk estimateswould be significantly affected by the general and peculiar fea-tures of the new project, especially the project construction cost.
Concluding Remarks
This paper develops a risk assessment methodology for construc-tion projects by combining existing large quantities of data andproject-specific information through updating approaches. Twomain ideas are pursued in this paper to facilitate practical imple-mentation: identify and evaluate the critical risk events, and de-velop a systematic updating methodology. Both epistemic andaleatory types of uncertainties in the data are considered, andcorresponding updating procedures are developed. This paper alsodevelops a general risk assessment procedure for constructionprojects along the following steps: risk-related information sur-vey, risk identification, risk analysis/evaluation combined withupdating approaches. The proposed procedure is expected to bevery useful for the systematic and rational risk assessment of realstructures.
The proposed risk assessment approach is quite general, andcan be applied to many types of practical construction projectssuch as bridges, industrial plants, dams, etc. The method is able toeffectively integrate past and new information to provide a quan-titative basis for risk management decision-making. Effective datafusion and processing capabilities are needed to integrate variousrisk survey and inspection activities, to develop the required da-tabase, and to facilitate practical implementation.
Acknowledgments
The work was supported by the Postdoctoral Fellowship Programof the Korea Research Foundation �KRF, M01-2004-000-20055-0�. The support is gratefully acknowledged.
References
Ang, A. H.-S., and Tang, W. H. �1975�. Probability concepts in engineer-ing planning and design, Vols. I and II, Wiley, New York.
Ang, A. H.-S., and Tang, W. H. �2006�. Probability concepts in engineer-ing: Emphasis on applications to civil and environmental engineering,2nd Ed., Wiley, New York.
Apeland, S., Aven, T., and Nilsen, T. �2002�. “Quantifying uncertaintyunder a predictive, epistemic approach to risk analysis.” Reliab. Eng.Syst. Saf., 75, 93–102.
Baldwin, J. F., and Pilsworth, B. W. �1979�. “Fuzzy truth definition ofpossibility measure for decision classification.” Int. J. Man-Mach.Stud., 2, 447–463.
Blockley, D. I. �1999�. “Risk based structural safety methods in context.”Struct. Safety, 214, 335–348.
Cho, H. N., Choi, H. H., and Kim, Y. B. �2002�. “A risk assessmentmethodology for incorporating uncertainties using fuzzy concepts.”Reliab. Eng. Syst. Saf., 78, 173–183.
Choi, H. H. �2005�. “A risk and safety assessment methodology usingfuzzy uncertainty and imprecise reliability for large civil structures.”Ph.D. thesis, Dept. of Civil and Environmental Engineering, HanyangUniv., Hanyang, Korea.
Choi, H. H., Cho, H. N., and Seo, J. W. �2004�. “Risk assessment meth-odology for underground construction projects.” J. Constr. Eng. Man-age., 130�2�, 258–272.
Dubois, D., and Prade, H. �1982�. “The use of fuzzy numbers in decision
© ASCE / NOVEMBER 2008
ASCE license or copyright; see http://pubs.asce.org/copyright

analysis.” Fuzzy information and decision processes, M. M. Guptaand E. Sanchez, eds., North-Holland, New York, 309–321.
Everett, J. G., and Frank, P. B. �1996�. “Costs of accidents and injuries tothe construction industry.” J. Constr. Eng. Manage., 122�2�, 158–164.
Fujino, T. �1994�. “The development of a method for investigation con-struction site accidents using fuzzy fault tree analysis.” Ph.D. thesis,Ohio State Univ.
Hadipriono, F. C. �1985�. “Assessment of falsework performance using
fuzzy set concepts.” Struct. Safety, �3�, 47–57.JOURNAL OF CONSTRUCTION EN
Downloaded 26 Jun 2009 to 218.49.21.53. Redistribution subject to
Haldar, A., and Mahadevan, S. �2000�. Probability, reliability, and statis-tical methods in engineering design, Wiley, New York.
Klir, G. J. �2004�. “Generalized information theory: Aims, results, andopen problems.” Reliab. Eng. Syst. Saf., 85, 21–38.
Korea Occupational Safety and Health Agency �KOSHA�. �2000�. Rep. ofInvestigation of the Preventive Measures against Vital Accidents atConstruction Sites.
Park, Y. H. �1995�. “Failures of structures and the causes of them.” Con-
struction Technology Information, 7–17.GINEERING AND MANAGEMENT © ASCE / NOVEMBER 2008 / 903
ASCE license or copyright; see http://pubs.asce.org/copyright