consistency in actor based server-client architecture based
TRANSCRIPT
CONSISTENCY IN ACTOR BASED SERVER-CLIENT ARCHITECTURE BASEDAPPLICATIONS
BY
ROHAN KASIVISWANATHAN
THESIS
Submitted in partial fulfillment of the requirementsfor the degree of Master of Science in Computer Science
in the Graduate College of theUniversity of Illinois at Urbana-Champaign, 2019
Urbana, Illinois
Adviser:
Professor Gul Agha
ABSTRACT
Computer science applications are generally used to solve many problems in our day to
day life, as well as find solutions to problems that impact society as a whole. One problem
that some applications face is their overall lack of speed and efficiency. Parallel programming
is used to help make processes more efficient, by splitting tasks efficiently among multiple
processes. This paper specifically focuses on distributed programming, which is a type of
parallel programming that involves multiple different computers and often makes use of
a server-client architecture. The actor model of programming is the main focus, and we
analyze multiple different cases and determine how it performs with both few machines as
well as with scalability. We focus on analyzing multiple different constraints as well called
consistency levels and analyze the overall cost of consistency for actor based applications.
Consistency levels correspond to the ways in which users receive information and how that
ordering would be controlled. The eventual goal is to come up with a user based system
where latencies for consistency levels can be analyzed, and an overall model on how useful
the different layers are for specific server client architectures would be developed.
ii
To my parents, for their love and support.
iii
TABLE OF CONTENTS
CHAPTER 1 INTRODUCTION . . . . . . . . . . . . . . . . . . . . . . . . . . . . 11.1 Distributed Programming Overview . . . . . . . . . . . . . . . . . . . . . . . 11.2 Examples of Distributed Programming . . . . . . . . . . . . . . . . . . . . . 21.3 Actor Model of Programming . . . . . . . . . . . . . . . . . . . . . . . . . . 41.4 Structure and Testing of Actor Programming Based Applications . . . . . . 51.5 Scalability and Latency . . . . . . . . . . . . . . . . . . . . . . . . . . . . . . 71.6 Definition of Consistency Levels . . . . . . . . . . . . . . . . . . . . . . . . . 81.7 Event driven programming . . . . . . . . . . . . . . . . . . . . . . . . . . . . 101.8 Project Overview and Paper Structure . . . . . . . . . . . . . . . . . . . . . 12
CHAPTER 2 PROBLEM STATEMENT . . . . . . . . . . . . . . . . . . . . . . . . 132.1 Problem Description . . . . . . . . . . . . . . . . . . . . . . . . . . . . . . . 132.2 Different Components . . . . . . . . . . . . . . . . . . . . . . . . . . . . . . . 132.3 Overall Approach . . . . . . . . . . . . . . . . . . . . . . . . . . . . . . . . . 142.4 Relation to Event Driven Programming . . . . . . . . . . . . . . . . . . . . . 14
CHAPTER 3 RELATED WORKS . . . . . . . . . . . . . . . . . . . . . . . . . . . 153.1 Overview . . . . . . . . . . . . . . . . . . . . . . . . . . . . . . . . . . . . . . 153.2 Papers focusing on Consistency Levels . . . . . . . . . . . . . . . . . . . . . 153.3 Papers focusing on Server Client Architecture and Event Driven Programming 153.4 Aggregation and other similar applications . . . . . . . . . . . . . . . . . . . 16
CHAPTER 4 CORE APPLICATIONS . . . . . . . . . . . . . . . . . . . . . . . . . 184.1 Overview and general structure . . . . . . . . . . . . . . . . . . . . . . . . . 184.2 Chatroom Structure . . . . . . . . . . . . . . . . . . . . . . . . . . . . . . . 194.3 Task Application Structure . . . . . . . . . . . . . . . . . . . . . . . . . . . . 224.4 Individual Cases for Consistency Layers . . . . . . . . . . . . . . . . . . . . . 244.5 Latency definitions . . . . . . . . . . . . . . . . . . . . . . . . . . . . . . . . 294.6 Overall Implementation Algorithm for Chat . . . . . . . . . . . . . . . . . . 304.7 Overall Implementation Algorithm for Task . . . . . . . . . . . . . . . . . . 33
CHAPTER 5 RESULTS AND BASIC ANALYSIS . . . . . . . . . . . . . . . . . . . 355.1 Experimental Setup . . . . . . . . . . . . . . . . . . . . . . . . . . . . . . . . 355.2 Sample Examples of Chat Analysis . . . . . . . . . . . . . . . . . . . . . . . 355.3 Scalability Experiments for Single Machine Chat . . . . . . . . . . . . . . . . 365.4 Scalability Experiments for 10 Machine Chat . . . . . . . . . . . . . . . . . . 445.5 Latency Optimizations for Chat . . . . . . . . . . . . . . . . . . . . . . . . . 485.6 Scalability Experiments for Single Machine Task . . . . . . . . . . . . . . . . 515.7 Scalability Experiments for 10 Machine Task . . . . . . . . . . . . . . . . . . 585.8 Comparison of Chat and Task Trends . . . . . . . . . . . . . . . . . . . . . . 61
iv
CHAPTER 6 CONCLUSION DRAWN FROM RESULTS . . . . . . . . . . . . . . 646.1 Overview . . . . . . . . . . . . . . . . . . . . . . . . . . . . . . . . . . . . . . 646.2 Analysis of Overall Latency Between Different Layers . . . . . . . . . . . . . 646.3 Analysis of Latency Increases with Scalability . . . . . . . . . . . . . . . . . 656.4 Analysis of 10 Machine Results . . . . . . . . . . . . . . . . . . . . . . . . . 656.5 Analysis of Task and Chat differences . . . . . . . . . . . . . . . . . . . . . . 666.6 Brief analysis of latency optimizations . . . . . . . . . . . . . . . . . . . . . 666.7 Brief Analysis of Variance of Observations . . . . . . . . . . . . . . . . . . . 666.8 Overall Analysis of Layers and Implications . . . . . . . . . . . . . . . . . . 676.9 Implications for Event Driven Programming . . . . . . . . . . . . . . . . . . 67
CHAPTER 7 FUTURE WORK . . . . . . . . . . . . . . . . . . . . . . . . . . . . . 687.1 Overview . . . . . . . . . . . . . . . . . . . . . . . . . . . . . . . . . . . . . . 687.2 Expansion of Project . . . . . . . . . . . . . . . . . . . . . . . . . . . . . . . 687.3 Conceptual Expansions and Other Topics . . . . . . . . . . . . . . . . . . . . 68
REFERENCES . . . . . . . . . . . . . . . . . . . . . . . . . . . . . . . . . . . . . . . 70
v
CHAPTER 1: INTRODUCTION
1.1 DISTRIBUTED PROGRAMMING OVERVIEW
Since computers became prevalent, efficiency of applications has been crucial to implement
faster processes. Splitting tasks among machines is also necessary in order to reflect on real
life scenarios where the work would be split across multiple different users, each of whom are
on different machines. Even with one user, sometimes splitting across machines is helpful
because resources on a single machine are often limited. Parallel programming [1] is used
to split up tasks among multiple different processes or threads. C has two developed ways
of such programming, and they are thread based and process based parallel programming.
In thread based programming, each thread handles a particular part of a task or part of the
data that is shared among all threads. The data segments which threads share are often
controlled with locks, as this helps prevent threads from accessing data when they should
not. Threads are often used for smaller tasks in nature and generally consume significant
amount of resources. However, they do help speed up processes considerably when not too
much waiting is involved to perform a certain operation.
Another parallel programming paradigm is process based programming. The difference
between a process and a thread is that processes generally do not share memory, while
threads do. Processes are also used for larger scale tasks and could consist of multiple
individual threads. The general use of processes includes having multiple different tasks
work with the same large data. C generally works with pipes, and pipes move data through
various different task segments. This works for both single and multiple nodes. One popular
example of this is map-reduce [2]. This algorithm has three steps, and they are map, shuffle,
and reduce. In map, a specific function is used on local data and then produces output into
temporary storage. Output keys are used from this and then passed to the next stage. The
next stage has different worker nodes which use output keys and then reallocate data, and
each key belongs to a single worker node. The next and final stage, reduce, makes various
worker nodes in parallel work with different groups of output data corresponding to every
key.
Distributed programming [3] involves an entire system, which is a network of computers
that communicate with each other using messages to accomplish various different tasks.
Here, processes are split across multiple machines where each user can also be split across
multiple machines, and that is sometimes necessary when involving applications with multi-
ple users due to resource constraints on a single machine. When splitting work across mul-
1
tiple machines, additional overhead could be added from communication that is involved.
Virtual memory (shared memory) is often used for these types of programs. Distributed
programming is often done in a network over a cluster of machines. One key point to note
is that parallel programming is always done on a single machine, but distributed program-
ming is always done over multiple machines and involves resource allocation across machines.
Distributed applications however are parallel in nature.
1.2 EXAMPLES OF DISTRIBUTED PROGRAMMING
One category of examples that could make good use of distributed programming is aggre-
gation [4]. The concept of aggregation involves collecting multiple data and taking some form
of total with that data. Total could imply multiple summation operations including total
sum and multiplicative sum. Aggregation often involves numerous data types and includes
countless data points. All of these contain crucial information that could be propagated to
one source. All of this data could be from multiple different fields such as weather data.
Doing this in a sequential manner could be extremely cumbersome, as going through that
many data points would be very tedious and could take a long time. Managing information
for each of these points is also very tedious. In cases like this, a distributed system would
help where individual users (split across multiple machines) maintain their own information
about the state for a particular data element, and then change state based on changes to
that data. This information would get repeatedly updated and held at one data source.
Simple parallelism would not be very effective here, as using threads would consume too
many resources and data is often too large to use that many threads. It would also make
more sense for this to be distributed, since there would be many users inputting their own
data from multiple different locations. Examples of this would include collecting tempera-
ture data from multiple different points in a city where sensors placed in the current location
would indicate the temperature. A central source which then takes all of these points would
then average out the temperature across all the data. Similarly, numerous such aggrega-
tions where points of information scattered about can be performed, which would then be
collected in one source.
Another example where distributed programming is useful is with server-client architec-
tures [5]. With such processes, it is generally beneficial to have two or more machines
that work in tandem. One machine would handle the server, and there would be different
machines for the clients. The server client distributed framework is useful, as a lot of appli-
cations require the use of both a server and a client. One example includes online games [6],
where multiple different users (clients) take part in the multi-player game, and there exists
2

Figure 1.1: Basic server client architecture example.
one server. Another example is a chatroom, where multiple users send messages there, as
well as exit or enter the chatroom. That is actually one of the examples that will be used as a
case study for this paper. Other examples include multiple users trying to complete an indi-
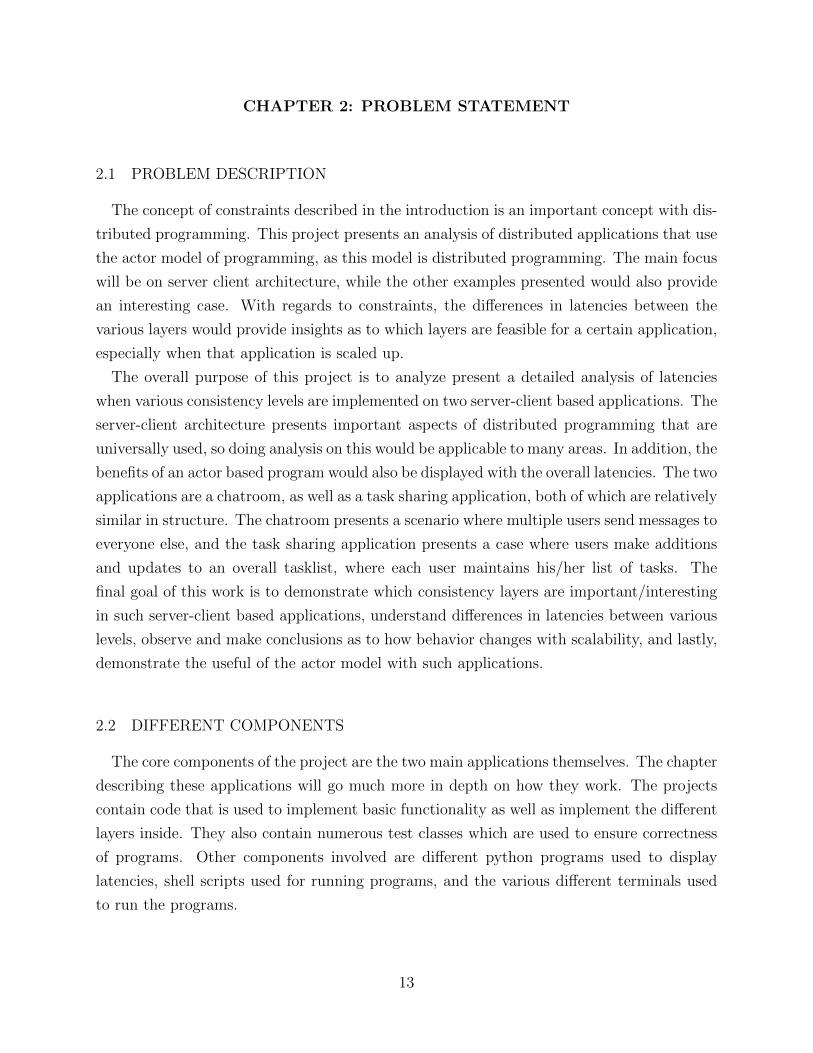
vidual task, which will also be looked at in this work. One example of such an architecture is
presented in figure 1.1. This example presents one server in the center which communicates
to all components. The server takes information from each the internet database, printer,
and scanner. It also handles requests from clients, and then sends back responses. This
server would keep track of various different states. The client would track its own unique
information as well. In this case too the actor model is useful. Having multiple threads
handle the necessary information is important, and in this case, numerous machines, both
virtual and physical, would be used to handle multiple different clients. It is imperative
that the threads/processes are fast, and do not consume as many resources. Similar to the
examples presented here, many real world scenarios involve the use of this architecture, as
communication among devices happens everywhere with one source as the center. Other ex-
amples include a system of self driving cars where the cars need to communicate important
information to each other.
Lastly, distributed applications can be used with high compute power machines [7] in order
to speed up crucial processes. One example of this is problem solving where the number
of computations are extremely high and impossible to solve with one machine alone. In
chess for example, there are many possible combinations of moves involved, and in order
to make computations effectively, it would help to split the work across multiple machines
[8]. Even with the most powerful machines, distributing work would make the work more
3
efficient and help increase the strength. This could be said for multiple other game engines
as well (although chess is one of the most complex). Problems that involve neural networks
[9] are often expensive too and could involve the use of multiple machines to speed things
up. Similarly, there are multiple processes overall that are too expensive for a single machine
to compute and would benefit from the power advantages of high power machines involved
in a cluster.
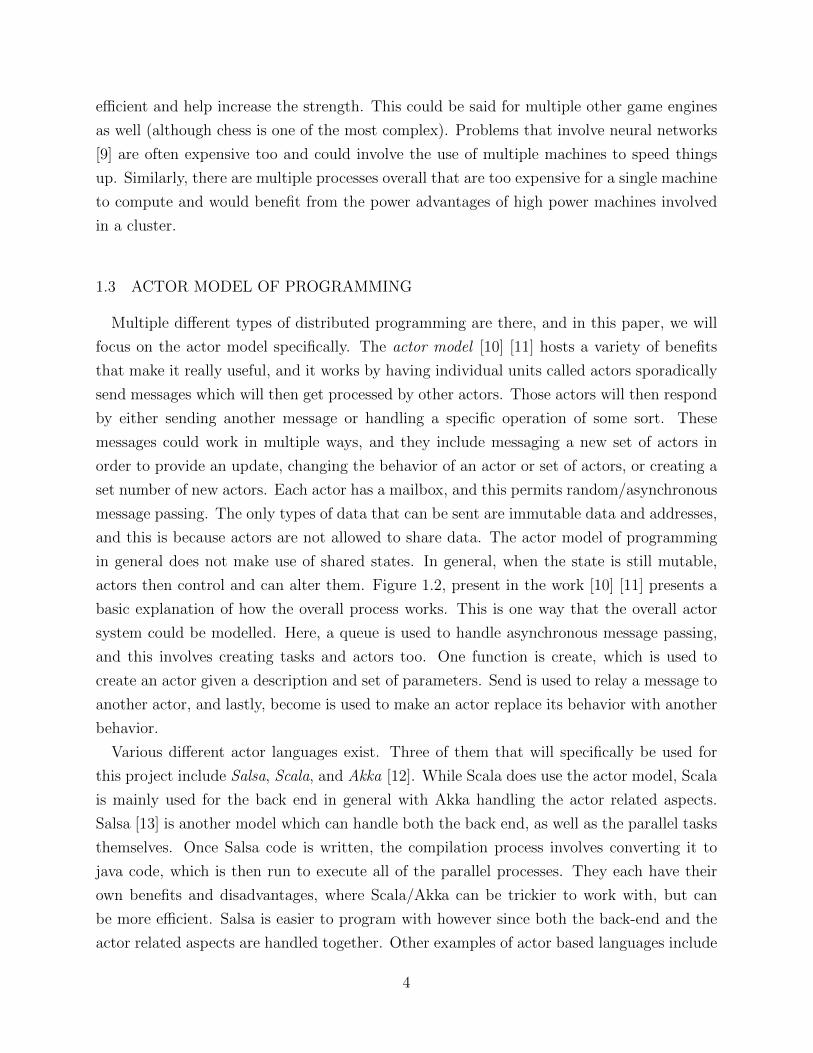
1.3 ACTOR MODEL OF PROGRAMMING
Multiple different types of distributed programming are there, and in this paper, we will
focus on the actor model specifically. The actor model [10] [11] hosts a variety of benefits
that make it really useful, and it works by having individual units called actors sporadically
send messages which will then get processed by other actors. Those actors will then respond
by either sending another message or handling a specific operation of some sort. These
messages could work in multiple ways, and they include messaging a new set of actors in
order to provide an update, changing the behavior of an actor or set of actors, or creating a
set number of new actors. Each actor has a mailbox, and this permits random/asynchronous
message passing. The only types of data that can be sent are immutable data and addresses,
and this is because actors are not allowed to share data. The actor model of programming
in general does not make use of shared states. In general, when the state is still mutable,
actors then control and can alter them. Figure 1.2, present in the work [10] [11] presents a
basic explanation of how the overall process works. This is one way that the overall actor
system could be modelled. Here, a queue is used to handle asynchronous message passing,
and this involves creating tasks and actors too. One function is create, which is used to
create an actor given a description and set of parameters. Send is used to relay a message to
another actor, and lastly, become is used to make an actor replace its behavior with another
behavior.
Various different actor languages exist. Three of them that will specifically be used for
this project include Salsa, Scala, and Akka [12]. While Scala does use the actor model, Scala
is mainly used for the back end in general with Akka handling the actor related aspects.
Salsa [13] is another model which can handle both the back end, as well as the parallel tasks
themselves. Once Salsa code is written, the compilation process involves converting it to
java code, which is then run to execute all of the parallel processes. They each have their
own benefits and disadvantages, where Scala/Akka can be trickier to work with, but can
be more efficient. Salsa is easier to program with however since both the back-end and the
actor related aspects are handled together. Other examples of actor based languages include
4
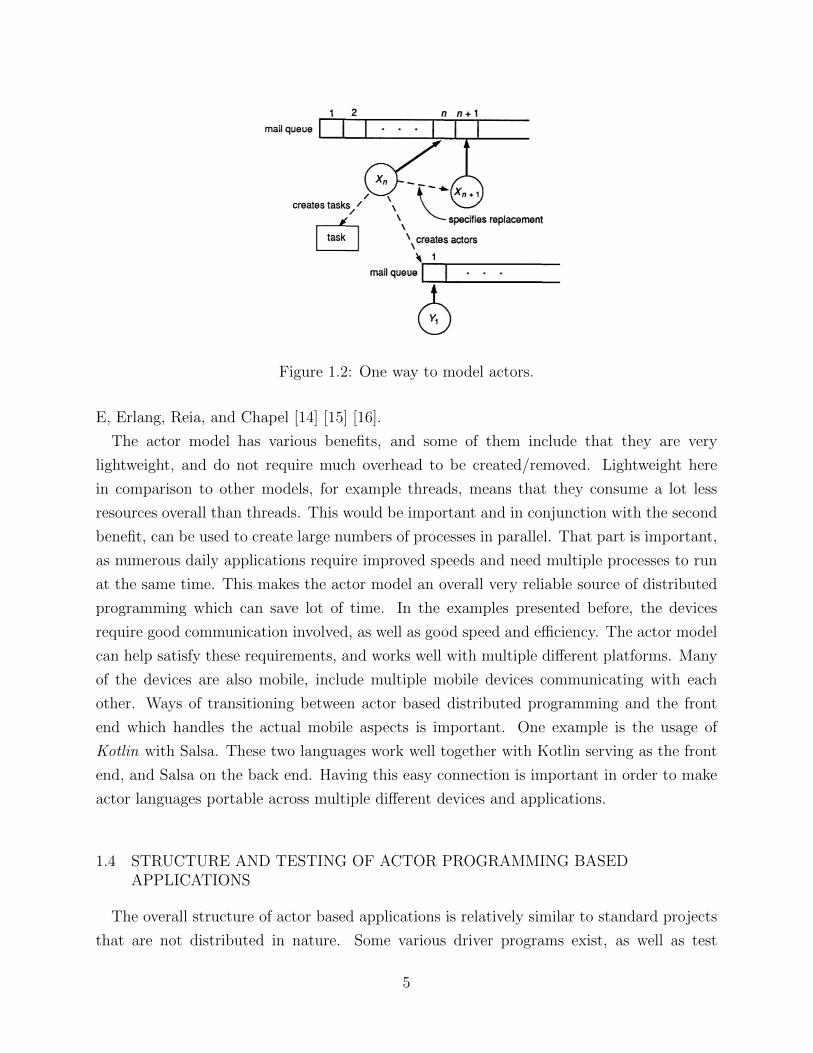
Figure 1.2: One way to model actors.
E, Erlang, Reia, and Chapel [14] [15] [16].
The actor model has various benefits, and some of them include that they are very
lightweight, and do not require much overhead to be created/removed. Lightweight here
in comparison to other models, for example threads, means that they consume a lot less
resources overall than threads. This would be important and in conjunction with the second
benefit, can be used to create large numbers of processes in parallel. That part is important,
as numerous daily applications require improved speeds and need multiple processes to run
at the same time. This makes the actor model an overall very reliable source of distributed
programming which can save lot of time. In the examples presented before, the devices
require good communication involved, as well as good speed and efficiency. The actor model
can help satisfy these requirements, and works well with multiple different platforms. Many
of the devices are also mobile, include multiple mobile devices communicating with each
other. Ways of transitioning between actor based distributed programming and the front
end which handles the actual mobile aspects is important. One example is the usage of
Kotlin with Salsa. These two languages work well together with Kotlin serving as the front
end, and Salsa on the back end. Having this easy connection is important in order to make
actor languages portable across multiple different devices and applications.
1.4 STRUCTURE AND TESTING OF ACTOR PROGRAMMING BASEDAPPLICATIONS
The overall structure of actor based applications is relatively similar to standard projects
that are not distributed in nature. Some various driver programs exist, as well as test
5
programs to make sure the functionality of the different components is correct. The overall
application is divided into multiple classes, where the different classes could be interpreted as
java objects. However, some of these classes are actor based and are used as actor instances
to send messages. These messages are often used as messages for another actor to perform,
or simply for a class to execute a specific function. Lot of these messages occur in random
order and operations within them could happen in parallel as well. Receivers of messages
in general need to make sure that they properly respond to the message that was sent, and
that they receive the message in the order that they wish. Lots of these are structured as
functions in different classes, but the classes would specify if they are an actor instance or
not. There are various base classes as well which will not be actor instances and simply
implement necessary functions.
There are multiple ways to test an actor based application. The application could be
either run on a single machine or be distributed, and the testing in each of these cases
would be different. On a single machine, there would be one terminal used with a shell
script that runs all of the necessary commands (or multiple terminals where each one runs
a different command). The driver programs could be configured as such to either manually
create actors from inside or have them specified by creating class instances from outside.
The first case is more convenient for large scale tests where manually creating too many
actors is very expensive. A lot of stuff would also be specified to driver programs while
testing, and examples of this include the number of users and number of messages involved.
Testing with multiple machines is a little trickier. Work would need to be split, so that
the server is on one machine with some clients, and then the rest of the clients need to be
evenly distributed across other machines. One issue in this area, presented in [17], is load
balancing in actor languages such as Thal. Lastly, the driver program would exist on the
final machine. In addition to this even split, it is imperative to make sure that the machines
properly communicate with each other, and this connection can add extra overhead. In
general, the output from the individual actors would be outputted to their respective output
files, and this can be done with a simple concatenation operator in the run command. When
generating actors from within the program, it is a little trickier as then specific output would
need to be written from within the actor programs rather than externally. The output would
then be parsed by an external program to analyze it (generally a python script).
Creating and testing actor based programs is a two way process. The first step involves
creating the needed programs and then testing with a small number of inputs. This is used
to make sure that the program and its various aspects work properly, as testing with a lot
of inputs at first is both challenging and very hard to debug. Once the application is known
to work, the next step involves scaling the numbers much higher to then observe patterns
6
and see how behavior changes. This testing also ensures that the application is scalable,
therefore making it useful for real life scenarios. This whole process would ensure the actor
based application as complete. Some other ways of testing also present such as format testing
[18], and further examples are illustrated in [19].
1.5 SCALABILITY AND LATENCY
Scalability [20] is a crucial problem within computer science. In general, numerous appli-
cations are tested both large scale and within a local scale. Scalability is defined as running
experiments on a large scale that involve multiple different users and operations. Scalability
tests for both efficiency and speed when scaling the application to a large number of ma-
chines, and this is important especially with distributed applications. Another good reason
for including scalability in the application is to perform analysis, as looking at results on
a larger scale can help observe trends, and see how different operations lead to different
changes in behavior. There are lots of factors of an application, and testing it with only a
few actors will not lead to any solid conclusions. Another aspect is to also know then will
the application take too long to complete, so that it can be deployed in a feasible way. For
example, some applications will not work will with too many users and too many messages.
In this case, it would help to have a good threshold to create proper scenarios in which the
application can be used. As seen, there are multiple ways scalability can be used to ensure
the limits of an application as well as form conclusions about experiments.
Latency [21] is another widely used concept in distributed programming. Latency is
important as it is the main source of testing how fast an application is. It is defined as
the time it takes for a certain process to complete, and this often has multiple different
definitions given the context of an application. With distributed applications in general,
latency often refers to the time it takes for a change to get broadcasted (with some changes
per application definition). When testing for application correctness, latency does not have
as significant of a role, and is used in general to understand how different parts of an
application work in response to each other. When scalability comes into play, it is used for
drawing important conclusions as well as how feasible the application would be in the real
world. Scalability graphs often go hand to hand with latency as that combination helps
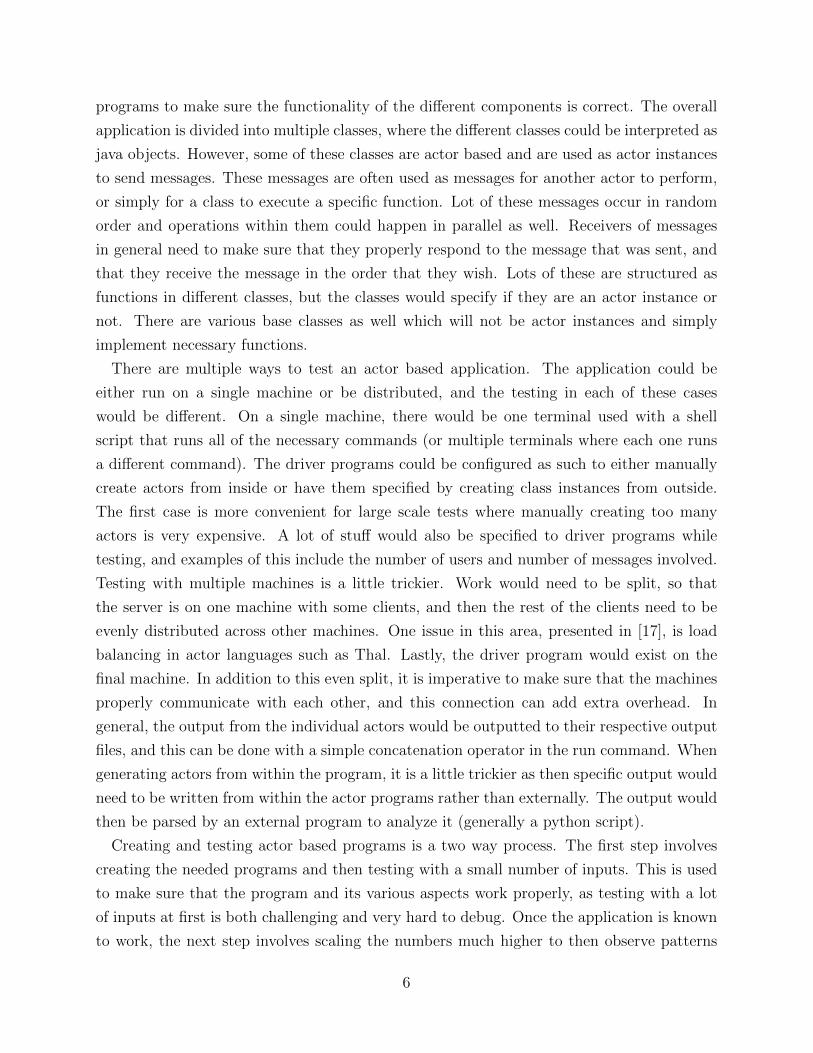
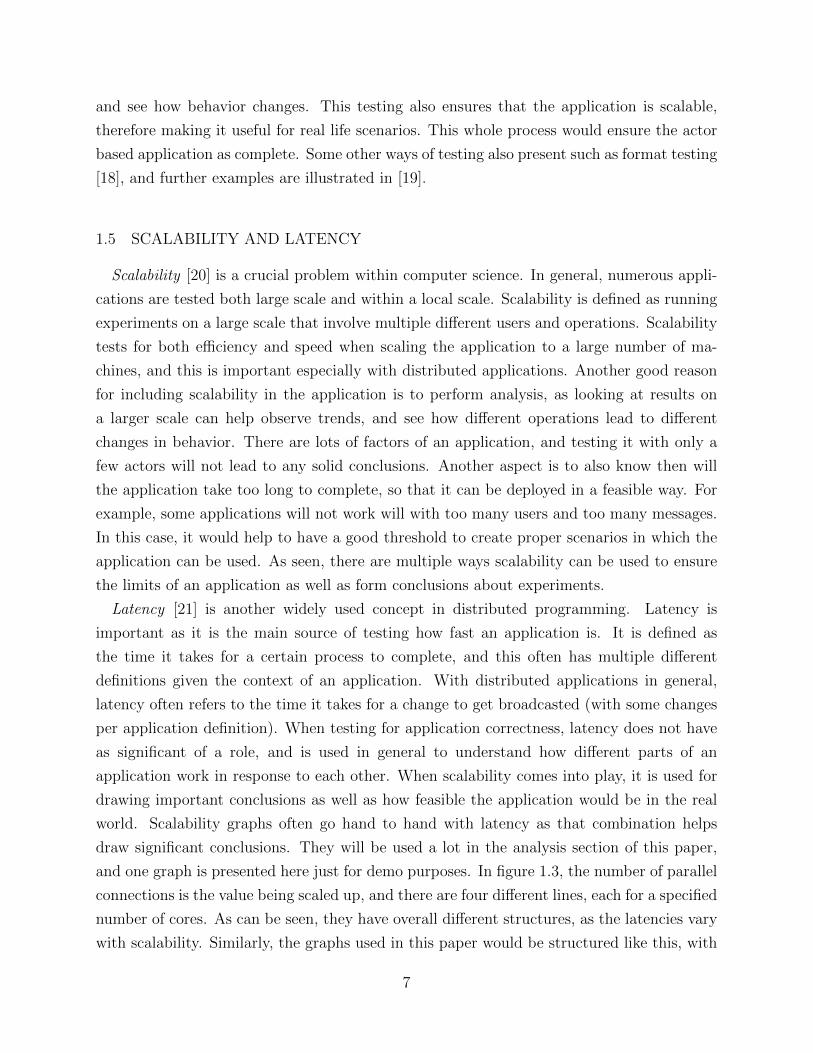
draw significant conclusions. They will be used a lot in the analysis section of this paper,
and one graph is presented here just for demo purposes. In figure 1.3, the number of parallel
connections is the value being scaled up, and there are four different lines, each for a specified
number of cores. As can be seen, they have overall different structures, as the latencies vary
with scalability. Similarly, the graphs used in this paper would be structured like this, with
7
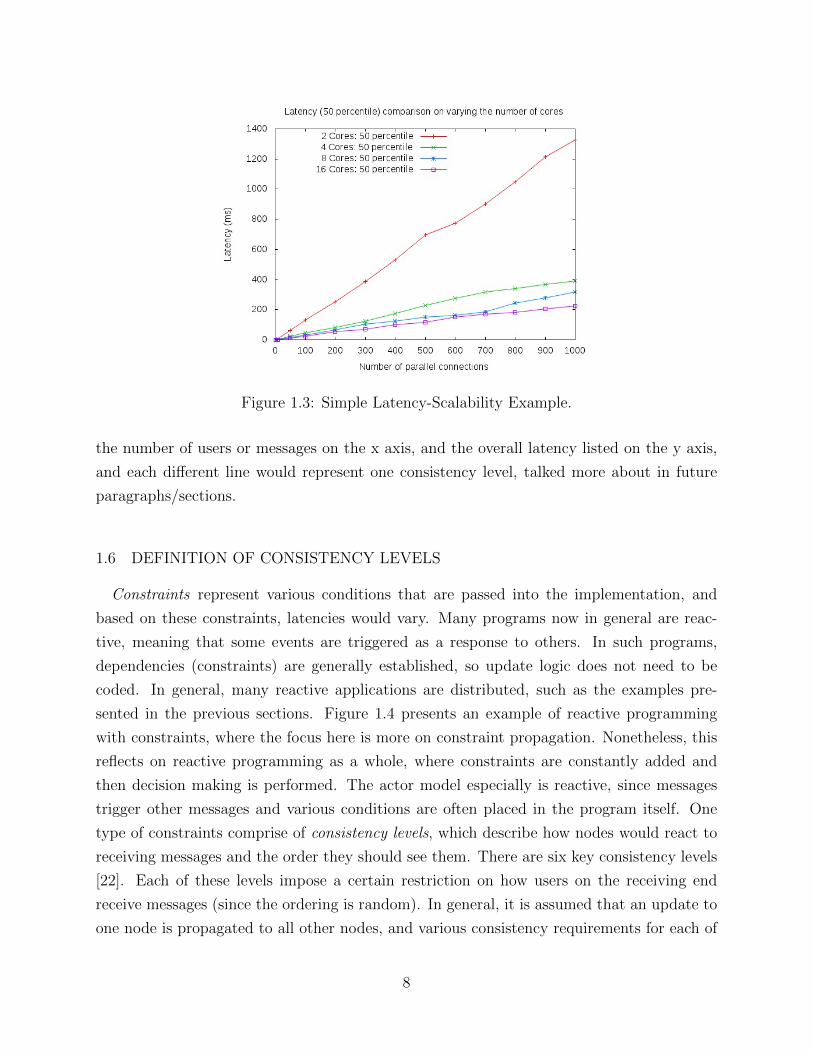
Figure 1.3: Simple Latency-Scalability Example.
the number of users or messages on the x axis, and the overall latency listed on the y axis,
and each different line would represent one consistency level, talked more about in future
paragraphs/sections.
1.6 DEFINITION OF CONSISTENCY LEVELS
Constraints represent various conditions that are passed into the implementation, and
based on these constraints, latencies would vary. Many programs now in general are reac-
tive, meaning that some events are triggered as a response to others. In such programs,
dependencies (constraints) are generally established, so update logic does not need to be
coded. In general, many reactive applications are distributed, such as the examples pre-
sented in the previous sections. Figure 1.4 presents an example of reactive programming
with constraints, where the focus here is more on constraint propagation. Nonetheless, this
reflects on reactive programming as a whole, where constraints are constantly added and
then decision making is performed. The actor model especially is reactive, since messages
trigger other messages and various conditions are often placed in the program itself. One
type of constraints comprise of consistency levels, which describe how nodes would react to
receiving messages and the order they should see them. There are six key consistency levels
[22]. Each of these levels impose a certain restriction on how users on the receiving end
receive messages (since the ordering is random). In general, it is assumed that an update to
one node is propagated to all other nodes, and various consistency requirements for each of
8
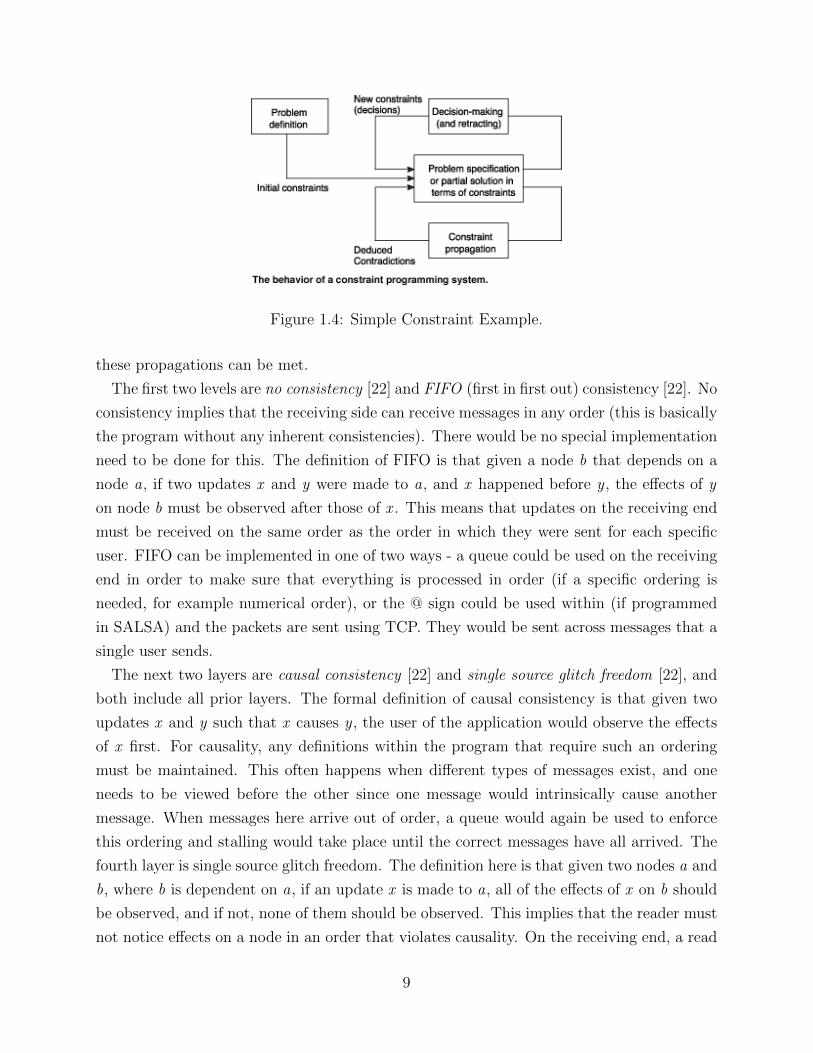
Figure 1.4: Simple Constraint Example.
these propagations can be met.
The first two levels are no consistency [22] and FIFO (first in first out) consistency [22]. No
consistency implies that the receiving side can receive messages in any order (this is basically
the program without any inherent consistencies). There would be no special implementation
need to be done for this. The definition of FIFO is that given a node b that depends on a
node a, if two updates x and y were made to a, and x happened before y , the effects of y
on node b must be observed after those of x . This means that updates on the receiving end
must be received on the same order as the order in which they were sent for each specific
user. FIFO can be implemented in one of two ways - a queue could be used on the receiving
end in order to make sure that everything is processed in order (if a specific ordering is
needed, for example numerical order), or the @ sign could be used within (if programmed
in SALSA) and the packets are sent using TCP. They would be sent across messages that a
single user sends.
The next two layers are causal consistency [22] and single source glitch freedom [22], and
both include all prior layers. The formal definition of causal consistency is that given two
updates x and y such that x causes y , the user of the application would observe the effects
of x first. For causality, any definitions within the program that require such an ordering
must be maintained. This often happens when different types of messages exist, and one
needs to be viewed before the other since one message would intrinsically cause another
message. When messages here arrive out of order, a queue would again be used to enforce
this ordering and stalling would take place until the correct messages have all arrived. The
fourth layer is single source glitch freedom. The definition here is that given two nodes a and
b, where b is dependent on a, if an update x is made to a, all of the effects of x on b should
be observed, and if not, none of them should be observed. This implies that the reader must
not notice effects on a node in an order that violates causality. On the receiving end, a read
9
of a node there must see all the effects (all messages that it has received), or none of it (if
that has not finished completely processing). This is often implemented in a case where it is
more convenient to process all messages at once rather than one at a time (simulating real
world scenarios). This would be implemented on the receiving end with a queue that takes
in messages as and when they come, rather than processing messages as they come. FIFO
and causal would also be implemented on this queue to ensure that messages in it have the
right order. After all messages have arrived, the user would loop through the queue and
process each message one by one.
The fifth and sixth layers are complete glitch freedom [22] and atomicity [22]. In addition
to the conditions of the previous layers, complete glitch holds that given two nodes a and
b, and given two updates x and y , a read which involves both a and b notes the effects of x
and y on a in the exact same order as those of x and y on b. This means that along with
single glitch, the order in which messages are processed must be the same across all users.
This enforces consistency across multiple users. In order to implement this, consistency must
be implemented on the server side too. When the server sends messages to the remaining
users, it needs to make sure that it also maintains a proper ordering where the messages it
sends are received in the order it sent them in. This would include using @ for SALSA in
the for loop where it keeps sending messages, and special implementation in that for loop
would ensure complete glitch freedom. Atomic consistency is the final layer, and in addition
to containing the previous layers, it requires that when a node a influences nodes b and c,
a read involving both b and c would notice the effects of update x on either both of them
or none of them. This is essentially single glitch across all users with the requirement of
complete glitch that messages have to be in the same order everywhere. All nodes essentially
must have the same processing timestamp. To implement this, a universal queue across all
users must be maintained, and as and when messages are added, they must be added to
each actor’s universal queue. Once all of these universal queues have been created, the
actors would then process them together and have the same timestamp. This concludes all
of the consistency layers.
1.7 EVENT DRIVEN PROGRAMMING
Event driven programming (reactive programming) [23] is a paradigm that relates to cre-
ating models based on specifications, and all of the events are somewhat reactive. This exists
in distributed programming within and outside of actor based programming. As seen in the
prior section, the actor model itself is reactive and has multiple reactive components that
make it suitable for constraint based programming. Many reactive models exist are used to
10
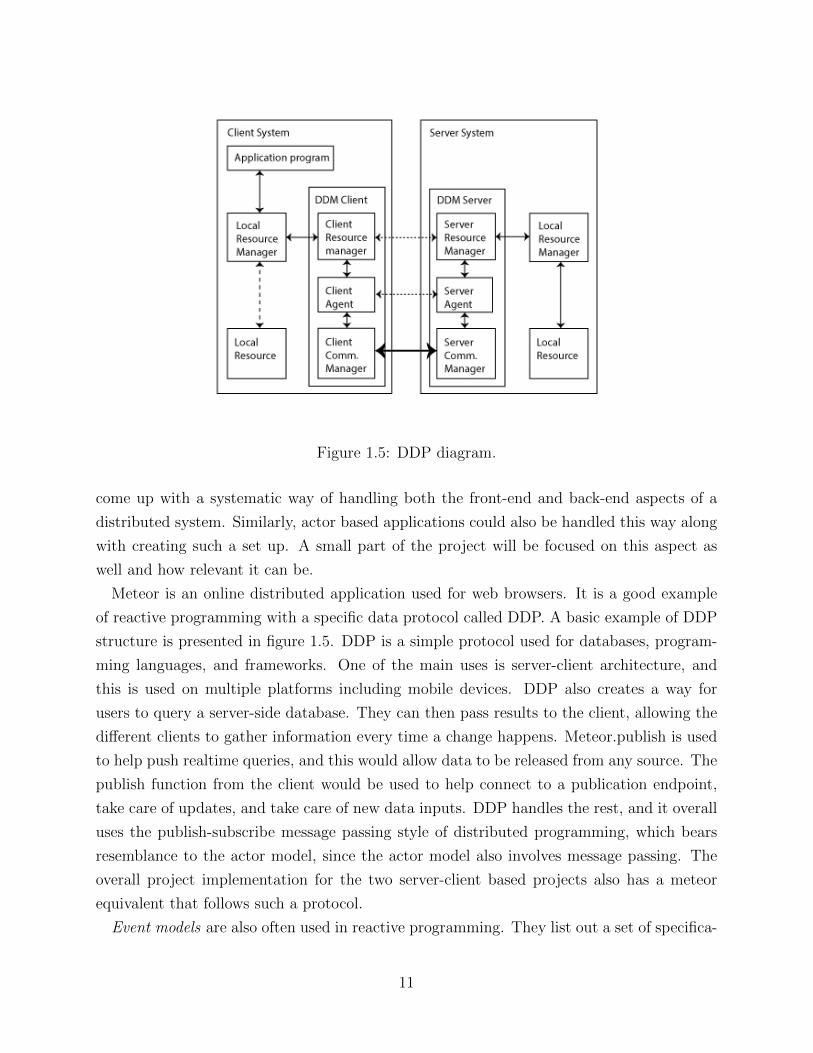
Figure 1.5: DDP diagram.
come up with a systematic way of handling both the front-end and back-end aspects of a
distributed system. Similarly, actor based applications could also be handled this way along
with creating such a set up. A small part of the project will be focused on this aspect as
well and how relevant it can be.
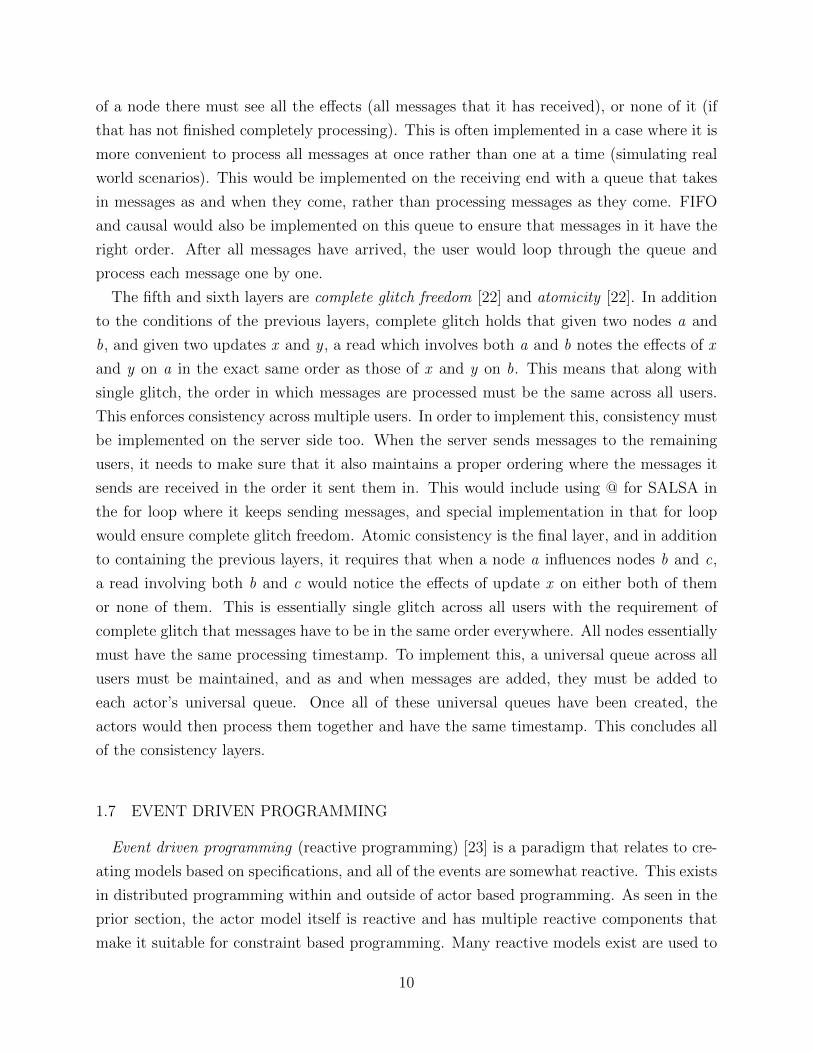
Meteor is an online distributed application used for web browsers. It is a good example
of reactive programming with a specific data protocol called DDP. A basic example of DDP
structure is presented in figure 1.5. DDP is a simple protocol used for databases, program-
ming languages, and frameworks. One of the main uses is server-client architecture, and
this is used on multiple platforms including mobile devices. DDP also creates a way for
users to query a server-side database. They can then pass results to the client, allowing the
different clients to gather information every time a change happens. Meteor.publish is used
to help push realtime queries, and this would allow data to be released from any source. The
publish function from the client would be used to help connect to a publication endpoint,
take care of updates, and take care of new data inputs. DDP handles the rest, and it overall
uses the publish-subscribe message passing style of distributed programming, which bears
resemblance to the actor model, since the actor model also involves message passing. The
overall project implementation for the two server-client based projects also has a meteor
equivalent that follows such a protocol.
Event models are also often used in reactive programming. They list out a set of specifica-
11
Figure 1.6: Example event model.
tions for both functions and variables. Event models are also used to help make a complex
distributed program seem sequential. The specifications provided help ease the transition
and implementation of the program, and also make the reactive parts more transparent,
something that would help with constraint based programming. Part of the purpose of an
event model is to provide generalizations that could be used across multiple server-client
architecture based programs. These models would be divided into a front-end and back-
end, and the final goal is to have a generic distributed program that could take in an event
model and then output both the front-end and back-end aspects. Figure 1.6 presents a sim-
ple example of an event model with some operations presented. Normally, an event model
would be more involved with more operations and variables, but nevertheless, this is a good
example.
1.8 PROJECT OVERVIEW AND PAPER STRUCTURE
All of the sections up until now have explained the basic concepts relating to this project
as well as the premise of this project. This project overall takes these concepts together
and performs latency analysis of constraints on two distributed applications. This will be
vastly expanded upon in the Problem Statement section. The remainder of this paper will
be organized as follows: problem statement, which explains the project in depth, related
works, chatroom (the first application), task (the second application), results (where the
results are displayed and a surface level analysis of them is done), conclusion from results
(conclusions drawn from results), and lastly, conclusion and future work.
12
CHAPTER 2: PROBLEM STATEMENT
2.1 PROBLEM DESCRIPTION
The concept of constraints described in the introduction is an important concept with dis-
tributed programming. This project presents an analysis of distributed applications that use
the actor model of programming, as this model is distributed programming. The main focus
will be on server client architecture, while the other examples presented would also provide
an interesting case. With regards to constraints, the differences in latencies between the
various layers would provide insights as to which layers are feasible for a certain application,
especially when that application is scaled up.
The overall purpose of this project is to analyze present a detailed analysis of latencies
when various consistency levels are implemented on two server-client based applications. The
server-client architecture presents important aspects of distributed programming that are
universally used, so doing analysis on this would be applicable to many areas. In addition, the
benefits of an actor based program would also be displayed with the overall latencies. The two
applications are a chatroom, as well as a task sharing application, both of which are relatively
similar in structure. The chatroom presents a scenario where multiple users send messages to
everyone else, and the task sharing application presents a case where users make additions
and updates to an overall tasklist, where each user maintains his/her list of tasks. The
final goal of this work is to demonstrate which consistency layers are important/interesting
in such server-client based applications, understand differences in latencies between various
levels, observe and make conclusions as to how behavior changes with scalability, and lastly,
demonstrate the useful of the actor model with such applications.
2.2 DIFFERENT COMPONENTS
The core components of the project are the two main applications themselves. The chapter
describing these applications will go much more in depth on how they work. The projects
contain code that is used to implement basic functionality as well as implement the different
layers inside. They also contain numerous test classes which are used to ensure correctness
of programs. Other components involved are different python programs used to display
latencies, shell scripts used for running programs, and the various different terminals used
to run the programs.
13
2.3 OVERALL APPROACH
The first step involved was to implement these two applications (chatroom was already
implemented at a basic level), and run basic tests to make sure that the applications worked.
After that, an overall plan of different consistency levels had to be developed, as well as use
cases for each layer and how to measure latencies for them. The final four layers decided
to be used were no consistency, FIFO, causal consistency and single glitch source freedom.
All of the needed code was then added one by one, with numerous tests for each layer.
Once basic testing was done, python programs had to be developed in order to automate
the process of collecting latencies as well as ensuring the latencies are properly collected.
Once that was done, the scalability scripts were developed, both for 10 machines as well as a
single machine. Various configurations were developed, and they include 10 users with 10000
messages, 100 users with 100 messages, 1000 users with 100 messages, and so forth. Once all
of the scripts were collected, the overall process of running was automated over many runs,
and a methodology to determine average value was created. Finally, analysis of the results
was performed. The purpose of this is to observe which layers have the most significant
effects on the overall application. Conclusions can then be drawn for those specific layers.
Another purpose of this is to analyze how run-times change as more layers are added, and
the long term goal is to make evaluations based on user inputs and see if the run-time is
feasible or not given their various requirements.
2.4 RELATION TO EVENT DRIVEN PROGRAMMING
One side goal of this project is to present a solution to part of the event model paradigm.
The programs mentioned above will ideally be part of a system which takes in an event
model and then creates a distributed program with the necessary front-end and back-end.
The front-end would be in kotlin, and the back-end would be in SALSA. This would take
into account constraints as well, as for this to be a complete application, a user would specify
the consistency levels required and then the program would make sure to create the code as
necessary. This full system will be programmed to understand the overall implication with
event driven programming. This concludes the overall problem statement section, and the
next section will focus on related works.
14
CHAPTER 3: RELATED WORKS
3.1 OVERVIEW
There are multiple papers and works focusing on overall roughly similar topics compared
to the ones provided in this paper. Each of these offer some unique insight into different
areas of distributed programming and can help add to the ideas presented in this paper.
Various such topics include a greater depth of aggregation, server-client architecture based
applications, sensor based programming, and so forth.
3.2 PAPERS FOCUSING ON CONSISTENCY LEVELS
Various papers focus on constraints in distributed programming, and how to apply that
concept to reactive programming. [22] provides the consistency level definitions described in
this paper. ScalaLoci [24] helps with constraint based programming as it provides an overall
structure to avoid dealing with too many data flow issues that come from other systems.
Simba [25] focuses on a slightly different set of definitions of consistency layers as opposed
to [22]. It creates a new data type which is basically a table that allows different apps to
pick from multiple distributed consistency schemes. [26] is an explorative study on the actor
model that analyzes sequential consistencies, and finds that these do not generally hold very
well with this model. [27] focuses on edge computing. Its purpose is to enforce session
consistency in edge computing.
3.3 PAPERS FOCUSING ON SERVER CLIENT ARCHITECTURE AND EVENTDRIVEN PROGRAMMING
[5] focuses on establishing a server-client architecture for instrumentation remote control
over the Internet. [28] is a very important paper that provides the overall chat model used in
this work. This paper is used to focus on the automation of the overall process of distributed
programming. A complex distributed program would be represented as if it were sequential.
The overall model consists of three parts, and they are the data model, network model, an
event model, and a security model. Sunny.js is mainly used to solve the problem. Some
components of this include using a domain specific language, a run-time environment, an
online code generator, and a dynamic template based rendering engine. As one of the goals
in this paper is automatic code generation, that is very similar to the online code generator
15
mentioned in the above paper. Overall, the core logic generally wants to be replicated across
multiple server-client architecture based programs, aiding in the overall automation process.
3.4 AGGREGATION AND OTHER SIMILAR APPLICATIONS
One project that was worked on in the past was the distributed aggregation project (a
project I actually worked on few years ago). This project used Scala/Akka in order to
perform the tasks needed. Scala helped develop the overall framework to perform the needed
tasks, and Akka’s actor model of programming helped make the needed communications. In
contrast to Salsa which combines both the implementations and concurrent parts together,
they are separated here. The overall task was to implement some distributed aggregation
algorithms. The first one was a tree based aggregation protocol. The nodes communicated
with each other in the form of a tree, where each node contained information of some kind
that meant to be propagated up to the root node which would contain the the aggregate of
all nodes. The aggregate would include for example the sum or product of nodes underneath.
There were two different cases of nodes, root and nonroot, as their behavior was different.
The overall module was implemented in Scala, where Scala was used to implement the
functionality of handling messages in areas such as aggregating information to above nodes,
handle fail cases, remove nodes, adding new nodes, and making needed broadcasts. Akka was
then used to test the application by creating multiple different actors and then calling needed
functions. Doing this enabled necessary communication and then results were observed in
order to make sure the output was as expected. ScalaTest was used to do a more thorough
check, running multiple different scenarios with actors and testing individual methods out
to make sure that output was okay. Lastly, templatization was used to make the overall
application more general purpose, in order to account for operations other than addition.
This was done with one general group interface which contained three functions: id, inverse,
and op. Various case classes such as multiplication, int modulo 11 were created and tested
with, and the overall application was generalized to work with this. A secondary application
that was worked on was implementing a gossip based aggregation protocol. Here, rather
than have nodes connect to each other, they each maintain their own table of information
about their relations to other nodes.
Other papers also exist which focus on aggregation related algorithms. [4] is a paper that
focuses more on user defined aggregation operations, since sometimes more basic operations
like sum, which was implemented by distributed aggregation, are not enough to accomplish
the task. An analysis of various high level query languages is also done to test for language
integration. [29] provides an overall survey of multiple different aggregation approaches so
16
far and serves as a good learning model to understand different choices. [30] focuses on
aggregation techniques in a specific area, namely wireless sensor networks. It tries to reduce
redundancy among data, as in general, there often is a huge volume of data that is generated.
Another paper that focuses on sensor networks is [31]. This in addition also tries to protect
against malicious software and adds in the security aspect. [32] focuses on various different
gossip based protocols for multiple different algorithms. Other papers in a similar area focus
on actor based programming of wireless sensor networks.
17
CHAPTER 4: CORE APPLICATIONS
4.1 OVERVIEW AND GENERAL STRUCTURE
The two main applications, chatroom and task, are two server client architecture based
applications. In both of them, one central server exists with multiple different users. The
purpose of the chatroom is to serve as a platform where different users can send messages
to everyone else. Each user maintains his/her own list of messages, which continuously
gets updated every time a user adds a new message to the list of messages. The task
application is pretty similar overall, with there being a central tasklist as well as each user
maintaining his/her own list of tasks. These tasks can be either updated, or new ones
can be added. Both of these applications were used since they are great examples where
server-client architecture is applied and provide multiple insights as well as a good structure
where receiving information can be well controlled. Since they are both relatively similar,
it would be interesting to analyze how the latency differs among the applications where
implementation is slightly different.
Both of these applications have multiple driver programs, shell scripts for running neces-
sary programs, as well as python programs that help parse output. Within the applications
themselves, there exists a user file which takes care of a user’s functionality, a server which is
used to send messages to a user, and any accessory classes which help with overall implemen-
tations. The user class handles most of the constraint related stuff, with the server making
sure all messages are sent. The driver programs all contain declarations of all the users,
and all of the messages are sent from there, which are then sent to the server, which finally
get broadcasted to individual users. Shell scripts are used from the outside to run actor
instances of the various actor based classes from outside, and those pass in the necessary
parameters, as well as ids of the user actor based instances when running driver programs.
The python programs are listed as part of the shell scripts, and they are run at the end after
a sleep command is listed (to ensure they run only after all output is delivered). They list
out the latencies and throw an exception every time a consistency level is not met (incorrect
implementation). All of these three work in conjunction to ensure an overall correct program
implementation. The four consistency levels that are tested for each of these layers are no
consistency, first in first out consistency, causal consistency, and single source glitch freedom.
All of the consistency code is handled on the receiving side of user to ensure that it correctly
waits when needed, and to ensure all of the latencies are measured properly.
18
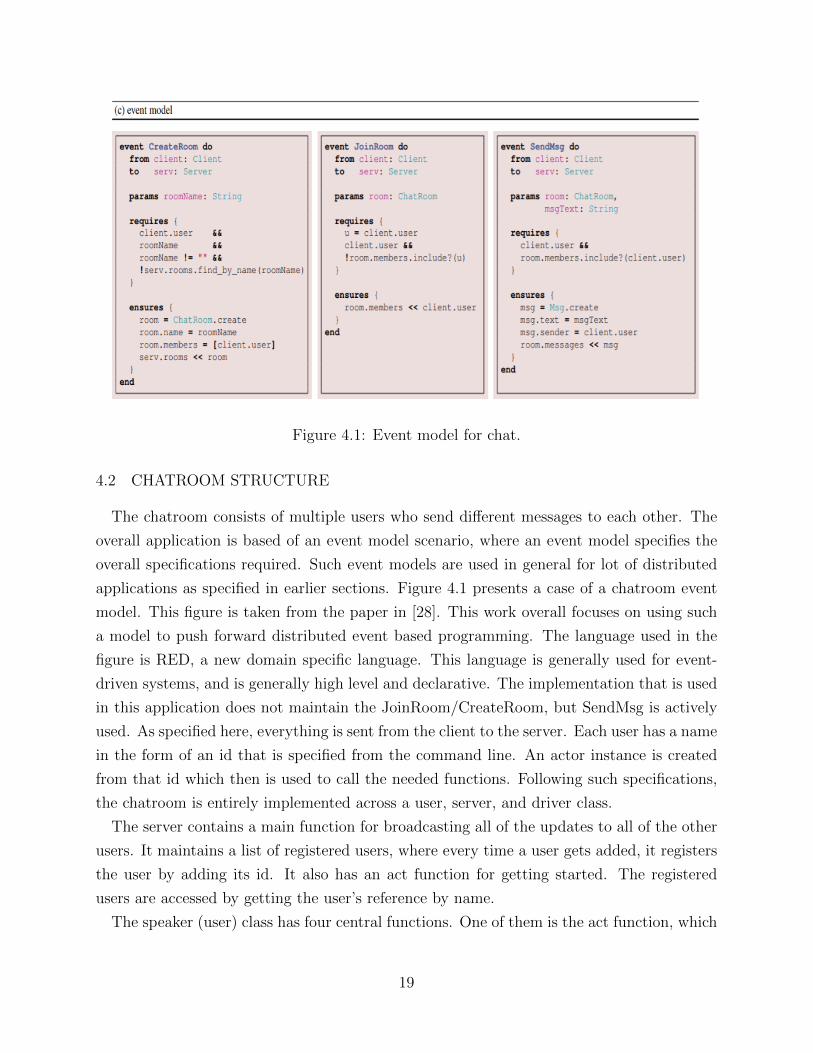
Figure 4.1: Event model for chat.
4.2 CHATROOM STRUCTURE
The chatroom consists of multiple users who send different messages to each other. The
overall application is based of an event model scenario, where an event model specifies the
overall specifications required. Such event models are used in general for lot of distributed
applications as specified in earlier sections. Figure 4.1 presents a case of a chatroom event
model. This figure is taken from the paper in [28]. This work overall focuses on using such
a model to push forward distributed event based programming. The language used in the
figure is RED, a new domain specific language. This language is generally used for event-
driven systems, and is generally high level and declarative. The implementation that is used
in this application does not maintain the JoinRoom/CreateRoom, but SendMsg is actively
used. As specified here, everything is sent from the client to the server. Each user has a name
in the form of an id that is specified from the command line. An actor instance is created
from that id which then is used to call the needed functions. Following such specifications,
the chatroom is entirely implemented across a user, server, and driver class.
The server contains a main function for broadcasting all of the updates to all of the other
users. It maintains a list of registered users, where every time a user gets added, it registers
the user by adding its id. It also has an act function for getting started. The registered
users are accessed by getting the user’s reference by name.
The speaker (user) class has four central functions. One of them is the act function, which
19
takes in the necessary parameters and calls server’s registerUser function. The other one
is the constructor which creates the necessary speaker reference, and sets the user id to
the appropriate value. The main two functions are broadcastSend and broadcastReceive.
BroadcastSend is used to push a change that is sent from a driver program (a new message)
into the server class, and then the server will broadcast this change back into other speakers’
broadcastReceive function. Receive handles both processing the message by adding it to the
overall message list, as well as the processing of the consistency levels, to make sure the user
views the messages in the correct order and at a proper timestamp. There are numerous
other helper functions which will be discussed in depth in the algorithms section.
The last main group of classes are the driver programs. There is one driver program for
each case, and a case consists of a type of experiment and the consistency level that goes
along with the run. For chat, there are four sample driver programs with the combination,
10 users with 10 messages, one for each layer. This testing combination is used to get a
general idea of the levels and how they compare (the learning stage described in the problem
statement). The rest of the tests are for scalability, and there are tests for both multiple
machines and a single machine. The configurations for a single machine are 10 users with
100 messages, 10 users with 10000 messages, 100 users with 100 messages, 100 users with
1000 messages, 1000 users with 1 message, 1000 users with 10 messages, 1000 users with 100
messages, and 1000 users with 1000 messages. The configurations for 10 machines, where
each machine has 10 users, are 20 users with 100 messages, 50 users with 100 messages, 100
users with 10 messages, 100 users with 100 messages, and 100 users with 1000 messages.
The driver programs for scalability are structured such that the number of users is the
focus, where all of the users are initiated from the shell script and passed into the program.
Hence, different driver programs are required for a different number of users. The number of
messages is specified, and those are created from within the program. The different number
of users are 10, 100, 1000, 20, and 50, and therefore, there are 20 driver programs for chat
since there exist four consistency levels for each. These programs are all structured that
they take in the necessary information from the shell scripts, create the users as needed
along with taking the number of messages. In a for loop, each speaker then broadcastSends
his/her message until all messages are sent. There is also one additional function that keeps
track of the ending time of this program. Once all messages are sent, that function is called,
and the total time that it takes to send all of these messages is measured.
Messages can be of multiple types. In real life, statements made are often of different
types/structures, and very rarely is anything done uniformly. For that reason, the project
accounts for multiple types in order to handle more real life scenarios, though not too much
as that would make implementation confusing. The three cases are statement, question, and
20
answer. Statements are a type of message that are not made as a response to anything.
They could either have a correlation to other statements or none. Questions are implied
by the type name, where the speaker asks a question and expects a response. Answers are
statements made in response to questions asked. Each of these cases are handled differently in
Speaker’s broadcastReceive, and this will be elaborated upon in the algorithms section. They
are handled differently among the driver programs. The structure used to call broadcastSend
from within will be slightly different among the calls, as the different type of statement will
have to be specified. In general, in programs that use the question/answer combination,
20 percent of users will be the ones asking questions. 20 is a decently portioned number,
as anything over would be too much, and this size allows for good analysis when observing
scalability trends.
Shell scripts exist in order to run all of the necessary programs, and they are of different
structures given the requirements. They create instances of all of the speakers by running
the command needed and passing in the proper parameters. They do the same with server,
and all of these outputs are concatenated to specific output files. The number of scalability
files that exist is the same as the number of driver files, since a different shell script is
required whenever the number of users is different. Whenever the number of messages
changes for those individual cases, that single parameter is changed to reflect the new test
case. Different consistency levels require different shell scripts since the output files will
be different for each of those. While the primary purpose of shell scripts is to run the
consistency levels and the tests, they also need to include running the python programs that
would help correctly parse output. To do this, the scripts must ensure that enough sleep
time is placed before the python program is executed, as otherwise, the python program
would parse an incomplete set of output files. To properly set the sleep command, multiple
runs with a certain experiment are observed, and then the sleep is set to a threshold value
high enough so that the python program would never run before completion. For example, if
a set of programs took 35 seconds on average to run, a sleep command would involve waiting
for one minute. On a side note, if the Salsa files for scalability involved generators without
creating the users from outside, the scalability files would be much different as then they
would not create speakers nor would the concatenation to output files exist there. These
shell scripts would be much smaller, and output concatenation would be handled within the
speaker class itself by keeping track of which speaker it is printing output for. Scalability
files for multiple users is slightly more complicated. Communication across machines needs
to be ensured, so instead of using localhost, the ip address of one specific machine would
be used, and this would be maintained across all machines as that would be essential for
proper communication. In addition to that, each machine would need to add some form of
21
sleep delay to account for network latency as well, and this way, the next machine would be
activated at the right moment, not incurring any communication issues. The overall split
of files across shell scripts would have the server along with some of the users in one, an
even split of users across multiple other machines, any accessory classes as well as the driver
program (along with few more machines) in the final script. Together, these would be run
one after another to ensure program completion.
The final component involved consists of the four python programs. Each of these python
programs correspond to one particular consistency level and are trained to adapt to mul-
tiple different use cases. The purpose of these programs is to find errors that may exist
for both testing purposes (if improvements/changes to code need to be made), and if the
programs work, to just have that on display every time a run is made so that output can
be tracked. The other two purposes are to measure the run-time of the driver program and
to also calculate latency (the most important purpose). Python scripts are used because it
is extremely difficult to hand calculate everything for so many runs. The creation of these
scripts involves some hand calculations however, mainly due to the necessity of checking for
correctness when testing individual aspects. These python programs take in the number of
users as an argument, so that all of the user output files can be properly parsed when going
through the output log files. The main aspects of these programs are the functions which
compute the latency, check for FIFO ordering, and compute the driver program run-time.
The python programs for causal consistency and single glitch must also check for ordering
of questions to make sure that all questions have arrived before answers. Lot of code among
these python scripts is relatively similar as basic functions, such as FIFO ordering testing
would be the same everywhere. All of this functionality is divided into functions which each
perform a unique task, and this will be delved much deeper in the algorithms section.
4.3 TASK APPLICATION STRUCTURE
The task application is overall very similar to chat, with a few differences. Task is slightly
more involved, and consists of a little bit of extra functionality as well as more operations.
It would be interesting to note latency differences between chat and task. The overall task
event model is similar to that of chat, with a set of conditions that describe what needs to
be maintained. The overall class structure and connection between the clients and server is
very similar between the two.
Many aspects of this application are very similar to chat. In terms of class similarity,
both Server and User (here, the class is called user, not speaker.salsa) maintain the same
functionality, with both responsible for making necessary updates, as well as sending changes
22
to each other. The server still registers users, but this time keeps a map of users to their ids
(which speaker in chatroom does not). The similarity among driver programs also exists,
since the driver programs here are run for the same scalability cases (so the same number
of programs is necessary). With just changes in class types and the way stuff is called,
the overall structure and purpose of driver programs is the same. The number of updates
(instead of messages) is again taken as a parameter. The shell scripts are also the same
for the most part, with the only difference being that an extra line needs to be added to
create a TaskList actor instance. This line also involves concatenation to output files. Lastly,
the code changes to python programs involves accommodating for the separate output, but
again, the overall structure is vastly the same.
The main difference comes from the types of updates that exist. Here, there are two
types of tasks, initial task and follow up task. Though not as commonplace as question and
answer, there could be many scenarios in the real world where one comes up with a set of
initial tasks for a project, and then the rest would have to create their own set of follow
up tasks which would then be added. This could exist in distributed settings as well. One
user would propose a task type of initial task, and then other users would respond with a
follow up task. This is handled by all the classes similarly to how chat handles the question,
statement, and answer types by having different parameter values account for this. With
task updates, there exist two operations here as opposed to one for chat. Tasks can be
added, and users can also make updates to an already existing task. The update operation
can have a bit of overhead, since instead of just adding a task to a list, update would require
finding that specific task by looping through all existing tasks and then making an update to
it. Rather than having one broadcastSend function, the driver programs call user’s addTask
and updateTask functions as needed passing in the needed parameters. These functions then
call server’s respective add and update functions, which take care of the overall adding to
the central tasklist functionality, and then call server’s broadcast function passing in the
correct parameters. The rest of the functionality is the same calling user’s broadcastReceive
function.
The other main difference between task and chat is the addition of the Task class and
TaskList classes. Task is needed, since now rather than just sending a message, a task with
multiple components is sent. The task class is a java class, since it is not wise to make it
an actor instance since it does not display any actor related behaviors. Task consists of a
constructor that sets the values of the different attributes of task, and has get functions that
return these values. The main function here is updateTask, which is responsible for updating
the task text to a new text, since it is the text that changes, not the creator or the id. The
primary purpose of TaskList is to serve as the main source of adding/updating tasks. This
23
class is not used anymore due to the overhead that could be caused by having such a central
tasklist. This contains mainly of addTask, updateTask, which are used to add/update tasks
as needed, the constructor which takes in necessary parameters, and get functions to return
users and tasks.
4.4 INDIVIDUAL CASES FOR CONSISTENCY LAYERS
While there are only four layers tested, the cases for all six consistency layers will be
described here, as they all present interesting cases and are instructional. These test cases
make use of the individual message types for chat and individual task types for chat. The
overall scenarios presented here are implemented within the driver programs. They are made
to be realistic as well, so that the overall understanding of how they would be used in real
life scenarios is enhanced. The purpose of this application is to reflect on how distributed
programs would need to make use of such consistency layers, as a lot of real life applications
described earlier are distributed in nature.
No Consistency and FIFO are the first two main cases of chat, as they are pretty related.
In the case of no consistency, multiple speakers would send statements in a chatroom, and
the messages that a user sends have no necessary ordering (they are random arbitrary state-
ments). Here, no consistency layers would be necessary, as all the messages are disconnected,
and it does not matter in what order do users receive these statements. In the cases specific
to this application, all of the users would each send a specified number of statements within
the driver program, all of which would be received randomly in the receiver’s end. This is
a somewhat interesting case, as it is not as commonplace as some other cases. In real life,
messages often have a coherent ordering to them and are not random, but in some cases
people do send random messages, so it would be unique to observe. The difference between
FIFO and no consistency is that with FIFO, messages must maintain order. This is true
in most cases, as a person would often make statements that have at least some coherent
connection. The driver programs for FIFO would be the same as those for no consistency
with the exception that the statements would be changed to be ordered, coherent statements
as opposed to unordered, random statements. The ordering for FIFO would also be across
the messages a user sends, not across multiple users. The way code is handled in receive
would also be different. The case here is very much interesting and applicable, as there are
lot of times you would want users messages to be received in the order in which they happen.
It would also be unique to see how the time keeps increasing with the number of users.
Causal consistency is a more interesting case that involves the use of questions and answers.
With the case of an application, multiple users could ask a set of questions for everyone to
24
answer, and it would be interesting for all users to see other responses. The response that
speakers make must be made after the initial questions are asked. This implies FIFO,
since an answer obviously cannot be made until the question is asked. The order in which
questions/answers come must also be maintained, since their orders are respective. It would
not make sense for answers to come in a different order than the questions are asked, and
both should maintain their original ordering. All driver programs must maintain some users
asking questions and some asking answers. On the receiving end, a queue would be used to
make sure that answers exist after questions, and if an answer arrives before, a queue would
be used to wait until the question arrives. One example of this is that if the ordering in one
set of messages is off, a queue should be used to wait until the question is propagated before
adding the answers to a users list on the receiving end. The overall ratio used is 20 percent
questions and 80 percent answers. Any less/more would not be interesting, as then the
proportion would be skewed. This is an interesting case, as lot of times, statements would
come in the case of questions and answers rather than random facts thrown around. It is
interesting to see how much more time latency would take when multiple users are involved.
Single source glitch freedom is interesting since the cases presented here require the user
to do all of the processing at once, rather than one at a time. A side operation would be
involved here, since merely adding messages to a message list can be done on the way (what is
done in prior cases). This operation is not implemented, but would generally involve decision
making based on a series of inputs. One example is polling, where everyones decision would
be based on what votes others sent. On the receiving end, a queue would take everything
and ensure ordering of timestamps arrive in order as and when messages are sent. Benefits of
this include that there is less overhead with the sending and processing of messages, and in
cases where decision making resides on cumulative responses from all other involved parties,
it would be better to wait until the end. A simple case involved would be the same as that
for causal, but here the questions/answers are poll based. The speakers would read in all of
the messages at once and make a decision based on how everyone else responded (despite
not being implemented, this is still a generic case in real world scenarios where decision
making exists among multiple speakers). This is a very common and interesting case that
can happen quite a bit. Polling is used to make decisions in many cases, and it is more
efficient to process everything at once than make a continuous operation each time. A lot of
distributed cases would benefit from processing everything at once than one at a time. This
would especially be interesting when scaled up.
With complete glitch freedom for chat, single glitch for each node must be implemented
(in broadcast receive), and the order in which messages are broadcasted must also maintain
good order. In order to make sure order in which nodes receive updates is maintained across
25
all nodes, the order in which broadcasts are sent must be ordered. This would be handled
in the broadcast function in Server. Cases in which this is important is when there is a
specific ordering of users in which they receive the message, and that actually matters for
the outcome. If this ordering changes, the responses may not be as accurate. One example
would be that the order in which it would matter that all users received updates in the same
order is polling where there exist dependencies between user messages. The same scenario
would be used here as for single glitch, but the updates must be made sure to be broadcasted
in the same order. This is stricter and may be useful in some cases. The percentage of users
questioning/answering would be the same, and they would be poll questions/answers again.
However, the messages would make sure to have some coherent ordering that they must be
received by all users in the same order. This case could be of some use, but it is not as
interesting as the previous cases because it is not as relevant. It would still be interesting to
see how runtime results are affected though.
With atomicity, it is imperative that all of the users in the chatroom process the update
that has been made at the same time. This is essentially single glitch implemented across all
users now, along with the complete glitch requirement that user updates are broadcasted to
all users in the same order. The case that this would be interesting is when inter-dependency
exists across all of the individual messages, and the users must all vote at the same time. In
order for atomicity to happen, in the last iteration when the users get the final broadcast
messages, ordering across all nodes would be maintained and only once the final node receives
the message, all operations would take place. Once all of the operations are done, then the
state of each of the nodes would be updated, and this way, the time of everything would be
the same. The case that goes along with this is voting where everything must be processed
at once, as an immediate decision needs to be made simultaneously among all users. This is
a stricter level of implementation than single glitch since this includes all of the nodes, and
this would help promote efficiency. This is an overall useful case where different machines
in the real world are all interdependent on the decision making of another, and it would be
beneficial for all of them to make the needed decisions at once.
Moving onto the task application, the no consistency case primarily consists of adding
new tasks repeatedly without making any updates. The tasks that users add also have no
relevance to each other. There is no need to add in layers here, as the order in which these
tasks are added does not matter at all. Updates cannot be part of no consistency as they
would have to be received in order. With regards to scalability code, all the users would
send in a passed unordered number of tasks, where the tasks are random and irrelevant.
It will be interesting to see what order they arrive in. This case is interesting, as this is
often reflective of cases in real life where a manager gives a set of tasks where each task
26
is different. This would be present in a distributed setting as well where the tasks do not
necessarily need relevance to each other. With regards to FIFO for the task application,
updating an already existing task would have to be considered too. The main case where
such an ordering is important is with adding one task and then updating it. The order has to
be strict here, as a task can only be updated after it is added. The other case involves a set of
tasks where the ordering does matter, as the tasks would be a sequential list of items where
the items keep following one another. The case with updates would consist of 80 percent of
changes a user makes would consist of adding a new task and then the remaining 20 percent
would consist of making updates to a set of randomly chosen tasks. The other case, which
is more similar to the driver programs code-wise, would consist of all users adding in a new
task, but here, the tasks would have a relevant ordering and connection. For the sake of
the application, the first case is not considered due more challenging implementation, more
significant changes in latency (since updates may take longer to be implemented), and the
fact that such a situation often is not as realistic. The second case is very interesting because
it is more often for tasks to be added with at least some relevance/ordering. In distributed
applications, one device could receive a sequence of instructions from another which would
want to be broadcasted in the correct order. The other case is not that relevant in a real
life or a distributed setting because very rarely would something be added to a task list and
then updated at the same time. Updating later on makes sense, but not within the same
period, and that would happen only if someone makes a mistake when first adding on a task.
Causal consistency for task makes use of the follow up handler. This is very similar to the
case for chat, except here there exist tasks instead of message types. The update case is not
considered here as no interesting examples with updates were found with regards to causal
consistency, and the latency effects might be too much. The main case scenario for this is
that the first 20 percent of users who are supposed to specify the details of tasks do not
provide all of the aspects of the project, and expect the other users to specify their own ideas
of what the rest should be. A causal relationship clearly exists between an original task and
its follow up here. Just as in chat, the first 20 percent of users here would specify the initial
tasks in all cases. The rest 80 percent will specify follow up tasks. FIFO ordering would
also need to be present here, since the tasks/follow up tasks correlation should be present,
and users would expect to receive information in the order they were sent. The queue
would be used anytime something is sent out of order. This is an overall interesting case as
multiple times, tasks that a user updates would require follow up tasks from other users to
be instantiated. This would be true in various distributed settings as well, though not as
commonplace as other scenarios such as the question answer one. The latency increases with
scalability as well as comparing the latency to chat’s corresponding causal implementation
27
would be interesting to notice.
With single source glitch freedom, everything would need to be processed once again.
One example is where everyone is dependent on all pending tasks to be completed to move
forward to the next step. For the users, rather than processing messages as they arrive,
everything will get processed at the end. The benefits would be similar to those of chat,
and everything would be processed at the end to make sure it is a valid final list. The
processing will again not be implemented since that is beyond the scope of this analysis,
but would make sense for a use case scenario. The overall case here would be the same as
the one for causal, but the task messages would be slightly different since they would be
more poll/decision based. Once all users have finished, they will then use knowledge of the
responses to then come to a consensus as to what to do. This is an interesting case and
can happen quite frequently, though probably not as often as the case mentioned in chat
(since voting is more commonplace in general). However, in general, lot of people involved
in a team project would be interested in knowing whether all of the users have completed
their tasks, with the manager being the one assigning all of the tasks. In a pure distributed
setting, this would be more rare, but due to the relevance to real life, it is still an interesting
case.
With complete glitch freedom, single glitch for each node must be implanted (in broadcast
receive), and the order in which messages are broadcasted must also maintain good order.
With tasks, it is generally good that users get messages properly because each user would
like to see the tasks updated in the same order since follow up tasks are relevant to that too.
If this ordering changes, the responses may not be as accurate. One use case scenario of this
is one where one user as the director wants other users to send their updates in. To make
sure the decision making process is smooth, the director wishes for all users to be seeing the
tasks in the same order since each task connects with others in a way that ordering matters.
This is stricter and may be useful in some cases. The ratio here would again be 20 percent
of users sending in initial tasks to 80 percent of users responding with follow up tasks. This
case, while still not as relevant as the prior cases, is more relevant than the chat equivalent
in real life as this could happen somewhat frequently. However, in distributed settings, it is
still not too relevant. Once again, analysis of run-time results would be interesting here.
With atomicity, it is imperative that all of the users in the task process the update that
has been made at the same time. The case where this is interesting is when all updates
and decisions by all users must be made to happen at the same time, as an immediate
decision needs to be made. All users must receive the task adds in the same order, as
some interleaving/dependencies exist between these tasks. This is again a stricter level of
implementation than single glitch, and would involve the same set of messages from the
28
driver programs (with some changes to the messages to reflect on requirements). This is
a somewhat useful case in the real world, and the one for atomicity presented in chat was
more relevant for both real world and distributed settings. However, it would nonetheless
be interesting to observe the overall run-times.
4.5 LATENCY DEFINITIONS
Latency is defined as the overall execution time taken for a certain process. In distributed
terms, it often refers to the amount of time taken for a change to get broadcasted to another
user. With constraints, multiple different definitions could be used, and each definition
offers some meaning towards the overall application. What would be required is a definition
that helps properly take into account differences between different consistency levels without
providing bias to any specific layer. Overall, the latency definition must indicate something
concrete about the time it takes for broadcasts to get received. The definitions are the same
for both chat and task.
In terms of definitions for no consistency, FIFO, and causal consistency, there is a little
variability in what would be correct/not correct. One definition of latency is that the total
latency would be defined as the maximum latency taken across the set of messages that a
user sends. This means that for all messages a user sends, the maximum broadcast time for
each message to another user will be taken account, and then the maximum out of these set
of messages will be the latency for one user. This would then be averaged across all users.
This definition would be the same across FIFO and causal as well, with the only difference
for causal being that instead of taking the average across all users, only the users sending
the initial questions/tasks would be taken into account. While this definition is definitely
valid, there are two main problems for the applications at hand that required a slightly more
accurate definition. The reason this definition was still illustrated here was that this was
presented in a paper and is of use as well. The main use of this above definition is for checking
individual times and observing how things behave on a user to user basis when consistency
levels change. The first main issue with this is that with the way single glitch (and higher
latency levels) is defined, single glitch would automatically have a much higher latency since
there, everything on the receiving end gets processed at once and not a message by message
basis. It would be more of a start to finish measurement since the first message sent would
obviously have the maximum value out of all messages sent. The second issue is with that
definition, only sometimes the consistency levels may matter, since the average may remove
stalling effects and therefore not lead to any significant differences between the layers. The
modified definition that was then followed is that the total time difference between the time
29

the first message gets sent by a user and the last message gets received by a user would be
taken into account. This way, the definitions are fair across all layers, and there is a higher
chance of accounting for different layers.
The definition for single glitch and complete glitch would be defined as the time it takes
from when the first message is sent to the time the last user has finished processing ev-
erything. With single glitch as well as causal now, the users sending the initial messages
(tasks/questions) do not get higher precedence. Complete glitch follows the same defini-
tion, as the changes added by that layer do not impact the way latency would be measured.
Lastly, atomicity would be defined as the difference between the time the first message was
sent and the time all users finished processing all of the updates. With all of the latency
levels, the average latency value of 30 - 50 runs (determined by a histogram) would be
taken and then that would be compared to the average value of other consistency level
runs. Implementation-wise, all of these latencies would be periodically measured whenever
a process has been finished, and before that a sleep function would also be called to increase
overall execution time to enhance differences between layers. The python program takes
care of parsing time differences from the outputs.
Lastly, there exists the overall runtime for driver programs. This essentially checks how
much time has passed between the time the first message got sent and the time the last
message got sent. While this is far from the main focus of the application, it is still interesting
to note how much delay exists between the message sends on average. In order to implement
this, the difference in time between the start of the program and the end of the program
is taken. Once again, the python programs parse this difference and display that needed
information, and again the average of 30 - 50 runs (again determined by a histogram) would
be taken.
4.6 OVERALL IMPLEMENTATION ALGORITHM FOR CHAT
The algorithms for the driver programs consists of taking in all of the users as parameters,
and then looping through the number of messages in a for loop. An arraylist is used to
keep track of the individual message numbers, and those are added as part of the message
string when the message is sent. Variables used to indicate the type of message are passed
into broadcastSend, along with the user number as well as message number (to avoid having
String parsing implementation). Lastly, a Boolean variable indicating whether FIFO order-
ing is required or not is passed. Server’s main functionality is within broadcast, where a for
loop is used to loop through all users and send the needed updates. Both broadcastSend
and broadcastReceive includes functionality to keep track of timestamps by using the Times-
30
tamp class. This instrumentation is necessary, as otherwise there is no way of determining
latencies. The vast majority of code implementation here comes from the consistency layers.
The shell script code was already described in prior sections.
For implementing no consistency, not much was required. Simply displaying the time on
the user side was all was needed, since no consistency does not implement constraints. For
FIFO code, most of the implementation is handled in a function called handleFifoCode. This
function takes in all of the information needed to print out information when processing the
messages. It also takes a variable indicating if a question is being considered now or not,
since questions are handled slightly differently. The function mainly makes use of two global
maps to keep track of what messages have been sent to the current user number. One map
is used to map current user to the message number, and the other map is used to map users
to the overall message. There are two main decisions to make at this point. When a new
message number is processed, it is compared to the latest message number that has been
processed. If it is not the first message to be added and its number is more than one greater
than the last message added, it is added to the correct positions of the values and messages
arraylists that are used to keep track of values that have not yet been added. The maps
are then properly updated. In the case that the message number is indeed in the correct
position and is added after the latest message number that has been added, the new message
first gets processed. After that, the arraylists that held stalled messages are gone through
to see if the first element there can be added, and then those are looped through and added
to the list of message numbers added. If there is a greater than one gap in the for loop,
then the loop ends there, and after the for loop has been processed, all elements in the loop
that have been processed are removed one by one to avoid repetition. In every process, the
message does get processed and added to the overall message list. The difference with the
question case will be described when illustrating how causal consistency works. This overall
code ensures that whatever order messages are entered in, the resulting output will always
be in proper order.
Causal consistency makes use of handleFifoCode as well as few other functions in order to
make sure everything is ordered. First of all, causal works with two case statements, question
and answer. The question case works by first calling the handleFifoCode function passing
in the needed variables and setting the question parameter as true. QuestionTimeStamp is
a crucial variable which keeps track of the number of questions processed. HandleFifoCode
makes sure that if the question variable is set as true, that variable is then utilized to add the
current message to questionTimeStamp, so that the total number of questions is updated.
After this is handled, another function called handleNormalStall is called to ensure that all
answers are processed after questions, if answers get received on the question side. Variables
31
are used to calculate the total number of users and questions from given information, and
those variables are used to determine if answers should be processed. If the current message
type is not of question, then the questionTimeStamp size is checked to make sure that it is
equal to the total number of questions, so that only then, answers would begin processing.
If it is of type question, then it waits until the total number of questions - the number of
questions this user sent is equal to questionTimeStamp’s size to begin processing the answers.
When processing the answers, the global answerQueue, a variable used to keep track of what
answers have been stalled while waiting for questions, will be looped through, and elements
will be pulled out one by one, and handleFifoCode will be called here also on the answers to
make sure that they are sent in order. The @ symbol is used in between the two calls within
the question case itself, so that handleNormalStall is not worked on while the first case itself
has not finished processing. With the second case, answer, the same information is gotten
and the same if statement is used as in the question case. The one difference is that after
the queue is processed, handleFifoCode is called on the current message as well to ensure
that answer is properly handled after all answers in the queue is processed. Lastly, the final
addition here is that if the if condition is not true, the answer is added to the overall global
answer queue.
Single glitch implementation is very similar to causal with a few changes. QuestionTimeS-
tamp is still used to keep track of the number of questions added, but now a different version
of handleFifoCode, called handleFifoCodeAdvanced is called. A function called broadcas-
tReceiveAdvanced is also called instead of the general broadcastReceive, which is used to
handle single glitch for all cases. An overall queue is also used to store messages as they
come for processing later instead of handling them as they come. That is the main difference
between the two FIFO functions, and no sleep is called there either. In the two cases for
question and answer, the code is overall similar, but the advanced function is called in the
same areas instead. Lastly, one final function called printQueueInformation is added in order
to display all of the necessary information. That function loops through the message queue
and prints out the information, as well as adding the needed amount of sleep time between
each print. After that, the final latency is printed out. As in causal, the @ symbol is used
between the function calls (including the call to printQueueInformation which is done at the
end) in order to avoid code from being executed before the prior function code finishes.
The python programs have four main functions (three for FIFO/no consistency). They are
checkOverallRuntime, getOverallLatency, checkQuestionsOrdered, and checkOrdering. The
rest of the python driver code (that is not part of any function) works by calling the func-
tions as necessary and printing out all of the appropriate information. CheckOverallRuntime
works by parsing the log file that contains information on how long the driver program took
32
to run, and specifically pulls out the number corresponding to that value. CheckQuestion-
sOrdered loops through each of the output files, and in each of those, it loops through the
first x number of lines which contain speaker remote in them (speaker remote is used to
indicate that it is a message coming from another user). X represents the total number of
questions that are supposed to be there, and by doing this, the python program ensures that
all the questions arrive before answers. CheckOrdering is used to ensure that all messages
are FIFO ordered. A map is used to map users to the overall message numbers received.
Every time a message with speaker remote in it is processed, that string is split and the
corresponding user gets updated with the corresponding message number. At the end, all
elements of the map are iterated through, and for each key, the list of numbers are checked to
see if they are ordered or not. If not ordered, then the value is returned as false. Otherwise,
this is continuously looped through all of the files to check for correctness. Lastly, there
exists getOverallLatency, the main function of the python programs. This function works
by getting the first starting time from a speaker local (messages sent from the user itself)
of any given file, and then the final time from a speaker remote of any given file, and then
taking the difference between these two. That will give the maximum latency difference.
Part of this code involves also parsing the timestamp structure given by the Timestamp
class in java to get the overall time in milliseconds. The final python program outside of the
ones used to parse information is GenerateGraphs.py. This program is used to generate the
necessary graphs as well as print out all of the information to a logs file. It works by parsing
all of the log file results and then, it extracts all of the latencies and run-times and prints
out the average value. It also creates a line graph of the information as well as a histogram,
and it does this by calling the necessary matplotlib functions. Lastly, from the histogram,
it gets a more accurate average value from it and displays that, and this average value gets
compared to the other value to check for utility.
4.7 OVERALL IMPLEMENTATION ALGORITHM FOR TASK
There are overall lot of similarities in the overall implementations between task and chat.
The overall driver programs are of the same structure, in addition accommodating for the
differences in types between task and chat. The communication between user (in task,
speaker is referred to as user) and server, as well as the driver programs, is pretty similar as
well. For simplicity, the task application does not account for update with its consistency
layers, so the way those layers are processed is also roughly the same. The only differences
consist of the parameters passed and the types checked for. The same is true for python
programs, where everything algorithms related is the same. The only difference with python
33
programs is that the programs are now made to work with a slightly different structure and
set of files.
Tasklist is one of the major additions to the task application that is not contained in chat.
The main functionality consists of adding information to an overall tasklist that consists of
all messages, and makes updates to a specific task when needed. It uses a combination of lists
and maps to keep track of all tasks there and maps tasks to ids accordingly when necessary. It
also calls the appropriate functionality as necessary to correctly handle everything. Update
is a slightly more involved implementation, and that involves looping through all existing
tasks and then changing the text of the found task to a new text. This concludes the overall
applications section, and the next section will focus on results, as well as an overview of
trends noticed.
34
CHAPTER 5: RESULTS AND BASIC ANALYSIS
5.1 EXPERIMENTAL SETUP
The overall results consist of (i) single machine runs which test for latency, (ii) distributed
runs which test for network latency. There exist a good number of differences in the con-
ditions in which the basic runs were run as well as the scalability runs. The basic runs
were done on a local Linux machine (ubuntu), which is much slower than the virtual high
processor Azure machines used. The Azure machines are 32 gigabytes and maintain a 4
core processor. Theaters were also used for Azure, with the scalability being run with a
deployment script which generated everything using a loop rather than manually deploying
actors on each machine. Theaters helped with the deployment process because executing
everything in an actor generator uses far less memory than bringing up actor instances.
Without theaters, the server worker actor also keeps dying, becoming unable to receive all
of the needed messages. Lastly, overall less processing time was involved with Azure, as
the sleep latency time was less than that of the basic results run in ubuntu. Regardless,
those results still serve as a good comparison, as they do provide some good models of anal-
ysis. Lastly, results also consist of work split across 10 machines, which incur an additional
network latency overhead. Analysis of that as well is interesting to note.
5.2 SAMPLE EXAMPLES OF CHAT ANALYSIS
The overall process of coming up with analysis includes first creating graphs of basic runs
and then seeing the overall average as well as how much variability exists. This was first
done across a set of runs with 10 users and 10 messages. Cases that were also considered
for chat were placing questions at the end to see if it increased latency, and while it did not
have much of an overall impact, it did increase latency in some cases (for causal and single
glitch). The overall latencies presented in such graphs are much higher than the number
seen in scalability experiments for a similar combination because these were run with higher
sleep latencies, and the machines used were not great. Originally, higher sleep latencies were
used in order to test how much difference among layers existed. Later on, it was realized
that such differences could exist with lower sleep latencies as well, and higher sleep latencies
were slowing down the overall latencies too much, making it hard to get good results as well
as run experiments. Regardless, there is not too much variance in results, and there are
some interesting trends to be noticed. The next sections will go through the core results of
35
the project.
5.3 SCALABILITY EXPERIMENTS FOR SINGLE MACHINE CHAT
The various combinations that were run were 10 users with 100 messages, 10 users with
1000 messages, 10 users with 10000 messages, 100 users with 10 messages, 100 users with
100 messages, 100 users with 1000 messages, 1000 users with 1 message, and 1000 users
with 10 messages. Everything was run over multiple runs and then averaged. These graphs
were divided into two categories, one with number of total messages a set parameter and the
number of users variable on the x-axis, and the other with the number of users fixed and the
number of messages variable on the x axis. Error bars are also produced for these various
combinations (displayed in tables immediately following the graph). The first set of graphs
focus on having a total number of messages, and change the number of users involved. All
of these runs are done with a sleep time of 2 ms when processing. The first combination
consists of the latency graph for 1000 total messages represented in figure 5.1. The second
combination, 10000 total messages, was represented in figure 5.3. The third combination,
100000 total messages was in figure 5.5. The next set of combinations keep the number of
users the same, and increases the number of messages to test how latency increases with
proportion to messages. The first of these has 10 users, represented in figure 5.7. The second
is 100 users in figure 5.9. The third is 1000 users in figure 5.11.
First analyzed is figure 5.1 with the individual values presented in table 5.2. With 1000
messages total, 10 users has an average of roughly 4 - 6 seconds, 100 users has an average
latency of around 20 - 25 seconds, and 1000 users has a much higher range of 160 - 260
seconds. Proportionally, the increase in latency from 10 to 100 users increases with a factor
of 5, but 100 to 1000 users has an increase in factor of closer to 8 - 10. This shows that
keeping messages constant does not guarantee a proportional increase with number of users.
It is also seen that the greater the number of users, the greater the overall increase in factor
of how much latency increases in general. Lastly, with regards to the consistency levels
themselves, the differences between them are noticeable even with 10 and 100 users, and
especially become apparent with 1000 users, with no consistency nearing 160 seconds, and
single glitch around 260 seconds, a full 100 seconds higher. One anomaly is that causal
consistency has a higher latency by a few seconds when 100 users exist.
The error bars also present cases of interest. However for these, only general trends will be
analyzed rather than an in depth case for latencies since these are not as important and have
more anomalies. With a 1000 total messages, the standard deviations are normal, increasing
with a number of users. The lines are also relatively close together, with the one exception
36
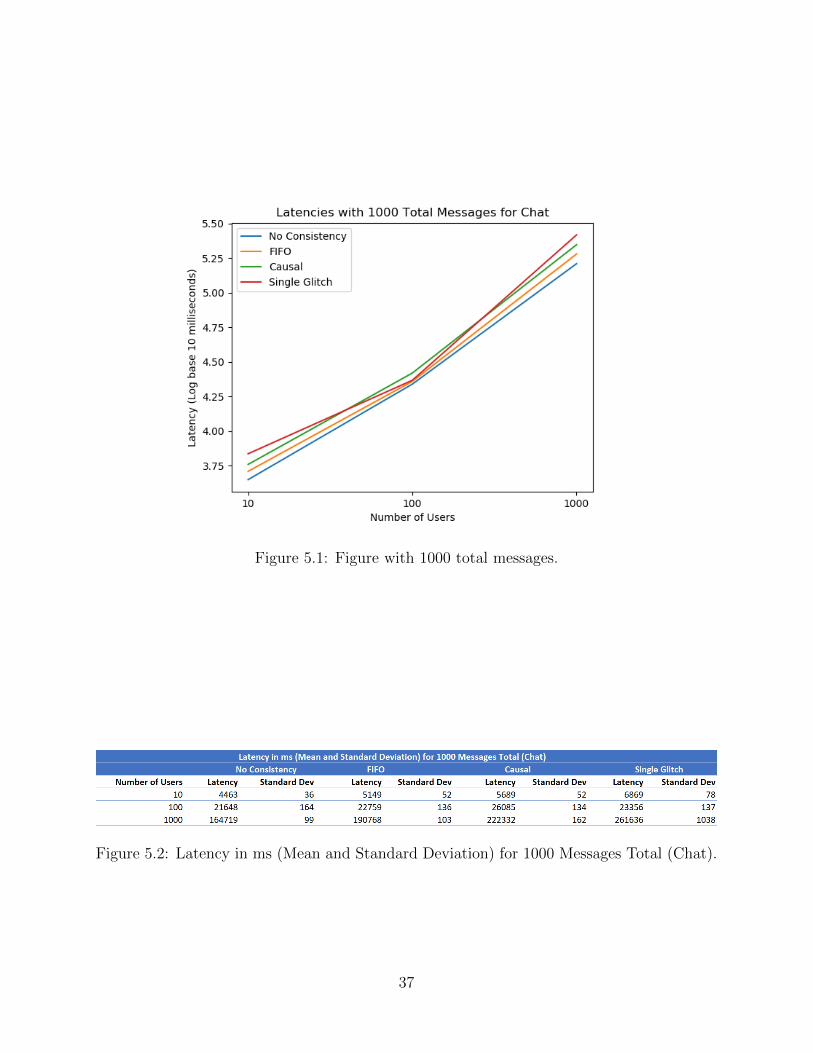
Figure 5.1: Figure with 1000 total messages.
Figure 5.2: Latency in ms (Mean and Standard Deviation) for 1000 Messages Total (Chat).
37
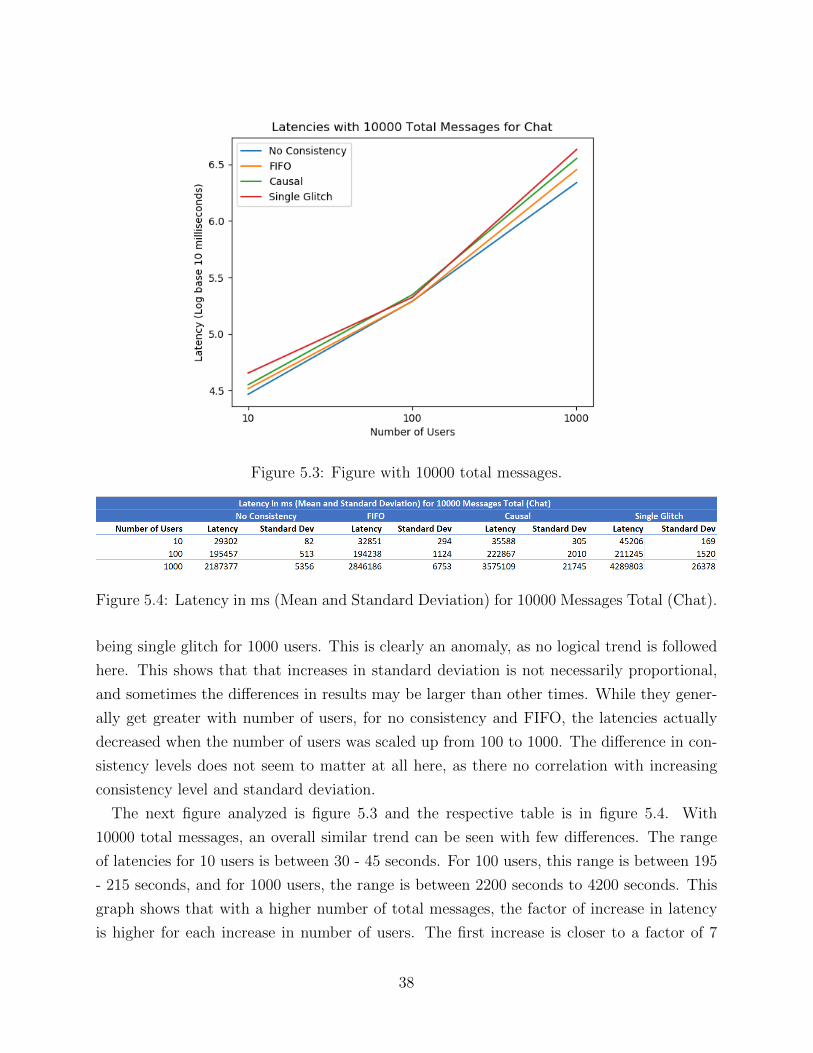
Figure 5.3: Figure with 10000 total messages.
Figure 5.4: Latency in ms (Mean and Standard Deviation) for 10000 Messages Total (Chat).
being single glitch for 1000 users. This is clearly an anomaly, as no logical trend is followed
here. This shows that that increases in standard deviation is not necessarily proportional,
and sometimes the differences in results may be larger than other times. While they gener-
ally get greater with number of users, for no consistency and FIFO, the latencies actually
decreased when the number of users was scaled up from 100 to 1000. The difference in con-
sistency levels does not seem to matter at all here, as there no correlation with increasing
consistency level and standard deviation.
The next figure analyzed is figure 5.3 and the respective table is in figure 5.4. With
10000 total messages, an overall similar trend can be seen with few differences. The range
of latencies for 10 users is between 30 - 45 seconds. For 100 users, this range is between 195
- 215 seconds, and for 1000 users, the range is between 2200 seconds to 4200 seconds. This
graph shows that with a higher number of total messages, the factor of increase in latency
is higher for each increase in number of users. The first increase is closer to a factor of 7
38
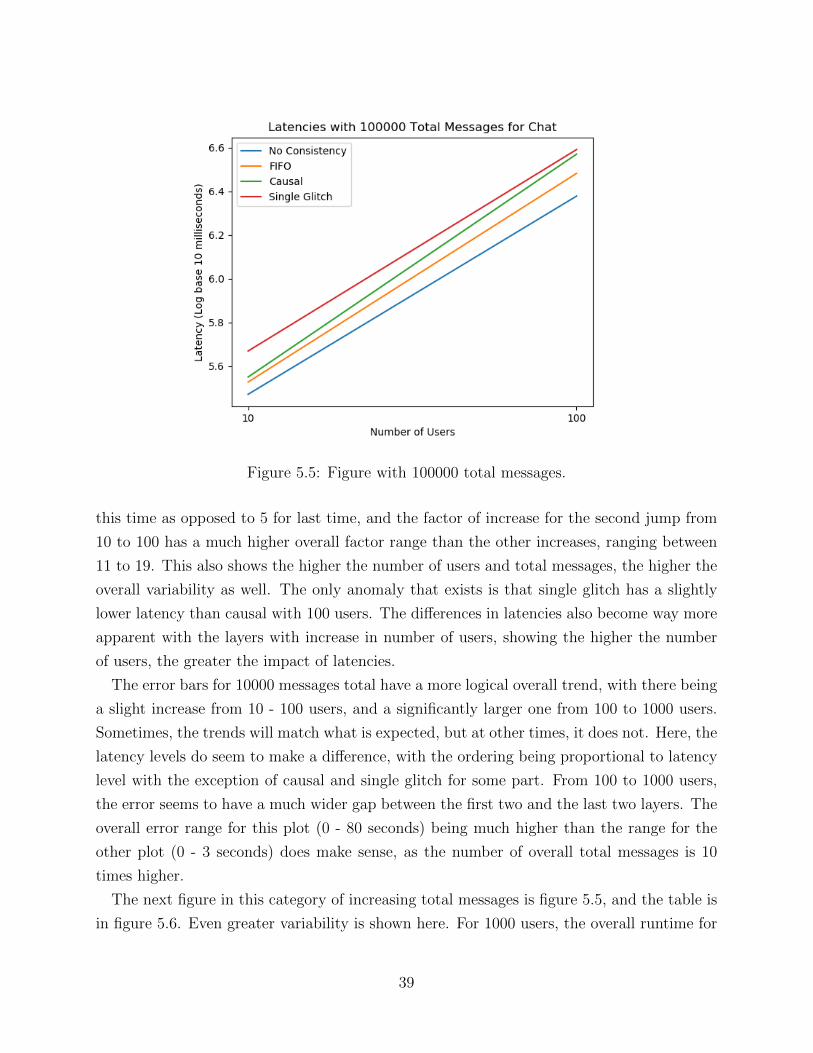
Figure 5.5: Figure with 100000 total messages.
this time as opposed to 5 for last time, and the factor of increase for the second jump from
10 to 100 has a much higher overall factor range than the other increases, ranging between
11 to 19. This also shows the higher the number of users and total messages, the higher the
overall variability as well. The only anomaly that exists is that single glitch has a slightly
lower latency than causal with 100 users. The differences in latencies also become way more
apparent with the layers with increase in number of users, showing the higher the number
of users, the greater the impact of latencies.
The error bars for 10000 messages total have a more logical overall trend, with there being
a slight increase from 10 - 100 users, and a significantly larger one from 100 to 1000 users.
Sometimes, the trends will match what is expected, but at other times, it does not. Here, the
latency levels do seem to make a difference, with the ordering being proportional to latency
level with the exception of causal and single glitch for some part. From 100 to 1000 users,
the error seems to have a much wider gap between the first two and the last two layers. The
overall error range for this plot (0 - 80 seconds) being much higher than the range for the
other plot (0 - 3 seconds) does make sense, as the number of overall total messages is 10
times higher.
The next figure in this category of increasing total messages is figure 5.5, and the table is
in figure 5.6. Even greater variability is shown here. For 1000 users, the overall runtime for
39
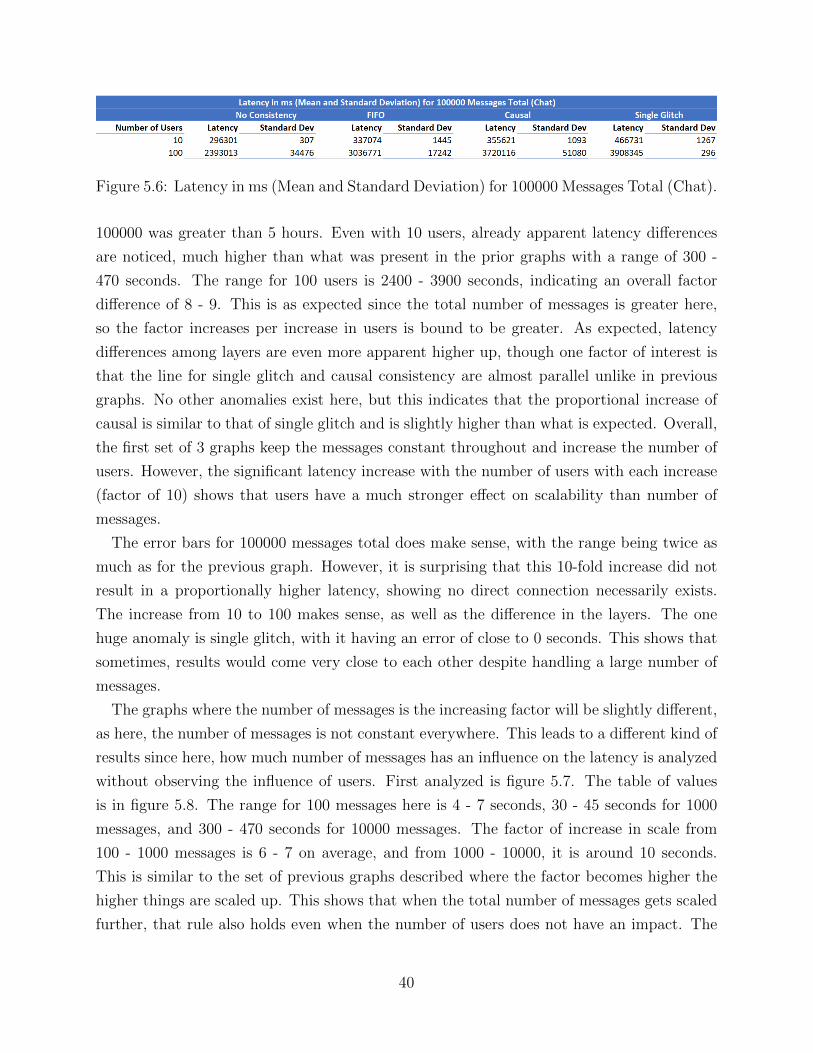
Figure 5.6: Latency in ms (Mean and Standard Deviation) for 100000 Messages Total (Chat).
100000 was greater than 5 hours. Even with 10 users, already apparent latency differences
are noticed, much higher than what was present in the prior graphs with a range of 300 -
470 seconds. The range for 100 users is 2400 - 3900 seconds, indicating an overall factor
difference of 8 - 9. This is as expected since the total number of messages is greater here,
so the factor increases per increase in users is bound to be greater. As expected, latency
differences among layers are even more apparent higher up, though one factor of interest is
that the line for single glitch and causal consistency are almost parallel unlike in previous
graphs. No other anomalies exist here, but this indicates that the proportional increase of
causal is similar to that of single glitch and is slightly higher than what is expected. Overall,
the first set of 3 graphs keep the messages constant throughout and increase the number of
users. However, the significant latency increase with the number of users with each increase
(factor of 10) shows that users have a much stronger effect on scalability than number of
messages.
The error bars for 100000 messages total does make sense, with the range being twice as
much as for the previous graph. However, it is surprising that this 10-fold increase did not
result in a proportionally higher latency, showing no direct connection necessarily exists.
The increase from 10 to 100 makes sense, as well as the difference in the layers. The one
huge anomaly is single glitch, with it having an error of close to 0 seconds. This shows that
sometimes, results would come very close to each other despite handling a large number of
messages.
The graphs where the number of messages is the increasing factor will be slightly different,
as here, the number of messages is not constant everywhere. This leads to a different kind of
results since here, how much number of messages has an influence on the latency is analyzed
without observing the influence of users. First analyzed is figure 5.7. The table of values
is in figure 5.8. The range for 100 messages here is 4 - 7 seconds, 30 - 45 seconds for 1000
messages, and 300 - 470 seconds for 10000 messages. The factor of increase in scale from
100 - 1000 messages is 6 - 7 on average, and from 1000 - 10000, it is around 10 seconds.
This is similar to the set of previous graphs described where the factor becomes higher the
higher things are scaled up. This shows that when the total number of messages gets scaled
further, that rule also holds even when the number of users does not have an impact. The
40
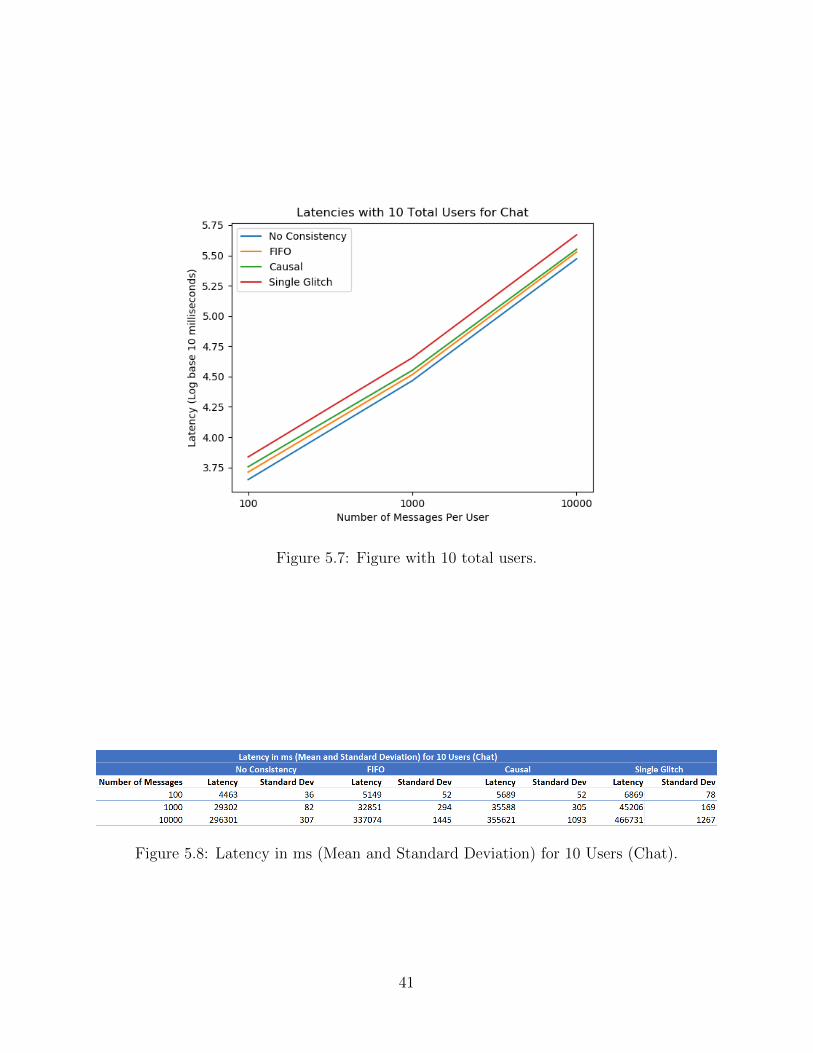
Figure 5.7: Figure with 10 total users.
Figure 5.8: Latency in ms (Mean and Standard Deviation) for 10 Users (Chat).
41
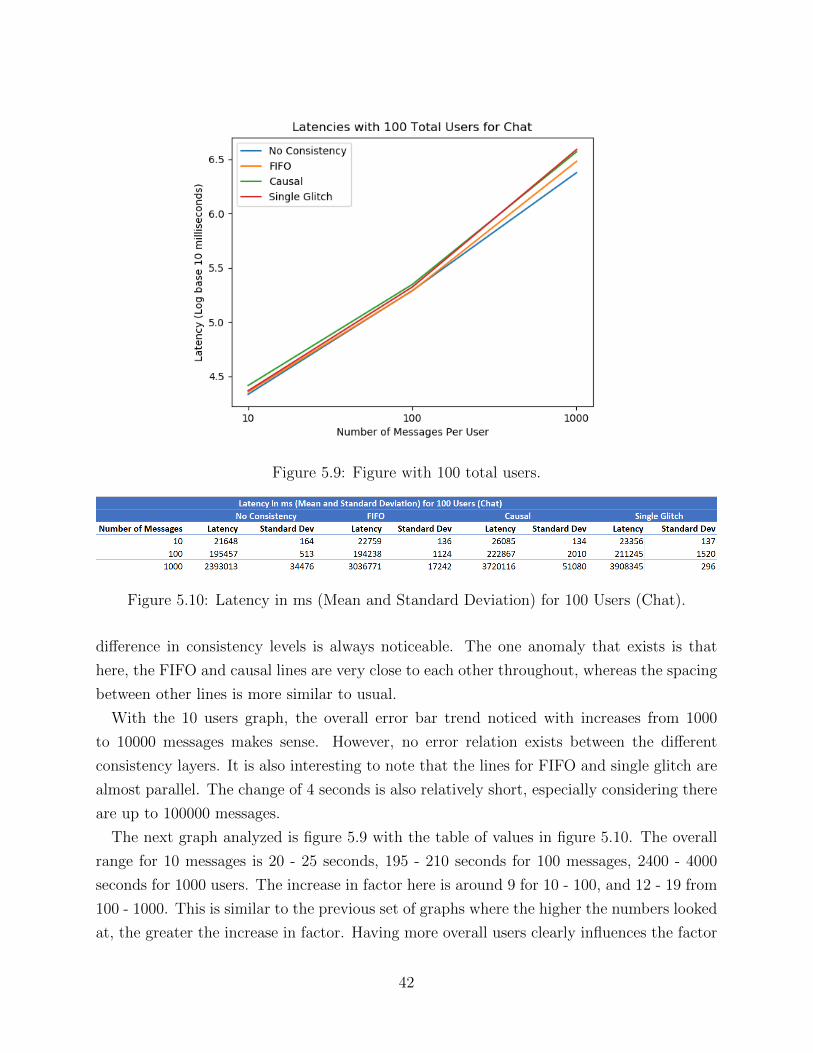
Figure 5.9: Figure with 100 total users.
Figure 5.10: Latency in ms (Mean and Standard Deviation) for 100 Users (Chat).
difference in consistency levels is always noticeable. The one anomaly that exists is that
here, the FIFO and causal lines are very close to each other throughout, whereas the spacing
between other lines is more similar to usual.
With the 10 users graph, the overall error bar trend noticed with increases from 1000
to 10000 messages makes sense. However, no error relation exists between the different
consistency layers. It is also interesting to note that the lines for FIFO and single glitch are
almost parallel. The change of 4 seconds is also relatively short, especially considering there
are up to 100000 messages.
The next graph analyzed is figure 5.9 with the table of values in figure 5.10. The overall
range for 10 messages is 20 - 25 seconds, 195 - 210 seconds for 100 messages, 2400 - 4000
seconds for 1000 users. The increase in factor here is around 9 for 10 - 100, and 12 - 19 from
100 - 1000. This is similar to the previous set of graphs where the higher the numbers looked
at, the greater the increase in factor. Having more overall users clearly influences the factor
42
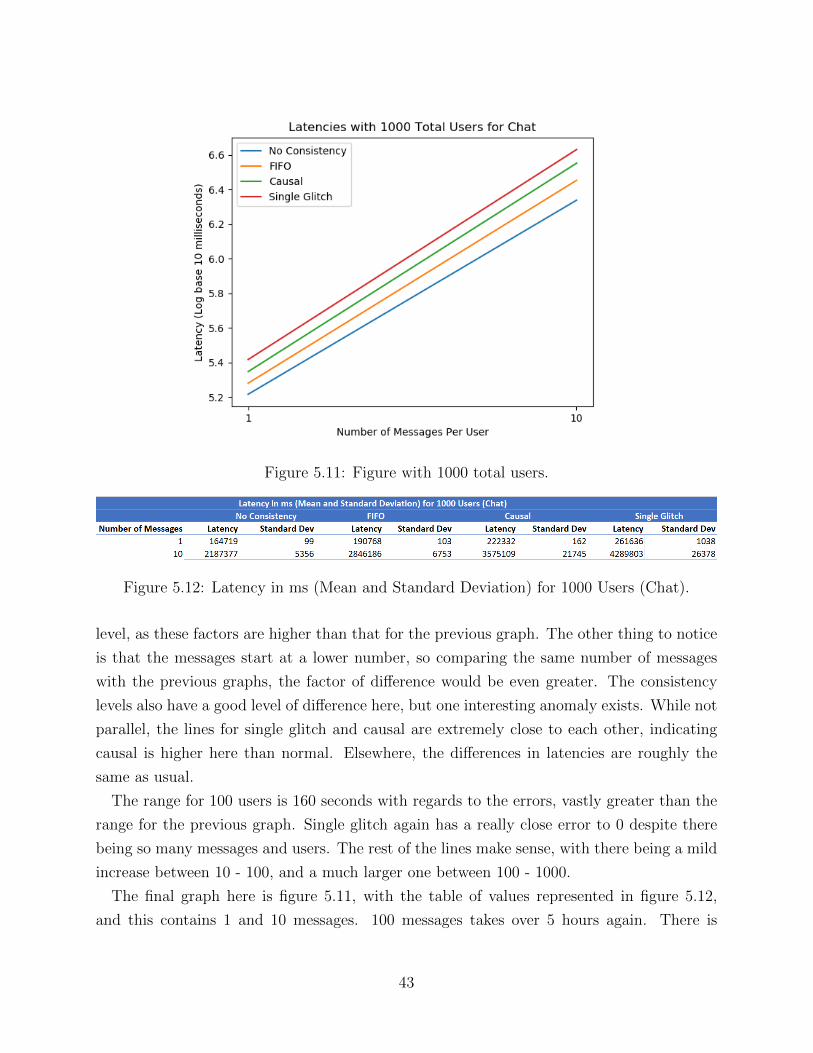
Figure 5.11: Figure with 1000 total users.
Figure 5.12: Latency in ms (Mean and Standard Deviation) for 1000 Users (Chat).
level, as these factors are higher than that for the previous graph. The other thing to notice
is that the messages start at a lower number, so comparing the same number of messages
with the previous graphs, the factor of difference would be even greater. The consistency
levels also have a good level of difference here, but one interesting anomaly exists. While not
parallel, the lines for single glitch and causal are extremely close to each other, indicating
causal is higher here than normal. Elsewhere, the differences in latencies are roughly the
same as usual.
The range for 100 users is 160 seconds with regards to the errors, vastly greater than the
range for the previous graph. Single glitch again has a really close error to 0 despite there
being so many messages and users. The rest of the lines make sense, with there being a mild
increase between 10 - 100, and a much larger one between 100 - 1000.
The final graph here is figure 5.11, with the table of values represented in figure 5.12,
and this contains 1 and 10 messages. 100 messages takes over 5 hours again. There is
43
decent range even with 1 message, ranging from 160 - 260 seconds. With 10 messages, the
range is 2200 - 4300 seconds. The factor of increase is around 12 - 17 here, which is even
considerably greater than the previous graph. This just further reinforces the point made
by analysis of previous graphs, as more messages would mean even higher factors of latency
increases. The difference in latencies among consistency levels is apparent again, and no
apparent anomalies exist. A brief analysis of how scaling by users keeping the number of
messages constant works will be done here, though the 10 machine section will go more in
depth on this. For example with 100 messages per user, the factor of increase between 10 -
100 users is around 40, which is much more than any factor caused by increase in number of
messages. From 100 - 1000 users, the increase is even much greater, going from 3 minutes to
over 5 hours. This is again reflective of how when the numbers become higher, the factors
of difference become greater as well, and this is also applied to the number of users. When
the number of messages is 1000 per user, the factor of increase when increasing number of
users from 10 - 100 is around 100. This is much higher than 40, showing that as expected,
having the number of messages per user higher increases this factor even more. Lastly, for 10
messages per user, the factor is again 100. However, this is because the number of users here
goes from 100 - 1000, not 10 - 100. This is the same as the previous factor even though the
number of messages is far less. This just shows how much of a stronger impact the number
of users has over the number of messages, since the user factor was scaled by 10 here.
Lastly, with the 1000 users error bars, the line shapes are overall interesting. There is a
larger difference in error considering there are just two message values, 1 and 10. The range
is also slightly smaller than the previous graph, but that makes sense since there are only
two message values instead of 3. Overall, some trends exist, but unlike for latencies, errors
do not have any specific trends that need to be followed since some of this depends on how
the run goes.
5.4 SCALABILITY EXPERIMENTS FOR 10 MACHINE CHAT
This section focuses on results gotten from 10 machines. The purpose of this is to analyze
how latency increases with more users as well as identify how overall network latencies
function. This is distributed, whereas all the results before were for a single machine. The
network latency is one of the main aspects of these results. The error graphs also will be
present here. The main results are analyzing latency increases with increasing number of
users from 20 - 100 (20, 50, and 100), which is represented in figure 5.13. The next set of
results are keeping the number of users constant at 100, while changing the total number of
messages from 10 - 100. this is present in figure 5.15.
44
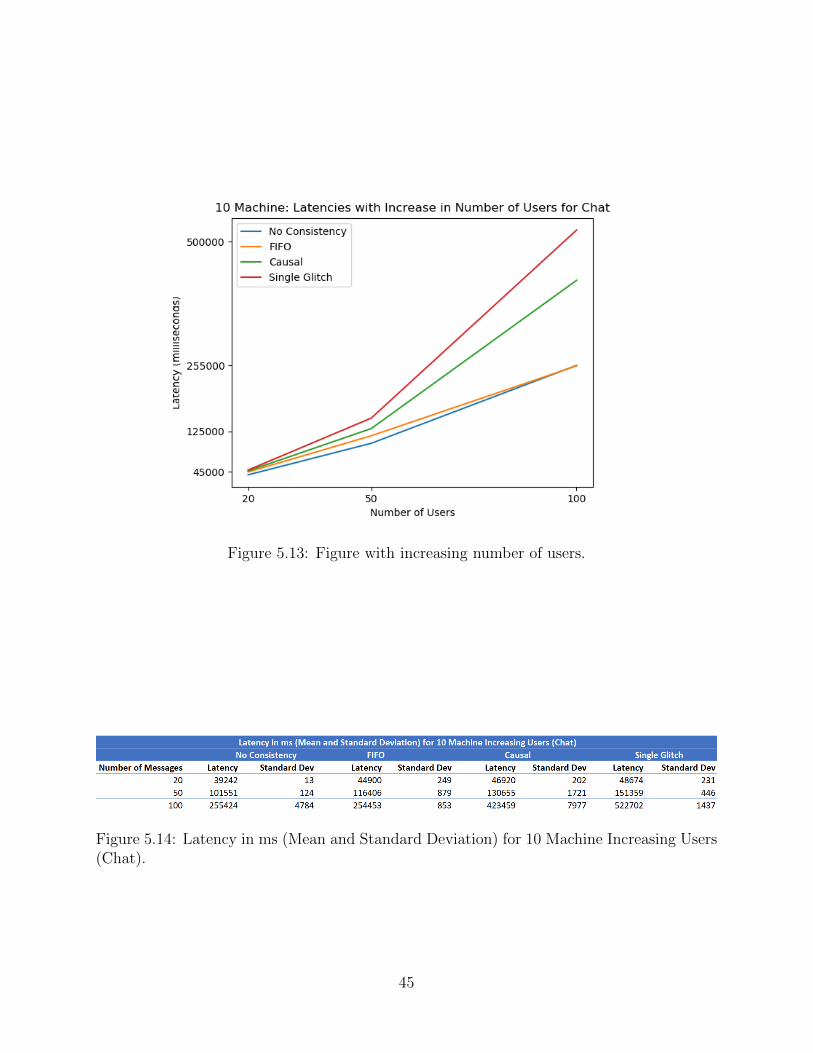
Figure 5.13: Figure with increasing number of users.
Figure 5.14: Latency in ms (Mean and Standard Deviation) for 10 Machine Increasing Users(Chat).
45
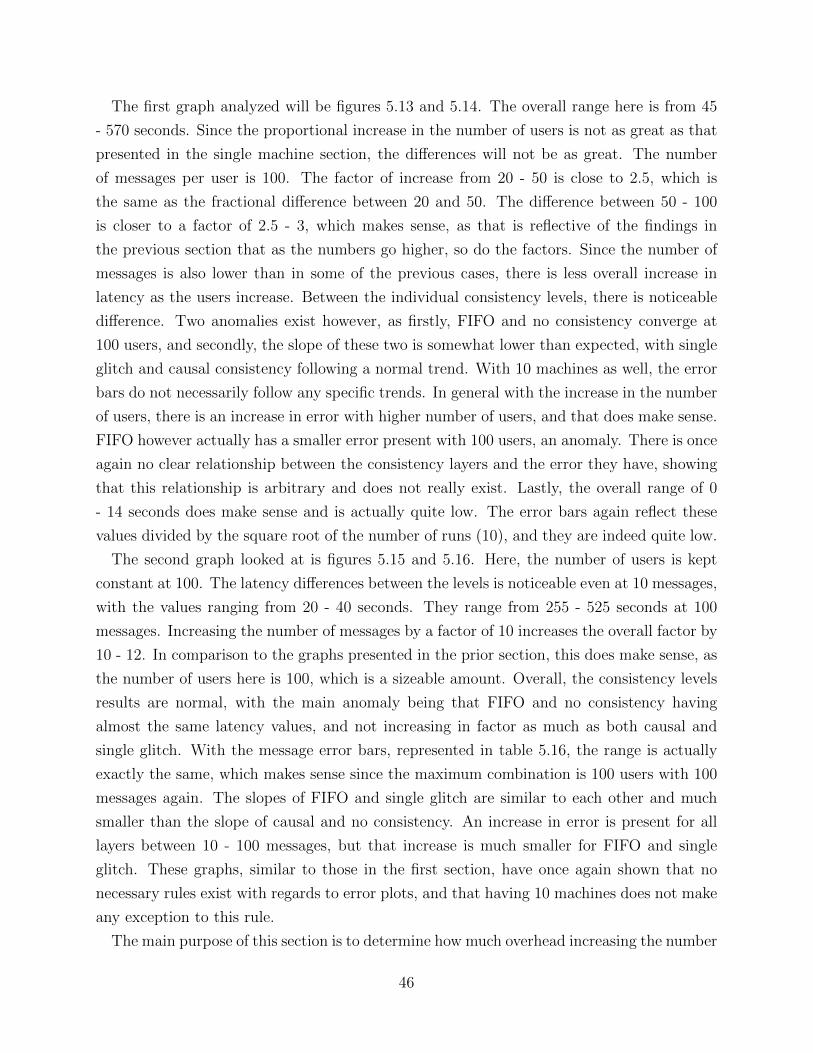
The first graph analyzed will be figures 5.13 and 5.14. The overall range here is from 45
- 570 seconds. Since the proportional increase in the number of users is not as great as that
presented in the single machine section, the differences will not be as great. The number
of messages per user is 100. The factor of increase from 20 - 50 is close to 2.5, which is
the same as the fractional difference between 20 and 50. The difference between 50 - 100
is closer to a factor of 2.5 - 3, which makes sense, as that is reflective of the findings in
the previous section that as the numbers go higher, so do the factors. Since the number of
messages is also lower than in some of the previous cases, there is less overall increase in
latency as the users increase. Between the individual consistency levels, there is noticeable
difference. Two anomalies exist however, as firstly, FIFO and no consistency converge at
100 users, and secondly, the slope of these two is somewhat lower than expected, with single
glitch and causal consistency following a normal trend. With 10 machines as well, the error
bars do not necessarily follow any specific trends. In general with the increase in the number
of users, there is an increase in error with higher number of users, and that does make sense.
FIFO however actually has a smaller error present with 100 users, an anomaly. There is once
again no clear relationship between the consistency layers and the error they have, showing
that this relationship is arbitrary and does not really exist. Lastly, the overall range of 0
- 14 seconds does make sense and is actually quite low. The error bars again reflect these
values divided by the square root of the number of runs (10), and they are indeed quite low.
The second graph looked at is figures 5.15 and 5.16. Here, the number of users is kept
constant at 100. The latency differences between the levels is noticeable even at 10 messages,
with the values ranging from 20 - 40 seconds. They range from 255 - 525 seconds at 100
messages. Increasing the number of messages by a factor of 10 increases the overall factor by
10 - 12. In comparison to the graphs presented in the prior section, this does make sense, as
the number of users here is 100, which is a sizeable amount. Overall, the consistency levels
results are normal, with the main anomaly being that FIFO and no consistency having
almost the same latency values, and not increasing in factor as much as both causal and
single glitch. With the message error bars, represented in table 5.16, the range is actually
exactly the same, which makes sense since the maximum combination is 100 users with 100
messages again. The slopes of FIFO and single glitch are similar to each other and much
smaller than the slope of causal and no consistency. An increase in error is present for all
layers between 10 - 100 messages, but that increase is much smaller for FIFO and single
glitch. These graphs, similar to those in the first section, have once again shown that no
necessary rules exist with regards to error plots, and that having 10 machines does not make
any exception to this rule.
The main purpose of this section is to determine how much overhead increasing the number
46
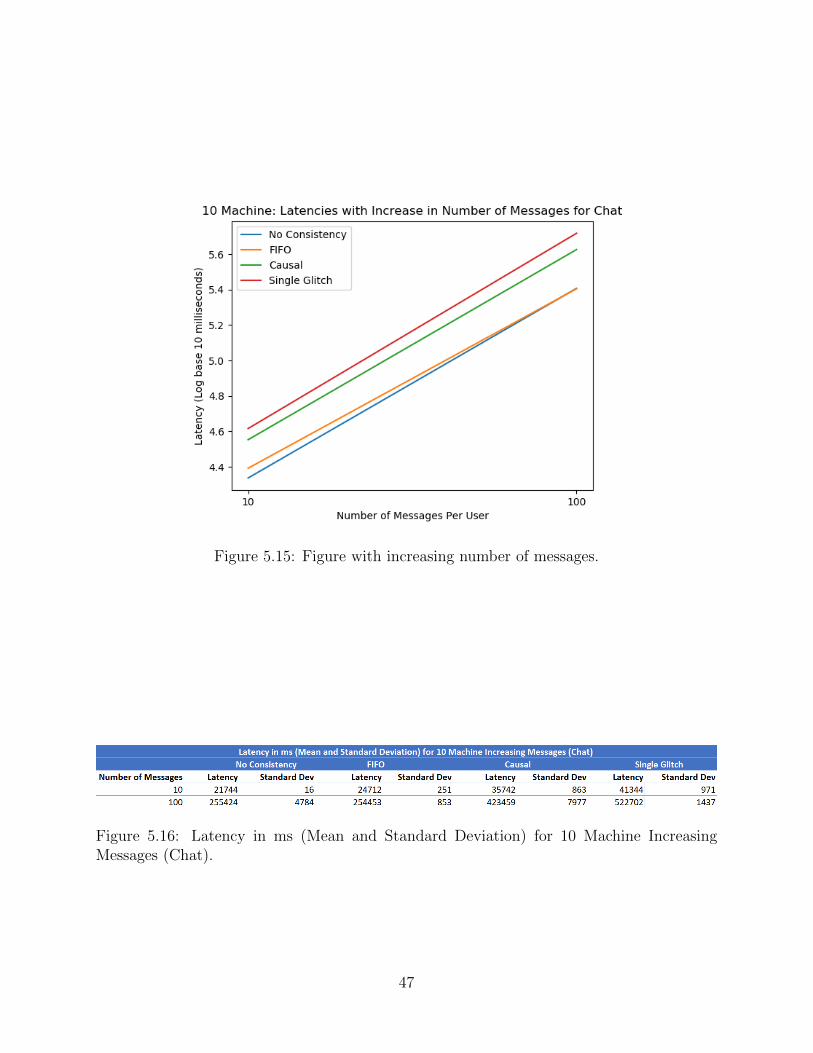
Figure 5.15: Figure with increasing number of messages.
Figure 5.16: Latency in ms (Mean and Standard Deviation) for 10 Machine IncreasingMessages (Chat).
47
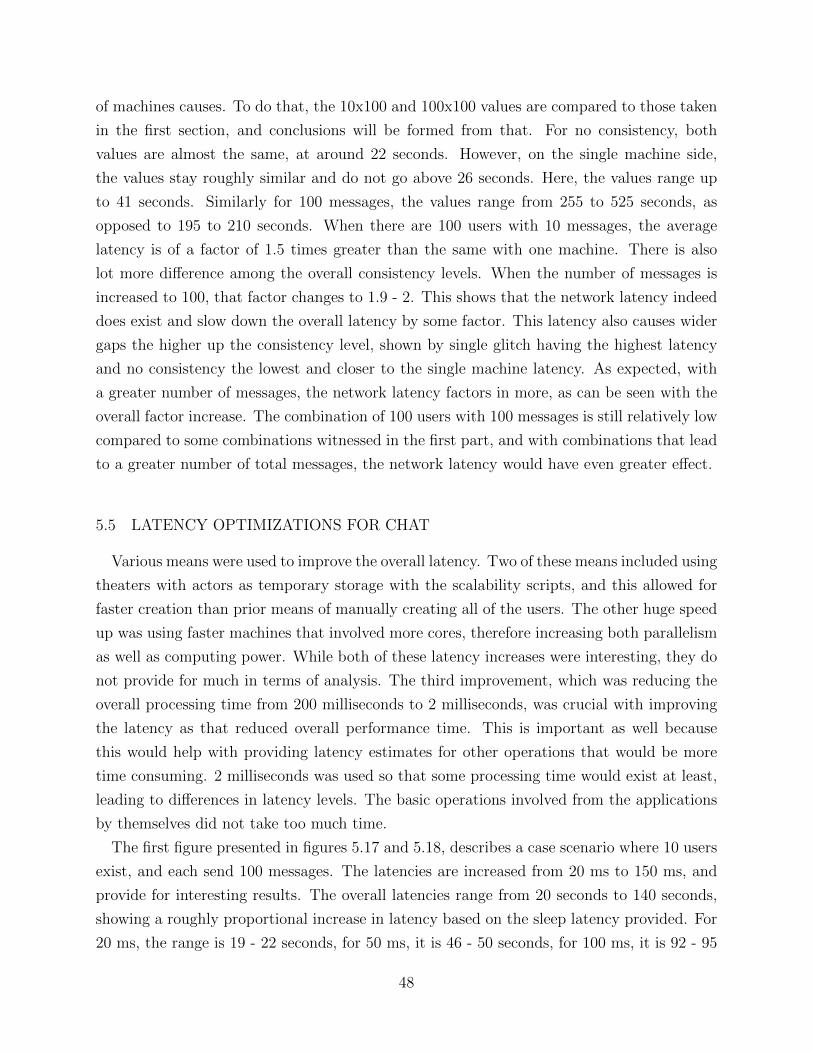
of machines causes. To do that, the 10x100 and 100x100 values are compared to those taken
in the first section, and conclusions will be formed from that. For no consistency, both
values are almost the same, at around 22 seconds. However, on the single machine side,
the values stay roughly similar and do not go above 26 seconds. Here, the values range up
to 41 seconds. Similarly for 100 messages, the values range from 255 to 525 seconds, as
opposed to 195 to 210 seconds. When there are 100 users with 10 messages, the average
latency is of a factor of 1.5 times greater than the same with one machine. There is also
lot more difference among the overall consistency levels. When the number of messages is
increased to 100, that factor changes to 1.9 - 2. This shows that the network latency indeed
does exist and slow down the overall latency by some factor. This latency also causes wider
gaps the higher up the consistency level, shown by single glitch having the highest latency
and no consistency the lowest and closer to the single machine latency. As expected, with
a greater number of messages, the network latency factors in more, as can be seen with the
overall factor increase. The combination of 100 users with 100 messages is still relatively low
compared to some combinations witnessed in the first part, and with combinations that lead
to a greater number of total messages, the network latency would have even greater effect.
5.5 LATENCY OPTIMIZATIONS FOR CHAT
Various means were used to improve the overall latency. Two of these means included using
theaters with actors as temporary storage with the scalability scripts, and this allowed for
faster creation than prior means of manually creating all of the users. The other huge speed
up was using faster machines that involved more cores, therefore increasing both parallelism
as well as computing power. While both of these latency increases were interesting, they do
not provide for much in terms of analysis. The third improvement, which was reducing the
overall processing time from 200 milliseconds to 2 milliseconds, was crucial with improving
the latency as that reduced overall performance time. This is important as well because
this would help with providing latency estimates for other operations that would be more
time consuming. 2 milliseconds was used so that some processing time would exist at least,
leading to differences in latency levels. The basic operations involved from the applications
by themselves did not take too much time.
The first figure presented in figures 5.17 and 5.18, describes a case scenario where 10 users
exist, and each send 100 messages. The latencies are increased from 20 ms to 150 ms, and
provide for interesting results. The overall latencies range from 20 seconds to 140 seconds,
showing a roughly proportional increase in latency based on the sleep latency provided. For
20 ms, the range is 19 - 22 seconds, for 50 ms, it is 46 - 50 seconds, for 100 ms, it is 92 - 95
48
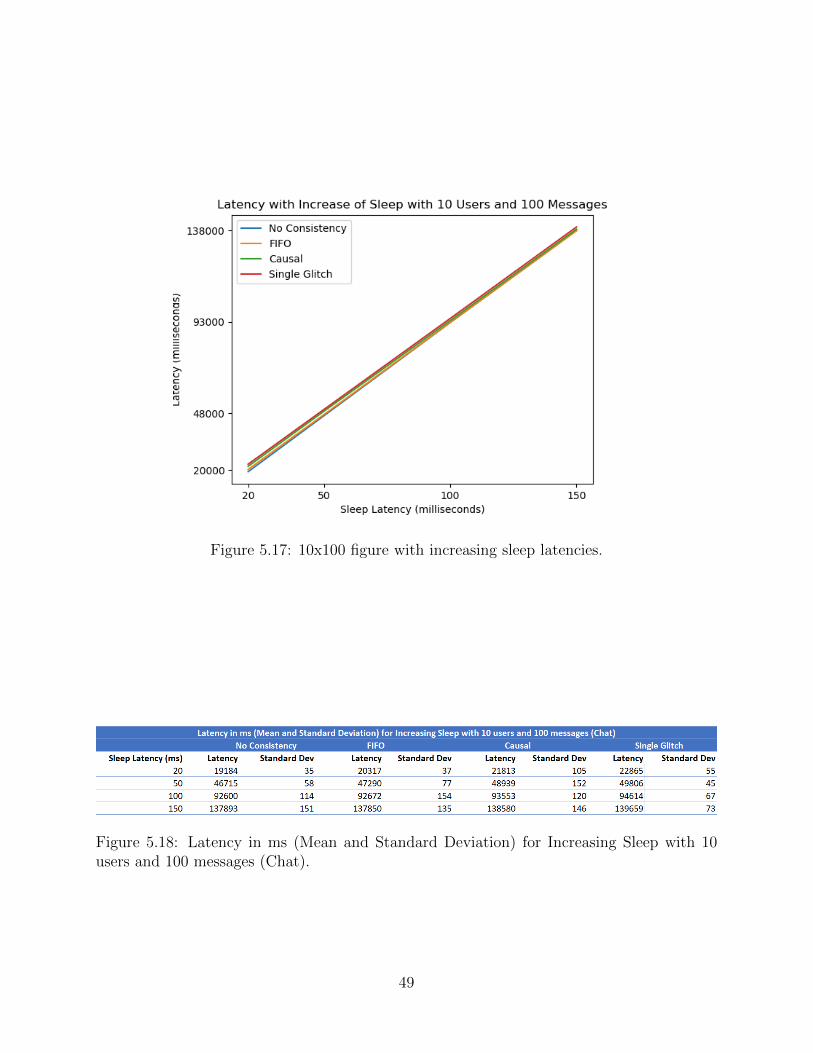
Figure 5.17: 10x100 figure with increasing sleep latencies.
Figure 5.18: Latency in ms (Mean and Standard Deviation) for Increasing Sleep with 10users and 100 messages (Chat).
49
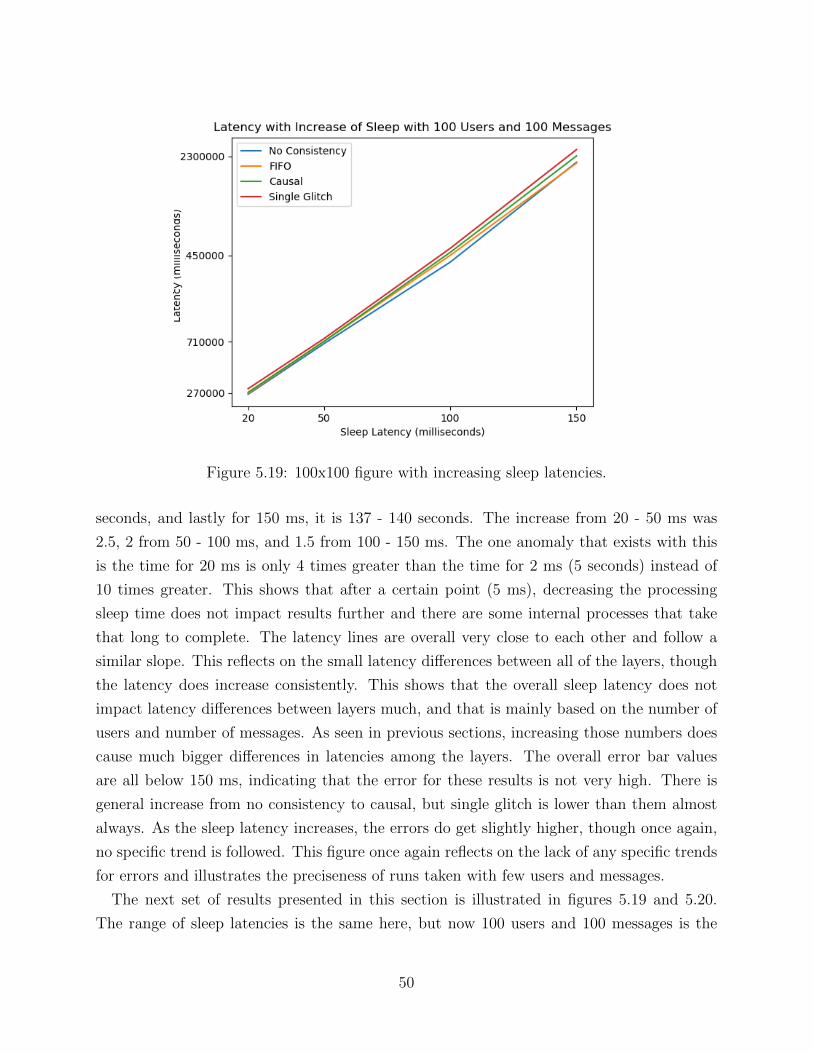
Figure 5.19: 100x100 figure with increasing sleep latencies.
seconds, and lastly for 150 ms, it is 137 - 140 seconds. The increase from 20 - 50 ms was
2.5, 2 from 50 - 100 ms, and 1.5 from 100 - 150 ms. The one anomaly that exists with this
is the time for 20 ms is only 4 times greater than the time for 2 ms (5 seconds) instead of
10 times greater. This shows that after a certain point (5 ms), decreasing the processing
sleep time does not impact results further and there are some internal processes that take
that long to complete. The latency lines are overall very close to each other and follow a
similar slope. This reflects on the small latency differences between all of the layers, though
the latency does increase consistently. This shows that the overall sleep latency does not
impact latency differences between layers much, and that is mainly based on the number of
users and number of messages. As seen in previous sections, increasing those numbers does
cause much bigger differences in latencies among the layers. The overall error bar values
are all below 150 ms, indicating that the error for these results is not very high. There is
general increase from no consistency to causal, but single glitch is lower than them almost
always. As the sleep latency increases, the errors do get slightly higher, though once again,
no specific trend is followed. This figure once again reflects on the lack of any specific trends
for errors and illustrates the preciseness of runs taken with few users and messages.
The next set of results presented in this section is illustrated in figures 5.19 and 5.20.
The range of sleep latencies is the same here, but now 100 users and 100 messages is the
50
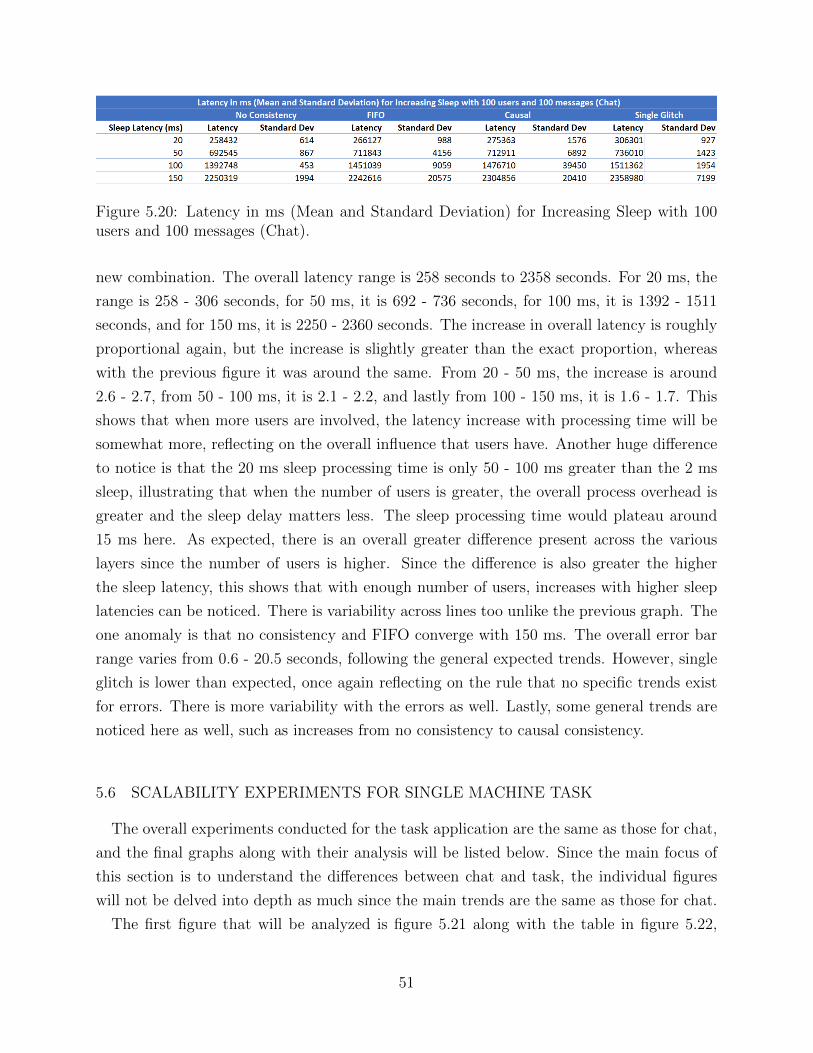
Figure 5.20: Latency in ms (Mean and Standard Deviation) for Increasing Sleep with 100users and 100 messages (Chat).
new combination. The overall latency range is 258 seconds to 2358 seconds. For 20 ms, the
range is 258 - 306 seconds, for 50 ms, it is 692 - 736 seconds, for 100 ms, it is 1392 - 1511
seconds, and for 150 ms, it is 2250 - 2360 seconds. The increase in overall latency is roughly
proportional again, but the increase is slightly greater than the exact proportion, whereas
with the previous figure it was around the same. From 20 - 50 ms, the increase is around
2.6 - 2.7, from 50 - 100 ms, it is 2.1 - 2.2, and lastly from 100 - 150 ms, it is 1.6 - 1.7. This
shows that when more users are involved, the latency increase with processing time will be
somewhat more, reflecting on the overall influence that users have. Another huge difference
to notice is that the 20 ms sleep processing time is only 50 - 100 ms greater than the 2 ms
sleep, illustrating that when the number of users is greater, the overall process overhead is
greater and the sleep delay matters less. The sleep processing time would plateau around
15 ms here. As expected, there is an overall greater difference present across the various
layers since the number of users is higher. Since the difference is also greater the higher
the sleep latency, this shows that with enough number of users, increases with higher sleep
latencies can be noticed. There is variability across lines too unlike the previous graph. The
one anomaly is that no consistency and FIFO converge with 150 ms. The overall error bar
range varies from 0.6 - 20.5 seconds, following the general expected trends. However, single
glitch is lower than expected, once again reflecting on the rule that no specific trends exist
for errors. There is more variability with the errors as well. Lastly, some general trends are
noticed here as well, such as increases from no consistency to causal consistency.
5.6 SCALABILITY EXPERIMENTS FOR SINGLE MACHINE TASK
The overall experiments conducted for the task application are the same as those for chat,
and the final graphs along with their analysis will be listed below. Since the main focus of
this section is to understand the differences between chat and task, the individual figures
will not be delved into depth as much since the main trends are the same as those for chat.
The first figure that will be analyzed is figure 5.21 along with the table in figure 5.22,
51
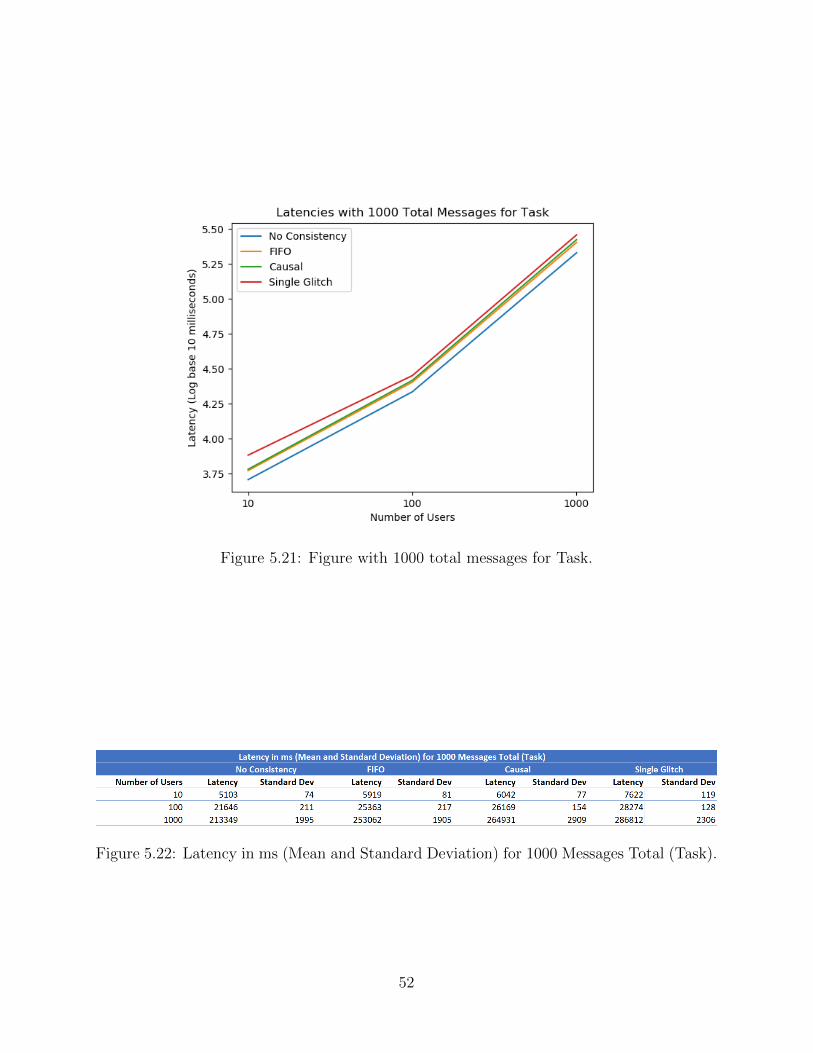
Figure 5.21: Figure with 1000 total messages for Task.
Figure 5.22: Latency in ms (Mean and Standard Deviation) for 1000 Messages Total (Task).
52
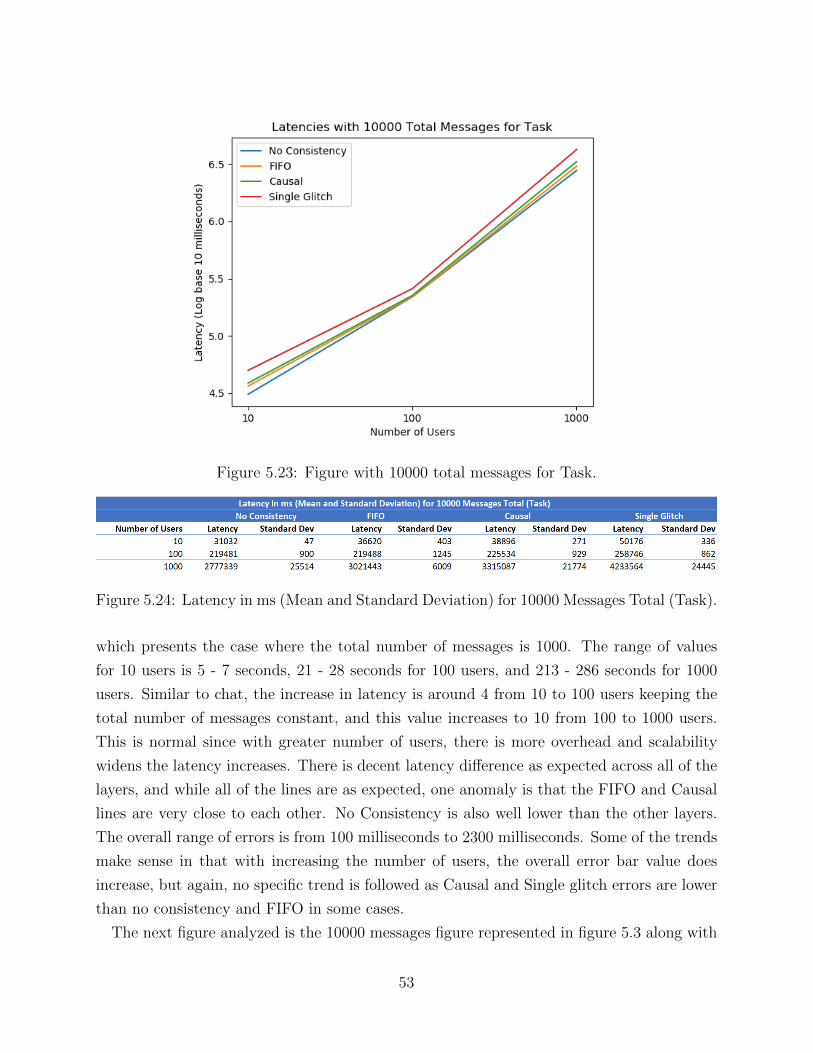
Figure 5.23: Figure with 10000 total messages for Task.
Figure 5.24: Latency in ms (Mean and Standard Deviation) for 10000 Messages Total (Task).
which presents the case where the total number of messages is 1000. The range of values
for 10 users is 5 - 7 seconds, 21 - 28 seconds for 100 users, and 213 - 286 seconds for 1000
users. Similar to chat, the increase in latency is around 4 from 10 to 100 users keeping the
total number of messages constant, and this value increases to 10 from 100 to 1000 users.
This is normal since with greater number of users, there is more overhead and scalability
widens the latency increases. There is decent latency difference as expected across all of the
layers, and while all of the lines are as expected, one anomaly is that the FIFO and Causal
lines are very close to each other. No Consistency is also well lower than the other layers.
The overall range of errors is from 100 milliseconds to 2300 milliseconds. Some of the trends
make sense in that with increasing the number of users, the overall error bar value does
increase, but again, no specific trend is followed as Causal and Single glitch errors are lower
than no consistency and FIFO in some cases.
The next figure analyzed is the 10000 messages figure represented in figure 5.3 along with
53
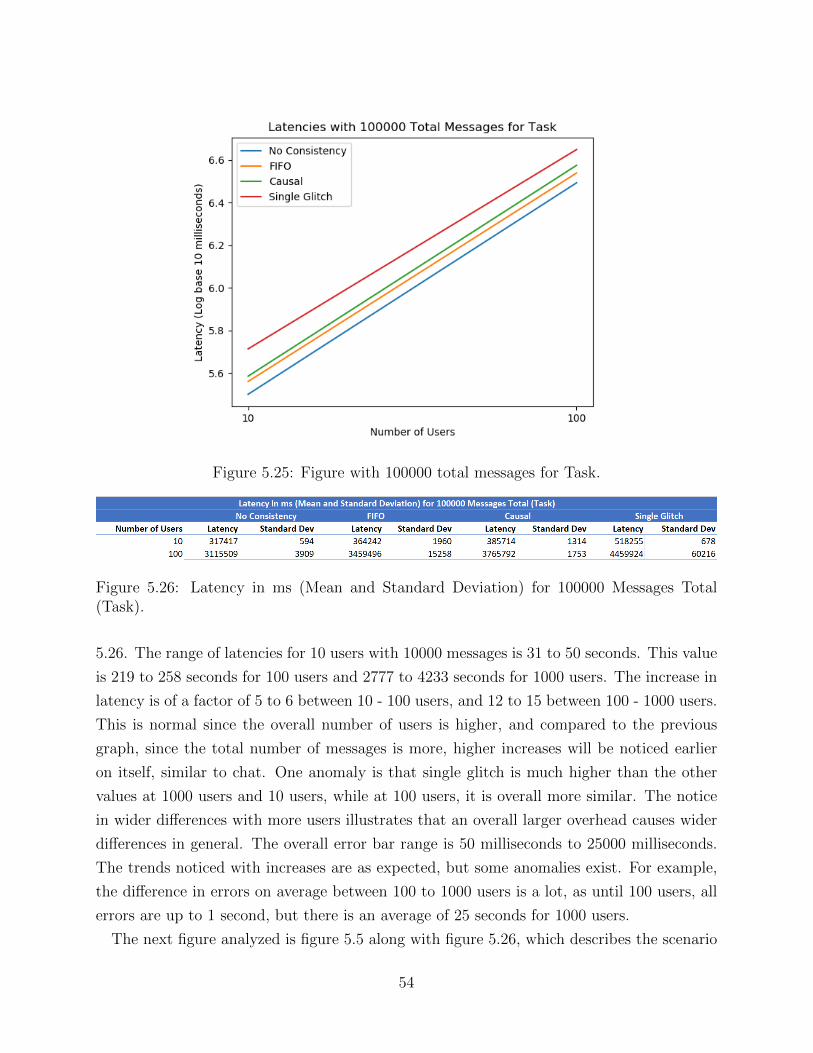
Figure 5.25: Figure with 100000 total messages for Task.
Figure 5.26: Latency in ms (Mean and Standard Deviation) for 100000 Messages Total(Task).
5.26. The range of latencies for 10 users with 10000 messages is 31 to 50 seconds. This value
is 219 to 258 seconds for 100 users and 2777 to 4233 seconds for 1000 users. The increase in
latency is of a factor of 5 to 6 between 10 - 100 users, and 12 to 15 between 100 - 1000 users.
This is normal since the overall number of users is higher, and compared to the previous
graph, since the total number of messages is more, higher increases will be noticed earlier
on itself, similar to chat. One anomaly is that single glitch is much higher than the other
values at 1000 users and 10 users, while at 100 users, it is overall more similar. The notice
in wider differences with more users illustrates that an overall larger overhead causes wider
differences in general. The overall error bar range is 50 milliseconds to 25000 milliseconds.
The trends noticed with increases are as expected, but some anomalies exist. For example,
the difference in errors on average between 100 to 1000 users is a lot, as until 100 users, all
errors are up to 1 second, but there is an average of 25 seconds for 1000 users.
The next figure analyzed is figure 5.5 along with figure 5.26, which describes the scenario
54
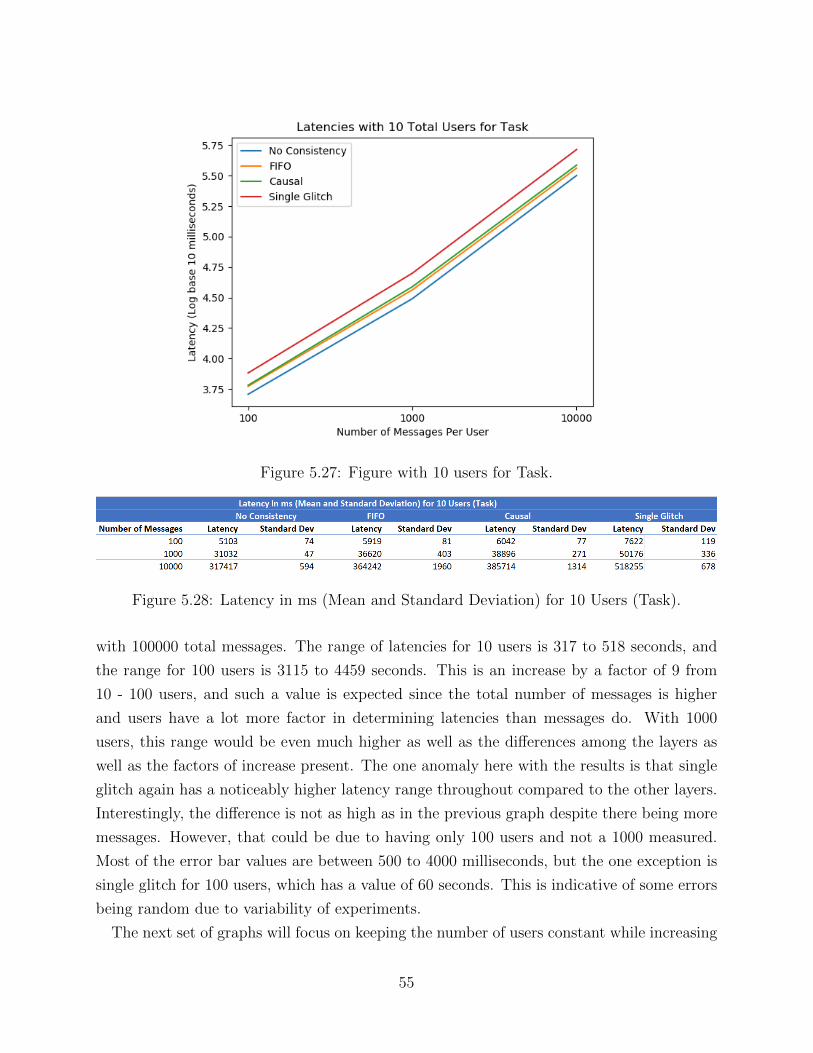
Figure 5.27: Figure with 10 users for Task.
Figure 5.28: Latency in ms (Mean and Standard Deviation) for 10 Users (Task).
with 100000 total messages. The range of latencies for 10 users is 317 to 518 seconds, and
the range for 100 users is 3115 to 4459 seconds. This is an increase by a factor of 9 from
10 - 100 users, and such a value is expected since the total number of messages is higher
and users have a lot more factor in determining latencies than messages do. With 1000
users, this range would be even much higher as well as the differences among the layers as
well as the factors of increase present. The one anomaly here with the results is that single
glitch again has a noticeably higher latency range throughout compared to the other layers.
Interestingly, the difference is not as high as in the previous graph despite there being more
messages. However, that could be due to having only 100 users and not a 1000 measured.
Most of the error bar values are between 500 to 4000 milliseconds, but the one exception is
single glitch for 100 users, which has a value of 60 seconds. This is indicative of some errors
being random due to variability of experiments.
The next set of graphs will focus on keeping the number of users constant while increasing
55
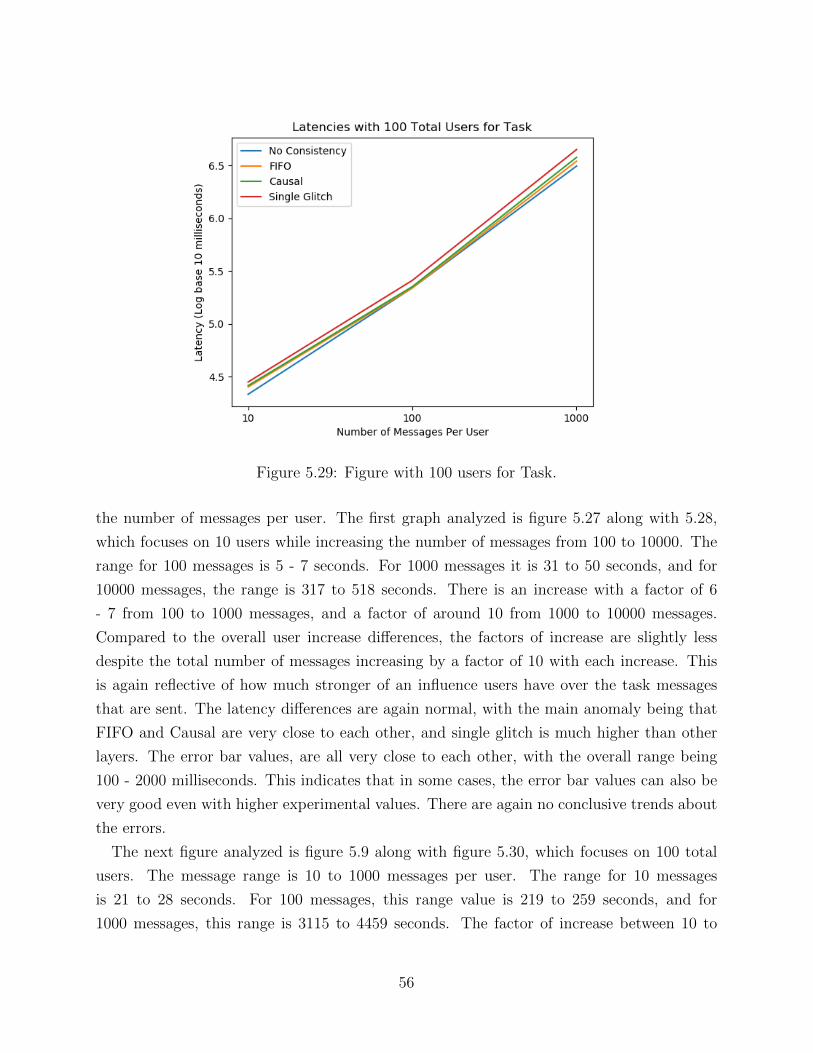
Figure 5.29: Figure with 100 users for Task.
the number of messages per user. The first graph analyzed is figure 5.27 along with 5.28,
which focuses on 10 users while increasing the number of messages from 100 to 10000. The
range for 100 messages is 5 - 7 seconds. For 1000 messages it is 31 to 50 seconds, and for
10000 messages, the range is 317 to 518 seconds. There is an increase with a factor of 6
- 7 from 100 to 1000 messages, and a factor of around 10 from 1000 to 10000 messages.
Compared to the overall user increase differences, the factors of increase are slightly less
despite the total number of messages increasing by a factor of 10 with each increase. This
is again reflective of how much stronger of an influence users have over the task messages
that are sent. The latency differences are again normal, with the main anomaly being that
FIFO and Causal are very close to each other, and single glitch is much higher than other
layers. The error bar values, are all very close to each other, with the overall range being
100 - 2000 milliseconds. This indicates that in some cases, the error bar values can also be
very good even with higher experimental values. There are again no conclusive trends about
the errors.
The next figure analyzed is figure 5.9 along with figure 5.30, which focuses on 100 total
users. The message range is 10 to 1000 messages per user. The range for 10 messages
is 21 to 28 seconds. For 100 messages, this range value is 219 to 259 seconds, and for
1000 messages, this range is 3115 to 4459 seconds. The factor of increase between 10 to
56
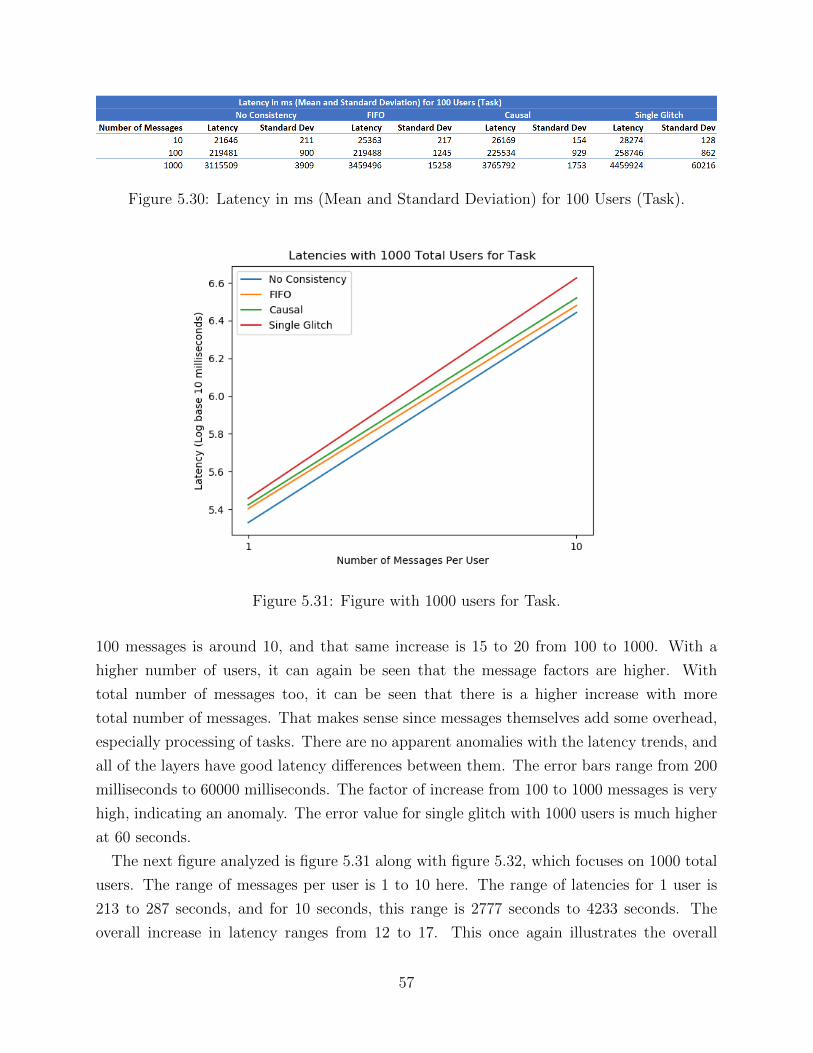
Figure 5.30: Latency in ms (Mean and Standard Deviation) for 100 Users (Task).
Figure 5.31: Figure with 1000 users for Task.
100 messages is around 10, and that same increase is 15 to 20 from 100 to 1000. With a
higher number of users, it can again be seen that the message factors are higher. With
total number of messages too, it can be seen that there is a higher increase with more
total number of messages. That makes sense since messages themselves add some overhead,
especially processing of tasks. There are no apparent anomalies with the latency trends, and
all of the layers have good latency differences between them. The error bars range from 200
milliseconds to 60000 milliseconds. The factor of increase from 100 to 1000 messages is very
high, indicating an anomaly. The error value for single glitch with 1000 users is much higher
at 60 seconds.
The next figure analyzed is figure 5.31 along with figure 5.32, which focuses on 1000 total
users. The range of messages per user is 1 to 10 here. The range of latencies for 1 user is
213 to 287 seconds, and for 10 seconds, this range is 2777 seconds to 4233 seconds. The
overall increase in latency ranges from 12 to 17. This once again illustrates the overall
57
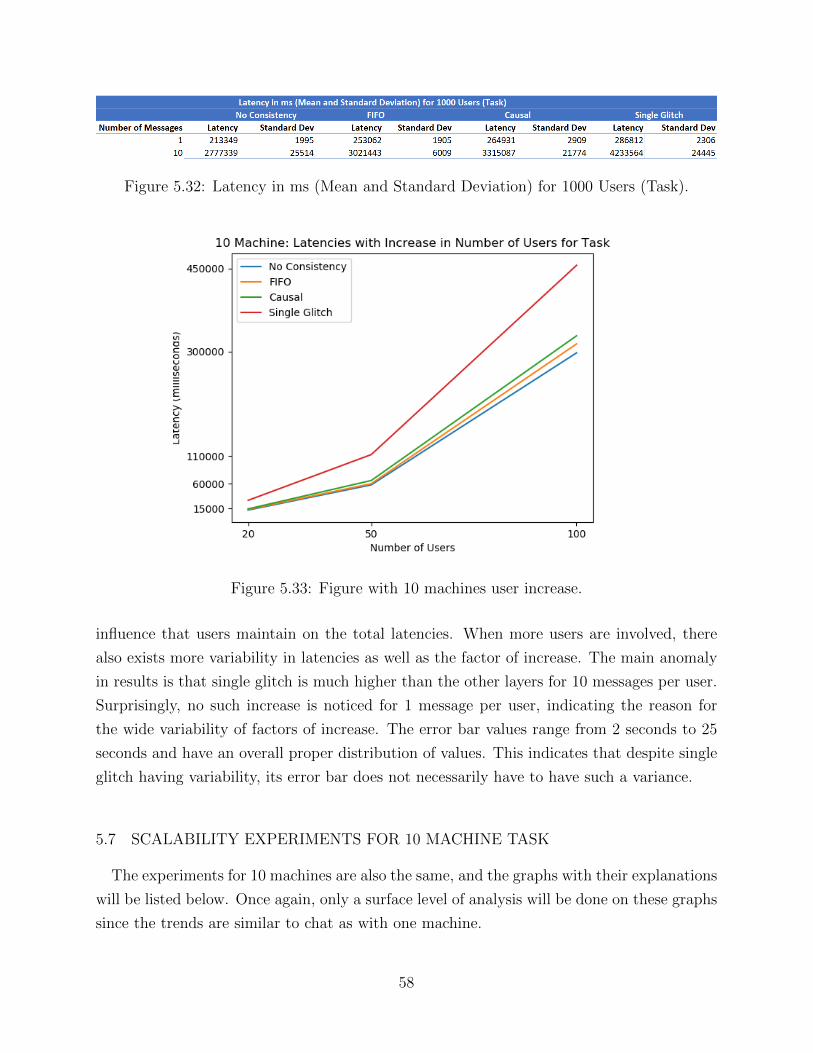
Figure 5.32: Latency in ms (Mean and Standard Deviation) for 1000 Users (Task).
Figure 5.33: Figure with 10 machines user increase.
influence that users maintain on the total latencies. When more users are involved, there
also exists more variability in latencies as well as the factor of increase. The main anomaly
in results is that single glitch is much higher than the other layers for 10 messages per user.
Surprisingly, no such increase is noticed for 1 message per user, indicating the reason for
the wide variability of factors of increase. The error bar values range from 2 seconds to 25
seconds and have an overall proper distribution of values. This indicates that despite single
glitch having variability, its error bar does not necessarily have to have such a variance.
5.7 SCALABILITY EXPERIMENTS FOR 10 MACHINE TASK
The experiments for 10 machines are also the same, and the graphs with their explanations
will be listed below. Once again, only a surface level of analysis will be done on these graphs
since the trends are similar to chat as with one machine.
58
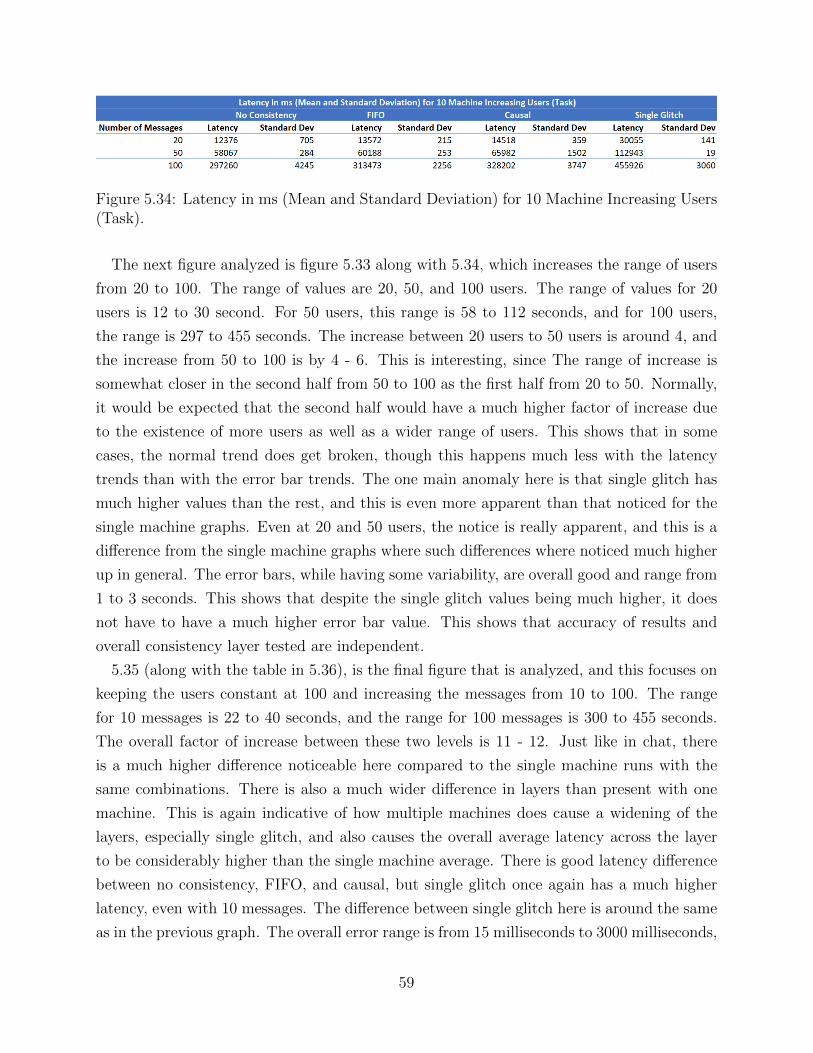
Figure 5.34: Latency in ms (Mean and Standard Deviation) for 10 Machine Increasing Users(Task).
The next figure analyzed is figure 5.33 along with 5.34, which increases the range of users
from 20 to 100. The range of values are 20, 50, and 100 users. The range of values for 20
users is 12 to 30 second. For 50 users, this range is 58 to 112 seconds, and for 100 users,
the range is 297 to 455 seconds. The increase between 20 users to 50 users is around 4, and
the increase from 50 to 100 is by 4 - 6. This is interesting, since The range of increase is
somewhat closer in the second half from 50 to 100 as the first half from 20 to 50. Normally,
it would be expected that the second half would have a much higher factor of increase due
to the existence of more users as well as a wider range of users. This shows that in some
cases, the normal trend does get broken, though this happens much less with the latency
trends than with the error bar trends. The one main anomaly here is that single glitch has
much higher values than the rest, and this is even more apparent than that noticed for the
single machine graphs. Even at 20 and 50 users, the notice is really apparent, and this is a
difference from the single machine graphs where such differences where noticed much higher
up in general. The error bars, while having some variability, are overall good and range from
1 to 3 seconds. This shows that despite the single glitch values being much higher, it does
not have to have a much higher error bar value. This shows that accuracy of results and
overall consistency layer tested are independent.
5.35 (along with the table in 5.36), is the final figure that is analyzed, and this focuses on
keeping the users constant at 100 and increasing the messages from 10 to 100. The range
for 10 messages is 22 to 40 seconds, and the range for 100 messages is 300 to 455 seconds.
The overall factor of increase between these two levels is 11 - 12. Just like in chat, there
is a much higher difference noticeable here compared to the single machine runs with the
same combinations. There is also a much wider difference in layers than present with one
machine. This is again indicative of how multiple machines does cause a widening of the
layers, especially single glitch, and also causes the overall average latency across the layer
to be considerably higher than the single machine average. There is good latency difference
between no consistency, FIFO, and causal, but single glitch once again has a much higher
latency, even with 10 messages. The difference between single glitch here is around the same
as in the previous graph. The overall error range is from 15 milliseconds to 3000 milliseconds,
59
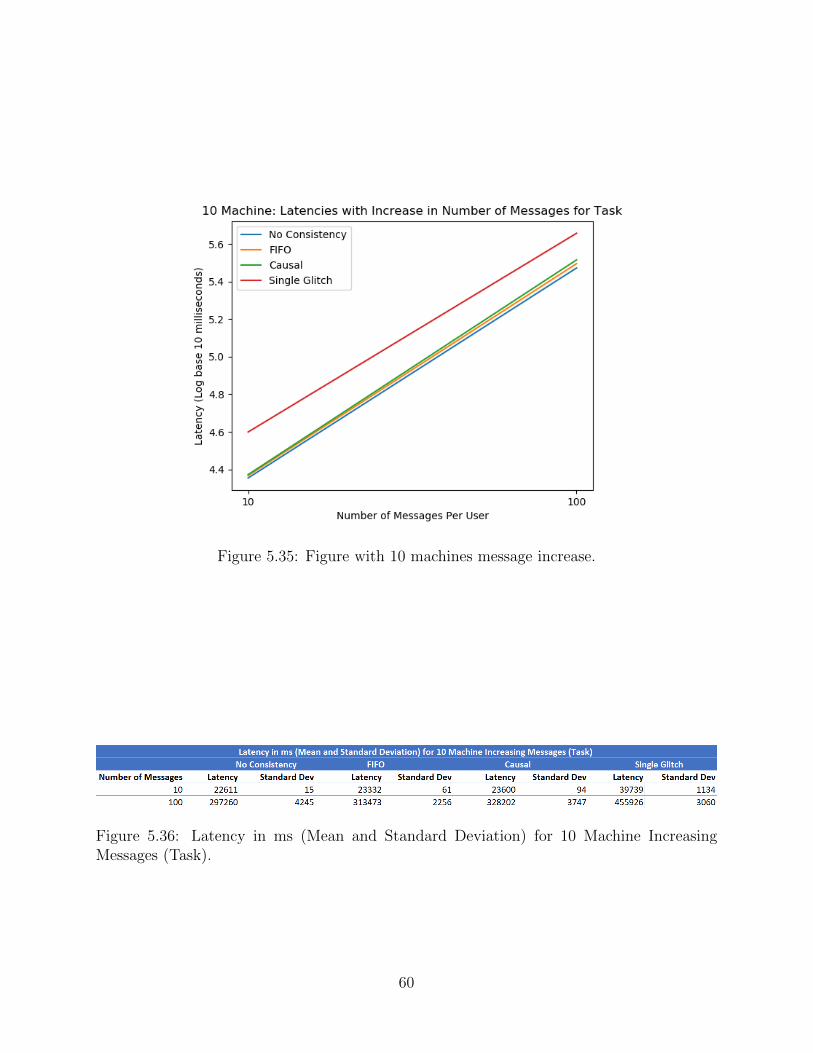
Figure 5.35: Figure with 10 machines message increase.
Figure 5.36: Latency in ms (Mean and Standard Deviation) for 10 Machine IncreasingMessages (Task).
60
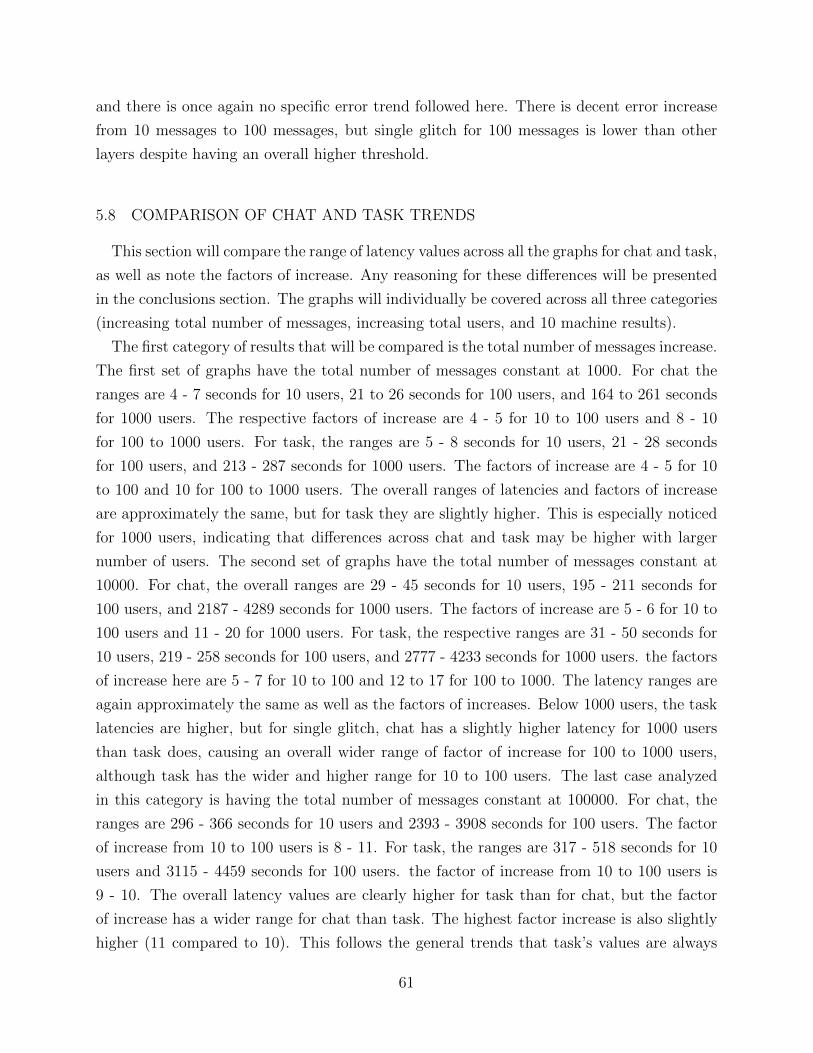
and there is once again no specific error trend followed here. There is decent error increase
from 10 messages to 100 messages, but single glitch for 100 messages is lower than other
layers despite having an overall higher threshold.
5.8 COMPARISON OF CHAT AND TASK TRENDS
This section will compare the range of latency values across all the graphs for chat and task,
as well as note the factors of increase. Any reasoning for these differences will be presented
in the conclusions section. The graphs will individually be covered across all three categories
(increasing total number of messages, increasing total users, and 10 machine results).
The first category of results that will be compared is the total number of messages increase.
The first set of graphs have the total number of messages constant at 1000. For chat the
ranges are 4 - 7 seconds for 10 users, 21 to 26 seconds for 100 users, and 164 to 261 seconds
for 1000 users. The respective factors of increase are 4 - 5 for 10 to 100 users and 8 - 10
for 100 to 1000 users. For task, the ranges are 5 - 8 seconds for 10 users, 21 - 28 seconds
for 100 users, and 213 - 287 seconds for 1000 users. The factors of increase are 4 - 5 for 10
to 100 and 10 for 100 to 1000 users. The overall ranges of latencies and factors of increase
are approximately the same, but for task they are slightly higher. This is especially noticed
for 1000 users, indicating that differences across chat and task may be higher with larger
number of users. The second set of graphs have the total number of messages constant at
10000. For chat, the overall ranges are 29 - 45 seconds for 10 users, 195 - 211 seconds for
100 users, and 2187 - 4289 seconds for 1000 users. The factors of increase are 5 - 6 for 10 to
100 users and 11 - 20 for 1000 users. For task, the respective ranges are 31 - 50 seconds for
10 users, 219 - 258 seconds for 100 users, and 2777 - 4233 seconds for 1000 users. the factors
of increase here are 5 - 7 for 10 to 100 and 12 to 17 for 100 to 1000. The latency ranges are
again approximately the same as well as the factors of increases. Below 1000 users, the task
latencies are higher, but for single glitch, chat has a slightly higher latency for 1000 users
than task does, causing an overall wider range of factor of increase for 100 to 1000 users,
although task has the wider and higher range for 10 to 100 users. The last case analyzed
in this category is having the total number of messages constant at 100000. For chat, the
ranges are 296 - 366 seconds for 10 users and 2393 - 3908 seconds for 100 users. The factor
of increase from 10 to 100 users is 8 - 11. For task, the ranges are 317 - 518 seconds for 10
users and 3115 - 4459 seconds for 100 users. the factor of increase from 10 to 100 users is
9 - 10. The overall latency values are clearly higher for task than for chat, but the factor
of increase has a wider range for chat than task. The highest factor increase is also slightly
higher (11 compared to 10). This follows the general trends that task’s values are always
61
somewhat higher than chat’s values, but that does not necessarily have any implication on
what the factors of increase should be and how wide that range is.
The next category of results focuses on increasing the number of users. The first set of
graphs have the number of users at 10. For chat, the range of values are 4 - 7 seconds for
100 messages, 29 - 45 seconds for 1000 messages, and 296 - 466 seconds for 10000 messages.
The factors of increase are around 7 for 100 to 1000 messages and 10 for 1000 to 10000
messages. For task, the range of values are 5 - 8 seconds for 100 messages, 31 - 50 seconds
for 1000 messages, and 317 - 518 seconds for 10000 messages. The factors of increase here
are around 6 for 100 to 1000 messages and 10 for 1000 to 10000 messages. As usual, task
has slightly higher overall latencies. The factors of increase are the same for 1000 to 10000
messages, and task’s factor of increase is slightly higher for 100 to 1000 messages. The next
set of graphs analyzed has the total number of users at 100. The range of values for chat are
21 - 26 seconds for 10 messages, 195 - 210 seconds for 100 messages, and 2393 - 3908 seconds
for 1000 messages. The factors of increase are 8 - 10 for 10 to 100 messages and 12 - 19 for
100 to 1000 messages. For task, the range of values are 21 - 28 seconds for 10 messages,
219 - 258 seconds for 100 messages, and 3115 - 4459 seconds for 1000 messages. The factors
of increase here are 9 - 10 for 10 to 100 messages and 14 - 17 for 100 to 1000 messages.
As usual, task has the overall higher latencies as well as range of latencies in general. The
factor of increase for task is higher for 10 to 100 messages, but chat has a wider range. For
100 to 1000 messages, chat has a much wider range as well as a higher factor of increase. In
general, it is noted that chat’s overall factors of increase are slightly higher than task’s when
scaled higher up. The last set of graphs analyzed are the case where the number of users is
1000. The range of values for chat are 164 - 261 seconds for 1 user and 2187 - 4289 seconds
for 10 users. The factor of increase range is 13 - 16. For task, the range of values are 213
- 286 seconds for 1 user and 2777 - 4233 seconds for 10 users. The factor of increase is 13
- 15. As usual, task’s latencies are higher as well as the overall range of values. The factor
of range increase is again slightly higher for chat, but in this case, the single glitch value for
chat with 10 messages is slightly higher than task’s value.
The final category of results consists of the 10 machine results. The first set of graphs
analyzed will be the case where the number of users increases with the number of messages
per user being 100. The range of values for chat are 39 - 48 seconds for 20 users, 101 -
151 seconds for 50 users, and 255 - 523 seconds for 100 users. The factors of increase are
2.5 - 3 for 20 to 50 users and 2.5 - 3.5 for 50 to 100 users. The range of values for task
are 12 - 30 seconds for 20 users, 58 - 112 seconds for 50 users, and 297 - 455 seconds for
100 users. The factors of increase for task are 4 - 5 for 20 to 50 users and 4 - 5 for 50 to
100 users. In this case, the opposite scenario of what usually occurs has happened, where
62
chat’s overall latencies are higher, but factors of increase are lower. The next set of graphs
analyzed present the case where the number of messages is increased from 10 to 100. For
chat, the range of values are 21 - 41 seconds for 10 messages and 255 - 523 seconds for 100
messages. The factor of increase range here is 12 - 13. For task, the range of values are 22 -
39 seconds for 10 messages and 297 - 455 seconds for 100 messages. The factor of increase
range here is 12 - 13. This is one of the few instances where the factor of increase ranges
have the same value. The latencies are still higher for chat than task, though not as much
as for the previous graph.
Overall, the latencies for task are noticeably higher than for chat with the exception of 10
machine results. The factor of increases in general are slightly higher for chat and have a
wider range than for task, though there seems to be no explicit rule to illustrate this, as task
still did have overall wider range of latency values. Reasons for this will be illustrated in the
next section. This concludes the overall results section, and the next section will focus on
analysis of reasons as to why these results are what they are.
63
CHAPTER 6: CONCLUSION DRAWN FROM RESULTS
6.1 OVERVIEW
Both chat and task application have interesting results that provide implications for dis-
tributed programming as well as various consistency levels. The results of this paper have
implications for event driven programming. From the conclusions drawn in the previous
section, various findings exist, as well as reasons for those findings. These would help with
future such experiments, and serve as motivations and guides for other similar projects. In
all cases, the overall latency results are as one would expect. The stricter the consistency
requirement, the longer the latency. Moreover, as scaling happens, the costs are increased.
6.2 ANALYSIS OF OVERALL LATENCY BETWEEN DIFFERENT LAYERS
Within chat, a good amount of latency differences were noticed among the different layers.
The reason for these differences is that the higher up the consistency levels went, more
constraints were added. The 4 core processors used involved a lot of parallelism. Since with
no consistency, no constraints exist, the processor is free to use as much parallelism across
users as is possible, and that speeds up the program quite a bit. Parallelism is always done
across users, with multiple users handling the necessary messages at the same time. With
FIFO, a good amount of restriction is added, and whenever messages are received out of
order, users have to wait until the message is again in proper order. Multiple users would
have to wait sometimes, and this overall reduces parallelism since the waiting stops some
processes from running in parallel. As a result, the latency becomes slower. Similarly, causal
consistency adds in further restrictions, with users having to wait if a question comes out
of order, and this happens a decent amount. Lastly, single glitch is the most restrictive,
and a lot of parallelism is killed since all users have to process everything at once. Due to
that, the latency of single glitch is generally the lowest. Sometimes, causal could be faster if
less waiting on a question is involved, and this does happen sometimes when the questions
always come in proper order. Sometimes, variability does exist in results, and this could
be due to less waiting required overall, or small errors in runtime conditions that cause a
process to be faster sometimes than others, resulting in minor differences from the norm.
With regards to the task application, the latency differences are roughly similar to the chat
application. Decent difference between the layers noticeably exists, but one difference is that
there are cases when single glitch has a much higher latency than any of the other layers.
64
Even in chat, single glitch often had a more noticeable jump with some exceptions, but
that happens even more with task and with much higher differences. The main explanation
for this is that the users here have more overhead than in chat because they handle more
operations and also contain tasks. Tasks are more involved than messages and contain more
features, so this additional overhead causes further slowing when parallelism is restricted
more. Single glitch has parallelism restricted the most out of all the layers, hence the largest
latency. This becomes even more apparent with 10 machines when the additional network
latency is added and the parallelism is even further restricted with more machines, resulting
in the extreme latency differences noticed in the two graphs for single glitch.
6.3 ANALYSIS OF LATENCY INCREASES WITH SCALABILITY
With regards to chat, the general trends conclude that users have a much larger effect on
latency than messages do. This is because users are based on using Remote actors/Universal
actors, where the cost of serialization becomes heavy. Since users are heavy objects with
a lot of variables and operations, adding more users occupies more memory in the Server
instance that is running. Another important difference is that when a message is sent to
a speaker, it enters in a background queue, and this is asynchronous. Sending messages
to individual users however is not, so increasing the number of users messaged adds a lot
of additional overhead latency. When this number becomes larger for both messages and
number of users, as seen in the previous chapter, the factor increase is not proportional.
The overhead becomes larger and larger with greater numbers, so the extra space used slows
the latency down even further. With task, the overall trends noticed are approximately the
same and the reasons the same as well. Any differences that exist will be analyzed in the
differences between chat and task section.
6.4 ANALYSIS OF 10 MACHINE RESULTS
With chat, the overall parallelism gets affected with a greater number of machines. With
no consistency, the parallelism is smooth since no constraints are there to affect it. That is
why the network latency does not have much of an effect here and only begins to show with
100 users and 100 messages. With the other layers, the stalling effects cause the latency from
the network to be higher as well. While waiting on messages to arrive in proper order, the
network overhead also gains more significance, and thus widens the gap across consistency
levels. This becomes more and more apparent with a higher number of users and total
65
messages, causing lot more overhead. Once again, the task trends are the same along with
the reasons for them. Differences will be analyzed in the next section.
6.5 ANALYSIS OF TASK AND CHAT DIFFERENCES
The overall higher latencies present with task are due to the overhead involved with
sending a task message over a chat message. Tasks are larger objects than Strings, since
they consist of a string message, a username, as well as a task name. They also have
more operations associated with them. When the number of users gets scaled up especially,
these differences become more apparent. However, one exception is the case of 10 machines.
With 10 machines, there might have been variability in conditions that caused chat to have a
slightly higher latency than task. Task did also have a wider range of values, and that makes
sense since due to the overall overhead added by a task, parallelism would be impacted more.
There is also no necessary relationship explaining the latency and overall factor of increase,
but in general, the factors of increase are around the same ballpark value even if slightly
different.
6.6 BRIEF ANALYSIS OF LATENCY OPTIMIZATIONS
The case study did present some interesting results, lot of which can be explained by the
user overhead illustrated in prior sections. With a greater number of users, more overhead
is involved in sending messages, and that overhead takes over the processing time involved.
As a result, sleep latency matters less at lower levels with more users. However, higher sleep
latencies do affect parallelism more with more users, and as a result, more variability exists
among the different consistency levels.
6.7 BRIEF ANALYSIS OF VARIANCE OF OBSERVATIONS
With errors, there are no specific trends that exist. The general trend that exists that
the higher number of total messages leads to higher errors makes sense as more variability
would exist then. However, lot of variables in runtime conditions exist, CPU speed being
a part of one of them. That is why in some instances, runs are very accurate and precise
despite there being a greater number of messages, breaking that overall rule. That is also
why no specific rule across different consistency layers exists.
66
6.8 OVERALL ANALYSIS OF LAYERS AND IMPLICATIONS
Overall, it is concluded that the layers do have noticeable latency differences between them
with single glitch having the highest difference compared to any of the previous layers. All of
these layers are useful and serve some purpose with the distributed applications presented in
this paper. Based on the trends that follow, it can be estimated that the difference between
single glitch and complete glitch would not be as noticeable as that between causal and
single glitch. This is due to complete glitch not adding a massive layer of restriction since
the restrictions are across how individual users receive information. However, the difference
between complete glitch and atomicity would be very high. Atomicity makes parallelism
almost nonexistent on the receiving end, since everything received is processed at the same
time. Analysis of layers could be done with distributed applications that do not have a
server-client architecture present too, and it would be interesting to note how they perform
there. All of these layers present useful cases for all sorts of applications, and eventually,
once enough projects are done, machine learning could be used to estimate latencies for
layers without actually implementing the project itself.
6.9 IMPLICATIONS FOR EVENT DRIVEN PROGRAMMING
This project has good implications for event driven programming. This would eventually
become part of a model that can create such distributed applications on its own given a set
of parameters from an event model. All parts of this application fit in perfectly in order
to create such a model. The main program itself would be part of a model, and then the
latencies could also be predicted and presented to the user. This matters a lot because the
user does not have to manually calculate latencies or implement an application. The user can
decide on restrictions and let the entire system handle all of the back-end work. This would
reduce time drastically and can be vastly expanded upon to multiple types of distributed
projects as well as larger ones.
67
CHAPTER 7: FUTURE WORK
7.1 OVERVIEW
Future work includes expanding this project as well using aspects of actors that have not
been included. Some of these expansions involve completing the event driven programming
model as well for this type of project. Other consistency levels exist as well, and those layers
could also be presented for analysis.
7.2 EXPANSION OF PROJECT
Expanding this project consists of creating a user interface system, which communicates
with the users as to what type of consistency layer they would want and which application
they would wish to use or have implemented. The users would present their consistency
layer requirements for a certain application, and then the overall latency averages for each
layer would be displayed. Lastly, the user would decide what layer he/she would want imple-
mented. More such server client architecture based applications could also be implemented,
as well as applications of other types such as aggregation. Once enough such applications
are implemented, a full event model based protocol can be created that would take in the
application a user wants implemented along with various specifications, and then manually
implement the application. Once enough analysis of layers in all of those applications is
performed, a generic consistency model that would output specific latencies given a certain
project description could also be created. For that, lot more analysis would need to be done.
Projects can be categorized by distributed topic as well. One other extension of this project
is to implement the two layers presented in [22] that were not completely implemented,
and they are complete glitch freedom and atomicity. Performing analysis of these two lay-
ers as well as finding use cases for these would be interesting and relevant to distributed
programming.
7.3 CONCEPTUAL EXPANSIONS AND OTHER TOPICS
Other conceptual expansions for the project also exist, and these may pertain to other new
works that could also be completed. One aspect is that not all aspects of the actor model
were used and analyzed within this project. Some aspects are mentioned in the SALSA
programming language tutorial [13]. These include aspects such as applications where actors
68
become disconnected, actors need to be part of garbage collection, and reconfiguration is
a component. This overall helps provide a more comprehensive view and understanding of
the actor model and also creates more widespread uses of the main application within this
project. Applications could be more dynamic as well, and some ideas for this are presented
in [17]. Lastly, other consistency levels with slightly different conceptual ideas are presented
in [25], and these could be implemented and compared with the layers implemented in this
paper for comparison and analysis. This overall concludes this section as well as this paper.
69
REFERENCES
[1] G.-L. Chen, G.-Z. Sun, Y.-Q. Zhang, and Z.-Y. Mo, “Study on parallel computing,”Journal of Computer Science and Technology, vol. 21, no. 5, pp. 665–673, Sep 2006.[Online]. Available: https://doi.org/10.1007/s11390-006-0665-9
[2] J. Dean and S. Ghemawat, “Mapreduce: Simplified data processing on large clusters,”in OSDI’04: Sixth Symposium on Operating System Design and Implementation, SanFrancisco, CA, 2004, pp. 137–150.
[3] Stankovic, “A perspective on distributed computer systems,” IEEE Transactions onComputers, vol. C-33, no. 12, pp. 1102–1115, Dec 1984.
[4] Y. Yu, P. K. Gunda, and M. Isard, “Distributed aggregation for data-parallel computing: Interfaces and implementations,” in ACM Symposiumon Operating Systems Principles (SOSP), October 2009. [Online]. Avail-able: https://www.microsoft.com/en-us/research/publication/distributed-aggregation-for-data-parallel-computing-interfaces-and-implementations/ pp. 247–260.
[5] M. Bertocco, F. Ferraris, C. Offelli, and M. Parvis, “A client-server architecture fordistributed measurement systems,” IEEE Transactions on Instrumentation and Mea-surement, vol. 47, no. 5, pp. 1143–1148, Oct 1998.
[6] A. R. Bharambe, J. W. L. Pang, and S. Seshan, “A distributed architecture for inter-active multiplayer games,” 2005.
[7] A. Reuther, P. Michaleas, A. Prout, and J. Kepner, “Hpc-vms: Virtual machines inhigh performance computing systems,” 09 2012, pp. 1–6.
[8] A. Rydzewski and P. Czarnul, “A distributed system for conducting chess games inparallel,” Procedia Comput. Sci., vol. 119, no. C, pp. 22–29, Dec. 2017. [Online].Available: https://doi.org/10.1016/j.procs.2017.11.156
[9] T. Ben-Nun and T. Hoefler, “Demystifying parallel and distributed deep learning: Anin-depth concurrency analysis,” ACM Comput. Surv., vol. 52, no. 4, pp. 65:1–65:43,Aug. 2019. [Online]. Available: http://doi.acm.org/10.1145/3320060
[10] G. Agha, Actors: A Model of Concurrent Computation in Distributed Systems. Cam-bridge, MA, USA: MIT Press, 1986.
[11] G. Agha, I. A. Mason, S. Smith, and C. Talcott, “Towards a theory of actor compu-tation,” in CONCUR ’92, W. Cleaveland, Ed. Berlin, Heidelberg: Springer BerlinHeidelberg, 1992, pp. 565–579.
[12] M. Odersky, P. Altherr, V. Cremet, I. Dragos, G. Dubochet, B. Emir, S. McDirmid,S. Micheloud, N. Mihaylov, M. Schinz, E. Stenman, L. Spoon, and M. Zenger, “Anoverview of the scala programming language second edition,” 2006.
70
[13] C. A. Varela, G. Agha, W. Wang, T. Desell, K. E. Maghraoui, J. LaPorte, andA. Stephens, “The SALSA programming language: 1.1.2 release tutorial,” Dept. ofComputer Science, R.P.I., Tech. Rep. 07-12, Feb. 2007.
[14] A. Shali and C. Lin, “Actor oriented programming in chapel,” 2010.
[15] J. De Koster, T. Van Cutsem, and W. De Meuter, “43 years of actors: Ataxonomy of actor models and their key properties,” in Proceedings of the 6thInternational Workshop on Programming Based on Actors, Agents, and DecentralizedControl, ser. AGERE 2016. New York, NY, USA: ACM, 2016. [Online]. Available:http://doi.acm.org/10.1145/3001886.3001890 pp. 31–40.
[16] D. Charousset, R. Hiesgen, and T. C. Schmidt, “Revisiting actor programming in C++,”CoRR, vol. abs/1505.07368, 2015. [Online]. Available: http://arxiv.org/abs/1505.07368
[17] W. Kim and G. Agha, “Efficient support of location transparency in concurrentobject-oriented programming languages,” in Proceedings of the 1995 ACM/IEEEConference on Supercomputing, ser. Supercomputing ’95. New York, NY, USA: ACM,1995. [Online]. Available: http://doi.acm.org/10.1145/224170.224297
[18] S. Tasharofi, R. K. Karmani, S. Lauterburg, A. Legay, D. Marinov, and G. A. Agha,“Transdpor: A novel dynamic partial-order reduction technique for testing actor pro-grams,” in FMOODS/FORTE, 2012.
[19] M. Sirjani and M. M. Jaghoori, Ten Years of Analyzing Actors: Rebeca Experience.Berlin, Heidelberg: Springer Berlin Heidelberg, 2011, pp. 20–56. [Online]. Available:https://doi.org/10.1007/978-3-642-24933-4-3
[20] P. Jogalekar and M. Woodside, “Evaluating the scalability of distributed systems,”IEEE Transactions on Parallel and Distributed Systems, vol. 11, no. 6, pp. 589–603,June 2000.
[21] B. Chandramouli, J. Goldstein, R. Barga, M. Riedewald, and I. Santos, “Accuratelatency estimation in a distributed event processing system,” in 2011 IEEE 27th Inter-national Conference on Data Engineering, April 2011, pp. 255–266.
[22] A. Margara and G. Salvaneschi, “On the semantics of distributed reactive programming:The cost of consistency,” IEEE Transactions on Software Engineering, vol. 44, no. 7,pp. 689–711, July 2018.
[23] G. Salvaneschi, S. Proksch, S. Amann, S. Nadi, and M. Mezini, “On the positive ef-fect of reactive programming on software comprehension: An empirical study,” IEEETransactions on Software Engineering, vol. 43, no. 12, pp. 1125–1143, Dec 2017.
[24] P. Weisenburger, M. Kohler, and G. Salvaneschi, “Distributed system developmentwith scalaloci,” Proc. ACM Program. Lang., vol. 2, no. OOPSLA, pp. 129:1–129:30,Oct. 2018. [Online]. Available: http://doi.acm.org/10.1145/3276499
71
[25] D. Perkins, N. Agrawal, A. Aranya, C. Yu, Y. Go, H. V. Madhyastha, and C. Ungureanu,“Simba: Tunable end-to-end data consistency for mobile apps,” in Proceedings of theTenth European Conference on Computer Systems, ser. EuroSys ’15. New York, NY,USA: ACM, 2015. [Online]. Available: http://doi.acm.org/10.1145/2741948.2741974pp. 7:1–7:16.
[26] Y. Long, M. Bagherzadeh, E. Lin, G. Upadhyaya, and H. Rajan, “Quantification ofsequential consistency in actor-like systems: An exploratory study,” 2014.
[27] S. H. Mortazavi, B. Balasubramanian, E. de Lara, and S. P. Narayanan, “Towardsession consistency for the edge,” in USENIX Workshop on Hot Topics in EdgeComputing (HotEdge 18). Boston, MA: USENIX Association, July 2018. [Online].Available: https://www.usenix.org/conference/hotedge18/presentation/mortazavi
[28] A. Milicevic, D. Jackson, M. Gligoric, and D. Marinov, “Model-based, event-drivenprogramming paradigm for interactive web applications,” in Proceedings of the 2013ACM International Symposium on New Ideas, New Paradigms, and Reflections onProgramming & Software, ser. Onward! 2013. New York, NY, USA: ACM, 2013.[Online]. Available: http://doi.acm.org/10.1145/2509578.2509588 pp. 17–36.
[29] P. Jesus, C. Baquero, and P. S. Almeida, “A survey of distributed data aggregationalgorithms,” 2011.
[30] H. Harb, A. Makhoul, S. Tawbi, and R. Couturier, “Comparison of different data aggre-gation techniques in distributed sensor networks,” IEEE Access, vol. 5, pp. 4250–4263,2017.
[31] H. Chan, H.-C. Hsiao, A. Perrig, and D. Song, “Secure distributed data aggregation,”Found. Trends databases, vol. 3, no. 3, pp. 149–201, Mar. 2011. [Online]. Available:http://dx.doi.org/10.1561/1900000025
[32] D. Kempe, A. Dobra, and J. Gehrke, “Gossip-based computation of aggregate infor-mation,” in 44th Annual IEEE Symposium on Foundations of Computer Science, 2003.Proceedings., Oct 2003, pp. 482–491.
72