conservation of grasshopper diversity in a changing environment
TRANSCRIPT
B I O L O G I C A L C O N S E R V A T I O N 1 3 8 ( 2 0 0 7 ) 3 6 0 – 3 7 0
. sc iencedi rec t .com
ava i lab le at wwwjournal homepage: www.elsevier .com/ locate /b iocon
Conservation of grasshopper diversity in a changingenvironment
Claude E. Stecka,b,*, Matthias Burgib, Janine Bolligerb, Felix Kienastb,Anthony Lehmannc,d, Yves Gonsethc
aNature and Landscape Protection, Swiss Federal Institute of Technology Zurich (ETH), CH-8092 Zurich, SwitzerlandbSwiss Federal Research Institute WSL, Zurcherstrasse 111, CH-8903 Birmensdorf, SwitzerlandcSwiss Centre for Faunal Cartography (CSCF), Terreaux 14, CH-2000 Neuchatel, SwitzerlanddUniversite de Geneve, Site de Battelle (IAUG), 7 Route de Drize, CH-1227 Carouge, Switzerland
A R T I C L E I N F O
Article history:
Received 18 September 2006
Received in revised form
24 April 2007
Accepted 7 May 2007
Available online 28 June 2007
Keywords:
Species richness
Hotspots
Land-use change
Climate change
Scenario
GAM
0006-3207/$ - see front matter � 2007 Elsevidoi:10.1016/j.biocon.2007.05.001
* Corresponding author: Address: Swiss Fede44 739 2692; fax: +41 44 739 2254.
E-mail addresses: [email protected]@wsl.ch (F. Kienast), anthony.leh
A B S T R A C T
Land-use change is a major driver for changes in biodiversity. In this study, we investigated
how the objectives of two conservation strategies (large-scale conservation of species rich-
ness versus conservation of diversity hotspots) can be achieved for grasshopper diversity
under different scenarios of environmental change (land-use and climate change).
Based on surveys of 95 grasshopper species from 2001 to 2004 recorded by the Swiss Cen-
tre for Faunal Cartography, we modelled the actual richness pattern as a function of differ-
ent environmental variables. The impact of potential future environmental change on
species richness was evaluated by applying four land-use scenarios (‘liberalization’, ‘busi-
ness as usual’, ‘lowered agricultural production’, and ‘complete conversion of intensive
open land’) and one climate change scenario. The effects of the scenarios were assessed
at the national scale, as well as on small-scale hotspots.
Environmental change has considerable effect on grasshopper species richness. At the
national scale, the number of grasshopper species decreased under the ‘liberalization’ sce-
nario (�0.24 species per 1 ha pixel) and increased under a climate change scenario (+0.63
species per 1 ha pixel). For most environmental change scenarios, species richness in
small-scale hotspots was more negatively affected than on average on the national scale.
The response of species richness to the scenarios did not differ significantly between hot-
spots of endangered and the hotspots of common grasshopper species.
We conclude that conservation efforts at the national scale and small-scale hotspot con-
servation programs should be combined to conserve species richness most successfully.
For the long-term conservation of species richness, common species as well as the com-
bined effects of land-use and climate change have to be considered.
� 2007 Elsevier Ltd. All rights reserved.
er Ltd. All rights reserved.
ral Research Institute WSL, Zurcherstrasse 111, CH-8903 Birmensdorf, Switzerland. Tel.: +41
(C.E. Steck), [email protected] (M. Burgi), [email protected] (J. Bolliger),[email protected] (A. Lehmann), [email protected] (Y. Gonseth).

B I O L O G I C A L C O N S E R V A T I O N 1 3 8 ( 2 0 0 7 ) 3 6 0 – 3 7 0 361
1. Introduction
Human-induced landscape change can enhance local and re-
gional species richness by increasing the disturbance regime
to intermediate levels (Pimentel et al., 1992; Jackson and Jack-
son, 2002; Rosenzweig, 2003). Worldwide, however, such land-
scape changes primarily pose a threat to biodiversity (Matson
et al., 1997; Tilman et al., 2001).
During recent decades, the composition and structure of
the European cultural landscape have changed dramatically
due to urbanisation and segregation of land-use intensities
(e.g. Leonard and Cobham, 1977; Robinson and Sutherland,
2002). The segregation of land-use intensity has been espe-
cially widespread in mountainous regions, where land use
has intensified in the easily accessible valley bottoms, while
sites at higher altitudes, which are more difficult to farm,
have generally been abandoned (e.g. Batzing, 1996). Most of-
ten, such abandoned land will become covered with forest.
The intensification of land use in the more easily accessible
land is accompanied by the removal of landscape elements
such as hedgerows, stone walls and single trees, and, in gen-
eral, by habitat deterioration. Similar developments have
been recorded in various mountainous areas of the world
(e.g. Brown, 2003).
Habitat changes brought about by the segregation of land-
use intensities have an impact on biodiversity and species
richness (e.g. Paoletti and Pimentel, 1992; McLaughlin and
Mineau, 1995; Lindblach, 1999; Germann and Holland, 2001;
Dirnbock et al., 2003; Haines-Young et al., 2003; Millan de la
Pena et al., 2003; Veken et al., 2004). Natural afforestation on
abandoned land may lead to a short-term increase in species
richness, but it will cause decreasing numbers of species in
the long term, especially of species depending on open-land
habitats (Labaune and Magnin, 2002; Dullinger et al., 2003;
Bolliger et al., 2007). Intensification of agriculture is likely to
be followed by a decrease in species richness primarily
caused by increasing disturbance, loss of valuable habitats,
use of chemicals, and nitrogen enrichment (Aebischer, 1991;
Sotherton, 1998; Chamberlain et al., 2000; Donald et al.,
2001; Benton et al., 2002; Veken et al., 2004).
For a sustainable development of cultural landscapes, the
conservation and restoration of species richness is a major
objective (Rio Convention, European Common Agricultural
Policy). The protection of so-called ‘diversity hotspots’ (sites
with relatively high numbers of species of interest) is a
straightforward strategy for the conservation of species rich-
ness (Prendergast et al., 1993; Armsworth et al., 2004). On a
landscape scale, the protection of such hotspots is seen as a
basis for designing reserve networks complying with the Con-
vention on Biological Diversity (ISCBD, 1994; Bonn et al., 2002;
Kati et al., 2004). However, if conservation efforts confine
themselves to a few diversity hotspots, e.g., because decision
makers see it as a cure for all, the remaining habitats may
deteriorate to ‘coldspots’ due to a liberalization of land use
(Jepson and Canney, 2001; Kareiva and Marvier, 2003).
An alternative conservation strategy to the hotspot
approach is the large-scale conversion of farmland into low-
input habitats. This is an important instrument in agri-envi-
ronmental schemes developed in many European countries
(Kleijn and Sutherland, 2003). Nevertheless, even though
biodiversity in general may benefit from this large-scale con-
servation approach, rare species are not necessarily sup-
ported by agri-environmental schemes (Herzog et al., 2005).
Consequently, hotspots that reveal high numbers of rare
and endangered species may not be fostered by large-scale
conservation programs such as agri-environmental schemes.
Hence, for the development of effective conservation strate-
gies, it is crucial to identify parameters that control species
richness at the landscape level (Huston, 1995). Combining
these parameters with scenarios of environmental change
makes it possible to compare the outcomes of different con-
servation strategies.
In this study, we investigated to what degree the objectives
of these conservation strategies (large-scale conservation of
species richness, conservation of diversity hotspots) are
reached in a dynamic cultural landscape. First, we assessed
major drivers for species richness under current conditions
on the national scale in Switzerland. Then, we investigated
how species richness may change on the national and on
the local scale (diversity hotspots) under different scenarios
of land-use and climate change. Would a liberalization of land
use lead to a large-scale ‘coldspot’? How would species rich-
ness develop under a ‘business as usual’ scenario? Will the
large-scale conversion of farmland into low-input habitats
remarkably foster species richness on the large scale and in
small-scale hotspots? At least some small-scale hotspots
are suggested to be relict habitats that may not benefit from
large-scale conservation efforts such as agri-environmental
schemes (Steck et al., 2007). Therefore, the impact of certain
measures on species richness may be markedly different on
a national scale compared to local-scale diversity hotspots.
For all analyses, data on grasshopper species richness
have been used. Grasshoppers are considered a good indica-
tor for overall species richness in the European cultural land-
scape (e.g. Sauberer et al., 2004). Because most of the
European grasshoppers are thermophilic, we wanted to addi-
tionally evaluate the effect of a climate-change scenario
(increasing temperature, decreasing precipitation) on grass-
hopper species richness. Our aim was to assess whether the
effects of climate change surpass the effects of the conver-
sion of farmland into low-input habitats.
2. Materials and methods
2.1. Study area
This study was conducted in Switzerland (surface:
4,128,400 ha), a country with a large proportion of mountain-
ous landscapes, where land-use segregation is generally most
obvious (e.g. Batzing, 1996; Brown, 2003). Six biogeographic re-
gions are observed for Switzerland: the Jura Mountains (10.4%
of the surface), the Plateau (27%) and four different alpine re-
gions (62.6% in total; Bundesamt fur Statistik, 2001).
2.2. Spatial model of grasshopper species richness
2.2.1. Biotic input dataBetween 2001 and 2004, professional entomologists collected
systematically data on grasshopper distribution for a national
Red-List project coordinated by the Swiss Centre for Faunal

362 B I O L O G I C A L C O N S E R V A T I O N 1 3 8 ( 2 0 0 7 ) 3 6 0 – 3 7 0
Cartography (CSCF Neuchatel) based on the following instruc-
tions (Gonseth, personal communication). Within selected
quadrants of 1 km2 they visited the sites with the highest
habitat quality for grasshoppers. Afterwards, they looked for
other species in the remaining area of the quadrant. In this
study, only grasshopper data from the most species-rich
1 ha plots within a 1 km2 quadrant were analysed, as these
sites have evidently been very thoroughly sampled. A total
of 7457 plots of 1 ha, containing data on altogether 95 grass-
hopper species, was included in our analysis. Our measure
for grasshopper diversity was the number of grasshopper
species.
2.2.2. Explanatory variablesTo describe each of the 7457 plots, we included nine predictive
variables that cover climate variables, topographical charac-
teristics, land use, and the biogeographic regions of Switzer-
land (Table 1). The six biogeographic regions are defined
based on vegetation and faunistic data (Gonseth et al.,
2001). We used maps of mean temperatures in July, as well
as of the mean sum of precipitation in July. These are based
on spatial interpolations of meteorological data from the na-
tional network of recording stations. A detailed description of
how these maps were calculated is outlined in Zimmermann
and Kienast (1999). Additionally, we used slope and northness
(cosine of the aspect in radians) as predictors of grasshopper
species richness.
Nation-wide data on land use is available at a 1 ha resolu-
tion for two time steps (1985 and 1997). (BFS, 1979/1985, 1992/
1997). The original 72 land-use categories were aggregated
into six categories (Table 1; details, see Bolliger et al., 2007).
To take into account neighbourhood effects, we calculated
the frequency of selected land-use categories within a radius
of 500 m. The selected land-use categories included open for-
est, scrub and non-intensive open land because these catego-
ries are exceptionally species rich (e.g. Duelli et al., 1999).
2.2.3. Model approachWe modelled grasshopper species richness to assess its major
drivers and predicted its spatial distribution to evaluate the
potential impact of environmental changes. As most of the
Table 1 – Predictive variables used to model grasshopper spec
Predictive variable Specifications
Biogeographic region Six regions (1 = Jura Mountains, 2 = Platea
3 = Northern Alps, 4 = Western Alps, 5 = E
Alps, 6 = Southern Alps)
Temperature Mean temperature in July; in �CPrecipitation Mean precipitation in July; in mm
Slope in %
Northness cos (aspect in radians)
Land use Six categories (1 = closed forest, 2 = open
3 = scrub, 4 = non-intensive open land,
5 = intensive farmland, 0 = other)
F. open forest Frequency (measured as proportion in per
open forest in the surrounding area, (r = 5
F. scrub Frequency of scrub in the surrounding ar
(r = 500 m)
F. non-intensive open land Frequency of non-intensive open land in
surrounding area (r = 500 m)
species-environment interactions are likely to be non-linear
(Gaston and Williams, 1996) we chose a nonparametric model
that is able to fit any response curve. We used a generalized
additive model (GAM; Hastie and Tibshirani, 1986) with a
poisson distribution as implemented in the GRASP library
(available online from http://www.cscf.ch/grasp; Lehmann
et al., 2002a) of SPlus (Insightful Corp., Seattle, Washington).
The default smoother degree of freedom was set to 4; to test
for linear relationships the alternative smoother degree of
freedom was set to 1. To optimize the model, we applied a
stepwise regression (backward and forward selection). We
started with a full model and used the Akaike information cri-
terion (AIC) for analysing the significance of eliminating or
adding terms.
To test the model’s performance, we validated the selected
model with a cross-validation procedure that divided the en-
tire data into five subsets of equally numbered and randomly
selected data points, as implemented in GRASP.
To predict the spatial distribution of species richness all
over Switzerland at the ha-scale, the resulting model was ex-
ported as a look-up table. The look-up table can be read in
ARCVIEW (ESRI, Redland, California) by an Avenue script
(available online from http://www.cscf.ch/grasp). This script
is written to build spatial predictions (in our case of grasshop-
per species richness for the whole of Switzerland) by reclassi-
fying the maps of the predictive variables selected by the
modelling procedure.
2.3. Applying scenarios of environmental change
Five different scenarios were applied to evaluate the changes
in species richness due to potential future environmental
change. Four land-use scenarios were applied: ‘liberalization’,
‘business as usual’, ‘lowered agricultural production’, and
‘complete conversion of intensive open land’. Additionally, a
climate-change scenario was used to cross-evaluate the ef-
fects of land-use and climate change.
2.3.1. Land-use change scenariosConceptual and methodological details on the land-use
change scenarios ‘‘liberalisation’’, ‘‘business-as-usual’’, and
ies richness
Data source
u,
astern
Gonseth et al. (2001)
Zimmermann and Kienast (1999)
Zimmermann and Kienast (1999)
DHM25� Bundesamt fur Landestopographie
DHM25� Bundesamt fur Landestopographie
forest, Bolliger et al. (2007) based on BFS (1979/1985, 1992/1997)
cent) of
00 m)
Bolliger et al. (2007) based on BFS (1979/1985, 1992/1997)
ea Bolliger et al. (2007) based on BFS (1979/1985, 1992/1997)
the Bolliger et al. (2007) based on BFS (1979/1985, 1992/1997)
B I O L O G I C A L C O N S E R V A T I O N 1 3 8 ( 2 0 0 7 ) 3 6 0 – 3 7 0 363
‘‘lowered agricultural production’’ are described in detail in
Bolliger et al. (2007).
The ‘liberalization’ scenario assumes that the agricultural
market of Switzerland is fully liberalized and that agriculture
and biodiversity conservation are not subsidized by the gov-
ernment. This scenario is characterized by a segregation of
land-use intensity depending on the terrain. Land use is
intensified in the easily accessible lowlands (<900 m a.s.l.)
and valley bottoms. Here, about 80% of non-intensive open
land is converted to intensively used land. In contrast, farms
at higher altitudes (>900 m a.s.l.) are likely to be abandoned
under this scenario. Consequently, 90% of non-intensive and
of intensive open land, respectively, is converted to scrub or
forest.
The ‘business as usual’ extrapolates trends observed in
land-use change during 15 years (1985–1997) into the future
(Bolliger et al., 2007). This scenario was applied to investigate
how species richness may develop if the structural changes in
agriculture and subsidies for biodiversity conservation con-
tinue into the future. This means that the political environ-
ment under this scenario remains similar to that of today
(Bolliger et al., 2007). Out of each land-use category, 90% or
more of the pixels do not change. The scenario ‘lowered agri-
cultural production’ (Bolliger et al., 2007) assumes a land-
scape-development strategy where management for
conservation purposes is the major goal. Nature conservation
is highly subsidized, while food production is subject to mar-
ket forces. In this scenario non-intensive land use is strongly
supported: 80% of the pixels representing intensive open land
are transformed to either non-intensively used farmland, to
scrub, or to forest (Bolliger et al., 2007). Thus, this scenario
is comparable with a widespread and far-reaching agri-envi-
ronmental scheme.
To explore extremes of land-use scenarios, we developed a
scenario called ‘complete conversion of intensive open land’.
In this scenario, all pixels of the land-use category ‘intensive
farmland’ were converted into ‘non-intensive open land’. As
the majority of the Swiss grasshopper species prefer open
land and depend mostly on non-intensively managed grass-
land habitats, this scenario should result in the strongest pos-
sible promotion of grasshopper species richness within our
model.
2.3.2. Climate-change scenarioOur climate-change scenario is based on a conservative
assumption of an increase in the mean temperatures in July
of 1 �C and a decrease in the mean precipitation in July of
15% (Christensen and Christensen, 2003; Beniston, 2004;
OcCC, 2007). As this scenario was applied to cross-evaluate
the effects of land-use and climate change, it was based on
current land-use data.
2.3.3. Implementation of the scenariosThe scenarios were implemented by re-sampling the land-use
variables (land-use scenarios) and the climate variables (cli-
mate scenario) for all 7457 plots with grasshopper surveys
in the potential future landscapes. Then we built new spatial
predictions of grasshopper species richness for each scenario
based on each new sample using the formula of the selected
model.
2.4. Assessing the impact of the scenarios on speciesrichness
We analyzed the changes in grasshopper species richness by
comparing the result of the present-state model with the
resulting richness patterns under the five scenarios. This
was done on two different scales: (a) for all 1 ha pixels of Swit-
zerland, and (b) for hotspots of grasshopper species richness.
We compared the mean number of grasshopper species
between the present-state model and each scenario for the
whole of Switzerland. Additionally, we assessed the shifts in
species richness resulting from the scenarios.
For hotspots of grasshopper species richness, the effects of
the scenarios were measured by assessing the shifts in spe-
cies richness. As relevant hotspots we chose 1 ha plots that
had been identified as ‘richness hotspots’, as ‘rarity hotspots’,
or as ‘hotspots of common species’ by Steck et al. (2007).
‘Richness hotspots’ encompass 50 1 ha plots that feature
most grasshopper species (17–29 grasshopper species). ‘Hot-
spots of common species’ are defined as the 501 ha plots with
the highest numbers of common species (not endangered; 11–
15 grasshopper species). ‘Rarity hotspots’ (n = 50) contain the
highest numbers of endangered grasshopper species (9–18
grasshopper species; Thorens and Nadig, 1994). To test for sig-
nificant differences in the changes in species richness be-
tween the three hotspot types under the different scenarios,
we performed a linear mixed-effect model (Pinheiro and
Bates, 2000) in SPlus (v.6.1). Hotspot type, scenario and their
interaction were fixed effects. The identity/number of the
hotspot was the random effect of the scenarios.
3. Results
3.1. Model of the spatial distribution of grasshopperspecies richness in Switzerland
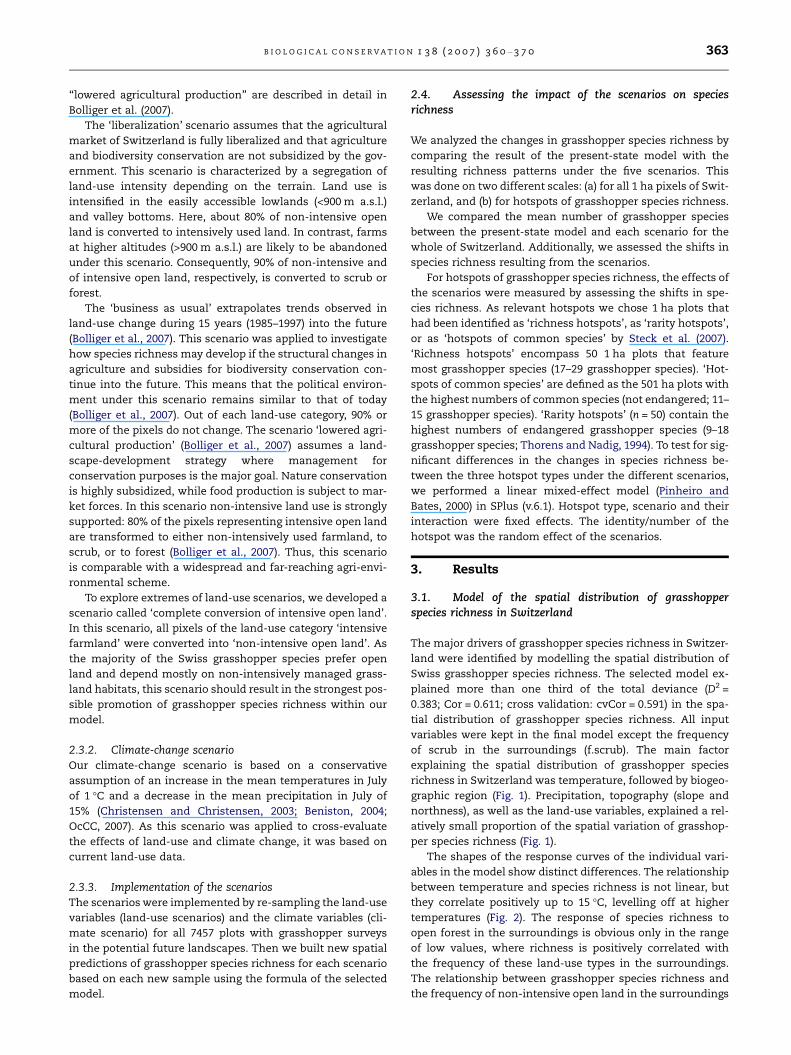
The major drivers of grasshopper species richness in Switzer-
land were identified by modelling the spatial distribution of
Swiss grasshopper species richness. The selected model ex-
plained more than one third of the total deviance (D2 =
0.383; Cor = 0.611; cross validation: cvCor = 0.591) in the spa-
tial distribution of grasshopper species richness. All input
variables were kept in the final model except the frequency
of scrub in the surroundings (f.scrub). The main factor
explaining the spatial distribution of grasshopper species
richness in Switzerland was temperature, followed by biogeo-
graphic region (Fig. 1). Precipitation, topography (slope and
northness), as well as the land-use variables, explained a rel-
atively small proportion of the spatial variation of grasshop-
per species richness (Fig. 1).
The shapes of the response curves of the individual vari-
ables in the model show distinct differences. The relationship
between temperature and species richness is not linear, but
they correlate positively up to 15 �C, levelling off at higher
temperatures (Fig. 2). The response of species richness to
open forest in the surroundings is obvious only in the range
of low values, where richness is positively correlated with
the frequency of these land-use types in the surroundings.
The relationship between grasshopper species richness and
the frequency of non-intensive open land in the surroundings
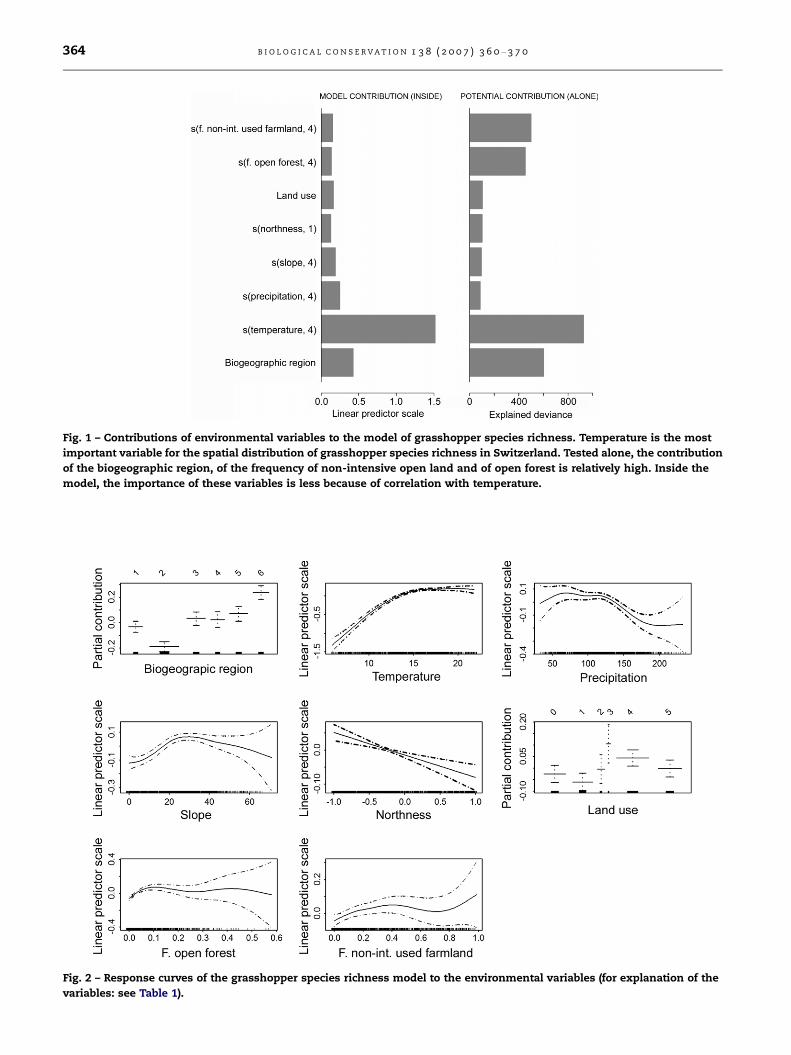
Fig. 1 – Contributions of environmental variables to the model of grasshopper species richness. Temperature is the most
important variable for the spatial distribution of grasshopper species richness in Switzerland. Tested alone, the contribution
of the biogeographic region, of the frequency of non-intensive open land and of open forest is relatively high. Inside the
model, the importance of these variables is less because of correlation with temperature.
Fig. 2 – Response curves of the grasshopper species richness model to the environmental variables (for explanation of the
variables: see Table 1).
364 B I O L O G I C A L C O N S E R V A T I O N 1 3 8 ( 2 0 0 7 ) 3 6 0 – 3 7 0

Table 2 – Number of 1 ha pixels with specific shifts in species richness under different environmental scenarios
Scenario Changes in species richness
�4.5 to �3.5 �3.5 to �2.5 �2.5 to �1.5 �1.5 to �0.5 �0.5 to 0.5 0.5–1.5 1.5–2.5 2.5–3.5
Liberalization 195 14,565 148,027 666,731 3,154,621 136,009 4000 15
Business as usual 17 2527 88,101 3,994,562 38,283 667 6
Lowered agricultural production 63 7587 109,006 3,103,351 845,993 57,846 317
Complete conversion 3,157,682 957,582 8899
Climate change 1,810,601 2,159,322 15,4240
B I O L O G I C A L C O N S E R V A T I O N 1 3 8 ( 2 0 0 7 ) 3 6 0 – 3 7 0 365
is mostly positively correlated. The land-use category ‘closed
forest’ (Fig. 2) of the plots themselves has a negative influence
on species richness, whereas the more open land-use types
scrub and non-intensive open land positively influence grass-
hopper species richness (Fig. 2).
Fig. 3 – Shifts of species richness in hotspots of common
species (n = 50), rarity hotspots (n = 50) and in richness
hotspots (n = 50) due to different scenarios of land-use and
climate change. The horizontal lines represent the mean
changes in grasshopper species richness all over
Switzerland under the individual scenarios.
Table 3 – Success of different conservation strategies under di
Scenario Large-scaleconversion (n = 4,128,400 1 ha pixels)
Liberalisation �Business as usual �Lowered agricultural
production
+
Complete conversion +
Climate change +++
(‘���’ = �0.70 to �0.50 species per pixel; ‘��’ = �0.49 to �0.30; ‘�’ = �0.29
‘+++’ = +0.51 to +0.70).
3.2. Large-scale richness change under different scenarios
The predicted mean grasshopper species richness in Switzer-
land was 6.15 species (ranging from 0 to 15 species). It de-
creased under the scenarios ‘liberalization’ (�0.24 species
per 1 ha pixel) and ‘business as usual’ (�0.04). It increased un-
der the scenarios ‘lowered agricultural production’ (+0.19),
‘complete conversion of intensive open land’ (+0.25) and un-
der the climate-change scenario (+0.63).
The scenarios revealed different magnitudes of change in
species richness on the national scale. The shifts in predicted
species richness in the individual 1 ha pixels across Switzer-
land ranged from �4.1 species to +3.3 species (Table 2). Under
all scenarios except the climate-change scenario, most pixels
revealed changes between �0.5 and +0.5 in predicted species
richness per pixel. The scenarios ‘liberalization’, ‘business as
usual’ and ‘lowered agricultural production’ led to decreases
as well as to increases in species richness. The response of
species richness under the scenario ‘complete conversion of
intensive open land’ and under the climate-change scenario
was restricted to positive values and to pixels with no re-
sponse (Table 2).
3.3. Changes in species richness in small-scale hotspots
The number of species in the three hotspot types (‘richness
hotspots’, ‘hotspots of common species’, ‘rarity hotspots’) de-
creased on average under all land-use scenarios except under
the scenario ‘complete conversion of intensive open land’
(Fig. 3). Increases are recorded only for hotspots of common
species under the scenario ‘lowered agricultural production’,
fferent scenarios of future environmental change
Hotspot-strategy
Richnesshotspots (n = 50)
Hotspots of commonspecies (n = 50)
Rarity hotspots(n = 50)
��� ��� ���� � �� � �
++ ++ ++
++ +++ +
to �0.10; ‘�’ = �0.09 to +0.10; ‘+’ = +0.11 to +0.30; ‘++’ = +0.31 to +0.50;

366 B I O L O G I C A L C O N S E R V A T I O N 1 3 8 ( 2 0 0 7 ) 3 6 0 – 3 7 0
as well as for all three types of hotspots under the scenario
‘complete conversion of intensive open land’ and under the
climate-change scenario (Fig. 3).
Compared to the mean changes in species richness all over
Switzerland, species richness in hotspots was more nega-
tively affected under most scenarios (Table 3). In two scenar-
ios which resulted in an overall increase in species richness in
Switzerland (‘lowered agricultural production’, ‘climate
change’), the numbers for the hotspots also did not increase
correspondingly. Only in the case of the scenario ‘complete
conversion of intensive open land’, species richness reacted
more positively in small-scale hotspots than in Switzerland
as a whole (Fig. 3).
The scenarios differed significantly in the response of spe-
cies richness in all hotspots (factor ‘scenario’; F = 32.60,
p < 0.0001). The three hotspot types (‘richness hotspots’, ‘rar-
ity hotspots’, ‘hotspots of common species’) did not differ sig-
nificantly in the mean response of species richness
depending on the individual scenarios (interaction of ‘sce-
nario’ and ‘hotspot type’; F = 1.43, p = 0.18). This means that,
for each scenario, the response of species richness in the dif-
ferent hotspot types did not differ significantly.
4. Discussion
4.1. Methodological considerations
We modelled and predicted species richness based on land-
use, topographical and climatic variables. There are a few
limitations to be considered with this widely used approach
(Guisan and Zimmermann, 2000; Segurado and Araujo, 2004;
Guisan and Thuiller, 2005). For modelling the spatial distribu-
tion of grasshoppers, dispersal ability and dispersal limita-
tions are likely to be the most important variables to be
combined with niche-related variables. However, these
parameters are known only for a few grasshopper species of
our study (e.g. Zoller, 1995; Schuhmacher and Fartmann,
2003); for most of the Swiss grasshopper species these param-
eters are unknown. Therefore, dispersal-related variables
could not be applied in our study.
As species are likely to respond individually to changing
environmental conditions, modelling individual species,
based on a binary model for each species, may be more appro-
priate than modelling whole communities (Huntley, 1991; Lis-
chke et al., 1998). To predict future distribution, both
approaches exhibit similar drawbacks, but several authors
have shown that the drawbacks of modelling individual spe-
cies are less severe (Zimmermann and Kienast, 1999; Guisan
and Theurillat, 2000). Lehmann et al. (2002b), however,
showed that both approaches are likely to result in a similar
spatial distribution of species richness. For the present study,
we also had to take into account that, for a relatively large
number of grasshopper species, only limited data are avail-
able. When modelling individual species, the minimum num-
ber of observations should be at least 10 times the number of
predictive variables. Here, this would have resulted in the
exclusion of 36 species from the analysis. We therefore
decided to model grasshopper species richness on the basis
of the whole community rather than the individual species
distributions.
4.2. Major drivers of grasshopper species richness
Climate is the most important factor for the large-scale distri-
bution of grasshopper species richness in Switzerland. This is
to be expected as most of the grasshopper species in Switzer-
land are thermophilic (Thorens and Nadig, 1997; Detzel, 1998;
Schlumprecht and Waeber, 2003, Baur et al., 2006). The ther-
mophilic character of the grasshopper community is also re-
flected in their preference for habitats with a southern
aspect (variable ‘northness’, see Table 1) and with low levels
of rainfall (Fig. 2).
Additionally, the number of grasshopper species is posi-
tively correlated with cultivated land and with the frequency
of open land in the surroundings. This coincides with the
dependence of most grasshopper species of Central Europe
on managed habitats (e.g. meadows). Only a few species live
in closed forests (Thorens and Nadig, 1997; Detzel, 1998; Sch-
lumprecht and Waeber, 2003; Baur et al., 2006). The preference
for habitats of intermediate slopes may be caused by a lower
intensity of land management compared to sites on the
plains. However, our model may be improved by adding
explanatory variables that yield more information about
landscape structure (e.g. With and Crist, 1995), habitat quality
(e.g. Holland and Fahrig, 2000), habitat history (e.g. Hersperger
and Forman, 2003), as well as about competition, dispersal
limitations and population dynamics (Guisan and Thuiller,
2005).
4.3. Potential future changes in species richness on thelarge scale
Under a laissez-faire policy, which is mimicked by the ‘liberal-
ization’ scenario, the mean number of grasshopper species
per ha decreases considerably. In more than 800,000 ha the
number of grasshopper species may decrease in the future
because of an increased vulnerability of these sites (that is,
on average, �0.24 species per 1 ha pixel). This potential future
type of land-use change corresponds generally with the land-
use changes observed in mountainous landscapes in the dec-
ades after WW II (e.g. Leonard and Cobham, 1977; Ewald,
1978; Batzing, 1996; Robinson and Sutherland, 2002; Brown,
2003). Hence, species richness is likely to deteriorate if nature
conservation concentrates only on a few sites (e.g. small-scale
diversity hotspots), which are not relevant on a large scale, or
if it is not considered at all in national policy. Only very few
habitats might benefit in the short term from this type of
land-use change, e.g., if a farm in the alpine region is aban-
doned and some previously intensively used land will under-
go succession and become covered with forest.
The ‘business as usual’ scenario proposes land-use
changes that are similar to those observed in the time period
between 1985 and 1997. In our study, these changes led to a
relatively slight decrease in the mean number of grasshopper
species per hectare. This effect may be realistic as there is no
evidence of a decline in grasshopper species richness be-
tween 1992 and 2004 (Gonseth, unpublished data). In contrast,
grasshopper species richness has benefited from recent con-
servation programs, namely agri-environmental schemes
(Herzog et al., 2005). But these agri-environmental schemes
are hardly considered by our ‘business as usual’ scenario

B I O L O G I C A L C O N S E R V A T I O N 1 3 8 ( 2 0 0 7 ) 3 6 0 – 3 7 0 367
because this scheme has only been applied since the early
1990s (Herzog and Walter, 2005). Consequently, species rich-
ness would probably decrease if agri-environmental schemes
were not applied. In the long term, this could mean that
important species or habitats would be lost.
Kareiva and Marvier (2003) suggest that focussing world-
wide nature conservation on a few diversity hotspots might
lead to a deterioration of the remaining habitats. On the large
scale, however, we conclude that restricting conservation ef-
forts to a few diversity hotspots would not per se degrade
all remaining habitats to coldspots because the application
of the two scenarios ‘liberalization’ and ‘business as usual’
did not lead to a large-scale coldspot. But, these approaches
would lead to a drastic long-term decrease in species richness
in specific areas. And this could also affect species richness in
the small-scale hotspots themselves if the immigration rates
of the species concerned were affected by land-use changes
in the surrounding areas.
The scenario ‘lowered agricultural production’ suggests a
landscape-development strategy where management for con-
servation purposes is the major aim. For Swiss grasshoppers,
the scenario ‘lowered agricultural production’ is a strategy
that, in general, positively influences species richness. How-
ever, in a relatively high proportion of pixels, this type of
landscape development could also have negative impact on
grasshopper species richness. This effect of the scenario ‘low-
ered agricultural production’ is probably due to the increase
in open forest, which is likely to foster specialized species
but not per se overall grasshopper species richness (Thorens
and Nadig, 1997; Baur et al., 2006). Under this scenario, the
number of species decreases by up to three species per hect-
are. Obviously, some habitats may deteriorate under a conser-
vation programme that is thought to maintain and develop
species richness (at least as far as grasshoppers are con-
cerned). Therefore, it is essential to have reliable information
on the most suitable sites for creating low-input habitats. The
selection of habitats for restoration could be optimized by
having experts assess habitats or by applying taxon-specific
habitat-suitability models (e.g. Maes et al., 2003).
The scenario ‘complete conversion of intensive open land’
seems the best scenario for enhancing grasshopper species
richness in our study. This scenario led to increased species
richness for more than 1 million hectares. As most Swiss
grasshopper species are open-land species (Thorens and Na-
dig, 1997; Baur et al., 2006), a-diversity of this indicator group
can be enhanced mostly by conversion of land use into low-
input habitats. However, open forest and hedgerows are
important habitats for other species (e.g. Burel et al., 2004).
Therefore, species and communities preferring different hab-
itat types should be considered when developing conserva-
tion strategies on a landscape level.
4.4. Changing species richness in small-scale hotspots
In Switzerland, the recently applied agri-environmental
scheme enhances species richness by converting farmland
into low-input habitats (Herzog et al., 2005; Knop et al.,
2006). But rare species are not specifically fostered by this
conservation approach (Herzog et al., 2005). Therefore, we
investigated the effects of our scenarios on species richness
in different types of small-scale hotspots: ‘richness hotspots’,
‘hotspots of common species’ and ‘rarity hotspots’.
In all hotspot types, the mean number of grasshopper spe-
cies declined under all land-use scenarios except under the
scenario ‘complete conversion of intensive open land’ and ex-
cept in hotspots of common species under the scenario ‘low-
ered agricultural production’. Furthermore, all hotspot types
were, on average, more negatively affected by the applied sce-
narios than an average pixel in Switzerland, except under the
scenario ‘complete conversion of intensive open land’. That
means that the hotspots of grasshopper species richness are
in fact special habitats that react differently to large-scale
land-use changes than does an average site in Switzerland.
This difference might be an effect of the relictic character
(habitats that are relics of traditional land-use practices) of
at least some of the hotspots (Steck et al., 2007).
Species richness in small-scale hotspots is, as in hotspots
at the national scale, likely to be threatened by human-in-
duced land-use change (e.g. Witt and Samways, 2004; Sodhi
et al., 2004). In Switzerland, these small-scale hotspots fea-
ture a relatively high amount of the overall grasshopper spe-
cies richness (Steck et al., 2007). Conservation strategies
should not restrict all efforts to enhance overall biodiversity,
but should pay additional attention to these vulnerable and
valuable sites.
Interestingly, the response of species richness in the ‘rarity
hotspots’did not significantly differ from the response of spe-
cies richness in the ‘hotspots of common species’. Conse-
quently, we cannot completely rule out rarity hotspots being
more vulnerable to landscape change than the ‘hotspots of
common species’. Conservation strategies should not just fo-
cus on endangered species alone or on rarity hotspots, but
should also consider the more common species as their vul-
nerability to environmental change might be underestimated
(e.g. Leon-Cortes et al., 1999; Cowley et al., 1999).
4.5. Impact of climate change on hotspots and remaininghabitats
In our study, the positive effects of climate change exceed the
effects of all land-use scenarios except ‘complete conversion
of intensive open land’, as temperature is the outstanding
major driver of grasshopper species richness in Switzerland.
This high relevance of climate for grasshoppers does not
come as a surprise, as most of the Central European grass-
hopper species are thermophilic (Thorens and Nadig, 1997;
Detzel, 1998; Schlumprecht and Waeber, 2003; Baur et al.,
2006). The relative contribution of land-use variables could,
however, turn out to be greater if better data on habitat struc-
ture were available.
Generally, climate change resulting in increasing tempera-
tures and decreasing precipitation favours thermophilic
grasshopper species and may also foster species richness in
alpine forests (e.g. Dorda, 1998; Kienast et al., 1998). But at
least in the case of grasshoppers, this general trend could
be overdriven by two aspects, i.e., the lack of suitable habitats
and secondary effects of climate change. Species may not ex-
pand their range size if habitat availability is insufficient.
Consequently, species richness will only profit from global
warming, if the spatial distribution of these species is mainly

368 B I O L O G I C A L C O N S E R V A T I O N 1 3 8 ( 2 0 0 7 ) 3 6 0 – 3 7 0
limited by climate and not by habitat availability. Therefore,
future investigations should focus on the interaction between
land-use change and climate change. This was beyond the
scope of this study because such investigations require fine-
scaled data on habitat quality, which are currently not avail-
able for whole Switzerland.
Secondary effects of climate change can diminish insect
populations severely. For instance an increase in the fre-
quency of ‘weather catastrophes’ can cause the extinction
of populations (e.g., Kindval, 1995). Another limitation of this
study is the coarse spatial scale of the climate scenario ap-
plied. It is likely that the effects of climate change differ along
altitudes (Beniston and Rebetez, 1996; Beniston et al., 1997).
Therefore, careful interpretation of these results is necessary.
5. Conclusions
In this study, grasshopper species richness reacted consider-
ably to changes in land-use strategies. Therefore, current
and future agricultural policies will have considerable influ-
ence on grasshopper diversity. The large-scale conversion of
farmland into non-intensively used habitats is likely to be
effective in enhancing the species richness of grasshoppers
and therefore successfully fits the objectives of a large-scale
conservation strategy. However, even if low-input habitats
are promoted on large-scale, small-scale hotspots of Swiss
grasshopper species may deteriorate in the future. Conse-
quently, combining and coordinating conservation efforts on
a large scale and hotspot-specific conservation programs is
likely to be the most successful approach in conserving spe-
cies richness, as stated by Sutherland (2002). But conservation
programs should not concentrate on rare species or on rarity
hotspots since currently common species are also likely to be
negatively affected by future land-use change. With all mea-
sures taken to protect biodiversity in the long run, the poten-
tial impacts of climate change have to be considered as well.
Acknowledgements
We thank two anonymous reviewers for helpful comments on
the manuscript. S. Dingwall improved our English. This re-
search was supported by the Swiss Federal Office for the Envi-
ronment (FOEN).
R E F E R E N C E S
Aebischer, N.J., 1991. Twenty years of monitoring invertebratesand weeds in cereal fields in Sussex. In: Firbank, L.G., Carter,N., Darbyshire, J.F., Potts, G.R. (Eds.), The Ecology of TemperateCereal Fields. Blackwell Scientific Publications, Oxford,pp. 305–331.
Armsworth, P.R., Kendall, B.E., Davis, F.W., 2004. An introductionto biodiversity concepts for environmental economists.Resource and Energy Economics 26, 115–136.
Batzing, W., 1996. Landwirtschaft im Alpenraum unverzichtbar,aber zukunftslos? In: Batzing, W. (Ed.), Landwirtschaft imAlpenraum – unverzichtbar, aber zukunftslos? Einealpenweite Bilanz der aktuellen Probleme und der moglichenLosungen. Blackwell, Wien, pp. 9–11.
Baur, B., Baur, H., Roesti, C., Roesti, D., 2006. Die Heuschrecken derSchweiz. Haupt, Bern. 352 pp.
Beniston, M., Rebetez, M., 1996. Regional behaviour ofminimum temperatures in Switzerland for the periodof 1979–1993. Theoretical and Applied Climatology 53,231–243.
Beniston, M., Diaz, H.F., Bradley, R.S., 1997. Climatic change athigh elevation sites: an overview. Climatic Change 36, 233–251.
Beniston, M., 2004. Climatic change and its impacts. KluwerAcademic Publishers, Dordrecht.
Benton, T.G., Bryant, D.M., Cole, L., Crick, H.Q.P., 2002. Linkingagricultural practice to insect and bird populations: ahistorical study over three decades. Journal of Applied Ecology39, 673–687.
Bolliger, J., Kienast, F., Soliva, R., Rutherford, G., 2007. Spatialsensitivity of species habitat patterns to scenarios of land usechange (Switzerland). Landscape Ecology 22, 773–789.
Bonn, A., Rodrigues, A.S.L., Gaston, K.J., 2002. Threatened andendemic species: are they good indicators of patterns ofbiodiversity on a national scale? Ecology Letters 5, 733–741.
Brown, D.G., 2003. Land use and forest cover on private parcels inthe Upper Midwest USA, 1970 to 1990. Landscape Ecology 18,777–790.
Bundesamt fur Statistik (BFS), 1979/1985. Arealstatistik.Bundesamt fur Statistik, CH-Neuchatel.
Bundesamt fur Statistik (BFS), 1992/1997. Arealstatistik.Bundesamt fur Statistik, CH-Neuchatel.
Bundesamt fur Statistik (BFS), 2001. Arealstatistik Schweiz.Bundesamt fur Statistik, Neuchatel, 31 pp.
Burel, F., Butet, A., Delettre, Y.R., Millan de la Pena, N., 2004.Differential response of selected taxa to landscape contextand agricultural intensification. Landscape and UrbanPlanning 67, 195–204.
Chamberlain, D.E., Fuller, R.J., Bunce, R.G.H., Duckworth, J.C.,Shrubb, M., 2000. Changes in the abundance of farmland birdsin relation to the timing of agricultural intensification inEngland and Wales. Journal of Applied Ecology 37, 771–788.
Christensen, J.H., Christensen, O.B., 2003. Severe summer-timeflooding in Europe. Nature 421, 805–806.
Cowley, M.J.R., Thomas, C.D., Thomas, J.A., Warren, M.S., 1999.Flight areas of British butterflies: assessing species status anddecline. Proceedings of the Royal Society London Series B 266,1587–1592.
Detzel, P., 1998. Die Heuschrecken Baden-Wurttembergs. Ulmer,Stuttgart.
Dirnbock, T., Greimler, J., Lopez, P., Stuessy, T.F., 2003. Predictingfuture threats to the native vegetation of Robinson CrusoeIsland, Juan Fernandez Archipelago, Chile. ConservationBiology 17, 1650–1659.
Donald, P.F., Green, R.E., Heath, M.F., 2001. Agriculturalintensification and the collapse of Europe’s farmland birdpopulations. Proceedings of the Royal Society London Series B268, 25–29.
Dorda, D., 1998. Arealexpansion und Zunahme desWeinhahnchens – Witterungsbedingte Populationsdynamikim Bliesgau (Saarland). Naturschutz und Landschaftsplanung30, 89–93.
Duelli, P., Obrist, M.K., Schmatz, D.R., 1999. Biodiversity evaluationin agricultural landscapes: above-ground insects. Agriculture,Ecosystems and Environment 74, 33–64.
Dullinger, S., Dirnbock, T., Greimler, J., Grabherr, G., 2003. Aresampling approach for evaluating effects of pastureabandonment on subalpine plant species diversity. Journal ofVegetation Science 14, 243–252.
Ewald, K.C., 1978. Der Landschaftswandel – Zur Veranderungschweizerischer Kulturlandschaften im 20. Jahrhundert.Tatigkeitsberichte der Naturforschenden GesellschaftBaselland 30, 55–305.
B I O L O G I C A L C O N S E R V A T I O N 1 3 8 ( 2 0 0 7 ) 3 6 0 – 3 7 0 369
Gaston, K.J., Williams, P.H., 1996. Spatial patterns in taxonomicdiversity. In: Gaston, K.J. (Ed.), Biodiversity: A Biology ofNumbers and Difference. Blackwell Science Ltd., Oxford,pp. 202–229.
Germann, P., Holland, P., 2001. Fragmented ecosystems: Peopleand forests on the mountains of Switzerland and NewZealand. Mountain Research and Development 21, 382–391.
Gonseth, Y., Wohlgemuth, T., Sansonnens, B., Buttler, A., 2001. Diebiogeographischen Regionen der Schweiz – Erlauterungen undEinteilungsstand. Umwelt Materialien (BUWAL) 137, 48.
Guisan, A., Theurillat, J.P., 2000. Equilibrium modeling of alpineplant distribution: how far can we go? Phytocoenologia 30,353–384.
Guisan, A., Zimmermann, N.E., 2000. Predictive habitat distributionmodels in ecology. Ecological Modelling 135, 147–186.
Guisan, A., Thuiller, W., 2005. Predicting species distributions:offering more than simple habitat models. Ecology Letters 8,993–1009.
Haines-Young, R., Barr, C.J., Firbank, L.G., Furse, M., Howard, D.C.,McGowan, G., Petit, S., Smart, S.M., Watkins, J.W., 2003.Changing landscapes, habitats and vegetation diversityacross Great Britain. Journal of Environmental Management67, 267–281.
Hastie, T., Tibshirani, R., 1986. Generalized additive models.Statistical Sciences 1, 297–318.
Hersperger, A.M., Forman, T.T., 2003. Adjacency arrangementeffects on plant diversity and composition in woodlandpatches. Oikos 101, 279–290.
Herzog, F., Dreier, S., Hofer, G., Marfurt, C., Schupbach, B., Spiess,M., Walter, T., 2005. Effect of ecological compensation areas onfloristic and breeding bird diversity in Swiss agriculturallandscapes. Agriculture, Ecosystems and Environment 108,189–204.
Herzog, F., Walter, T., 2005. Evaluation der Okomassnahmen –Bereich Biodiversitat. Schriftenreihe der FAL 56, 1–202.
Holland, J., Fahrig, L., 2000. Effect of woody borders on insectdensity and diversity in crop fields: a landscape-scale analysis.Agriculture, Ecosystems and Environment 78, 115–122.
Huntley, B., 1991. How plants respond to climate change.Migration rates, individualism and the consequences for plantcommunities. Annals of Botany 67, 15–22.
Huston, M.A., 1995. Biological Diversity: The Coexistence ofSpecies on Changing Landscapes. Cambridge University Press,Cambridge.
ISCBD, 1994. Convention on biological diversity. Text andannexes. UNEP, Geneva.
Jackson, D.L., Jackson, L.J., 2002. The Farm as Natural Habitat.Reconnecting Food Systems with Ecosystems. Island Press,Washington, DC.
Jepson, P., Canney, S., 2001. Biodiversity hotspots: hot for what?Global Ecology and Biogeography 10, 225–227.
Kareiva, P., Marvier, M., 2003. Conserving biodiversity coldspots.American Scientist 91, 344.
Kati, V., Devillers, P., Dufrene, M., Legakis, A., Vokou, D., Lebrun, P.,2004. Hotspots, complementary or representativeness?designing optimal small-scale reserves for biodiversityconservation. Biological Conservation 120, 471–480.
Kienast, F., Wildi, O., Brzeziecki, B., 1998. Potential impacts ofclimate change on species richness in mountain forests – anecological risk assessment. Biological Conservation 83,291–305.
Kindval, O., 1995. The impact of extreme weather on habitatpreference and survival in a metapopulation of thebush-cricket Metrioptera bicolor in Sweden. BiologicalConservation 73, 51–58.
Kleijn, D., Sutherland, W.J., 2003. How effective are Europeanagri-environment schemes in conserving and promotingbiodiversity? Journal of Applied Ecology 40, 947–969.
Knop, E., Kleijn, D., Herzog, F., Schmid, B., 2006. Effectiveness ofthe Swiss agri-environment scheme in promoting biodiversity.Journal of Applied Ecology 43, 120–127.
Labaune, C., Magnin, F.D., 2002. Pastoral management vs. landabandonment in Mediterranean uplands: impact on land snailcommunities. Global Ecology and Biogeography 11, 237–245.
Lehmann, A., Overton, J.M., Leathwick, J.R., 2002a. GRASP:generalized regression analysis and spatial prediction.Ecological Modelling 157, 189–207.
Lehmann, A., Leathwick, J.R., Overton, J.M., 2002b. Assessing NewZealand fern diversity from spatial predictions of speciesassemblages. Biodiversity and Conservation 11, 2217–2238.
Leon-Cortes, J.L., Cowley, M.J.R., Thomas, C.D., 1999. Detectingdecline in a formerly widespread species: how common is thecommon blue butterfly Polyommatus icarus? Ecography 22,643–650.
Leonard, P.L., Cobham, R.O., 1977. The farming landscape ofEngland and Wales: a changing scene. Landscape Planning 4,205–216.
Lindblach, M., 1999. The influence of former land-use onvegetation and biodiversity in the boreo-nemoral zone ofSweden. Ecography 22, 485–498.
Lischke, H., Guisan, A., Fischlin, A., Bugmann, H., 1998.Vegetations responses to climate change in theAlps – Modelling studies. In: Cebon, P., Dahinden, U., Davies,H.C., Imboden, D., Jaeger, C. (Eds.), A View From the Alps:Regional Perspectives on Climate Change. MIT Press, Boston,pp. 309–350.
Maes, D., Gilbert, M., Titeux, N., Goffart, P., Dennis, R.L.H., 2003.Prediction of butterfly diversity hotspots in Belgium: acomparison of statistically focused and land use-focusedmodels. Journal of Biogeography 30, 1907–1920.
Matson, P.A., Parton, W.J., Power, A.G., Swift, M.J., 1997.Agricultural intensification and ecosystem properties. Science277, 504–509.
McLaughlin, A., Mineau, P., 1995. The impact of agriculturalpractices on biodiversity. Agriculture, Ecosystems &Environment 55, 201–212.
Paoletti, M.G., Pimentel, D., 1992. Biotic Diversity inAgroecosystems. Elsevier, Amsterdam.
Millan de la Pena, N., Butet, A., Delettre, Y., Morant, P., Burel, F.,2003. Landscape context and carabid beetles (Coleoptera:Carabidae) communities of hedgerows in western France.Agriculture Ecosystems & Environment 94, 59–72.
Organe consultatife sur les changements climatiques (OcCC),2007. Klimaanderung und die Schweiz 2050 – ErwarteteAuswirkungen auf Umwelt, Gesellschaft und Wirtschaft.OcCC/ProClim, Bern.
Pinheiro, J., Bates, D.M., 2000. Mixed-Effects Models in S andS-PLUS. Springer, New York.
Pimentel, D., Stachow, U., Takacs, D.A., Brubaker, H.W., Dumas,A.R., Meaney, J.J., Oneil, J.A.S., Onsi, D.E., Corzilius, D.B., 1992.Conserving biological diversity in agricultural forestry systems– most biological diversity exists in human-managedecosystems. Bioscience 432, 354–362.
Prendergast, J.R., Quinn, R.M., Lawton, J.H., Eversham, B.C.,Gibbons, D.W., 1993. Rare species, the coincidence of diversityhotspots and conservation strategies. Nature 365, 335–337.
Robinson, R.A., Sutherland, W.J., 2002. Post-war changes in arablefarming and biodiversity in Great Britain. Journal of AppliedEcology 39, 157–176.
Rosenzweig, M., 2003. Win-win Ecology. How the Earth’s Speciescan Survive in the Midst of Human Enterprise. OxfordUniversity Press, Oxford.
Sauberer, N., Zulka, K.P., Abensberg-Traun, M., Berg, H.-M.,Bieringer, G., Milasowszky, N., Moser, D., Plutzar, C.,Pollheimer, M., Storch, C., Trostl, R., Zechmeister, H., Grabherr,G., 2004. Surrogate taxa for biodiversity in agricultural
370 B I O L O G I C A L C O N S E R V A T I O N 1 3 8 ( 2 0 0 7 ) 3 6 0 – 3 7 0
landscapes of eastern Austria. Biological Conservation 117,181–190.
Schlumprecht, H., Waeber, G., 2003. Heuschrecken in Bayern.Ulmer, Stuttgart.
Schuhmacher, O., Fartmann, T., 2003. Wie mobil ist derWarzenbeisser? Naturschutz und Landschaftsplanung 35,20–28.
Segurado, P., Araujo, M.B., 2004. An evaluation of methods formodelling species distributions. Journal of Biogeography 31,1555–1568.
Sodhi, N.S., Koh, L.P., Brook, B.W., Ng, P.K.L., 2004. Southeast Asianbiodiversity: an impending desaster. Trends in Ecology andEvolution 19, 654–660.
Sotherton, N.W., 1998. Land use changes and the decline offarmland wildlife: An appraisal of the set-aside approach.Biological Conservation 83, 259–268.
Steck, C.E., Burgi, M., Coch, T., Duelli, P., 2007. Hotspotsand richness pattern of grasshopper species in culturallandscapes. Biodiversity and Conservation 16 (7),2075–2086.
Sutherland, W.J., 2002. Restoring a sustainable countryside.Trends in Ecology and Evolution 17, 148–150.
Thorens, P., Nadig, A., 1994. Rote Liste der gefahrdetenHeuschrecken der Schweiz. In: Duelli, P. (Ed), Rote Listen der
gefahrdeten Tierarten in der Schweiz, BUWAL-Reihe RoteListen, EDMZ, Bern. pp. 66–68.
Thorens, P., Nadig, A., 1997. Verbreitungsatlas der Orthopterender Schweiz. Documenta Faunistica Helvetiae 16, 236 pp.
Tilman, D., Fargione, J., Wolff, B., D’Antonio, C., Dobson, A.,Howarth, R., Schindler, D., Schlesinger, W.H., Simberloff, D.,Swackhamer, D., 2001. Forecasting agriculturally driven globalenvironmental change. Science 292, 281–284.
Veken, S.V.d., Verheyen, K., Hermy, M., 2004. Plant species loss inan urban area (Turnhout, Belgium) from 1880 to 1999 and itsenvironmental determinants. Flora 199, 516–523.
With, K.A., Crist, T.O., 1995. Critical thresholds in species’responses to landscape structure. Ecology 76, 2446–2459.
Witt, A.B.R., Samways, M.J., 2004. Influence of agricultural landtransformation and pest management practices on thearthropod diversity of a biodiversity hotspot, the Cape FloristicRegion, South Africa. African Entomology 12, 89–95.
Zimmermann, N.E., Kienast, F., 1999. Predictive mapping of alpinegrasslands in Switzerland: species versus communityapproach. Journal of Vegetation Science 10, 469–482.
Zoller, S., 1995. Untersuchungen zur Okologie von Oedipodagermanica (LATREILLE, 1804) unter besondererBerucksichtigung der Populationsstruktur, der Habitatbindungund der Mobilitat. Articulata 10, 21–59.