connectivity of lobster populations in the coastal gulf of maine
TRANSCRIPT
e c o l o g i c a l m o d e l l i n g 2 1 0 ( 2 0 0 8 ) 193–211
avai lab le at www.sc iencedi rec t .com
journa l homepage: www.e lsev ier .com/ locate /eco lmodel
Connectivity of lobster populations in the coastal Gulfof MainePart I: Circulation and larval transport potential
Huijie Xuea,∗, Lewis Inczeb, Danya Xua, Nicholas Wolffb, Neal Pettigrewa
a School of Marine Sciences, University of Maine, Orono, ME 04469-5706, United Statesb University of Southern Maine, United States
a r t i c l e i n f o
Article history:
Received 20 June 2006
Received in revised form
11 July 2007
Accepted 26 July 2007
Published on line 12 September 2007
Keywords:
Lobster population
Larval transport
Circulation
Model
Gulf of Maine
a b s t r a c t
The remarkable increase of Homarus Americanus (lobster) abundance in recent years has
resulted in record landings throughout the states and provinces along the perimeter of the
Gulf of Maine. A considerable amount of data on various life stages of lobsters has been
collected for research, management and conservation purposes over the past 15 years. We
have used these data sets to develop models that simulate lobster populations from newly
hatched larval stage through settlement and recruitment to the fishery. This paper presents
a part of the synthesis study that focuses on the early life history of lobsters.
A coupled biophysical individual based model was developed that considers patterns of
egg production (abundance, distribution and timing of hatch), temperature-dependent lar-
val growth, stage-explicit vertical distributions of larvae, and mortality. The biophysical
model was embedded in the realistic simulations of the physical environment (current and
temperature) from the Gulf of Maine Nowcast/Forecast System. The predominant direc-
tion of larval movement follows the cyclonic Gulf of Maine Coastal Current (GMCC). Results
show relatively low accumulation of planktonic stages along the eastern Maine coast and
high accumulation along the western Maine coast. In years when the eastern branch of the
GMCC turns offshore southeast of Penobscot Bay, more particles accumulate downstream
of the branch point. Interannual variability is also apparent in development times that vary
as a function of year-to-year water temperature variation. The larval stages tend to remain
relatively near shore, but the final planktonic stage (the postlarva) resides near the sea sur-
face, and the prevailing southwesterly winds in summer cause eastward and offshore drift of
postlarvae. Thus, more settlement might take place earlier in the potentially long postlarval
stage, and the timing and strength of the southwesterly winds are important in determining
the population of potential settlers.
1
Tc
more than 80% of total commercial landings of all species of
0d
. Introduction
he lobster (Homarus americanus) fishery is the most lucrativeoastal fishery in the Gulf of Maine (Fig. 1), now comprising
∗ Corresponding author. Tel.: +1 207 5814318; fax: +1 207 5814388.E-mail address: [email protected] (H. Xue).
304-3800/$ – see front matter © 2007 Elsevier B.V. All rights reserved.oi:10.1016/j.ecolmodel.2007.07.024
© 2007 Elsevier B.V. All rights reserved.
fish and shellfish in the state of Maine. During the past decade,regional landings were more than double the previous long-term mean and appear to be due in significant measure to an
194 e c o l o g i c a l m o d e l l i n g
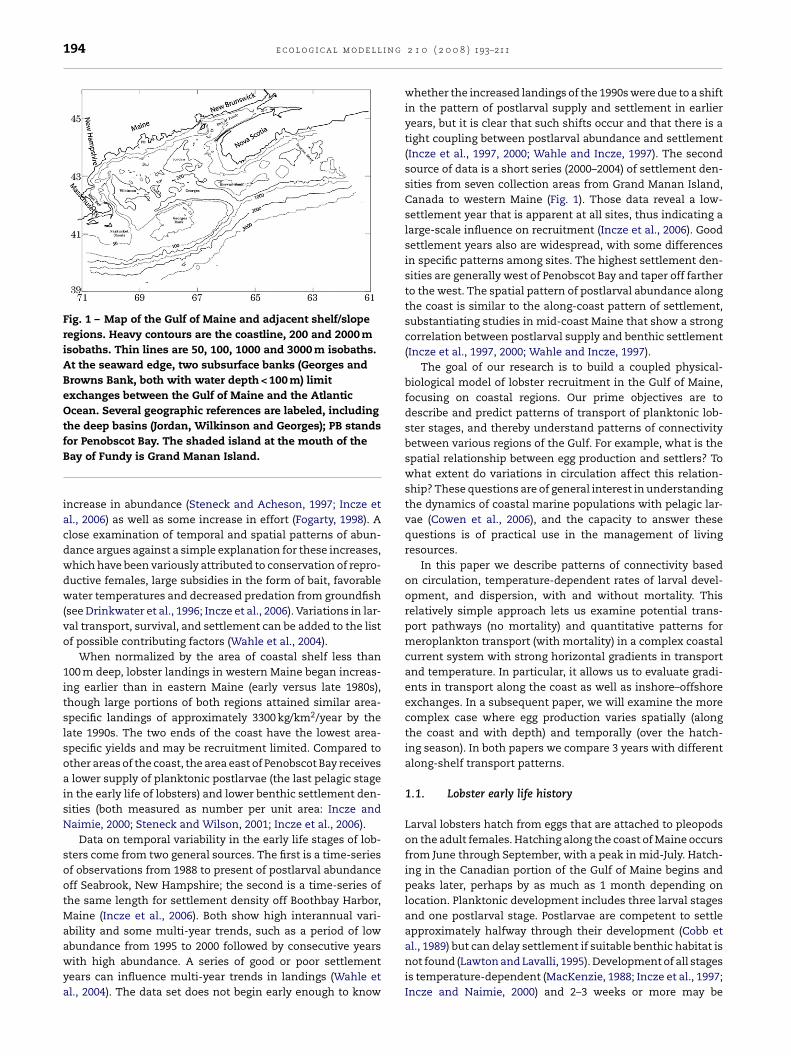
Fig. 1 – Map of the Gulf of Maine and adjacent shelf/sloperegions. Heavy contours are the coastline, 200 and 2000 misobaths. Thin lines are 50, 100, 1000 and 3000 m isobaths.At the seaward edge, two subsurface banks (Georges andBrowns Bank, both with water depth < 100 m) limitexchanges between the Gulf of Maine and the AtlanticOcean. Several geographic references are labeled, includingthe deep basins (Jordan, Wilkinson and Georges); PB stands
for Penobscot Bay. The shaded island at the mouth of theBay of Fundy is Grand Manan Island.increase in abundance (Steneck and Acheson, 1997; Incze etal., 2006) as well as some increase in effort (Fogarty, 1998). Aclose examination of temporal and spatial patterns of abun-dance argues against a simple explanation for these increases,which have been variously attributed to conservation of repro-ductive females, large subsidies in the form of bait, favorablewater temperatures and decreased predation from groundfish(see Drinkwater et al., 1996; Incze et al., 2006). Variations in lar-val transport, survival, and settlement can be added to the listof possible contributing factors (Wahle et al., 2004).
When normalized by the area of coastal shelf less than100 m deep, lobster landings in western Maine began increas-ing earlier than in eastern Maine (early versus late 1980s),though large portions of both regions attained similar area-specific landings of approximately 3300 kg/km2/year by thelate 1990s. The two ends of the coast have the lowest area-specific yields and may be recruitment limited. Compared toother areas of the coast, the area east of Penobscot Bay receivesa lower supply of planktonic postlarvae (the last pelagic stagein the early life of lobsters) and lower benthic settlement den-sities (both measured as number per unit area: Incze andNaimie, 2000; Steneck and Wilson, 2001; Incze et al., 2006).
Data on temporal variability in the early life stages of lob-sters come from two general sources. The first is a time-seriesof observations from 1988 to present of postlarval abundanceoff Seabrook, New Hampshire; the second is a time-series ofthe same length for settlement density off Boothbay Harbor,Maine (Incze et al., 2006). Both show high interannual vari-ability and some multi-year trends, such as a period of low
abundance from 1995 to 2000 followed by consecutive yearswith high abundance. A series of good or poor settlementyears can influence multi-year trends in landings (Wahle etal., 2004). The data set does not begin early enough to know2 1 0 ( 2 0 0 8 ) 193–211
whether the increased landings of the 1990s were due to a shiftin the pattern of postlarval supply and settlement in earlieryears, but it is clear that such shifts occur and that there is atight coupling between postlarval abundance and settlement(Incze et al., 1997, 2000; Wahle and Incze, 1997). The secondsource of data is a short series (2000–2004) of settlement den-sities from seven collection areas from Grand Manan Island,Canada to western Maine (Fig. 1). Those data reveal a low-settlement year that is apparent at all sites, thus indicating alarge-scale influence on recruitment (Incze et al., 2006). Goodsettlement years also are widespread, with some differencesin specific patterns among sites. The highest settlement den-sities are generally west of Penobscot Bay and taper off fartherto the west. The spatial pattern of postlarval abundance alongthe coast is similar to the along-coast pattern of settlement,substantiating studies in mid-coast Maine that show a strongcorrelation between postlarval supply and benthic settlement(Incze et al., 1997, 2000; Wahle and Incze, 1997).
The goal of our research is to build a coupled physical-biological model of lobster recruitment in the Gulf of Maine,focusing on coastal regions. Our prime objectives are todescribe and predict patterns of transport of planktonic lob-ster stages, and thereby understand patterns of connectivitybetween various regions of the Gulf. For example, what is thespatial relationship between egg production and settlers? Towhat extent do variations in circulation affect this relation-ship? These questions are of general interest in understandingthe dynamics of coastal marine populations with pelagic lar-vae (Cowen et al., 2006), and the capacity to answer thesequestions is of practical use in the management of livingresources.
In this paper we describe patterns of connectivity basedon circulation, temperature-dependent rates of larval devel-opment, and dispersion, with and without mortality. Thisrelatively simple approach lets us examine potential trans-port pathways (no mortality) and quantitative patterns formeroplankton transport (with mortality) in a complex coastalcurrent system with strong horizontal gradients in transportand temperature. In particular, it allows us to evaluate gradi-ents in transport along the coast as well as inshore–offshoreexchanges. In a subsequent paper, we will examine the morecomplex case where egg production varies spatially (alongthe coast and with depth) and temporally (over the hatch-ing season). In both papers we compare 3 years with differentalong-shelf transport patterns.
1.1. Lobster early life history
Larval lobsters hatch from eggs that are attached to pleopodson the adult females. Hatching along the coast of Maine occursfrom June through September, with a peak in mid-July. Hatch-ing in the Canadian portion of the Gulf of Maine begins andpeaks later, perhaps by as much as 1 month depending onlocation. Planktonic development includes three larval stagesand one postlarval stage. Postlarvae are competent to settleapproximately halfway through their development (Cobb et
al., 1989) but can delay settlement if suitable benthic habitat isnot found (Lawton and Lavalli, 1995). Development of all stagesis temperature-dependent (MacKenzie, 1988; Incze et al., 1997;Incze and Naimie, 2000) and 2–3 weeks or more may be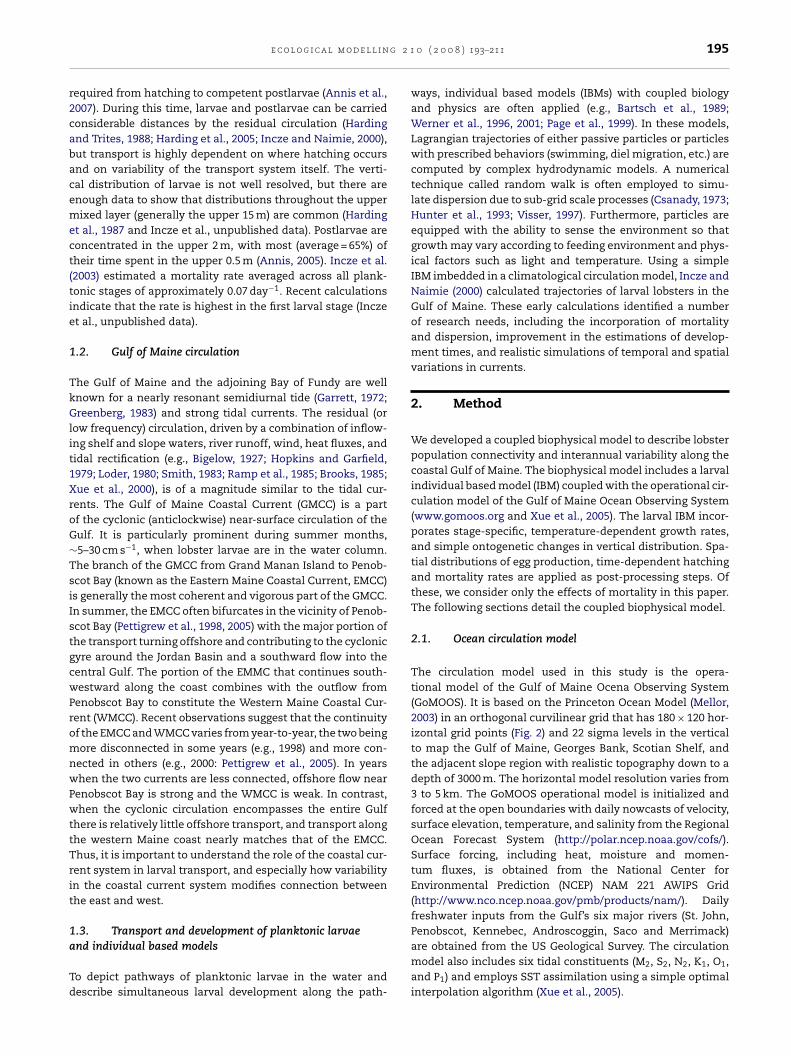
g 2 1
r2cabacemect(tie
1
TkGlit1XroG∼TsiIstgcwPromnwPwttTrit
1a
Td
Penobscot, Kennebec, Androscoggin, Saco and Merrimack)
e c o l o g i c a l m o d e l l i n
equired from hatching to competent postlarvae (Annis et al.,007). During this time, larvae and postlarvae can be carriedonsiderable distances by the residual circulation (Hardingnd Trites, 1988; Harding et al., 2005; Incze and Naimie, 2000),ut transport is highly dependent on where hatching occursnd on variability of the transport system itself. The verti-al distribution of larvae is not well resolved, but there arenough data to show that distributions throughout the upperixed layer (generally the upper 15 m) are common (Harding
t al., 1987 and Incze et al., unpublished data). Postlarvae areoncentrated in the upper 2 m, with most (average = 65%) ofheir time spent in the upper 0.5 m (Annis, 2005). Incze et al.2003) estimated a mortality rate averaged across all plank-onic stages of approximately 0.07 day−1. Recent calculationsndicate that the rate is highest in the first larval stage (Inczet al., unpublished data).
.2. Gulf of Maine circulation
he Gulf of Maine and the adjoining Bay of Fundy are wellnown for a nearly resonant semidiurnal tide (Garrett, 1972;reenberg, 1983) and strong tidal currents. The residual (or
ow frequency) circulation, driven by a combination of inflow-ng shelf and slope waters, river runoff, wind, heat fluxes, andidal rectification (e.g., Bigelow, 1927; Hopkins and Garfield,979; Loder, 1980; Smith, 1983; Ramp et al., 1985; Brooks, 1985;ue et al., 2000), is of a magnitude similar to the tidal cur-
ents. The Gulf of Maine Coastal Current (GMCC) is a partf the cyclonic (anticlockwise) near-surface circulation of theulf. It is particularly prominent during summer months,5–30 cm s−1, when lobster larvae are in the water column.he branch of the GMCC from Grand Manan Island to Penob-cot Bay (known as the Eastern Maine Coastal Current, EMCC)s generally the most coherent and vigorous part of the GMCC.n summer, the EMCC often bifurcates in the vicinity of Penob-cot Bay (Pettigrew et al., 1998, 2005) with the major portion ofhe transport turning offshore and contributing to the cyclonicyre around the Jordan Basin and a southward flow into theentral Gulf. The portion of the EMMC that continues south-estward along the coast combines with the outflow from
enobscot Bay to constitute the Western Maine Coastal Cur-ent (WMCC). Recent observations suggest that the continuityf the EMCC and WMCC varies from year-to-year, the two beingore disconnected in some years (e.g., 1998) and more con-
ected in others (e.g., 2000: Pettigrew et al., 2005). In yearshen the two currents are less connected, offshore flow near
enobscot Bay is strong and the WMCC is weak. In contrast,hen the cyclonic circulation encompasses the entire Gulf
here is relatively little offshore transport, and transport alonghe western Maine coast nearly matches that of the EMCC.hus, it is important to understand the role of the coastal cur-ent system in larval transport, and especially how variabilityn the coastal current system modifies connection betweenhe east and west.
.3. Transport and development of planktonic larvae
nd individual based modelso depict pathways of planktonic larvae in the water andescribe simultaneous larval development along the path-
0 ( 2 0 0 8 ) 193–211 195
ways, individual based models (IBMs) with coupled biologyand physics are often applied (e.g., Bartsch et al., 1989;Werner et al., 1996, 2001; Page et al., 1999). In these models,Lagrangian trajectories of either passive particles or particleswith prescribed behaviors (swimming, diel migration, etc.) arecomputed by complex hydrodynamic models. A numericaltechnique called random walk is often employed to simu-late dispersion due to sub-grid scale processes (Csanady, 1973;Hunter et al., 1993; Visser, 1997). Furthermore, particles areequipped with the ability to sense the environment so thatgrowth may vary according to feeding environment and phys-ical factors such as light and temperature. Using a simpleIBM imbedded in a climatological circulation model, Incze andNaimie (2000) calculated trajectories of larval lobsters in theGulf of Maine. These early calculations identified a numberof research needs, including the incorporation of mortalityand dispersion, improvement in the estimations of develop-ment times, and realistic simulations of temporal and spatialvariations in currents.
2. Method
We developed a coupled biophysical model to describe lobsterpopulation connectivity and interannual variability along thecoastal Gulf of Maine. The biophysical model includes a larvalindividual based model (IBM) coupled with the operational cir-culation model of the Gulf of Maine Ocean Observing System(www.gomoos.org and Xue et al., 2005). The larval IBM incor-porates stage-specific, temperature-dependent growth rates,and simple ontogenetic changes in vertical distribution. Spa-tial distributions of egg production, time-dependent hatchingand mortality rates are applied as post-processing steps. Ofthese, we consider only the effects of mortality in this paper.The following sections detail the coupled biophysical model.
2.1. Ocean circulation model
The circulation model used in this study is the opera-tional model of the Gulf of Maine Ocena Observing System(GoMOOS). It is based on the Princeton Ocean Model (Mellor,2003) in an orthogonal curvilinear grid that has 180 × 120 hor-izontal grid points (Fig. 2) and 22 sigma levels in the verticalto map the Gulf of Maine, Georges Bank, Scotian Shelf, andthe adjacent slope region with realistic topography down to adepth of 3000 m. The horizontal model resolution varies from3 to 5 km. The GoMOOS operational model is initialized andforced at the open boundaries with daily nowcasts of velocity,surface elevation, temperature, and salinity from the RegionalOcean Forecast System (http://polar.ncep.noaa.gov/cofs/).Surface forcing, including heat, moisture and momen-tum fluxes, is obtained from the National Center forEnvironmental Prediction (NCEP) NAM 221 AWIPS Grid(http://www.nco.ncep.noaa.gov/pmb/products/nam/). Dailyfreshwater inputs from the Gulf’s six major rivers (St. John,
are obtained from the US Geological Survey. The circulationmodel also includes six tidal constituents (M2, S2, N2, K1, O1,and P1) and employs SST assimilation using a simple optimalinterpolation algorithm (Xue et al., 2005).
196 e c o l o g i c a l m o d e l l i n g 2 1 0 ( 2 0 0 8 ) 193–211
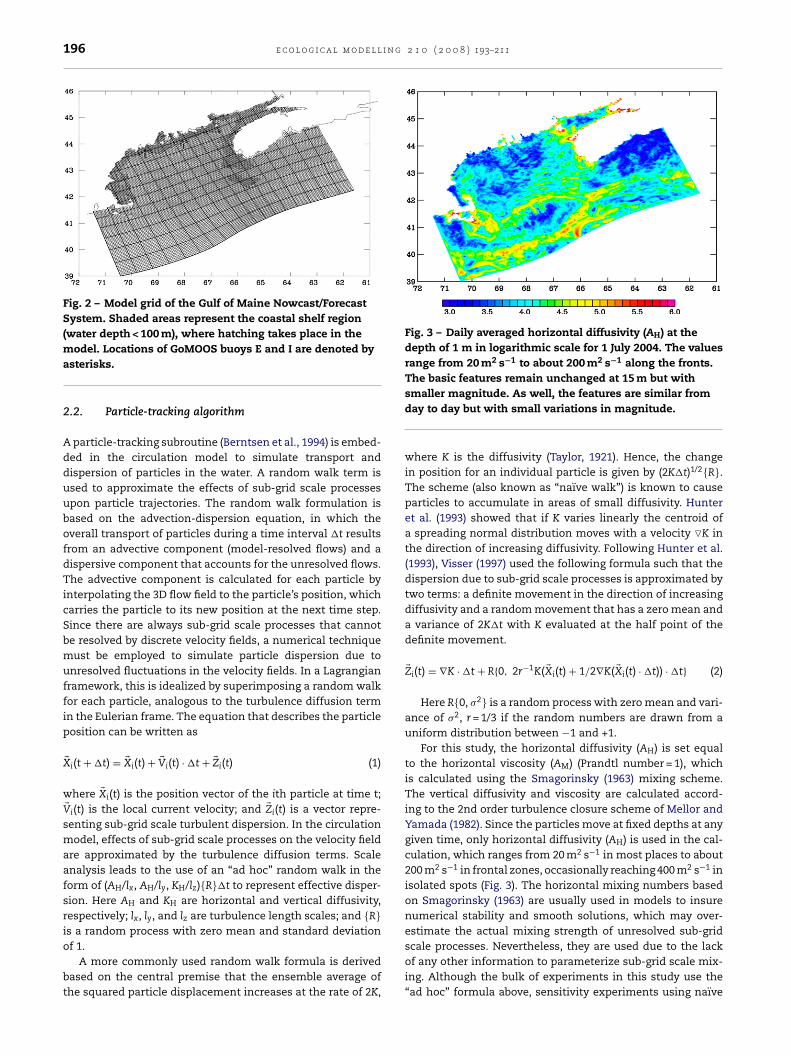
Fig. 2 – Model grid of the Gulf of Maine Nowcast/ForecastSystem. Shaded areas represent the coastal shelf region(water depth < 100 m), where hatching takes place in the Fig. 3 – Daily averaged horizontal diffusivity (AH) at the
depth of 1 m in logarithmic scale for 1 July 2004. The valuesrange from 20 m2 s−1 to about 200 m2 s−1 along the fronts.The basic features remain unchanged at 15 m but with
model. Locations of GoMOOS buoys E and I are denoted byasterisks.
2.2. Particle-tracking algorithm
A particle-tracking subroutine (Berntsen et al., 1994) is embed-ded in the circulation model to simulate transport anddispersion of particles in the water. A random walk term isused to approximate the effects of sub-grid scale processesupon particle trajectories. The random walk formulation isbased on the advection-dispersion equation, in which theoverall transport of particles during a time interval �t resultsfrom an advective component (model-resolved flows) and adispersive component that accounts for the unresolved flows.The advective component is calculated for each particle byinterpolating the 3D flow field to the particle’s position, whichcarries the particle to its new position at the next time step.Since there are always sub-grid scale processes that cannotbe resolved by discrete velocity fields, a numerical techniquemust be employed to simulate particle dispersion due tounresolved fluctuations in the velocity fields. In a Lagrangianframework, this is idealized by superimposing a random walkfor each particle, analogous to the turbulence diffusion termin the Eulerian frame. The equation that describes the particleposition can be written as
�Xi(t + �t) = �Xi(t) + �Vi(t) · �t + �Zi(t) (1)
where �Xi(t) is the position vector of the ith particle at time t;�Vi(t) is the local current velocity; and �Zi(t) is a vector repre-senting sub-grid scale turbulent dispersion. In the circulationmodel, effects of sub-grid scale processes on the velocity fieldare approximated by the turbulence diffusion terms. Scaleanalysis leads to the use of an “ad hoc” random walk in theform of (AH/lx, AH/ly, KH/lz){R}�t to represent effective disper-sion. Here AH and KH are horizontal and vertical diffusivity,respectively; lx, ly, and lz are turbulence length scales; and {R}is a random process with zero mean and standard deviation
of 1.A more commonly used random walk formula is derivedbased on the central premise that the ensemble average ofthe squared particle displacement increases at the rate of 2K,
smaller magnitude. As well, the features are similar fromday to day but with small variations in magnitude.
where K is the diffusivity (Taylor, 1921). Hence, the changein position for an individual particle is given by (2K�t)1/2{R}.The scheme (also known as “naı̈ve walk”) is known to causeparticles to accumulate in areas of small diffusivity. Hunteret al. (1993) showed that if K varies linearly the centroid ofa spreading normal distribution moves with a velocity �K inthe direction of increasing diffusivity. Following Hunter et al.(1993), Visser (1997) used the following formula such that thedispersion due to sub-grid scale processes is approximated bytwo terms: a definite movement in the direction of increasingdiffusivity and a random movement that has a zero mean anda variance of 2K�t with K evaluated at the half point of thedefinite movement.
�Zi(t) = ∇K · �t + R{0, 2r−1K( �Xi(t) + 1/2∇K( �Xi(t) · �t)) · �t} (2)
Here R{0, �2} is a random process with zero mean and vari-ance of �2, r = 1/3 if the random numbers are drawn from auniform distribution between −1 and +1.
For this study, the horizontal diffusivity (AH) is set equalto the horizontal viscosity (AM) (Prandtl number = 1), whichis calculated using the Smagorinsky (1963) mixing scheme.The vertical diffusivity and viscosity are calculated accord-ing to the 2nd order turbulence closure scheme of Mellor andYamada (1982). Since the particles move at fixed depths at anygiven time, only horizontal diffusivity (AH) is used in the cal-culation, which ranges from 20 m2 s−1 in most places to about200 m2 s−1 in frontal zones, occasionally reaching 400 m2 s−1 inisolated spots (Fig. 3). The horizontal mixing numbers basedon Smagorinsky (1963) are usually used in models to insurenumerical stability and smooth solutions, which may over-estimate the actual mixing strength of unresolved sub-grid
scale processes. Nevertheless, they are used due to the lackof any other information to parameterize sub-grid scale mix-ing. Although the bulk of experiments in this study use the“ad hoc” formula above, sensitivity experiments using naı̈ve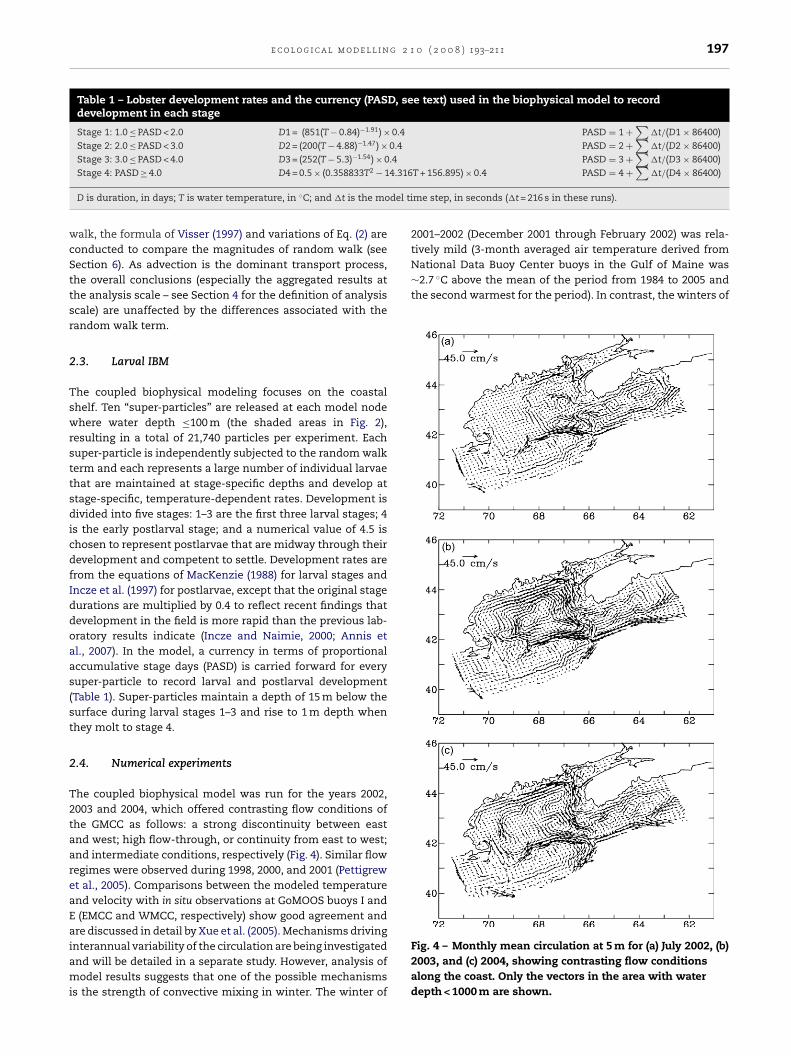
e c o l o g i c a l m o d e l l i n g 2 1 0 ( 2 0 0 8 ) 193–211 197
Table 1 – Lobster development rates and the currency (PASD, see text) used in the biophysical model to recorddevelopment in each stage
Stage 1: 1.0 ≤ PASD < 2.0 D1 = (851(T − 0.84)−1.91) × 0.4 PASD = 1 +∑
�t/(D1 × 86400)Stage 2: 2.0 ≤ PASD < 3.0 D2 = (200(T − 4.88)−1.47) × 0.4 PASD = 2 +
∑�t/(D2 × 86400)
Stage 3: 3.0 ≤ PASD < 4.0 D3 = (252(T − 5.3)−1.54) × 0.4 PASD = 3 +∑
�t/(D3 × 86400)4.316
∑
del ti
wcSttsr
2
TswrsttsdicdfIddoaas(st
2
T2taareaEaiami
tively mild (3-month averaged air temperature derived fromNational Data Buoy Center buoys in the Gulf of Maine was∼2.7 ◦C above the mean of the period from 1984 to 2005 andthe second warmest for the period). In contrast, the winters of
Stage 4: PASD ≥ 4.0 D4 = 0.5 × (0.358833T2 − 1
D is duration, in days; T is water temperature, in ◦C; and �t is the mo
alk, the formula of Visser (1997) and variations of Eq. (2) areonducted to compare the magnitudes of random walk (seeection 6). As advection is the dominant transport process,he overall conclusions (especially the aggregated results athe analysis scale – see Section 4 for the definition of analysiscale) are unaffected by the differences associated with theandom walk term.
.3. Larval IBM
he coupled biophysical modeling focuses on the coastalhelf. Ten “super-particles” are released at each model nodehere water depth ≤100 m (the shaded areas in Fig. 2),
esulting in a total of 21,740 particles per experiment. Eachuper-particle is independently subjected to the random walkerm and each represents a large number of individual larvaehat are maintained at stage-specific depths and develop attage-specific, temperature-dependent rates. Development isivided into five stages: 1–3 are the first three larval stages; 4
s the early postlarval stage; and a numerical value of 4.5 ishosen to represent postlarvae that are midway through theirevelopment and competent to settle. Development rates arerom the equations of MacKenzie (1988) for larval stages andncze et al. (1997) for postlarvae, except that the original stageurations are multiplied by 0.4 to reflect recent findings thatevelopment in the field is more rapid than the previous lab-ratory results indicate (Incze and Naimie, 2000; Annis etl., 2007). In the model, a currency in terms of proportionalccumulative stage days (PASD) is carried forward for everyuper-particle to record larval and postlarval developmentTable 1). Super-particles maintain a depth of 15 m below theurface during larval stages 1–3 and rise to 1 m depth whenhey molt to stage 4.
.4. Numerical experiments
he coupled biophysical model was run for the years 2002,003 and 2004, which offered contrasting flow conditions ofhe GMCC as follows: a strong discontinuity between eastnd west; high flow-through, or continuity from east to west;nd intermediate conditions, respectively (Fig. 4). Similar flowegimes were observed during 1998, 2000, and 2001 (Pettigrewt al., 2005). Comparisons between the modeled temperaturend velocity with in situ observations at GoMOOS buoys I and(EMCC and WMCC, respectively) show good agreement and
re discussed in detail by Xue et al. (2005). Mechanisms driving
nterannual variability of the circulation are being investigatednd will be detailed in a separate study. However, analysis ofodel results suggests that one of the possible mechanismss the strength of convective mixing in winter. The winter of
T + 156.895) × 0.4 PASD = 4 + �t/(D4 × 86400)
me step, in seconds (�t = 216 s in these runs).
2001–2002 (December 2001 through February 2002) was rela-
Fig. 4 – Monthly mean circulation at 5 m for (a) July 2002, (b)2003, and (c) 2004, showing contrasting flow conditionsalong the coast. Only the vectors in the area with waterdepth < 1000 m are shown.
i n g 2 1 0 ( 2 0 0 8 ) 193–211
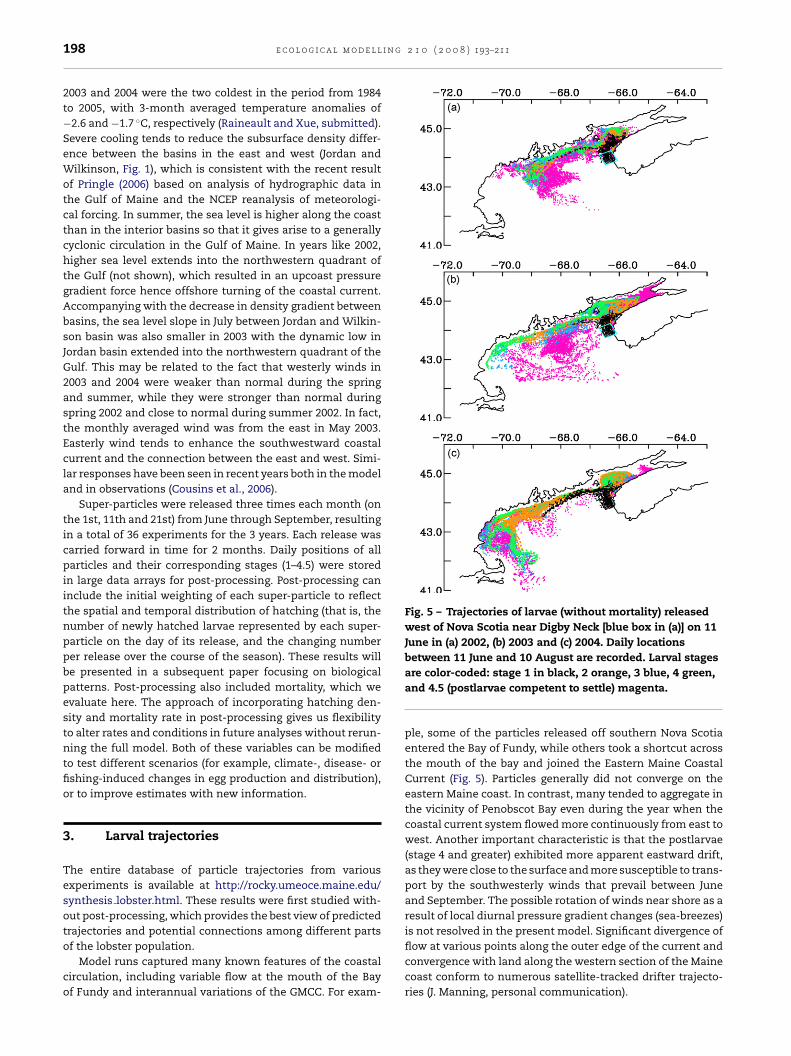
Fig. 5 – Trajectories of larvae (without mortality) releasedwest of Nova Scotia near Digby Neck [blue box in (a)] on 11June in (a) 2002, (b) 2003 and (c) 2004. Daily locationsbetween 11 June and 10 August are recorded. Larval stages
198 e c o l o g i c a l m o d e l l
2003 and 2004 were the two coldest in the period from 1984to 2005, with 3-month averaged temperature anomalies of−2.6 and −1.7 ◦C, respectively (Raineault and Xue, submitted).Severe cooling tends to reduce the subsurface density differ-ence between the basins in the east and west (Jordan andWilkinson, Fig. 1), which is consistent with the recent resultof Pringle (2006) based on analysis of hydrographic data inthe Gulf of Maine and the NCEP reanalysis of meteorologi-cal forcing. In summer, the sea level is higher along the coastthan in the interior basins so that it gives arise to a generallycyclonic circulation in the Gulf of Maine. In years like 2002,higher sea level extends into the northwestern quadrant ofthe Gulf (not shown), which resulted in an upcoast pressuregradient force hence offshore turning of the coastal current.Accompanying with the decrease in density gradient betweenbasins, the sea level slope in July between Jordan and Wilkin-son basin was also smaller in 2003 with the dynamic low inJordan basin extended into the northwestern quadrant of theGulf. This may be related to the fact that westerly winds in2003 and 2004 were weaker than normal during the springand summer, while they were stronger than normal duringspring 2002 and close to normal during summer 2002. In fact,the monthly averaged wind was from the east in May 2003.Easterly wind tends to enhance the southwestward coastalcurrent and the connection between the east and west. Simi-lar responses have been seen in recent years both in the modeland in observations (Cousins et al., 2006).
Super-particles were released three times each month (onthe 1st, 11th and 21st) from June through September, resultingin a total of 36 experiments for the 3 years. Each release wascarried forward in time for 2 months. Daily positions of allparticles and their corresponding stages (1–4.5) were storedin large data arrays for post-processing. Post-processing caninclude the initial weighting of each super-particle to reflectthe spatial and temporal distribution of hatching (that is, thenumber of newly hatched larvae represented by each super-particle on the day of its release, and the changing numberper release over the course of the season). These results willbe presented in a subsequent paper focusing on biologicalpatterns. Post-processing also included mortality, which weevaluate here. The approach of incorporating hatching den-sity and mortality rate in post-processing gives us flexibilityto alter rates and conditions in future analyses without rerun-ning the full model. Both of these variables can be modifiedto test different scenarios (for example, climate-, disease- orfishing-induced changes in egg production and distribution),or to improve estimates with new information.
3. Larval trajectories
The entire database of particle trajectories from variousexperiments is available at http://rocky.umeoce.maine.edu/synthesis lobster.html. These results were first studied with-out post-processing, which provides the best view of predictedtrajectories and potential connections among different parts
of the lobster population.Model runs captured many known features of the coastalcirculation, including variable flow at the mouth of the Bayof Fundy and interannual variations of the GMCC. For exam-
are color-coded: stage 1 in black, 2 orange, 3 blue, 4 green,and 4.5 (postlarvae competent to settle) magenta.
ple, some of the particles released off southern Nova Scotiaentered the Bay of Fundy, while others took a shortcut acrossthe mouth of the bay and joined the Eastern Maine CoastalCurrent (Fig. 5). Particles generally did not converge on theeastern Maine coast. In contrast, many tended to aggregate inthe vicinity of Penobscot Bay even during the year when thecoastal current system flowed more continuously from east towest. Another important characteristic is that the postlarvae(stage 4 and greater) exhibited more apparent eastward drift,as they were close to the surface and more susceptible to trans-port by the southwesterly winds that prevail between Juneand September. The possible rotation of winds near shore as aresult of local diurnal pressure gradient changes (sea-breezes)is not resolved in the present model. Significant divergence of
flow at various points along the outer edge of the current andconvergence with land along the western section of the Mainecoast conform to numerous satellite-tracked drifter trajecto-ries (J. Manning, personal communication).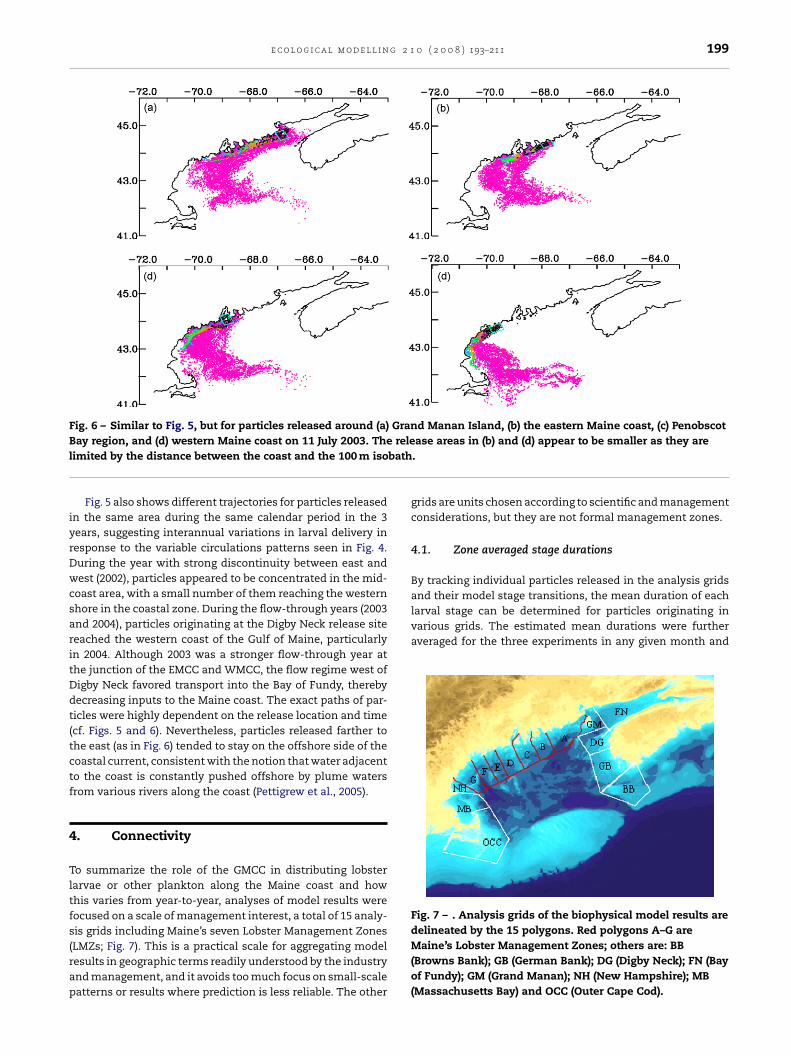
e c o l o g i c a l m o d e l l i n g 2 1 0 ( 2 0 0 8 ) 193–211 199
Fig. 6 – Similar to Fig. 5, but for particles released around (a) Grand Manan Island, (b) the eastern Maine coast, (c) PenobscotB relel bath
iyrDwcsaritDdt(tctf
4
Tltfs(rap
and their model stage transitions, the mean duration of eachlarval stage can be determined for particles originating invarious grids. The estimated mean durations were furtheraveraged for the three experiments in any given month and
Fig. 7 – . Analysis grids of the biophysical model results aredelineated by the 15 polygons. Red polygons A–G are
ay region, and (d) western Maine coast on 11 July 2003. Theimited by the distance between the coast and the 100 m iso
Fig. 5 also shows different trajectories for particles releasedn the same area during the same calendar period in the 3ears, suggesting interannual variations in larval delivery inesponse to the variable circulations patterns seen in Fig. 4.uring the year with strong discontinuity between east andest (2002), particles appeared to be concentrated in the mid-
oast area, with a small number of them reaching the westernhore in the coastal zone. During the flow-through years (2003nd 2004), particles originating at the Digby Neck release siteeached the western coast of the Gulf of Maine, particularlyn 2004. Although 2003 was a stronger flow-through year athe junction of the EMCC and WMCC, the flow regime west ofigby Neck favored transport into the Bay of Fundy, therebyecreasing inputs to the Maine coast. The exact paths of par-icles were highly dependent on the release location and timecf. Figs. 5 and 6). Nevertheless, particles released farther tohe east (as in Fig. 6) tended to stay on the offshore side of theoastal current, consistent with the notion that water adjacento the coast is constantly pushed offshore by plume watersrom various rivers along the coast (Pettigrew et al., 2005).
. Connectivity
o summarize the role of the GMCC in distributing lobsterarvae or other plankton along the Maine coast and howhis varies from year-to-year, analyses of model results wereocused on a scale of management interest, a total of 15 analy-is grids including Maine’s seven Lobster Management Zones
LMZs; Fig. 7). This is a practical scale for aggregating modelesults in geographic terms readily understood by the industrynd management, and it avoids too much focus on small-scaleatterns or results where prediction is less reliable. The otherase areas in (b) and (d) appear to be smaller as they are.
grids are units chosen according to scientific and managementconsiderations, but they are not formal management zones.
4.1. Zone averaged stage durations
By tracking individual particles released in the analysis grids
Maine’s Lobster Management Zones; others are: BB(Browns Bank); GB (German Bank); DG (Digby Neck); FN (Bayof Fundy); GM (Grand Manan); NH (New Hampshire); MB(Massachusetts Bay) and OCC (Outer Cape Cod).
200 e c o l o g i c a l m o d e l l i n g 2 1 0 ( 2 0 0 8 ) 193–211
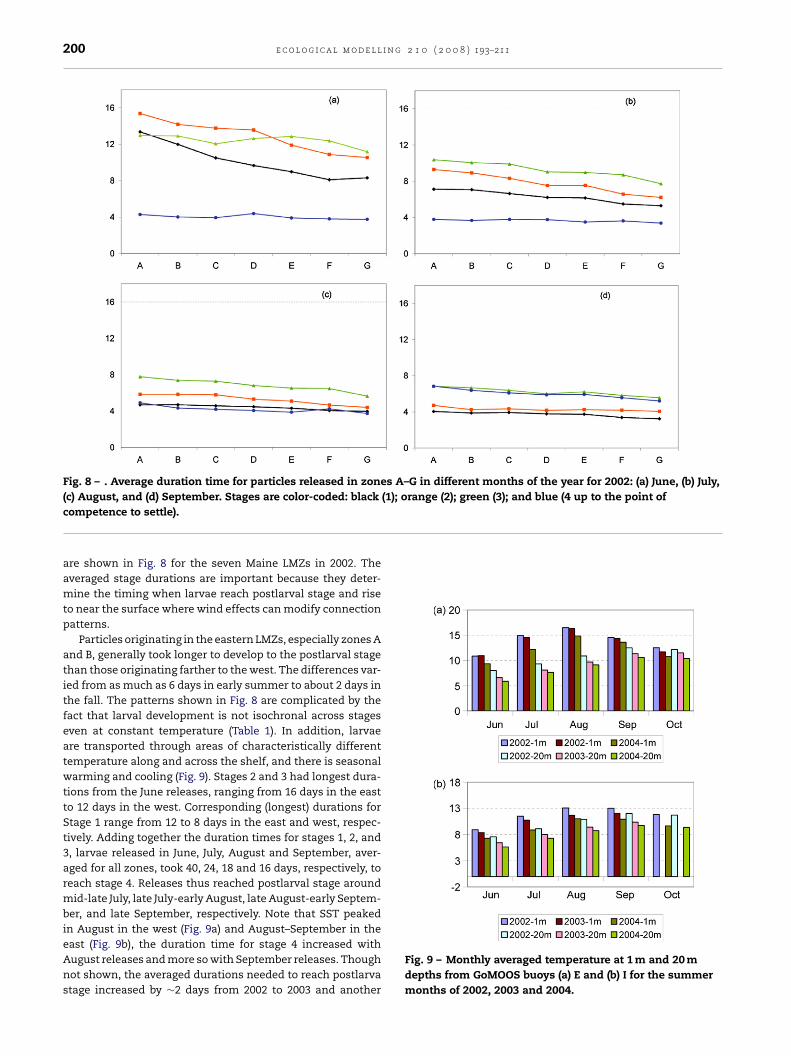
Fig. 8 – . Average duration time for particles released in zones A–G in different months of the year for 2002: (a) June, (b) July,(1); orange (2); green (3); and blue (4 up to the point of
(c) August, and (d) September. Stages are color-coded: blackcompetence to settle).
are shown in Fig. 8 for the seven Maine LMZs in 2002. Theaveraged stage durations are important because they deter-mine the timing when larvae reach postlarval stage and riseto near the surface where wind effects can modify connectionpatterns.
Particles originating in the eastern LMZs, especially zones Aand B, generally took longer to develop to the postlarval stagethan those originating farther to the west. The differences var-ied from as much as 6 days in early summer to about 2 days inthe fall. The patterns shown in Fig. 8 are complicated by thefact that larval development is not isochronal across stageseven at constant temperature (Table 1). In addition, larvaeare transported through areas of characteristically differenttemperature along and across the shelf, and there is seasonalwarming and cooling (Fig. 9). Stages 2 and 3 had longest dura-tions from the June releases, ranging from 16 days in the eastto 12 days in the west. Corresponding (longest) durations forStage 1 range from 12 to 8 days in the east and west, respec-tively. Adding together the duration times for stages 1, 2, and3, larvae released in June, July, August and September, aver-aged for all zones, took 40, 24, 18 and 16 days, respectively, toreach stage 4. Releases thus reached postlarval stage aroundmid-late July, late July-early August, late August-early Septem-ber, and late September, respectively. Note that SST peakedin August in the west (Fig. 9a) and August–September in the
east (Fig. 9b), the duration time for stage 4 increased withAugust releases and more so with September releases. Thoughnot shown, the averaged durations needed to reach postlarvastage increased by ∼2 days from 2002 to 2003 and anotherFig. 9 – Monthly averaged temperature at 1 m and 20 mdepths from GoMOOS buoys (a) E and (b) I for the summermonths of 2002, 2003 and 2004.
g 2 1
2t
4
Cras
Ftc
e c o l o g i c a l m o d e l l i n
days from 2003 to 2004 in response to the lower tempera-ures.
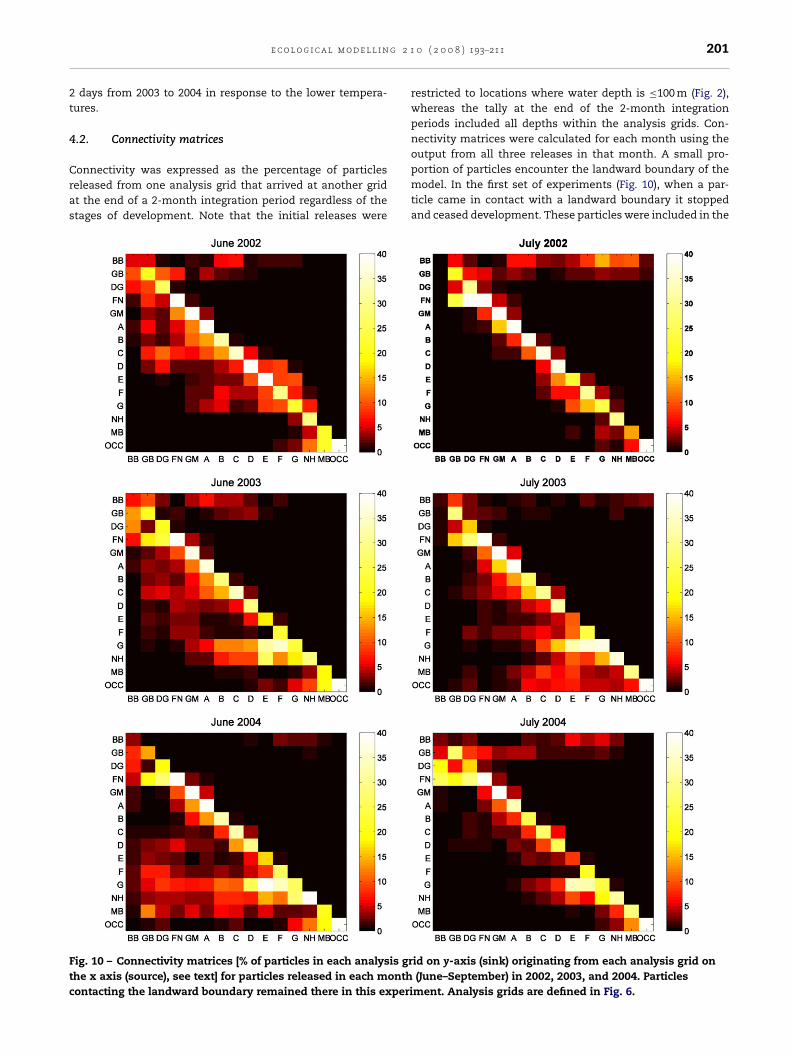
.2. Connectivity matrices
onnectivity was expressed as the percentage of particleseleased from one analysis grid that arrived at another gridt the end of a 2-month integration period regardless of thetages of development. Note that the initial releases were
ig. 10 – Connectivity matrices [% of particles in each analysis grhe x axis (source), see text] for particles released in each monthontacting the landward boundary remained there in this experi
0 ( 2 0 0 8 ) 193–211 201
restricted to locations where water depth is ≤100 m (Fig. 2),whereas the tally at the end of the 2-month integrationperiods included all depths within the analysis grids. Con-nectivity matrices were calculated for each month using theoutput from all three releases in that month. A small pro-
portion of particles encounter the landward boundary of themodel. In the first set of experiments (Fig. 10), when a par-ticle came in contact with a landward boundary it stoppedand ceased development. These particles were included in theid on y-axis (sink) originating from each analysis grid on(June–September) in 2002, 2003, and 2004. Particlesment. Analysis grids are defined in Fig. 6.
202 e c o l o g i c a l m o d e l l i n g 2 1 0 ( 2 0 0 8 ) 193–211
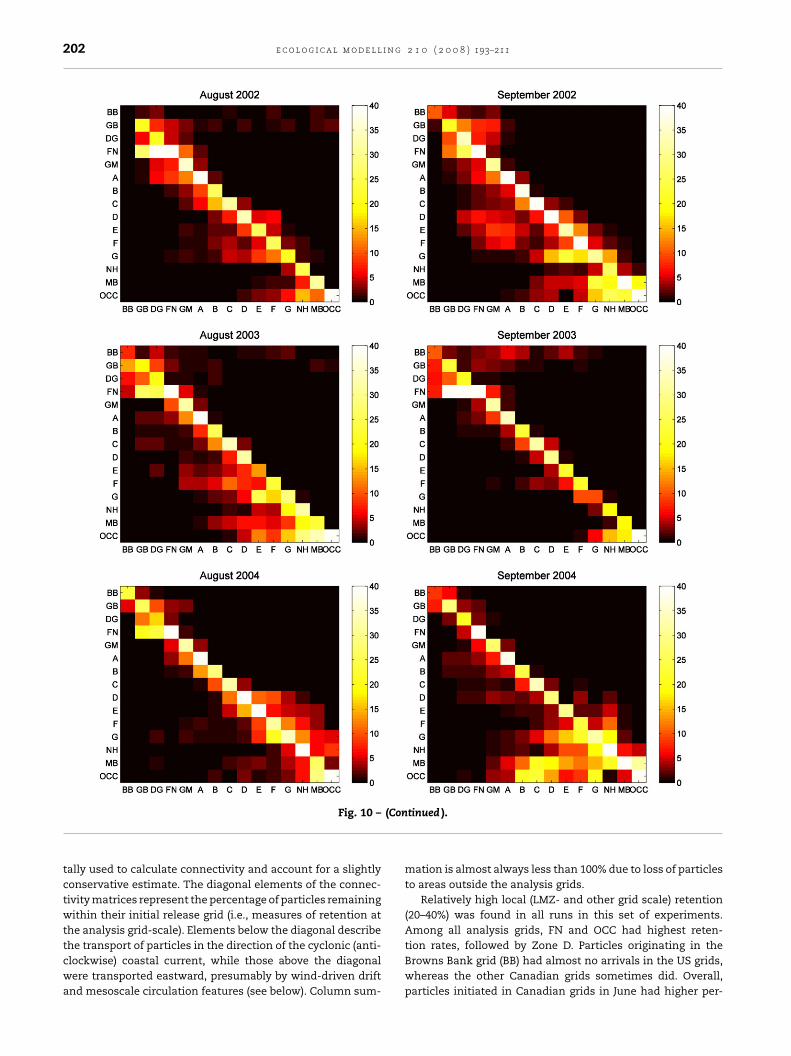
(Con
Fig. 10 –tally used to calculate connectivity and account for a slightlyconservative estimate. The diagonal elements of the connec-tivity matrices represent the percentage of particles remainingwithin their initial release grid (i.e., measures of retention atthe analysis grid-scale). Elements below the diagonal describe
the transport of particles in the direction of the cyclonic (anti-clockwise) coastal current, while those above the diagonalwere transported eastward, presumably by wind-driven driftand mesoscale circulation features (see below). Column sum-tinued ).
mation is almost always less than 100% due to loss of particlesto areas outside the analysis grids.
Relatively high local (LMZ- and other grid scale) retention(20–40%) was found in all runs in this set of experiments.Among all analysis grids, FN and OCC had highest reten-
tion rates, followed by Zone D. Particles originating in theBrowns Bank grid (BB) had almost no arrivals in the US grids,whereas the other Canadian grids sometimes did. Overall,particles initiated in Canadian grids in June had higher per-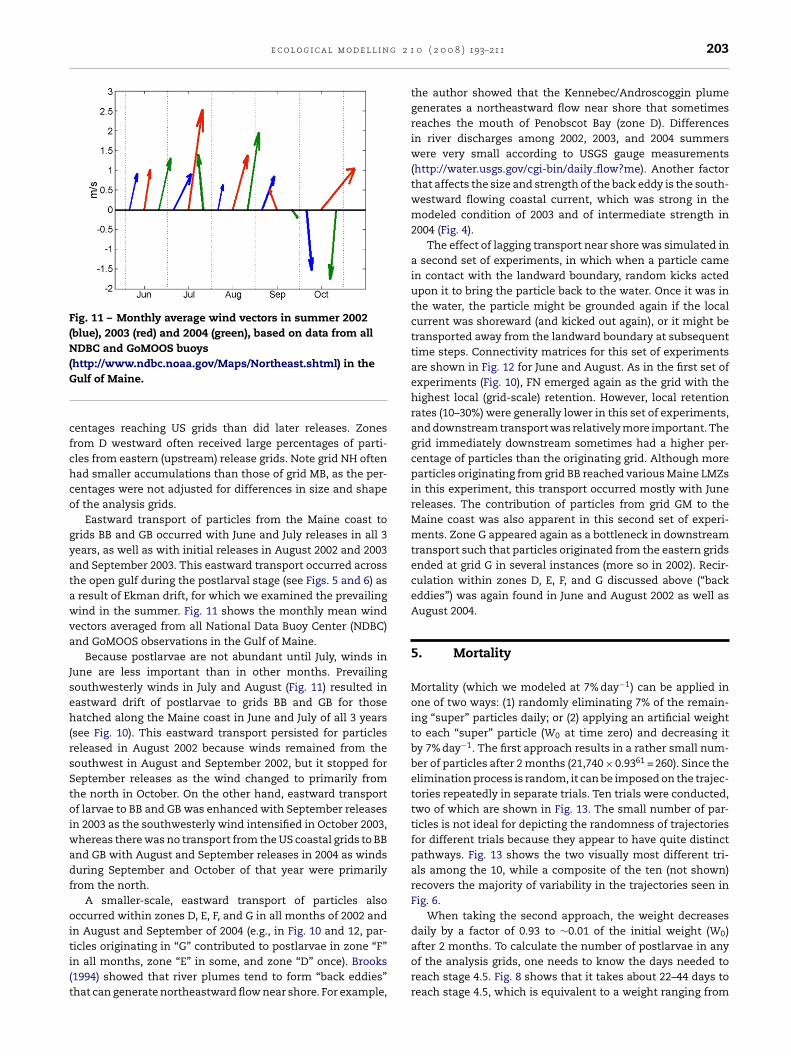
e c o l o g i c a l m o d e l l i n g 2 1
Fig. 11 – Monthly average wind vectors in summer 2002(blue), 2003 (red) and 2004 (green), based on data from allNDBC and GoMOOS buoys(G
cfchco
gyatawva
Jseh(rsStoiwadf
oiti(t
0
http://www.ndbc.noaa.gov/Maps/Northeast.shtml) in theulf of Maine.
entages reaching US grids than did later releases. Zonesrom D westward often received large percentages of parti-les from eastern (upstream) release grids. Note grid NH oftenad smaller accumulations than those of grid MB, as the per-entages were not adjusted for differences in size and shapef the analysis grids.
Eastward transport of particles from the Maine coast torids BB and GB occurred with June and July releases in all 3ears, as well as with initial releases in August 2002 and 2003nd September 2003. This eastward transport occurred acrosshe open gulf during the postlarval stage (see Figs. 5 and 6) asresult of Ekman drift, for which we examined the prevailingind in the summer. Fig. 11 shows the monthly mean wind
ectors averaged from all National Data Buoy Center (NDBC)nd GoMOOS observations in the Gulf of Maine.
Because postlarvae are not abundant until July, winds inune are less important than in other months. Prevailingouthwesterly winds in July and August (Fig. 11) resulted inastward drift of postlarvae to grids BB and GB for thoseatched along the Maine coast in June and July of all 3 years
see Fig. 10). This eastward transport persisted for particleseleased in August 2002 because winds remained from theouthwest in August and September 2002, but it stopped foreptember releases as the wind changed to primarily fromhe north in October. On the other hand, eastward transportf larvae to BB and GB was enhanced with September releases
n 2003 as the southwesterly wind intensified in October 2003,hereas there was no transport from the US coastal grids to BB
nd GB with August and September releases in 2004 as windsuring September and October of that year were primarilyrom the north.
A smaller-scale, eastward transport of particles alsoccurred within zones D, E, F, and G in all months of 2002 and
n August and September of 2004 (e.g., in Fig. 10 and 12, par-
icles originating in “G” contributed to postlarvae in zone “F”n all months, zone “E” in some, and zone “D” once). Brooks1994) showed that river plumes tend to form “back eddies”hat can generate northeastward flow near shore. For example,0 ( 2 0 0 8 ) 193–211 203
the author showed that the Kennebec/Androscoggin plumegenerates a northeastward flow near shore that sometimesreaches the mouth of Penobscot Bay (zone D). Differencesin river discharges among 2002, 2003, and 2004 summerswere very small according to USGS gauge measurements(http://water.usgs.gov/cgi-bin/daily flow?me). Another factorthat affects the size and strength of the back eddy is the south-westward flowing coastal current, which was strong in themodeled condition of 2003 and of intermediate strength in2004 (Fig. 4).
The effect of lagging transport near shore was simulated ina second set of experiments, in which when a particle camein contact with the landward boundary, random kicks actedupon it to bring the particle back to the water. Once it was inthe water, the particle might be grounded again if the localcurrent was shoreward (and kicked out again), or it might betransported away from the landward boundary at subsequenttime steps. Connectivity matrices for this set of experimentsare shown in Fig. 12 for June and August. As in the first set ofexperiments (Fig. 10), FN emerged again as the grid with thehighest local (grid-scale) retention. However, local retentionrates (10–30%) were generally lower in this set of experiments,and downstream transport was relatively more important. Thegrid immediately downstream sometimes had a higher per-centage of particles than the originating grid. Although moreparticles originating from grid BB reached various Maine LMZsin this experiment, this transport occurred mostly with Junereleases. The contribution of particles from grid GM to theMaine coast was also apparent in this second set of experi-ments. Zone G appeared again as a bottleneck in downstreamtransport such that particles originated from the eastern gridsended at grid G in several instances (more so in 2002). Recir-culation within zones D, E, F, and G discussed above (“backeddies”) was again found in June and August 2002 as well asAugust 2004.
5. Mortality
Mortality (which we modeled at 7% day−1) can be applied inone of two ways: (1) randomly eliminating 7% of the remain-ing “super” particles daily; or (2) applying an artificial weightto each “super” particle (W0 at time zero) and decreasing itby 7% day−1. The first approach results in a rather small num-ber of particles after 2 months (21,740 × 0.9361 = 260). Since theelimination process is random, it can be imposed on the trajec-tories repeatedly in separate trials. Ten trials were conducted,two of which are shown in Fig. 13. The small number of par-ticles is not ideal for depicting the randomness of trajectoriesfor different trials because they appear to have quite distinctpathways. Fig. 13 shows the two visually most different tri-als among the 10, while a composite of the ten (not shown)recovers the majority of variability in the trajectories seen inFig. 6.
When taking the second approach, the weight decreasesdaily by a factor of 0.93 to ∼0.01 of the initial weight (W )
after 2 months. To calculate the number of postlarvae in anyof the analysis grids, one needs to know the days needed toreach stage 4.5. Fig. 8 shows that it takes about 22–44 days toreach stage 4.5, which is equivalent to a weight ranging from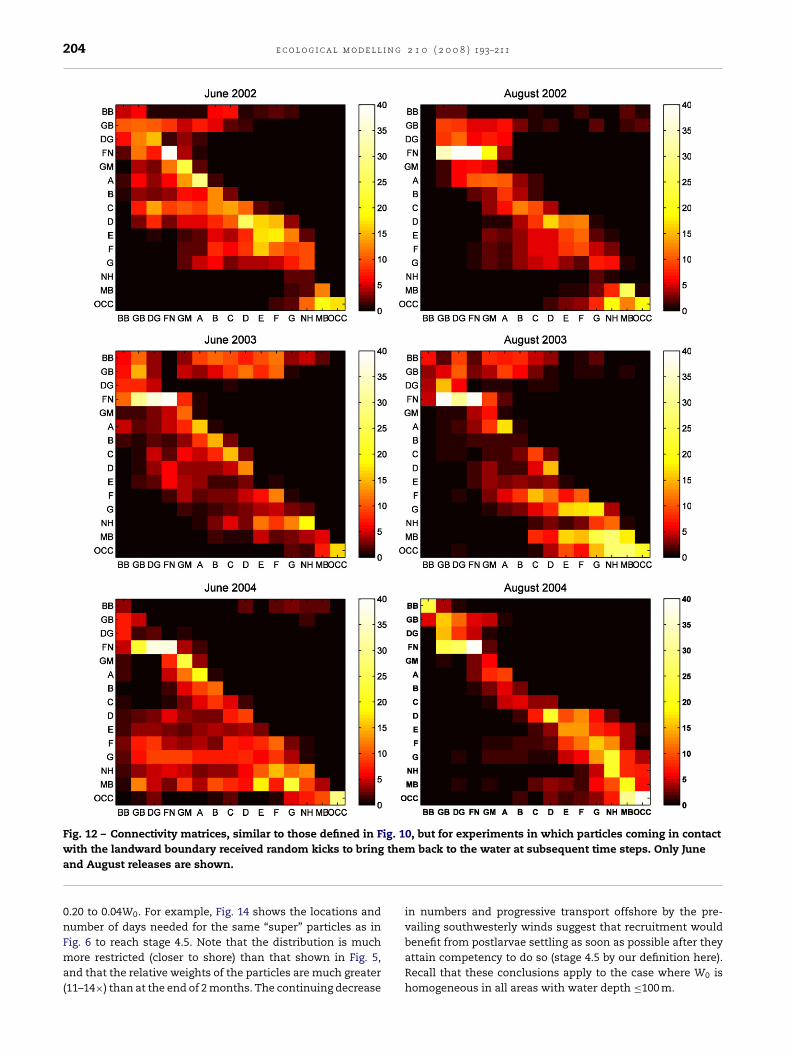
204 e c o l o g i c a l m o d e l l i n g 2 1 0 ( 2 0 0 8 ) 193–211
Fig. 12 – Connectivity matrices, similar to those defined in Fig. 10, but for experiments in which particles coming in contactthe
with the landward boundary received random kicks to bringand August releases are shown.
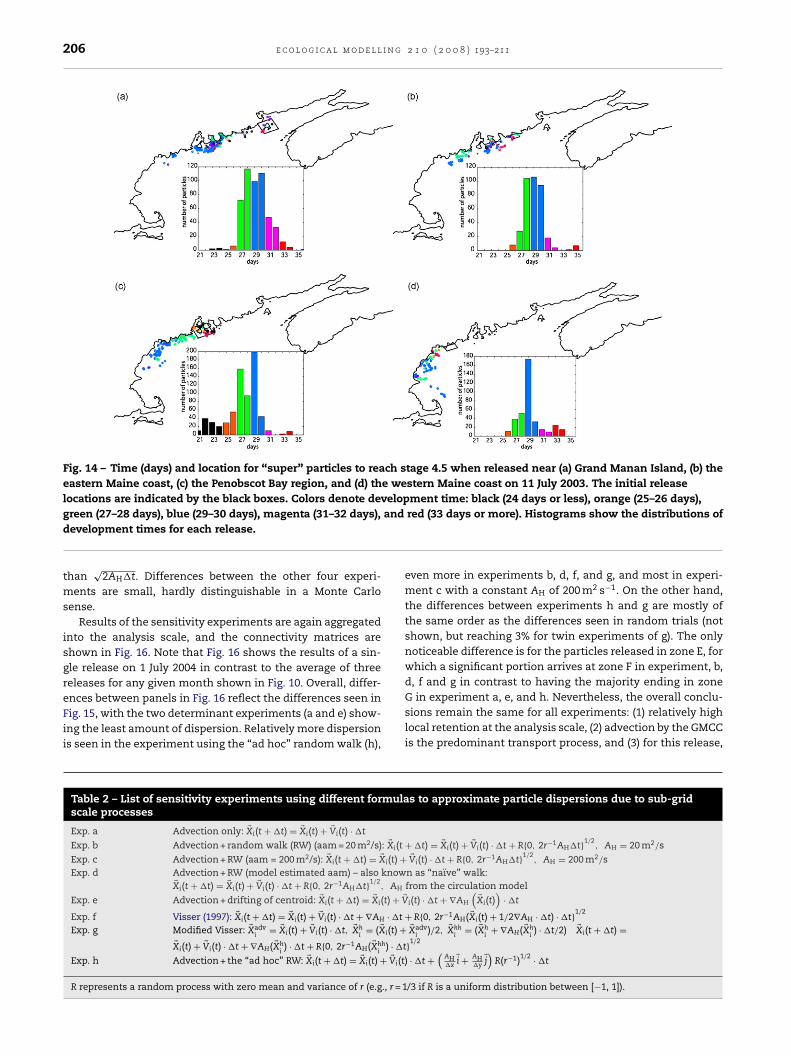
0.20 to 0.04W0. For example, Fig. 14 shows the locations andnumber of days needed for the same “super” particles as in
Fig. 6 to reach stage 4.5. Note that the distribution is muchmore restricted (closer to shore) than that shown in Fig. 5,and that the relative weights of the particles are much greater(11–14×) than at the end of 2 months. The continuing decreasem back to the water at subsequent time steps. Only June
in numbers and progressive transport offshore by the pre-vailing southwesterly winds suggest that recruitment would
benefit from postlarvae settling as soon as possible after theyattain competency to do so (stage 4.5 by our definition here).Recall that these conclusions apply to the case where W0 ishomogeneous in all areas with water depth ≤100 m.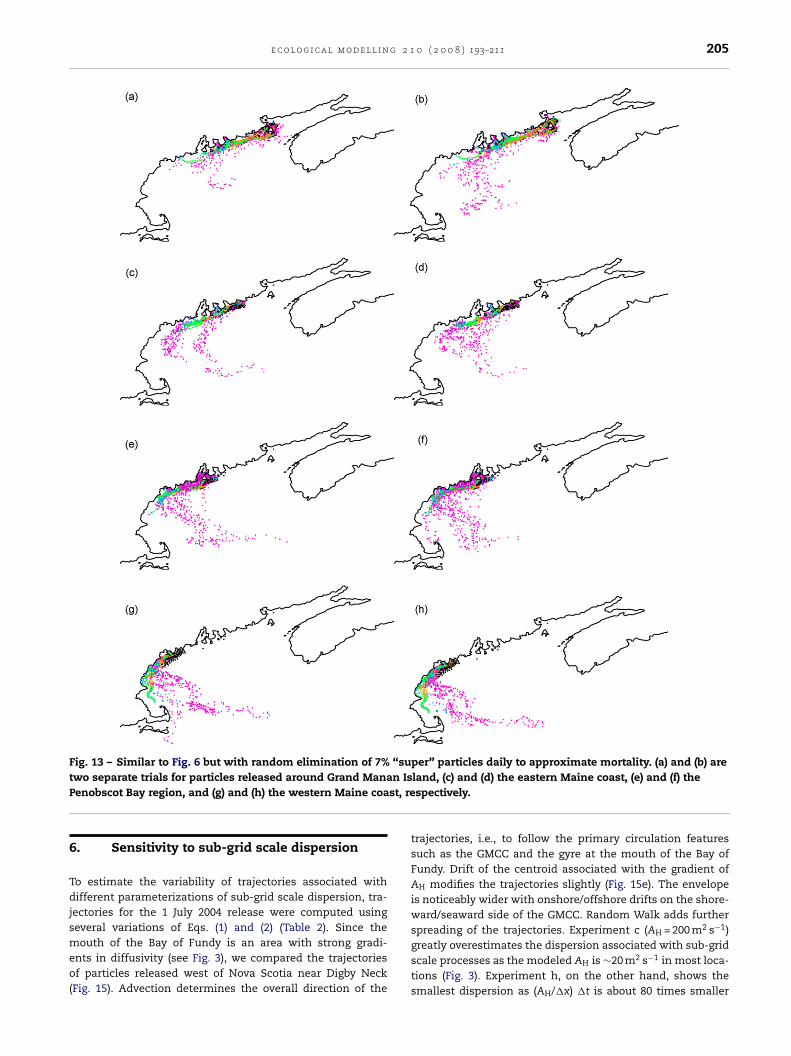
e c o l o g i c a l m o d e l l i n g 2 1 0 ( 2 0 0 8 ) 193–211 205
Fig. 13 – Similar to Fig. 6 but with random elimination of 7% “super” particles daily to approximate mortality. (a) and (b) aret n IsP st, re
6
Tdjsmeo(
wo separate trials for particles released around Grand Manaenobscot Bay region, and (g) and (h) the western Maine coa
. Sensitivity to sub-grid scale dispersion
o estimate the variability of trajectories associated withifferent parameterizations of sub-grid scale dispersion, tra-
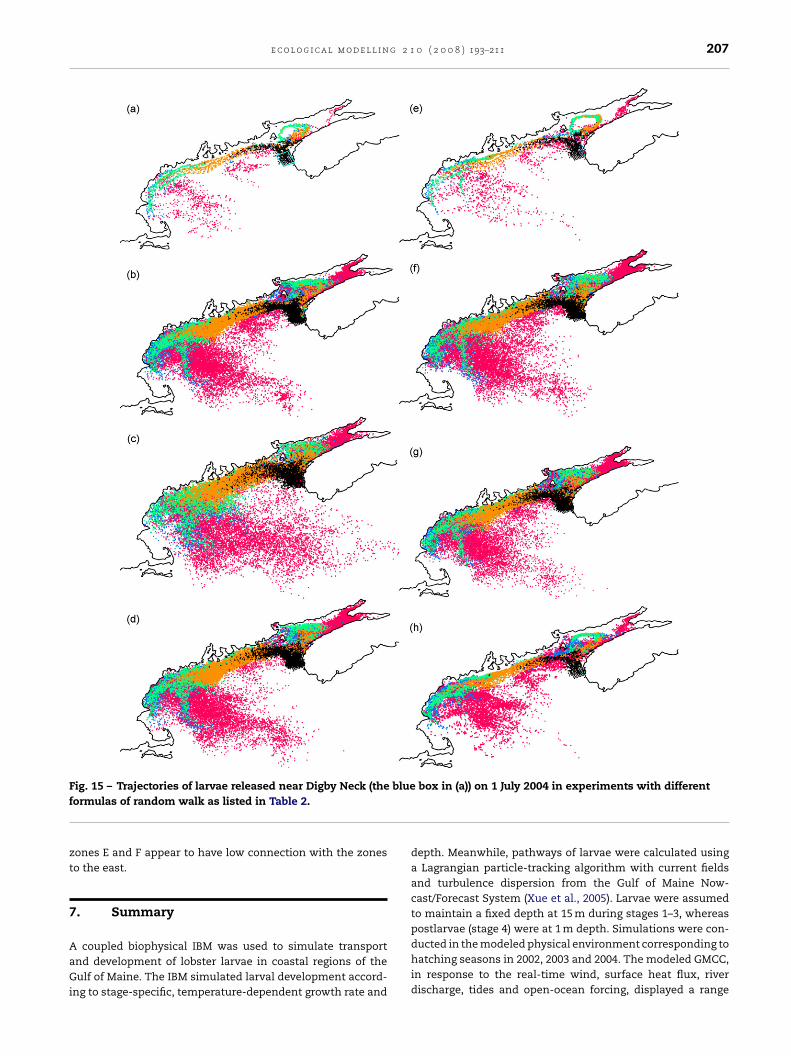
ectories for the 1 July 2004 release were computed usingeveral variations of Eqs. (1) and (2) (Table 2). Since the
outh of the Bay of Fundy is an area with strong gradi-nts in diffusivity (see Fig. 3), we compared the trajectoriesf particles released west of Nova Scotia near Digby Neck
Fig. 15). Advection determines the overall direction of the
land, (c) and (d) the eastern Maine coast, (e) and (f) thespectively.
trajectories, i.e., to follow the primary circulation featuressuch as the GMCC and the gyre at the mouth of the Bay ofFundy. Drift of the centroid associated with the gradient ofAH modifies the trajectories slightly (Fig. 15e). The envelopeis noticeably wider with onshore/offshore drifts on the shore-ward/seaward side of the GMCC. Random Walk adds furtherspreading of the trajectories. Experiment c (A = 200 m2 s−1)
Hgreatly overestimates the dispersion associated with sub-gridscale processes as the modeled AH is ∼20 m2 s−1 in most loca-tions (Fig. 3). Experiment h, on the other hand, shows thesmallest dispersion as (AH/�x) �t is about 80 times smaller
206 e c o l o g i c a l m o d e l l i n g 2 1 0 ( 2 0 0 8 ) 193–211
Fig. 14 – Time (days) and location for “super” particles to reach stage 4.5 when released near (a) Grand Manan Island, (b) theeastern Maine coast, (c) the Penobscot Bay region, and (d) the western Maine coast on 11 July 2003. The initial releaselocations are indicated by the black boxes. Colors denote development time: black (24 days or less), orange (25–26 days),
and
green (27–28 days), blue (29–30 days), magenta (31–32 days),development times for each release.than√
2AH�t. Differences between the other four experi-ments are small, hardly distinguishable in a Monte Carlosense.
Results of the sensitivity experiments are again aggregatedinto the analysis scale, and the connectivity matrices areshown in Fig. 16. Note that Fig. 16 shows the results of a sin-gle release on 1 July 2004 in contrast to the average of threereleases for any given month shown in Fig. 10. Overall, differ-
ences between panels in Fig. 16 reflect the differences seen inFig. 15, with the two determinant experiments (a and e) show-ing the least amount of dispersion. Relatively more dispersionis seen in the experiment using the “ad hoc” random walk (h),Table 2 – List of sensitivity experiments using different formulascale processes
Exp. a Advection only: �Xi(t + �t) = �Xi(t) + �Vi(t) · �t
Exp. b Advection + random walk (RW) (aam = 20 m2/s): �Xi(t
Exp. c Advection + RW (aam = 200 m2/s): �Xi(t + �t) = �Xi(t) +Exp. d Advection + RW (model estimated aam) – also know
�Xi(t + �t) = �Xi(t) + �Vi(t) · �t + R{0, 2r−1AH�t}1/2, AH
Exp. e Advection + drifting of centroid: �Xi(t + �t) = �Xi(t) + �VExp. f Visser (1997): �Xi(t + �t) = �Xi(t) + �Vi(t) · �t + ∇AH · �t
Exp. g Modified Visser: �Xadvi
= �Xi(t) + �Vi(t) · �t, �Xhi
= ( �Xi(t) +�Xi(t) + �Vi(t) · �t + ∇AH( �Xh
i) · �t + R{0, 2r−1AH( �Xhh
i) · �t
Exp. h Advection + the “ad hoc” RW: �Xi(t + �t) = �Xi(t) + �Vi(t
R represents a random process with zero mean and variance of r (e.g., r = 1
red (33 days or more). Histograms show the distributions of
even more in experiments b, d, f, and g, and most in experi-ment c with a constant AH of 200 m2 s−1. On the other hand,the differences between experiments h and g are mostly ofthe same order as the differences seen in random trials (notshown, but reaching 3% for twin experiments of g). The onlynoticeable difference is for the particles released in zone E, forwhich a significant portion arrives at zone F in experiment, b,d, f and g in contrast to having the majority ending in zone
G in experiment a, e, and h. Nevertheless, the overall conclu-sions remain the same for all experiments: (1) relatively highlocal retention at the analysis scale, (2) advection by the GMCCis the predominant transport process, and (3) for this release,s to approximate particle dispersions due to sub-grid
+ �t) = �Xi(t) + �Vi(t) · �t + R{0, 2r−1AH�t}1/2, AH = 20 m2/s
�Vi(t) · �t + R{0, 2r−1AH�t}1/2, AH = 200 m2/s
n as “naı̈ve” walk:from the circulation model
i(t) · �t + ∇AH
(�Xi(t))
· �t
+ R{0, 2r−1AH( �Xi(t) + 1/2∇AH · �t) · �t}1/2
�Xadvi
)/2, �Xhhi
= ( �Xhi
+ ∇AH( �Xhi) · �t/2) �Xi(t + �t) =
}1/2
) · �t +(
AH�x
�i + AH�y
�j)
R(r−1)1/2 · �t
/3 if R is a uniform distribution between [−1, 1]).
e c o l o g i c a l m o d e l l i n g 2 1 0 ( 2 0 0 8 ) 193–211 207
F bluef
zt
7
AaGi
ig. 15 – Trajectories of larvae released near Digby Neck (theormulas of random walk as listed in Table 2.
ones E and F appear to have low connection with the zoneso the east.
. Summary
coupled biophysical IBM was used to simulate transportnd development of lobster larvae in coastal regions of theulf of Maine. The IBM simulated larval development accord-
ng to stage-specific, temperature-dependent growth rate and
box in (a)) on 1 July 2004 in experiments with different
depth. Meanwhile, pathways of larvae were calculated usinga Lagrangian particle-tracking algorithm with current fieldsand turbulence dispersion from the Gulf of Maine Now-cast/Forecast System (Xue et al., 2005). Larvae were assumedto maintain a fixed depth at 15 m during stages 1–3, whereaspostlarvae (stage 4) were at 1 m depth. Simulations were con-
ducted in the modeled physical environment corresponding tohatching seasons in 2002, 2003 and 2004. The modeled GMCC,in response to the real-time wind, surface heat flux, riverdischarge, tides and open-ocean forcing, displayed a range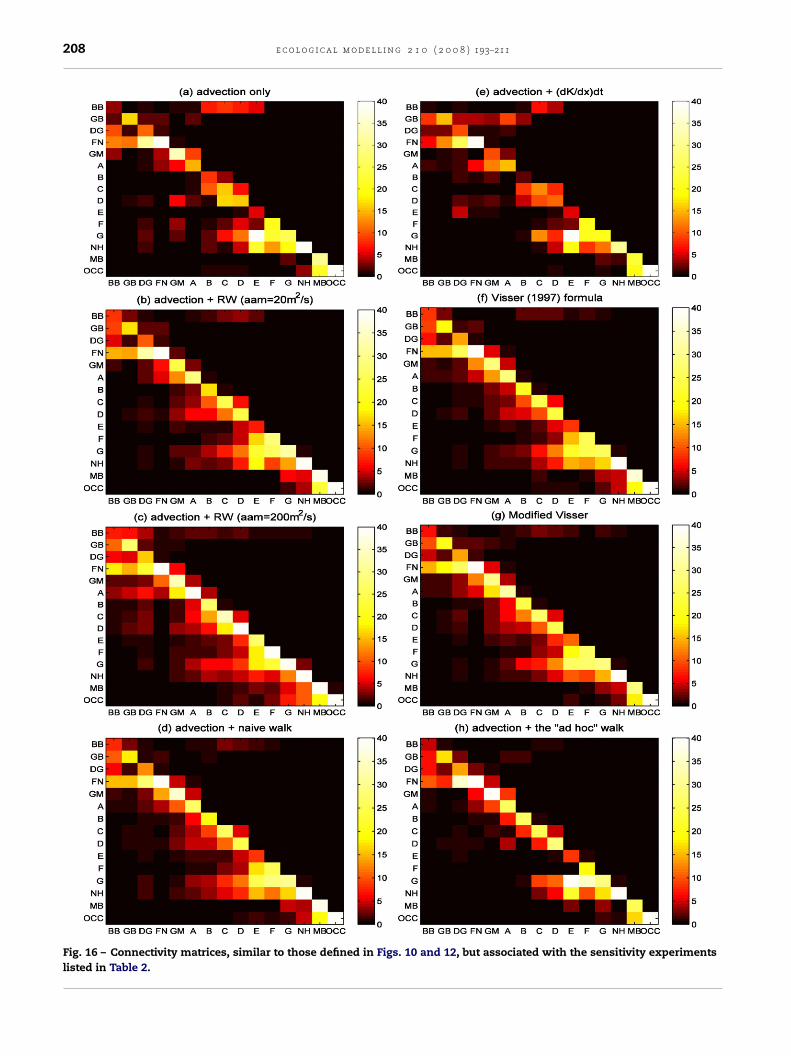
208 e c o l o g i c a l m o d e l l i n g 2 1 0 ( 2 0 0 8 ) 193–211
Fig. 16 – Connectivity matrices, similar to those defined in Figs. 10 and 12, but associated with the sensitivity experimentslisted in Table 2.
g 2 1
ortti2iim
ssptcdFMBosbmctbrtwTdofttpcMwvtad
aimGGwaa
olaltmt
e c o l o g i c a l m o d e l l i n
f circulation regimes over the simulation years. The GMCCegimes varied from little east–west continuity, with most ofhe EMCC turning offshore and a weak WMCC (e.g., 2002),o a highly connected flow-through (2003). Similar contrast-ng flow conditions have been directly observed in 1998 and000 (Pettigrew et al., 2005). The numerical experiments thusnvestigated a realistic range of flow conditions in evaluatingnfluence of GMCC interannual variability on lobster settle-
ent patterns.Although the trajectory of any individual particle is highly
usceptible to flow conditions affected by instantaneous wind,tratification of the water column, interactions with riverlumes, and other factors, the prevailing pathways for plank-onic stages of lobster larvae can be predicted given theharacteristics of the GMCC. For example, the model pre-icts two distinct pathways near the mouth of the Bay ofundy, with one bypassing the Bay to arrive at the coast ofaine directly, and another circulating cyclonically in the
ay and often being entrained in the cyclonic eddy in theuter Bay. The predominant direction of larval movement isouthwestward following the cyclonic coastal current system,ut the within-year and interannual variations substantiallyodify the generalized expectations. Accumulation of parti-
les is relatively low along the eastern Maine coast, whereashe western Maine coast appears to receive particles (larvae)rought from the east by the coastal current system. Theseesults describe the general tendency of water motion to dis-ribute lobster larvae (or similar plankton) along the shelfhen they originate everywhere where water depth is ≤100 m.he patterns will be further modified by spatial and temporalifferences in hatching patterns. There is a significant amountf retention in most zones, indicating considerable potentialor local recruitment in populations. In years when the EMCCurned offshore southeast of Penobscot Bay, more particlesended to accumulate in zones C and D. A small portion ofarticles from zones A, B and C, especially those closer to theoast (inside the 50 m isobath), were able to reach the westernaine coast, while most particles that originated in deeperater (50–100 m depth) tended to veer offshore. Interannual
ariability was apparent in development times. As the wateremperature decreased from 2002 to 2003 then to 2004, theveraged duration needed to reach postlarvae increased by 2–4ays.
The potential contribution from egg hatching even fartherfield, in Canadian waters, was also investigated. Those hatch-ng on Browns Bank had limited impact on the total number of
odeled postlarvae along the US coast, while those from therand Manan region reached as far as the western shore of theulf. These connectivities describe only the potential path-ays, however, as mortality reduces the numerical impact of
ll super-particles over time. Egg production patterns also varynd must be factored into any population-level modeling.
Wind is the primary factor responsible for eastward driftingf postlarvae across vast regions of the open gulf. Transport of
arvae by offshore branches of the EMCC and by the WMCClso contributes to the eastward flux of later stages in some
ocations and years. When larvae develop to stage 4 and moveo near the surface they become part of the easterly move-ent driven by the prevailing southwesterly winds. Relativeiming and strength of the southwesterly wind are thus impor-
0 ( 2 0 0 8 ) 193–211 209
tant in determining the likelihood and the percentage of larvaeoriginated from the Maine coast that potentially settle aroundGerman Bank and Browns Bank. An interesting implication ofthis eastward drift is that it leads to a circular larval transportassemblage.
Local retention rates are relatively high especially if theland boundary is assumed to be sticky. Downstream transportbecomes more important if the larvae are randomly reinjectedinto the water column after they encounter the land boundary.Due to the limited resolution of the present model, processesnear the coast (<10 m deep and <2 grid scales from shore)were not well resolved. Neither simulation fully resolves trans-port processes along the complex shoreline of our modeledarea. Both approaches have interpretive value, however, andtogether they allow one to estimate the proportion of parti-cles that converge on the near-shore environment as a resultof circulation. The circulation model, which represents a sub-stantial step forward in transport and population modeling inthe Gulf of Maine region, is in transition to higher-resolutionsimulations (∼1 km in the horizontal and 30 sigma levels inthe vertical), which will enable us to refine the estimates ofnear-shore transport in the future.
The simple mortality algorithm used in this study(7% day−1 for all stages) results in about 4–20% of larvae devel-oping to postlarvae that are competent to settle (stage 4.5),depending on how long development takes. This numberwould be further reduced during the time required for postlar-vae to settle, and many probably never do (Incze and Wahle,1991; Incze et al., 2000, 2003), in part because they are locatedover deep water where settlement appears to be low (Incze etal., 2006). The initial postlarval population appears relativelyclose to the coastline (Fig. 14), but postlarvae drift farther off-shore and continue to disperse and become less abundant thelonger they remain in the water column (as in Fig. 5). Thetransport pathways depicted in these model results are usefulfor considering potential sources of postlarvae as well as pat-terns of gene flow (where relatively small numbers still count).For example, it seems that postlarvae in the southern Gulf ofMaine might come from a variety of potential source regions(e.g., Fig. 5) that varies among years (Fig. 4). The patterns alsoare very useful for considering transport pathways for otherconstituents of the water column, including holoplanktonicspecies. The next addition to this model should evaluate thequantitative relationships between egg production and set-tlement in lobsters around the Gulf of Maine, which requiresthat we introduce data on egg production, which is not evenlydistributed around the Gulf.
This study represents the first quantitative and spatiallyexplicit analysis of early life history data and coupled biophys-ical recruitment processes for lobsters for the entire coastalGulf of Maine. Further refinements of the coupled biophysi-cal model should include better information on the verticaldistribution of larvae and mortality rates, and increased res-olution of near-shore flows. Additional Lagrangian boundaryconditions and alternative random walk models also shouldbe tested in future renditions of the model.
Though only approximations of the first order for growthand vertical movement have been included in the study,the individual based modeling approach offers advantages toallow ontogenetic details about the targeted organism. Unlike
i n g
r
210 e c o l o g i c a l m o d e l l
the bioenergetics-based model NEMURO.FISH (Megrey et al.,2007; Rose et al., 2007) that is coupled with a lower trophic levelnutrient-phytoplankton-zooplankton model (Kishi et al., 2007)but site specific (i.e., box models), this study takes full advan-tage of the detailed spatial and temporal structures in physicalsimulations by integrating the Lagrangian based biologicalmodel concurrently with an operational coastal circulationmodel. Another notable trait of this study is the analysismethod that employs a scale in which individuals are aggre-gated to result in estimates at the population level. Similarconcept has been adopted in the study of metapopulations ofinsect species (Hilker et al., 2006). The key to the choice of theanalysis scale is that the aggregated results reduce uncertain-ties in estimates associated with individual super-particle, yetthey produce rich spatial patterns associated with the lobsterpopulation in the coastal waters of the Gulf of Maine. Equallyimportant is that the analysis scale coincides with the fisherymanagement scale so that the results from this study can beintegrated into future lobster fishery management policies.
Acknowledgements
This study has benefited from the GoMOOS Nowcast/ForecastSystem and the GoMOOS derived data products. Mr. StephenCousins provided frequent technical assistance to enablecomputations conducted for this study. Other individuals par-ticipated in the synthesis project: Drs. David Brooks, YongChen, David Greenberg, Peter Lawton, Frederick Page, RobertSteneck, David Townsend, Richard Wahle, and Carl Wilson.Their contributions are gratefully acknowledged. We alsothank Dr. Charles Hannah and another anonymous reviewerfor their constructive comments that have led to substantialimprovements of the manuscript. This project was fundedby the U.S. National Oceanic and Atmospheric Administra-tion’s Coastal Ocean Program, Grant NA16OP2669. We alsoacknowledge support for LI from the Alfred P. Sloan Foun-dation (Census of Marine Life) during final analysis andwriting.
e f e r e n c e s
Annis, E.R., 2005. Temperature effects on vertical distribution oflobster postlarvae (Homarus americanus). Limnolol. Oceanogr.50, 1972–1982.
Annis, E.R., Incze, L.S., Wolff, N., Steneck, R.S., 2007. Estimates ofin situ larval development time for the lobster, Homarusamericanus. J. Crustacean Biol. 27, 454–462.
Bartsch, J., Brander, K., Heath, M., Munk, P., Richardson, K.,Svendsen, E., 1989. Modeling the advection of herring larvaein the North Sea. Nature 340, 632–636.
Berntsen, J., Skagen, D.W., Svendsen, E., 1994. Modeling the driftof particles in the North Sea with reference to sandeel larvae.Fish. Oceanogr. 3, 81–91.
Bigelow, H.B., 1927. Physical oceanography of the Gulf of Maine.Fish. Bull. 40, 511–1027.
Brooks, D.A., 1985. Vernal circulation in the Gulf of Maine. J.Geophys. Res. 90, 4687–4705.
Brooks, D.A., 1994. A model study of the buoyancy-drivencirculation in the Gulf of Maine. J. Phys. Oceanogr. 24,2387–2412.
2 1 0 ( 2 0 0 8 ) 193–211
Cobb, J.S., Wang, D., Campbell, D.B., 1989. Timing of settlement bypostlarval lobsters (Homarus americanus): field and laboratoryevidence. J. Crustacean Biol. 9, 60–66.
Cousins, S., Xue, H., Pettigrew, N.R., Mickelson, M., 2006.Responses of the Gulf of Maine to northeasters in May 2005: acase study using the GoMOOS Nowcast/Forecast System. In:Poster presented at the 2006 Ocean Science Meeting,Honolulu, HI.
Cowen, R.K., Paris, C.B., Srinivasan, A., 2006. Scaling ofconnectivity in marine populations. Science 311, 522–527.
Csanady, G.T., 1973. Turbulent Diffusion in the Environment.Reidel, Dordrecht.
Drinkwater, K.F., Harding, G.C., Mann, K.H., Tunner, N., 1996.Temperature as a possible factor in the increased abundanceof American lobster, Homarus americanus, during the 1960sand early 1990s. Fish. Oceanogr. 5, 176–193.
Fogarty, M.J., 1998. Implications of migration and larvalinterchange in American lobster (Homarus americanus) stocks:spatial structure and resilience. In: Jamieson, G.S., Campbell,A. (Eds.), Proceedings of the North Pacific Symposium onInvertebrate Stock Assessment and Management. CanadianSpecial Publication of Canadian Fisheries and AquaticSciences 125, pp. 273–283.
Garrett, C., 1972. Tidal resonance in the Bay of Fundy and Gulf ofMaine. Nature 238, 441–443.
Greenberg, D.A., 1983. Modeling the mean barotropic circulationin the Bay of Fundy and Gulf of Maine. J. Phys. Oceanogr. 13,886–904.
Harding, G.C., Drinkwater, K.F., Hannah, C.G., Pringle, J.D., Prena,J., Loder, J.W., Pearre, S., Vass, W.P., 2005. Larval lobster(Homarus americanus) distribution and drift in the vicinity ofthe Gulf of Maine offshore banks and their probable origins.Fish. Oceanogr. 14, 112–137.
Harding, G.C., Pringle, J.D., Vass, W.P., Pearre Jr., S., Smith, S.J.,1987. Vertical distribution and daily movements of larvallobsters Homarus americanus over Browns Bank, Nova Scotia.Mar. Ecol. Prog. Ser. 41, 29–41.
Harding, G.C., Trites, R.W., 1988. Dispersal of Homarus americanuslarvae in the Gulf of Maine from Browns Bank. Can. J. Fish.Aquat. Sci. 45, 1077–1082.
Hilker, F.M., Hinsch, M., Poethke, H.J., 2006. Parameterizing,evaluating and comparing metapopulation models with datafrom individual-based simulations. Ecol. Modell. 199, 476–485.
Hopkins, T.S., Garfield, N., 1979. Gulf of Maine intermediatewater. J. Mar. Res. 37, 103–139.
Hunter, J.R., Craig, P.D., Phillips, H.E., 1993. On the use of randomwalk models with spatially variable diffusivity. J. Comput.Phys. 106, 366–376.
Incze, L.S., Naimie, C., 2000. Modeling the transport of lobster(homarus americanus) larvae and postlarvae in the Gulf ofMaine. Fish. Oceanogr. 9, 99–113.
Incze, L.S., Wahle, R.A., 1991. Recruitment from pelagic to earlybenthic phase in lobsters Homarus americanus. Mar. Ecol. Progr.Ser. 79, 77–97.
Incze, L.S., Wahle, R.A., Cobb, J.S., 1997. Quantitive relationshipsbetween postlarval production and benthic recruitment inlobsters Homarus americanus. Mar. Freshwater Res. 48, 729–743.
Incze, L.S., Wahle, R.A., Palma, A., 2000. Advection and settlementrates in a benthic invertebrate: recruitment to first benthicstage in Homarus americanus. J. Mar. Sci. 57, 430–437.
Incze, L.S., Wolff, N., Wahle, R.A., 2003. Can scientificobservations of early life stages be scaled up to the level of afished population? A case study using Homarus americanus.Fish. Res. 65, 33–46.
Incze, L.S., Wahle, R.A., Wolff, N., Wilson, C., Steneck, R., Annis,E., Lawton, P., Xue, H., Chen, Y., 2006. Early life history oflobster (Homarus americanus) populations in the Gulf of Maine.J. Crustacean Biol. 26, 555–564.
g 2 1
K
L
L
M
M
M
M
P
P
P
P
R
e c o l o g i c a l m o d e l l i n
ishi, M.J., Kashiwai, M., Ware, D.M., Megrey, B.A., Eslinger, D.L.,Werner, F.E., Aita, M.N., Azumaya, T., Fujii, M., Hashimoto, S.,Huang, D., Iizumi, H., Ishida, Y., Kang, S., Kantakov, G.A., Kim,H.-C., Komatsu, K., Navrotsky, V.V., Smith, S.L., Tadokoro, K.,Tsuda, A., Yamamura, O., Yamanaka, Y., Yokouchi, K., Yoshie,N., Zhang, J., Zuenko, Y.I., Zvalinsky, V.I., 2007. NEMURO—alower trophic level model for the North Pacific marineecosystem. Ecol. Modell. 202, 12–25.
awton, P., Lavalli, K.L., 1995. Postlarval, juvenile, adolescent andadult ecology. In: Factor, J.R. (Ed.), Biology of the Lobster.Academic Press, New York, pp. 47–88.
oder, J.W., 1980. Topographic rectification of tidal currents on thesides of Georges Bank. J. Phys. Oceanogr. 10, 1399–1416.
acKenzie, B.R., 1988. Assessment of temperature effects oninterrelationships between stage durations, mortality, andgrowth in laboratory-reared Homarus americanus MilneEdwards. J. Exp. Mar. Biol. Ecol. 116, 87–98.
egrey, B.A., Rose, K.A., Klumb, R.A., Hay, D.E., Werner, F.E.,Eslinger, D.L., Smith, S.L., 2007. A bioenergetics-basedpopulation dynamics model of Pacific herring (Clupea harenguspallasii) coupled to a lower trophic levelnutrient-phytoplankton-zooplankton model: description,calibration and sensitivity analysis. Ecol. Modell. 2002,144–164.
ellor, G.L., 2003. Users Guide for a Three-Dimensional, PrimitiveEquation, Numerical Ocean Model. Princeton University, 53pp.
ellor, G.L., Yamada, T., 1982. Development of a turbulanceclosure model for geophysical fluid problems. Rev. Geophys.Space Phys. 20, 851–875.
age, F., Sinclair, H.M., Naimie, C.E., Loder, J.W., Losier, R.J.,Berrien, P.L., Lough, R.G., 1999. Cod and haddock spawning onGeorges Bank in relation to water residence times. Fish.Oceanogr. 8, 212–216.
ettigrew, N.R., Churchill, J.H., Janzen, C.D., Mangum, L., Signell,R.P., Thomas, A., Townsend, D.W., Wallinga, J.P., Xue, H., 2005.The kinematic and hydrographic structure of the Gulf ofMaine Coastal Current. Deep Sea Res. II 52, 2369–2391.
ettigrew, N.R., Townsend, D.W., Xue, H., Jwallinga, J.P., Brickley,P.J., Hetland, R.D., 1998. Observations of the eastern Mainecoastal current and its offshore extensions. J. Geophys. Res.103, 30623–30640.
ringle, J.M., 2006. Sources of variability in Gulf of Mainecirculation, and the observations needed to model it. DeepSea Res. II 53, 2457–2476.
aineault, N., Xue, H. Temporal and spatial variability of surfacemeteorological conditions over the Gulf of Maine:
0 ( 2 0 0 8 ) 193–211 211
comparisons of the National Data Buoy Center observationsand Eta model results. Mon. Wea. Rev., submitted forpublication.
Rose, K.A., Werner, F.E., Megrey, B.A., Aita, M.N., Yamanaka, Y.,Hay, E.E., 2007. Simulated herring growth responses in theNortheastern Pacific to historic temperature and zooplanktonconditions generated by the 3-dimensional NEMUROnutrient-phytoplankton-zooplankton model. Ecol. Modell.202, 184–195.
Ramp, S., Schlitz, R.J., Wright, W.R., 1985. The deep flow throughthe Northeast Channel, Gulf of Maine. J. Phys. Oceanogr. 15,1790–1808.
Smagorinsky, J., 1963. General circulation experiments with theprimitive equations. I. The basic experiment. Mon. Wea. Rev.91, 99–164.
Smith, P.C., 1983. The mean and seasonal circulation offsoutheast Nova Scotia. J. Phys. Oceanogr. 13, 1034–1054.
Steneck, R.S., Acheson, J.M., 1997. Bust and then boom in theMaine lobster industry: perspectives of fishers and biologists.North Am. J. Fish. Manage. 17, 826–847.
Steneck, R.S., Wilson, C., 2001. Large-scale and long-term, spatialand temporal patterns in demography and landings of theAmerican lobster, Homarus americanus. Mar. Freshwater Res.52, 1303–1319.
Taylor, G.I., 1921. Diffusion by continuous movements. Proc.Lond. Math. Soc. 20, 196–211.
Visser, A.W., 1997. Using random walk models to simulate thevertical distribution of particles in a turbulent water column.Mar. Ecol. Prog. Ser. 158, 275–328.
Wahle, R.A., Incze, L.S., 1997. Pre- and post-settlement processesin recruitment of the American lobster. J. Exp. Mar. Biol. Ecol.217, 179–207.
Wahle, R.A., Incze, L.S., Fogarty, M.J., 2004. First projections ofAmerican lobster fishery recruitment using a settlementindex and variable growth. Bull. Mar. Sci. 74, 101–114.
Werner, F.E., Perry, R.I., Lough, R.G., Naimie, C.E., 1996.Trophydynamic and advective influences on Georges BankLarval cod and haddock. Deep Sea Res. II 43, 1793–1822.
Werner, F.E., Quinlan, J.A., Lough, R.G., Lynch, D.R., 2001.Spatially-explicit individual based modeling of Marinepopulations: a review of the advances in 1990s. Sarsia 86,411–421.
Xue, H., Chai, F., Pettigrew, N.R., 2000. A model study of seasonalcirculation in the Gulf of Maine. J. Phys. Oceanogr. 30,1111–1135.
Xue, H., Shi, L., Cousins, S., Pettigrew, N.R., 2005. The GoMOOSnowcast/forecast system. Cont. Shelf Res. 25, 2122–2146.