connecticut - ct.gov
TRANSCRIPT
Connecticut Statewide Lake Nutrient TMDL
1
Connecticut Statewide Lake Nutrient
Total Maximum Daily Load Core Document
December 13, 2021
Connecticut Statewide Lake Nutrient TMDL
i
This work was supported by grants provided by the United States Environmental Protection Agency. Horsley Witten Group, 294 Washington Street, Suite 801, Boston, MA 02108 and FB Environmental Associates, 97A Exchange Street, Suite 305, Portland, Maine 04101, provided support to this project in fulfillment of Task 2 of the Purchase Order #68HE0119F0049 and Contract Number BPA-68HE0118A0002 issued on September 27, 2019. NOTICE OF AVAILABILITY This report is available on CT DEEP’s web page: CT DEEP Bantam Lake Project Website DISCLAIMER References to trade names, commercial products, manufacturers, or distributors in this report constituted neither endorsement nor recommendations by the CT DEEP for use. Much of this document and the appendices were prepared using text and general guidance from the EPA-approved A TMDL Analysis for Kenosia Lake in Danbury, Connecticut (2004), Final TMDL for Phosphorus for Haunted Lake, Francestown, NH (2019), and Connecticut Statewide Bacteria TMDL (2012).
DEDICATION:
This document is dedicated in memory of Tobias “Toby” Stover in recognition of his significant contributions to this effort. Toby worked at the United States Environmental Protection Agency Region 1 where he was a water quality scientist and served as the coordinator for nutrient related issues for the Region. Toby was a dedicated member of the team of scientists from CTDEEP and EPA who worked together to develop the approach used in this project to analyze and manage nutrient-related impacts on lakes, ponds and impoundments in Connecticut. Toby was a quiet and thoughtful person who cared deeply for protecting environmental resources in New England. His contributions helped to set a strong scientific foundation for this work and will make a difference for the environment and the people of Connecticut into the future. Toby passed away as this project was being finalized. He is deeply missed by all who knew him.
Connecticut Statewide Lake Nutrient TMDL
i
ACRONYM LIST AFO Animal Feeding Operation BMP Best Management Practice CAF Confined Animal Facility CALM Consolidated Assessment and Listing Methodology CFR Code of Federal Regulations CI Confidence Intervals CLEAR UConn’s Center for Land Use Education and Research CNMP Comprehensive Nutrient Management Plan CSO Combined Sewer Overflow CT DEEP Connecticut Department of Energy and Environmental Protection CT DPH Connecticut Department of Public Health CV Coefficient of Variance CVA Clean Vessel Act CWA Clean Water Act CWF Clean Water Fund DCIA Directly Connected Impervious Area DOT Department of Transportation EPA United States Environmental Protection Agency EQIP Environmental Quality Incentives Program HAB Harmful Algal Bloom HEAP Horse environmental Awareness Program HSPF Hydrological Simulation Program Fortran IDDE Illicit Discharge Detection and Elimination IWQR Integrated Water Quality Report LA Load Allocation LAGOS Lake Multi-scaled Geospatial and Temporal Database LID Low Impact Development LISFF Long Island Sound Futures Fund LLRM Lake Loading Response Model MOS Margin of Safety MS4 Municipal Separate Storm Sewer System NEIWPCC New England Interstate Water Pollution Control Commission NELP New England Lake and Pond Study NEMO National Nonpoint Education for Municipal Officials NHD National Hydrography Dataset NLA National Lakes Assessment NLCD National Land Cover Dataset NOAA National Oceanic & Atmospheric Administration NPDES National Pollutant Discharge Elimination System NPS Nonpoint Source NRCS Natural Resource Conservation Service O&M Operation and Maintenance
Connecticut Statewide Lake Nutrient TMDL
ii
POTW Publicly Owned Treatment Works PPP Pollution Prevention Plan PS Point Source PWS Public Water System QAPP Quality Assurance Project Plan RCSA Regulations of Connecticut State Agencies SAP Sampling and Analysis Plan SSO Sanitary Sewer Overflow SSDS Subsurface Sewage Treatment and Disposal System SWMP Stormwater Management Plan TMDL Total Maximum Daily Load UNHSC University of New Hampshire Stormwater Center USDA United States Department of Agriculture WBP Watershed Based Plan WEP Water and Environment Program WHIP Wildlife Habitat Incentive Program WLA Waste Load Allocation WPCF Wastewater Pollution Control Facilities WQS Water Quality Standards
Connecticut Statewide Lake Nutrient TMDL
iii
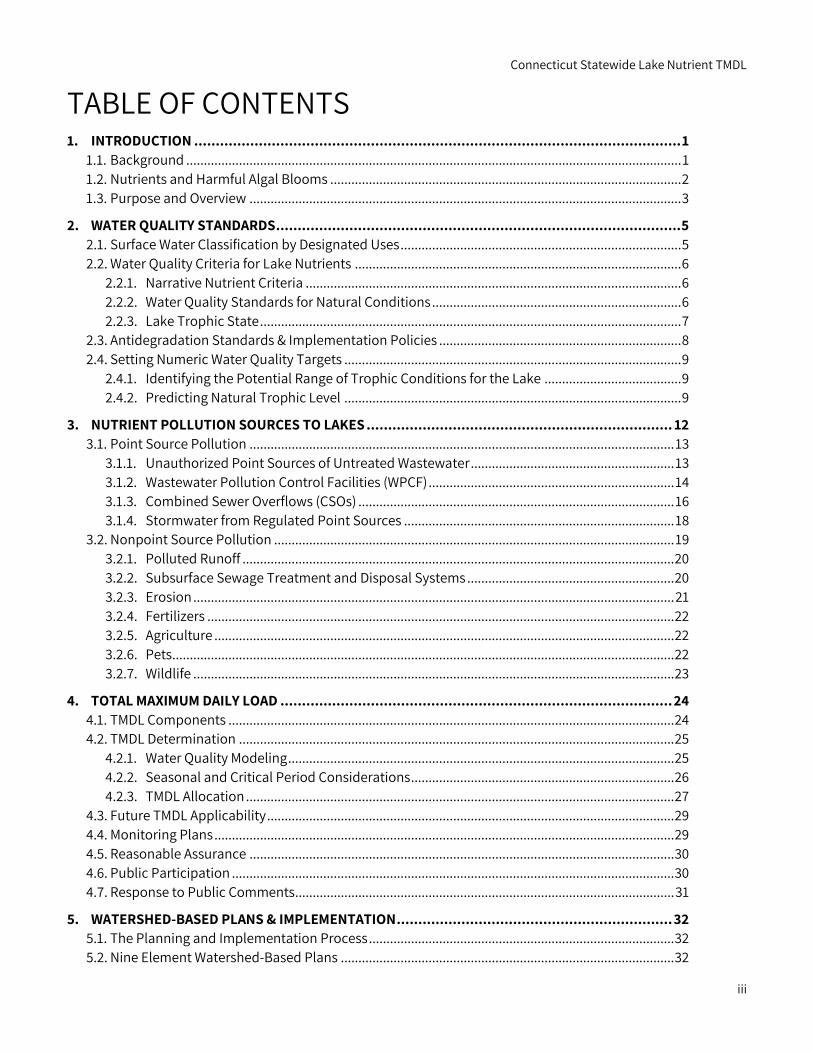
TABLE OF CONTENTS 1. INTRODUCTION ................................................................................................................. 1
1.1. Background ............................................................................................................................................. 1
1.2. Nutrients and Harmful Algal Blooms .................................................................................................... 2
1.3. Purpose and Overview ........................................................................................................................... 3
2. WATER QUALITY STANDARDS .............................................................................................. 5
2.1. Surface Water Classification by Designated Uses ................................................................................ 5
2.2. Water Quality Criteria for Lake Nutrients ............................................................................................. 6
2.2.1. Narrative Nutrient Criteria ........................................................................................................... 6
2.2.2. Water Quality Standards for Natural Conditions ....................................................................... 6
2.2.3. Lake Trophic State ........................................................................................................................ 7
2.3. Antidegradation Standards & Implementation Policies ..................................................................... 8
2.4. Setting Numeric Water Quality Targets ................................................................................................ 9
2.4.1. Identifying the Potential Range of Trophic Conditions for the Lake ....................................... 9
2.4.2. Predicting Natural Trophic Level ................................................................................................ 9
3. NUTRIENT POLLUTION SOURCES TO LAKES ....................................................................... 12
3.1. Point Source Pollution ......................................................................................................................... 13
3.1.1. Unauthorized Point Sources of Untreated Wastewater .......................................................... 13
3.1.2. Wastewater Pollution Control Facilities (WPCF) ...................................................................... 14
3.1.3. Combined Sewer Overflows (CSOs) .......................................................................................... 16
3.1.4. Stormwater from Regulated Point Sources ............................................................................. 18
3.2. Nonpoint Source Pollution .................................................................................................................. 19
3.2.1. Polluted Runoff ........................................................................................................................... 20
3.2.2. Subsurface Sewage Treatment and Disposal Systems ........................................................... 20
3.2.3. Erosion ......................................................................................................................................... 21
3.2.4. Fertilizers ..................................................................................................................................... 22
3.2.5. Agriculture ................................................................................................................................... 22
3.2.6. Pets ............................................................................................................................................... 22
3.2.7. Wildlife ......................................................................................................................................... 23
4. TOTAL MAXIMUM DAILY LOAD ........................................................................................... 24
4.1. TMDL Components ............................................................................................................................... 24
4.2. TMDL Determination ............................................................................................................................ 25
4.2.1. Water Quality Modeling .............................................................................................................. 25
4.2.2. Seasonal and Critical Period Considerations ........................................................................... 26
4.2.3. TMDL Allocation .......................................................................................................................... 27
4.3. Future TMDL Applicability .................................................................................................................... 29
4.4. Monitoring Plans ................................................................................................................................... 29
4.5. Reasonable Assurance ......................................................................................................................... 30
4.6. Public Participation .............................................................................................................................. 30
4.7. Response to Public Comments ............................................................................................................ 31
5. WATERSHED-BASED PLANS & IMPLEMENTATION ................................................................ 32
5.1. The Planning and Implementation Process ....................................................................................... 32
5.2. Nine Element Watershed-Based Plans ............................................................................................... 32
Connecticut Statewide Lake Nutrient TMDL
iv
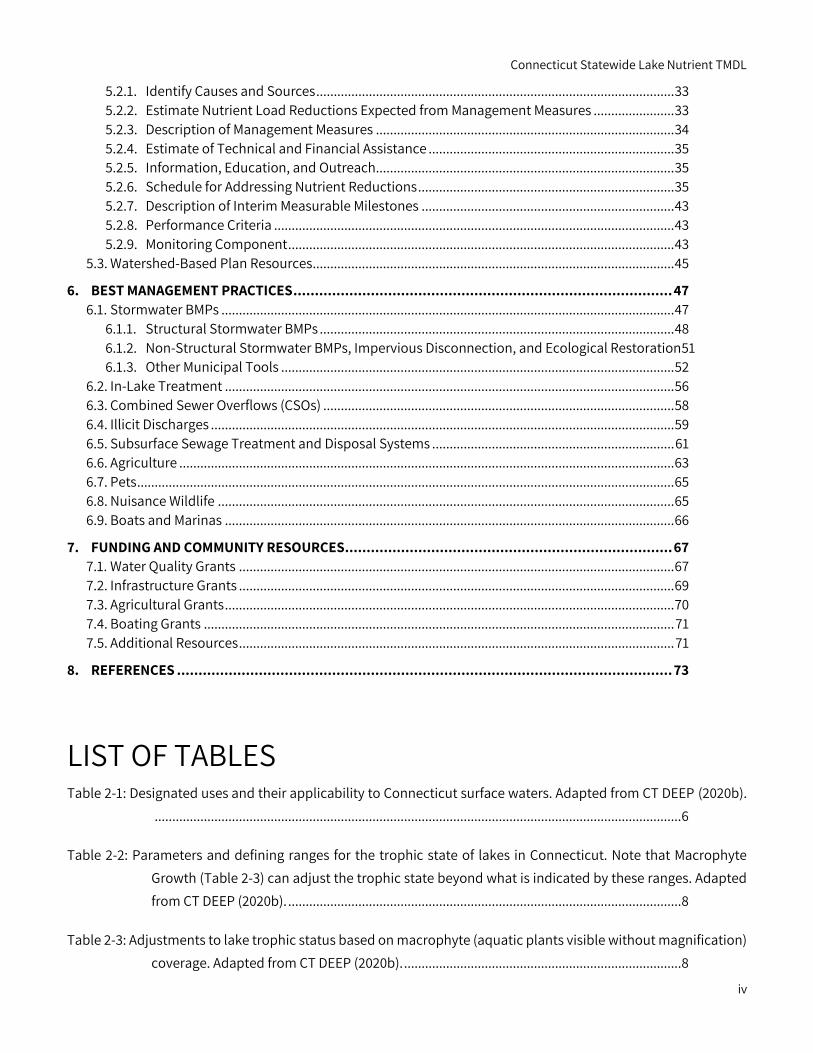
5.2.1. Identify Causes and Sources ...................................................................................................... 33
5.2.2. Estimate Nutrient Load Reductions Expected from Management Measures ....................... 33
5.2.3. Description of Management Measures ..................................................................................... 34
5.2.4. Estimate of Technical and Financial Assistance ...................................................................... 35
5.2.5. Information, Education, and Outreach ..................................................................................... 35
5.2.6. Schedule for Addressing Nutrient Reductions ......................................................................... 35
5.2.7. Description of Interim Measurable Milestones ........................................................................ 43
5.2.8. Performance Criteria .................................................................................................................. 43
5.2.9. Monitoring Component .............................................................................................................. 43
5.3. Watershed-Based Plan Resources ....................................................................................................... 45
6. BEST MANAGEMENT PRACTICES ........................................................................................ 47
6.1. Stormwater BMPs ................................................................................................................................. 47
6.1.1. Structural Stormwater BMPs ..................................................................................................... 48
6.1.2. Non-Structural Stormwater BMPs, Impervious Disconnection, and Ecological Restoration51
6.1.3. Other Municipal Tools ................................................................................................................ 52
6.2. In-Lake Treatment ................................................................................................................................ 56
6.3. Combined Sewer Overflows (CSOs) .................................................................................................... 58
6.4. Illicit Discharges .................................................................................................................................... 59
6.5. Subsurface Sewage Treatment and Disposal Systems ..................................................................... 61
6.6. Agriculture ............................................................................................................................................. 63
6.7. Pets ......................................................................................................................................................... 65
6.8. Nuisance Wildlife .................................................................................................................................. 65
6.9. Boats and Marinas ................................................................................................................................ 66
7. FUNDING AND COMMUNITY RESOURCES ............................................................................ 67
7.1. Water Quality Grants ............................................................................................................................ 67
7.2. Infrastructure Grants ............................................................................................................................ 69
7.3. Agricultural Grants ................................................................................................................................ 70
7.4. Boating Grants ...................................................................................................................................... 71
7.5. Additional Resources ............................................................................................................................ 71
8. REFERENCES ................................................................................................................... 73
LIST OF TABLES Table 2-1: Designated uses and their applicability to Connecticut surface waters. Adapted from CT DEEP (2020b).
...................................................................................................................................................... 6
Table 2-2: Parameters and defining ranges for the trophic state of lakes in Connecticut. Note that Macrophyte Growth (Table 2-3) can adjust the trophic state beyond what is indicated by these ranges. Adapted from CT DEEP (2020b). ................................................................................................................ 8
Table 2-3: Adjustments to lake trophic status based on macrophyte (aquatic plants visible without magnification) coverage. Adapted from CT DEEP (2020b). ............................................................................... 8
Connecticut Statewide Lake Nutrient TMDL
v
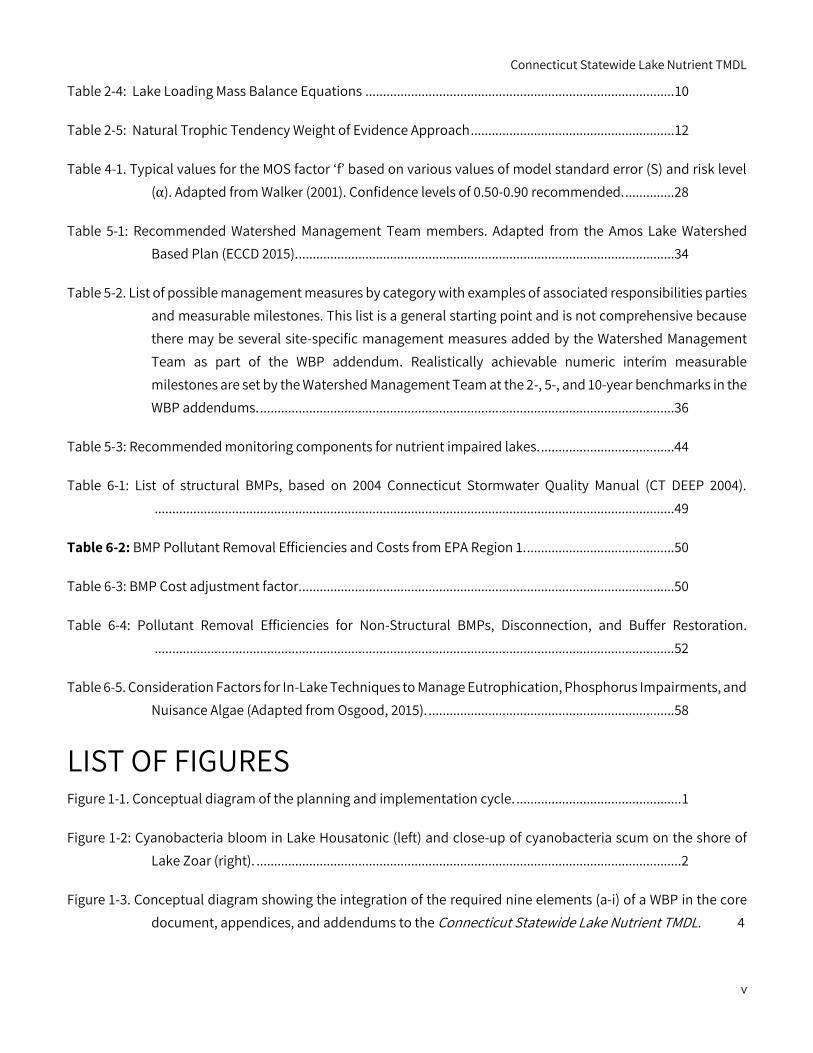
Table 2-4: Lake Loading Mass Balance Equations ........................................................................................ 10
Table 2-5: Natural Trophic Tendency Weight of Evidence Approach .......................................................... 12
Table 4-1. Typical values for the MOS factor ‘f’ based on various values of model standard error (S) and risk level (α). Adapted from Walker (2001). Confidence levels of 0.50-0.90 recommended. ..............28
Table 5-1: Recommended Watershed Management Team members. Adapted from the Amos Lake Watershed Based Plan (ECCD 2015). ...........................................................................................................34
Table 5-2. List of possible management measures by category with examples of associated responsibilities parties and measurable milestones. This list is a general starting point and is not comprehensive because there may be several site-specific management measures added by the Watershed Management Team as part of the WBP addendum. Realistically achievable numeric interim measurable milestones are set by the Watershed Management Team at the 2-, 5-, and 10-year benchmarks in the WBP addendums. ......................................................................................................................36
Table 5-3: Recommended monitoring components for nutrient impaired lakes. ......................................44
Table 6-1: List of structural BMPs, based on 2004 Connecticut Stormwater Quality Manual (CT DEEP 2004). ....................................................................................................................................................49
Table 6-2: BMP Pollutant Removal Efficiencies and Costs from EPA Region 1. ..........................................50
Table 6-3: BMP Cost adjustment factor. ..........................................................................................................50
Table 6-4: Pollutant Removal Efficiencies for Non-Structural BMPs, Disconnection, and Buffer Restoration. ....................................................................................................................................................52
Table 6-5. Consideration Factors for In-Lake Techniques to Manage Eutrophication, Phosphorus Impairments, and Nuisance Algae (Adapted from Osgood, 2015). ......................................................................58
LIST OF FIGURES Figure 1-1. Conceptual diagram of the planning and implementation cycle. ............................................... 1
Figure 1-2: Cyanobacteria bloom in Lake Housatonic (left) and close-up of cyanobacteria scum on the shore of Lake Zoar (right). ......................................................................................................................... 2
Figure 1-3. Conceptual diagram showing the integration of the required nine elements (a-i) of a WBP in the core document, appendices, and addendums to the Connecticut Statewide Lake Nutrient TMDL. 4
Connecticut Statewide Lake Nutrient TMDL
vi
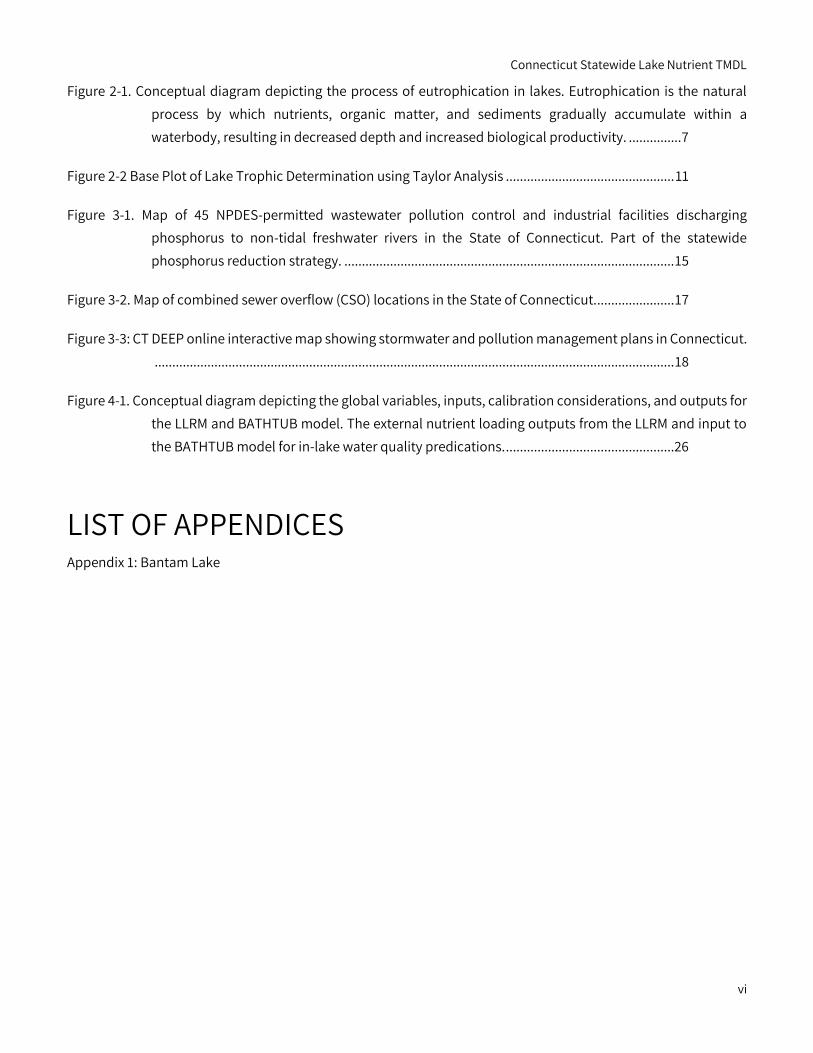
Figure 2-1. Conceptual diagram depicting the process of eutrophication in lakes. Eutrophication is the natural process by which nutrients, organic matter, and sediments gradually accumulate within a waterbody, resulting in decreased depth and increased biological productivity. ............... 7
Figure 2-2 Base Plot of Lake Trophic Determination using Taylor Analysis ................................................ 11
Figure 3-1. Map of 45 NPDES-permitted wastewater pollution control and industrial facilities discharging phosphorus to non-tidal freshwater rivers in the State of Connecticut. Part of the statewide phosphorus reduction strategy. .............................................................................................. 15
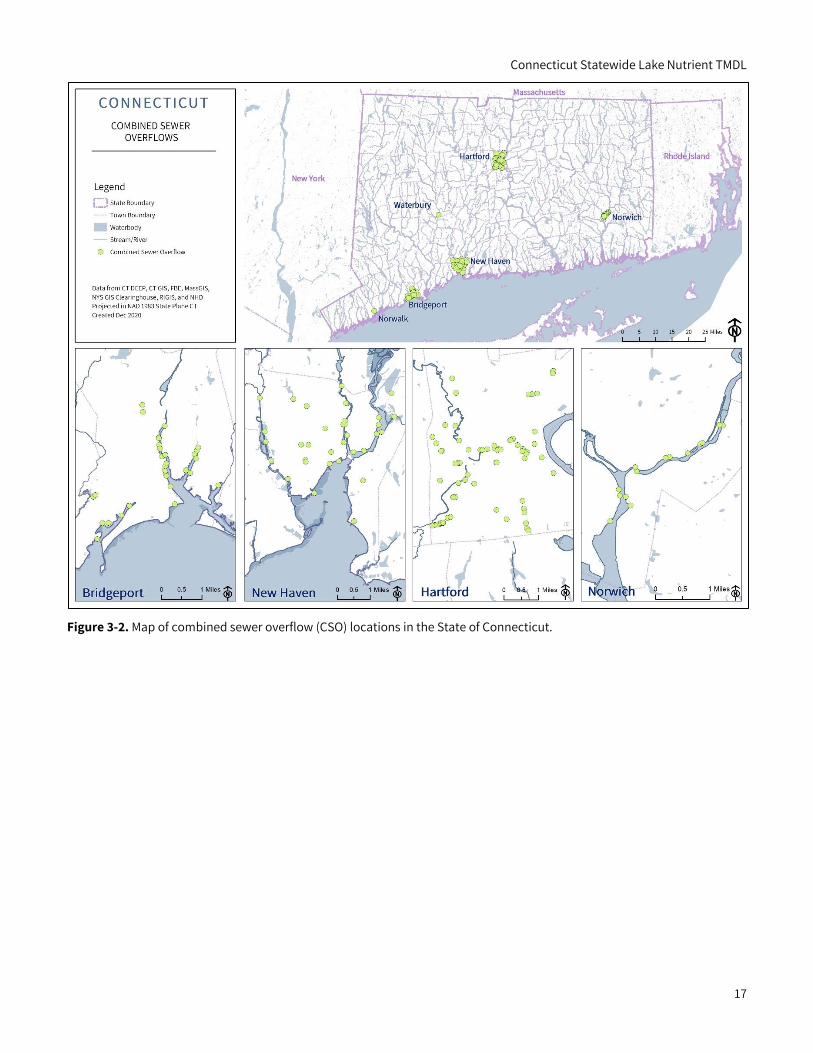
Figure 3-2. Map of combined sewer overflow (CSO) locations in the State of Connecticut. ...................... 17
Figure 3-3: CT DEEP online interactive map showing stormwater and pollution management plans in Connecticut. .................................................................................................................................................... 18
Figure 4-1. Conceptual diagram depicting the global variables, inputs, calibration considerations, and outputs for the LLRM and BATHTUB model. The external nutrient loading outputs from the LLRM and input to the BATHTUB model for in-lake water quality predications. ................................................26
LIST OF APPENDICES Appendix 1: Bantam Lake
Connecticut Statewide Lake Nutrient TMDL
1
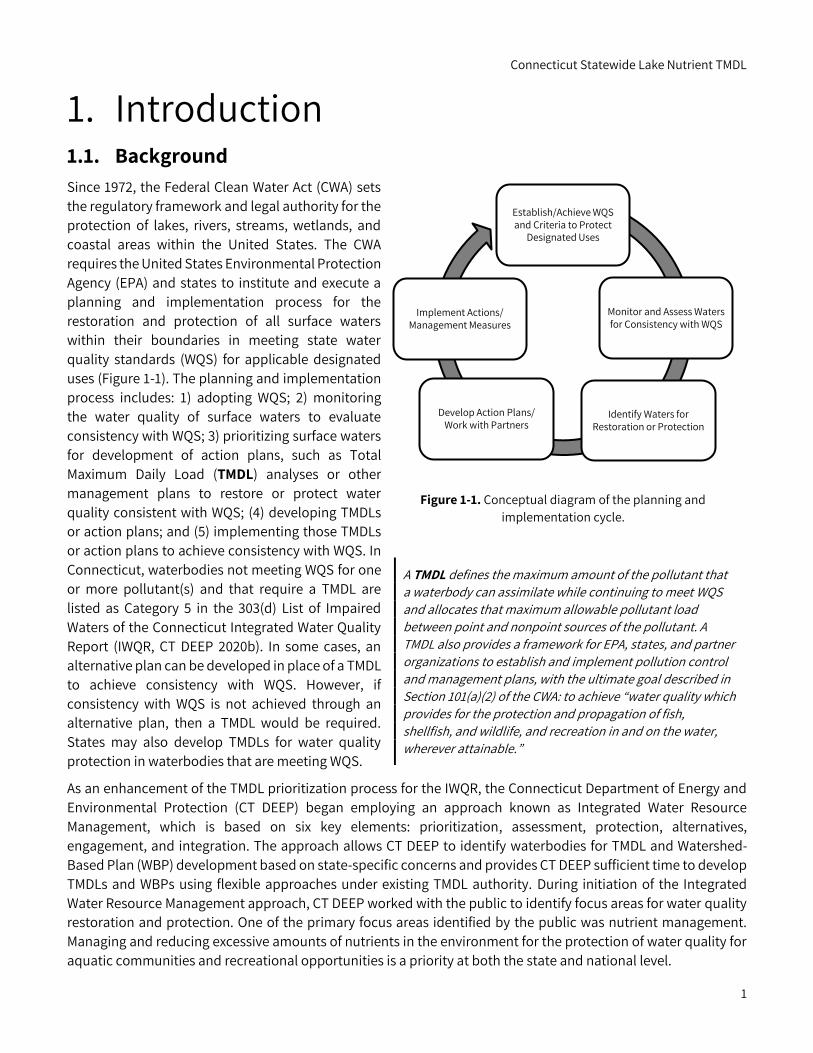
1. Introduction 1.1. Background Since 1972, the Federal Clean Water Act (CWA) sets the regulatory framework and legal authority for the protection of lakes, rivers, streams, wetlands, and coastal areas within the United States. The CWA requires the United States Environmental Protection Agency (EPA) and states to institute and execute a planning and implementation process for the restoration and protection of all surface waters within their boundaries in meeting state water quality standards (WQS) for applicable designated uses (Figure 1-1). The planning and implementation process includes: 1) adopting WQS; 2) monitoring the water quality of surface waters to evaluate consistency with WQS; 3) prioritizing surface waters for development of action plans, such as Total Maximum Daily Load (TMDL) analyses or other management plans to restore or protect water quality consistent with WQS; (4) developing TMDLs or action plans; and (5) implementing those TMDLs or action plans to achieve consistency with WQS. In Connecticut, waterbodies not meeting WQS for one or more pollutant(s) and that require a TMDL are listed as Category 5 in the 303(d) List of Impaired Waters of the Connecticut Integrated Water Quality Report (IWQR, CT DEEP 2020b). In some cases, an alternative plan can be developed in place of a TMDL to achieve consistency with WQS. However, if consistency with WQS is not achieved through an alternative plan, then a TMDL would be required. States may also develop TMDLs for water quality protection in waterbodies that are meeting WQS.
As an enhancement of the TMDL prioritization process for the IWQR, the Connecticut Department of Energy and Environmental Protection (CT DEEP) began employing an approach known as Integrated Water Resource Management, which is based on six key elements: prioritization, assessment, protection, alternatives, engagement, and integration. The approach allows CT DEEP to identify waterbodies for TMDL and Watershed-Based Plan (WBP) development based on state-specific concerns and provides CT DEEP sufficient time to develop TMDLs and WBPs using flexible approaches under existing TMDL authority. During initiation of the Integrated Water Resource Management approach, CT DEEP worked with the public to identify focus areas for water quality restoration and protection. One of the primary focus areas identified by the public was nutrient management. Managing and reducing excessive amounts of nutrients in the environment for the protection of water quality for aquatic communities and recreational opportunities is a priority at both the state and national level.
A TMDL defines the maximum amount of the pollutant that a waterbody can assimilate while continuing to meet WQS and allocates that maximum allowable pollutant load between point and nonpoint sources of the pollutant. A TMDL also provides a framework for EPA, states, and partner organizations to establish and implement pollution control and management plans, with the ultimate goal described in Section 101(a)(2) of the CWA: to achieve “water quality which provides for the protection and propagation of fish, shellfish, and wildlife, and recreation in and on the water, wherever attainable.”
Establish/Achieve WQS and Criteria to Protect
Designated Uses
Monitor and Assess Waters for Consistency with WQS
Identify Waters for Restoration or Protection
Develop Action Plans/ Work with Partners
Implement Actions/ Management Measures
Figure 1-1. Conceptual diagram of the planning and implementation cycle.
Connecticut Statewide Lake Nutrient TMDL
2
Prior to the use of Integrated Water Resource Management, Public Act 12-155 An Act Concerning Phosphorus Reduction in State Waters was passed and required CT DEEP and select municipalities to collaboratively develop recommendations for a statewide strategy to reduce phosphorus loadings consistent with WQS in inland non-tidal waters. A coordinating committee and working groups were formed to accomplish this task. Work groups evaluated phosphorus in ambient waters affected by nonpoint sources and in point source discharges from sewage treatment plants. The committee and work groups then developed and provided a final report with recommendations to the Connecticut legislature. The final report identified the need to manage phosphorus impacts on lakes and recommended taking an integrated approach to phosphorus management. TMDL studies, TMDL alternatives, and WBPs were all identified as important tools for addressing nutrient-related water quality impacts (CT DEEP 2017).
1.2. Nutrients and Harmful Algal Blooms Nutrients such as phosphorus and nitrogen, as well as algae and cyanobacteria, naturally occur in the environment, including lakes and tributaries and their contributing watersheds, and are essential to lake health. Under natural conditions, algae and cyanobacteria concentrations are regulated by limited nutrient inputs and lake mixing processes that keep them from growing too rapidly. However, human related disturbances, such as erosion, overapplied fertilizers, polluted stormwater runoff, excessive domesticated animal waste, and inadequately treated wastewater, can dramatically increase the amount of nutrients entering lakes and their tributaries.
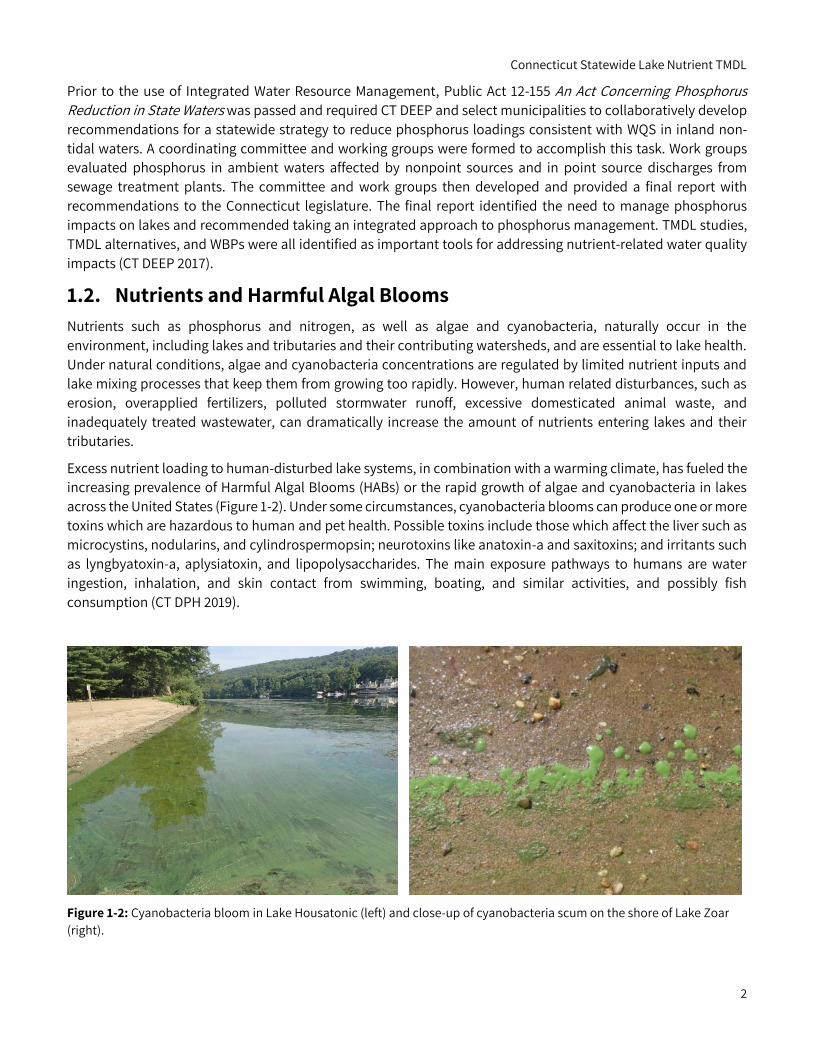
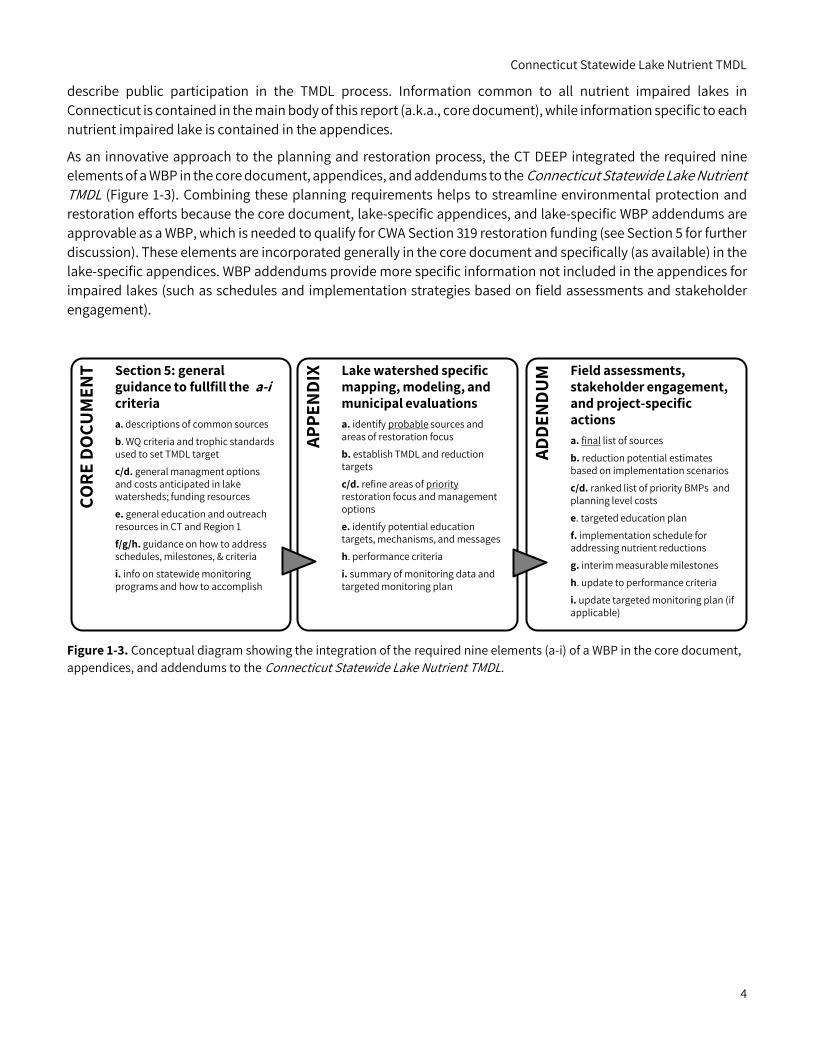
Excess nutrient loading to human-disturbed lake systems, in combination with a warming climate, has fueled the increasing prevalence of Harmful Algal Blooms (HABs) or the rapid growth of algae and cyanobacteria in lakes across the United States (Figure 1-2). Under some circumstances, cyanobacteria blooms can produce one or more toxins which are hazardous to human and pet health. Possible toxins include those which affect the liver such as microcystins, nodularins, and cylindrospermopsin; neurotoxins like anatoxin-a and saxitoxins; and irritants such as lyngbyatoxin-a, aplysiatoxin, and lipopolysaccharides. The main exposure pathways to humans are water ingestion, inhalation, and skin contact from swimming, boating, and similar activities, and possibly fish consumption (CT DPH 2019).
Figure 1-2: Cyanobacteria bloom in Lake Housatonic (left) and close-up of cyanobacteria scum on the shore of Lake Zoar (right).
Connecticut Statewide Lake Nutrient TMDL
3
HABs can also impact macroinvertebrate and fish communities through the alteration of food resources and habitat structure, upsetting the ecological balance of a lake in a process known as cultural eutrophication. Recreational uses of the lake are also impacted as water transparency can be greatly reduced, boating can become difficult due to heavy plant or algal growth, and dissolved oxygen can be depleted resulting in fish kills. In lakes which are drinking water sources, HABs can also make water treatment more expensive and difficult.
At any given time, phosphorus or nitrogen alone may be the limiting nutrient which controls the process of cultural eutrophication; thus, it is important to control both phosphorus and nitrogen loads to lakes. For instance, the limiting nutrient may change over the course of the year even within a single watershed, and there is some evidence that controlling only for phosphorus may contribute to more toxins being expressed by cyanobacteria (EPA 2015). In addition, controlling for both nitrogen and phosphorus protects downstream waters, including coastal estuaries, embayments, and Long Island Sound (EPA 2015).
EPA provides a wealth of detailed information on nutrient loading in its Causal Analysis/Diagnosis Decision Information System (CADDIS) online document, which includes detailed discussions, photos, and diagrams depicting the sources and impacts of nutrient loading. Other information from CT DEEP and EPA related to HABs include:
• Cyanobacteria Blooms in Connecticut factsheet includes a statewide map and list of lakes with recent or historical cyanobacteria blooms.
• CT DEEP Blue Green Algae Bloom website includes an FAQ and photos of HABs in lakes, as well as links to CT Department of Public Health (DPH) Environmental Health and Drinking Water sections.
• HAB Guidance for local health departments includes details on public health effects. • US National Office for Harmful Algal Blooms website includes information on the latest HAB research.
1.3. Purpose and Overview The purpose of the Connecticut Statewide Lake Nutrient TMDL is to use a watershed-based approach to set total phosphorus and total nitrogen loading targets in individual lakes and impoundments (hereafter, lakes) throughout Connecticut that, if achieved, will result in consistency with the State of Connecticut WQS. Water quality that is consistent with WQS is expected to support designated uses. The lakes in this TMDL may be listed on Connecticut’s 303(d) Impaired Waters List as impaired for either aquatic life or recreational uses due to excess nutrients, low dissolved oxygen, or the prevalence of algae. This TMDL considers low dissolved oxygen, reduced water clarity, and algal blooms to be caused by (or in response to) excessive nutrient loading.
The Connecticut Statewide Lake Nutrient TMDL was prepared following the EPA protocol for developing nutrient TMDLs (EPA 1999b). The main objectives of this TMDL include the following: describe existing conditions and applicable standards and guidelines; estimate the loading capacity of each applicable lake; assign loading capacities for existing and future sources; establish a margin of safety; account for seasonal variation; develop a monitoring plan; develop an implementation plan; provide reasonable assurances that the plans will be acted upon; and
A watershed-based approach that uses the surface drainage area as the basic study unit enables managers to gain a more complete understanding of the potential pollutant sources impacting a waterbody and increases the precision of identifying local problem areas or “hot spots” which may detrimentally affect water quality. Further, addressing many waterbodies across multiple watersheds through a statewide TMDL is more efficient than developing TMDLs for each impaired waterbody individually. This approach also provides a useful format for guiding both remediation and protection efforts at the municipal and regional level by providing a coordinating framework for environmental management that supports efforts to systematically identify, evaluate, and prioritize point and nonpoint sources of pollutants using natural hydrologic boundaries to define the problem areas.
Connecticut Statewide Lake Nutrient TMDL
4
describe public participation in the TMDL process. Information common to all nutrient impaired lakes in Connecticut is contained in the main body of this report (a.k.a., core document), while information specific to each nutrient impaired lake is contained in the appendices.
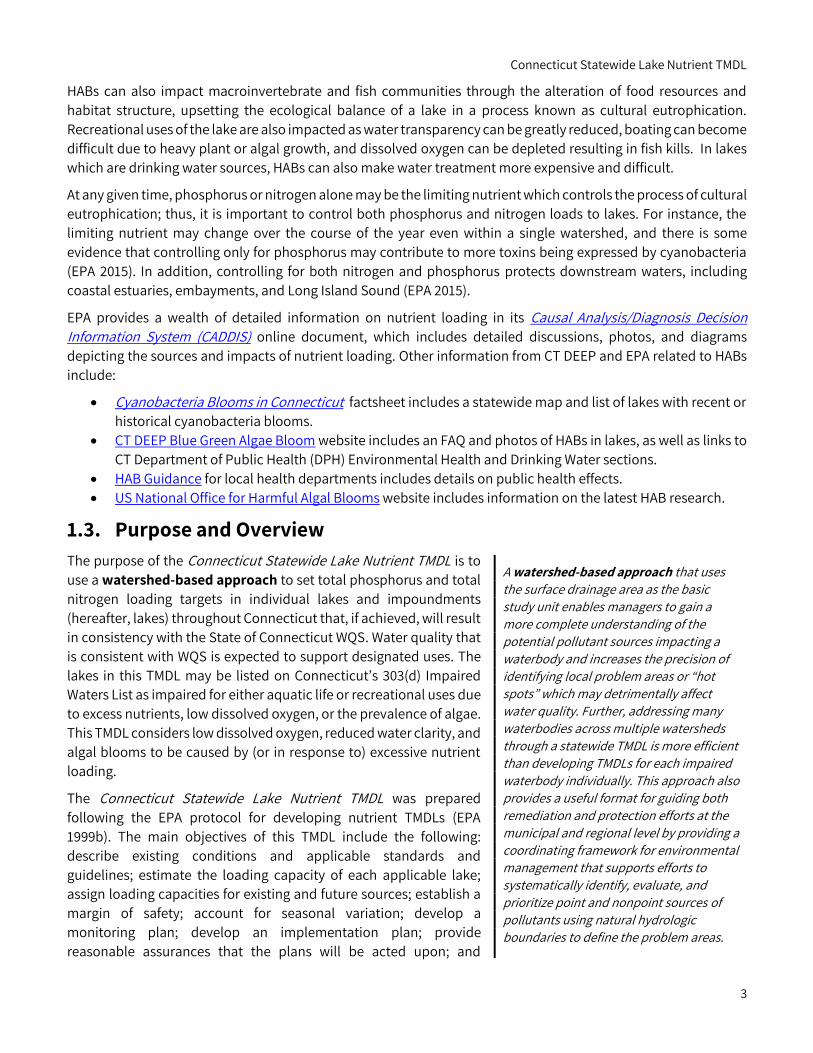
As an innovative approach to the planning and restoration process, the CT DEEP integrated the required nine elements of a WBP in the core document, appendices, and addendums to the Connecticut Statewide Lake Nutrient TMDL (Figure 1-3). Combining these planning requirements helps to streamline environmental protection and restoration efforts because the core document, lake-specific appendices, and lake-specific WBP addendums are approvable as a WBP, which is needed to qualify for CWA Section 319 restoration funding (see Section 5 for further discussion). These elements are incorporated generally in the core document and specifically (as available) in the lake-specific appendices. WBP addendums provide more specific information not included in the appendices for impaired lakes (such as schedules and implementation strategies based on field assessments and stakeholder engagement).
Figure 1-3. Conceptual diagram showing the integration of the required nine elements (a-i) of a WBP in the core document, appendices, and addendums to the Connecticut Statewide Lake Nutrient TMDL.
CORE
DO
CUM
ENT Section 5: general
guidance to fullfill the a-icriteriaa. descriptions of common sourcesb. WQ criteria and trophic standards used to set TMDL targetc/d. general managment options and costs anticipated in lake watersheds; funding resourcese. general education and outreach resources in CT and Region 1f/g/h. guidance on how to address schedules, milestones, & criteriai. info on statewide monitoring programs and how to accomplish
APPE
NDI
X Lake watershed specific mapping, modeling, and municipal evaluationsa. identify probable sources and areas of restoration focusb. establish TMDL and reduction targets
c/d. refine areas of priorityrestoration focus and management optionse. identify potential education targets, mechanisms, and messagesh. performance criteriai. summary of monitoring data and targeted monitoring plan
ADDE
NDU
M Field assessments, stakeholder engagement, and project-specific actionsa. final list of sourcesb. reduction potential estimates based on implementation scenariosc/d. ranked list of priority BMPs and planning level costse. targeted education planf. implementation schedule for addressing nutrient reductionsg. interim measurable milestonesh. update to performance criteriai. update targeted monitoring plan (if applicable)
Connecticut Statewide Lake Nutrient TMDL
5
2. Water Quality Standards WQS determine the baseline water quality that all waters of a state must meet to protect the intended uses for each waterbody. The Connecticut WQS are the foundation for the State’s water pollution control and water quality management efforts and are applicable to both surface and groundwaters. Section 22a-426 of the Connecticut General Statutes requires that the Commissioner of the CT DEEP adopt WQS consistent with the CWA. The Connecticut WQS themselves are contained within the Regulations of Connecticut State Agencies (RCSA) § 22a-426 (the same section number is used for both statute and regulations relating to WQS, CT DEEP 2015b).
The Connecticut WQS are formally composed of three parts: Standards, Criteria, and Classification Maps. The Standards designate use goals and set overall policy for managing surface and ground waters (including antidegradation provisions). The Criteria set the narrative and numerical targets for water quality which are necessary to protect the designated uses. The Classification Maps are a series of municipal level maps which indicate which classification, and thus which designated uses and criteria, apply to each waterbody in the State. For this TMDL, the applicable lake nutrient WQS are presented in the following order: surface water quality classification by designated uses; water quality criteria for lake nutrients; and antidegradation standards and implementation policies. Each of these parts is described below, along with application of WQS to monitoring data for the 303(d) impaired waters listing process and for the setting of numeric water quality targets for the TMDL.
While many aspects of the WQS are applicable to nutrient-related water quality in lakes, the following are particularly pertinent: surface water classifications, narrative nutrient criteria, standards pertaining to natural conditions, and the Antidegradation Policy and Implementation Strategy. More information on this topic is available from CT DEEP online, including a multimedia story map on WQS and classifications.
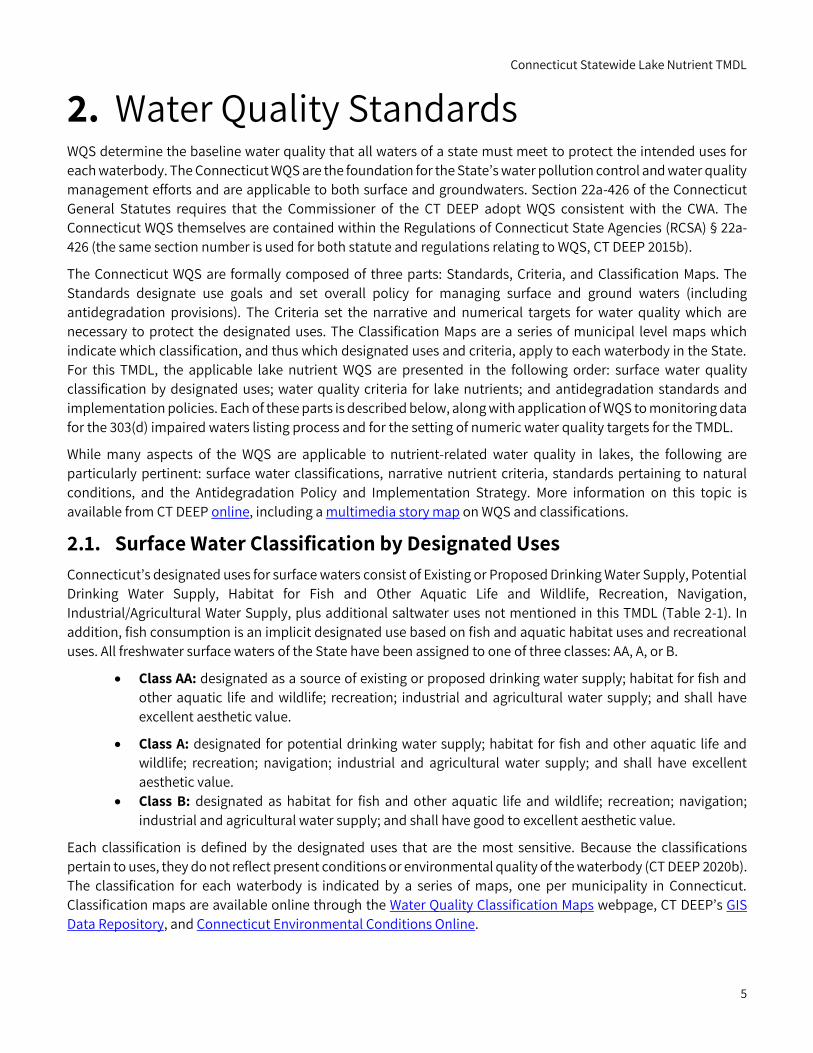
2.1. Surface Water Classification by Designated Uses Connecticut’s designated uses for surface waters consist of Existing or Proposed Drinking Water Supply, Potential Drinking Water Supply, Habitat for Fish and Other Aquatic Life and Wildlife, Recreation, Navigation, Industrial/Agricultural Water Supply, plus additional saltwater uses not mentioned in this TMDL (Table 2-1). In addition, fish consumption is an implicit designated use based on fish and aquatic habitat uses and recreational uses. All freshwater surface waters of the State have been assigned to one of three classes: AA, A, or B.
• Class AA: designated as a source of existing or proposed drinking water supply; habitat for fish and other aquatic life and wildlife; recreation; industrial and agricultural water supply; and shall have excellent aesthetic value.
• Class A: designated for potential drinking water supply; habitat for fish and other aquatic life and wildlife; recreation; navigation; industrial and agricultural water supply; and shall have excellent aesthetic value.
• Class B: designated as habitat for fish and other aquatic life and wildlife; recreation; navigation; industrial and agricultural water supply; and shall have good to excellent aesthetic value.
Each classification is defined by the designated uses that are the most sensitive. Because the classifications pertain to uses, they do not reflect present conditions or environmental quality of the waterbody (CT DEEP 2020b). The classification for each waterbody is indicated by a series of maps, one per municipality in Connecticut. Classification maps are available online through the Water Quality Classification Maps webpage, CT DEEP’s GIS Data Repository, and Connecticut Environmental Conditions Online.
Connecticut Statewide Lake Nutrient TMDL
6
This TMDL was developed for freshwater lakes, ponds, and impoundments. As such, surface waters classified as AA, A, or B may be included in the TMDL. The TMDL focuses on the impacts of nutrients on designated uses, primarily recreation and aquatic life uses, but drinking water use protection could also be considered, if needed.
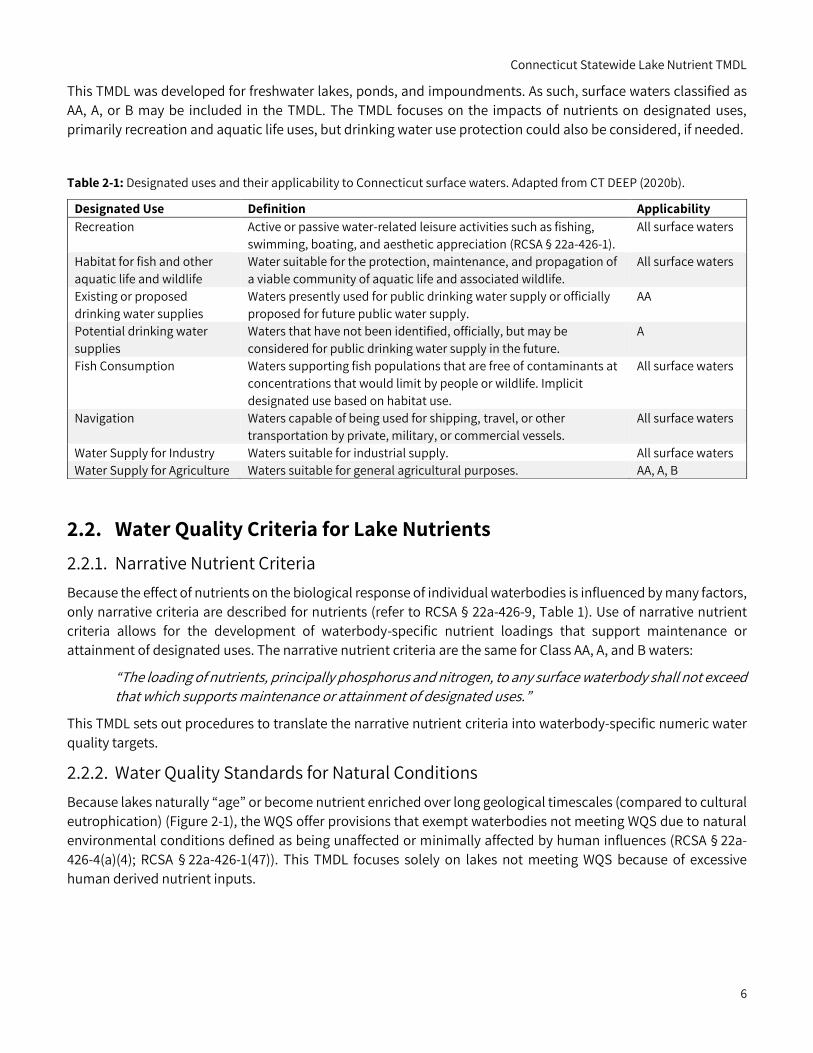
Table 2-1: Designated uses and their applicability to Connecticut surface waters. Adapted from CT DEEP (2020b).
2.2. Water Quality Criteria for Lake Nutrients 2.2.1. Narrative Nutrient Criteria Because the effect of nutrients on the biological response of individual waterbodies is influenced by many factors, only narrative criteria are described for nutrients (refer to RCSA § 22a-426-9, Table 1). Use of narrative nutrient criteria allows for the development of waterbody-specific nutrient loadings that support maintenance or attainment of designated uses. The narrative nutrient criteria are the same for Class AA, A, and B waters:
“The loading of nutrients, principally phosphorus and nitrogen, to any surface waterbody shall not exceed that which supports maintenance or attainment of designated uses.”
This TMDL sets out procedures to translate the narrative nutrient criteria into waterbody-specific numeric water quality targets.
2.2.2. Water Quality Standards for Natural Conditions Because lakes naturally “age” or become nutrient enriched over long geological timescales (compared to cultural eutrophication) (Figure 2-1), the WQS offer provisions that exempt waterbodies not meeting WQS due to natural environmental conditions defined as being unaffected or minimally affected by human influences (RCSA § 22a-426-4(a)(4); RCSA § 22a-426-1(47)). This TMDL focuses solely on lakes not meeting WQS because of excessive human derived nutrient inputs.
Designated Use Definition Applicability Recreation Active or passive water-related leisure activities such as fishing,
swimming, boating, and aesthetic appreciation (RCSA § 22a-426-1). All surface waters
Habitat for fish and other aquatic life and wildlife
Water suitable for the protection, maintenance, and propagation of a viable community of aquatic life and associated wildlife.
All surface waters
Existing or proposed drinking water supplies
Waters presently used for public drinking water supply or officially proposed for future public water supply.
AA
Potential drinking water supplies
Waters that have not been identified, officially, but may be considered for public drinking water supply in the future.
A
Fish Consumption Waters supporting fish populations that are free of contaminants at concentrations that would limit by people or wildlife. Implicit designated use based on habitat use.
All surface waters
Navigation Waters capable of being used for shipping, travel, or other transportation by private, military, or commercial vessels.
All surface waters
Water Supply for Industry Waters suitable for industrial supply. All surface waters Water Supply for Agriculture Waters suitable for general agricultural purposes. AA, A, B
Connecticut Statewide Lake Nutrient TMDL
7
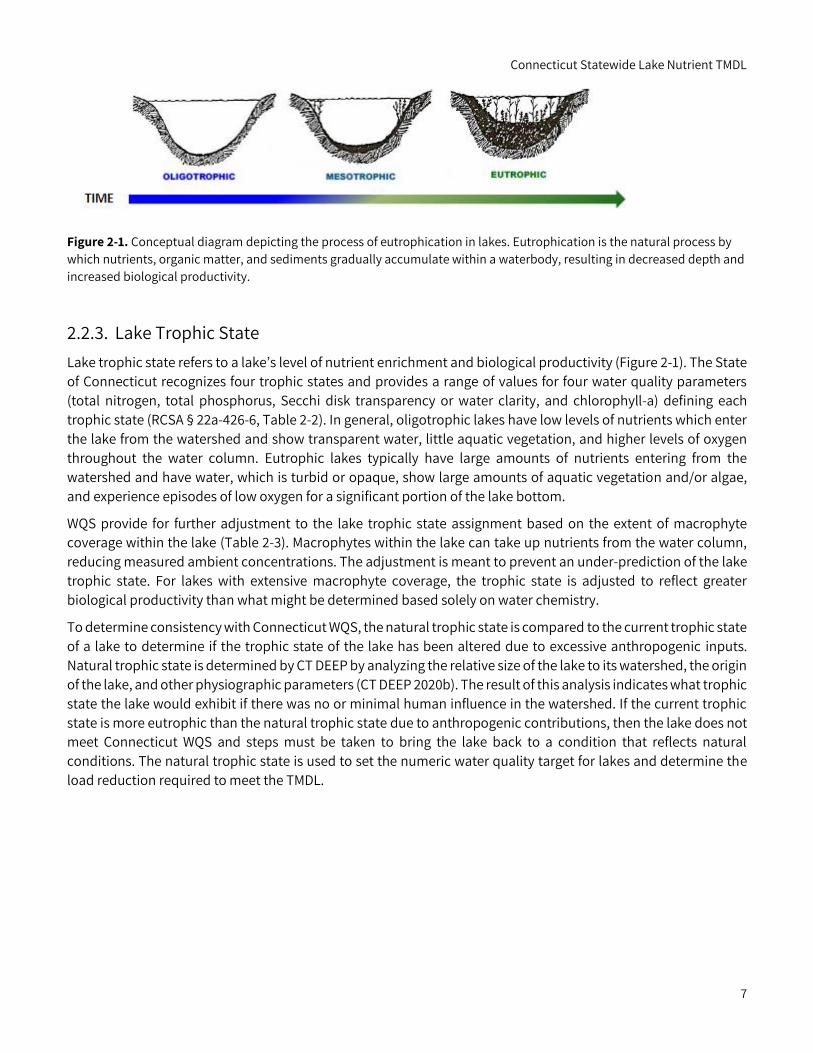
Figure 2-1. Conceptual diagram depicting the process of eutrophication in lakes. Eutrophication is the natural process by which nutrients, organic matter, and sediments gradually accumulate within a waterbody, resulting in decreased depth and increased biological productivity.
2.2.3. Lake Trophic State Lake trophic state refers to a lake’s level of nutrient enrichment and biological productivity (Figure 2-1). The State of Connecticut recognizes four trophic states and provides a range of values for four water quality parameters (total nitrogen, total phosphorus, Secchi disk transparency or water clarity, and chlorophyll-a) defining each trophic state (RCSA § 22a-426-6, Table 2-2). In general, oligotrophic lakes have low levels of nutrients which enter the lake from the watershed and show transparent water, little aquatic vegetation, and higher levels of oxygen throughout the water column. Eutrophic lakes typically have large amounts of nutrients entering from the watershed and have water, which is turbid or opaque, show large amounts of aquatic vegetation and/or algae, and experience episodes of low oxygen for a significant portion of the lake bottom.
WQS provide for further adjustment to the lake trophic state assignment based on the extent of macrophyte coverage within the lake (Table 2-3). Macrophytes within the lake can take up nutrients from the water column, reducing measured ambient concentrations. The adjustment is meant to prevent an under-prediction of the lake trophic state. For lakes with extensive macrophyte coverage, the trophic state is adjusted to reflect greater biological productivity than what might be determined based solely on water chemistry.
To determine consistency with Connecticut WQS, the natural trophic state is compared to the current trophic state of a lake to determine if the trophic state of the lake has been altered due to excessive anthropogenic inputs. Natural trophic state is determined by CT DEEP by analyzing the relative size of the lake to its watershed, the origin of the lake, and other physiographic parameters (CT DEEP 2020b). The result of this analysis indicates what trophic state the lake would exhibit if there was no or minimal human influence in the watershed. If the current trophic state is more eutrophic than the natural trophic state due to anthropogenic contributions, then the lake does not meet Connecticut WQS and steps must be taken to bring the lake back to a condition that reflects natural conditions. The natural trophic state is used to set the numeric water quality target for lakes and determine the load reduction required to meet the TMDL.
Connecticut Statewide Lake Nutrient TMDL
8
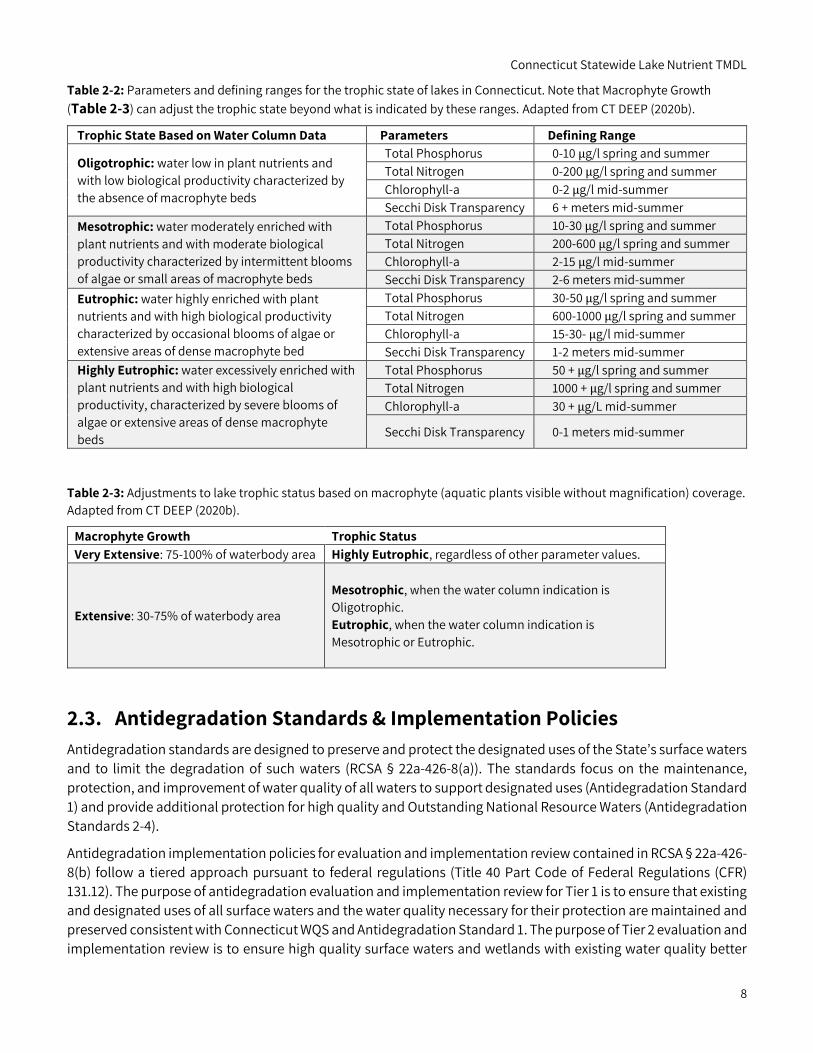
Table 2-2: Parameters and defining ranges for the trophic state of lakes in Connecticut. Note that Macrophyte Growth (Table 2-3) can adjust the trophic state beyond what is indicated by these ranges. Adapted from CT DEEP (2020b).
Trophic State Based on Water Column Data Parameters Defining Range
Oligotrophic: water low in plant nutrients and with low biological productivity characterized by the absence of macrophyte beds
Total Phosphorus 0-10 µg/l spring and summer Total Nitrogen 0-200 µg/l spring and summer Chlorophyll-a 0-2 µg/l mid-summer Secchi Disk Transparency 6 + meters mid-summer
Mesotrophic: water moderately enriched with plant nutrients and with moderate biological productivity characterized by intermittent blooms of algae or small areas of macrophyte beds
Total Phosphorus 10-30 µg/l spring and summer Total Nitrogen 200-600 µg/l spring and summer Chlorophyll-a 2-15 µg/l mid-summer Secchi Disk Transparency 2-6 meters mid-summer
Eutrophic: water highly enriched with plant nutrients and with high biological productivity characterized by occasional blooms of algae or extensive areas of dense macrophyte bed
Total Phosphorus 30-50 µg/l spring and summer Total Nitrogen 600-1000 µg/l spring and summer Chlorophyll-a 15-30- µg/l mid-summer Secchi Disk Transparency 1-2 meters mid-summer
Highly Eutrophic: water excessively enriched with plant nutrients and with high biological productivity, characterized by severe blooms of algae or extensive areas of dense macrophyte beds
Total Phosphorus 50 + µg/l spring and summer Total Nitrogen 1000 + µg/l spring and summer Chlorophyll-a 30 + µg/L mid-summer
Secchi Disk Transparency 0-1 meters mid-summer
Table 2-3: Adjustments to lake trophic status based on macrophyte (aquatic plants visible without magnification) coverage. Adapted from CT DEEP (2020b).
Macrophyte Growth Trophic Status Very Extensive: 75-100% of waterbody area Highly Eutrophic, regardless of other parameter values.
Extensive: 30-75% of waterbody area
Mesotrophic, when the water column indication is Oligotrophic. Eutrophic, when the water column indication is Mesotrophic or Eutrophic.
2.3. Antidegradation Standards & Implementation Policies Antidegradation standards are designed to preserve and protect the designated uses of the State’s surface waters and to limit the degradation of such waters (RCSA § 22a-426-8(a)). The standards focus on the maintenance, protection, and improvement of water quality of all waters to support designated uses (Antidegradation Standard 1) and provide additional protection for high quality and Outstanding National Resource Waters (Antidegradation Standards 2-4).
Antidegradation implementation policies for evaluation and implementation review contained in RCSA § 22a-426-8(b) follow a tiered approach pursuant to federal regulations (Title 40 Part Code of Federal Regulations (CFR) 131.12). The purpose of antidegradation evaluation and implementation review for Tier 1 is to ensure that existing and designated uses of all surface waters and the water quality necessary for their protection are maintained and preserved consistent with Connecticut WQS and Antidegradation Standard 1. The purpose of Tier 2 evaluation and implementation review is to ensure high quality surface waters and wetlands with existing water quality better
Connecticut Statewide Lake Nutrient TMDL
9
than the WQS are maintained at their existing high quality, pursuant to Antidegradation Standards 2 and 3. The purpose of Tier 3 evaluation and implementation review is to ensure that water quality of Outstanding National Resource Waters is maintained and protected pursuant to Antidegradation Standard 4.
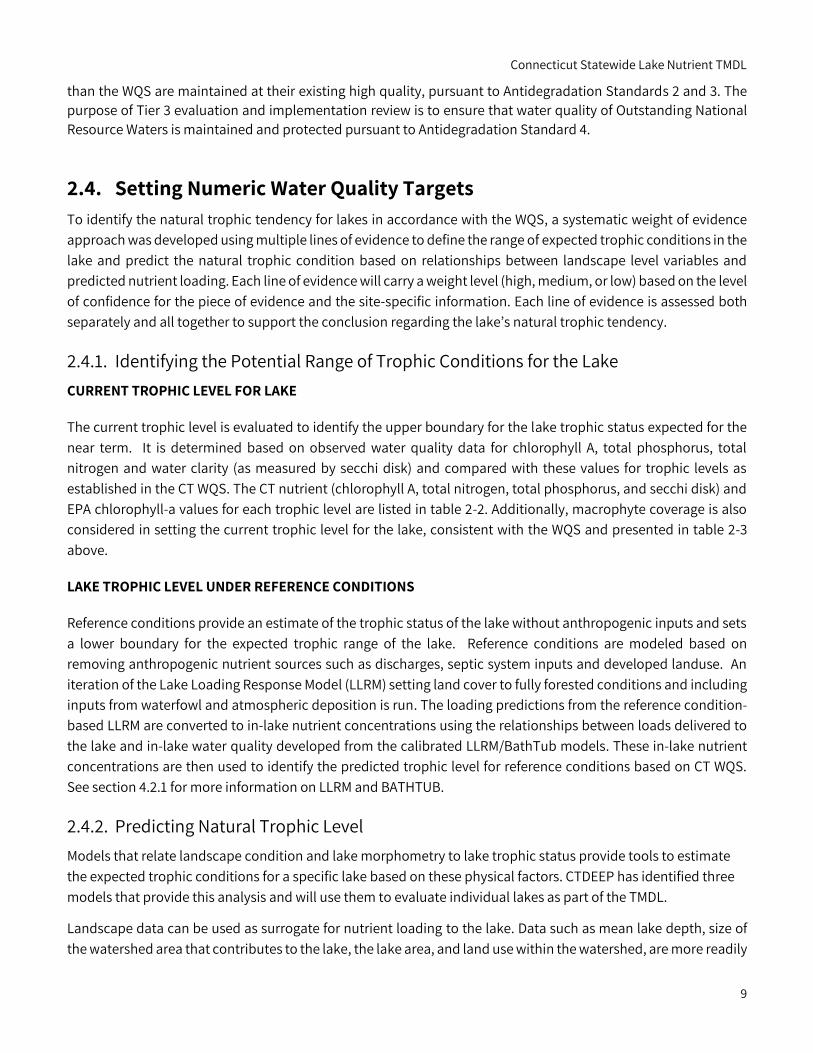
2.4. Setting Numeric Water Quality Targets To identify the natural trophic tendency for lakes in accordance with the WQS, a systematic weight of evidence approach was developed using multiple lines of evidence to define the range of expected trophic conditions in the lake and predict the natural trophic condition based on relationships between landscape level variables and predicted nutrient loading. Each line of evidence will carry a weight level (high, medium, or low) based on the level of confidence for the piece of evidence and the site-specific information. Each line of evidence is assessed both separately and all together to support the conclusion regarding the lake’s natural trophic tendency.
2.4.1. Identifying the Potential Range of Trophic Conditions for the Lake CURRENT TROPHIC LEVEL FOR LAKE
The current trophic level is evaluated to identify the upper boundary for the lake trophic status expected for the near term. It is determined based on observed water quality data for chlorophyll A, total phosphorus, total nitrogen and water clarity (as measured by secchi disk) and compared with these values for trophic levels as established in the CT WQS. The CT nutrient (chlorophyll A, total nitrogen, total phosphorus, and secchi disk) and EPA chlorophyll-a values for each trophic level are listed in table 2-2. Additionally, macrophyte coverage is also considered in setting the current trophic level for the lake, consistent with the WQS and presented in table 2-3 above.
LAKE TROPHIC LEVEL UNDER REFERENCE CONDITIONS
Reference conditions provide an estimate of the trophic status of the lake without anthropogenic inputs and sets a lower boundary for the expected trophic range of the lake. Reference conditions are modeled based on removing anthropogenic nutrient sources such as discharges, septic system inputs and developed landuse. An iteration of the Lake Loading Response Model (LLRM) setting land cover to fully forested conditions and including inputs from waterfowl and atmospheric deposition is run. The loading predictions from the reference condition-based LLRM are converted to in-lake nutrient concentrations using the relationships between loads delivered to the lake and in-lake water quality developed from the calibrated LLRM/BathTub models. These in-lake nutrient concentrations are then used to identify the predicted trophic level for reference conditions based on CT WQS. See section 4.2.1 for more information on LLRM and BATHTUB.
2.4.2. Predicting Natural Trophic Level Models that relate landscape condition and lake morphometry to lake trophic status provide tools to estimate the expected trophic conditions for a specific lake based on these physical factors. CTDEEP has identified three models that provide this analysis and will use them to evaluate individual lakes as part of the TMDL.
Landscape data can be used as surrogate for nutrient loading to the lake. Data such as mean lake depth, size of the watershed area that contributes to the lake, the lake area, and land use within the watershed, are more readily
Connecticut Statewide Lake Nutrient TMDL
10
available than water quality data, which can be difficult to obtain and limits applications of water quality goal setting to lakes with available data. Additionally, water quality observations provide information to evaluate the trophic state of the lake for moments in time. This, however, is not equivalent to identifying the natural trophic state of the lake, which is an expression of the likely trophic state when anthropogenic sources are well controlled and exert minimal effect on water quality. The trophic state of a lake describes the lakes productivity, which is a reliable indicator of nutrient availability and so can be used to set lake-specific nutrient targets. In this effort, we use models that make a connection between landscape variables and trophic conditions to help identify the natural trophic state of a lake.
TAYLOR APPROACH
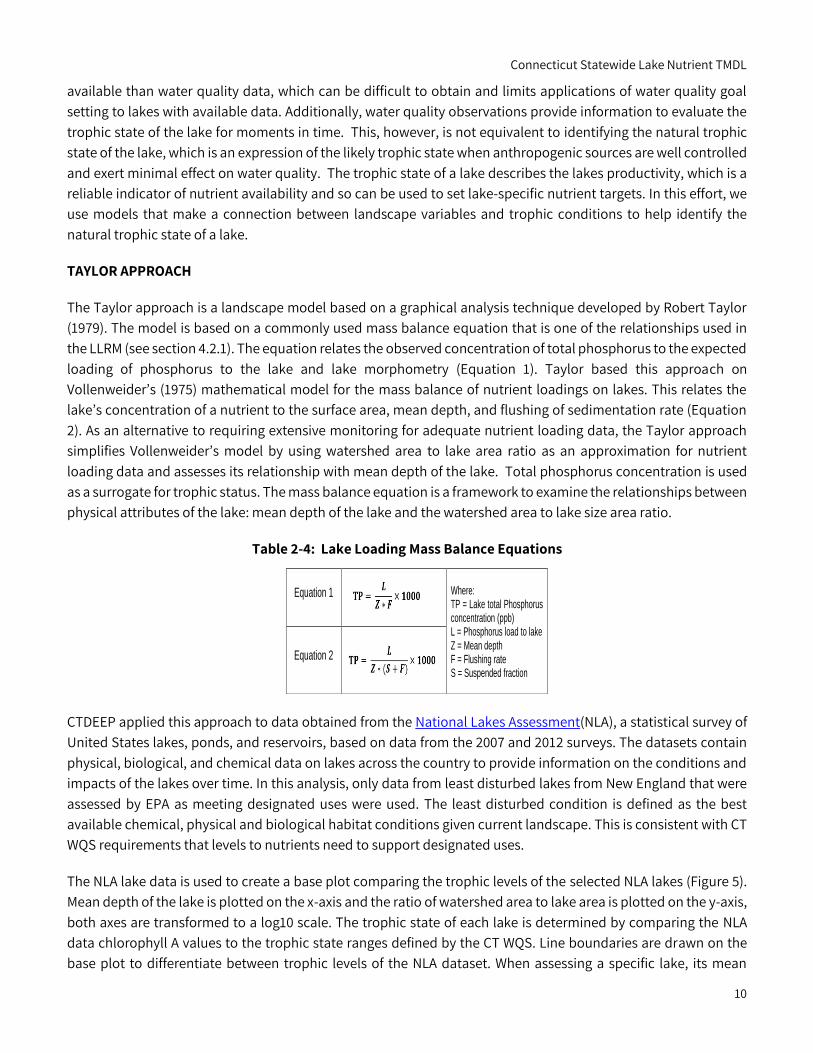
The Taylor approach is a landscape model based on a graphical analysis technique developed by Robert Taylor (1979). The model is based on a commonly used mass balance equation that is one of the relationships used in the LLRM (see section 4.2.1). The equation relates the observed concentration of total phosphorus to the expected loading of phosphorus to the lake and lake morphometry (Equation 1). Taylor based this approach on Vollenweider’s (1975) mathematical model for the mass balance of nutrient loadings on lakes. This relates the lake’s concentration of a nutrient to the surface area, mean depth, and flushing of sedimentation rate (Equation 2). As an alternative to requiring extensive monitoring for adequate nutrient loading data, the Taylor approach simplifies Vollenweider’s model by using watershed area to lake area ratio as an approximation for nutrient loading data and assesses its relationship with mean depth of the lake. Total phosphorus concentration is used as a surrogate for trophic status. The mass balance equation is a framework to examine the relationships between physical attributes of the lake: mean depth of the lake and the watershed area to lake size area ratio.
Table 2-4: Lake Loading Mass Balance Equations
CTDEEP applied this approach to data obtained from the National Lakes Assessment(NLA), a statistical survey of United States lakes, ponds, and reservoirs, based on data from the 2007 and 2012 surveys. The datasets contain physical, biological, and chemical data on lakes across the country to provide information on the conditions and impacts of the lakes over time. In this analysis, only data from least disturbed lakes from New England that were assessed by EPA as meeting designated uses were used. The least disturbed condition is defined as the best available chemical, physical and biological habitat conditions given current landscape. This is consistent with CT WQS requirements that levels to nutrients need to support designated uses.
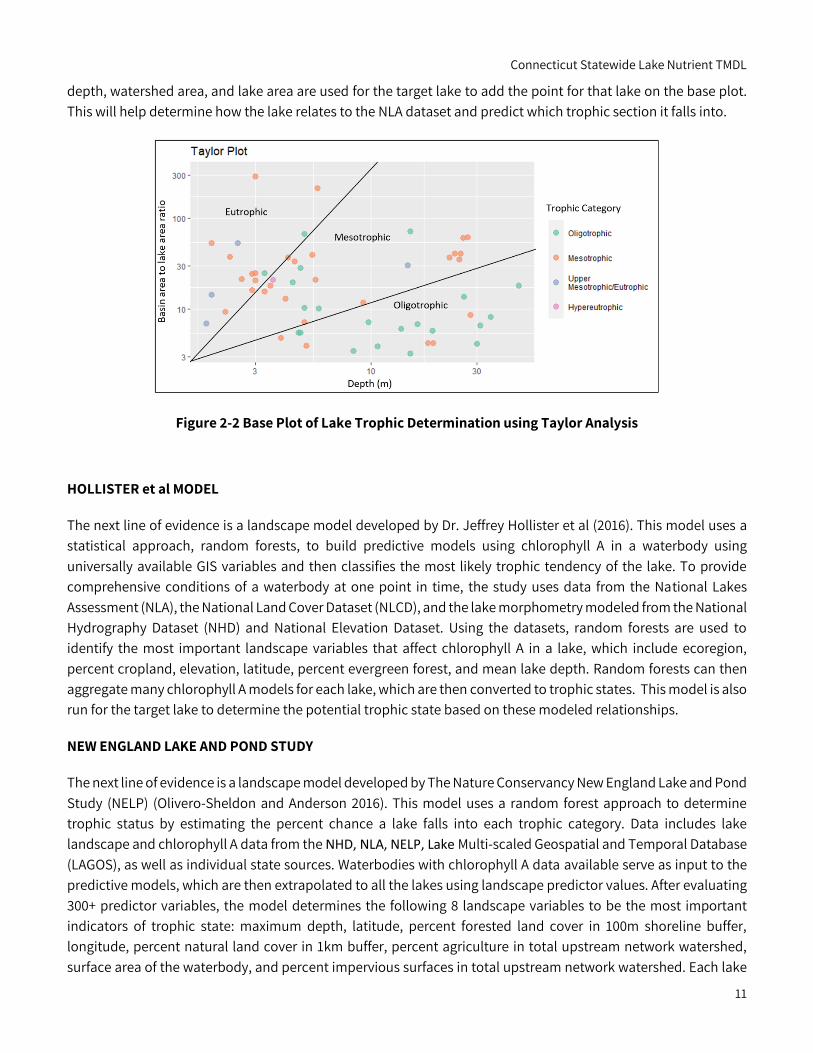
The NLA lake data is used to create a base plot comparing the trophic levels of the selected NLA lakes (Figure 5). Mean depth of the lake is plotted on the x-axis and the ratio of watershed area to lake area is plotted on the y-axis, both axes are transformed to a log10 scale. The trophic state of each lake is determined by comparing the NLA data chlorophyll A values to the trophic state ranges defined by the CT WQS. Line boundaries are drawn on the base plot to differentiate between trophic levels of the NLA dataset. When assessing a specific lake, its mean
Equation 1 Where: TP = Lake total Phosphorus concentration (ppb) L = Phosphorus load to lake Z = Mean depth F = Flushing rate S = Suspended fraction
Equation 2
Connecticut Statewide Lake Nutrient TMDL
11
depth, watershed area, and lake area are used for the target lake to add the point for that lake on the base plot. This will help determine how the lake relates to the NLA dataset and predict which trophic section it falls into.
Figure 2-2 Base Plot of Lake Trophic Determination using Taylor Analysis
HOLLISTER et al MODEL
The next line of evidence is a landscape model developed by Dr. Jeffrey Hollister et al (2016). This model uses a statistical approach, random forests, to build predictive models using chlorophyll A in a waterbody using universally available GIS variables and then classifies the most likely trophic tendency of the lake. To provide comprehensive conditions of a waterbody at one point in time, the study uses data from the National Lakes Assessment (NLA), the National Land Cover Dataset (NLCD), and the lake morphometry modeled from the National Hydrography Dataset (NHD) and National Elevation Dataset. Using the datasets, random forests are used to identify the most important landscape variables that affect chlorophyll A in a lake, which include ecoregion, percent cropland, elevation, latitude, percent evergreen forest, and mean lake depth. Random forests can then aggregate many chlorophyll A models for each lake, which are then converted to trophic states. This model is also run for the target lake to determine the potential trophic state based on these modeled relationships.
NEW ENGLAND LAKE AND POND STUDY
The next line of evidence is a landscape model developed by The Nature Conservancy New England Lake and Pond Study (NELP) (Olivero-Sheldon and Anderson 2016). This model uses a random forest approach to determine trophic status by estimating the percent chance a lake falls into each trophic category. Data includes lake landscape and chlorophyll A data from the NHD, NLA, NELP, Lake Multi-scaled Geospatial and Temporal Database (LAGOS), as well as individual state sources. Waterbodies with chlorophyll A data available serve as input to the predictive models, which are then extrapolated to all the lakes using landscape predictor values. After evaluating 300+ predictor variables, the model determines the following 8 landscape variables to be the most important indicators of trophic state: maximum depth, latitude, percent forested land cover in 100m shoreline buffer, longitude, percent natural land cover in 1km buffer, percent agriculture in total upstream network watershed, surface area of the waterbody, and percent impervious surfaces in total upstream network watershed. Each lake
Connecticut Statewide Lake Nutrient TMDL
12
is assigned an estimated probability that it falls into each of the trophic categories. This model is also run for the target lake to get an estimate of trophic status based on these modeled relationships.
LAKE SPECIFIC STUDIES
Lastly, any lake specific studies that focus on determining lake trophic conditions associated with minimal human influence are considered for the weight of evidence. Generally, studies that are helpful include an evaluation of lake trophic trends over time or provide an analysis for lake sediment cores to determine lake diatom conditions over time.
SELECTING WATER QUALITY TARGETS BASED ON WEIGHT OF EVIDENCE EVALUATION
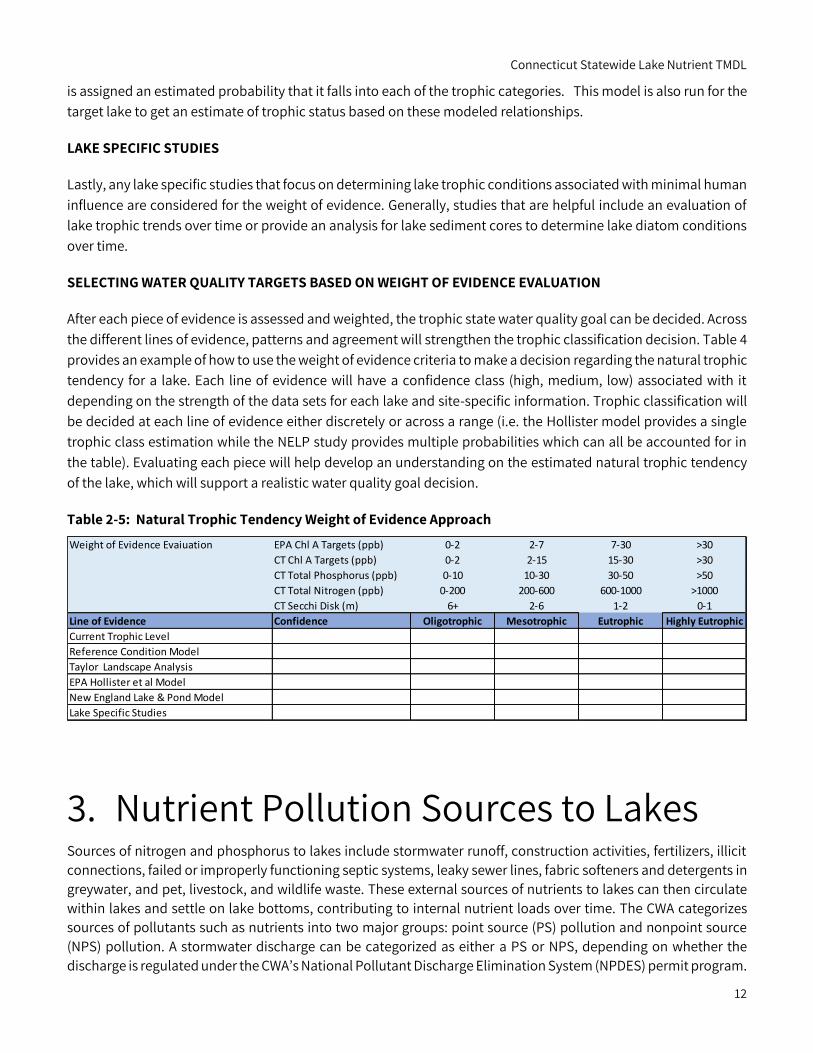
After each piece of evidence is assessed and weighted, the trophic state water quality goal can be decided. Across the different lines of evidence, patterns and agreement will strengthen the trophic classification decision. Table 4 provides an example of how to use the weight of evidence criteria to make a decision regarding the natural trophic tendency for a lake. Each line of evidence will have a confidence class (high, medium, low) associated with it depending on the strength of the data sets for each lake and site-specific information. Trophic classification will be decided at each line of evidence either discretely or across a range (i.e. the Hollister model provides a single trophic class estimation while the NELP study provides multiple probabilities which can all be accounted for in the table). Evaluating each piece will help develop an understanding on the estimated natural trophic tendency of the lake, which will support a realistic water quality goal decision.
Table 2-5: Natural Trophic Tendency Weight of Evidence Approach
3. Nutrient Pollution Sources to Lakes Sources of nitrogen and phosphorus to lakes include stormwater runoff, construction activities, fertilizers, illicit connections, failed or improperly functioning septic systems, leaky sewer lines, fabric softeners and detergents in greywater, and pet, livestock, and wildlife waste. These external sources of nutrients to lakes can then circulate within lakes and settle on lake bottoms, contributing to internal nutrient loads over time. The CWA categorizes sources of pollutants such as nutrients into two major groups: point source (PS) pollution and nonpoint source (NPS) pollution. A stormwater discharge can be categorized as either a PS or NPS, depending on whether the discharge is regulated under the CWA’s National Pollutant Discharge Elimination System (NPDES) permit program.
Weight of Evidence Evaiuation EPA Chl A Targets (ppb) 0-2 2-7 7-30 >30
CT Chl A Targets (ppb) 0-2 2-15 15-30 >30
CT Total Phosphorus (ppb) 0-10 10-30 30-50 >50
CT Total Nitrogen (ppb) 0-200 200-600 600-1000 >1000
CT Secchi Disk (m) 6+ 2-6 1-2 0-1
Line of Evidence Confidence Oligotrophic Mesotrophic Eutrophic Highly Eutrophic
Current Trophic Level
Reference Condition Model
Taylor Landscape Analysis
EPA Hollister et al Model
New England Lake & Pond Model
Lake Specific Studies
Connecticut Statewide Lake Nutrient TMDL
13
For this TMDL, stormwater runoff regulated under NPDES is considered a PS and runoff from all other non-regulated areas as NPS.
This section describes sources of nutrient pollution within the regulatory context. Types of pollutant sources are defined, and the process of regulating pollutants is described. Section 6. Best Management Practices (BMPs) contain strategies for assessing pollutant sources and taking mitigative action to reduce the adverse impacts of excess nutrient loading.
3.1. Point Source Pollution PS pollution can be traced back to a specific source such as a discharge pipe from an industrial facility, municipal treatment plant, permitted stormwater outfall, or a regulated animal feeding operation, making this type of pollution relatively easy to identify. According to the CWA and RCSA § 22a-426-1-51, a PS is defined as follows:
“Point source means any discernible, confined and discrete conveyance, including but not limited to any pipe, ditch, channel, tunnel, conduit, well, discrete fissure, container, rolling stock, concentrated animal feeding operation, landfill leachate collection system, or vessel or other floating craft, from which pollutants are or may be discharged. This term does not include agricultural stormwater discharges and return flows from irrigated agriculture.”
Section 402 of the CWA requires all such PS discharges to be regulated under the NPDES program to control the type and quantity of pollutants discharged. NPDES is the national program for regulating PS through issuance of permit limitations specifying monitoring, reporting, and other requirements under Sections 307, 318, 402, and 405 of the CWA.
In Connecticut, the CT DEEP has been delegated the authority to implement the NPDES program. Permit limits issued for a discharge to an impaired waterbody must be consistent with the WQS and with any relevant TMDLs approved for that waterbody. The permitted PS discharging to a lake covered by this TMDL, such as stormwater or other discharges that are regulated as PS under the NPDES program, are described in each lake-specific appendix.
3.1.1. Unauthorized Point Sources of Untreated Wastewater Untreated wastewater may contain high levels of phosphorus and nitrogen from human waste, food, and some soaps and detergents. This category includes all PS discharges that are not authorized under the NPDES program or by the State because they will not meet WQS or have not obtained necessary permits or authorization. Examples include the discharge of untreated wastewater from sources such as sanitary sewer overflows (SSOs) and illicit discharges to storm drains. Untreated discharges of sewage (i.e., wastewater) to waters of the State are prohibited. Since such PS discharges will not meet WQS, they must be eliminated (or treated) once discovered. As discussed below, this category also includes discharges of sewage from boats which is prohibited by State law.
• Sanitary Sewer Overflows (SSOs): SSOs are discharges of untreated wastewater from municipal sewer systems. SSOs can be caused by blocked or cracked sewer pipes, excess infiltration and inflow, an undersized sewer system (piping and/or pumps), or equipment failure. Such untreated wastewater can find its way to surface waters and cause nutrient pollution.
• Illicit Discharges (to Stormwater Systems): Illicit discharges include any discharges to stormwater systems that are not entirely composed of stormwater, as defined in the CT DEEP Municipal Separate Storm Sewer System (MS4) General Permit (CT DEEP 2017):
“Illicit Discharge” means any unpermitted discharge to waters of the state that does not consist entirely of stormwater or uncontaminated ground water except those discharges identified in
Connecticut Statewide Lake Nutrient TMDL
14
Section 3(a)(2) of this general permit when such non-stormwater discharges are not significant contributors of pollution to a discharge from an identified MS4.
Section 3(a)(2): This permit authorizes the following non-stormwater discharges provided: the permittee controls such non-stormwater discharges to the Maximum Extent Practicable (MEP), as required by this general permit; such non-stormwater discharges do not contribute to a violation of WQS; and such non-stormwater discharges are documented in the Stormwater Management Plan and are not significant contributors of pollutants to any identified MS4:
• uncontaminated ground water discharges including, but not limited to, pumped ground water, foundation drains, water from crawl space pumps and footing drains;
• irrigation water including, but not limited to, landscape irrigation and lawn watering runoff;
• residual street wash water associated with sweeping; • discharges or flows from firefighting activities (except training); and • naturally occurring discharges such as rising ground waters, uncontaminated ground
water infiltration (as defined at 40 CFR 35.2005(20)), springs, diverted stream flows and flows from riparian habitats and wetlands
• Boat Discharges: Boats have the potential to discharge nutrients in sewage from installed toilets and greywater (such as drainage from sinks, showers, and laundry). The impact of dumping even a small amount of raw sewage into surface waters can significantly impact the local ecosystem, causing algal blooms and a degradation in water quality. The Connecticut WQS prohibit the discharge of sewage from any vessel to any water in Connecticut (RCSA § 22a-426-4(a)(9)(D)).
• Illegal disposal of pumped septage: Septic pump trucks sometimes illegally discharge their waste from on-site sewage disposal systems (septic systems). The Connecticut DPH licenses the individuals that conduct the pumping of sewage from septic systems. DPH also pursues enforcement actions against individuals that improperly dispose their septage.
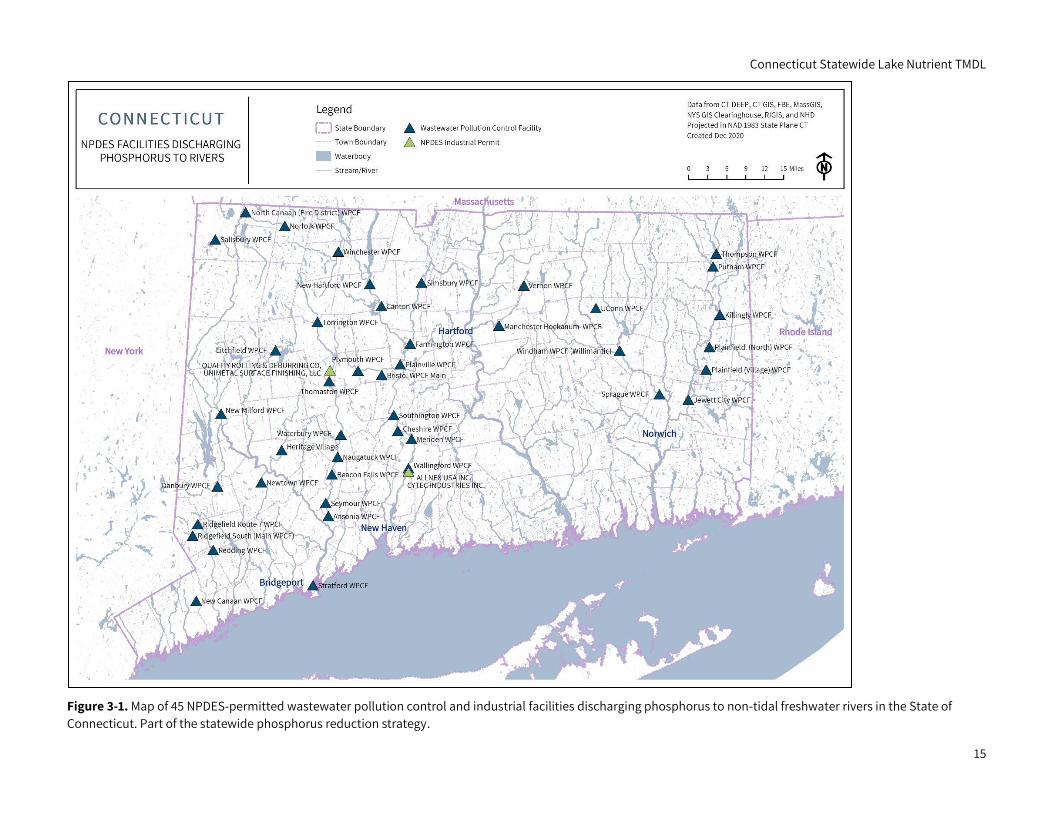
3.1.2. Wastewater Pollution Control Facilities (WPCF) The State of Connecticut’s Permitting and Enforcement Division of the Bureau of Materials Management and Compliance Assurance, as well as the Municipal Facilities Section of the Bureau of Water Protection and Land Reuse, administer the NPDES program for discharges from individual, municipal, and industrial WPCFs. Wastewater treated by WPCFs remove or greatly reduce a variety of organic and inorganic pollutants so that post-treatment discharges are consistent with State WQS. Figure 3-1 shows the locations of 45 NPDES facilities (43 of which are WPCFs) discharging phosphorus to non-tidal freshwater rivers in Connecticut.
Connecticut Statewide Lake Nutrient TMDL
15
Figure 3-1. Map of 45 NPDES-permitted wastewater pollution control and industrial facilities discharging phosphorus to non-tidal freshwater rivers in the State of Connecticut. Part of the statewide phosphorus reduction strategy.
Connecticut Statewide Lake Nutrient TMDL
16
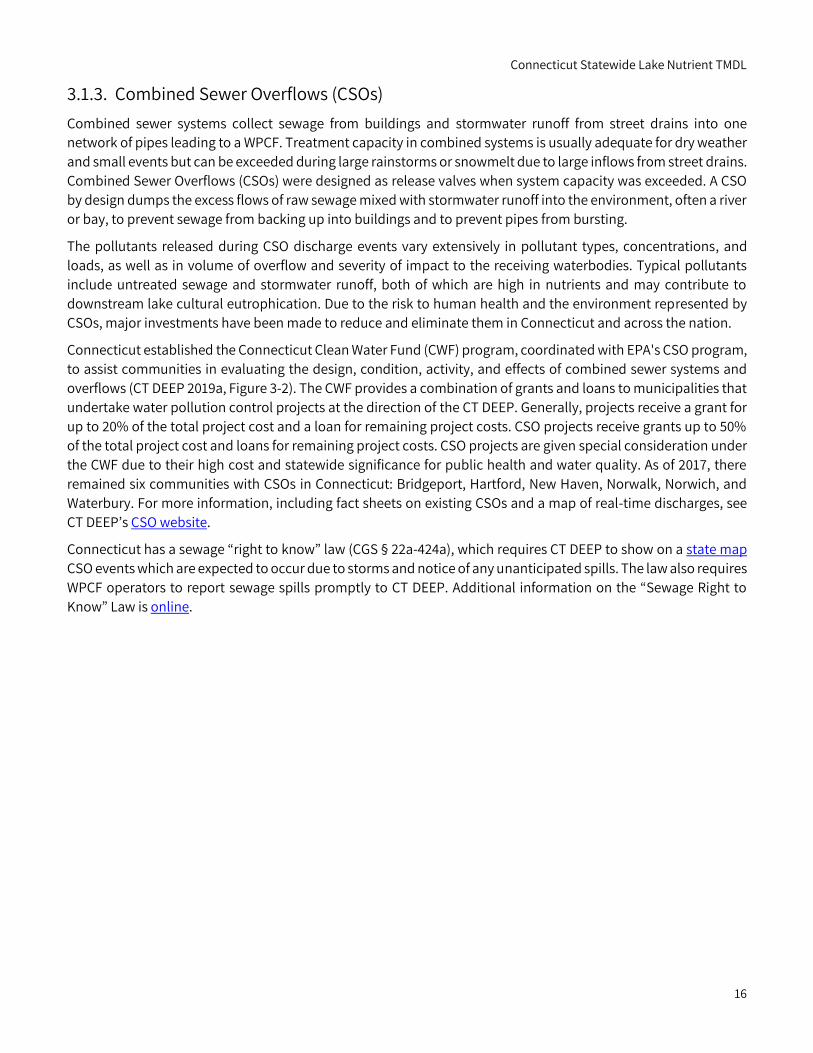
3.1.3. Combined Sewer Overflows (CSOs) Combined sewer systems collect sewage from buildings and stormwater runoff from street drains into one network of pipes leading to a WPCF. Treatment capacity in combined systems is usually adequate for dry weather and small events but can be exceeded during large rainstorms or snowmelt due to large inflows from street drains. Combined Sewer Overflows (CSOs) were designed as release valves when system capacity was exceeded. A CSO by design dumps the excess flows of raw sewage mixed with stormwater runoff into the environment, often a river or bay, to prevent sewage from backing up into buildings and to prevent pipes from bursting.
The pollutants released during CSO discharge events vary extensively in pollutant types, concentrations, and loads, as well as in volume of overflow and severity of impact to the receiving waterbodies. Typical pollutants include untreated sewage and stormwater runoff, both of which are high in nutrients and may contribute to downstream lake cultural eutrophication. Due to the risk to human health and the environment represented by CSOs, major investments have been made to reduce and eliminate them in Connecticut and across the nation.
Connecticut established the Connecticut Clean Water Fund (CWF) program, coordinated with EPA's CSO program, to assist communities in evaluating the design, condition, activity, and effects of combined sewer systems and overflows (CT DEEP 2019a, Figure 3-2). The CWF provides a combination of grants and loans to municipalities that undertake water pollution control projects at the direction of the CT DEEP. Generally, projects receive a grant for up to 20% of the total project cost and a loan for remaining project costs. CSO projects receive grants up to 50% of the total project cost and loans for remaining project costs. CSO projects are given special consideration under the CWF due to their high cost and statewide significance for public health and water quality. As of 2017, there remained six communities with CSOs in Connecticut: Bridgeport, Hartford, New Haven, Norwalk, Norwich, and Waterbury. For more information, including fact sheets on existing CSOs and a map of real-time discharges, see CT DEEP’s CSO website.
Connecticut has a sewage “right to know” law (CGS § 22a-424a), which requires CT DEEP to show on a state map CSO events which are expected to occur due to storms and notice of any unanticipated spills. The law also requires WPCF operators to report sewage spills promptly to CT DEEP. Additional information on the “Sewage Right to Know” Law is online.
Connecticut Statewide Lake Nutrient TMDL
17
Figure 3-2. Map of combined sewer overflow (CSO) locations in the State of Connecticut.
Connecticut Statewide Lake Nutrient TMDL
18
3.1.4. Stormwater from Regulated Point Sources Stormwater is water that does not soak into the ground during a rainstorm but instead flows over the surface of the ground until it reaches a waterbody or enters a drainage system and is transferred to a receiving waterbody. As the stormwater moves, it picks up and carries away natural and anthropogenic pollutants, such as soil, fertilizers, manure, leaked oil, brake dust, and many others, and eventually deposits pollutants into surface waters. Stormwater is one of the leading sources of impairment of our nation’s waters and often contains high concentrations of various pollutants including nutrients like phosphorus and nitrogen.
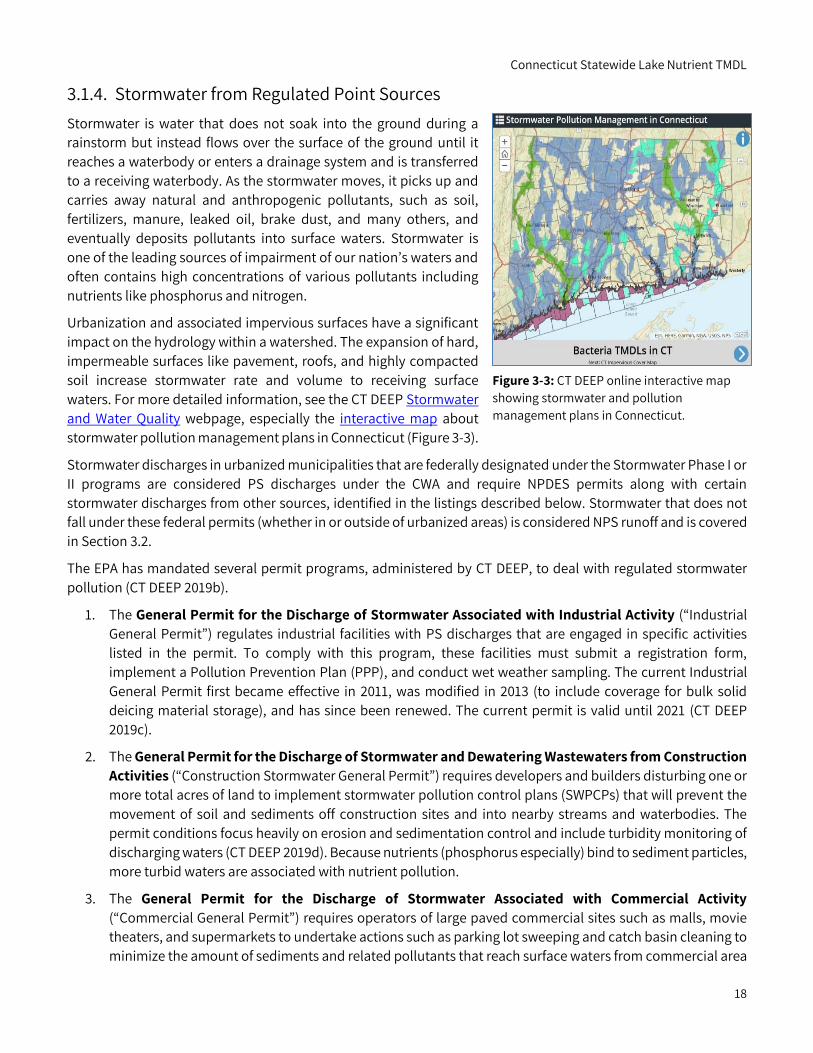
Urbanization and associated impervious surfaces have a significant impact on the hydrology within a watershed. The expansion of hard, impermeable surfaces like pavement, roofs, and highly compacted soil increase stormwater rate and volume to receiving surface waters. For more detailed information, see the CT DEEP Stormwater and Water Quality webpage, especially the interactive map about stormwater pollution management plans in Connecticut (Figure 3-3).
Stormwater discharges in urbanized municipalities that are federally designated under the Stormwater Phase I or II programs are considered PS discharges under the CWA and require NPDES permits along with certain stormwater discharges from other sources, identified in the listings described below. Stormwater that does not fall under these federal permits (whether in or outside of urbanized areas) is considered NPS runoff and is covered in Section 3.2.
The EPA has mandated several permit programs, administered by CT DEEP, to deal with regulated stormwater pollution (CT DEEP 2019b).
1. The General Permit for the Discharge of Stormwater Associated with Industrial Activity (“Industrial General Permit”) regulates industrial facilities with PS discharges that are engaged in specific activities listed in the permit. To comply with this program, these facilities must submit a registration form, implement a Pollution Prevention Plan (PPP), and conduct wet weather sampling. The current Industrial General Permit first became effective in 2011, was modified in 2013 (to include coverage for bulk solid deicing material storage), and has since been renewed. The current permit is valid until 2021 (CT DEEP 2019c).
2. The General Permit for the Discharge of Stormwater and Dewatering Wastewaters from Construction Activities (“Construction Stormwater General Permit”) requires developers and builders disturbing one or more total acres of land to implement stormwater pollution control plans (SWPCPs) that will prevent the movement of soil and sediments off construction sites and into nearby streams and waterbodies. The permit conditions focus heavily on erosion and sedimentation control and include turbidity monitoring of discharging waters (CT DEEP 2019d). Because nutrients (phosphorus especially) bind to sediment particles, more turbid waters are associated with nutrient pollution.
3. The General Permit for the Discharge of Stormwater Associated with Commercial Activity (“Commercial General Permit”) requires operators of large paved commercial sites such as malls, movie theaters, and supermarkets to undertake actions such as parking lot sweeping and catch basin cleaning to minimize the amount of sediments and related pollutants that reach surface waters from commercial area
Figure 3-3: CT DEEP online interactive map showing stormwater and pollution management plans in Connecticut.
Connecticut Statewide Lake Nutrient TMDL
19
runoff. The program was implemented through CT DEEP’s own initiatives (rather than EPA mandate) in August 1995 to help track impacts to water quality from commercial development in Connecticut. Sites authorized by this permit must develop and implement a Stormwater Management Plan (SWMP), which consists of records, schedules, and instructions with the facilities’ Stormwater Management Measures. The permit was reissued on September 10, 2020 and expires in 2022 (CT DEEP 2020a). Stormwater Management Measures mentioned in this permit include a Pollution Prevention Team, a sweeping plan, outside storage actions, controls on water from washing materials, a Spill Control and Response Plan, and other measures.
4. The Stormwater from Small Municipal Separate Storm Sewer Systems (MS4) General Permit requires municipalities with urbanized areas to take steps to minimize stormwater pollutants from discharging to waterbodies from urbanized municipal drainage systems. Each municipality covered by the MS4 permit must fulfill six minimum measures/pollutant reduction requirements based on a timeline provided by CT DEEP. The range of activities includes planning, mapping, ordinances and regulations, monitoring, education and outreach, and public participation.
The current MS4 General Permit is valid from 2017 to 2022 (CT DEEP 2016). The permit was updated to reflect the 2010 Census data, and federal institutions, military facilities, and eight municipalities were added. Institutions are considered if they do not already fall within urbanized areas (as defined by the 2010 census) but have dense urban population clusters with stormwater discharges to impaired waters that are causing the impairment. As of February 5, 2018, 121 municipalities and 12 institutions were covered by permit (CT DEEP 2018).
CT DEEP created a series of fact sheets which provide water quality charts, maps, and MS4 pollutant control activities for every municipality in the State. CT DEEP has also partnered with UConn’s Center for Land Use Education and Research (CLEAR) to support and assist municipalities with MS4 permit compliance.
5. The Department of Transportation (DOT) Separate Storm Sewer System General Permit (“CT DOT MS4”) requires DOT to take steps to minimize stormwater pollutants from discharging to waterbodies from the DOT separate storm sewer systems. The applicability and requirements of this permit are similar to the MS4 permit above. The permit became active on July 1, 2019. Compliance with the permit involves creating a SWMP, executing a monitoring program for discharges contributing to stream impairments, and submitting Annual Reports that describe implementation efforts. A fact sheet describing the CT DOT MS4 permit.
3.2. Nonpoint Source Pollution NPS pollution comes from many diffuse sources on the landscape and is more difficult to identify and control than PS pollution. NPS pollution can result from contaminants transported by overland runoff (e.g., agricultural runoff or runoff from unregulated suburban and rural areas), groundwater flow, or direct deposition of pollutants to receiving waters. Runoff occurring outside federally designated urban areas is considered a NPS discharge and typically is not regulated under the NPDES program (unless it is covered by a NPDES general or individual permit).
Examples of NPS pollution that can contribute nutrients to surface waters via runoff, groundwater, and direct deposition include malfunctioning septic systems, erosion from disturbed ground or along roads, excessive fertilizer application, unmitigated agricultural activities, pet waste, and wildlife waste. The Connecticut Nonpoint Source Management Program Plan (2019) lays out CT DEEP’s 5-year approach to addressing NPS pollution for the protection and restoration of water resources in the State.
Connecticut Statewide Lake Nutrient TMDL
20
3.2.1. Polluted Runoff As discussed above, stormwater runoff can be categorized as either PS or NPS pollution, depending on whether it occurs in a federally designated MS4 urbanized area. NPS runoff discharges are generally characterized as diffuse or sheet flow runoff that occur outside regulated urban areas and thus are not categorically regulated under the NPDES program. Resources such as the Connecticut RiverSmart program provide developed material and programs to help manage local polluted runoff.
3.2.2. Subsurface Sewage Treatment and Disposal Systems Untreated discharges of sewage (domestic wastewater) are prohibited regardless of source. An example of an NPS discharge of untreated wastewater is from insufficient or malfunctioning subsurface sewage treatment and disposal systems, commonly referred to as septic systems. When properly designed, installed, operated, and maintained, subsurface sewage treatment and disposal systems effectively reduce phosphorus concentrations in sewage within a zone close to the system. Nitrogen loading is more complex. Depending on soil type and groundwater conditions, some systems are a source of nitrates to groundwater and ultimately surface waters. Age, overloading, or poor maintenance can result in system failure and the release of nutrients and other pollutants into surface waters (EPA 2002). Nutrients from insufficient subsurface sewage treatment and disposal systems can enter surface waters through surface overflow or breakout, stormwater runoff, or groundwater.
According to the CT DPH, approximately 40% of the population in Connecticut uses individual subsurface sewage treatment and disposal systems to treat wastewater and disperse it back into the environment. There are several specific types of systems that may be installed onsite. The following definitions highlight the major differences in function and type of systems that are available for consideration at sites across Connecticut.
A "conventional subsurface sewage treatment and disposal system" consists of a building sewer, a septic tank followed by a leaching system, any necessary pumps or siphons, and any groundwater control system on which the operation of the leaching system is dependent.
• The building sewer conveys the wastewater from the house plumbing to the septic tank. • The septic tank is a watertight receptacle that serves as the primary physical treatment of the
wastewater. Here, the heavier solids are settled out, and the floating scum and greases are kept from escaping into the leaching field. The standard septic tank has a 1,000-gallon minimum liquid capacity and may be made from concrete or plastic. Newer tanks are equipped with inlet and outlet baffles, an interior compartment wall, and an effluent filter, all which assist in retaining scum/solids inside the septic tank. A relatively stable biological system within the septic tank helps promote the reduction of complex organic compounds to simpler soluble chemicals and gases.
• Distribution piping directs the flow of sewage effluent to the leaching system in a manner that assures full utilization of the system. Sewage effluent can flow through the distribution piping by means of gravity or with the assistance of a mechanical pump or siphon.
• The leaching system disperses the sewage effluent into the surrounding soil, which provides further biological treatment to the sewage. There are many types of leaching systems. The specific type utilized on a property is usually dependent on the soil conditions on that site. Most residential installations utilize stone-filled leaching trenches or hollow structures surrounded by stone. Septic system specifications are designed primarily to reduce pathogen loads to the environment. These specifications often provide adequate phosphorus removal, while nitrogen removal is not assured. Specifications include a minimum separating distance of at least 18 inches between the bottom of the leaching system and maximum groundwater level, as well as 4 feet between the
Connecticut Statewide Lake Nutrient TMDL
21
bottom of the leaching system and ledge rock. These distances may be increased due to specific site conditions.
A "community subsurface sewage treatment and disposal system" consists of one subsurface sewage treatment and disposal system serving two or more residential buildings, regardless of system size.
An "alternative treatment system" consists of a sewage treatment system serving one or more buildings that utilizes a method of treatment other than a subsurface sewage treatment and disposal system and that involves a discharge to the groundwaters of the State.
Regulatory authority (design review, permitting, and enforcement) over subsurface sewage treatment and disposal systems varies, depending on the designed flow capacity and the type of treatment and disposal system present on the site. In Connecticut, local Departments of Health issue approvals and permits (Approval to Construct, Permit to Discharge) for SSDSs up to 7,500 GPD. DPH is required to approve large (2,000 to 7,500 GPD) SSDS plans in accordance with Section 19-13-B103d (c) of the Regulations of CT State Agencies (RCSAs). Regulatory jurisdiction for alternative treatment systems with design flows less than 7,500 gpd has also been delegated to DPH, but due to lack of available resources, a state-wide program for approving and permitting those systems does not yet exist. Use of alternative treatment systems with design flows less than 7,500 GPD is an option but recommended after a statewide permitting program is established. If used, proper permitting and regulatory oversight would need to be followed. Conventional and alternative treatment systems with design flows of greater than 7,500 gpd and all community treatment systems are regulated by the CT DEEP. It is possible for a system to change jurisdiction if any expansions are created to add on more structures to a system or to account for increase in flows over the previous designs. These changes would move jurisdiction to CT DEEP.
3.2.3. Erosion Erosion can occur when ground is disturbed by digging, construction, plowing, foot or vehicle traffic, or wildlife. Soil which is normally stable can be mobilized by rain, wind, ice, and gravity when protective vegetation is removed, more fragile underlying soil layers are exposed, change in slopes or upstream soil compaction occurs, or other landscape altering activities (CTSWCS 2002). Rain and associated runoff are the primary pathways by which eroded soil reaches lakes and streams. Once in surface waters, nutrients are released from the soil particles into the water column, causing excess nutrient loading to surface waters or cultural eutrophication.
Since development demand near lakes is high, construction activities in lake watersheds can be a large source of nutrients. Unpaved roads and trails used by motorized vehicles near lakes and streams are especially vulnerable to erosion. Stream bank erosion can also have a rapid and severe effect on lake water quality and can be triggered or worsened by upstream impervious surfaces like buildings, parking lots, and roads which send large amounts of high velocity runoff to surface waters. Maintaining natural vegetative buffers around lakes and streams and employing strict erosion and sedimentation controls for construction can minimize these effects (CT DEEP 1996a) Where erosion is considered a point source, erosion control is a crucial function of several permit programs (Construction General Permit, Commercial General Permit, MS4 Permit, and others; see Section 3.1.4).
Additionally, evaluating culverts may help to identify issues that contribute to nutrient loading via transport of sediment and attached nutrients. An example of a program designed to evaluate the impacts from stream crossings is available at the Housatonic Valley Association’s Reconnect Rivers and Streams web page.
Connecticut Statewide Lake Nutrient TMDL
22
3.2.4. Fertilizers When lawn and garden fertilizers are applied in excessive amounts, in the wrong season, or just before heavy precipitation, they can be transported by rain or snowmelt runoff to lakes and other surface waters where they can promote cultural eutrophication and impair the recreational and aquatic life uses of the waterbody.
Connecticut passed Public Act 12-155, An Act Concerning Phosphorus Reductions in State Waters (State of Connecticut 2012) requiring the development of a statewide strategy to address phosphorus impacts on water quality, as well as control the application of fertilizers. Section 2 of the Act requires soil tests to demonstrate a need for any phosphate application to lawns and prohibits phosphate application within 15 feet of a surface water, among other restrictions on fertilizer application. UConn’s National Nonpoint Education for Municipal Officials (NEMO) program developed a bulletin on maximizing efficiency of lawn fertilizer applications (UConn 2017).
3.2.5. Agriculture Agriculture in Connecticut includes cropland, livestock, forestry and forest products, bees, poultry, Christmas trees, vineyards, maple syrup, aquaculture, and orchards (CT FB 2009). Agricultural activities, including dairy farming, raising livestock and poultry, growing crops, and keeping horses and other animals for pleasure or profit, involve managing nutrients. Most agricultural discharges are considered sources of NPS pollution. However, certain agricultural activities are regulated under the NPDES program as PS discharges.
Agricultural activities and facilities with the potential to contribute to nutrient impairment include:
• Plowing and earth moving; • Fertilizer and manure storage and application; • Livestock grazing; • Animal feeding operations and barnyards; • Paddock and exercise areas for horses and other animals; and • Leachate from haylage/silage storage bunkers.
Diffuse runoff of farm animal waste from land surfaces (whether from manure stockpiles or cropland where manure is spread), as well as direct deposition of fecal matter from farm animals standing or swimming in surface waters, are significant sources of agricultural nutrient pollution in surface waters (EPA 2003). Farm activities like plowing, livestock grazing, vegetation clearing, and vehicle traffic can also result in soil erosion which can contribute to nutrient pollution.
Excessive or ill-timed application of fertilizer or poor storage which allows nutrients to wash away with precipitation not only endangers lakes and other waters, it also means those nutrients are not reaching the intended crop. The key to nutrient application is to apply the right amount of nutrients at the right time. When appropriately applied to soil, synthetic fertilizers or animal manure can fertilize crops and restore nutrients to the land. When improperly managed, pollutants in manure can enter surface waters through several pathways, including surface runoff and erosion, direct discharges to surface water, spills and other dry-weather discharges, and leaching into soil and groundwater.
3.2.6. Pets In residential areas, fecal matter from pets can be a significant contributor of nutrients to surface waters. Each dog is estimated to produce 200 grams of feces per day, which contain concentrated amounts of phosphorus and nitrogen (CWP 1999). If pet feces are not properly disposed, these nutrients can be washed off the land and transported to surface waters by stormwater runoff. Pet feces can also enter surface waters by direct deposition of fecal matter from pets standing or swimming in surface waters. CT DEEP has several online resources for
Connecticut Statewide Lake Nutrient TMDL
23
managing pet waste, including Pollution Prevention webpage for pets and the Give a Bark for Clean State Park program.
3.2.7. Wildlife Fecal matter from wildlife such as geese, gulls, other birds, and beaver may be a significant source of nutrients in some watersheds. This is particularly true when human activities, including the direct and indirect feeding of wildlife and habitat modification, result in the congregation of wildlife (CWP 1999). Congregations of geese, gulls, and ducks are of concern because they often deposit their fecal matter next to or directly into surface waters. Examples include large mowed fields adjacent to lakes and streams where geese and other waterfowl gather, as well as the underside of bridges with pipes or joists directly over the water that attract large numbers of pigeons or other birds. Studies show that geese inhabiting riparian areas increase soil nitrogen availability (Choi et al. 2020) and gulls along shorelines increase phosphorus concentration in beach sand pore water that then enters surface waters through groundwater transport and wave action (Staley et al. 2018). When submerged in water, the droppings from geese and gulls quickly release nitrogen and phosphorus into the water column, contributing to eutrophication in freshwater ecosystems (Mariash et al. 2019). On a global scale, fluxes of nitrogen and phosphorus from seabird populations have been estimated at 591 Gg N per year and 99 Gg P per year, respectively (with the highest values derived from arctic and southern shorelines) (Otero et al. 2018). Additionally, other studies show greater concentrations of nitrogen, ammonia, and dissolved organic carbon downstream of beaver impoundments when compared to similar streams with no beaver activity in New England (Bledzki et al. 2010).
Connecticut Statewide Lake Nutrient TMDL
24
4. Total Maximum Daily Load When CT DEEP determines that a lake’s current trophic state is more eutrophic than its natural trophic state and requires a TMDL (i.e., placed on the 303(d) List of Impaired Waters in the IWQR), action must be taken to restore water quality and protect the lake’s designated uses. This action begins by developing an Action Plan. A TMDL is one type of Action Plan focused on water quality restoration consistent with federal requirements and guidelines. A TMDL forms the basis for the subsequent development of implementation plans and actions to achieve the water quality targets (refer to Sections 5 and 6).
Determining the TMDL that a waterbody can assimilate without exceeding WQS is challenging and complex for the following reasons: (1) Many lakes receive a significant portion of their nutrient load from diffuse landscape or nonpoint sources, which are highly variable and difficult to quantify without a substantial data set. Internal loading of nutrients, which is retention and cycling of nutrients within a lake, can also play a significant role but can also be difficult to quantify without adequate water quality data. (2) Lakes generally respond to nutrient loading on a seasonal time scale, rather than a daily time scale. Nutrient loading capacity is typically determined through water quality modeling, which is often expressed on an annual basis, targeting the time of year when nutrients are likely to be transported to the lake and affect water quality. Therefore, it is most appropriate to quantify a lake TMDL as an annual load and evaluate the results of that annual load on seasonal conditions from April through October, which is most critical to supporting designated uses. (3) Additionally, water quality response to nutrient loading in lakes depends on several factors, including weather patterns (drought, storm events), lake morphology, and nutrient forms. Consequently, while a single value may be chosen, the TMDL for each nutrient represents a range of loads with a probability distribution for associated water quality problems, such as algal blooms. In these cases, an adaptive management approach can be used to assess water quality following implementation efforts and help inform future implementation efforts (depending on whether milestones are being met or not).
4.1. TMDL Components A TMDL identifies the amount of a pollutant that a waterbody can assimilate without exceeding water quality criteria or impairing designated use(s). It is the loading capacity of a waterbody including a margin of safety (MOS) to account for uncertainty in target setting. The TMDL allocates pollutant loads among PS discharges permitted under NPDES and all other NPS discharges. A TMDL can be represented as:
TMDL = Loading Capacity = Σ WLA + Σ LA + MOS Where:
Σ WLA = sum of the Waste Load Allocations (i.e., PS discharges, including NPDES-regulated stormwater)
Σ LA = sum of the Load Allocations (i.e., natural background, NPS pollution, and stormwater not regulated by NPDES)
MOS = Margin of Safety
The loading allocations can be expressed as a mass per unit time (e.g., daily load), concentration, or other appropriate measures (40 CFR Part 103.2(i)). The WLA and LA both need to account for existing and future loads.
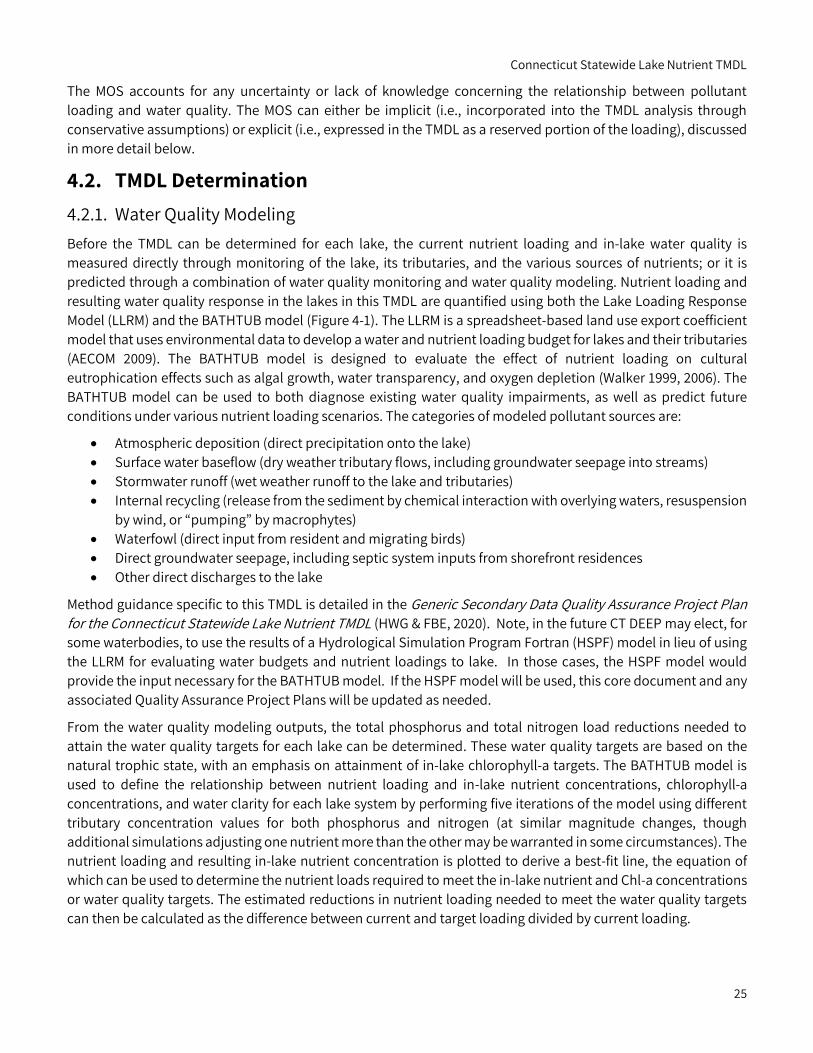
Connecticut Statewide Lake Nutrient TMDL
25
The MOS accounts for any uncertainty or lack of knowledge concerning the relationship between pollutant loading and water quality. The MOS can either be implicit (i.e., incorporated into the TMDL analysis through conservative assumptions) or explicit (i.e., expressed in the TMDL as a reserved portion of the loading), discussed in more detail below.
4.2. TMDL Determination 4.2.1. Water Quality Modeling Before the TMDL can be determined for each lake, the current nutrient loading and in-lake water quality is measured directly through monitoring of the lake, its tributaries, and the various sources of nutrients; or it is predicted through a combination of water quality monitoring and water quality modeling. Nutrient loading and resulting water quality response in the lakes in this TMDL are quantified using both the Lake Loading Response Model (LLRM) and the BATHTUB model (Figure 4-1). The LLRM is a spreadsheet-based land use export coefficient model that uses environmental data to develop a water and nutrient loading budget for lakes and their tributaries (AECOM 2009). The BATHTUB model is designed to evaluate the effect of nutrient loading on cultural eutrophication effects such as algal growth, water transparency, and oxygen depletion (Walker 1999, 2006). The BATHTUB model can be used to both diagnose existing water quality impairments, as well as predict future conditions under various nutrient loading scenarios. The categories of modeled pollutant sources are:
• Atmospheric deposition (direct precipitation onto the lake) • Surface water baseflow (dry weather tributary flows, including groundwater seepage into streams) • Stormwater runoff (wet weather runoff to the lake and tributaries) • Internal recycling (release from the sediment by chemical interaction with overlying waters, resuspension
by wind, or “pumping” by macrophytes) • Waterfowl (direct input from resident and migrating birds) • Direct groundwater seepage, including septic system inputs from shorefront residences • Other direct discharges to the lake
Method guidance specific to this TMDL is detailed in the Generic Secondary Data Quality Assurance Project Plan for the Connecticut Statewide Lake Nutrient TMDL (HWG & FBE, 2020). Note, in the future CT DEEP may elect, for some waterbodies, to use the results of a Hydrological Simulation Program Fortran (HSPF) model in lieu of using the LLRM for evaluating water budgets and nutrient loadings to lake. In those cases, the HSPF model would provide the input necessary for the BATHTUB model. If the HSPF model will be used, this core document and any associated Quality Assurance Project Plans will be updated as needed.
From the water quality modeling outputs, the total phosphorus and total nitrogen load reductions needed to attain the water quality targets for each lake can be determined. These water quality targets are based on the natural trophic state, with an emphasis on attainment of in-lake chlorophyll-a targets. The BATHTUB model is used to define the relationship between nutrient loading and in-lake nutrient concentrations, chlorophyll-a concentrations, and water clarity for each lake system by performing five iterations of the model using different tributary concentration values for both phosphorus and nitrogen (at similar magnitude changes, though additional simulations adjusting one nutrient more than the other may be warranted in some circumstances). The nutrient loading and resulting in-lake nutrient concentration is plotted to derive a best-fit line, the equation of which can be used to determine the nutrient loads required to meet the in-lake nutrient and Chl-a concentrations or water quality targets. The estimated reductions in nutrient loading needed to meet the water quality targets can then be calculated as the difference between current and target loading divided by current loading.
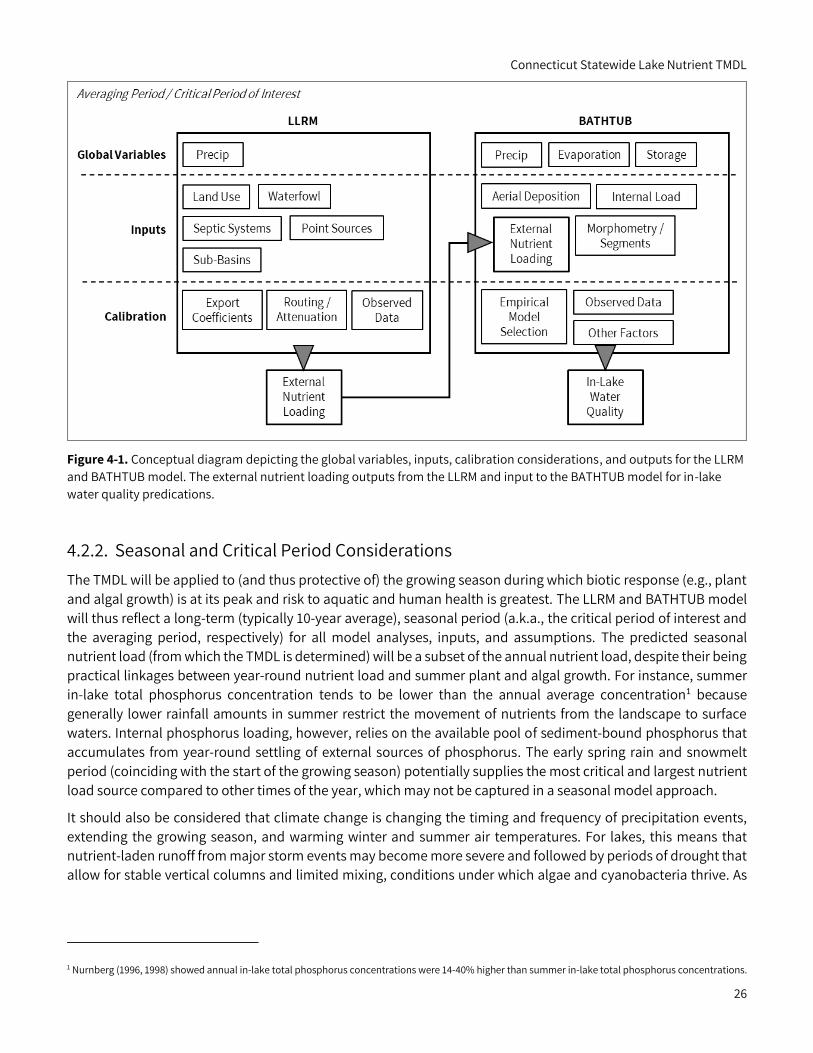
Connecticut Statewide Lake Nutrient TMDL
26
Figure 4-1. Conceptual diagram depicting the global variables, inputs, calibration considerations, and outputs for the LLRM and BATHTUB model. The external nutrient loading outputs from the LLRM and input to the BATHTUB model for in-lake water quality predications.
4.2.2. Seasonal and Critical Period Considerations The TMDL will be applied to (and thus protective of) the growing season during which biotic response (e.g., plant and algal growth) is at its peak and risk to aquatic and human health is greatest. The LLRM and BATHTUB model will thus reflect a long-term (typically 10-year average), seasonal period (a.k.a., the critical period of interest and the averaging period, respectively) for all model analyses, inputs, and assumptions. The predicted seasonal nutrient load (from which the TMDL is determined) will be a subset of the annual nutrient load, despite their being practical linkages between year-round nutrient load and summer plant and algal growth. For instance, summer in-lake total phosphorus concentration tends to be lower than the annual average concentration1 because generally lower rainfall amounts in summer restrict the movement of nutrients from the landscape to surface waters. Internal phosphorus loading, however, relies on the available pool of sediment-bound phosphorus that accumulates from year-round settling of external sources of phosphorus. The early spring rain and snowmelt period (coinciding with the start of the growing season) potentially supplies the most critical and largest nutrient load source compared to other times of the year, which may not be captured in a seasonal model approach.
It should also be considered that climate change is changing the timing and frequency of precipitation events, extending the growing season, and warming winter and summer air temperatures. For lakes, this means that nutrient-laden runoff from major storm events may become more severe and followed by periods of drought that allow for stable vertical columns and limited mixing, conditions under which algae and cyanobacteria thrive. As
1 Nurnberg (1996, 1998) showed annual in-lake total phosphorus concentrations were 14-40% higher than summer in-lake total phosphorus concentrations.
Connecticut Statewide Lake Nutrient TMDL
27
such, the distribution of nutrient loading throughout the year (whether in or outside of the growing season) may be just as impactful as the amount of nutrient loading to lake systems.
Additional considerations may include differences between natural lakes and impounded reservoirs controlled by dams. Water level regulation at critical times of the year can impact the concentration and distribution of nutrients available for uptake and/or settling.
4.2.3. TMDL Allocation The TMDL allocation is distributed among the waste load allocation (WLA), load allocation (LA), and MOS. TMDL allocations are specified in each lake-specific appendix. The loading targets developed are expressed in kg/year, based on loading estimates for models calibrated to April through October. Dividing the loading targets by 365 provides an estimate of the daily load associated with the allocations.
WASTE LOAD ALLOCATION (WLA) AND LOAD ALLOCATION (LA)
The WLA refers to the portion of loading capacity allocated to PS discharges, such as piped stormwater, construction runoff, and nutrient pollution from other regulated activities. The LA refers to the portion of loading capacity allocated to NPS pollution and natural background, such as diffuse overland runoff, septic systems, groundwater seepage, internal loading, atmospheric deposition, and waterfowl. Both PS and NPS pollution are described in detail in Section 3.
In practice, data are usually not sufficiently detailed to allow a precise separation of PS and NPS pollution. Therefore, in this TMDL, the WLA is set as the MS4-regulated watershed load (plus any other NPDES regulated discharges, which may be present), while the LA is set as the sum of the non- regulated watershed load, atmospheric deposition, septic systems, waterfowl, and internal loading. The percent of directly connected impervious area (DCIA) will be determined for MS4-regulated areas in the watershed (percent out of the total DCIA in the watershed) and applied to the total watershed load. The difference between the MS4-regulated watershed load and the total watershed load will be the non-regulated watershed load.
MARGIN OF SAFETY
Federal regulations require that all TMDL analyses include a MOS to account for uncertainties in model inputs and/or assumptions. In this TMDL, the modeling inputs and assumptions are used to determine both the current and natural trophic status of each lake and thus the nutrient load reductions necessary to achieve the numeric water quality targets. The MOS may be either implicit or explicit in the analysis, or both. TMDL guidance suggests that an implicit MOS can be accounted for by using conservative assumptions and/or calculations, while an explicit MOS can be derived from statistical analysis of uncertainty and applied as a portion of the total target load (EPA 1999b; Walker 2001).
This TMDL employs the Walker (2001) approach. Instead of an implicit MOS based on conservative assumptions, this TMDL accounts for uncertainty in an explicit MOS. An appropriate factor ‘f’, which represents the fraction of the TMDL that is allocated to the MOS, is selected from Table 4-1 for various values of model standard error (S) and risk level (α). This TMDL uses a confidence level of 0.90 by default unless otherwise justified. Data-rich constitutes those waterbodies with 3 or more years of in-lake water quality data. Data-poor constitutes those waterbodies with 1 or less years of in-lake water quality data. The number of segments with adequate water quality data may also be considered and may increase the S value selected. This approach assumes that enough data are available for model calibration to minimize model error, otherwise the MOS could become impractically large. Best professional judgement should be used to select the most appropriate S value and confidence level for each waterbody that is acceptable to both CT DEEP and the USEPA.
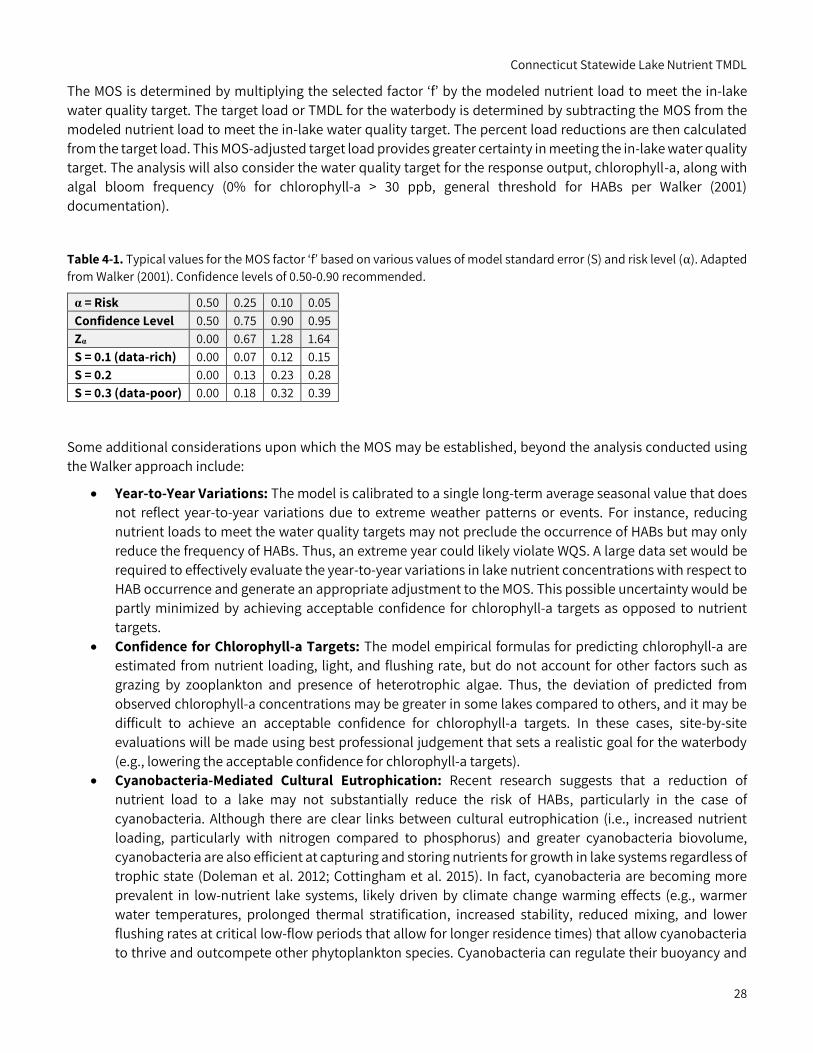
Connecticut Statewide Lake Nutrient TMDL
28
The MOS is determined by multiplying the selected factor ‘f’ by the modeled nutrient load to meet the in-lake water quality target. The target load or TMDL for the waterbody is determined by subtracting the MOS from the modeled nutrient load to meet the in-lake water quality target. The percent load reductions are then calculated from the target load. This MOS-adjusted target load provides greater certainty in meeting the in-lake water quality target. The analysis will also consider the water quality target for the response output, chlorophyll-a, along with algal bloom frequency (0% for chlorophyll-a > 30 ppb, general threshold for HABs per Walker (2001) documentation).
Table 4-1. Typical values for the MOS factor ‘f’ based on various values of model standard error (S) and risk level (α). Adapted from Walker (2001). Confidence levels of 0.50-0.90 recommended.
α = Risk 0.50 0.25 0.10 0.05 Confidence Level 0.50 0.75 0.90 0.95 Zα 0.00 0.67 1.28 1.64 S = 0.1 (data-rich) 0.00 0.07 0.12 0.15 S = 0.2 0.00 0.13 0.23 0.28 S = 0.3 (data-poor) 0.00 0.18 0.32 0.39
Some additional considerations upon which the MOS may be established, beyond the analysis conducted using the Walker approach include:
• Year-to-Year Variations: The model is calibrated to a single long-term average seasonal value that does not reflect year-to-year variations due to extreme weather patterns or events. For instance, reducing nutrient loads to meet the water quality targets may not preclude the occurrence of HABs but may only reduce the frequency of HABs. Thus, an extreme year could likely violate WQS. A large data set would be required to effectively evaluate the year-to-year variations in lake nutrient concentrations with respect to HAB occurrence and generate an appropriate adjustment to the MOS. This possible uncertainty would be partly minimized by achieving acceptable confidence for chlorophyll-a targets as opposed to nutrient targets.
• Confidence for Chlorophyll-a Targets: The model empirical formulas for predicting chlorophyll-a are estimated from nutrient loading, light, and flushing rate, but do not account for other factors such as grazing by zooplankton and presence of heterotrophic algae. Thus, the deviation of predicted from observed chlorophyll-a concentrations may be greater in some lakes compared to others, and it may be difficult to achieve an acceptable confidence for chlorophyll-a targets. In these cases, site-by-site evaluations will be made using best professional judgement that sets a realistic goal for the waterbody (e.g., lowering the acceptable confidence for chlorophyll-a targets).
• Cyanobacteria-Mediated Cultural Eutrophication: Recent research suggests that a reduction of nutrient load to a lake may not substantially reduce the risk of HABs, particularly in the case of cyanobacteria. Although there are clear links between cultural eutrophication (i.e., increased nutrient loading, particularly with nitrogen compared to phosphorus) and greater cyanobacteria biovolume, cyanobacteria are also efficient at capturing and storing nutrients for growth in lake systems regardless of trophic state (Doleman et al. 2012; Cottingham et al. 2015). In fact, cyanobacteria are becoming more prevalent in low-nutrient lake systems, likely driven by climate change warming effects (e.g., warmer water temperatures, prolonged thermal stratification, increased stability, reduced mixing, and lower flushing rates at critical low-flow periods that allow for longer residence times) that allow cyanobacteria to thrive and outcompete other phytoplankton species. Cyanobacteria can regulate their buoyancy and
Connecticut Statewide Lake Nutrient TMDL
29
travel vertically in the water column to maximize their capture of both sunlight and sediment phosphorus (even during stratification and/or under oxic conditions) for growth. Cyanobacteria can also fix atmospheric nitrogen, if enough light, phosphorus, iron, and molybdenum are available for the energy-taxing process. Some taxa are also able to store excess nitrogen and phosphorus intra-cellularly for later use under more favorable conditions (e.g., warmer temperatures, greater sunlight). Because of these traits and as climate warming expands the range and dominance of cyanobacteria, cyanobacteria are one of the major factors driving positive feedbacks with lake cultural eutrophication and may prevent complete recovery of lakes from eutrophic states (Doleman et al. 2012). A better understanding of cyanobacteria’s role in nutrient feedbacks will be needed for better and more effective lake restoration strategies; thus, TMDLs may be adjusted in the future if needed.
• Future Development Potential: The lake-specific TMDLs will be based on nutrient loads at the time of modeling and will not reflect future watershed development potential, which would likely increase nutrient loads to the lakes. The numeric water quality targets set for each lake will remain the same, but the nutrient load reductions needed to meet the TMDL should be considered in flux. In Maine, anticipated future development was estimated to increase phosphorus loading equivalent to increasing in-lake concentration by 1 ppb (Dennis et al. 1992). While antidegradation policies limit and/or restrict any additional pollutant input to impaired waterbodies, there are typically no enforcement mechanisms in place to address this unless at the municipal level. Climate Change: Climate change has already had significant impact to lake systems and will continue to alter lake ecosystems in ways that remain uncertain. Steady-state assumptions in this era are moot as these lake systems are now more likely to be in flux from response to changing environmental factors induced by climate change. These changing dynamics may alter significant ecosystem processes and require re-modeling and re-setting of numeric water quality targets on a regular, long-term basis, and therefore the TMDL targets may need to be revisited based on evolving conditions.
4.3. Future TMDL Applicability Under appropriate circumstances in the future, CT DEEP may submit additional TMDLs to the EPA for waterbodies to be added for nutrient TMDL coverage without resubmitting the approved core document (this document). The future submittals will provide detailed information on the additional impaired waterbodies and their TMDLs. Connecticut will provide public notice for review of the additional TMDLs either alone or as part of the public notice process associated with the biannual review of the State’s IWQRs. If modifications are made to the methods for evaluating nutrient loads or calculating loading targets for lakes covered by this core document, CT DEEP will propose changes to the core document at that time and provide a public notice process for review and comment on any changes to the core document.
4.4. Monitoring Plans A monitoring program such as CT DEEP’s Water Monitoring Program or monitoring conducted by local lake associations or other groups is critical to assessing the effectiveness of implementation efforts. Monitoring will generally consist of total phosphorus, total nitrogen, chlorophyll-a, Secchi disk transparency, and presence/characteristics of algal and cyanobacteria blooms in the critical period of spring and summer. Major tributary inputs to these lakes, in additional to any critical locations within the watershed or specific sources as appropriate, should also be closely monitored for at least total phosphorus and total nitrogen. Monitoring plans should be devised to assess water quality conditions before and after significant BMP implementation projects. Additional specific monitoring components may be identified for each lake and are described in each lake’s appendix. An example monitoring program for a future WBP is provided in Section 5.2.9.
Connecticut Statewide Lake Nutrient TMDL
30
4.5. Reasonable Assurance TMDLs must include reasonable assurance that implementation activities focused on meeting the loading targets will occur. Funding is a major factor in achieving TMDL targets. Progress is also contingent on the willingness and motivation of a strong local stakeholder group to lead each lake restoration effort.
After a TMDL has been approved, the next step toward water quality attainment is ideally modification of any NPDES permits or other authorizations as needed, to address PS pollution and development of a WBP, which contains nine essential elements established by EPA, to address NPS pollution. Such a plan provides a valuable organizational vision for moving forward, establishes eligibility for CWA Section 319 NPS Grant funding, and enhances other funding opportunities by providing a concrete plan of action.
To accelerate water quality attainment, this TMDL has been written to support nearly every element of a WBP that can be determined at the TMDL stage, thus supporting implementation. Descriptions of existing watershed-specific management activities by municipalities, permit holders, and other responsible parties, as well as volunteer monitoring groups, lake associations, research organizations, and other engaged stakeholders, is provided in each lake-specific appendix. Past and current management actions, plus Connecticut WQS which specifically mandate BMPs to protect water quality, provide reasonable assurance of future efforts toward meeting the TMDL targets. RCSA § 22a-426-4(a)(11) and (12) specifically refer to nutrients:
(11) “The Commissioner shall require Best Management Practices, including the imposition of discharge limitations or other reasonable controls on a case‐by‐case basis as necessary for point and nonpoint sources of phosphorus and nitrogen, including sources of atmospheric deposition, which have the potential to contribute to the impairment of any surface water, to ensure maintenance and attainment of existing and designated uses, restore impaired waters, and prevent excessive anthropogenic inputs of nutrients or impairment of downstream waters.”
(12) “Such use of Best Management Practices and other reasonable controls on nonpoint sources of nutrients and sediment are preferable to the use of biocides to address a trophic state that has been altered due to excessive anthropogenic inputs.”
These sections of the WQS provide reasonable assurance within this TMDL that implementation actions are required in response to the nutrient loading targets set for each lake included in the TMDL.
4.6. Public Participation CTDEEP provides TMDL documents to the public for review and comment prior to establishing the TMDL and submitting it to the US EPA for review and approval. Under this effort, documents that are available for public review are noticed in appropriate newspapers and electronic notification is provided through the CTDEEP web page, various list servs, direct email notification and, in some cases, through social media. The intent is to provide substantial public outreach allowing for review and comment of available documents by interested and potentially affected stakeholders. A public meeting is held during the public comment period to provide details on the project that is available for comment and to answer any questions. Comments are to be submitted via email during the public comment period in order to be considered by CTDEEP during finalization of the documents.

Connecticut Statewide Lake Nutrient TMDL
31
4.7. Response to Public Comments Public comments received on this document or associated lake-specific TMDLs or WSPs, will be reviewed and considered, a response to comment document developed and the documents revised as appropriate prior to finalizing each document.
Connecticut Statewide Lake Nutrient TMDL
32
5. Watershed-Based Plans & Implementation
5.1. The Planning and Implementation Process Developing a WBP is often the next planning step in restoring an impaired waterbody after a TMDL document is approved. WBPs provide the framework for coordinating the lake restoration effort and include analyses, actions, participants, and resources to achieve the NPS pollutant load reductions called for in the TMDLs (EPA 2008). WBPs are developed collaboratively among stakeholders, typically municipalities, conservation districts, watershed groups, and private citizens. Management measures recommended in WBPs are voluntary (unlike the required measures for communities or industries that fall under MS4 General Permit or other NPDES permits). WBPs set mechanisms for tracking progress over time because successful lake restoration is an iterative process, requiring realistic goals over a reasonable timeframe, as well as ongoing adjustments based on monitoring results. Each lake’s nutrient impairment is a unique problem with a its own set of stakeholders and resources to solve that problem. Substantial time, financial commitment, and community drive is required to attain the targets set by the TMDL and WBP.
WBPs developed to implement this TMDL may consider other impairments and threats in the watershed. TMDLs in Connecticut focus on the watershed, incorporating the pollutant- and site-specific TMDL into the larger context of the watershed, including additional water quality threats, pollutants, and sources. WBPs should also consider the watershed size to ensure that implementing the plan will address all the major sources and causes of impairments to the waterbody of interest. Plans that bundle sub-watersheds with similar sets of problems or address a common stressor (e.g., nutrients) across multiple related watersheds can be particularly useful in terms of planning and implementation efficiency and the strategic use of administrative resources (EPA 2008). Therefore, multiple impaired segments within the larger watershed may be covered under a single WBP.
Although many different components may be included in WBPs, EPA has identified nine key elements that are critical for achieving improvements in water quality. These elements must be included in all WBPs intended to address water quality impairments with CWA Section 319 funding.
5.2. Nine Element Watershed-Based Plans Many of the required nine elements in a WBP can be adopted directly from the TMDL. For example, both the TMDL and the WBP include a description and quantification of pollutant sources, quantification of acceptable source loads, an implementation plan, a monitoring component, and information on technical and financial assistance. It is important to note that a TMDL analyzes both PS and NPS while a WBP focuses largely on NPS. Additionally, the WBP process relies more heavily on outreach and local stakeholder involvement to develop the plan. The following sections are intended to streamline the process of writing the WBP for each lake in this TMDL by
Nine Key Elements a. Identify causes and sources of
pollutants that need to be controlled. b. Determine pollutant load reductions
needed. c. Develop management measures to
reduce pollutants and achieve goals. d. Identify technical and financial
assistance needed to implement plan. e. Develop information/education
component. f. Develop implementation schedule. g. Develop interim milestones to track
implementation of management measures.
h. Develop criteria to measure progress towards meeting goals.
i. Develop monitoring component.
Connecticut Statewide Lake Nutrient TMDL
33
presenting the plan components in as much detail as possible. Sections 5.2.1 through 5.2.9 correspond to the nine elements of a WBP, with guidelines and materials for completing WBP addendums.
5.2.1. Identify Causes and Sources The core document describes generally the potential sources of nutrient loading to lakes (refer to Section 3), while the lake-specific appendices use a watershed model (LLRM) to identify and quantify sources of phosphorus and nitrogen loads to each lake and an in-lake model (BATHTUB) to determine lake water quality response. The LLRM estimates loads for multiple sub-basins, which are smaller drainage areas within the overall watershed. The models allow for input and quantification of nutrient source loads by category, including watershed runoff, groundwater, septic systems, point source discharges, atmospheric deposition, wildlife, and internal loading from lake sediments. All modeling inputs and results that identify and quantify the sources of nutrients to each lake are provided or referenced in each lake-specific appendix. Each lake-specific TMDL appendix also includes a Potential Nutrient Sources map that identifies sewer and non-sewer areas, permitted discharge sources, permitted waste sites, golf courses, migratory waterfowl hotspots, agricultural areas, and other relevant potential sources in the watershed as available through CT DEEP spatial files and records.
WBP addendums include documentation of more specific pollutant sources identified by local stakeholders and technical personnel during field surveys of the watershed. Documented pollutant sources could include:
• Street and parking lot drains which discharge to or near surface waters; • Unmanaged runoff from urban and agricultural lands; • Erosion sites (including unpaved roads, streams, construction, etc.); • Expansive pavement or lawns leading to the lake’s edge; • Over-fertilized lawns, especially adjacent to lake or tributary streams; • Sites where dog waste is regularly abandoned; • Suspected sewer and septic system leaks; • Manure management needs; and • Other stormwater or pollutant hotspots.
5.2.2. Estimate Nutrient Load Reductions Expected from Management Measures The core document describes generally the nutrient load modeling, TMDL, and percent reduction calculation methods (refer to Section 4), while the lake-specific appendices provide results from employing these modeling and calculation methods to determine nutrient load reductions to achieve WQS. General pollutant load reduction estimates are provided for some BMPs and other water quality restoration work in Section 6. While the lake-specific appendices may provide a select and prioritized list of recommended BMPs as effective management measures, the WBP addendum for each lake includes pollutant load reduction estimates for structural BMPs recommended at NPS sites identified in the field survey.
The nutrient loading estimates by sub-basin can help prioritize drainage areas within the watershed where nutrient pollutant sources are concentrated (and thus where to focus field survey efforts). For example, the LLRM can indicate which drainage areas within the lake watershed have the highest level of phosphorus and nitrogen loading per unit area (kg/ha/year). Water quality monitoring of tributary streams can refine the modeled predictions, and together they can inform a selection of high priority “management areas” for BMP installations, focused outreach and education, and additional source identification surveys. When combined with BMP cost estimates, the BMP pollutant loading estimates can also inform a cost-benefit analysis for each BMP option. See Section 6, Best Management Practices, for detailed information on the types of BMPs and the level of pollutant reduction possible.
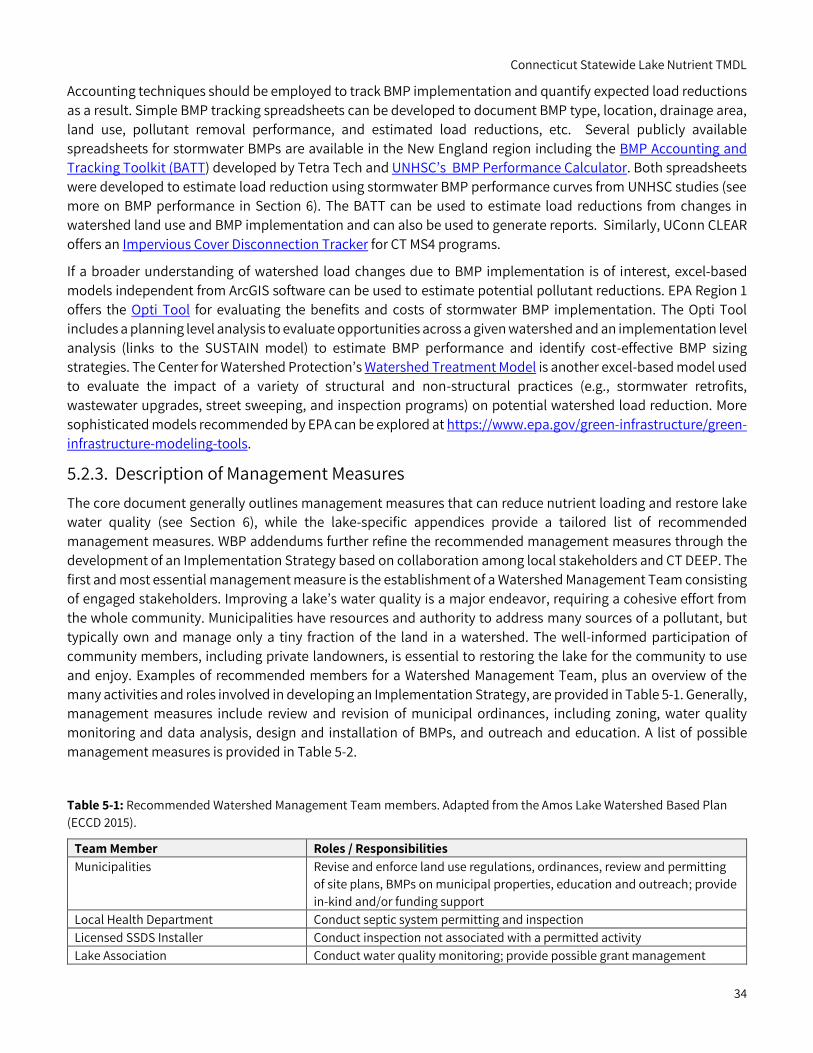
Connecticut Statewide Lake Nutrient TMDL
34
Accounting techniques should be employed to track BMP implementation and quantify expected load reductions as a result. Simple BMP tracking spreadsheets can be developed to document BMP type, location, drainage area, land use, pollutant removal performance, and estimated load reductions, etc. Several publicly available spreadsheets for stormwater BMPs are available in the New England region including the BMP Accounting and Tracking Toolkit (BATT) developed by Tetra Tech and UNHSC’s BMP Performance Calculator. Both spreadsheets were developed to estimate load reduction using stormwater BMP performance curves from UNHSC studies (see more on BMP performance in Section 6). The BATT can be used to estimate load reductions from changes in watershed land use and BMP implementation and can also be used to generate reports. Similarly, UConn CLEAR offers an Impervious Cover Disconnection Tracker for CT MS4 programs.
If a broader understanding of watershed load changes due to BMP implementation is of interest, excel-based models independent from ArcGIS software can be used to estimate potential pollutant reductions. EPA Region 1 offers the Opti Tool for evaluating the benefits and costs of stormwater BMP implementation. The Opti Tool includes a planning level analysis to evaluate opportunities across a given watershed and an implementation level analysis (links to the SUSTAIN model) to estimate BMP performance and identify cost-effective BMP sizing strategies. The Center for Watershed Protection’s Watershed Treatment Model is another excel-based model used to evaluate the impact of a variety of structural and non-structural practices (e.g., stormwater retrofits, wastewater upgrades, street sweeping, and inspection programs) on potential watershed load reduction. More sophisticated models recommended by EPA can be explored at https://www.epa.gov/green-infrastructure/green-infrastructure-modeling-tools.
5.2.3. Description of Management Measures The core document generally outlines management measures that can reduce nutrient loading and restore lake water quality (see Section 6), while the lake-specific appendices provide a tailored list of recommended management measures. WBP addendums further refine the recommended management measures through the development of an Implementation Strategy based on collaboration among local stakeholders and CT DEEP. The first and most essential management measure is the establishment of a Watershed Management Team consisting of engaged stakeholders. Improving a lake’s water quality is a major endeavor, requiring a cohesive effort from the whole community. Municipalities have resources and authority to address many sources of a pollutant, but typically own and manage only a tiny fraction of the land in a watershed. The well-informed participation of community members, including private landowners, is essential to restoring the lake for the community to use and enjoy. Examples of recommended members for a Watershed Management Team, plus an overview of the many activities and roles involved in developing an Implementation Strategy, are provided in Table 5-1. Generally, management measures include review and revision of municipal ordinances, including zoning, water quality monitoring and data analysis, design and installation of BMPs, and outreach and education. A list of possible management measures is provided in Table 5-2.
Table 5-1: Recommended Watershed Management Team members. Adapted from the Amos Lake Watershed Based Plan (ECCD 2015).
Team Member Roles / Responsibilities Municipalities Revise and enforce land use regulations, ordinances, review and permitting
of site plans, BMPs on municipal properties, education and outreach; provide in-kind and/or funding support
Local Health Department Conduct septic system permitting and inspection Licensed SSDS Installer Conduct inspection not associated with a permitted activity Lake Association Conduct water quality monitoring; provide possible grant management
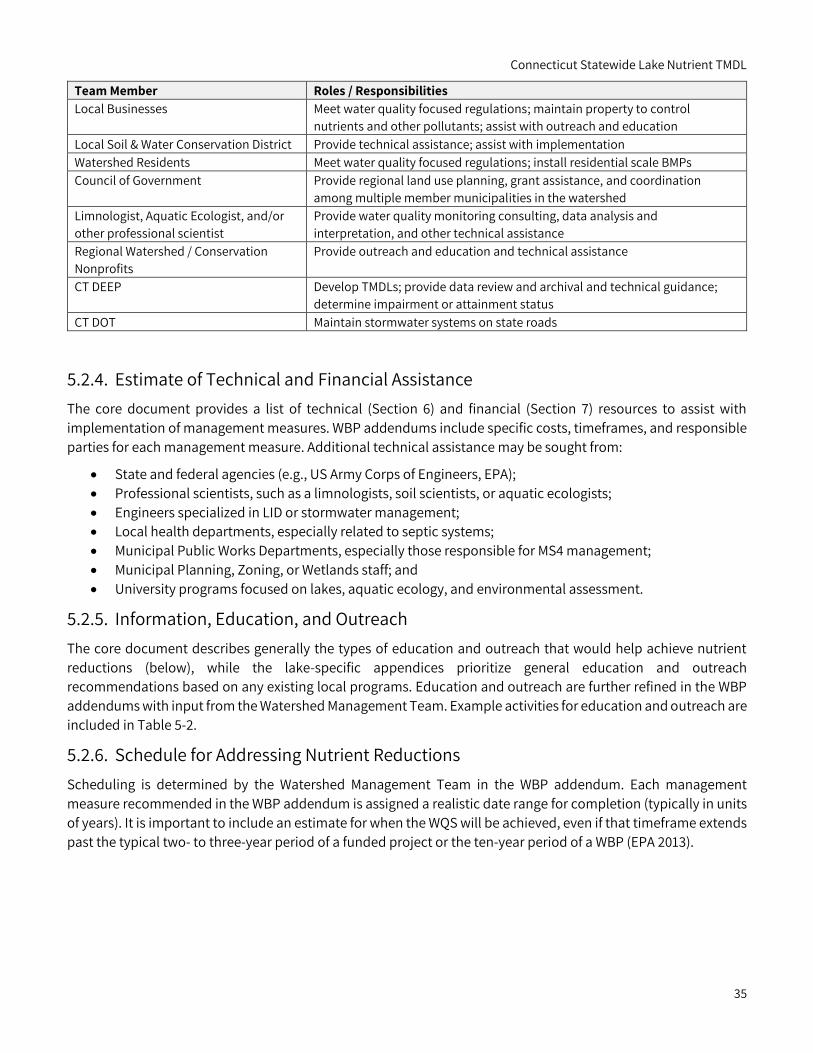
Connecticut Statewide Lake Nutrient TMDL
35
Team Member Roles / Responsibilities Local Businesses Meet water quality focused regulations; maintain property to control
nutrients and other pollutants; assist with outreach and education Local Soil & Water Conservation District Provide technical assistance; assist with implementation Watershed Residents Meet water quality focused regulations; install residential scale BMPs Council of Government Provide regional land use planning, grant assistance, and coordination
among multiple member municipalities in the watershed Limnologist, Aquatic Ecologist, and/or other professional scientist
Provide water quality monitoring consulting, data analysis and interpretation, and other technical assistance
Regional Watershed / Conservation Nonprofits
Provide outreach and education and technical assistance
CT DEEP Develop TMDLs; provide data review and archival and technical guidance; determine impairment or attainment status
CT DOT Maintain stormwater systems on state roads
5.2.4. Estimate of Technical and Financial Assistance The core document provides a list of technical (Section 6) and financial (Section 7) resources to assist with implementation of management measures. WBP addendums include specific costs, timeframes, and responsible parties for each management measure. Additional technical assistance may be sought from:
• State and federal agencies (e.g., US Army Corps of Engineers, EPA); • Professional scientists, such as a limnologists, soil scientists, or aquatic ecologists; • Engineers specialized in LID or stormwater management; • Local health departments, especially related to septic systems; • Municipal Public Works Departments, especially those responsible for MS4 management; • Municipal Planning, Zoning, or Wetlands staff; and • University programs focused on lakes, aquatic ecology, and environmental assessment.
5.2.5. Information, Education, and Outreach The core document describes generally the types of education and outreach that would help achieve nutrient reductions (below), while the lake-specific appendices prioritize general education and outreach recommendations based on any existing local programs. Education and outreach are further refined in the WBP addendums with input from the Watershed Management Team. Example activities for education and outreach are included in Table 5-2.
5.2.6. Schedule for Addressing Nutrient Reductions Scheduling is determined by the Watershed Management Team in the WBP addendum. Each management measure recommended in the WBP addendum is assigned a realistic date range for completion (typically in units of years). It is important to include an estimate for when the WQS will be achieved, even if that timeframe extends past the typical two- to three-year period of a funded project or the ten-year period of a WBP (EPA 2013).
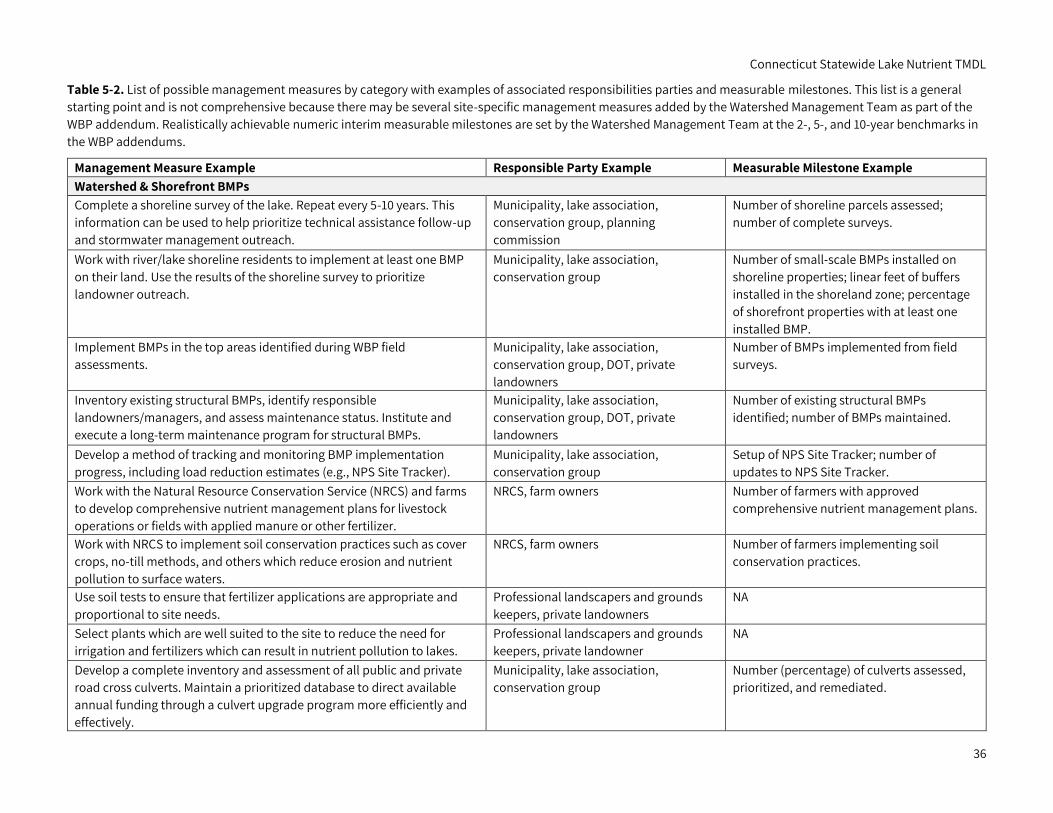
Connecticut Statewide Lake Nutrient TMDL
36
Table 5-2. List of possible management measures by category with examples of associated responsibilities parties and measurable milestones. This list is a general starting point and is not comprehensive because there may be several site-specific management measures added by the Watershed Management Team as part of the WBP addendum. Realistically achievable numeric interim measurable milestones are set by the Watershed Management Team at the 2-, 5-, and 10-year benchmarks in the WBP addendums.
Management Measure Example Responsible Party Example Measurable Milestone Example Watershed & Shorefront BMPs Complete a shoreline survey of the lake. Repeat every 5-10 years. This information can be used to help prioritize technical assistance follow-up and stormwater management outreach.
Municipality, lake association, conservation group, planning commission
Number of shoreline parcels assessed; number of complete surveys.
Work with river/lake shoreline residents to implement at least one BMP on their land. Use the results of the shoreline survey to prioritize landowner outreach.
Municipality, lake association, conservation group
Number of small-scale BMPs installed on shoreline properties; linear feet of buffers installed in the shoreland zone; percentage of shorefront properties with at least one installed BMP.
Implement BMPs in the top areas identified during WBP field assessments.
Municipality, lake association, conservation group, DOT, private landowners
Number of BMPs implemented from field surveys.
Inventory existing structural BMPs, identify responsible landowners/managers, and assess maintenance status. Institute and execute a long-term maintenance program for structural BMPs.
Municipality, lake association, conservation group, DOT, private landowners
Number of existing structural BMPs identified; number of BMPs maintained.
Develop a method of tracking and monitoring BMP implementation progress, including load reduction estimates (e.g., NPS Site Tracker).
Municipality, lake association, conservation group
Setup of NPS Site Tracker; number of updates to NPS Site Tracker.
Work with the Natural Resource Conservation Service (NRCS) and farms to develop comprehensive nutrient management plans for livestock operations or fields with applied manure or other fertilizer.
NRCS, farm owners Number of farmers with approved comprehensive nutrient management plans.
Work with NRCS to implement soil conservation practices such as cover crops, no-till methods, and others which reduce erosion and nutrient pollution to surface waters.
NRCS, farm owners Number of farmers implementing soil conservation practices.
Use soil tests to ensure that fertilizer applications are appropriate and proportional to site needs.
Professional landscapers and grounds keepers, private landowners
NA
Select plants which are well suited to the site to reduce the need for irrigation and fertilizers which can result in nutrient pollution to lakes.
Professional landscapers and grounds keepers, private landowner
NA
Develop a complete inventory and assessment of all public and private road cross culverts. Maintain a prioritized database to direct available annual funding through a culvert upgrade program more efficiently and effectively.
Municipality, lake association, conservation group
Number (percentage) of culverts assessed, prioritized, and remediated.
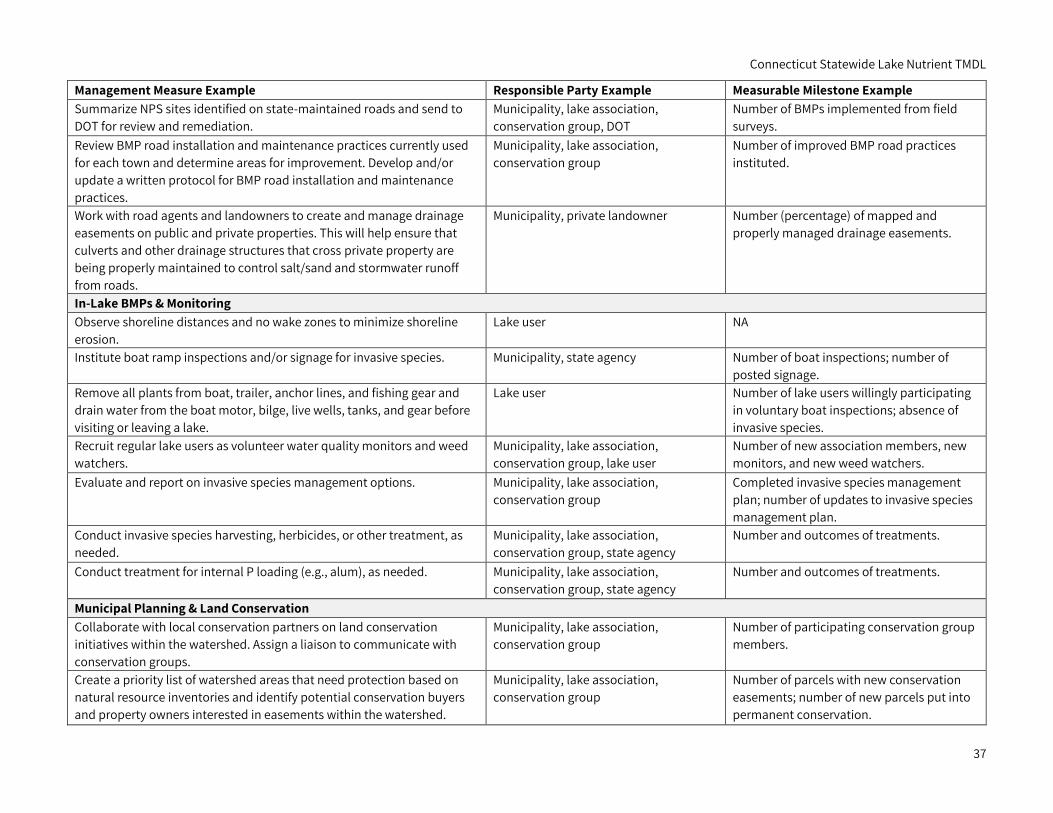
Connecticut Statewide Lake Nutrient TMDL
37
Management Measure Example Responsible Party Example Measurable Milestone Example Summarize NPS sites identified on state-maintained roads and send to DOT for review and remediation.
Municipality, lake association, conservation group, DOT
Number of BMPs implemented from field surveys.
Review BMP road installation and maintenance practices currently used for each town and determine areas for improvement. Develop and/or update a written protocol for BMP road installation and maintenance practices.
Municipality, lake association, conservation group
Number of improved BMP road practices instituted.
Work with road agents and landowners to create and manage drainage easements on public and private properties. This will help ensure that culverts and other drainage structures that cross private property are being properly maintained to control salt/sand and stormwater runoff from roads.
Municipality, private landowner Number (percentage) of mapped and properly managed drainage easements.
In-Lake BMPs & Monitoring Observe shoreline distances and no wake zones to minimize shoreline erosion.
Lake user NA
Institute boat ramp inspections and/or signage for invasive species. Municipality, state agency Number of boat inspections; number of posted signage.
Remove all plants from boat, trailer, anchor lines, and fishing gear and drain water from the boat motor, bilge, live wells, tanks, and gear before visiting or leaving a lake.
Lake user Number of lake users willingly participating in voluntary boat inspections; absence of invasive species.
Recruit regular lake users as volunteer water quality monitors and weed watchers.
Municipality, lake association, conservation group, lake user
Number of new association members, new monitors, and new weed watchers.
Evaluate and report on invasive species management options. Municipality, lake association, conservation group
Completed invasive species management plan; number of updates to invasive species management plan.
Conduct invasive species harvesting, herbicides, or other treatment, as needed.
Municipality, lake association, conservation group, state agency
Number and outcomes of treatments.
Conduct treatment for internal P loading (e.g., alum), as needed. Municipality, lake association, conservation group, state agency
Number and outcomes of treatments.
Municipal Planning & Land Conservation Collaborate with local conservation partners on land conservation initiatives within the watershed. Assign a liaison to communicate with conservation groups.
Municipality, lake association, conservation group
Number of participating conservation group members.
Create a priority list of watershed areas that need protection based on natural resource inventories and identify potential conservation buyers and property owners interested in easements within the watershed.
Municipality, lake association, conservation group
Number of parcels with new conservation easements; number of new parcels put into permanent conservation.
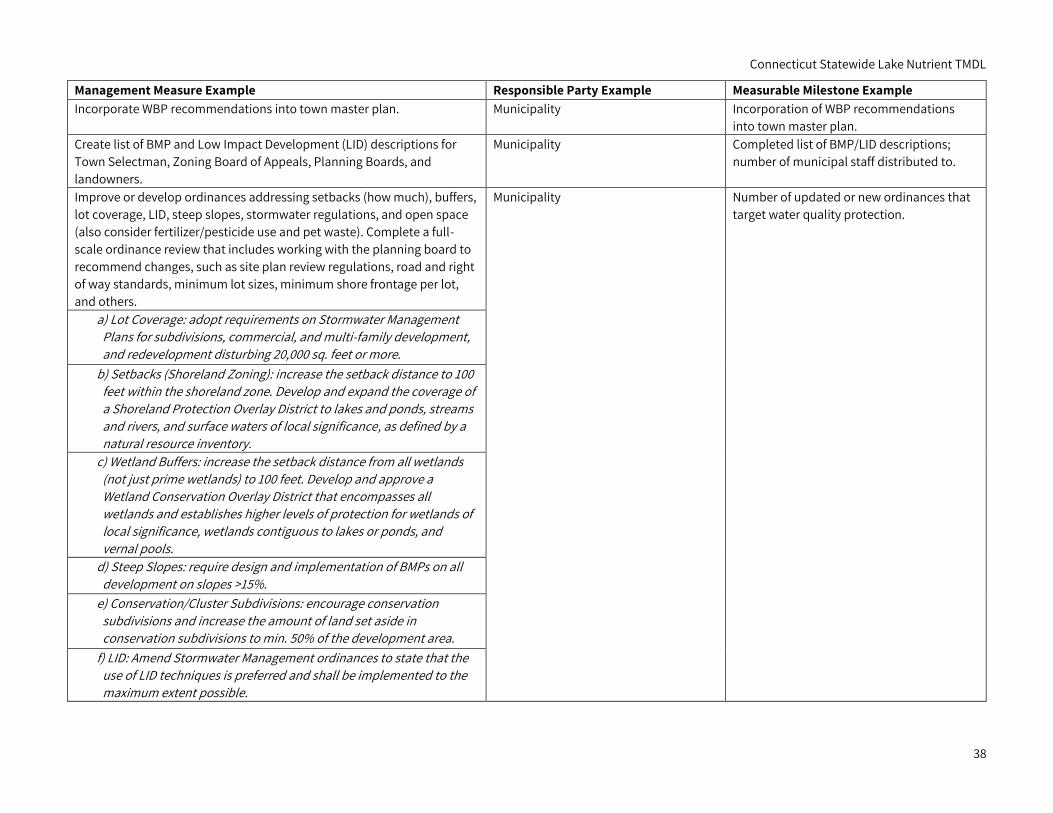
Connecticut Statewide Lake Nutrient TMDL
38
Management Measure Example Responsible Party Example Measurable Milestone Example Incorporate WBP recommendations into town master plan. Municipality Incorporation of WBP recommendations
into town master plan. Create list of BMP and Low Impact Development (LID) descriptions for Town Selectman, Zoning Board of Appeals, Planning Boards, and landowners.
Municipality Completed list of BMP/LID descriptions; number of municipal staff distributed to.
Improve or develop ordinances addressing setbacks (how much), buffers, lot coverage, LID, steep slopes, stormwater regulations, and open space (also consider fertilizer/pesticide use and pet waste). Complete a full-scale ordinance review that includes working with the planning board to recommend changes, such as site plan review regulations, road and right of way standards, minimum lot sizes, minimum shore frontage per lot, and others.
Municipality Number of updated or new ordinances that target water quality protection.
a) Lot Coverage: adopt requirements on Stormwater Management Plans for subdivisions, commercial, and multi-family development, and redevelopment disturbing 20,000 sq. feet or more.
b) Setbacks (Shoreland Zoning): increase the setback distance to 100 feet within the shoreland zone. Develop and expand the coverage of a Shoreland Protection Overlay District to lakes and ponds, streams and rivers, and surface waters of local significance, as defined by a natural resource inventory.
c) Wetland Buffers: increase the setback distance from all wetlands (not just prime wetlands) to 100 feet. Develop and approve a Wetland Conservation Overlay District that encompasses all wetlands and establishes higher levels of protection for wetlands of local significance, wetlands contiguous to lakes or ponds, and vernal pools.
d) Steep Slopes: require design and implementation of BMPs on all development on slopes >15%.
e) Conservation/Cluster Subdivisions: encourage conservation subdivisions and increase the amount of land set aside in conservation subdivisions to min. 50% of the development area.
f) LID: Amend Stormwater Management ordinances to state that the use of LID techniques is preferred and shall be implemented to the maximum extent possible.
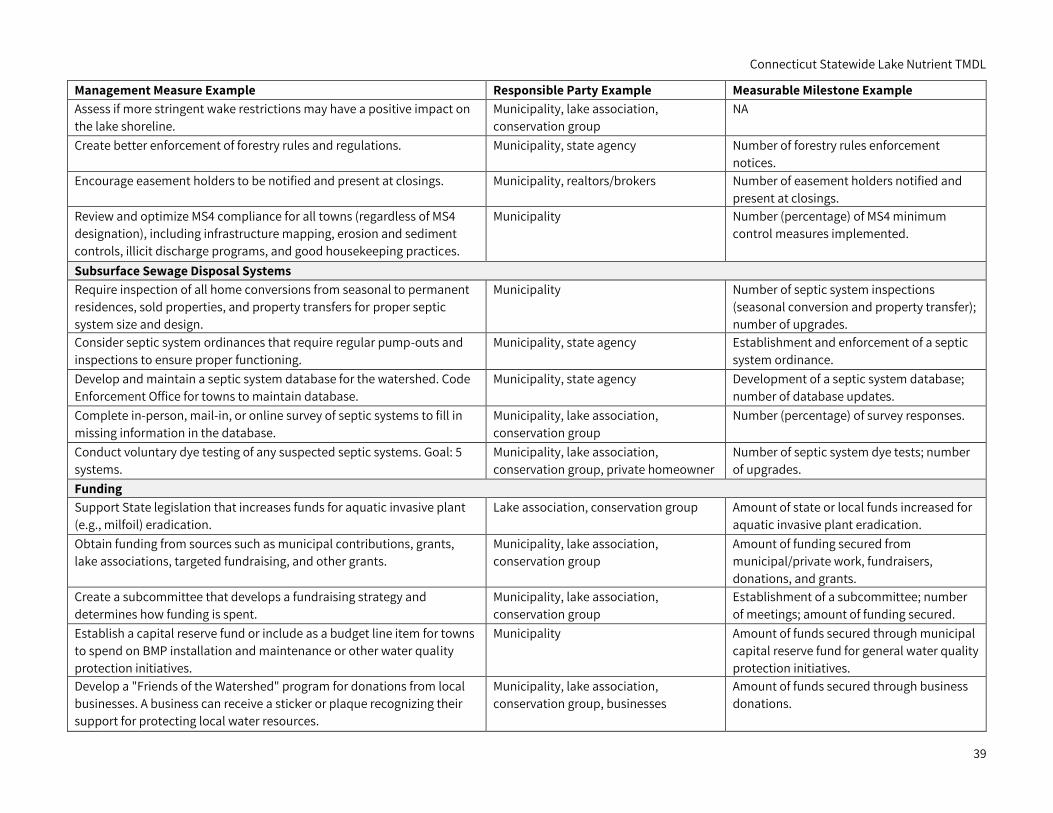
Connecticut Statewide Lake Nutrient TMDL
39
Management Measure Example Responsible Party Example Measurable Milestone Example Assess if more stringent wake restrictions may have a positive impact on the lake shoreline.
Municipality, lake association, conservation group
NA
Create better enforcement of forestry rules and regulations. Municipality, state agency Number of forestry rules enforcement notices.
Encourage easement holders to be notified and present at closings. Municipality, realtors/brokers Number of easement holders notified and present at closings.
Review and optimize MS4 compliance for all towns (regardless of MS4 designation), including infrastructure mapping, erosion and sediment controls, illicit discharge programs, and good housekeeping practices.
Municipality Number (percentage) of MS4 minimum control measures implemented.
Subsurface Sewage Disposal Systems Require inspection of all home conversions from seasonal to permanent residences, sold properties, and property transfers for proper septic system size and design.
Municipality Number of septic system inspections (seasonal conversion and property transfer); number of upgrades.
Consider septic system ordinances that require regular pump-outs and inspections to ensure proper functioning.
Municipality, state agency Establishment and enforcement of a septic system ordinance.
Develop and maintain a septic system database for the watershed. Code Enforcement Office for towns to maintain database.
Municipality, state agency Development of a septic system database; number of database updates.
Complete in-person, mail-in, or online survey of septic systems to fill in missing information in the database.
Municipality, lake association, conservation group
Number (percentage) of survey responses.
Conduct voluntary dye testing of any suspected septic systems. Goal: 5 systems.
Municipality, lake association, conservation group, private homeowner
Number of septic system dye tests; number of upgrades.
Funding Support State legislation that increases funds for aquatic invasive plant (e.g., milfoil) eradication.
Lake association, conservation group Amount of state or local funds increased for aquatic invasive plant eradication.
Obtain funding from sources such as municipal contributions, grants, lake associations, targeted fundraising, and other grants.
Municipality, lake association, conservation group
Amount of funding secured from municipal/private work, fundraisers, donations, and grants.
Create a subcommittee that develops a fundraising strategy and determines how funding is spent.
Municipality, lake association, conservation group
Establishment of a subcommittee; number of meetings; amount of funding secured.
Establish a capital reserve fund or include as a budget line item for towns to spend on BMP installation and maintenance or other water quality protection initiatives.
Municipality Amount of funds secured through municipal capital reserve fund for general water quality protection initiatives.
Develop a "Friends of the Watershed" program for donations from local businesses. A business can receive a sticker or plaque recognizing their support for protecting local water resources.
Municipality, lake association, conservation group, businesses
Amount of funds secured through business donations.
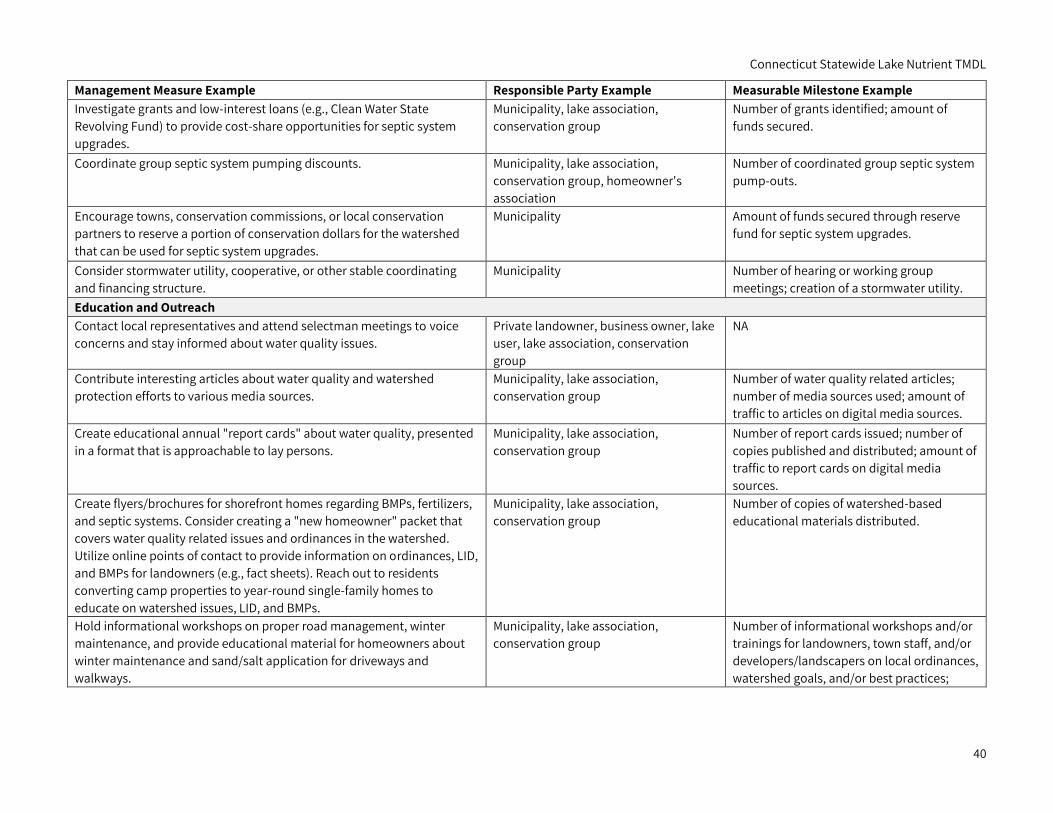
Connecticut Statewide Lake Nutrient TMDL
40
Management Measure Example Responsible Party Example Measurable Milestone Example Investigate grants and low-interest loans (e.g., Clean Water State Revolving Fund) to provide cost-share opportunities for septic system upgrades.
Municipality, lake association, conservation group
Number of grants identified; amount of funds secured.
Coordinate group septic system pumping discounts. Municipality, lake association, conservation group, homeowner's association
Number of coordinated group septic system pump-outs.
Encourage towns, conservation commissions, or local conservation partners to reserve a portion of conservation dollars for the watershed that can be used for septic system upgrades.
Municipality Amount of funds secured through reserve fund for septic system upgrades.
Consider stormwater utility, cooperative, or other stable coordinating and financing structure.
Municipality Number of hearing or working group meetings; creation of a stormwater utility.
Education and Outreach Contact local representatives and attend selectman meetings to voice concerns and stay informed about water quality issues.
Private landowner, business owner, lake user, lake association, conservation group
NA
Contribute interesting articles about water quality and watershed protection efforts to various media sources.
Municipality, lake association, conservation group
Number of water quality related articles; number of media sources used; amount of traffic to articles on digital media sources.
Create educational annual "report cards" about water quality, presented in a format that is approachable to lay persons.
Municipality, lake association, conservation group
Number of report cards issued; number of copies published and distributed; amount of traffic to report cards on digital media sources.
Create flyers/brochures for shorefront homes regarding BMPs, fertilizers, and septic systems. Consider creating a "new homeowner" packet that covers water quality related issues and ordinances in the watershed. Utilize online points of contact to provide information on ordinances, LID, and BMPs for landowners (e.g., fact sheets). Reach out to residents converting camp properties to year-round single-family homes to educate on watershed issues, LID, and BMPs.
Municipality, lake association, conservation group
Number of copies of watershed-based educational materials distributed.
Hold informational workshops on proper road management, winter maintenance, and provide educational material for homeowners about winter maintenance and sand/salt application for driveways and walkways.
Municipality, lake association, conservation group
Number of informational workshops and/or trainings for landowners, town staff, and/or developers/landscapers on local ordinances, watershed goals, and/or best practices;
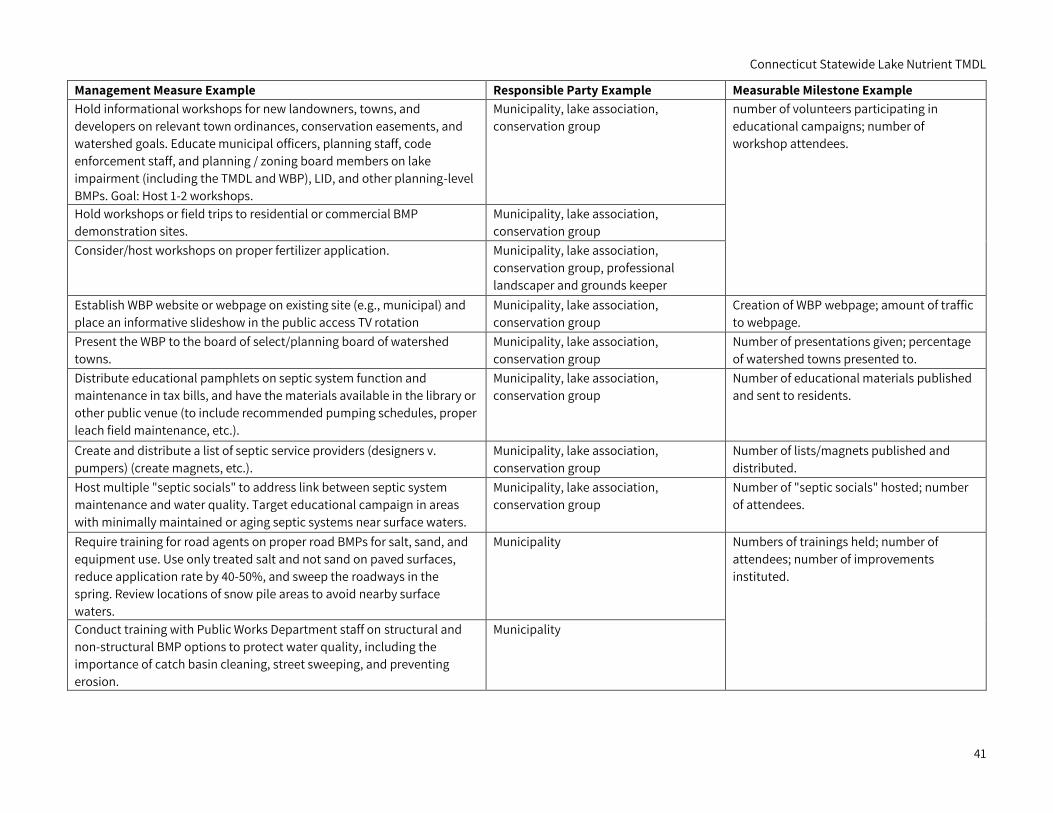
Connecticut Statewide Lake Nutrient TMDL
41
Management Measure Example Responsible Party Example Measurable Milestone Example Hold informational workshops for new landowners, towns, and developers on relevant town ordinances, conservation easements, and watershed goals. Educate municipal officers, planning staff, code enforcement staff, and planning / zoning board members on lake impairment (including the TMDL and WBP), LID, and other planning-level BMPs. Goal: Host 1-2 workshops.
Municipality, lake association, conservation group
number of volunteers participating in educational campaigns; number of workshop attendees.
Hold workshops or field trips to residential or commercial BMP demonstration sites.
Municipality, lake association, conservation group
Consider/host workshops on proper fertilizer application. Municipality, lake association, conservation group, professional landscaper and grounds keeper
Establish WBP website or webpage on existing site (e.g., municipal) and place an informative slideshow in the public access TV rotation
Municipality, lake association, conservation group
Creation of WBP webpage; amount of traffic to webpage.
Present the WBP to the board of select/planning board of watershed towns.
Municipality, lake association, conservation group
Number of presentations given; percentage of watershed towns presented to.
Distribute educational pamphlets on septic system function and maintenance in tax bills, and have the materials available in the library or other public venue (to include recommended pumping schedules, proper leach field maintenance, etc.).
Municipality, lake association, conservation group
Number of educational materials published and sent to residents.
Create and distribute a list of septic service providers (designers v. pumpers) (create magnets, etc.).
Municipality, lake association, conservation group
Number of lists/magnets published and distributed.
Host multiple "septic socials" to address link between septic system maintenance and water quality. Target educational campaign in areas with minimally maintained or aging septic systems near surface waters.
Municipality, lake association, conservation group
Number of "septic socials" hosted; number of attendees.
Require training for road agents on proper road BMPs for salt, sand, and equipment use. Use only treated salt and not sand on paved surfaces, reduce application rate by 40-50%, and sweep the roadways in the spring. Review locations of snow pile areas to avoid nearby surface waters.
Municipality Numbers of trainings held; number of attendees; number of improvements instituted.
Conduct training with Public Works Department staff on structural and non-structural BMP options to protect water quality, including the importance of catch basin cleaning, street sweeping, and preventing erosion.
Municipality
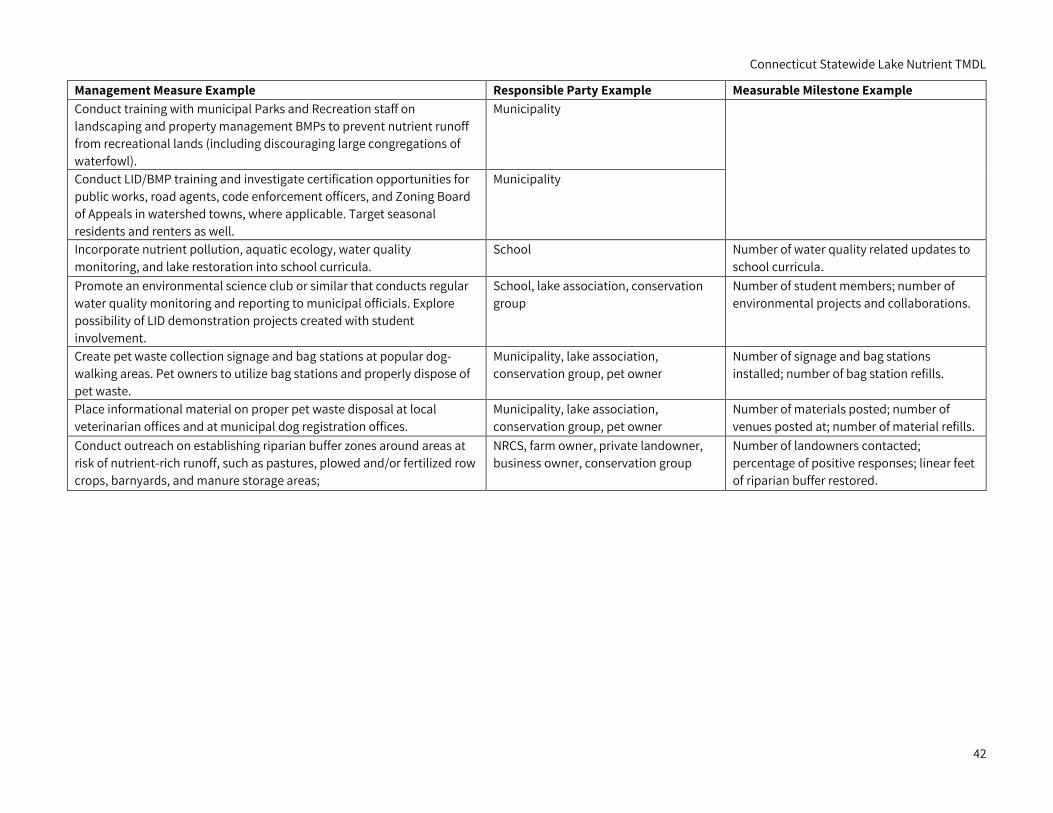
Connecticut Statewide Lake Nutrient TMDL
42
Management Measure Example Responsible Party Example Measurable Milestone Example Conduct training with municipal Parks and Recreation staff on landscaping and property management BMPs to prevent nutrient runoff from recreational lands (including discouraging large congregations of waterfowl).
Municipality
Conduct LID/BMP training and investigate certification opportunities for public works, road agents, code enforcement officers, and Zoning Board of Appeals in watershed towns, where applicable. Target seasonal residents and renters as well.
Municipality
Incorporate nutrient pollution, aquatic ecology, water quality monitoring, and lake restoration into school curricula.
School Number of water quality related updates to school curricula.
Promote an environmental science club or similar that conducts regular water quality monitoring and reporting to municipal officials. Explore possibility of LID demonstration projects created with student involvement.
School, lake association, conservation group
Number of student members; number of environmental projects and collaborations.
Create pet waste collection signage and bag stations at popular dog-walking areas. Pet owners to utilize bag stations and properly dispose of pet waste.
Municipality, lake association, conservation group, pet owner
Number of signage and bag stations installed; number of bag station refills.
Place informational material on proper pet waste disposal at local veterinarian offices and at municipal dog registration offices.
Municipality, lake association, conservation group, pet owner
Number of materials posted; number of venues posted at; number of material refills.
Conduct outreach on establishing riparian buffer zones around areas at risk of nutrient-rich runoff, such as pastures, plowed and/or fertilized row crops, barnyards, and manure storage areas;
NRCS, farm owner, private landowner, business owner, conservation group
Number of landowners contacted; percentage of positive responses; linear feet of riparian buffer restored.
Connecticut Statewide Lake Nutrient TMDL
43
5.2.7. Description of Interim Measurable Milestones To guide progress toward the long-term restoration target set by the TMDL, the core document includes general interim measurable milestones, while the WBP addendums further refine the interim measurable milestones through input received by the Watershed Management Team. These milestones are shorter-term steppingstones which can help focus and maintain momentum toward the long-term goal of lake restoration. The measurable milestones identified in the WBP addendum are specific to the watershed and stakeholders involved and closely follow the proposed management measures. An overview of commonly adopted milestones for each management measure is included in Table 5-2.
5.2.8. Performance Criteria WBPs must cite the criteria to be used for determining whether pollutant load reductions are being achieved over time and whether recommended actions need to be revisited. These criteria usually center around WQS, especially the parameters which were used to calculate the TMDL. In the case of nutrient impaired freshwater lakes, applicable WQS are based on CT DEEP’s analysis of the natural lake trophic status and whether macrophyte growth is “extensive” or “highly extensive” (see Section 2.2).
For nutrient impaired lakes, criteria will be the in-lake concentrations and flow-weighted tributary loading of total phosphorus and total nitrogen set by the TMDL. The impact of nutrient pollution, however, is ultimately measured by in-lake responses. Therefore, additional response criteria include the intensity and duration of algal blooms (cyanobacteria cell counts, macrophyte coverage, phytoplankton, and/or chlorophyll-a concentrations), the occurrence of HABs, and water clarity measured by Secchi disk transparency. Specific target values for each parameter will depend on the lake and are described in the lake-specific appendices to this TMDL.
The TMDL targets, especially for NPS pollution, may be long-term goals; therefore, additional intermediate criteria can be valuable. These shorter-term criteria may focus on water quality in specific geographic areas. For example, downstream water quality after installation of BMPs must be better than before the BMP was installed to determine whether the BMP is functioning as intended. Additional criteria for areas where no BMPs have been planned, such as rural areas with little development, may include that water quality does not worsen over time. Finally, intermediate criteria for in-lake response variables may be set. For example, in-lake total phosphorus concentrations are to be reduced by 30% within three years, even if that level of reduction does not yet fully meet the TMDL target.
5.2.9. Monitoring Component The core document describes the existing statewide monitoring program below and generally the recommended future monitoring program for any nutrient impaired lake (Table 5-3). The lake-specific appendices provide a more detailed proposed future monitoring program recommendation based on review of existing data and the water quality targets. The WBP addendums may further refine these recommendations based on new data or local knowledge and resources.
There are at least four main components to any monitoring program that evaluates the effectiveness of implementation efforts over time:
• Methods and documentation for quality assurance / quality control; • Personnel trained to conduct the monitoring; • A monitoring plan, with parameters, locations, and timing; and • Data management, including analysis, interpretation, reporting, and archival.
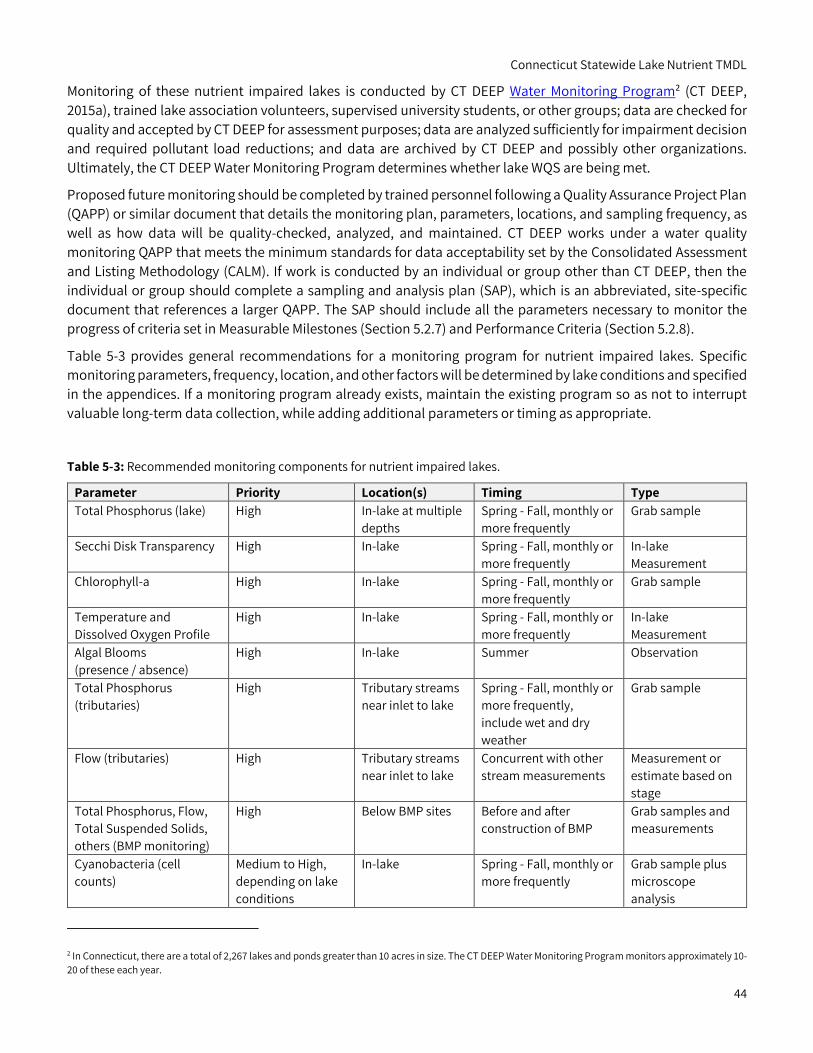
Connecticut Statewide Lake Nutrient TMDL
44
Monitoring of these nutrient impaired lakes is conducted by CT DEEP Water Monitoring Program2 (CT DEEP, 2015a), trained lake association volunteers, supervised university students, or other groups; data are checked for quality and accepted by CT DEEP for assessment purposes; data are analyzed sufficiently for impairment decision and required pollutant load reductions; and data are archived by CT DEEP and possibly other organizations. Ultimately, the CT DEEP Water Monitoring Program determines whether lake WQS are being met.
Proposed future monitoring should be completed by trained personnel following a Quality Assurance Project Plan (QAPP) or similar document that details the monitoring plan, parameters, locations, and sampling frequency, as well as how data will be quality-checked, analyzed, and maintained. CT DEEP works under a water quality monitoring QAPP that meets the minimum standards for data acceptability set by the Consolidated Assessment and Listing Methodology (CALM). If work is conducted by an individual or group other than CT DEEP, then the individual or group should complete a sampling and analysis plan (SAP), which is an abbreviated, site-specific document that references a larger QAPP. The SAP should include all the parameters necessary to monitor the progress of criteria set in Measurable Milestones (Section 5.2.7) and Performance Criteria (Section 5.2.8).
Table 5-3 provides general recommendations for a monitoring program for nutrient impaired lakes. Specific monitoring parameters, frequency, location, and other factors will be determined by lake conditions and specified in the appendices. If a monitoring program already exists, maintain the existing program so as not to interrupt valuable long-term data collection, while adding additional parameters or timing as appropriate.
Table 5-3: Recommended monitoring components for nutrient impaired lakes.
Parameter Priority Location(s) Timing Type Total Phosphorus (lake) High In-lake at multiple
depths Spring - Fall, monthly or more frequently
Grab sample
Secchi Disk Transparency High In-lake Spring - Fall, monthly or more frequently
In-lake Measurement
Chlorophyll-a High In-lake Spring - Fall, monthly or more frequently
Grab sample
Temperature and Dissolved Oxygen Profile
High In-lake Spring - Fall, monthly or more frequently
In-lake Measurement
Algal Blooms (presence / absence)
High In-lake Summer Observation
Total Phosphorus (tributaries)
High Tributary streams near inlet to lake
Spring - Fall, monthly or more frequently, include wet and dry weather
Grab sample
Flow (tributaries) High Tributary streams near inlet to lake
Concurrent with other stream measurements
Measurement or estimate based on stage
Total Phosphorus, Flow, Total Suspended Solids, others (BMP monitoring)
High Below BMP sites Before and after construction of BMP
Grab samples and measurements
Cyanobacteria (cell counts)
Medium to High, depending on lake conditions
In-lake Spring - Fall, monthly or more frequently
Grab sample plus microscope analysis
2 In Connecticut, there are a total of 2,267 lakes and ponds greater than 10 acres in size. The CT DEEP Water Monitoring Program monitors approximately 10-20 of these each year.
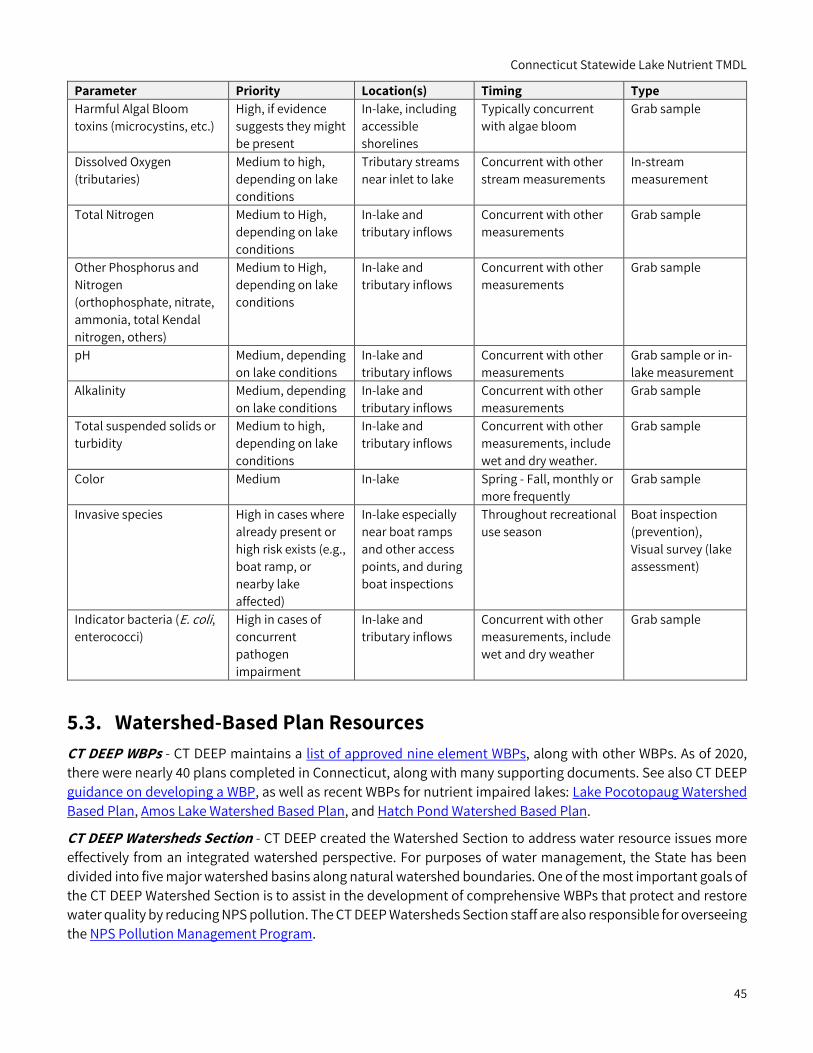
Connecticut Statewide Lake Nutrient TMDL
45
Parameter Priority Location(s) Timing Type Harmful Algal Bloom toxins (microcystins, etc.)
High, if evidence suggests they might be present
In-lake, including accessible shorelines
Typically concurrent with algae bloom
Grab sample
Dissolved Oxygen (tributaries)
Medium to high, depending on lake conditions
Tributary streams near inlet to lake
Concurrent with other stream measurements
In-stream measurement
Total Nitrogen Medium to High, depending on lake conditions
In-lake and tributary inflows
Concurrent with other measurements
Grab sample
Other Phosphorus and Nitrogen (orthophosphate, nitrate, ammonia, total Kendal nitrogen, others)
Medium to High, depending on lake conditions
In-lake and tributary inflows
Concurrent with other measurements
Grab sample
pH Medium, depending on lake conditions
In-lake and tributary inflows
Concurrent with other measurements
Grab sample or in-lake measurement
Alkalinity Medium, depending on lake conditions
In-lake and tributary inflows
Concurrent with other measurements
Grab sample
Total suspended solids or turbidity
Medium to high, depending on lake conditions
In-lake and tributary inflows
Concurrent with other measurements, include wet and dry weather.
Grab sample
Color Medium In-lake Spring - Fall, monthly or more frequently
Grab sample
Invasive species High in cases where already present or high risk exists (e.g., boat ramp, or nearby lake affected)
In-lake especially near boat ramps and other access points, and during boat inspections
Throughout recreational use season
Boat inspection (prevention), Visual survey (lake assessment)
Indicator bacteria (E. coli, enterococci)
High in cases of concurrent pathogen impairment
In-lake and tributary inflows
Concurrent with other measurements, include wet and dry weather
Grab sample
5.3. Watershed-Based Plan Resources CT DEEP WBPs - CT DEEP maintains a list of approved nine element WBPs, along with other WBPs. As of 2020, there were nearly 40 plans completed in Connecticut, along with many supporting documents. See also CT DEEP guidance on developing a WBP, as well as recent WBPs for nutrient impaired lakes: Lake Pocotopaug Watershed Based Plan, Amos Lake Watershed Based Plan, and Hatch Pond Watershed Based Plan.
CT DEEP Watersheds Section - CT DEEP created the Watershed Section to address water resource issues more effectively from an integrated watershed perspective. For purposes of water management, the State has been divided into five major watershed basins along natural watershed boundaries. One of the most important goals of the CT DEEP Watershed Section is to assist in the development of comprehensive WBPs that protect and restore water quality by reducing NPS pollution. The CT DEEP Watersheds Section staff are also responsible for overseeing the NPS Pollution Management Program.
Connecticut Statewide Lake Nutrient TMDL
46
CT DEEP CWA Grant Guidance WBP Checklist - CT DEEP developed a CWA Grant Guidance WBP Checklist to aid grant recipients seeking CT DEEP CWA funding for WBP development. Completing the checklist is also useful for authors of WBPs funded in previous years to help keep them on track to meet CT DEEP and EPA's expectations for WBP development.
EPA, A Quick Guide to Developing WBPs to Restore and Protect Our Waters – This quick guide provides guidance on developing an EPA-approved WBP with the required nine elements.
EPA Handbook for Developing WBPs to Restore and Protect Our Waters - This handbook and factsheet are designed for users who are just beginning to develop a WBP, are in the process of developing a WBP, or updating an existing WBP. Note that this handbook and factsheet do not contain the nine elements and should be used in tandem with updated guidance, such as the Quick Guide above.
Connecticut Statewide Lake Nutrient TMDL
47
6. Best Management Practices BMPs refer to a wide range of possible options that help prevent or reduce the movement of pollutants from the landscape to surface or ground waters. The term has a specific meaning in the context of Connecticut WQS, defined by RCSA § 22a-426-1(7):
“’Best Management Practices’ means those practices which reduce pollution and which have been determined by the Commissioner to be acceptable based on, but not limited to, technical, economic and institutional feasibility.”
As mentioned previously, RCSA § 22a-426-4(a)(11) requires the use of BMPs “as necessary” for the reduction of PS and NPS nutrient pollution. Thus, BMPs are an essential and mandatory component of restoring nutrient impaired lakes in Connecticut.
In most watersheds, the sources of nutrients are many and diffuse. As a result, management practices must be selected, designed, and implemented at numerous locations to mitigate pollutants and prevent or reduce water quality impairment. BMPs can include a wide variety practices aimed at managing watershed nutrient sources, such as urban stormwater runoff, agricultural contributions, wastewater discharges, or natural green infrastructure improvements. The most appropriate suite of management practices will depend on land use, nutrient source, nutrient removal targets, implementation feasibility, and cost. Effective BMP implementation should focus not only on reducing existing pollutant loads, but also on preventing new pollutants. Once nutrients alter a waterbody, it is much more difficult and expensive to restore the waterbody to an unimpaired condition than effective prevention would have been. Therefore, implementing practices which prevent degradation of receiving waters is one of the highest priorities.
6.1. Stormwater BMPs Stormwater BMPs are often described as structural and non-structural. Structural BMPs are engineered systems that provide for recharge, water quality treatment, erosion prevention, and flood control. The selection and design of stormwater practices has evolved from storage facilities designed for flood control and channel protection to a preference for green stormwater infrastructure design for volume reduction onsite (via recharge, evapotranspiration, and reuse) and water quality treatment. Examples of green stormwater infrastructure practices include bioretention facilities, underground infiltration chambers, constructed wetlands, etc. Non-structural BMPs refer to a broad range of behavioral practices, activities, and operational measures that contribute to pollutant prevention and reduction, such as street sweeping, spill prevention measures, and pet waste management. In addition to structural and non-structural stormwater practices, there are also a suite of techniques for removing or disconnecting impervious cover and ecosystem restoration that can also provide nutrient removal benefits. These practices are typically awarded credits within stormwater management context and are, thus, briefly discussed below.
The selection of stormwater BMPs will be site specific and dependent on several factors, such as: land use, nutrient source, soils, depth to groundwater, slope, and other site constraints including costs and long-term maintenance considerations.
Connecticut Statewide Lake Nutrient TMDL
48
6.1.1. Structural Stormwater BMPs In developed areas, structural BMPs are engineered infrastructure designed to intercept stormwater runoff, often allowing it to soak into the ground, be taken up by plants, harvested for reuse, or released slowly over time to minimize flooding and downstream erosion. These BMPs often incorporate some mechanism for pollutant removal, such as sediment forebays, oil separators, filtration, or microbial breakdown. They can also consist of removing or disconnecting impervious surfaces, which in turn reduces the volume of polluted runoff generated, minimizing adverse impacts to receiving waters.
When selecting the appropriate BMPs for a given site, it is important to consider the potential for groundwater contamination, especially if groundwater in an aquifer protection area. Maps and information on aquifer protection areas are available through the CT DEEP Aquifer Protection Area Program. While direct infiltration through drywells or leaching trenches may be acceptable for clean roof runoff, infiltration without pretreatment may not be appropriate for parking lot or road runoff where road salt, petroleum byproducts, brake-pad dust and brake fluid, antifreeze, and other soluble compounds could pollute drinking water. In fact, infiltration at known sites of high pollutant loads or contaminated soils may be prohibited. New information is emerging on contaminants such as PFAS that may lead to changes in what type of runoff can be infiltrated without pretreatment.
Typically, structural BMPs are small, distributed installations focused on treating stormwater runoff in localized areas. Examples of smaller structural BMPs include bioretention, soil infiltration (via trenches or basins), porous pavement, constructed gravel wetlands, vegetative buffers, rain gardens, etc. Structural BMPs tend to have a higher initial cost than non-structural BMPs, though an effective maintenance program will extend their service life, avert expensive repair costs, and maximize overall cost efficiency. An operations and maintenance (O&M) program with a source of ongoing funding and a responsible party are necessary for structural BMPs to function over time.
Studies examining the nutrient removal efficiencies of structural BMPs reveal wide variability in performance. Nutrients in the form of particulates can be removed by many BMPs but removing dissolved nutrients from stormwater runoff can be a challenge, often requiring specific technologies, accurate sizing, and careful materials selection. A national database of structural BMP performance found that composites (treatment train or multiple BMPs working together), wet ponds and constructed wetlands tend to be the most effective in removing both phosphorus and nitrogen, although the lack of volume reduction was not always considered in the data (Water Environment & Reuse Foundation 2017). Other recent research on BMP effectiveness indicates that soil infiltration, porous pavement, gravel wetlands, and biofiltration with an internal storage reservoir can reduce phosphorus concentrations in stormwater by 60-90%, with performance depending on the size of BMP relative to the impervious area treated (UNHSC 2019). Given the variability in BMP performance, it is critical to select structural BMPs based on scientific and engineering data and a site-specific analysis. The 2004 Connecticut Stormwater Manual provides design guidance and qualitative nutrient removal, cost, and maintenance levels for different BMPs (CT DEEP 2004, Table 6-1). To supplement this information, Table 6-2 summarizes nutrient removal
In developed areas, large portions of the natural landscape have been replaced with non-porous or impervious surfaces (e.g., roads, driveways, parking lots, and rooftops), which alters the natural hydrologic cycle. The removal of vegetation, compaction of soils, and increase of impervious surfaces results in a larger portion of precipitation being converted into surface runoff while less infiltrates into the ground, evaporates, or transpires. Larger quantities and higher velocities of surface runoff contribute to flooding, erosion of exposed soils and stream channels, and pollutant transport. Surface runoff picks up the sediments, bacteria, nutrients, oils, and other pollutants and carries them into storm drains or directly to nearby waterbodies. Therefore, development practices and BMPs that maintain the natural hydrologic cycle by minimizing runoff and enhancing infiltration and evapotranspiration are beneficial for water quality protection.
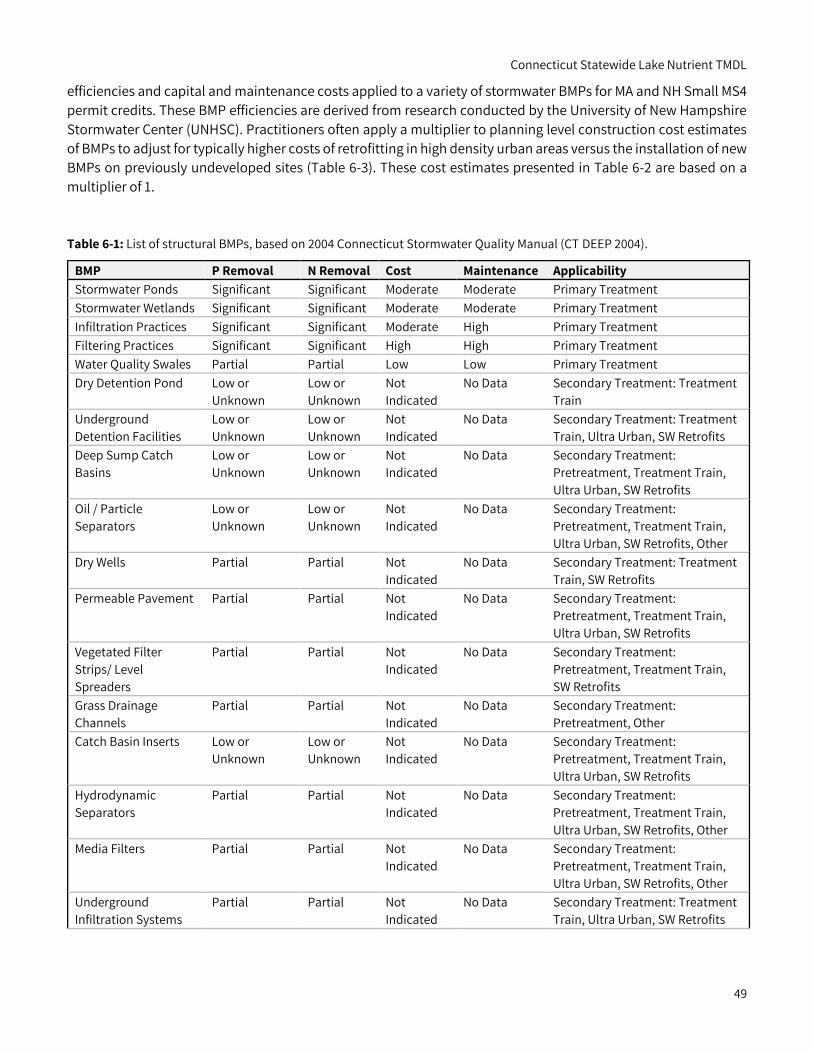
Connecticut Statewide Lake Nutrient TMDL
49
efficiencies and capital and maintenance costs applied to a variety of stormwater BMPs for MA and NH Small MS4 permit credits. These BMP efficiencies are derived from research conducted by the University of New Hampshire Stormwater Center (UNHSC). Practitioners often apply a multiplier to planning level construction cost estimates of BMPs to adjust for typically higher costs of retrofitting in high density urban areas versus the installation of new BMPs on previously undeveloped sites (Table 6-3). These cost estimates presented in Table 6-2 are based on a multiplier of 1.
Table 6-1: List of structural BMPs, based on 2004 Connecticut Stormwater Quality Manual (CT DEEP 2004).
BMP P Removal N Removal Cost Maintenance Applicability Stormwater Ponds Significant Significant Moderate Moderate Primary Treatment Stormwater Wetlands Significant Significant Moderate Moderate Primary Treatment Infiltration Practices Significant Significant Moderate High Primary Treatment Filtering Practices Significant Significant High High Primary Treatment Water Quality Swales Partial Partial Low Low Primary Treatment Dry Detention Pond Low or
Unknown Low or Unknown
Not Indicated
No Data Secondary Treatment: Treatment Train
Underground Detention Facilities
Low or Unknown
Low or Unknown
Not Indicated
No Data Secondary Treatment: Treatment Train, Ultra Urban, SW Retrofits
Deep Sump Catch Basins
Low or Unknown
Low or Unknown
Not Indicated
No Data Secondary Treatment: Pretreatment, Treatment Train, Ultra Urban, SW Retrofits
Oil / Particle Separators
Low or Unknown
Low or Unknown
Not Indicated
No Data Secondary Treatment: Pretreatment, Treatment Train, Ultra Urban, SW Retrofits, Other
Dry Wells Partial Partial Not Indicated
No Data Secondary Treatment: Treatment Train, SW Retrofits
Permeable Pavement Partial Partial Not Indicated
No Data Secondary Treatment: Pretreatment, Treatment Train, Ultra Urban, SW Retrofits
Vegetated Filter Strips/ Level Spreaders
Partial Partial Not Indicated
No Data Secondary Treatment: Pretreatment, Treatment Train, SW Retrofits
Grass Drainage Channels
Partial Partial Not Indicated
No Data Secondary Treatment: Pretreatment, Other
Catch Basin Inserts Low or Unknown
Low or Unknown
Not Indicated
No Data Secondary Treatment: Pretreatment, Treatment Train, Ultra Urban, SW Retrofits
Hydrodynamic Separators
Partial Partial Not Indicated
No Data Secondary Treatment: Pretreatment, Treatment Train, Ultra Urban, SW Retrofits, Other
Media Filters Partial Partial Not Indicated
No Data Secondary Treatment: Pretreatment, Treatment Train, Ultra Urban, SW Retrofits, Other
Underground Infiltration Systems
Partial Partial Not Indicated
No Data Secondary Treatment: Treatment Train, Ultra Urban, SW Retrofits
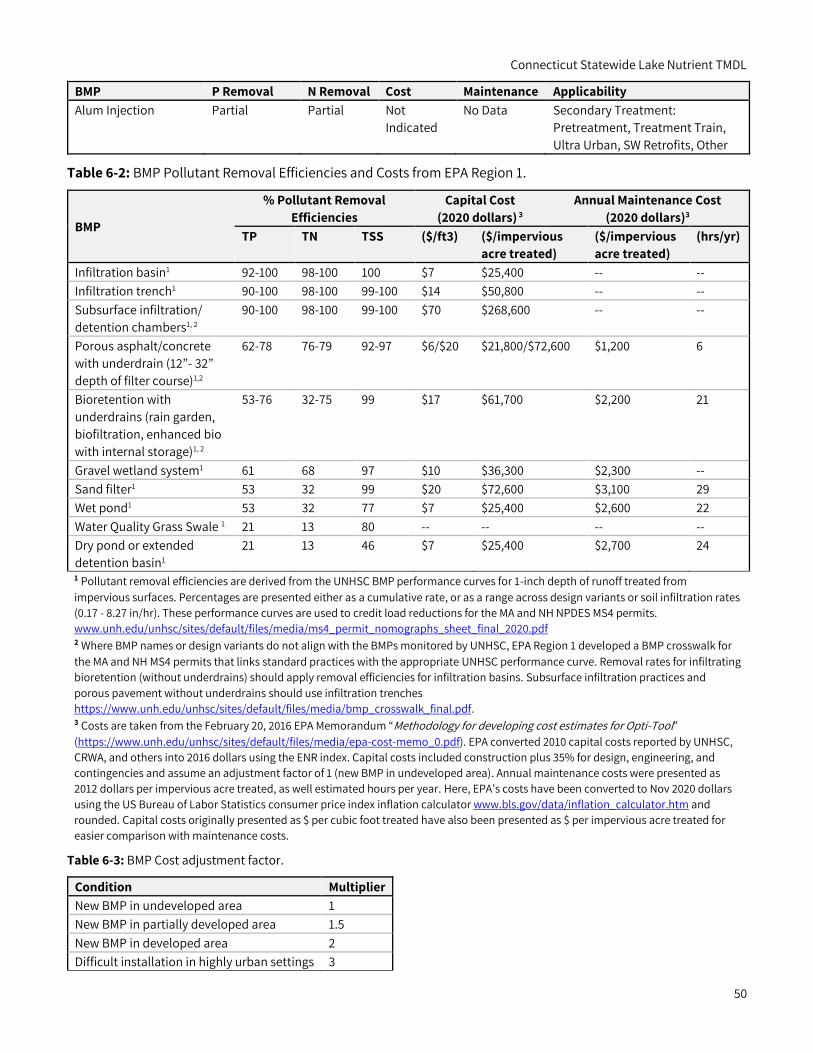
Connecticut Statewide Lake Nutrient TMDL
50
BMP P Removal N Removal Cost Maintenance Applicability Alum Injection Partial Partial Not
Indicated No Data Secondary Treatment:
Pretreatment, Treatment Train, Ultra Urban, SW Retrofits, Other
Table 6-2: BMP Pollutant Removal Efficiencies and Costs from EPA Region 1.
BMP
% Pollutant Removal Efficiencies
Capital Cost (2020 dollars) 3
Annual Maintenance Cost (2020 dollars)3
TP TN TSS ($/ft3) ($/impervious acre treated)
($/impervious acre treated)
(hrs/yr)
Infiltration basin1 92-100 98-100 100 $7 $25,400 -- -- Infiltration trench1 90-100 98-100 99-100 $14 $50,800 -- -- Subsurface infiltration/ detention chambers1, 2
90-100 98-100 99-100 $70 $268,600 -- --
Porous asphalt/concrete with underdrain (12”- 32” depth of filter course)1,2
62-78 76-79 92-97 $6/$20 $21,800/$72,600 $1,200 6
Bioretention with underdrains (rain garden, biofiltration, enhanced bio with internal storage)1, 2
53-76 32-75 99 $17 $61,700 $2,200 21
Gravel wetland system1 61 68 97 $10 $36,300 $2,300 -- Sand filter1 53 32 99 $20 $72,600 $3,100 29 Wet pond1 53 32 77 $7 $25,400 $2,600 22 Water Quality Grass Swale 1 21 13 80 -- -- -- -- Dry pond or extended detention basin1
21 13 46 $7 $25,400 $2,700 24
1 Pollutant removal efficiencies are derived from the UNHSC BMP performance curves for 1-inch depth of runoff treated from impervious surfaces. Percentages are presented either as a cumulative rate, or as a range across design variants or soil infiltration rates (0.17 - 8.27 in/hr). These performance curves are used to credit load reductions for the MA and NH NPDES MS4 permits. www.unh.edu/unhsc/sites/default/files/media/ms4_permit_nomographs_sheet_final_2020.pdf 2 Where BMP names or design variants do not align with the BMPs monitored by UNHSC, EPA Region 1 developed a BMP crosswalk for the MA and NH MS4 permits that links standard practices with the appropriate UNHSC performance curve. Removal rates for infiltrating bioretention (without underdrains) should apply removal efficiencies for infiltration basins. Subsurface infiltration practices and porous pavement without underdrains should use infiltration trenches https://www.unh.edu/unhsc/sites/default/files/media/bmp_crosswalk_final.pdf. 3 Costs are taken from the February 20, 2016 EPA Memorandum “Methodology for developing cost estimates for Opti-Tool” (https://www.unh.edu/unhsc/sites/default/files/media/epa-cost-memo_0.pdf). EPA converted 2010 capital costs reported by UNHSC, CRWA, and others into 2016 dollars using the ENR index. Capital costs included construction plus 35% for design, engineering, and contingencies and assume an adjustment factor of 1 (new BMP in undeveloped area). Annual maintenance costs were presented as 2012 dollars per impervious acre treated, as well estimated hours per year. Here, EPA’s costs have been converted to Nov 2020 dollars using the US Bureau of Labor Statistics consumer price index inflation calculator www.bls.gov/data/inflation_calculator.htm and rounded. Capital costs originally presented as $ per cubic foot treated have also been presented as $ per impervious acre treated for easier comparison with maintenance costs.
Table 6-3: BMP Cost adjustment factor.
Condition Multiplier New BMP in undeveloped area 1 New BMP in partially developed area 1.5 New BMP in developed area 2 Difficult installation in highly urban settings 3
Connecticut Statewide Lake Nutrient TMDL
51
6.1.2. Non-Structural Stormwater BMPs, Impervious Disconnection, and Ecological Restoration
Nutrient load reduction can also be accomplished through non-structural BMPs, removal or disconnection of impervious cover, and restoration of natural green infrastructure or ecological restoration. Non-structural BMPs include a wide variety of activities that contribute to the protection of water quality. Examples include the following (some of which are already required by the MS4 program):
• Mapping and inspection of storm drain network; • Municipal maintenance (BMP inspection and maintenance tracking, catch basin cleaning, street
sweeping, road and ditch maintenance); • Source control and pollution prevention, including deicing; • Outreach and education for watershed residents, municipal officials, and stormwater operators; • Enactment and enforcement of ordinances and bylaws to protect water quality; • Land use planning to protect water quality (minimize impervious cover, protect and restore buffers,
require use LID techniques and green infrastructure); • Agricultural practices that protect water quality; • Vehicle impact reduction, especially those that generate erosion such as off-road vehicles; • Illegal dumping controls; • Spill prevention; and • Illicit discharge detection and elimination programs.
CT DEEP has guidance for municipalities on street sweeping and catch basin cleanout (CT DEEP 2007) and CT MS4s have targets for impervious cover disconnection. Impervious cover removal or disconnection results in the reduction in the volume of stormwater runoff that is generated or ultimately discharged from a site. Either by conversion of pavement to pervious area or by redirecting runoff from an area of pavement to an on-site BMP can result in an overall reduction in pollutant loads.
Ecosystem restoration, such as buffer and wetland enhancement, stream restoration, and floodplain reconnection are also management practices that have been determined to provide nutrient and sediment reduction benefits. The Chesapeake Bay Program, for example, has established protocols to calculate pollutant reduction credit for several ecosystem restoration BMPs to meet watershed TMDL targets, as well as prepared guidance on practice verification and credit application (https://chesapeakestormwater.net/bmp-resources/urban-stream-restoration/). Stream restoration and the stabilization of gullies below outfalls on steep slopes can have a significant impact on sediment loads and should be included in watershed pollutant load reduction calculations. Reconnecting rivers to their floodplains provides additional flood storage capacity, improves the naturally variable flow regime, supports diverse habitats, and can moderate nutrient loading to lakes and impoundments (American Rivers 2016).
In the MA and NH MS4 permits, EPA Region 1 has adopted nutrient removal credits for several municipal maintenance operations (e.g., street sweeping, catch basin cleaning, and leaf pickup) and offers phosphorus removal credits for impervious cover disconnection. The VT Municipal Road General Permit establishes methodologies for accounting for TP removal for unpaved and certain paved road improvements and outfall stabilization projects (https://dec.vermont.gov/sites/dec/files/FINAL%20DRAFT%20MRGP%20SOP%206-1-20.pdf). The state of Maine implements a statewide program to enhance shoreline buffer zones by managing and controlling change along lake shorelines throughout the state (https://www.maine.gov/dep/land/slz/index.html). In addition, the UNHSC prepared a technical paper suggesting pollutant removal performance values for riparian
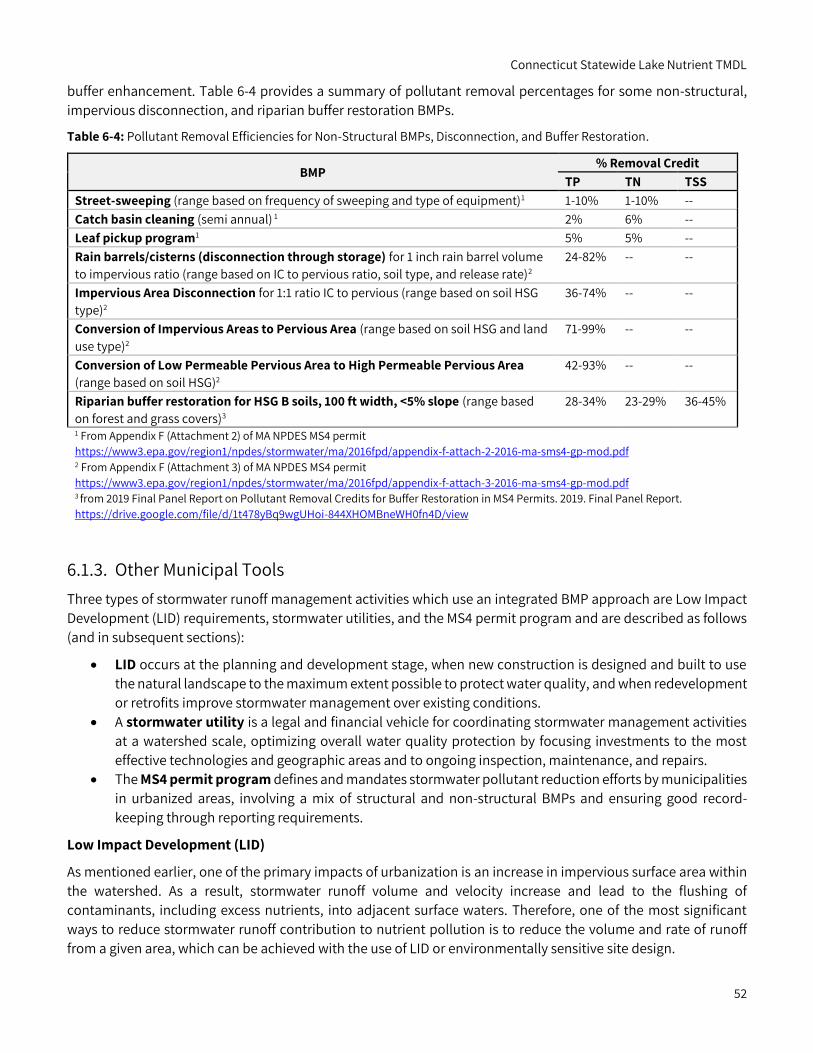
Connecticut Statewide Lake Nutrient TMDL
52
buffer enhancement. Table 6-4 provides a summary of pollutant removal percentages for some non-structural, impervious disconnection, and riparian buffer restoration BMPs.
Table 6-4: Pollutant Removal Efficiencies for Non-Structural BMPs, Disconnection, and Buffer Restoration.
BMP % Removal Credit
TP TN TSS Street-sweeping (range based on frequency of sweeping and type of equipment)1 1-10% 1-10% -- Catch basin cleaning (semi annual) 1 2% 6% -- Leaf pickup program1 5% 5% -- Rain barrels/cisterns (disconnection through storage) for 1 inch rain barrel volume to impervious ratio (range based on IC to pervious ratio, soil type, and release rate)2
24-82% -- --
Impervious Area Disconnection for 1:1 ratio IC to pervious (range based on soil HSG type)2
36-74% -- --
Conversion of Impervious Areas to Pervious Area (range based on soil HSG and land use type)2
71-99% -- --
Conversion of Low Permeable Pervious Area to High Permeable Pervious Area (range based on soil HSG)2
42-93% -- --
Riparian buffer restoration for HSG B soils, 100 ft width, <5% slope (range based on forest and grass covers)3
28-34% 23-29% 36-45%
1 From Appendix F (Attachment 2) of MA NPDES MS4 permit https://www3.epa.gov/region1/npdes/stormwater/ma/2016fpd/appendix-f-attach-2-2016-ma-sms4-gp-mod.pdf 2 From Appendix F (Attachment 3) of MA NPDES MS4 permit https://www3.epa.gov/region1/npdes/stormwater/ma/2016fpd/appendix-f-attach-3-2016-ma-sms4-gp-mod.pdf 3 from 2019 Final Panel Report on Pollutant Removal Credits for Buffer Restoration in MS4 Permits. 2019. Final Panel Report. https://drive.google.com/file/d/1t478yBq9wgUHoi-844XHOMBneWH0fn4D/view
6.1.3. Other Municipal Tools Three types of stormwater runoff management activities which use an integrated BMP approach are Low Impact Development (LID) requirements, stormwater utilities, and the MS4 permit program and are described as follows (and in subsequent sections):
• LID occurs at the planning and development stage, when new construction is designed and built to use the natural landscape to the maximum extent possible to protect water quality, and when redevelopment or retrofits improve stormwater management over existing conditions.
• A stormwater utility is a legal and financial vehicle for coordinating stormwater management activities at a watershed scale, optimizing overall water quality protection by focusing investments to the most effective technologies and geographic areas and to ongoing inspection, maintenance, and repairs.
• The MS4 permit program defines and mandates stormwater pollutant reduction efforts by municipalities in urbanized areas, involving a mix of structural and non-structural BMPs and ensuring good record-keeping through reporting requirements.
Low Impact Development (LID)
As mentioned earlier, one of the primary impacts of urbanization is an increase in impervious surface area within the watershed. As a result, stormwater runoff volume and velocity increase and lead to the flushing of contaminants, including excess nutrients, into adjacent surface waters. Therefore, one of the most significant ways to reduce stormwater runoff contribution to nutrient pollution is to reduce the volume and rate of runoff from a given area, which can be achieved with the use of LID or environmentally sensitive site design.
Connecticut Statewide Lake Nutrient TMDL
53
LID strategies are a set of development tools intended to restore, maintain, or mimic the hydrology of a watershed by reducing runoff rates and volume and increasing groundwater recharge (CT DEEP 2004). The overall goal of LID is to design and build, utilizing the natural landscape and unique features of a site to avoid unnecessary water pollution, environmental degradation, and flooding. Techniques include controlling stormwater runoff close to the point of generation, reducing impervious surfaces, and infiltrating more rainwater into the soil where it falls. Possible LID elements include building narrower and shorter roads, setting maximum parking space standards (rather than minimums), and leaving as much of the natural landscape and vegetation as is feasible. This approach avoids or greatly reduces expensive pipe-and-drain collection systems and associated end-of-pipe treatment infrastructure and can reduce paving costs (Fuss & O’Neill 2011). The treatment infrastructure that is applied is generally smaller and more evenly distributed throughout the development. Although LID is often intended primarily for new development, many of these practices can be applied as retrofits to existing sites with similar benefits.
LID strategies should be targeted for use in areas known to contribute significantly to nutrient pollution (e.g., areas with high use by domestic animals or wildlife or highly urban areas with significant impervious cover) but should also consider potential impacts to surface and groundwater. Any LID projects should consider existing or future subsurface sewage treatment and disposal system applications and avoid altering of site hydraulics and negative impacts on existing systems. Protection of existing or potential future uses for groundwater should drive infiltration options and locations.
LID Resources
• CT DEEP 2004 Connecticut Stormwater Quality Manual. The manual provides guidance on protecting the waters of Connecticut from the impacts of post-construction stormwater runoff and is a design tool for site planning source control and stormwater treatment practices. Section 4.4 of the manual describes LID in more detail (CT DEEP 2004).
• LID Appendix to the Connecticut Stormwater Quality Manual. CT DEEP conducted a study evaluating possible incorporation of LID principles into the Stormwater General Permits program. This document is one of the resulting deliverables of the study and is meant to supplement the Connecticut Stormwater Quality Manual. It provides detailed information on LID, including integrated management approaches, design standards useful at the municipal and state planning level, and site-specific stormwater BMPs (Fuss & O’Neill 2011).
• CT DEEP LID Resources Factsheet. This document provides links to many additional LID resources useful to municipalities (CT DEEP 2019e).
• Watershed Municipal Outreach and LID. CT DEEP has compiled LID project examples in Connecticut and has developed a series of brochures for municipalities and homeowners who wish to learn more about implementing innovative stormwater controls.
• Forging the Link: Linking the Economic Benefits of LID and Community Decisions. The University of New Hampshire Stormwater Center published a study that discusses the benefits of integrating LID and traditional stormwater management for towns and commercial developers. Through a series of case studies, this project documents the advantages of LID in economic terms in relation to how municipal land use decisions are commonly made.
• National LID Atlas. An online National LID Atlas with examples from around the nation was created for the NEMO Network by the Connecticut NEMO Program and the California Center for Water and Land Use.
• New England Environmental Finance Center. Additional LID examples are available from the New England Environmental Finance Center (n.d.).
Stormwater Utilities
Connecticut Statewide Lake Nutrient TMDL
54
Communities across the nation are increasingly examining the option of stormwater utilities to fund stormwater management. A stormwater utility charges fees to property owners who use the local stormwater management system. The revenue can be used to maintain and upgrade existing storm drain systems, develop drainage plans, construct flood control measures, and cover administrative costs. Stormwater utilities are considered a fair way of collecting funds for stormwater management. The properties that contribute stormwater runoff and pollutant loads and, therefore, create the need for stormwater management, pay for the program. Stormwater utilities provide a predictable and dependable amount of revenue that is dedicated to the implementation of stormwater management. Over 400 communities in the United States have created stormwater utilities.
In 2007, Connecticut Public Act 7-154, also known as the Municipal Stormwater Authority Pilot Program, was signed into law. This law allows for grants for up to four communities interested in examining stormwater utility districts. It also allows for the formation of such districts by participating communities if stormwater utility districts were desired upon completion of the grant studies (Fuss & O’Neill 2010). Effective July 2021, Public Act 21-115, “An Act Concerning Climate Change Adaption” updated CGS Section 22a-498 and authorizes all municipalities, rather than just certain ones, to establish a municipal stormwater authority.
Three Connecticut communities opted to participate in this program—New Haven, Norwalk, and New London. Each community has considered a utility district to assist with implementation of Phase II Stormwater and other stormwater management issues such as flooding and upgrade of aging infrastructure. New Haven is proceeding with additional analysis and stakeholder meetings to identify the best organizational structure and user fee implementation program to address the City’s anticipated stormwater management program needs (Fuss & O’Neill 2010). New London instituted the first stormwater utility in Connecticut in 2019.
MS4 Stormwater Management
An MS4 is defined by EPA as “a conveyance or system of conveyances that is owned by a state, city, town, village, or other public entity that discharges to waters of the U.S., designed or used to collect or convey stormwater (e.g., storm drains, pipes, ditches), not a combined sewer, and not part of a sewage treatment plant, or publicly owned treatment works (POTW).”
These storm drain networks collect polluted stormwater and often direct it to lakes and streams, and thus are a critical part of surface water impairments. How these systems are managed, maintained, and gradually evolve will have a major effect on water quality in Connecticut lakes and streams.
Since MS4 systems involve rainwater collection pipes, they are considered point source pollution by EPA (see the definition in Section 3.1) and are thus subject to NPDES regulation. The EPA began to address the polluted stormwater by MS4s under the NPDES program in 1990, with Phase I of the EPA Stormwater Rule addressing runoff from medium and large MS4s with populations greater than 100,000. Phase II of the Stormwater Rule was issued in 1999 and focused on small MS4s serving less than 100,000. Connecticut began regulating small MS4 municipalities in 2004 under a General Permit for the Discharge of Stormwater from Small Municipal Separate Storm Sewer Systems (MS4 General Permit). As of 2018, there were 133 entities in Connecticut covered under the MS4 General Permit (CT DEEP 2018). In addition, the Connecticut DOT has its own MS4 General Permit.
The MS4 General Permit approach means that a single permit is written for the state, approved by EPA, then individual municipalities register under the permit and meet its requirements. The MS4 General Permit requires municipalities to conduct a standard set of stormwater management activities, most of which are non-structural BMPs. Key requirements are described below.
The SWMP is the cornerstone requirement under the MS4 General Permit. This plan is developed by the municipality and documents the relevant infrastructure and BMPs to reduce water quality pollutants to the “Maximum Extent Practicable,” a term defined by EPA as, “to reduce and/or eliminate to the extent achievable
Connecticut Statewide Lake Nutrient TMDL
55
using control measures that are technologically available and economically practicable and achievable in light of best industry practice.”
These six minimum control measures are identified in the MS4 General Permit:
• Public Education and Outreach requires the municipality to educate the public about water quality and pet waste, application of fertilizers, herbicides, and pesticides, and impacts of illicit discharges and improper disposal of waste. Educational materials may be developed by the municipality itself or adapted from universities, watershed organizations, or other sources.
• Public Participation involves making the SWMP and Annual Reports publicly available, with a 45-day public comment period on the Annual Report. In addition, municipalities are encouraged to work with local organizations to help carry out the plan.
• Illicit Discharge Detection and Elimination requires the municipality to inspect drainage infrastructure and the watershed for sewer cross-connections, illegal dumping, industrial and commercial wastes, floor drains, animal wastes, and lawn management chemicals and wastes. It includes detailed guidelines for conducting mapping, fieldwork, and reporting and is mandated in priority areas only.
• Construction Site Stormwater Runoff Control focuses on using local authority to implement the 2004 Connecticut Stormwater Manual and the 2002 Guidelines for Soil Erosion and Sedimentation Control. This element contains detailed guidance on review and inspection, as well as notification requirements to CT DEEP regarding construction, maintenance of stormwater treatment ponds, and how municipal departments and boards with varying jurisdictions shall coordinate their functions.
• Post-Construction Stormwater Management involves updating land use regulations to include LID measures, post-construction stormwater retention, and inspection and long-term maintenance of existing stormwater facilities operated by the municipality and those in new developments, as well as a requirement to map DCIA.
• Pollution Prevention and Good Housekeeping requires water quality focused maintenance and management of municipal parks and open space, employee training, pet waste and waterfowl, buildings and facilities, vehicles and equipment, parking lots, snow management, street sweeping, leaf collection, and catch basin cleaning. It also contains a requirement to reduce DCIA through retrofits or stormwater retention in redevelopment projects.
Monitoring is required by the MS4 General Permit, although it is not considered one of the six essential elements. The permit requires monitoring outfalls discharging to impaired waters, such as those covered by this TMDL. Monitoring outfalls discharging to impaired waters requires additional parameter analyses for Pollutants of Concern. Outfalls with results over a specified threshold require follow up investigation and improvements to BMPs in the portion of the drainage network upstream of the outfall.
MS4 Stormwater Management Resources
• CT DEEP Overview of the MS4 Program in Connecticut: There are annual reporting requirements under the MS4 General Permit, and these reports provide valuable documentation and insight to water quality protection and restoration activities (CT DEEP 2017). Much of this information is summarized in individual town Water Quality Fact Sheets, available online through CT DEEP Municipal Stormwater.
• EPA Overview of the National MS4 program: Additional MS4 program information is available online through EPA’s NPDES program, Stormwater Discharges from Municipal Sources.
• University of Connecticut NEMO Program: UConn’s CLEAR established the NEMO program in 1991 to address the lack of education and assistance to community land use decision makers. NEMO offers a LID Inventory as an online resource to geo-referenced examples of stormwater management practices in
Connecticut Statewide Lake Nutrient TMDL
56
Connecticut. NEMO offers site planning concepts for stormwater runoff in conjunction with principles laid out in the State’s Stormwater Quality Manual. In addition, UConn’s CLEAR was contracted to work with the CT DEEP Stormwater Program to help provide support, training, and tools to MS4 communities.
• National Menu of Stormwater BMPs. The National Menu of BMPs for Stormwater (based on the MS4 Phase II rules) was first released in October 2000. An updated version of this original webpage includes the addition of new fact sheets and the revision of existing fact sheets.
• University of New Hampshire (UNH) Stormwater Center. The UNH Stormwater Center runs a facility that provides controlled testing of stormwater management designs and devices. The Center is a technical resource for stormwater practitioners and studies a range of issues for specific stormwater management strategies including design, water quality and quantity, cost, maintenance, and operations. The field research facility serves as a site for testing stormwater treatment processes, for technology demonstrations, and for conducting workshops. The testing results and technology demonstrations are meant to assist resource managers in planning, designing, and implementing effective stormwater management strategies. Detailed descriptions of multiple stormwater BMPs are available through their website and annual reports.
6.2. In-Lake Treatment In some cases, it may be determined that one of the best approaches to minimizing phosphorus impacts is in-lake treatment. Several common techniques for addressing eutrophication and nuisance plants were evaluated by Osgood (2015). The reliability, applicability, effectiveness, and duration of techniques targeting eutrophication, phosphorus impairments, and nuisance algae are summarized in Table 6-5 and are described below in more detail. CTDEEP recommends that nutrient reductions from point and nonpoint sources within the watershed be achieved prior to addressing internal nutrient loads using in-lake treatments.
Algaecide Treatment – Algaecides are chemicals used to kill algae. The duration of algaecide effectiveness is short (measured in weeks) and repeated applications are often required. The most commonly used algaecides are copper compounds. Herbicide options also exist for managing macrophytes, including copper, endothall, Diquat, Glyphosate, 2,4-D, Fluridone, or Triclopyr. An herbicide is applied to a target area or directly to the plants. This process allows for a wide range of control and may achieve some algae control as well. However, herbicides can have toxicity to non-target species and possible downstream impacts. They can also increase oxygen demand in the water due to dying and decaying vegetation, and result in possible recycling of nutrients back into the pond system. Typical herbicide treatment costs are in the range of approximately $2,000 per acre.
Aeration is a type of artificial circulation and generally includes aerators installed on the pond bottom that add air or oxygen from shoreline-based pumps. In waters that are anoxic, sediment phosphorus is released and becomes available. When these waters are oxygenated the phosphorus binds with the sediment and becomes unavailable. For ponds resistant to mixing, waters deeper than 7 meters, or waters that have regular anoxia events, aeration may be a viable option to reduce internal phosphorus additions from the sediments. However, because aeration systems function in part by forcing phytoplankton to spend more time in deeper areas where light penetration and photosynthesis is reduced; shallow waterbodies are generally not good candidates for aeration systems. In addition, aeration is also generally not considered effective for macrophyte control. Alternative mixing techniques include downdraft or updraft pumping, which use pumps to exchange surface or bottom waters, respectively, to bring higher oxygen waters down to the sediments. These pumps are generally floating units, often solar powered, that sit over the deeper portions of the pond where anoxic conditions exist. A typical unit is estimated to treat 35 acres. Aesthetics may prove to be an issue as each system is approximately 10 feet in diameter. Typically, aeration methods and technologies have more commonly been applied to address water quality issues in drinking water/water supply reservoirs, sewage treatment plants, and stormwater ponds, where
Connecticut Statewide Lake Nutrient TMDL
57
oxygen depletion is a threat to water quality. These techniques are less commonly applied to natural ponds/lakes in response to effects from eutrophication. Osgood (2015) notes that inappropriate use of aeration can cause harm to lake systems and the application of this technique should be critically evaluated.
Application of aluminum salts (Alum) – alum applications are typically a mix of aluminum sulfate and sodium aluminate. Salts of aluminum, iron, or calcium chemically bind with phosphorus and form solid precipitates that sink to the bottom, thus inactivating sediment phosphorus. Alum reacts with inorganic phosphorus to form a precipitate that is not sensitive to redox so it can be used in anoxic settings. Aluminum sulfate is a material commonly used in water treatment plants to clarify drinking water and in lakes to reduce the amount of phosphorus in the water. On contact with water, alum forms a fluffy aluminum hydroxide precipitate called floc. Aluminum hydroxide binds with phosphorus to form an aluminum phosphate compound. This compound is insoluble in water under most conditions, so the phosphorus bound in it is no longer available. As the floc settles, some phosphorus is physically removed from the water along with suspended particles which get carried down to the bottom of the lake. Once settled on the bottom of the lake, the floc forms a layer that acts as a phosphorus barrier by combining with phosphorus as it is released from the sediments. Benefits from alum treatments have been well documented and can reasonably be expected for periods of several up to 15 years. Longevity is maximized if internal load is the major source of phosphorus. Benefits may be compromised if external loading remains elevated after treatment. Typical alum treatment costs are in the range of approximately $2,000 per acre.
There are several negative considerations with alum treatment. Alum may cause fluctuations in water chemistry, especially pH, during treatment with possible toxicity to aquatic fauna (fish and invertebrates) from aluminum at low or high pH. There is potential for resuspension of floc in shallow, well-mixed waters. In addition, alum treatments generally do not effectively discourage growth of macrophytes. While alum treatments have been shown to be effective for water quality improvement and algal control, these effects may encourage even more dense infestations of nuisance rooted plants, due to improved water clarity and light penetration, which may allow weeds to grow in deeper areas.
Biological controls, such as fish, insects, or pathogens, feed on or parasitize plants to reduce plant population. The most used biological control for macrophytes is the grass carp. This fish is an Asian carp that is invasive, will dominate an ecosystem, decimate the native fish populations, and take over their habitat, and is subsequently illegal in states like Massachusetts. Thus, this is not a feasible option.
Dredging - Removal of sediments would remove much of the historical phosphorus mass available for internal loading; however, dredging is a complicated and expensive undertaking that is generally challenging to permit and technically perform, such as determining where to dewater and ultimately dispose of the dredged sediment. Dredging is a high-cost option, has permitting challenges, generally is coupled with unknown sediment quality and questions as to how that might affect disposal options, and may result in severe disruption to local traffic from sediment transport.
Harvesting of aquatic plants can be done by hand pulling or mechanical cutting (with or without collection). This method is effective; however, it is a highly selective and labor-intensive technique which is difficult to perform in dense stands. This method is best utilized for small or hard-to-access areas and requires snorkeler or diver. As such, it may be considered for spot treatment of select areas but not often a realistic option as the primary management approach. Cutting without collecting involves severing the submerged or emergent stem of the macrophyte from its root and leaving the cuttings and fragments in the water. If cut materials are left in the pond, they will decay while consuming oxygen and releasing bound nutrients. This option does not meet the project objectives of reducing nutrient concentrations. Mechanical cutting with collecting is typically done with specially designed boats that have cutting and harvesting mechanisms built into/onto them. Collected cuttings are typically composted and then used as mulch. Cutting rates for harvesters tend to range from four to eight hours
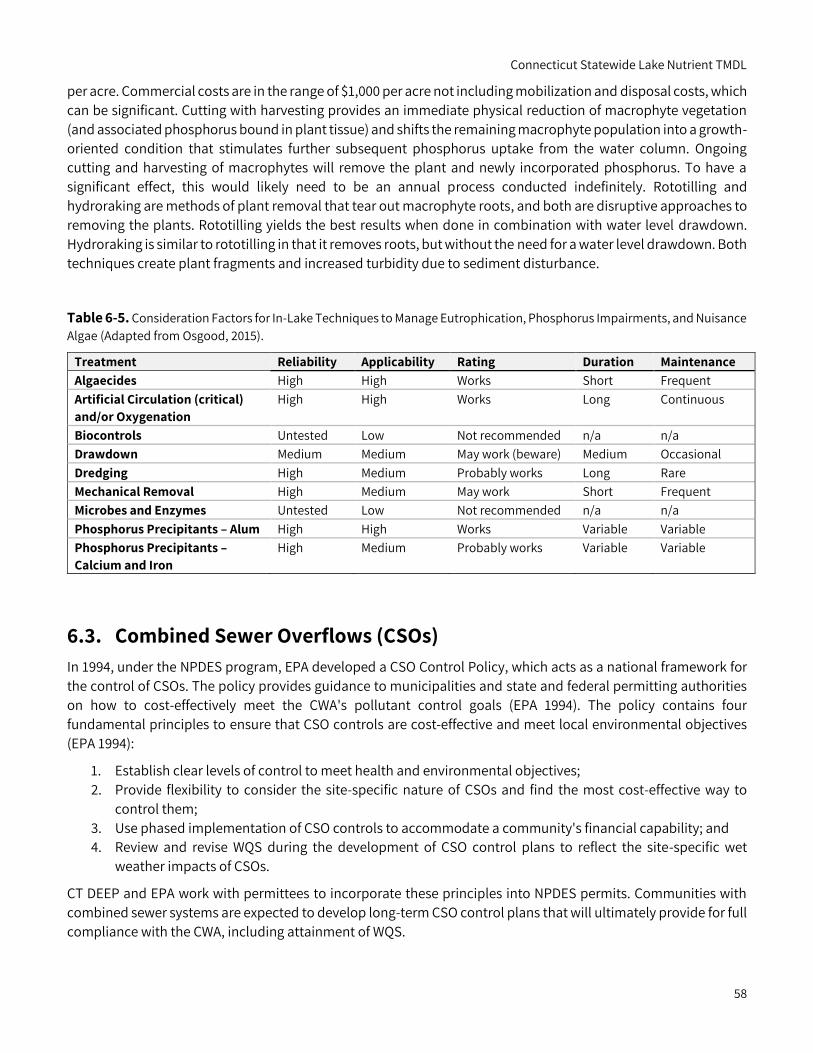
Connecticut Statewide Lake Nutrient TMDL
58
per acre. Commercial costs are in the range of $1,000 per acre not including mobilization and disposal costs, which can be significant. Cutting with harvesting provides an immediate physical reduction of macrophyte vegetation (and associated phosphorus bound in plant tissue) and shifts the remaining macrophyte population into a growth-oriented condition that stimulates further subsequent phosphorus uptake from the water column. Ongoing cutting and harvesting of macrophytes will remove the plant and newly incorporated phosphorus. To have a significant effect, this would likely need to be an annual process conducted indefinitely. Rototilling and hydroraking are methods of plant removal that tear out macrophyte roots, and both are disruptive approaches to removing the plants. Rototilling yields the best results when done in combination with water level drawdown. Hydroraking is similar to rototilling in that it removes roots, but without the need for a water level drawdown. Both techniques create plant fragments and increased turbidity due to sediment disturbance.
Table 6-5. Consideration Factors for In-Lake Techniques to Manage Eutrophication, Phosphorus Impairments, and Nuisance Algae (Adapted from Osgood, 2015).
Treatment Reliability Applicability Rating Duration Maintenance Algaecides High High Works Short Frequent Artificial Circulation (critical) and/or Oxygenation
High High Works Long Continuous
Biocontrols Untested Low Not recommended n/a n/a Drawdown Medium Medium May work (beware) Medium Occasional Dredging High Medium Probably works Long Rare Mechanical Removal High Medium May work Short Frequent Microbes and Enzymes Untested Low Not recommended n/a n/a Phosphorus Precipitants – Alum High High Works Variable Variable Phosphorus Precipitants – Calcium and Iron
High Medium Probably works Variable Variable
6.3. Combined Sewer Overflows (CSOs) In 1994, under the NPDES program, EPA developed a CSO Control Policy, which acts as a national framework for the control of CSOs. The policy provides guidance to municipalities and state and federal permitting authorities on how to cost-effectively meet the CWA's pollutant control goals (EPA 1994). The policy contains four fundamental principles to ensure that CSO controls are cost-effective and meet local environmental objectives (EPA 1994):
1. Establish clear levels of control to meet health and environmental objectives; 2. Provide flexibility to consider the site-specific nature of CSOs and find the most cost-effective way to
control them; 3. Use phased implementation of CSO controls to accommodate a community's financial capability; and 4. Review and revise WQS during the development of CSO control plans to reflect the site-specific wet
weather impacts of CSOs.
CT DEEP and EPA work with permittees to incorporate these principles into NPDES permits. Communities with combined sewer systems are expected to develop long-term CSO control plans that will ultimately provide for full compliance with the CWA, including attainment of WQS.
Connecticut Statewide Lake Nutrient TMDL
59
CSO Prevention Practices: CSO prevention practices are aimed at both minimizing the volume of pollutants entering a combined sewer system and reducing the frequency of CSOs. Stormwater management measures that reduce the volume and rates of runoff can also reduce the frequency of CSO events. Additionally, management measures that reduce nutrient sources to stormwater will reduce their concentrations in CSO discharges.
As of 1995, all CSO communities are responsible for implementing EPA’s nine minimum technology-based controls (unrelated to the nine elements for a WBP). The nine minimum controls are measures that can reduce the prevalence and impacts of CSOs without significant engineering or construction (EPA 1995). These controls include:
1. Proper operation and maintenance of the collection system; 2. Maximum use of the collection system for storage; 3. Review of pretreatment programs to minimize CSO-related impacts; 4. Maximum flow to the treatment plant; 5. Prohibit dry-weather overflows; 6. Control of solid and floatable materials; 7. Pollutant prevention; 8. Public notification; and 9. Monitoring to characterize CSO improvements and remaining CSO impacts.
Combined Sewer Separation: Sewer separation is the practice of separating the combined, single pipe system into separate sewers for sanitary and stormwater flows. This approach is usually a major infrastructure investment. In a separate system, stormwater is conveyed to a stormwater outfall for discharge directly into the receiving water. Based on a comprehensive review of a community's sewer system, separating part or all its combined systems into distinct storm and sanitary sewer systems may be feasible. Communities that elect for partial separation typically use other CSO controls in the areas that are not separated (EPA 1995).
CSO Resources
• Guidance: Coordinating CSO Long-Term Planning with WQS Reviews. Addresses impediments to implementing the water quality-based provisions in the CSO Policy and provides recommended actions that State and Interstate Water Pollution Control directors and CSO communities can take to overcome these impediments (EPA 2001a).
• CSO Guidance for Nine Minimum Control Measures. Provides information on nine minimum technology-based controls that communities are expected to use to address CSO problems, without extensive engineering studies or significant construction costs, before long-term measures are taken (EPA 1995).
• CSO Management Fact Sheet: Sewer Separation. Describes the basic information regarding the separation of CSOs for combined sewer systems (EPA 1999a).
• Other NPDES CSO guidance documents are available online.
6.4. Illicit Discharges Illicit discharge refers to any release into an MS4 that is not composed entirely of stormwater, except discharges pursuant to a NPDES permit and discharges resulting from fire-fighting activities (although firefighting activities cause other water pollution concerns, including high solids and water volumes from hydrant flushing and high PFAS contamination from fire suppression chemicals). Refer to Section 3.1.1, Unauthorized Point Sources of Untreated Wastewater. Examples include direct discharges such as sanitary wastewater piping that is directly connected from a home to a storm sewer, and indirect discharges such as an old and damaged sanitary sewer line that is leaking into a cracked storm sewer line (NEIWPCC 2003). EPA’s Stormwater Phase II Final Rule states that
Connecticut Statewide Lake Nutrient TMDL
60
municipalities are required to develop Illicit Discharge Detection and Elimination (DDE) plans. IDDE can also help in areas without such MS4 requirements. Removing these illicit discharges is a high priority for CT DEEP and EPA because it is an effective approach to eliminating water quality impairments. The MS4 General Permit has gradually adopted more prescriptive requirements related to the IDDE program to ensure efforts are effective.
A sample list of IDDE BMPs and measurable milestones is presented below. BMPs are listed in bold, followed by the measurable goals for each BMP. This list was excerpted from “Illicit Discharge Detection and Elimination Manual: A Handbook for Municipalities” (NEIWPCC 2003):
• Create a storm sewer map: Map a certain percentage of outfalls or areas of town (adding up to 100% by the end of the permit term).
• Pass an illicit discharge ordinance: Draft an IDDE ordinance (or stormwater ordinance with IDDE component) or an amendment to existing bylaws.
• Prepare an IDDE plan: Complete a final plan and obtain the signature of the person overseeing the plan. • Conduct dry weather field screening of outfalls: Screen a certain percentage of outfalls (adding up to
100% by the end of the permit term). • Trace the source of potential illicit discharges: Trace the source of a certain percentage of continuous
flows (adding up to 100% by the end of the permit term); and trace the source of a certain percentage of intermittent flows and illegal dumping reports (adding up to 100% by the end of the permit term).
• Eliminate illicit discharges: Eliminate a certain number of discharges and/or a certain volume of flow, or a certain percentage of discharges whose source is identified (adding up to 100% by the end of the permit term).
• Implement and publicize a household hazardous waste collection program: Hold a periodic (e.g., annual) hazardous waste collection day; and mail flyers about the hazardous waste collection program to all town residences.
• Create and distribute an informational flyer for homeowners about IDDE: Mail the flyer to town residences; and print the flyer as a doorknob hanger and have water-meter readers distribute it.
• Create and distribute an informational flyer for businesses about IDDE: Mail the flyer to targeted businesses.
• Work with community groups to stencil storm drains: Stencil a certain percentage of drains (adding up to 100% by the end of the permit term).
• Create and publicize an illicit discharge reporting hotline: Put the hotline in place; Include an announcement of the hotline in sewer bills; and follow up on all hotline reports within 48 hours.
Illicit Discharges Resources
• Connecticut IDDE Program. Section 5.2.5 of Connecticut’s Stormwater Quality Manual (CT DEEP 2004) requires Connecticut municipalities to develop, implement, and enforce plans to detect and eliminate existing illicit discharges and connections.
• NEIWPCC IDDE Manual. The New England Interstate Water Pollution Control Commission (NEIWPCC) published a useful manual for communities titled Illicit Discharge Detection and Elimination Manual: A Handbook for Municipalities (NEIWPCC 2003).
• CWP IDDE Manual. This manual provides practical, low cost, and effective techniques for Phase II NPDES MS4 communities and others to develop an effective IDDE program (Brown et al. 2004). Guidance is provided on IDDE testing techniques, estimating program costs that include capital and personnel expenses, and estimating program implementation.
• EPA Model Ordinances. The EPA maintains a list of model ordinances designed to protect local resources through the elimination and prevention of illicit discharges. The list includes language to address illicit discharges in general, as well as illicit connections from industrial sites.
Connecticut Statewide Lake Nutrient TMDL
61
• EPA IDDE Program Development BMP Fact Sheet. Communities addressing the IDDE minimum control measure should begin with EPA’s IDDE program development fact sheet (EPA 2005b).
6.5. Subsurface Sewage Treatment and Disposal Systems When properly designed, installed, operated, and maintained, subsurface sewage treatment and disposal systems or septic systems can renovate wastewater just as well as most conventional WPCFs. However, if a system is going to experience failure, it is most likely to occur in late winter or early spring when groundwater levels are at their highest elevations. It is important to evaluate site conditions during this time to account for potential worst-case scenarios. The following is an additional list of key components for consideration when installing and operating a subsurface sewage disposal system:
• Proper design includes adequate evaluation of soil conditions, seasonal high groundwater or impermeable materials, proximity of sensitive resources (e.g., drinking water wells, surface waters, wetlands, etc.);
• Proper siting and installation means that the system is installed in conformance with the approved design and siting requirements (e.g., setbacks from waterways);
• Proper operation includes how the property owner uses the system. While most systems excel at treating normal domestic sewage, disposing of some materials, such as toxic chemicals, paints, personal hygiene products, oils and grease in large volumes, and garbage, can adversely affect the function and design life of the system, resulting in treatment failure and potential health threats; proper operation also includes how the property owner protects the system; allowing vegetation with extensive roots to grow above the system will clog the system; driving large vehicles over the system may crush or compact piping or leaching structures;
• Proper maintenance means having the septic tank pumped at regular intervals to eliminate accumulations of solids and grease in the tank; it may also mean regular cleaning of effluent filters, if installed.
• Proper replacement of failed systems, which may include programs or regulations to encourage upgrades of conventional systems to more innovative alternative technologies, provided a statewide permitting program has been established.
The life and effectiveness of a properly designed and installed subsurface sewage treatment and disposal system can be optimized though proper operation and maintenance of the system, including:
• Knowing the location of the building sewer, septic tank, distribution piping, and leaching system; • Keeping deep-rooted trees and shrubs from growing above the leaching system; • Maintaining proper vegetation between your system and adjacent water resources; • Keeping heavy vehicles from driving on or parking above any component of the subsurface sewage
treatment and disposal system; • Installing risers above the inlet and outlet of the septic tank to allow for easy access during inspections
and pumping; • Installing an effluent filter at the outlet of the septic tank to enhance its performance and protect the
leaching system from clogging; • Pumping the tank on a regular basis (typically 3-5 years) to optimize primary treatment and to minimize
the potential for solids carry-over into the leaching system (which would result in premature failure of the system);
• Composting kitchen wastes instead of using a garbage disposal;
Connecticut Statewide Lake Nutrient TMDL
62
• Avoiding the dumping of materials down the drain which are likely to inhibit the proper operation of the system, including toxic chemicals, paints, solvents, personal hygiene products, oils and grease in large volumes, and garbage;
• Avoiding the disposal of water softener or other water treatments into the septic system; • No pet wastes including cat litter should be placed into the septic system; • No water softener treatment backwash or regeneration brine should be allowed into the septic system;
and • Checking all plumbing for leaks on a regular basis; a continually running faucet or toilet could add
hundreds of gallons of water a day to the system, possibly resulting in a hydraulic overload and failure of the system.
Subsurface Sewage Treatment and Disposal System Resources
• CT DPH. The CT DPH has published a Design Manual for Subsurface Sewage Disposal Systems for Households and Small Commercial Buildings in two parts. Part I identifies general design principles, while Part II discusses specific design considerations. There are also links to Home Buyers Guide, Septic Systems 101: Operation and Maintenance of a Subsurface Sewage Disposal System, and Sewage Backup Fact Sheet. Also see the CT DPH On-Site Sewage Disposal Regulations and Technical Standards.
• CT General Statutes. Connecticut’s subsurface sewage treatment and disposal system rules are adopted in accordance with Connecticut General Statutes, Chapter 368a and Chapter 446k. The purpose of these rules is to protect public health and the environment by establishing a comprehensive program to regulate the design, construction, replacement, modification, operation, and maintenance of subsurface sewage treatment and disposal systems.
• SepticSmart Homeowner’s Program. EPA’s SepticSmart initiative is a nation-wide public education effort with resources for homeowners, local organizations, and government leaders.
• Homeowner Guide to Septic Systems. This EPA guide describes how a septic system works and what homeowners can do to help their systems treat wastewater effectively (EPA 2005a).
• EPA Septic Website. This site offers valuable information and resources to manage subsurface sewage treatment and disposal systems in a manner that is protective of public health and the environment and allows communities to grow and prosper. Specific resources include:
▪ Voluntary National Guidelines for Management of Onsite and Clustered (Decentralized) Wastewater Treatment Systems. Guide that helps states and local communities establish comprehensive management programs to ensure that subsurface sewage treatment and disposal systems function properly (EPA 2003). Proper management of decentralized systems involves implementation of approximately one dozen management components such as public education and participation, planning, operation and maintenance, and financial assistance and funding.
▪ Handbook for Managing Onsite and Clustered (Decentralized) Wastewater Treatment Systems. A “how-to guide” for implementing EPA’s Voluntary National Guidelines for Management of Onsite and Clustered (Decentralized) Wastewater Treatment Systems (EPA 2005c). The guide describes a step-by-step approach for the development of a community management program for decentralized wastewater systems. It includes specific community examples, gives an overview of the elements essential for sound management of these systems and provides links to resources.
▪ Onsite Wastewater Treatment Systems Manual. This manual was developed to provide supplemental and new information for wastewater treatment professionals in the public and private sectors (EPA 2002). This manual goes into more detail about subsurface sewage treatment and disposal systems than the previous manual.
Connecticut Statewide Lake Nutrient TMDL
63
6.6. Agriculture Manure management BMPs and nutrient management planning are two of the primary tools for controlling nutrient runoff from agricultural areas, particularly horse farms in Connecticut. Agriculture management measures addressed by Connecticut’s NPS Pollution Control Program and Agricultural Permitting Program pertain to nutrient management and confined animal facilities (CAFs). A CAF is a non-agriculturally productive lot or facility where non-aquatic animals are held and fed for at least 45 days per year. The key measures recommended include:
Confined Animal Facilities
• Limit discharges by storing wastewater and diverting runoff caused by storms; • Manage stored runoff and solids through proper use of waste and disposal methods that minimize
impacts to surface water and/or groundwater; and • Collect solids, reduce contaminant concentrations, and reduce runoff to minimize the discharge of
contaminants in both facility wastewater and runoff caused by all storms up to and including 25-year, 24-hour frequency storms.
Nutrient Management
• Develop and implement Comprehensive Nutrient Management Plans (CNMPs), including: ▪ Nutrient budgets for crops; ▪ Identification of the types and amount of nutrients necessary to produce a crop based on realistic
crop yield expectations; and ▪ Identification of the environmental hazards of the site.
• Conduct soil tests and other tests to determine crop nutrient needs and proper calibration of nutrient application equipment.
A CNMP is a conservation system for livestock agricultural operations. CNMPs are designed to address, at a minimum, the soil erosion and water quality concerns of agricultural operations. The CNMP encompasses the storage and handling of the manure, as well as the utilization and application of the manure nutrients on the land. Manure and nutrient management involve managing the source, rate, form, timing, and placement of nutrients. Writing a CNMP is an ongoing process because it is a working document that changes over time.
The State of Connecticut has the second highest horse density in the nation, which makes proper horse farm management a priority for farm operations in the State. The Horse Environmental Awareness Program (HEAP) developed the Good Horse Keeping: Best Practices Manual for Protecting the Environment 2011, which identified the following BMPs for sustainable horse management and environmental protection:
1. Construct adequate manure (permanent or temporary) storage facilities based on the number of horses, and divert runoff away from manure piles using roofs, gutters, curbs, walls, or land grading;
a. Earthen channels or diversion should be constructed where clean water may mix with wastewater from paddocks or manure storage areas and diverted to a stable outlet such as a vegetated channel or storm drain;
2. If not using a roll-off dumpster for manure removal, construct an onsite compost pile away from water sources for farm spreading operations
3. Select an appropriate bedding material (such as pine shavings, pine sawdust, straw, wood pellets, straw pellets, peat moss, etc.) that is absorbent and cost effective at mitigating wastewater runoff to surface and ground waters;
Connecticut Statewide Lake Nutrient TMDL
64
4. Develop a CNMP based on field soil tests to determine the amount, type, and timing of nutrient amendments; ensure adequate buffers are planted around water sources to reduce erosion and excess nutrient loading;
5. Designate stream crossings to minimize impacts to stream banks using bridges, culverts, and stabilized gravel pads;
6. Rotate pastures to ensure overgrazing does not compact soil and cause erosion; and 7. Use alternative water systems (automatic or manual) and proper fencing to restrict horse access to
streams.
CT DEEP is developing a General Permit for Concentrated Animal Feeding Operations (CAFOs) to regulate manure management activities currently practiced on Connecticut Animal Feeding Operations (Connecticut AFOs), specifically those with many animals, defined as CAFOs. In a 2003 Technical Report on the impact of such a permit, dairy and poultry manures were identified as contributing to a nutrient surplus in Connecticut (Wright-Pierce 2005). Land application is the most common agricultural manure management method for dairy and poultry manure. Due to the reduction of farmland in Connecticut, there is not enough farmland available for typical agronomic application rates to meet the supply of manure. The proposed General Permit would limit land application to agronomic rates, meaning many CAFOs would likely not have enough land to apply their manure. Since manure production rates are directly related to overall farm production, feasible manure management alternatives would be essential to maintaining the productivity of affected farms.
Examples of successful agricultural management projects can be found in the Lake Waramaug watershed (CT DEEP 2000) and the Blackberry River watershed (CT DEEP 2010).
Agriculture Resources
• Manual of Best Management Practices for Agriculture: Guidelines for Protecting Connecticut’s Water Resources. This manual describes a wide range of BMPs designed to reduce the impact of agriculture on ground and surface water quality (CT DEEP, NRCS & CT CSWC 1996).
• USDA Natural Resources Conservation Service (NRCS). Agricultural operators can obtain assistance in developing CNMPs and BMPs from the NRCS in Connecticut, which can be accessed through the local county conservation district.
• CT Department of Agriculture. Agricultural operators can obtain assistance in nutrient or wastewater management from the Department of Agriculture in Connecticut. Many of the State grants and loans are in collaboration with such agencies as NRCS.
• EPA National Management Measures to Control NPS from Agriculture. Online. • USDA NRCS Animal Waste Software. Software designed to assess the threat to ground and surface water
from manure storage facilities. • HEAP: Good Horse Keeping: Best Practices Manual for Protecting the Environment 2011. A guide that
assists equine owners with managing horses and protecting the environment through sustainable BMP practices (HEAP 2011).
• Partnership for Assistance on Agricultural Waste Management Systems. Connecticut offers technical and financial support to farm businesses in their farm waste efforts through a partnership with the following agencies: USDA NRCS, USDA Farm Service Agency, UConn Cooperative Extension System, Connecticut Conservation Districts, CT DEEP, and the Connecticut Department of Agriculture. Through this partnership, a farm business may obtain waste management planning for structure design and qualify for financial assistance, as well as assistance in procuring required permits.
Connecticut Statewide Lake Nutrient TMDL
65
6.7. Pets Pet waste collection as a pollutant source control involves a combination of educational outreach and enforcement to encourage residents to clean up after their pets. It is recommended that residents do not put dog and cat feces in a compost pile because it may contain parasites, bacteria, pathogens, and viruses that are harmful to humans. These may or may not be destroyed by composting. Put dog and cat feces in a plastic bag and set it out with the trash.
Education and Outreach Campaigns: Public education programs can be used to reduce pet waste. These programs are often incorporated to a larger message of reducing NPS pollution to improve water quality. Signs, posters, brochures, and newsletters describing the proper techniques to dispose of pet waste can also be used to educate the public about this problem and to create a cause-and-effect link between pet waste and water quality (EPA 2005d).
Designated dog parks are becoming more common and can be used to reduce pet waste near surface waters. These parks often include signs about the importance of removing pet waste, as well as bags and trashcans in which to dispose of the waste. Other techniques can be incorporated to the design of the park, such as “Doggy Loos,” which are pet waste disposal units placed in the ground and operated by foot-activated lids, “Pooch Patches,” which consist of a pole surrounded by sand where dogs are encouraged to defecate, and “Long Grass Areas,” which are areas where grass is left un-mowed to allow pet waste to disintegrate naturally. Other practices, such as creating a vegetated buffer around the park would reduce impacts of this type of developed area runoff to nearby surface waters by encouraging infiltration to soils (EPA 2005d).
Individual pet owners can also take steps to reduce their pet’s impact on water quality. Adopting simple habits, such as carrying a plastic bag on walks and properly disposing of pet waste in dumpsters or other refuse containers, can make a difference.
Town Ordinances and Enforcement: “Pooper-scooper” ordinances are often used to regulate pet waste disposal. These ordinances generally require the removal of pet waste from public areas, other people’s properties, and occasionally from personal property, before leaving the area. Fines are typically the enforcement method used to encourage compliance with these ordinances.
Pet Waste Resources
The following resources discuss the heath and water quality risks associated with pet waste:
• Give a Bark for a Clean State Park (CT DEEP 2008). Online. • What's the Scoop on Pet Waste and Water Quality? (TAPP-Think About Personal Pollution).
Developed by the City of Tallahassee, Florida. Online. • EPA Source Water Protection Practices Bulletin. Managing Pet and Wildlife Waste to Prevent
Contamination of Drinking Water (CT DEEP 2008).
6.8. Nuisance Wildlife Human development has altered the natural habitat of many wildlife species, restricting wildlife access to surface waters in some areas and promoting access in others. Minimizing the impact of wildlife on water quality generally requires either reducing the concentration of wildlife in an area or reducing their proximity to a waterbody. In areas where wildlife are observed to be a large source of nutrient contamination, a program of repelling wildlife from surface waters (also called harassment programs) may be implemented. These programs often involve the use of scarecrows, kites, a daily human presence, or modification of habitat to reduce attractiveness of an at-risk
Connecticut Statewide Lake Nutrient TMDL
66
area. Providing closed trash cans near waterbodies, as well as discouraging wildlife from entering surface waters by installing fences, pruning trees, or making other changes to landscaping, can reduce impacts to water quality.
Canada geese are an increasing urban nuisance in office parks, recreation areas, residential areas, and golf courses. Studies have correlated the amount of developed land to the number of geese, particularly land use defined as turf grass or lawns at open fields and parks. The goal of goose management is to reduce goose populations and protect property, water quality, and aesthetics. The CT DEEP Wildlife Division identifies two primary methods of goose management that municipalities can adopt and include non-lethal and lethal forms of control.
Non-lethal Goose Population Controls • Promote widespread education of goose management to public and recommend that residents do not
feed waterfowl; and • Develop a hazing program that discourages waterfowl from certain areas and forces waterfowl to areas
with greater predation. Techniques include the use of chemical repellents, dogs, fencing, reflective tape, balloons, and noisemakers. A survey of municipalities with a goose management program indicated that dog services were the most effective at hazing geese.
Lethal Goose Population Controls • Regulate sport hunting during non-migratory season; • Register citizens to remove Canada goose nests from March – June; • Conduct egg addling (eggs temporarily removed from nest, rendered nonviable, then returned to nest) by
certified professionals only; and • Trap and cull or euthanize geese (most controversial control mechanism) by certified professionals only.
Wildlife Resources
• CT DEEP Wildlife Division. The Wildlife Division offers links to wildlife publications related to fisheries, endangered species, and mosquito management.
• EPA Source Water Protection Practices Bulletin. Managing Pet and Wildlife Waste to Prevent Contamination of Drinking Water (EPA 2001b).
6.9. Boats and Marinas A sample list of BMPs for boats and marinas is presented below.
• Target outreach to marina owners, boat dealers, and their consumers regarding State and EPA requirements; and
• Encourage marina owners to provide clean and safe onshore restrooms and pump-out facilities; • Provide an appropriate location for boat washing; • Do not allow waste from the pump-out stations to drain directly into receiving waters; • Consider alternatives to asphalt for parking lots and vessel storage areas such as permeable pavement; • Install infiltration trenches at the leading edge of a boat ramp to catch pollutants in an oil absorbent
barrier or crushed stone before discharge; • Install vegetated buffers between surface waters and upland areas; and • Protect storm drains with filters or oil-grit separators. Stencil words (such as “Drains to the River”) on
storm drains to alert customers and visitors that storm drains lead directly to waterbodies without treatment. Contact the municipal public works department before stenciling any drain.
Connecticut Statewide Lake Nutrient TMDL
67
Boats and Marinas Resources
• Connecticut’s Clean Vessel Act Program. The Connecticut Clean Vessel Act Program works to secure a healthy aquatic environment by preventing improper sewage disposal by recreational boats.
• Connecticut’s Pump-out Services Directory. Pump-out facilities or pump-out boats are offered in many Connecticut boating locations. Pump-out services are free to utilize by boat owners.
• A Guidebook for Marina Owners and Operators for the Installation and Operation of Sewage Pump-out and Dumping Stations. The purpose of this guidebook is to provide marina owners and operators with general information on the design, construction, operation, and maintenance of marine sewage pump-out facilities and dump stations.
7. Funding and Community Resources Funding assistance for nutrient pollutant mitigation and other watershed management projects is available from various governmental and private sources. This section provides an overview and contact information for financial assistance programs offered by the State of Connecticut and others. Information here is subject to change, so please contact the appropriate agency to learn more about the programs.
7.1. Water Quality Grants
Long Island Sound Research Grant Program
The Long Island Sound Research Grant offers support for scientific pursuit that will increase understanding of ecological processes of Long Island Sound. The information obtained through funded research must be directly applicable to managing Long Island Sound natural resources.
Eligible applicants: In-State academic institutions Contact: Harry Yamalis, Land and Water Resources Division, Bureau of Water Protection and Land Reuse, CT DEEP, 79 Elm Street, Hartford, CT 06106, (860) 424-3034
Section 319 NPS Grants
Congress enacted Section 319 of the CWA in 1987 establishing a national program to abate NPS pollution. These grants, known as Section 319 Grants, are made possible by the federal funds provided to CT DEEP by the EPA, and may be available to assist in the implementation of projects to promote restoration of water quality by reducing and managing NPS pollution in Connecticut waters.
Eligible applicants: Municipalities, other governmental agencies and non-profit organizations, schools, and universities Contact: Erik Bedan Watershed Section, Bureau of Water Protection and Land Reuse, CT DEEP, 79 Elm Street, Hartford, CT 06106, or [email protected]
CT DEEP Coastal Habitat Restoration Program
The CT DEEP Coastal Habitat Restoration Program funds restoration projects around tidal wetlands, coves and embayments, riverine migratory corridors, and coastal barrier beaches. The riverine corridors category includes re-vegetation, erosion, and sedimentation controls for inland waters that are useful to protecting lakes from further cultural eutrophication.
Eligible applicants: any individual, agency, or private organization
Connecticut Statewide Lake Nutrient TMDL
68
Contact: Land and Water Resources Division, Bureau of Water Protection and Land Reuse, CT DEEP, 79 Elm Street, Hartford, CT 06106, (860) 424-3019
NFWF Long Island Sound Futures Fund
The Long Island Sound Futures Fund (LISFF) supports projects that restore and protect the health and living resources of Long Island Sound and its coastal watersheds. Projects focus on habitat restoration, water quality improvement, watershed management plan development and public awareness of water resource issues. LISFF considers funding for upland water quality improvement projects that reduce nutrients to LIS. Funding is provided by EPA, U.S. Fish and Wildlife Service, and the National Fish and Wildlife Foundation (NFWF).
Eligible applicants: State and local governments, non-profit organizations, for-profit entities, educational institutions, and interstate entities or regional water pollution control agencies
Contact: Lynn Dwyer, NFWF, Eastern Partnership Office, 1133 Fifteenth St., N.W., Ste 1100, Washington, D.C., 20005, (631) 627-3488. [email protected]
NRCS Wildlife Habitat Incentive Program (WHIP)
WHIP offers funding for development and improvement of fish and wildlife habitat on private land. NRCS provides technical assistance and up to 75% of the cost-share assistance.
Eligible Applicants: private landowners
Contact: Joyce Purcell, Assistant State Conservationist-Programs/RCPP Coordinator, (860)-871-4028, [email protected]
CT DEEP Recreation and Natural Heritage Trust Program
This is the CT DEEP’s primary program for acquiring land to expand the State’s system of parks, forests, wildlife, and other natural open spaces. The program focuses on land in CT that represents the ecological and cultural diversity of the State, including rivers, mountains, rare natural communities, scenic qualities, historic significance, connections to other protected land, and access to water.
Eligible Applicants: landowners willing to sell their land now or for a future sale or donation of the property
Contact: Matt Starr, CT DEEP Division of Land Acquisitions and Management, 79 Elm Street, Hartford, CT 06106, (860) 424-3080
CT DEEP Section 6217 Coastal Nonpoint Pollution
Section 6217 of the Coastal Zone Act Reauthorization Amendments of 1990 requires the State of Connecticut to control NPS pollution in coastal waters. There are six major nonpoint pollution categories covered: agriculture, forestry, urban sources, marinas and recreational boating, hydromodifications, and wetlands and riparian areas. The Coastal Nonpoint Program Management Areas associated with this program extend well inland, with a map and list of municipalities.
Eligible Applicants: Connecticut municipalities in coastal nonpoint program management areas
Contact: CT DEEP, 79 Elm Street, Hartford, CT 06106, (860) 424-3000
CT DEEP Open Space and Watershed Land Acquisition Grant Program
This program offers funding to towns or organizations for the purchase of land that is valuable for recreation, forestry, fishing, and conservation of wildlife and natural resources.
Eligible applicants: municipalities, non-profit land conservation organizations, and water companies
Connecticut Statewide Lake Nutrient TMDL
69
Contact: Allyson Clarke, Office of Constituent Affairs and Land Management, 79 Elm Street, Hartford, CT 06106, (860) 424-3016
STEAP - Small Town Economic Assistance Program (CGS Section 4-66g)
STEAP provides grants for environmental protection, economic development, community conservation, and quality-of-life capital projects for localities that are ineligible to receive Urban Action (CGS Section 4-66c) bonds.
Eligible applicants: certain smaller municipalities
Contact: Martin Heft at (860) 418-6355 or Kathleen Taylor at (860) 418-6379, CT Office of Policy and Management 450 Capitol Avenue, Hartford, CT 06106
Connecticut Society for Women Environmental Professionals
The Grant Program provided by the Connecticut Society for Women Environmental Professionals provides funding for projects benefiting the environment.
Eligible applicants: not specified
Contact: Kathie Cyr at [email protected]
Environmental Professionals Organization of Connecticut (EPOC)
The EPOC Grant Program offers funds for local projects that benefit the environment. Projects may include the improvement of the environment through “property and watershed clean-ups, reforestation efforts, biodiversity projects, streamside buffer restoration projects, and hazardous waste collection efforts.” Proposals with environmental education and/or environmental monitoring of watersheds or ecosystems are also welcomed.
Eligible applicants: non-profit and not-for-profit environmental advocacy groups, community-based groups, and environmental education organizations
Contact: Seth Molofsky, Executive Director, [email protected], (860) 537-0337P.O. Box 176, Amston, CT 06231-0176
7.2. Infrastructure Grants National Recreational Trails Program
The National Recreational Trails Program is administered by the CT DEEP for the U.S. Department of Transportation’s Federal Highway Administration. This fund supports construction of new trails, maintenance and restoration of existing trails, disability access to trails, purchase of trail construction equipment, and purchase of land for trails. Trail maintenance can prevent erosion and sedimentation, a major source of nutrient pollution to lakes and tributary streams. Availability of grants is dependent on funding of the program.
Eligibility: non-profit organizations, municipalities, State departments
Contact: Laurie Giannotti, Trails & Greenways Program Coordinator, CT DEEP, 79 Elm Street, Hartford, CT 06106, (860) 424-3578, [email protected]
CT OPM Small Town Economic Assistance Program (STEAP)
The Small Town Economic Assistance Program (STEAP) funds economic development, community conservation, and quality of life projects for localities that are ineligible to receive Urban Action (CGS Section 4-66c) bonds. This
Connecticut Statewide Lake Nutrient TMDL
70
program covers development projects involving economic and community development, transportation, environmental protection, public safety, children and families, and social service programs.
Eligible applicants: municipalities that are not designated as a distressed municipality or public investment community, and the State Plan of Conservation Development does not show them as having a regional center
Contact: Kathleen Taylor, Office of Policy and Management, CT DEEP, 79 Elm Street, Hartford, CT 06106, (860) 418-6379. [email protected]
Connecticut DPH Source Water Assessment and Protection
The Connecticut DPH Source Protection and Assessment Unit offers a range of programs and support to protect surface and ground water drinking water supply sources.
Eligible applicants: Community and non-profit public water systems (PWSs)
Connecticut Community Development Program Block Grants
The Connecticut Community Development Block Grant (CDBG) Program, also known as the Small Cities Program, is funded through the Department of Housing and Urban Development as part of the federal Community Development Block Grant program. It provides grants for a wide range of assistance projects for low- and moderate-income communities with populations of less than 50,000. These projects include improvements to water, sewer, and roads serving economic development and housing.
Eligible applicants: Any Connecticut town, city, or incorporated village chartered to function as a general purpose unit of local government. Most projects are a coordinated effort between the municipalities, community groups, and local or State non-profit organizations.
Contact: Dimple Desai, Community Development Director, Department of Housing. 505 Hudson St, Hartford, CT 06106, (860) 270-8012.
USDA Rural Utilities Service Water and Environmental Programs
The USDA Rural Utilities Service Water and Environmental Programs (WEP) program supports community development projects in communities of less than 10,000 people. Eligible projects include water improvements (source, storage, distribution, treatment), sanitary sewer (collection, treatment, combine sewer separation, storm sewers), solid waste disposal (transfer station, incinerator), new systems, renovations, expansions, purchase of an existing system, or “buy-in” fees to existing systems.
Eligible applicants: An eligible applicant can be a public body (town, village, special purpose district) or a non-profit association serving a community with a population of less than 10,000 people. Applicants must also show that they are unable to afford commercial credit.
Contact: See local area contact here.
7.3. Agricultural Grants Connecticut Conservation Stewardship Program
NRCS in Connecticut provides funding for landowners with agricultural land and forest land to address natural resource conservation and management activities on their properties through the Connecticut Conservation Stewardship Program.
Eligible applicants: private landowners of agricultural land and non-industrial private forest land
Connecticut Statewide Lake Nutrient TMDL
71
Contact: Joyce Purcell, Assistant State Conservationist, (860) 871-4028 or local NRCS field office
Farms, Forest and Open Space Property Tax Benefits
Under Connecticut Public Act 490, all farm, forest, and open space land can apply for a use value assessment that may lower property taxes for the landowner.
Eligible applicants: landowners with farm, forest, or open space land must apply at their local tax assessor’s office. Landowners with designated forest land must have an area totaling 25 acres or more in parcels no smaller than 10 acres.
Contact: local tax assessor’s office
US Department of Agriculture NRCS Environmental Quality Incentives Program (EQIP)
This program is a voluntary conservation grant program designed to promote and stimulate innovative approaches to environmental enhancement and protection, while improving agricultural production. Through EQIP, farmers, and forestland managers may receive financial and technical help to install or implement structural and management conservation practices on eligible agricultural and forest land. EQIP provides for additional funding specifically to promote ground and surface water conservation activities to improve irrigation systems; to convert to the production of less water intensive agricultural commodities; to improve water storage through measures such as water banking and groundwater recharge; or to institute other measures that improve groundwater and surface water conservation. EQIP payment rates may cover up to 75% of the costs of installing certain conservation practices.
Eligible applicants: Any person engaged in livestock, agricultural production, aquaculture, or forestry on eligible land.
Contact: Joyce Purcell, Assistant State Conservationist, (860) 871-4028 or local NRCS field office
7.4. Boating Grants Clean Vessel Act Grants
The Federal Clean Vessel Act (CVA) was established in 1992 to protect waters and associated recreational opportunities from damaging vessel sewage discharges. Projects proposed for the construction, renovation, operation, or maintenance of pump-out stations, pump-out boats, and dump stations used by boaters are all eligible to receive federal funding. This money can also be used to pay for projects that hold and transport boater sewage to sewage treatment plants, such as holding tanks, piping, or hauling and disposal fees. Approved projects are given funding for up to 75% of the total cost of the project.
Eligible applicants: Any public/private marina, boatyard, shipyard, or State/county/municipal organization wishing to install or significantly upgrade their pump-out station and make it available to all boaters is eligible for grant funding.
Contact: Kate Hughes Brown, Office of Long Island Sound Program, 79 Elm Street, Hartford, CT 06106, (860) 424-3652. Submit applications to Bureau of Outdoor Recreation, CT DEEP, 79 Elm Street, 6th floor, Hartford, CT 06106, Attn: Sara Ganzer.
7.5. Additional Resources U.S. Environmental Protection Agency (EPA)
The EPA recognizes that committed watershed organizations and State and local governments need adequate resources to achieve the goals of the CWA and improve our nation’s water quality. To this end, the EPA has created
Connecticut Statewide Lake Nutrient TMDL
72
the following website to provide tools, databases, and information about sources of funding to practitioners and funders that serve to protect watersheds:
U.S. Department of Agriculture (USDA)
The USDA offers several potential sources of funding for the protection, restoration, and stewardship of our water resources, including the USFS Landscape Scale Restoration Grants, the Watershed and Flood Prevention Operations Program, and the Water Resources Program.
National Oceanic and Atmospheric Administration (NOAA)
NOAA’s Office of Ocean and Coastal Resource Management offers several options in protecting coastal resources.
Connecticut Statewide Lake Nutrient TMDL
73
8. References AECOM (2009). LLRM Lake Loading Response Model Users Guide and Quality Assurance Project Plan AECOM,
Willington CT.
American Rivers (2016). Reconnecting Rivers to Floodplains. Spring 2016. https://www.americanrivers.org/wp-content/uploads/2016/06/ReconnectingFloodplains_WP_Final.pdf.
Bledzki, L. A., Bubier, J. L., Moulton, L. A., & Kyker-Snowman, T. D. (2010). Downstream effects of beaver ponds on the water quality of New England first‐ and second‐order streams. Ecohydrology, 698-707. Retrieved from https://onlinelibrary.wiley.com/doi/abs/10.1002/eco.163
Brown, E., Caraco, D., Pitt, R. (2004). Illicit Discharge Detection and Elimination: A Guidance Manual for Program Development and Technical Assessments. Center for Watershed Protection, Ellicott City, MD & University of Alabama, Tuscaloosa, AL. Available online at: https://www3.epa.gov/npdes/pubs/idde_manualwithappendices.pdf
Choi, R. T., Beard, K. H., Kelsey, K. C., Leffler, A. J., Schmutz, J. A., & Welker, J. M. (2020). Early Goose Arrival Increases Soil Nitrogen Availability More Than an Advancing Spring in Coastal Western Alaska. Ecosystems, 23, 1309-1324. Retrieved from https://link.springer.com/article/10.1007/s10021-019-00472-9
Cottingham, K.L., Ewing, H.A., Greer, M.L., Carey, C.C., Weathers, K.C. (2015). Cyanobacteria as biological drivers of lake nitrogen and phosphorus cycling. Ecosphere 6(1):1. https://doi.org/10.1890/ES14-00174.1
CT DEEP (1996a). Caring for Our Lakes: Watershed and In-Lake Management for Connecticut Lakes. https://portal.ct.gov/-/media/DEEP/water/lakes/CaringforOurLakespdf.pdf
CT DEEP (2000). Lake Waramaug Watershed Agricultural Waste Management System, part of CT DEEP Success Stories. Connecticut Department of Energy & Environmental Protection. August 2000. Available online at: https://portal.ct.gov/-/media/DEEP/water/nps/success_stories/lkwarapdf.pdf
CT DEEP (2004). 2004 Connecticut Stormwater Quality Manual. Connecticut Department of Energy & Environmental Protection. https://portal.ct.gov/DEEP/Water-Regulating-and-Discharges/Stormwater/Stormwater-Manual
CT DEEP (2007). Guideline for Municipal Management Practices for Street Sweepings & Catch Basin Cleanings. Connecticut Department of Energy & Environmental Protection. Available online at: https://portal.ct.gov/-/media/DEEP/waste_management_and_disposal/solid_waste/streetsweepingspdf.pdf
CT DEEP (2008). Pollution Prevent View: Give a Bark for Clean State Park. A Newsletter from the Connecticut Department of Environmental Protection. Fall 2008. P2 View, 8 (4). Available online at: https://portal.ct.gov/-/media/DEEP/water/nps/2019ctdeepnpsplanpdf.pdf
CT DEEP (2010). Managing Surplus Manure: Laurelbrook Farm & Freund’s Farm. Connecticut Department of Energy & Environmental Protection. Available online at: https://portal.ct.gov/-/media/DEEP/water/tmdl/CTFinalTMDL/blackberryriver6100
CT DEEP (2015a). Ambient Water Quality Monitoring Program Strategy 2015-2024. Connecticut Department of Energy & Environmental Protection. Available online at: https://portal.ct.gov/-/media/DEEP/water/water_quality_management/monitoringpubs/monstrategy20152024finalpdf.pdf
CT DEEP (2015b). Regulations of Connecticut State Agencies, Title 22a. Environmental Protection. Connecticut Water Quality Standards, § § 22a-426-1 – 22a-426-9. Revised 2015-11-21. Available online at:
Connecticut Statewide Lake Nutrient TMDL
74
https://eregulations.ct.gov/eRegsPortal/Browse/getDocument?guid={C0A3E155-0100-C1CF-85C3-D3C28F298640}
CT DEEP (2016). General Permit for the Discharge of Stormwater from Small Municipal Separate Storm Sewer Systems, Issued January 20, 2016, Effective July 1, 2017, DEEP-WPED-GP-021. Connecticut Department of Energy & Environmental Protection, Bureau of Materials Management & Compliance Assurance, Water Permitting & Enforcement Division. Available online at: https://portal.ct.gov/-/media/DEEP/Permits_and_Licenses/Water_Discharge_General_Permits/MS4gppdf.pdf
CT DEEP (2017). Recommendations for Phosphorus Strategy Pursuant to PA 12-155 Final Report, February 16, 2017. Coordinating Committee – Phosphorus Reduction Strategy, Connecticut Department of Energy & Environmental Protection. Available online at: https://portal.ct.gov/DEEP/Water/Water-Quality/-/media/DEEP/water/water_quality_standards/p/PA12155FullCCreportpdf.pdf?la=en&hash=BD60BF6C14C1C398205DA30F17CB1FB3
CT DEEP (2018). MS4 Municipalities Active Registrations, 2/5/2018. Connecticut Department of Energy & Environmental Protection. Available online at: https://portal.ct.gov/-/media/DEEP/water_regulating_and_discharges/stormwater/municipal/180223MS4MunicipalitiesFeb2018pdf.pdf
CT DEEP (2019a). Connecticut's Clean Water Fund. Connecticut Department of Energy & Environmental Protection, Bureau of Water Protection and Land Reuse, Clean Water Fund Management Office. Accessed November 2019. https://portal.ct.gov/DEEP/Municipal-Wastewater/Financial-Assistance-for-Municipal-Wastewater-Projects
CT DEEP (2019b). Stormwater Management Program. Connecticut Department of Energy & Environmental Protection. Accessed November 2019. https://portal.ct.gov/DEEP/Water-Regulating-and-Discharges/Stormwater/Stormwater-Management
CT DEEP (2019c). General Permit for the Discharge of Stormwater Associated with Industrial Activity. Connecticut Department of Energy & Environmental Protection, Bureau of Materials Management & Compliance Assurance, Water Permitting & Enforcement Division. Effective October 1, 2019: DEEP-WPED-GP-014. Available online at: https://portal.ct.gov/-/media/DEEP/Permits_and_Licenses/Water_Discharge_General_Permits/stormindustgppdf.pdf
CT DEEP (2019d). General Permit for the Discharge of Stormwater and Dewatering Wastewaters from Construction Activities. Connecticut Department of Energy & Environmental Protection. Effective October 1, 2019, DEEP-WPED-GP-015. Available online at: https://portal.ct.gov/-/media/DEEP/Permits_and_Licenses/Water_Discharge_General_Permits/stormconstgppdf.pdf
CT DEEP (2019e). Bureau of Water Protection and Land Reuse Green Infrastructure and Low Impact Development Resources for Municipalities. Connecticut Department of Energy & Environmental Protection. Available online at: https://portal.ct.gov/-/media/DEEP/water/watershed_management/wm_plans/LID/lidresourcespdf.pdf?la=en
CT DEEP (2020a). General Permit for the Discharge of Stormwater Associated with Commercial Activity. Connecticut Department of Energy & Environmental Protection. Issued on September 10, 2020, DEEP-PED-GP-004. Available online at: https://portal.ct.gov/-/media/DEEP/Permits_and_Licenses/Water_Discharge_General_Permits/stormcommgppdf.pdf
Connecticut Statewide Lake Nutrient TMDL
75
CT DEEP (2020b). 2020 Integrated Water Quality Report, September 2020. https://portal.ct.gov/DEEP/Water/Water-Quality/Water-Quality-305b-Report-to-Congress
CT DEEP, NRCS & CT CSWC (1996). Manual of Best Management Practices for Agriculture: Guidelines for Protecting Connecticut’s Water Resources. 1993 (Revised 1996). Connecticut Department of Energy & Environmental Protection, USDA Natural Resources Conservation Service, and the Connecticut Council on Soil and Water Conservation. Available online at: https://portal.ct.gov/-/media/DEEP/aquifer_protection/BMPsagriculturepdf.pdf
CT DPH (2019). Cyanobacteria Blooms in Recreational Freshwaters: Guidance for Local Health Departments, June 2019. https://portal.ct.gov/-/media/Departments-and-Agencies/DPH/dph/environmental_health/BEACH/Blue-Green-AlgaeBlooms_June2019_FINAL.pdf
CT FB (2009). The Changing Face of Connecticut Agriculture. Connecticut Farm Bureau. Available online at: https://portal.ct.gov/-/media/DEEP/water/wetlands/seg32009changingfacejnpdf.pdf
CTSWCS (2002). 2002 Connecticut Guidelines for Soil Erosion and Sediment Control. Connecticut Council on Soil and Water Conservation. DEP Bulletin 34. ISBN 0-942085-10-8. https://portal.ct.gov/DEEP/Water/Soil-Erosion-and-Sediment-Control-Guidelines/Guidelines-for-Soil-Erosion-and-Sediment-Control
CWP (1999). Watershed Protection Techniques. Center for Watershed Protection, Vol. 3, No. 1.
Dennis, J., J. Noel, D. Miller, C. Elliot, M.E. Dennis, and C. Kuhns. (1992). Phosphorus Control in Lake Watersheds: A Technical Guide to Evaluating New Development. Maine Department of Environmental Protection, Augusta, Maine.
Dolman, A.M., Rucker, J., Pick, F.R., Fastner, J., Rohrlack, T., et al. (2012). Cyanobacteria and Cyanotoxins: The Influence of Nitrogen versus Phosphorus. PLoS ONE 7(6): e38757. doi:10.1371/journal.pone.0038757
ECCD (2015). 2015 Amos Lake Abbreviated Watershed-Based Plan. Eastern Connecticut Conservation District. https://portal.ct.gov/-/media/DEEP/water/watershed_management/wm_plans/amoslakewbpeccdpdf.pdf
EPA (1994). National Pollutant Discharge Elimination System (NPDES) Combined Sewer Overflows Control Policy. United States Environmental Protection Agency. 59 Fed. Reg. 18688. Online: https://www.epa.gov/sites/production/files/2015-10/documents/owm0111.pdf.
EPA (1995). Combined Sewer Overflows: Guidance for Nine Minimum Controls. United States Environmental Protection Agency. EPA/832/B-95/003. Available online at: https://www.epa.gov/sites/production/files/2015-10/documents/owm0030_2.pdf
EPA (1999a). Combined Sewer Overflow Management Fact Sheet: Sewer Separation. United States Environmental Protection Agency. September 1999. EPA 832-F-99-041. Available online at: https://www3.epa.gov/npdes/pubs/sepa.pdf
EPA (1999b). Protocol for Developing Nutrient TMDLs. United States Environmental Protection Agency. November 1999. EPA 841-B-99-007. Available online at: http://nepis.epa.gov/Exe/ZyPDF.cgi/20004PB2.PDF?Dockey=20004PB2.PDF
EPA (2001a). Guidance: Coordinating CSO Long-Term Planning with Water Quality Standards Review. July 2001. United States Environmental Protection Agency. EPA/833/R-01/002. Available online at: https://www.epa.gov/sites/production/files/2015-10/documents/wqs_guide_final_0.pdf
Connecticut Statewide Lake Nutrient TMDL
76
EPA (2001b). Managing Pet and Wildlife Waste to Prevent Contamination of Drinking Water. Source Water Protection Practices Bulletin. July 2001. United State Environmental Protection Agency. EPA 916-F-01-027. Available online at: https://nepis.epa.gov/Exe/ZyPDF.cgi/901V1N00.PDF?Dockey=901V1N00.PDF
EPA (2002). EPA Onsite Wastewater Treatment Systems Manual, February 2002. EPA/625/R-00/008. https://www.epa.gov/sites/production/files/2015-06/documents/2004_07_07_septics_septic_2002_osdm_all.pdf
EPA (2003). Voluntary National Guidelines for Management of Onsite and Clustered (Decentralized) Wastewater Treatment Systems. United States Environmental Protection Agency. March 2003. EPA 832-B-03-001. Available online at: https://nepis.epa.gov/Exe/ZyPDF.cgi/20009NAM.PDF?Dockey=20009NAM.PDF
EPA (2005a). Homeowner Guide: Your Septic System is Your Responsibility. United States Environmental Protection Agency. December 2002 (revised March 2005). EPA 832-B-02-005. Available online at: https://www3.epa.gov/npdes/pubs/homeowner_guide_long.pdf
EPA (2005b). Stormwater Phase II Final Rule: IDDE Minimum Control Measure Fact Sheet 2.5. United States Environmental Protection Agency. January 2000 (revised December 2005). EPA 833-F-00-007. Available online at: https://www3.epa.gov/npdes/pubs/fact2-5.pdf
EPA (2005c). Handbook for Managing Onsite and Clustered (Decentralized Wastewater Treatment Systems: An Introduction to Management Tools and Information for Implementing EPA’s Management Guidelines. United States Environmental Protection Agency. December 2005. EPA 832-B-05-001. Available online at: https://nepis.epa.gov/Exe/ZyPDF.cgi/20017K2G.PDF?Dockey=20017K2G.PDF
EPA (2005d). National Management Measures to Control Nonpoint Source Pollution from Urban Areas. United States Environmental Protection Agency. November 2005. EPA 841-B-05-004. Available online at: https://www.epa.gov/sites/production/files/2015-09/documents/urban_guidance_0.pdf
EPA (2008). Handbook for Developing Watershed Plans to Restore and Protect Our Waters. March 2008. United States Environmental Protection Agency. EPA 841-B-08-002. http://www.epa.gov/owow/nps/watershed_handbook
EPA (2013). A Quick Guide to Developing Watershed Plans to Restore and Protect Our Waters. May 2013. United States Environmental Protection Agency. EPA 841-R-13-003. https://www.epa.gov/sites/production/files/2015-12/documents/watershed_mgmnt_quick_guide.pdf
EPA (2015). Preventing Eutrophication: Scientific Support for Dual Nutrient Criteria, EPA - 820-S-15-001.
Fuss & O’Neill (2010). Technical Memorandum 2 Evaluating the Role of Stormwater Utility Districts in the Implementation of Low Impact Development. Partners for the Connecticut Low Impact Development and Stormwater General Permit Evaluation, Connecticut. August 2010.
Fuss & O’Neill (2011). Low Impact Development Appendix to the Connecticut Stormwater Quality Manual. Partners for the Connecticut Low Impact Development and Stormwater General Permit Evaluation, Connecticut. August 2011. https://portal.ct.gov/-/media/DEEP/water/nps/swgp/lidapdxctstormwatermanualpdf.pdf
HEAP (2011). Good Horse Keeping: Best Practices Manual for Protecting the Environment. Horse Environmental Awareness Program. Available online at: http://www.townofcantonct.org/filestorage/19342/Good_Horse_Keeping.pdf
Connecticut Statewide Lake Nutrient TMDL
77
Hollister, J. W., Milstead, W. B., and Kreakie, B. J. (2016). Modeling lake trophic state: a random forest approach. Ecosphere 7(3):e01321. 10.1002/ecs2.1321
HWG & FBE (2020). Generic Secondary Data Quality Assurance Project Plan for the Connecticut Statewide Lake Nutrient Total Maximum Daily Load. Prepared by Horsley Witten Group and FB Environmental Associates for the United States Environmental Protection Agency, February 2020.
Mariash, H. L., Rautio, M., Mallory, M., & Smith, P. (2019). Experimental tests of water chemistry response to ornithological eutrophication: biological implications in Arctic freshwaters. Biogeosciences, 4719-4730. Retrieved from https://search.proquest.com/openview/4f008318d39b55648830d53e4a366062/1?pq-origsite=gscholar&cbl=105740
NEIWPCC (2003). Illicit Discharge Detection and Elimination Manual: A Handbook for Municipalities. January 2003. New England Interstate Water Pollution Control Commission. Online: http://www.neiwpcc.org/neiwpcc_docs/iddmanual.pdf
New England Environmental Finance Center (n.d.). Selected LID Projects in New England. University of Southern Maine, Muskie School of Public Service. Available online at: http://efc.muskie.usm.maine.edu/docs/Selected_LID_Projects.pdf
Nurnberg, G.K. (1996). Trophic State of Clear and Colored, Soft and Hardwater lakes with Special Consideration of Nutrients, Anoxia, Phytoplankton and Fish. Journal of Lake and Reservoir Management 12(4):432-447.
Nurnberg, G.K. (1998). Prediction of annual and seasonal phosphorus concentrations in stratified and unstratified polymictic lakes. Limnology and Oceanography, 43(7), 1544-1552.
Olivero-Sheldon, A. and M.G. Anderson. (2016). Northeast Lake and Pond Classification. The Nature Conservancy, Eastern Conservation Science, Eastern Regional Office. Boston, MA.
Osgood, D. (2015). Do you want something that works? In North American Lake Management Society, Lakes Lake Line, 35(1), 8-16.
Otero, X. L., De La Peña-Lastra, S., Pérez-Alberti, A., Osorio Ferreira, T., & Huerta-Diaz, M. A. (2018). Seabird colonies as important global drivers in the nitrogen and phosphorus cycles. Nature Communications. Retrieved from https://www.nature.com/articles/s41467-017-02446-8
Staley, Z. R., He, D. D., Shum, P., Vender, R., & Edge, T. A. (2018). Foreshore beach sand as a reservoir and source of total phosphorus in Lake Ontario. Aquatic Ecosystem Health & Management, 268-275. Retrieved from https://www.tandfonline.com/doi/abs/10.1080/14634988.2018.1505353
State of Connecticut (2012). Substitute Senate Bill no. 440. Public Act No. 12-155, An Act Concerning Phosphorus Reduction in State Waters. Approved June 15, 2012 Available online at: https://www.cga.ct.gov/2012/ACT/PA/2012PA-00155-R00SB-00440-PA.htm
Taylor, Robert (1979) Connecticut Lakes Management Program Efforts published in Connecticut Institute of Water Resources Special Report 30 Proceedings: Lake Management Conference. https://opencommons.uconn.edu/cgi/viewcontent.cgi?article=1028&context=ctiwr_specreports
UConn (2017). Minimizing Pollution and Maximizing the Effectiveness of Lawn Fertilizer. University of Connecticut College of Agriculture, Health and Natural Resources, Nonpoint Education for Municipal Officials (NEMO), July 2017. Available online at: https://nemo.uconn.edu/publications/MS4/NEMO%20turf%20management.pdf
Connecticut Statewide Lake Nutrient TMDL
78
UNHSC (2019). BMP Performance Fact Sheets (rev_5-19), University of New Hampshire Stormwater Center. Online: https://www.unh.edu/unhsc/sites/default/files/media/ms4_permit_nomographs_sheet_final_2019.pdf
Walker, W.W. (1999). Simplified Procedures for Eutrophication Assessment & Prediction: User Manual. US Army Corps of Engineers Water Operations Technical Support Program, Instruction Report W-96-2, September 1996 (Updated April 1999). Online at: http://wwwalker.net/bathtub/Flux_Profile_Bathtub_DOS_1999.pdf
Walker, W.W. (2001). Quantifying Uncertainty in Phosphorus TMDLs for Lakes. NEIWPCC/EPA, Lowell, MA. http://www.wwwalker.net/pdf/lake_tmdl_www_march_2001.pdf
Walker, W.W. (2006). Simplified Procedures for Eutrophication Assessment & Prediction: BATHTUB Online user documentation, http://www.wwwalker.net/bathtub/help/bathtubWebMain.html
Water Environment & Reuse Foundation (2017). Final Report, International Stormwater BMP Database 2016 Summary Statistics. http://www.bmpdatabase.org/Docs/03-SW-1COh%20BMP%20Database%202016%20Summary%20Stats.pdf
Wright-Pierce (2005). Feasibility Study for Alternative Technologies and Utilization for Managing Dairy and Poultry Manure. Report submitted to the State of Connecticut Department of Environmental Protection, December 2005. Online: https://portal.ct.gov/-/media/DEEP/water_regulating_and_discharges/CAFO/070618CAFOFeasibilityStudyDec05pdf.pdf?la=en