concordance with dietary and lifestyle population goals for cancer prevention in dutch, scottish,...
TRANSCRIPT
Nutrition 26 (2010) 40–52
Applied nutritional investigation
Concordance with dietary and lifestyle population goals for cancer
prevention in Dutch, Scottish, Mexican, and Guatemalan
population samples
Marieke Vossenaar, Ph.D.a,c,*, Noel W. Solomons, M.D.a, Roxana Valdes-Ramos, Ph.D.b,y,and Annie S. Anderson, Ph.D.c
aCenter for Studies of Sensory Impairment, Aging and Metabolism (CeSSIAM), Guatemala City, GuatemalabInstıtuto de Perinatologıa, Mexico City, Mexico
cUniversity of Dundee, Dundee, Scotland
Manuscript received December 14, 2008; accepted April 12, 2009.
Abstract Objectives: We assessed concordance with selected population goal components of the 1997 World
www.nutritionjrnl.com
This study was s
American Institute for
tion, Akzo Nobel andyCurrent address: U
Mexico.
*Corresponding au
E-mail address: m
0899-9007/10/$ – see
doi:10.1016/j.nut.2009
Cancer Research Fund/American Institute for Cancer Research (WCRF/AICR) diet and lifestyle rec-
ommendations to decrease cancer risk across four population samples.
Methods: This was a prospectively designed survey examining concordance with the population
goals of the WCRF/AICR recommendations using target criteria across sites. Population samples
were from the Netherlands, Scotland, Mexico, and Guatemala. A total of 3564 men and women
aged 18 to 70 y were recruited in equal proportions by site and gender.
Results: None of the four pooled samples met the target population average criteria for body mass
index or refined sugar intake. The Guatemalan sample had concordance with the largest number of
recommended cancer-prevention goals (10 of 12 selected WCRF/AICR components). Successively,
Mexican, Scottish, and Dutch samples were concordant with seven, four, and three selected compo-
nents, respectively.
Conclusions: A prospectively designed research instrument and exhaustive prior examination of
operative criteria allow for the assessment of group-level concordance with cancer-prevention goals.
To the extent that the study samples reflect the respective national situations, geographic variance in
concordance exists, with conditions and behaviors in Guatemala bringing that nation into more general
compliance with the 1997 WCRF/AICR goals. � 2010 Elsevier Inc. All rights reserved.
Keywords: Dietary surveys; Food habits; Lifestyle habits; Cancer prevention
Introduction
The principal cause of morbidity and mortality in adults in
developed and developing countries is non-transmissible
chronic disease [1]. Cancers of diverse anatomic sites
represent the second most important cause of death among
chronic diseases and the second leading cause overall [2].
upported by the World Cancer Research Fund, the
Cancer Research, the International Nutrition Founda-
the Hildegard Grunow Foundation.
niversidad Autonoma del Estado de Mexico, Toluca,
thor. Tel/fax: þ502-2473-3942.
[email protected] (M. Vossenaar).
front matter � 2010 Elsevier Inc. All rights reserved.
.04.007
Following on the conjecture of Doll and Peto [3] that up to
30% of all cancers were preventable through the selection
of an appropriate diet, evidence continues to come forth
regarding the effects of protective or noxious substances in
the diet on the malignancy risk [4].
The World Cancer Research Fund (WCRF) and American
Institute for Cancer Research (AICR) took the lead in deriv-
ing practical program and policy guidance for the public from
the causal links between unhealthful diets and life pursuits
and cancer risk. A novel approach to weighing the published
evidence and providing guidance for public health was pro-
vided in the expert panel report, Diet, Nutrition and Preven-tion of Human Cancer: A Global Perspective in 1997 [4].
The report compiled a roster of 14 specific diet, activity,
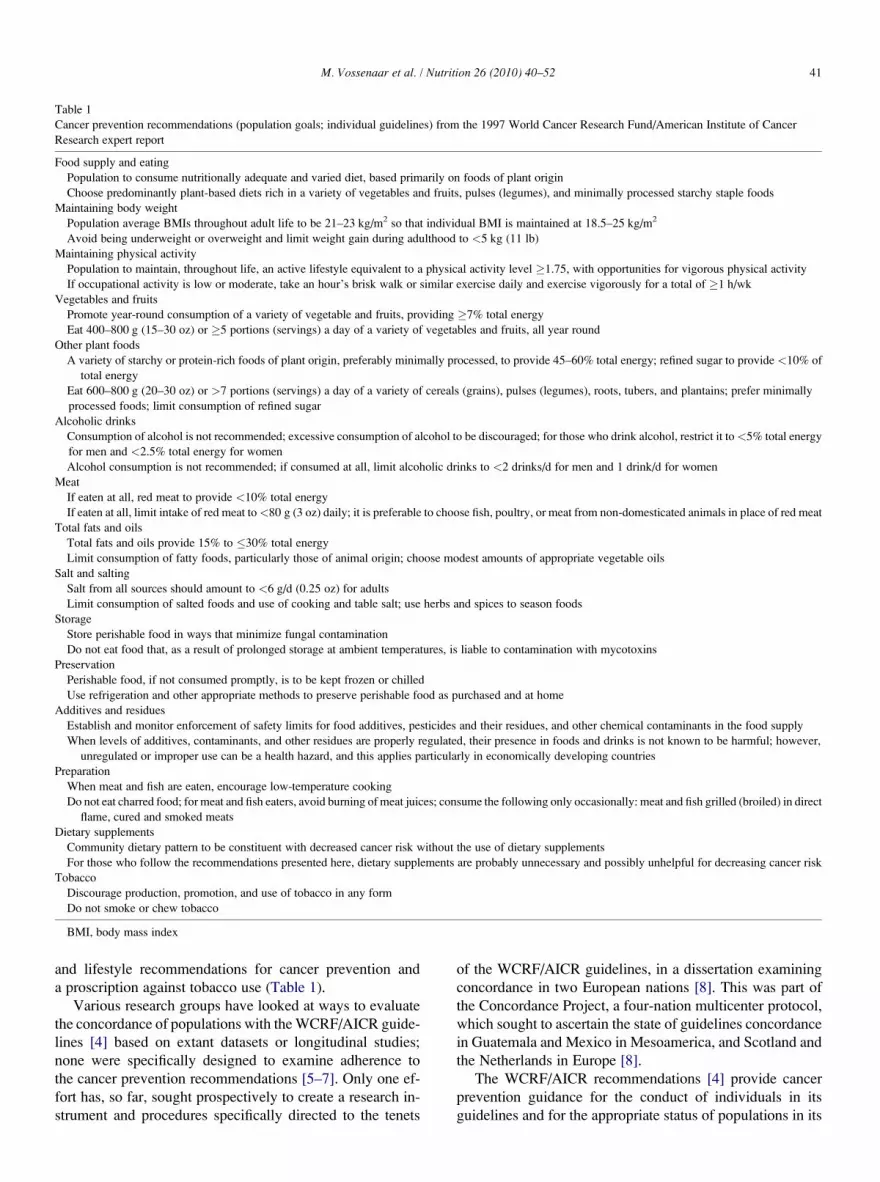
Table 1
Cancer prevention recommendations (population goals; individual guidelines) from the 1997 World Cancer Research Fund/American Institute of Cancer
Research expert report
Food supply and eating
Population to consume nutritionally adequate and varied diet, based primarily on foods of plant origin
Choose predominantly plant-based diets rich in a variety of vegetables and fruits, pulses (legumes), and minimally processed starchy staple foods
Maintaining body weight
Population average BMIs throughout adult life to be 21–23 kg/m2 so that individual BMI is maintained at 18.5–25 kg/m2
Avoid being underweight or overweight and limit weight gain during adulthood to <5 kg (11 lb)
Maintaining physical activity
Population to maintain, throughout life, an active lifestyle equivalent to a physical activity level �1.75, with opportunities for vigorous physical activity
If occupational activity is low or moderate, take an hour’s brisk walk or similar exercise daily and exercise vigorously for a total of �1 h/wk
Vegetables and fruits
Promote year-round consumption of a variety of vegetable and fruits, providing �7% total energy
Eat 400–800 g (15–30 oz) or �5 portions (servings) a day of a variety of vegetables and fruits, all year round
Other plant foods
A variety of starchy or protein-rich foods of plant origin, preferably minimally processed, to provide 45–60% total energy; refined sugar to provide <10% of
total energy
Eat 600–800 g (20–30 oz) or >7 portions (servings) a day of a variety of cereals (grains), pulses (legumes), roots, tubers, and plantains; prefer minimally
processed foods; limit consumption of refined sugar
Alcoholic drinks
Consumption of alcohol is not recommended; excessive consumption of alcohol to be discouraged; for those who drink alcohol, restrict it to<5% total energy
for men and <2.5% total energy for women
Alcohol consumption is not recommended; if consumed at all, limit alcoholic drinks to <2 drinks/d for men and 1 drink/d for women
Meat
If eaten at all, red meat to provide <10% total energy
If eaten at all, limit intake of red meat to<80 g (3 oz) daily; it is preferable to choose fish, poultry, or meat from non-domesticated animals in place of red meat
Total fats and oils
Total fats and oils provide 15% to �30% total energy
Limit consumption of fatty foods, particularly those of animal origin; choose modest amounts of appropriate vegetable oils
Salt and salting
Salt from all sources should amount to <6 g/d (0.25 oz) for adults
Limit consumption of salted foods and use of cooking and table salt; use herbs and spices to season foods
Storage
Store perishable food in ways that minimize fungal contamination
Do not eat food that, as a result of prolonged storage at ambient temperatures, is liable to contamination with mycotoxins
Preservation
Perishable food, if not consumed promptly, is to be kept frozen or chilled
Use refrigeration and other appropriate methods to preserve perishable food as purchased and at home
Additives and residues
Establish and monitor enforcement of safety limits for food additives, pesticides and their residues, and other chemical contaminants in the food supply
When levels of additives, contaminants, and other residues are properly regulated, their presence in foods and drinks is not known to be harmful; however,
unregulated or improper use can be a health hazard, and this applies particularly in economically developing countries
Preparation
When meat and fish are eaten, encourage low-temperature cooking
Do not eat charred food; for meat and fish eaters, avoid burning of meat juices; consume the following only occasionally: meat and fish grilled (broiled) in direct
flame, cured and smoked meats
Dietary supplements
Community dietary pattern to be constituent with decreased cancer risk without the use of dietary supplements
For those who follow the recommendations presented here, dietary supplements are probably unnecessary and possibly unhelpful for decreasing cancer risk
Tobacco
Discourage production, promotion, and use of tobacco in any form
Do not smoke or chew tobacco
BMI, body mass index
M. Vossenaar et al. / Nutrition 26 (2010) 40–52 41
and lifestyle recommendations for cancer prevention and
a proscription against tobacco use (Table 1).
Various research groups have looked at ways to evaluate
the concordance of populations with the WCRF/AICR guide-
lines [4] based on extant datasets or longitudinal studies;
none were specifically designed to examine adherence to
the cancer prevention recommendations [5–7]. Only one ef-
fort has, so far, sought prospectively to create a research in-
strument and procedures specifically directed to the tenets
of the WCRF/AICR guidelines, in a dissertation examining
concordance in two European nations [8]. This was part of
the Concordance Project, a four-nation multicenter protocol,
which sought to ascertain the state of guidelines concordance
in Guatemala and Mexico in Mesoamerica, and Scotland and
the Netherlands in Europe [8].
The WCRF/AICR recommendations [4] provide cancer
prevention guidance for the conduct of individuals in its
guidelines and for the appropriate status of populations in its
M. Vossenaar et al. / Nutrition 26 (2010) 40–5242
goals. Insights from Nishida et al. [9] in the preparation of the
Diet, Nutrition and the Prevention of Chronic Diseases report
[10] informed our postcollection analytical approach to as-
sessing concordance with group-level recommendations.
Moreover, the lessons learned to date from previous evalua-
tion efforts on concordance with WCRF/AICR guidelines
have been summarized by our group [11]. Insofar as different
dietary patterns associated with different cultural backgrounds
have been shown to modify the risk of certain chronic diseases
[12], a comparative focus is pertinent. We present a compara-
tive perspective across the four national sites and samples of
the Concordance Project of the classification of the popula-
tions as concordant or discordant with the population goals
of the 1997 expert panel report on cancer prevention [4].
Materials and methods
Population samples
Men and women aged 18 to 70 y from lower and higher so-
cioeconomic statuses (SESs) and living in urban and residential
areas across four nations were enrolled; the sites included the
Netherlands, Scotland, Mexico, and Guatemala. In the Nether-
lands, 1503 subjects who participated in the Health Examina-
tion Survey of the Risk Factors and Health (REGENBOOG)
project [13], under the auspices of the National Institute of
Public Health and the Environment in cooperation with Dutch
municipal health centers across the country, were invited to
participate. In Scotland, a sample of 2400 electoral roll names
and addresses in the districts of Tayside and Fife were selected
by a market research company, using social class, age, and
population density markers to obtain an appropriate sampling
frame. In Mexico, individuals were selected in a convenient
sampling area in Yucatan’s capital Merida and the surrounding
countryside to reach the desired number and age distribution. In
Guatemala, individuals were selected in a convenient sampling
area in Guatemala City and rural areas west of the city. In Mes-
oamerica, interviews were done door to door at convenient
times and with the people available in the home.
In each nation, the stratification was to select roughly
equal numbers of men and women and of residents of three
geographic areas (social classes). Subjects were recruited
on the basis of voluntary participation.
Ethical approval was obtained in the four nations. In the
Netherlands, formal permission to include the present survey
in the national health survey was obtained from the scientific
advisory group from the Dutch office of national statistics. In
Scotland, ethics approval came from the Tayside and the Fife
ethics committees. In Mexico, the research and ethics com-
mittee of the National Institute of Perinatology approved
the protocol for application. In Guatemala, the human sub-
jects committee of the Center for Studies of Sensory Impair-
ment, Aging and Metabolism (CeSSIAM) approved the
study protocol. All participants signed a written informed
consent form at the time of questionnaire completion.
Development of questionnaire instruments
Culturally sensitive, cancer-related Diet/Anthropometry/
Lifestyle Data Instruments (DALDI) were developed concur-
rently in the four nations. The tools were developed to assess
concordance with 11 of the 15 WCRF/AICR recommenda-
tions for the prevention of cancer in adult samples, as
described previously [11]. The examined behaviors included
total diet (comprising total energy, macronutrient, and spe-
cific micronutrient intakes), food preparation techniques
(such as charring of meat, temperature of cooking meat),
use of supplements, smoking habits, body weight history,
and physical activity.
Dietary intake
The European questionnaires were very similar across the
two sites. The Dutch dietary assessment tool comprised a 60-
item, semiquantitative food-frequency questionnaire (FFQ),
with additional open-ended questions: 45 on usual intake of
commonly consumed foods (such as potatoes and fruits) and
13 on type of foods preferred (such as type of bread). The Scot-
tish dietary assessment tool comprised a 107-item FFQ, with 34
additional, open-ended questions on usual intake of commonly
consumed foods and 8 queries on type of foods preferred. In
both DALDI, most food items included in the FFQ did not
include an indication of portion size. Some exceptions were
breakfast cereals (i.e., 1 bowl) and jam (i.e., 1 tsp). Most open-
ended questions queried portion size in household measure-
ments. Nearly all questions referred to the ’’usual’’ diet during
the previous 12 mo. On the one hand, total fruit and vegetable
(F&V) intake was estimated based on questions querying usual
consumption per week during the previous year (frequency of
intake and number of portions). On the other hand, F&V variety
was assessed as a function of the number of types consumed dur-
ing the previous week. Subjects were asked to select all types
consumed in the previous week from a predefined comprehen-
sive list of F&V commonly consumed in these populations.
For the Mesoamerican sites of Mexico and Guatemala, two
sets of dietary assessment tools were designed per nation, one
for the lower SES (urban and rural) and one for the higher SES
(urban). The Mexican dietary assessment tool for the lower
SES comprised a 158-item semiquantitative FFQ, whereas
the questionnaire for the higher SES was longer with 188-
items. A total of 155 items were food items listed in both ques-
tionnaires, whereas 33 items were listed only in the elite social
class and 3 only in the urban lower SES and rural social classes.
The Guatemalan dietary assessment tool for the lower SES con-
sisted of a 166-item semiquantitative FFQ. Eight additional
food items were included in the questionnaire for the higher
SES. For both Mesoamerican FFQs, the magnitude of con-
sumption was based on a 1-y time frame; for each item that
was affirmed as consumed, its frequency across a range of
options from ‘‘never’’ to ‘‘4–6 times per day’’ was assigned.
Most food items queried by means of FFQ included a portion
size in household measurements.
M. Vossenaar et al. / Nutrition 26 (2010) 40–52 43
The newly developed DALDI were pilot tested to assess
cognitive and practical issues such as ease of comprehension,
time needed to complete, and reliability. The Scottish dietary
assessment questionnaire was validated against 7-d weighed
diaries and 24-h urine collections for nitrogen, as described
by Vossenaar [8]. The methods used for subject recruitment
and the completion of food diaries are described in detail
elsewhere [14].
Body weight and height
Anthropometric data were obtained in different manners,
depending on the site. In Scotland, self-reported current
weight and height were queried. In the Netherlands and Gua-
temala, data were available on measured and self-reported
weights and heights (Vossenaar et al., in preparation). In
the Mexican sample, only directly measured data on weight
and height were collected. Trained staff measured body
weight and height, with participants wearing light indoor
clothing with emptied pockets and no shoes. Body weight
was measured to the nearest 100 g on calibrated scales. To
adjust for the weight of clothing, 1 kg was subtracted from
the measured body weight.
Other variables
A series of additional questions was included in the devel-
opment of the DALDI in domains; these included aspects
such as food preparation methods, use of dietary supple-
ments, use of tobacco, history of weight change, storage
and preservation of foods, and activities of daily living.
Data collection
To better account for seasonal variation, data were col-
lected during an entire calendar year. In Europe, all data col-
lection was done by means of postal, self-administered
questionnaires. In the Netherlands, part of the data for the
present study was collected during the home interview con-
ducted as part of the REGENBOOG health survey. The
data collected during this computerized face-to-face inter-
view, and used for the present study, included self-reported
sociodemographic factors, anthropometric measurements,
and physical activity. The methods used are described else-
where [13]. Subjects who agreed to participate in the dietary
survey were posted a study information sheet, an informed
consent form, a DALDI, and a stamped return envelope.
Questionnaires were posted shortly after recruitment on
a weekly basis. Data collection occurred from May 2001 to
May 2002. In Scotland, questionnaires were posted in six
batches at 2-mo intervals. Subjects from lower SES groups
were prospectively oversampled because their response rate
remained lower than that of subjects from higher SES groups.
In Mexico, four previously trained nutrition undergradu-
ate students conducted all interviews face-to-face, whereas
in Guatemala, face-to-face interviews were used only in rural
and lower SES urban areas. In higher SES urban areas, data
collection was done predominantly by means of face-to-face
interviews (n¼ 184), but also by means of postal question-
naires (n¼ 90) due to lower response rates.
The overall response rates were 85% in the Netherlands,
48% in Scotland, and above 95% in Guatemala and Mexico.
Exclusion criteria included age older than 70 y, pregnancy, or
lactation in the first 6 mo. Subjects with incomplete question-
naires were excluded from analysis for the variables depen-
dent on the missing data. The number of incomplete
questionnaires was minimal in all samples. Missing data
were the greatest in the Netherlands because no follow-up
was possible, but still fewer than 5%. In Scotland most miss-
ing data were completed by means of a telephone follow-up
interview when necessary. In Mesoamerica there was almost
no missing data, with the exception of body weight data.
Data analysis
All data collected were double-entered by a data entering
agency in the Netherlands, using Epi Info (Centers for Disease
Control and Prevention, Atlanta, GA, USA, 2000) in Scotland
and Access (Microsoft, Redmond, WA, USA, 2000) in Mexico
and Guatemala. Data were cleaned by checking missing values
and outliers. Missing values were replaced according to fixed
criteria or left missing when appropriate. Questionnaires with
’’too many’’ missing values (i.e., 14, 6, 0, and 0 questionnaires
in the Dutch, Scottish, Mexican, and Guatemalan samples,
respectively) were excluded. Outliers were replaced with the
estimated mean value for the sample, with the maximum value,
or were made missing according to fixed criteria.
Quantification of dietary intakes
Country-specific nutrient analysis programs were devel-
oped using SAS 6.07 (SAS Institute, Cary, NC, USA) for
the Scottish and Dutch questionnaires and SPSS 11.0
(SPSS Inc., Chicago, IL, USA) for the Mexican and Guate-
malan questionnaires. A series of internal corrections was
applied to the daily frequencies of intake in the European
questionnaires. When the sum of the frequencies for the indi-
vidual components was not equal to the answer given else-
where, the frequencies for the individual components were
corrected proportionally, as suggested by Haraldsdottir
[15]. Portion sizes were assigned according to the unit
described in the questionnaire or to an average portion size
for that population (not gender or age specific). Daily intakes
of foods were linked with country-specific nutrient composi-
tion data from electronic versions of national food composi-
tion tables [16,17].
Establishment of operating criteria for concordanceanalysis
A major, generic clarification of the appropriate approach
to evaluating public health goals for populations’ decrease of
M. Vossenaar et al. / Nutrition 26 (2010) 40–5244
chronic disease risk emerged from a similar public policy
panel consultation of the World Health Organization
(WHO). After the consultation leading to the publication
by the WHO/Food and Agriculture Organization (FAO)
report on Diet, Nutrition and the Prevention of Chronic Dis-eases [10], Nishida et al. [9] provided critical insights on how
one is to assess compliance or concordance of an entire pop-
ulation sample, when a target population average is provided
as a criterion. Their concept is related to the issue of nutrient-
intake goals for a population, which in turn are ‘‘based on the
assumption that the first priority is to ensure national food
security and equity of distribution of available food in accor-
dance with individual needs.’’ This counsel has been adopted
as representing the appropriate evaluation focus for popula-
tion goals [11].
The exact evaluation criteria applied with respect to the
1997 WCRF/AICR population goals (Table 1) are described
below and summarized in Table 2. The issues related to set-
ting evaluation criteria are discussed in detail in a previous
publication [11].
Quantification of nutrient adequacy (WCRF/AICRcomponent 1a)
The estimated average requirement (EAR) cutpoint
method [18] was used to assess nutrient adequacy of vitamins
A, C, B1, and B2, niacin, calcium, and iron estimated daily
intakes. The EAR calculated values were based on FAO/
WHO recommended nutrient intakes. Gender-specific values
for adults aged 19 to 50 y were used for the entire sample. An
iron bioavailability of 15% was assumed for the Dutch and
Scottish samples and 5% for the Mexican and Guatemalan
samples. Population samples with adequate intakes for five
of seven selected micronutrients were considered concordant.
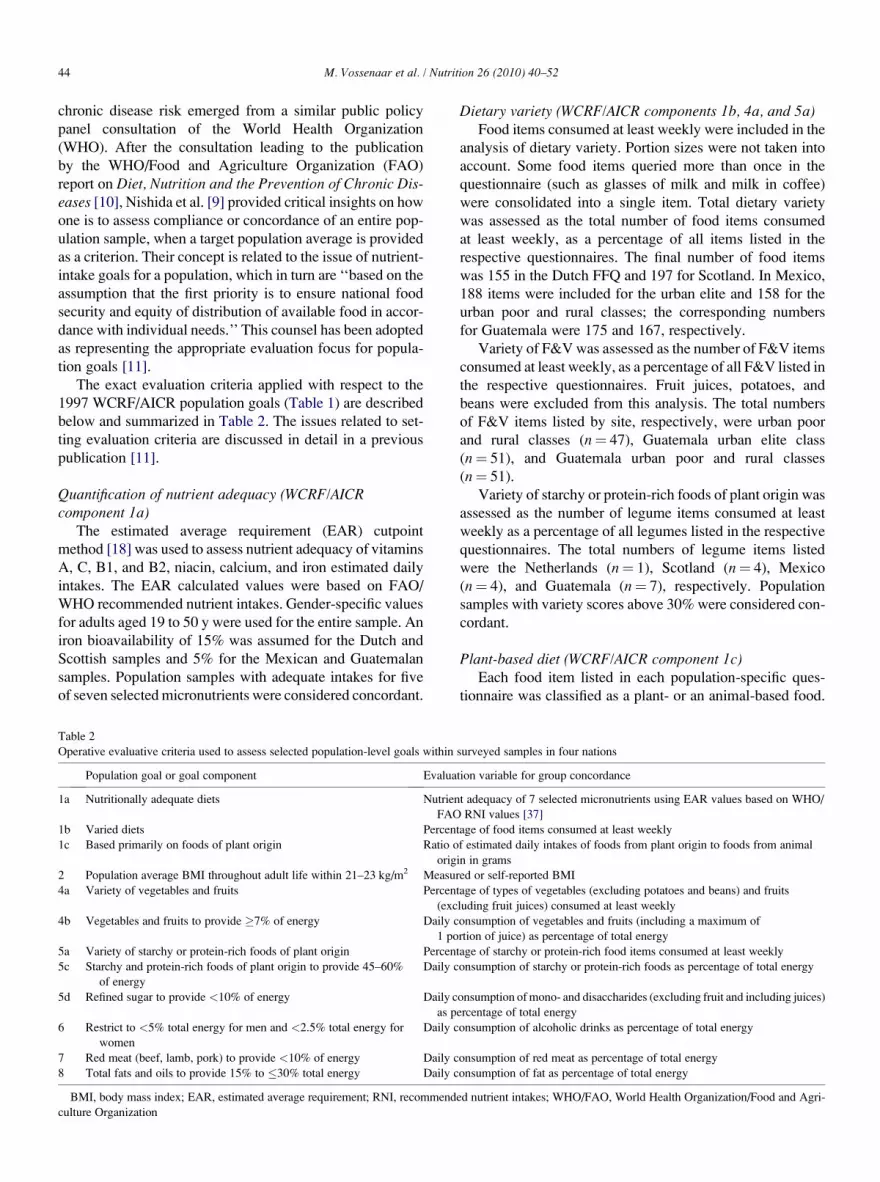
Table 2
Operative evaluative criteria used to assess selected population-level goals within
Population goal or goal component Evalua
1a Nutritionally adequate diets Nutrien
FAO
1b Varied diets Percen
1c Based primarily on foods of plant origin Ratio o
orig
2 Population average BMI throughout adult life within 21–23 kg/m2 Measu
4a Variety of vegetables and fruits Percen
(exc
4b Vegetables and fruits to provide �7% of energy Daily c
1 po
5a Variety of starchy or protein-rich foods of plant origin Percen
5c Starchy and protein-rich foods of plant origin to provide 45–60%
of energy
Daily c
5d Refined sugar to provide <10% of energy Daily c
as p
6 Restrict to <5% total energy for men and <2.5% total energy for
women
Daily c
7 Red meat (beef, lamb, pork) to provide <10% of energy Daily c
8 Total fats and oils to provide 15% to �30% total energy Daily c
BMI, body mass index; EAR, estimated average requirement; RNI, recommend
culture Organization
Dietary variety (WCRF/AICR components 1b, 4a, and 5a)Food items consumed at least weekly were included in the
analysis of dietary variety. Portion sizes were not taken into
account. Some food items queried more than once in the
questionnaire (such as glasses of milk and milk in coffee)
were consolidated into a single item. Total dietary variety
was assessed as the total number of food items consumed
at least weekly, as a percentage of all items listed in the
respective questionnaires. The final number of food items
was 155 in the Dutch FFQ and 197 for Scotland. In Mexico,
188 items were included for the urban elite and 158 for the
urban poor and rural classes; the corresponding numbers
for Guatemala were 175 and 167, respectively.
Variety of F&V was assessed as the number of F&V items
consumed at least weekly, as a percentage of all F&V listed in
the respective questionnaires. Fruit juices, potatoes, and
beans were excluded from this analysis. The total numbers
of F&V items listed by site, respectively, were urban poor
and rural classes (n¼ 47), Guatemala urban elite class
(n¼ 51), and Guatemala urban poor and rural classes
(n¼ 51).
Variety of starchy or protein-rich foods of plant origin was
assessed as the number of legume items consumed at least
weekly as a percentage of all legumes listed in the respective
questionnaires. The total numbers of legume items listed
were the Netherlands (n¼ 1), Scotland (n¼ 4), Mexico
(n¼ 4), and Guatemala (n¼ 7), respectively. Population
samples with variety scores above 30% were considered con-
cordant.
Plant-based diet (WCRF/AICR component 1c)Each food item listed in each population-specific ques-
tionnaire was classified as a plant- or an animal-based food.
surveyed samples in four nations
tion variable for group concordance
t adequacy of 7 selected micronutrients using EAR values based on WHO/
RNI values [37]
tage of food items consumed at least weekly
f estimated daily intakes of foods from plant origin to foods from animal
in in grams
red or self-reported BMI
tage of types of vegetables (excluding potatoes and beans) and fruits
luding fruit juices) consumed at least weekly
onsumption of vegetables and fruits (including a maximum of
rtion of juice) as percentage of total energy
tage of starchy or protein-rich food items consumed at least weekly
onsumption of starchy or protein-rich foods as percentage of total energy
onsumption of mono- and disaccharides (excluding fruit and including juices)
ercentage of total energy
onsumption of alcoholic drinks as percentage of total energy
onsumption of red meat as percentage of total energy
onsumption of fat as percentage of total energy
ed nutrient intakes; WHO/FAO, World Health Organization/Food and Agri-
M. Vossenaar et al. / Nutrition 26 (2010) 40–52 45
The numbers of items classified of plant- or animal-based
foods were 67/48, 91/69, 89/50, and 117/54, respectively,
for the Netherlands, Scotland, Mexico, and Guatemala. Daily
intakes of plant- or animal-based foods were computed in
grams. The ratios of estimated weight of daily intakes of
foods from plant origin to all foods (plant and animal origin
combined) were generated. Population samples with a plant-
to-animal ratio greater than 0.5 were considered concordant.
Adequate body mass index (WCRF/AICR component 2)Body mass index (BMI) was calculated as weight (kilo-
grams) divided by height (meters) squared. Measured weight
and height were used when available, and self-reported mea-
surements were used otherwise. Population samples with
a mean BMI within 21- to 23-kg/m2 limits were considered
concordant.
Estimated daily intake of F&V as energy percentage (WCRF/AICR component 4b)
In the Netherlands and Scotland, estimated daily intake of
vegetables (excluding potatoes and beans) was assessed from
the frequency of intake per week and the average portion
sizes. Estimated daily intake of fruits (including a maximum
of 1 portion of juice) was assessed from the frequency of in-
take per week and the portion sizes of all fruits. Although ba-
nanas were not classified as fruits by the WCRF/AICR report,
they were included in the estimation of fruit intake in the Eu-
ropean questionnaire, because they are conceptually seen as
a fruit. In Mesoamerica, intakes of F&V were estimated on
the basis of 29 vegetables and 26 fruit items in the Mexican
FFQ and on 26 vegetables and 20 fruit items in the Guatema-
lan FFQ. At these sites, bananas constituted a separate com-
ponent in the FFQ and could be excluded from the estimation
of total fruit intake and included within other plant foods.
Population samples with a mean F&V intake at least 7 energy
percentage were considered concordant.
Estimated daily intake of starchy and protein-rich foods asenergy percentage (WCRF/AICR component 5c)
The numbers of food items classified as starchy or protein-
rich foods were 33, 54, 31, and 50, respectively, for the Neth-
erlands, Scotland, Mexico, and Guatemala. These included
foods such as tortillas, pasta, rice, bread, and other cereals
and banana and plantain. Given that the estimation of banana
intake in Europe was bound to the question on fruit intake, it
could not be included in this food group. As a consequence,
there is a systematic under-inclusion of total starchy foods
and overestimation of fruits in the European samples. Popu-
lation samples with a mean intake from 45 to 60 energy per-
centage were considered concordant.
Estimated daily intake of refined sugar as energy percentage(WCRF/AICR component 5d)
In Europe, daily intakes of foods (excluding fruits and
including juices) were linked to country-specific mono- and
disaccharide composition data from electronic versions of
national food composition tables [16,17]. F&V were
excluded from this analysis. In Mesoamerica, values for
extrinsic sugar were derived from U.S. Department of Agri-
culture food composition tables obtained online from the
U.S. Department of Agriculture database [19] and manufac-
turers’ food labels. Population samples with a mean intake
below 10% of total energy were considered concordant.
Estimated daily intake of alcoholic drinks as energypercentage (WCRF/AICR component 6)
In Europe, usual consumption of alcoholic drinks was
queried for week and weekend days separately. Number of
portions was queried separately for beer, wine, and other
spirits. In Mesoamerica, usual consumption of alcoholic
drinks was queried by means of an FFQ. Daily consumption
of alcoholic drinks as a percentage of total calories was com-
puted, and population samples with a mean intake below the
gender specific cutoff values (5% for men and 2.5% for
women) were considered concordant.
Estimated daily intake of red meat as energy percentage(WCRF/AICR component 7)
Usual intake of red meat (including beef, mutton, lamb,
pork, and products from these meats) was queried by means
of an FFQ. Composite dishes with a red meat component
were taken into account. Population samples with a mean in-
take below 10 energy percentage were considered concordant.
Estimated daily intake of total fat as energy percentage(WCRF/AICR component 8)
Usual fat intake, in all foods, was estimated. Population
samples with a mean intake from10% to 15% of total energy
were considered concordant.
Statistical analysis
Data were analyzed using SPSS 11.0. Means and standard
deviations were computed for descriptive purposes for each
population sample.
Results
Demographic description of population samples
The goal for sample enrollment was 900 subjects per na-
tion, stratified and equally distributed among three SES cate-
gories, and by sex. Table 3 outlines the characteristics of the
subjects actually analyzed in generating the present findings.
Recommendation 1: Food supply and eating
This recommendation has three components. We estab-
lished that a population reaching or exceeding the five of
seven EARs for average recorded micronutrient intake would
be classified as consuming a nutritionally adequate diet. All
national samples were so classified (Table 4). In terms of
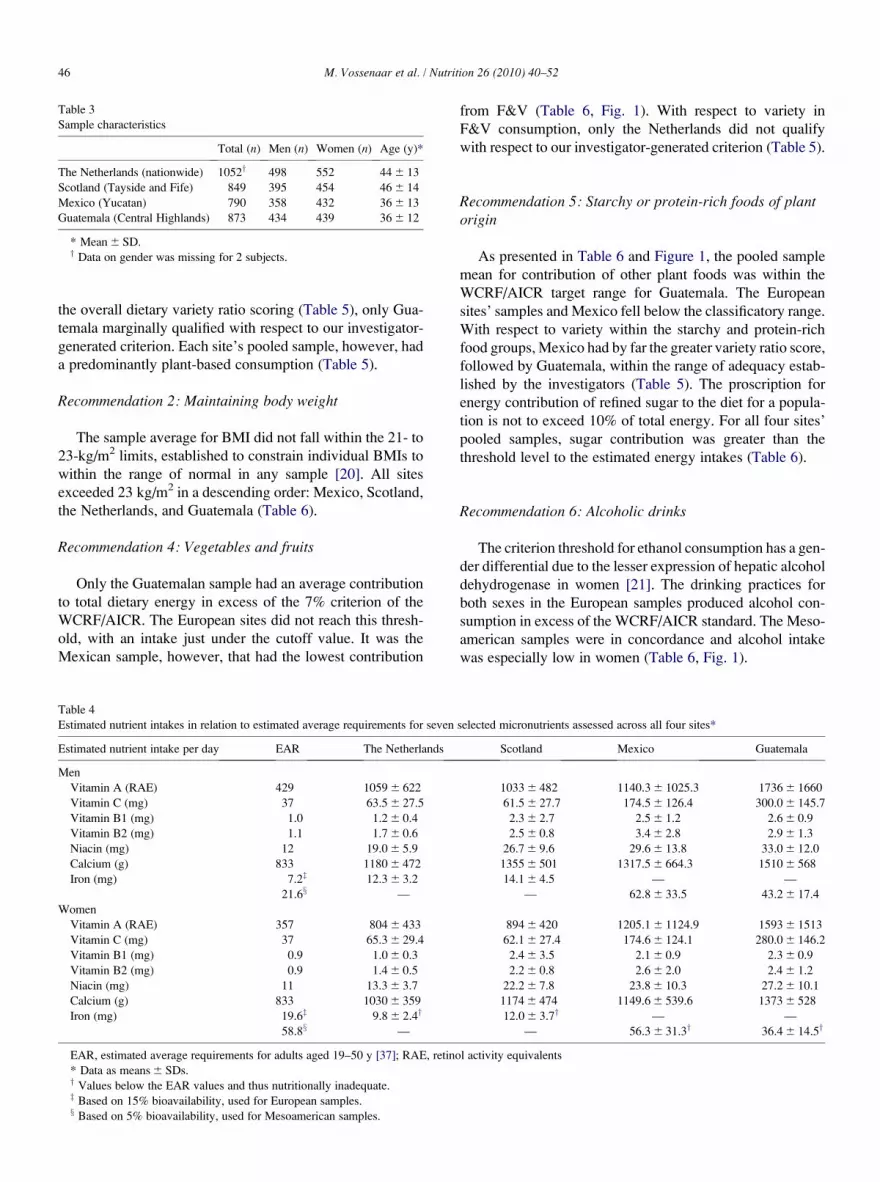
Table 3
Sample characteristics
Total (n) Men (n) Women (n) Age (y)*
The Netherlands (nationwide) 1052y 498 552 44 6 13
Scotland (Tayside and Fife) 849 395 454 46 6 14
Mexico (Yucatan) 790 358 432 36 6 13
Guatemala (Central Highlands) 873 434 439 36 6 12
* Mean 6 SD.y Data on gender was missing for 2 subjects.
M. Vossenaar et al. / Nutrition 26 (2010) 40–5246
the overall dietary variety ratio scoring (Table 5), only Gua-
temala marginally qualified with respect to our investigator-
generated criterion. Each site’s pooled sample, however, had
a predominantly plant-based consumption (Table 5).
Recommendation 2: Maintaining body weight
The sample average for BMI did not fall within the 21- to
23-kg/m2 limits, established to constrain individual BMIs to
within the range of normal in any sample [20]. All sites
exceeded 23 kg/m2 in a descending order: Mexico, Scotland,
the Netherlands, and Guatemala (Table 6).
Recommendation 4: Vegetables and fruits
Only the Guatemalan sample had an average contribution
to total dietary energy in excess of the 7% criterion of the
WCRF/AICR. The European sites did not reach this thresh-
old, with an intake just under the cutoff value. It was the
Mexican sample, however, that had the lowest contribution
Table 4
Estimated nutrient intakes in relation to estimated average requirements for seven
Estimated nutrient intake per day EAR The Netherlands
Men
Vitamin A (RAE) 429 1059 6 622
Vitamin C (mg) 37 63.5 6 27.5
Vitamin B1 (mg) 1.0 1.2 6 0.4
Vitamin B2 (mg) 1.1 1.7 6 0.6
Niacin (mg) 12 19.0 6 5.9
Calcium (g) 833 1180 6 472
Iron (mg) 7.2z 12.3 6 3.2
21.6x —
Women
Vitamin A (RAE) 357 804 6 433
Vitamin C (mg) 37 65.3 6 29.4
Vitamin B1 (mg) 0.9 1.0 6 0.3
Vitamin B2 (mg) 0.9 1.4 6 0.5
Niacin (mg) 11 13.3 6 3.7
Calcium (g) 833 1030 6 359
Iron (mg) 19.6z 9.8 6 2.4y
58.8x —
EAR, estimated average requirements for adults aged 19–50 y [37]; RAE, retino
* Data as means 6 SDs.y Values below the EAR values and thus nutritionally inadequate.z Based on 15% bioavailability, used for European samples.x Based on 5% bioavailability, used for Mesoamerican samples.
from F&V (Table 6, Fig. 1). With respect to variety in
F&V consumption, only the Netherlands did not qualify
with respect to our investigator-generated criterion (Table 5).
Recommendation 5: Starchy or protein-rich foods of plantorigin
As presented in Table 6 and Figure 1, the pooled sample
mean for contribution of other plant foods was within the
WCRF/AICR target range for Guatemala. The European
sites’ samples and Mexico fell below the classificatory range.
With respect to variety within the starchy and protein-rich
food groups, Mexico had by far the greater variety ratio score,
followed by Guatemala, within the range of adequacy estab-
lished by the investigators (Table 5). The proscription for
energy contribution of refined sugar to the diet for a popula-
tion is not to exceed 10% of total energy. For all four sites’
pooled samples, sugar contribution was greater than the
threshold level to the estimated energy intakes (Table 6).
Recommendation 6: Alcoholic drinks
The criterion threshold for ethanol consumption has a gen-
der differential due to the lesser expression of hepatic alcohol
dehydrogenase in women [21]. The drinking practices for
both sexes in the European samples produced alcohol con-
sumption in excess of the WCRF/AICR standard. The Meso-
american samples were in concordance and alcohol intake
was especially low in women (Table 6, Fig. 1).
selected micronutrients assessed across all four sites*
Scotland Mexico Guatemala
1033 6 482 1140.3 6 1025.3 1736 6 1660
61.5 6 27.7 174.5 6 126.4 300.0 6 145.7
2.3 6 2.7 2.5 6 1.2 2.6 6 0.9
2.5 6 0.8 3.4 6 2.8 2.9 6 1.3
26.7 6 9.6 29.6 6 13.8 33.0 6 12.0
1355 6 501 1317.5 6 664.3 1510 6 568
14.1 6 4.5 — —
— 62.8 6 33.5 43.2 6 17.4
894 6 420 1205.1 6 1124.9 1593 6 1513
62.1 6 27.4 174.6 6 124.1 280.0 6 146.2
2.4 6 3.5 2.1 6 0.9 2.3 6 0.9
2.2 6 0.8 2.6 6 2.0 2.4 6 1.2
22.2 6 7.8 23.8 6 10.3 27.2 6 10.1
1174 6 474 1149.6 6 539.6 1373 6 528
12.0 6 3.7y — —
— 56.3 6 31.3y 36.4 6 14.5y
l activity equivalents
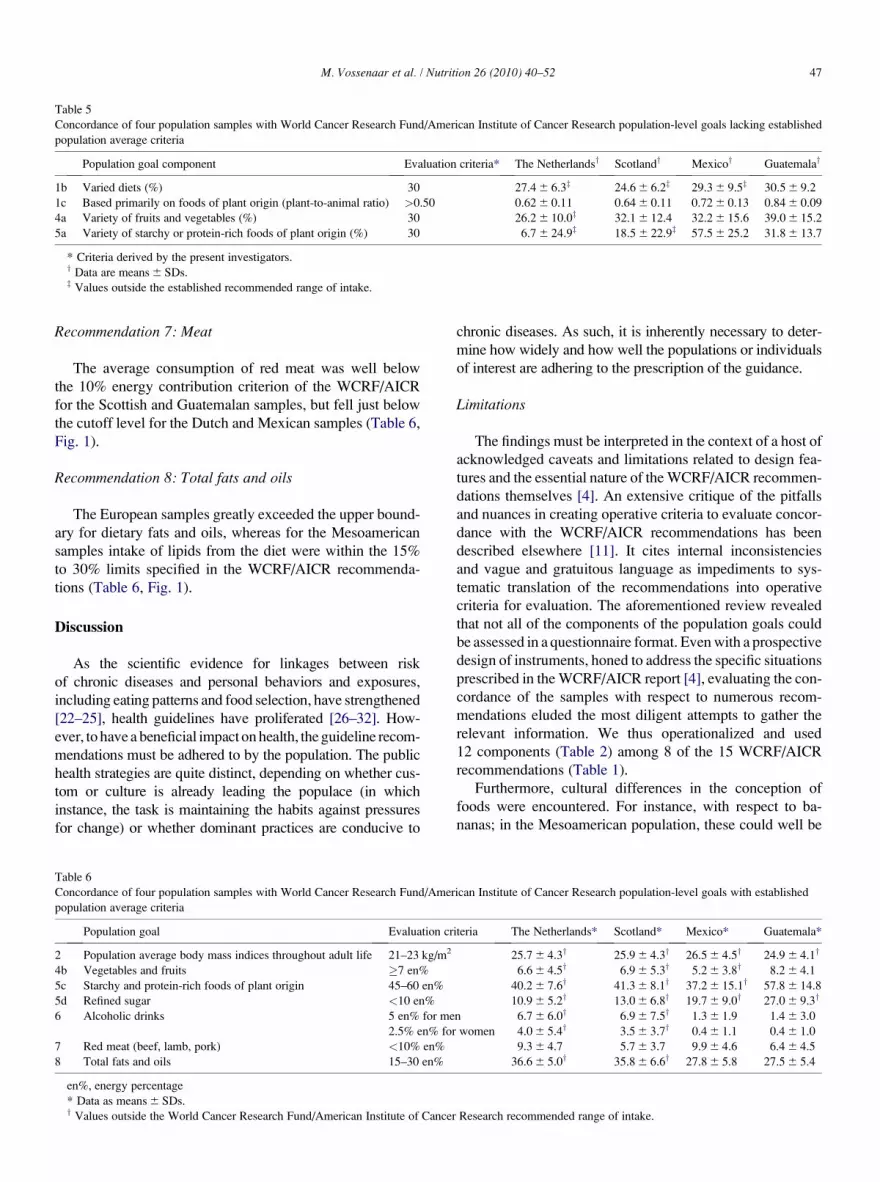
Table 5
Concordance of four population samples with World Cancer Research Fund/American Institute of Cancer Research population-level goals lacking established
population average criteria
Population goal component Evaluation criteria* The Netherlandsy Scotlandy Mexicoy Guatemalay
1b Varied diets (%) 30 27.4 6 6.3z 24.6 6 6.2z 29.3 6 9.5z 30.5 6 9.2
1c Based primarily on foods of plant origin (plant-to-animal ratio) >0.50 0.62 6 0.11 0.64 6 0.11 0.72 6 0.13 0.84 6 0.09
4a Variety of fruits and vegetables (%) 30 26.2 6 10.0z 32.1 6 12.4 32.2 6 15.6 39.0 6 15.2
5a Variety of starchy or protein-rich foods of plant origin (%) 30 6.7 6 24.9z 18.5 6 22.9z 57.5 6 25.2 31.8 6 13.7
* Criteria derived by the present investigators.y Data are means 6 SDs.z Values outside the established recommended range of intake.
M. Vossenaar et al. / Nutrition 26 (2010) 40–52 47
Recommendation 7: Meat
The average consumption of red meat was well below
the 10% energy contribution criterion of the WCRF/AICR
for the Scottish and Guatemalan samples, but fell just below
the cutoff level for the Dutch and Mexican samples (Table 6,
Fig. 1).
Recommendation 8: Total fats and oils
The European samples greatly exceeded the upper bound-
ary for dietary fats and oils, whereas for the Mesoamerican
samples intake of lipids from the diet were within the 15%
to 30% limits specified in the WCRF/AICR recommenda-
tions (Table 6, Fig. 1).
Discussion
As the scientific evidence for linkages between risk
of chronic diseases and personal behaviors and exposures,
including eating patterns and food selection, have strengthened
[22–25], health guidelines have proliferated [26–32]. How-
ever, to have a beneficial impact on health, the guideline recom-
mendations must be adhered to by the population. The public
health strategies are quite distinct, depending on whether cus-
tom or culture is already leading the populace (in which
instance, the task is maintaining the habits against pressures
for change) or whether dominant practices are conducive to
Table 6
Concordance of four population samples with World Cancer Research Fund/Amer
population average criteria
Population goal Evaluation cr
2 Population average body mass indices throughout adult life 21–23 kg/m2
4b Vegetables and fruits �7 en%
5c Starchy and protein-rich foods of plant origin 45–60 en%
5d Refined sugar <10 en%
6 Alcoholic drinks 5 en% for me
2.5% en% for
7 Red meat (beef, lamb, pork) <10% en%
8 Total fats and oils 15–30 en%
en%, energy percentage
* Data as means 6 SDs.y Values outside the World Cancer Research Fund/American Institute of Cancer
chronic diseases. As such, it is inherently necessary to deter-
mine how widely and how well the populations or individuals
of interest are adhering to the prescription of the guidance.
Limitations
The findings must be interpreted in the context of a host of
acknowledged caveats and limitations related to design fea-
tures and the essential nature of the WCRF/AICR recommen-
dations themselves [4]. An extensive critique of the pitfalls
and nuances in creating operative criteria to evaluate concor-
dance with the WCRF/AICR recommendations has been
described elsewhere [11]. It cites internal inconsistencies
and vague and gratuitous language as impediments to sys-
tematic translation of the recommendations into operative
criteria for evaluation. The aforementioned review revealed
that not all of the components of the population goals could
be assessed in a questionnaire format. Even with a prospective
design of instruments, honed to address the specific situations
prescribed in the WCRF/AICR report [4], evaluating the con-
cordance of the samples with respect to numerous recom-
mendations eluded the most diligent attempts to gather the
relevant information. We thus operationalized and used
12 components (Table 2) among 8 of the 15 WCRF/AICR
recommendations (Table 1).
Furthermore, cultural differences in the conception of
foods were encountered. For instance, with respect to ba-
nanas; in the Mesoamerican population, these could well be
ican Institute of Cancer Research population-level goals with established
iteria The Netherlands* Scotland* Mexico* Guatemala*
25.7 6 4.3y 25.9 6 4.3y 26.5 6 4.5y 24.9 6 4.1y
6.6 6 4.5y 6.9 6 5.3y 5.2 6 3.8y 8.2 6 4.1
40.2 6 7.6y 41.3 6 8.1y 37.2 6 15.1y 57.8 6 14.8
10.9 6 5.2y 13.0 6 6.8y 19.7 6 9.0y 27.0 6 9.3y
n 6.7 6 6.0y 6.9 6 7.5y 1.3 6 1.9 1.4 6 3.0
women 4.0 6 5.4y 3.5 6 3.7y 0.4 6 1.1 0.4 6 1.0
9.3 6 4.7 5.7 6 3.7 9.9 6 4.6 6.4 6 4.5
36.6 6 5.0y 35.8 6 6.6y 27.8 6 5.8 27.5 6 5.4
Research recommended range of intake.

Fig. 1. Population sample distributions of (A) body mass index, (B) fruit and vegetable intake (en%), (C) starchy food intake (en%), (D) refined sugar intake
(en%), (E) alcoholic drink intake in men (en%), (F) alcoholic drink intake in women (en%), (G) red meat intake (en%), and (H) total fat and oil intake
(en%). Line with crosses is the Dutch sample (n¼ 1052), dashed line is the Scottish sample (n¼ 849), continuous line is the Mexican sample (n¼ 790), and
line with triangles is the Guatemalan sample (n¼ 873). Vertical dotted lines represent the World Cancer Fund/American Institute of Cancer Research recommen-
dations. en%, energy percentage.
M. Vossenaar et al. / Nutrition 26 (2010) 40–5248
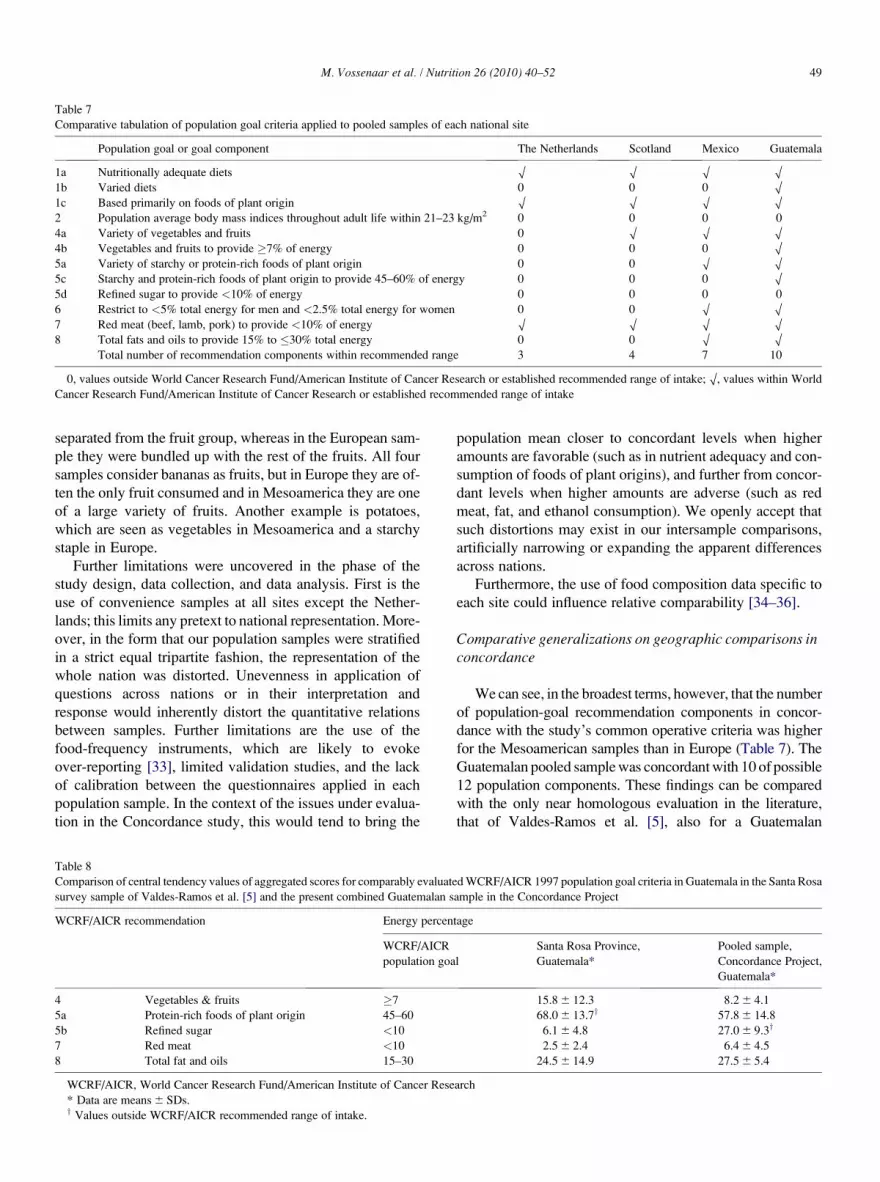
Table 7
Comparative tabulation of population goal criteria applied to pooled samples of each national site
Population goal or goal component The Netherlands Scotland Mexico Guatemala
1a Nutritionally adequate diets O O O O1b Varied diets 0 0 0 O1c Based primarily on foods of plant origin O O O O2 Population average body mass indices throughout adult life within 21–23 kg/m2 0 0 0 0
4a Variety of vegetables and fruits 0 O O O4b Vegetables and fruits to provide �7% of energy 0 0 0 O5a Variety of starchy or protein-rich foods of plant origin 0 0 O O5c Starchy and protein-rich foods of plant origin to provide 45–60% of energy 0 0 0 O5d Refined sugar to provide <10% of energy 0 0 0 0
6 Restrict to <5% total energy for men and <2.5% total energy for women 0 0 O O7 Red meat (beef, lamb, pork) to provide <10% of energy O O O O8 Total fats and oils to provide 15% to �30% total energy 0 0 O O
Total number of recommendation components within recommended range 3 4 7 10
0, values outside World Cancer Research Fund/American Institute of Cancer Research or established recommended range of intake; O, values within World
Cancer Research Fund/American Institute of Cancer Research or established recommended range of intake
M. Vossenaar et al. / Nutrition 26 (2010) 40–52 49
separated from the fruit group, whereas in the European sam-
ple they were bundled up with the rest of the fruits. All four
samples consider bananas as fruits, but in Europe they are of-
ten the only fruit consumed and in Mesoamerica they are one
of a large variety of fruits. Another example is potatoes,
which are seen as vegetables in Mesoamerica and a starchy
staple in Europe.
Further limitations were uncovered in the phase of the
study design, data collection, and data analysis. First is the
use of convenience samples at all sites except the Nether-
lands; this limits any pretext to national representation. More-
over, in the form that our population samples were stratified
in a strict equal tripartite fashion, the representation of the
whole nation was distorted. Unevenness in application of
questions across nations or in their interpretation and
response would inherently distort the quantitative relations
between samples. Further limitations are the use of the
food-frequency instruments, which are likely to evoke
over-reporting [33], limited validation studies, and the lack
of calibration between the questionnaires applied in each
population sample. In the context of the issues under evalua-
tion in the Concordance study, this would tend to bring the
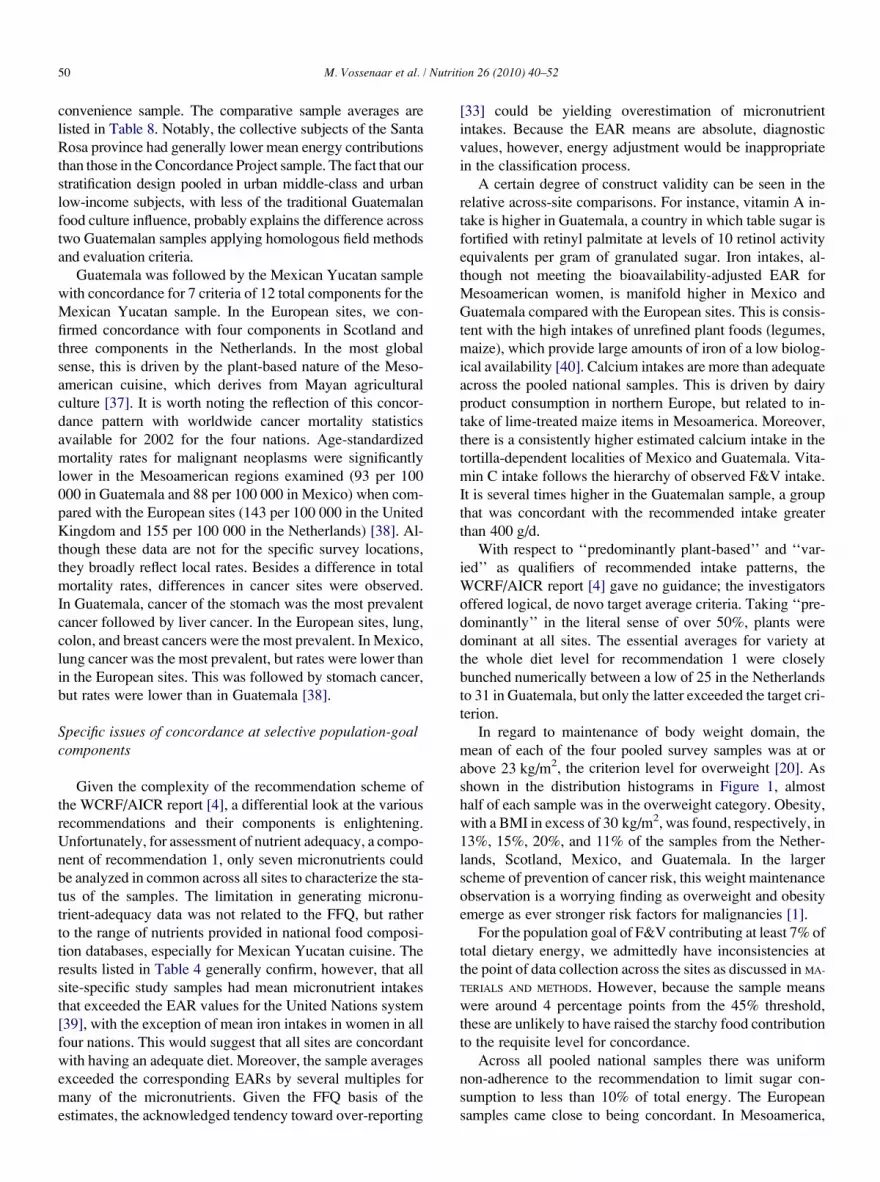
Table 8
Comparison of central tendency values of aggregated scores for comparably evaluate
survey sample of Valdes-Ramos et al. [5] and the present combined Guatemalan s
WCRF/AICR recommendation Energy percen
WCRF/AICR
population goa
4 Vegetables & fruits �7
5a Protein-rich foods of plant origin 45–60
5b Refined sugar <10
7 Red meat <10
8 Total fat and oils 15–30
WCRF/AICR, World Cancer Research Fund/American Institute of Cancer Rese
* Data are means 6 SDs.y Values outside WCRF/AICR recommended range of intake.
population mean closer to concordant levels when higher
amounts are favorable (such as in nutrient adequacy and con-
sumption of foods of plant origins), and further from concor-
dant levels when higher amounts are adverse (such as red
meat, fat, and ethanol consumption). We openly accept that
such distortions may exist in our intersample comparisons,
artificially narrowing or expanding the apparent differences
across nations.
Furthermore, the use of food composition data specific to
each site could influence relative comparability [34–36].
Comparative generalizations on geographic comparisons inconcordance
We can see, in the broadest terms, however, that the number
of population-goal recommendation components in concor-
dance with the study’s common operative criteria was higher
for the Mesoamerican samples than in Europe (Table 7). The
Guatemalan pooled sample was concordant with 10 of possible
12 population components. These findings can be compared
with the only near homologous evaluation in the literature,
that of Valdes-Ramos et al. [5], also for a Guatemalan
d WCRF/AICR 1997 population goal criteria in Guatemala in the Santa Rosa
ample in the Concordance Project
tage
l
Santa Rosa Province,
Guatemala*
Pooled sample,
Concordance Project,
Guatemala*
15.8 6 12.3 8.2 6 4.1
68.0 6 13.7y 57.8 6 14.8
6.1 6 4.8 27.0 6 9.3y
2.5 6 2.4 6.4 6 4.5
24.5 6 14.9 27.5 6 5.4
arch
M. Vossenaar et al. / Nutrition 26 (2010) 40–5250
convenience sample. The comparative sample averages are
listed in Table 8. Notably, the collective subjects of the Santa
Rosa province had generally lower mean energy contributions
than those in the Concordance Project sample. The fact that our
stratification design pooled in urban middle-class and urban
low-income subjects, with less of the traditional Guatemalan
food culture influence, probably explains the difference across
two Guatemalan samples applying homologous field methods
and evaluation criteria.
Guatemala was followed by the Mexican Yucatan sample
with concordance for 7 criteria of 12 total components for the
Mexican Yucatan sample. In the European sites, we con-
firmed concordance with four components in Scotland and
three components in the Netherlands. In the most global
sense, this is driven by the plant-based nature of the Meso-
american cuisine, which derives from Mayan agricultural
culture [37]. It is worth noting the reflection of this concor-
dance pattern with worldwide cancer mortality statistics
available for 2002 for the four nations. Age-standardized
mortality rates for malignant neoplasms were significantly
lower in the Mesoamerican regions examined (93 per 100
000 in Guatemala and 88 per 100 000 in Mexico) when com-
pared with the European sites (143 per 100 000 in the United
Kingdom and 155 per 100 000 in the Netherlands) [38]. Al-
though these data are not for the specific survey locations,
they broadly reflect local rates. Besides a difference in total
mortality rates, differences in cancer sites were observed.
In Guatemala, cancer of the stomach was the most prevalent
cancer followed by liver cancer. In the European sites, lung,
colon, and breast cancers were the most prevalent. In Mexico,
lung cancer was the most prevalent, but rates were lower than
in the European sites. This was followed by stomach cancer,
but rates were lower than in Guatemala [38].
Specific issues of concordance at selective population-goalcomponents
Given the complexity of the recommendation scheme of
the WCRF/AICR report [4], a differential look at the various
recommendations and their components is enlightening.
Unfortunately, for assessment of nutrient adequacy, a compo-
nent of recommendation 1, only seven micronutrients could
be analyzed in common across all sites to characterize the sta-
tus of the samples. The limitation in generating micronu-
trient-adequacy data was not related to the FFQ, but rather
to the range of nutrients provided in national food composi-
tion databases, especially for Mexican Yucatan cuisine. The
results listed in Table 4 generally confirm, however, that all
site-specific study samples had mean micronutrient intakes
that exceeded the EAR values for the United Nations system
[39], with the exception of mean iron intakes in women in all
four nations. This would suggest that all sites are concordant
with having an adequate diet. Moreover, the sample averages
exceeded the corresponding EARs by several multiples for
many of the micronutrients. Given the FFQ basis of the
estimates, the acknowledged tendency toward over-reporting
[33] could be yielding overestimation of micronutrient
intakes. Because the EAR means are absolute, diagnostic
values, however, energy adjustment would be inappropriate
in the classification process.
A certain degree of construct validity can be seen in the
relative across-site comparisons. For instance, vitamin A in-
take is higher in Guatemala, a country in which table sugar is
fortified with retinyl palmitate at levels of 10 retinol activity
equivalents per gram of granulated sugar. Iron intakes, al-
though not meeting the bioavailability-adjusted EAR for
Mesoamerican women, is manifold higher in Mexico and
Guatemala compared with the European sites. This is consis-
tent with the high intakes of unrefined plant foods (legumes,
maize), which provide large amounts of iron of a low biolog-
ical availability [40]. Calcium intakes are more than adequate
across the pooled national samples. This is driven by dairy
product consumption in northern Europe, but related to in-
take of lime-treated maize items in Mesoamerica. Moreover,
there is a consistently higher estimated calcium intake in the
tortilla-dependent localities of Mexico and Guatemala. Vita-
min C intake follows the hierarchy of observed F&V intake.
It is several times higher in the Guatemalan sample, a group
that was concordant with the recommended intake greater
than 400 g/d.
With respect to ‘‘predominantly plant-based’’ and ‘‘var-
ied’’ as qualifiers of recommended intake patterns, the
WCRF/AICR report [4] gave no guidance; the investigators
offered logical, de novo target average criteria. Taking ‘‘pre-
dominantly’’ in the literal sense of over 50%, plants were
dominant at all sites. The essential averages for variety at
the whole diet level for recommendation 1 were closely
bunched numerically between a low of 25 in the Netherlands
to 31 in Guatemala, but only the latter exceeded the target cri-
terion.
In regard to maintenance of body weight domain, the
mean of each of the four pooled survey samples was at or
above 23 kg/m2, the criterion level for overweight [20]. As
shown in the distribution histograms in Figure 1, almost
half of each sample was in the overweight category. Obesity,
with a BMI in excess of 30 kg/m2, was found, respectively, in
13%, 15%, 20%, and 11% of the samples from the Nether-
lands, Scotland, Mexico, and Guatemala. In the larger
scheme of prevention of cancer risk, this weight maintenance
observation is a worrying finding as overweight and obesity
emerge as ever stronger risk factors for malignancies [1].
For the population goal of F&V contributing at least 7% of
total dietary energy, we admittedly have inconsistencies at
the point of data collection across the sites as discussed in MA-
TERIALS AND METHODS. However, because the sample means
were around 4 percentage points from the 45% threshold,
these are unlikely to have raised the starchy food contribution
to the requisite level for concordance.
Across all pooled national samples there was uniform
non-adherence to the recommendation to limit sugar con-
sumption to less than 10% of total energy. The European
samples came close to being concordant. In Mesoamerica,
M. Vossenaar et al. / Nutrition 26 (2010) 40–52 51
the samples exceeded the target criterion by more than two-
fold and almost three-fold. Our uniform approach across all
sites was to estimate not only the granulated table sugar
added to beverages, cereals, and fruits at the table, but also
the refined sugar contained within processed products such
as soft drinks, sweet rolls, and pastries.
All sites were concordant with a less than 10% energy con-
tribution of red meats, with Mexico very near the threshold
level. Excessive consumption of alcoholic beverages gener-
ated a partition among continents, with the European sites
above the recommendation and the Mesoamerican sites well
below the cutoff value. The final example of this partition
came with contribution of fats and oils; like alcohol bever-
ages, Mexico and Guatemala were the only sites concordant
with the targets for average energy contribution from lipids.
The fact that we have generated the histographic distribu-
tions of the variables measured to calculate the population-
goal concordance (Fig. 1) provides a unique opportunity to
examine real-life variance in population samples. No generic
conclusions can be derived from the visualization of the
actual width of the variance around the mean and the magni-
tudes of the upper and lower tails of the distributions. The
kurtosis of the distributions was a function of the variable
of interest and the sample site. The experience with our
nations suggests that, for variables such as total contribution
of starchy and protein-rich foods and alcoholic drinks, a pop-
ulation with a concordant average could have a substantial
segment of the population in a high excess intake range.
Since the conclusion of analysis of these data, the WCRF/
AICR published a new set of eight recommendations at two
levels: public health goals and personal recommendations
[41]. In this new report, population goals are set within
a time range of 10 y, e.g., ‘‘population average consumption
of sugary drinks to be halved every 10 years.’’ This makes the
monitoring over a 10-y frame essential for the assessment of
concordance. The details and challenges of evaluating con-
cordance with these revised recommendations (and indeed
other recommendations for chronic disease) remain challeng-
ing for nutritional epidemiology.
Conclusions
The evaluation of compliance or concordance with the
tenets of health guidelines is a necessary—but challenging—
undertaking. It is safe to conclude that creating an evaluation
instrument prospectively designed to assess the components
of the guidelines is superior in its scope than relying on conven-
tional nutritional surveys as was contemplated or done in the
past [5–7]. The present study was challenged by residual ambi-
guities in the wording of the population goals by the framers
[11], by inconsistencies and non-comparability in the variables
across study sites, and by the myriad of population goals that, in
fact, cannot be gauged from questioning the populace.
Within the limitations of comparability and sampling ac-
knowledged here, we see more concordance with compo-
nents of the WCRF/AICR recommendations in Guatemala
than in the other participating sites and the two northern Eu-
ropean samples fell short of concordance for a wide array of
the components examined. We postulate, therefore, that ef-
forts to maintain currently positive practices is the strategic
priority in Central America, whereas efforts at behavioral
reorientation are needed in Europe to bring the populations
into compliance. Our comparison across the four sites
showed different dietary patterns; this not only affects pri-
mary risk or protection from cancers, but also has implica-
tions for different interactions with specific dietary
constituents [42]. For future progress in this line of investiga-
tion, increasingly more representative samples must be en-
rolled to better reflect concordance or compliance across
a population or subpopulation of public health interest.
Acknowledgments
The authors gratefully acknowledge the remaining mem-
bers of the Concordance Project group: Professor M. E. J.
Lean at the University of Glasgow, Scotland, and Professor
J. C. Seidell and Dr. Marga C. Ocke at the National Institute
of Public Health and the Environment (RIVM), Bilthoven,
The Netherlands. Furthermore, they thank Ms. Evelyn May-
orga and Ms. Cristina Gasque for coordinating data collec-
tion in Guatemala and Mexico, respectively, and the Food
Standards Agency for providing access to dietary survey
data.
References
[1] Uauy R, Solomons NW. The role of the international community: forg-
ing a common agenda in tackling the double burden of malnutrition.
SCN News 2006;32:24–37.
[2] World Health Organization. The world health report. reducing risks,
promoting healthy life. Geneva: World Health Organization; 2002.
2002.
[3] Doll R, Peto R. The causes of cancer: quantitative estimates of avoid-
able risks of cancer in the United States today. J Natl Cancer Inst
1981;66:1191–308.
[4] World Cancer Research Fund, American Institute of Cancer Research.
Diet, nutrition and prevention of human cancer: a global perspective,
World Cancer Research Fund. Washington, DC: American Institute
of Cancer Research; 1997.
[5] Valdes-Ramos R, Cervantes I, Mendoza-Perdomo I, Anderson AS,
Solomons NW. Concordance of diets and eating practices in a rural
Guatemalan setting with the cancer prevention recommendations of
the World Cancer Research Fund: estimates from existing dietary
intake. Asia Pac J Clin Nutr 2006;15:259–66.
[6] Valdes-Ramos R, Solomons NW, Anderson AS, Mendoza I,
Garces MA, Benincasa L. Can the degree of concordance with recom-
mendations for a cancer prevention diet and lifestyle be assessed from
existing survey information data? Am J Clin Nutr 2001;74:848–51.
[7] Cerhan JR, Potter JD, Gilmore JM, Janney CA, Kushi LH, Lazovich D,
et al. Adherence to the AICR cancer prevention recommendations and
subsequent morbidity and mortality in the Iowa Women’s Health Study
cohort. Cancer Epidemiol Biomarkers Prev 2004;13:1114–20.
[8] Vossenaar M. Concordance with global dietary and lifestyle recom-
mendations to reduce cancer risk in two European populations. Dun-
dee, UK: University of Dundee; 2005.
[9] Nishida C, Uauy R, Kumanyika S, Shetty P. The joint WHO/FAO
expert consultation on diet, nutrition and the prevention of chronic

M. Vossenaar et al. / Nutrition 26 (2010) 40–5252
diseases: process, product and policy implications. Public Health Nutr
2004;7:245–50.
[10] World Health Organization, Food and Agriculture Organization. Diet,
nutrition and the prevention of chronic diseases. Geneva: World Health
Organization, Food and Agriculture Organization; 2003.
[11] Vossenaar M, Solomons NW, Valdes-Ramos R, Anderson AS. Evaluat-
ing concordance with the 1997 World Cancer Research Fund/American
Institute of Cancer Research cancer prevention guidelines: challenges
for the research community. Nutr Res Rev 2008;21:189–206.
[12] Kim HS, Park SY, Grandinetti A, Holck PS, Waslien C. Major dietary
patterns, ethnicity, and prevalence of type 2 diabetes in rural Hawaii.
Nutrition 2008;24:1065–72.
[13] Viet A, van den Hof S, Elvers LH, Ocke MC, Vossenaar M, Seidell JC,
et al. Risk factors and health in the Netherlands, a survey on municipal
health services. Annual report 2001. Report no. 260854004. Bilthoven:
RIVM; 2003.
[14] Food Standards Agency: Evaluation of effects of dietary exchange
of individual saturated fatty acids on haemostasis and vascular function
(N02013). Available at: http://www.food.gov.uk/science/research/
researchinfo/nutritionresearch/dietandcardiovasc/n02programme/
n02projilist/n02013/. Accessed June 2006.
[15] Haraldsdottir J. Minimizing error in the field: quality control in dietary
surveys. Eur J Clin Nutr 1993;47(suppl 2):S19–24.
[16] Stichting NEVO. NEVO-tabel 2001. Nederlands Voedingsstoffenbe-
stand. Den Haag: Voedingscentrum; 2001.
[17] Food Standards Agency, Royal Society of Chemistry. McCance and
Widdowson’s the composition of foods. Cambridge: Royal Society
of Chemistry; 2001.
[18] World Health Organisation. Preparation and use of food-based dietary
guidelines. Report of a joint FAO/WHO consultation. Geneva: World
Health Organisation; 1998.
[19] United States Department of Agriculture: Nationalnutrient database for
standard reference. Available at: www.nal.usda.gov/fnic/foodcomp/
data. Accessed June 2006.
[20] World Health Organisation. Clinical guidelines on the identification, eval-
uation, and treatment of overweight and obesity in adults—the evidence
report. National Institutes of Health. Obes Res 1998;6(suppl 2):51S–209.
[21] Chrostek L, Jelski W, Szmitkowski M, Puchalski Z. Gender-related dif-
ferences in hepatic activity of alcohol dehydrogenase isoenzymes and
aldehyde dehydrogenase in humans. J Clin Lab Anal 2003;17:93–6.
[22] Martins e Silva J, Saldanha C. Diet, atherosclerosis and atherothrom-
botic events. Rev Port Cardiol 2007;26:277–94.
[23] Tsugane S, Sasazuki S. Diet and the risk of gastric cancer: review of
epidemiological evidence. Gastric Cancer 2007;10:75–83.
[24] Michels KB, Mohllajee AP, Roset-Bahmanyar E, Beehler GP,
Moysich KB. Diet and breast cancer: a review of the prospective obser-
vational studies. Cancer 2007;109:2712–49.
[25] Gonzalez CA, Riboli E. Diet and cancer prevention: where we are,
where we are going. Nutr Cancer 2006;56:225–31.
[26] Marantz PR, Bird ED, Alderman MH. A call for higher standards of
evidence for dietary guidelines. Am J Prev Med 2008;34:234–40.
[27] World Health Organization. FAO/WHO technical consultation on na-
tional food-based dietary guidelines. Cairo: Food and Agriculture
Organization, World Health Organization; 2006.
[28] Albert JL, Samuda PM, Molina V, Regis TM, Severin M, Finlay B,
Prevost JL. Developing food-based dietary guidelines to promote
healthy diets and lifestyles in the Eastern Caribbean. J Nutr Educ Behav
2007;39:343–50.
[29] Keller I, Lang T. Food-based dietary guidelines and implementation:
lessons from four countries—Chile, Germany, New Zealand and South
Africa. Public Health Nutr 2008;11:867–74.
[30] Aranceta J, Serra-Majem L. Dietary guidelines for the Spanish popula-
tion. Public Health Nutr 2001;4:1403–8.
[31] Krishnaswamy K. Developing and implementing dietary guidelines in
India. Asia Pac J Clin Nutr 2008;17(suppl 1):66–9.
[32] Tzeng MS. From dietary guidelines to daily food guide: the Taiwanese
experience. Asia Pac J Clin Nutr 2008;17(suppl 1):59–62.
[33] Bingham S, Gill C, Welch A, Cassidy A, Runswick S, Oakes S, et al.
Validation of dietary assessment methods in the UK arm of EPIC using
weighed records, and 24-hour urinary nitrogen and potassium and
serum vitamin C and carotenoids as biomarkers. Int J Epidemiol
1997;26(Suppl 1):S137–51.
[34] Deharveng G, Charrondiere UR, Slimani N, Southgate DA, Riboli E.
Comparison of nutrients in the food composition tables available in the
nine European countries participating in EPIC. European Prospective In-
vestigation into Cancer and Nutrition. Eur J Clin Nutr 1999;53:60–79.
[35] Charrondiere UR, Vignat J, Møller A, Ireland JD, Becker W, Church S.
The European Nutrient Database (ENDB) for nutritional epidemiology.
J Food Comp Anal 2002;15:435–51.
[36] Egan MB, Fragodt A, Raats MM, Hodgkins C, Lumbers M. The impor-
tance of harmonizing food composition data across Europe. Eur J Clin
Nutr 2007;61:813–21.
[37] Saenz de, Tejada E. Descripcion analıtica de los patrones alimentarios
en mesoamerica desde los tiempos prehistoricas hasta el presente, con
especial atencion a la triada (Analytical description of dietary patterns
in Mesoamerica from prehistoric times to modern times, with special
emphasis on the triad). Guatemala City: Universidad de Valle de Gua-
temala; 1988.
[38] Ferlay J, Bray F, Pisani P, Parkin DM, GLOBOCAN. Cancer incidence,
mortality and prevalence worldwide. Lyon: IARC Press; 2002. 2004.
[39] World Health Organization, Food and Agriculture Organization.
Guidelines on food fortification with micronutrients. Geneva: World
Health Organization, Food and Agriculture Organization; 2006.
[40] Krause VM, Solomons NW, Tucker KL, Lopez-Palacios CY, Ruz M,
Kuhnlein HV. Rural–urban variation in the calcium, iron, zinc and cop-
per content of tortillas and intake of these minerals from tortillas by
women in Guatemala. Ecol Food Nutr 1992;28:289–97.
[41] World Cancer Research Fund, American Institute of Cancer Research.
Food, nutrition, physical activity and the prevention of cancer: a global
perspective. Washington, DC: World Cancer Research Fund; 2007.
[42] Linsalata M, Russo F. Nutritional factors and polyamine metabolism in
colorectal cancer. Nutrition 2008;24:382–9.