computerised cognitive behavioural therapy (ccbt): a possible treatment for mood disorders...
TRANSCRIPT
This article was downloaded by: [Andrew Bateman]On: 05 April 2013, At: 00:07Publisher: RoutledgeInforma Ltd Registered in England and Wales Registered Number: 1072954Registered office: Mortimer House, 37-41 Mortimer Street, London W1T 3JH,UK
NeuropsychologicalRehabilitation: An InternationalJournalPublication details, including instructions for authorsand subscription information:http://www.tandfonline.com/loi/pnrh20
Dimensions of the DysexecutiveQuestionnaire (DEX) examinedusing Rasch analysisSara K. Simblett a b & Andrew Bateman ca National Institute for Health Research (NIHR)Collaborations for Leadership in Applied HealthResearch and Care (CLAHRC) for Cambridgeshire andPeterborough, UKb Cambridge Intellectual and DevelopmentalDisabilities Research Group, Department of Psychiatry,University of Cambridge, UKc The Oliver Zangwill Centre for NeuropsychologicalRehabilitation, Ely, Cambridgeshire, UKVersion of record first published: 21 Dec 2010.
To cite this article: Sara K. Simblett & Andrew Bateman (2011): Dimensions of theDysexecutive Questionnaire (DEX) examined using Rasch analysis, NeuropsychologicalRehabilitation: An International Journal, 21:1, 1-25
To link to this article: http://dx.doi.org/10.1080/09602011.2010.531216
PLEASE SCROLL DOWN FOR ARTICLE
Full terms and conditions of use: http://www.tandfonline.com/page/terms-and-conditions
This article may be used for research, teaching, and private study purposes.Any substantial or systematic reproduction, redistribution, reselling, loan, sub-
licensing, systematic supply, or distribution in any form to anyone is expresslyforbidden.
The publisher does not give any warranty express or implied or make anyrepresentation that the contents will be complete or accurate or up todate. The accuracy of any instructions, formulae, and drug doses should beindependently verified with primary sources. The publisher shall not be liablefor any loss, actions, claims, proceedings, demand, or costs or damageswhatsoever or howsoever caused arising directly or indirectly in connectionwith or arising out of the use of this material.
Dow
nloa
ded
by [
And
rew
Bat
eman
] at
00:
07 0
5 A
pril
2013
Dimensions of the Dysexecutive Questionnaire (DEX)
examined using Rasch analysis
Sara K. Simblett1,2, and Andrew Bateman3
1National Institute for Health Research (NIHR) Collaborations for
Leadership in Applied Health Research and Care (CLAHRC) for
Cambridgeshire and Peterborough, UK2Cambridge Intellectual and Developmental Disabilities Research Group,
Department of Psychiatry, University of Cambridge, UK3The Oliver Zangwill Centre for Neuropsychological Rehabilitation, Ely,
Cambridgeshire, UK
Executive dysfunction is very broad term used to capture a range of interactinghigh-level cognitive, emotional and behavioural difficulties, commonly seenafter acquired brain injury (ABI). Many argue that the concept of executivefunctioning should be subdivided into several separate dimensions. In thisstudy we explore the dimensional structure of a tool designed to assess levelof executive functioning, the Dysexecutive (DEX) Questionnaire (Burgess,Alderman, Wilson, Evans, & Emslie, 1996), in order to inform theoretical con-ceptualisations of executive functioning and improve measurement precision inrehabilitation centres. Rasch analysis was undertaken on the responses of 363people with ABI to the DEX. Overall, the questionnaire did not perform as aunidimensional, interval-level scale of executive functioning, suggesting thatit measures more than one psychological construct. Most subscales previouslyproposed using factor analysis, including those suggested in the DEX manual,did not perform as unidimensional interval-level scales either. Several newsubscales in keeping with theoretical conceptualisations of the different
Correspondence should be sent to Sara K. Simblett, Cambridge Intellectual and Developmental
Disabilities Research Group, Department of Psychiatry, University of Cambridge, Douglas House,
18 B, Trumpington Road, Cambridge, CB2 8AH, UK. E-mail: [email protected]
The data reported here were collected by clinicians at the Oliver Zangwill Centre for Neuro-
psychological Rehabilitation. The preparation this paper was funded by an NIHR CLAHRC for
Cambridgeshire and Peterborough PhD award to the first author; we are grateful for their
support.
NEUROPSYCHOLOGICAL REHABILITATION
2011, 21 (1), 1–25
# 2011 Psychology Press, an imprint of the Taylor & Francis Group, an Informa business
http://www.psypress.com/neurorehab DOI:10.1080/09602011.2010.531216
Dow
nloa
ded
by [
And
rew
Bat
eman
] at
00:
07 0
5 A
pril
2013
dimensions of executive functioning are proposed, alongside suggestions forrevision of the wording and scoring of some of the items in the DEX. Theseresults provide a platform for future evaluation of executive function rehabili-tation programmes.
Keywords: Dysexecutive Questionnaire; DEX; Acquired brain injury; Raschanalysis.
INTRODUCTION
Changes in the ability to plan, problem-solve, make decisions, initiate actions,multitask, grasp abstract concepts, and regulate emotions are frequentlyencountered after acquired brain injury (ABI; see McDonald, Flashman, &Saykin, 2002). These executive functions are often relied upon to adapt andrespond appropriately to the environment, as well as prioritise and maintainfocus on goals. Therefore, impairments in such abilities can severelyimpact on a person’s ability to function independently and productively ineveryday life (Hanks, Rapport, Millis, & Deshpanse, 1999). However,despite this, deficits in executive functioning are deceptively subtle when itcomes to neuropsychological assessment. Indeed, people with executive def-icits often perform relatively normally on neuropsychological assessment bat-teries commonly employed to screen for cognitive impairments, and yetstruggle to perform activities in everyday life (Damasio, 1994; Shallice &Burgess, 1991; Stuss & Benson, 1983). According to Gilbert, Zamenopoulos,Alexiou, and Johnson (2010) this is likely to be the result of dissociationbetween well-structured and ill-structured problems, with the majority of neu-ropsychological tests being “well specified and clearly cued”, and everydaytasks being more unpredictable. Research has shown that application of com-pensatory strategies that reintroduce structure and control, such as the use ofproblem-solving or goal management schemas (D’Zurilla & Nezu, 1999;Levine et al., 2000; Rath, Simon, Langenbahn, Sherr, & Diller, 2003; vonCramon, Cramon, & Mai, 1991) and emotion regulation or adaptive copingtechniques (Anson & Ponsford, 2006; Medd & Tate, 2000; Rath et al.,2003); or that prompt people to remember to do something (including imple-menting specific cognitive or behavioural strategies in everyday life), such asthe use of visual or auditory cues (Alderman, Fry, & Youngson, 1995; Fishet al., 2007; Manly, Hawkins, Evans, Woldt, & Robertson, 2002), can aidexecutive functioning.
However, the concept of executive functioning remains broad. Past researchsuggests that executive functioning may not be a unidimensional concept.Focal damage to different areas of the brain has been found to result in differenttypes of executive impairment. For example, on the basis of previous human
2 SIMBLETT AND BATEMAN
Dow
nloa
ded
by [
And
rew
Bat
eman
] at
00:
07 0
5 A
pril
2013
lesions studies, Stuss (2007) has identified four functional domains within theprefrontal cortex (PFC), with damage primarily affecting the dorsolateralregion of the PFC being associated with impairments in “executive cognitivefunctions”, such as working memory and attentional set shifting; damageprimarily to the ventral (medial) region of the PFC resulting in impaired“behavioural/emotional self-regulatory functions”, such as making decisionsthat require an understanding of the emotional consequences of behaviour;damage to the medial (anterior cingulate or superior) frontal regions producingspecific impairments associated with “activation regulating functions”, such asappropriately initiating, sustaining and terminating actions; and damage to thefrontal polar region causing deficits in metacognitive processes, such as anawareness of the mental state or goals of oneself or others. Although executivefunctions are unlikely to be confined to the frontal lobes (Alvarez & Emory,2006), it may still be advantageous to divide the concept of executive function-ing into smaller sub-components such as those suggested by Stuss (2007),which each describe a distinct measurable function within a process.
If executive functioning is not a unidimensional concept, but is rather anumbrella term that captures a collection of separable cognitive and behaviour-al functions, it is likely that different people will experience different types ofexecutive impairment following an acquired brain injury and therefore benefitfrom using different types of compensatory strategies to aid their executivefunctioning. For instance, the use of problem-solving or goal managementschemas might be particularly good strategies for people experiencingproblems mainly with “executive cognitive functions”; emotion regulationor adaptive coping techniques equip people to deal more appropriately with“behavioural/emotional self-regulatory” problems; and prompting might bemost helpful to people who have difficulties with either “metacognitive pro-cesses” or “activation regulating functions”. As it is a lengthy and thus costlyprocess to teach people to implement compensatory strategies, it is clear thatthe ability to accurately identify specific areas of executive dysfunction,through neuropsychological assessment, would be extremely valuable torehabilitation centres.
The Dysexecutive (DEX) Questionnaire (Burgess et al., 1996) is a 20-itemscale which was designed to screen for changes in observable everyday mani-festations of executive dysfunction following ABI. It covers a wide range ofspecific problems including difficulties with attention, memory, informationprocessing, behavioural control, emotion regulation and awareness. Itemsare rated on the five-point (0–4) Likert scale with each point representing agreater level of problem severity (ranging from “never” to “very often”).The DEX is available in two different formats, a self-rating version forpeople with ABI to complete and an independent-rating version forsomeone close to that person to complete. Although the DEX was originallymeant for use as a qualitative tool for focusing rehabilitation on an individual’s
EXAMINATION OF THE DEX USING RASCH ANALYSIS 3
Dow
nloa
ded
by [
And
rew
Bat
eman
] at
00:
07 0
5 A
pril
2013
personal difficulties, it is now frequently used as a quantitative test instrumentfor diagnostic purposes (Bennett, Ong, & Ponsford, 2005; Chan, 2001; Magar,Philips, & Hosie, 2008; Oikawa, Oguri, Sato, Imamura, & Imamura, 2006).
The DEX has been shown to be a sensitive measure of executive dysfunc-tion after brain injury (Bennett et al., 2005). However, several pieces ofresearch have suggested that the interpretation of findings could be improvedby considering scores on several subscales. In other words the DEX measuresmultiple latent variables that represent different dimensions of executive dys-function. An initial factor analysis of the independent-rating version of theDEX within a sample of 78 people with a variety of neurological disorders(including closed head injury, encephalitis, dementia, stroke, anoxia, openhead injury, e.g. from gun-shot wounds, and Korsakoff’s syndrome), asreported in the DEX manual, revealed a three factor structure, consisting ofsubscales for emotion, behaviour and cognition, accounted for more than50% of the variance in total DEX scores (Burgess et al., 1996). Severalfactor analyses have since been performed on different samples of peoplewith neurological conditions, including ABI, on both the self- and indepen-dent-rating versions of the DEX. Burgess et al. (1998) carried out anotherfactor analysis following the publication of the DEX manual on the indepen-dent-rating DEX scores for a slightly larger sample of 92 people with neuro-logical disorders of mixed aetiology, 80 of whom were of the non-progressiveABI type, similar to our sample. The findings of this analysis revealed that afive-factor structure, including separate scales for inhibition, intentionality,executive memory, positive affect, and negative affect, explained the mostvariance in total DEX scores (67.2%). More recently, Chaytor, Scmitter-Edgecombe, and Burr (2006) performed a principal component factor analy-sis on the self-rating version of the DEX completed by a small sample of 46adults with varying neurological conditions (including epilepsy, traumaticbrain injury, tumour, vascular accident or malformation, and multiple scler-osis), and subsequently concluded that the questionnaire had a multi-factorialstructure with five distinct subscales for behavioural inhibition, goal-directedbehaviour, executive memory/cognition, lack of awareness and agitation/hyperactivity (accounting for 71.9% of variance in total DEX scores). Follow-ing on from this, Bodenburg and Dopslaff (2008) analysed the self-ratingversion of the DEX translated into German, using principal componentsfactor analysis on a clinical, unselected sample of 191 people with ABI.Their result supported previous analyses that the questionnaire displays amultidimensional structure. However, they reported that a four-factor struc-ture captured the highest amount of variance (49.7%), with separate subscalesfor initiating and sustaining action; impulse control and sequencing; psycho-physical and mental excitability; and social conventions.
If it is the case that the DEX measures not one psychological construct, buta series of related psychological constructs, then it should be analysed as
4 SIMBLETT AND BATEMAN
Dow
nloa
ded
by [
And
rew
Bat
eman
] at
00:
07 0
5 A
pril
2013
separate subscales in future research, otherwise change score estimationsaimed at establishing the efficacy of rehabilitation interventions may be mis-leading. It is perhaps the case that different groups of compensatory strategiespreviously mentioned are beneficial for different symptoms which fall intodifferent dimensions of executive function. For example, goal managementor problem solving schemas are arguably best taught to people scoring highon subscales labelled as goal-directed behaviour or intentionality; promptingmay most benefit someone scoring high on subscales labelled as executivememory or cognition; and emotion regulation or adaptive coping techniquesmay be of most use to people scoring high on subscales labelled as emotion,positive affect, negative affect or inhibition (Burgess et al., 1996; Burgess,Alderman, Evans, Emslie, & Wilson, 1998; Chaytor et al., 2006). Greaterknowledge of whether different strategies for rehabilitation of executive func-tion relate to scores on separate subscales of measures of executive dysfunc-tion, such as the DEX, may therefore help to guide choice of treatment forindividuals in future years.
However, traditional psychometric methods based on classical test theory,such as factor analysis, have received criticism for making assumptions aboutcertain characteristics of the data (see Novick, 1966) without first analysingwhether response patterns meet the formal axioms that underpin measure-ment. For example, Hobart and Cano (2009) claimed that traditional psycho-metric methods are limited by making the assumption that ordinal-level dataequates to interval-level data, i.e., the distances between response categoriesare consistent within and across items and the distances between differentscores on a scale are consistent across the entire continuum of the underlyingconstruct. The Rasch measurement model (Rasch, 1960), also known as theone-parameter logistic model in item response theory (see Hambleton, Swa-minathan, & Rogers, 1991), was developed as a framework for testingwhether responses to ordinal scales, such as the DEX, behave in a patternthat satisfies the axioms necessary for it to be classed as an interval-scalemeasurement tool (Tennant & Conaghan, 2007).
The Rasch model takes into account both item difficulty and person ability.In terms of people with ABI, item difficulty can be seen as relating to theseverity of each of person’s symptoms, and person ability can be seen as relat-ing to the overall severity of their disorder (Bateman, Teasdale, & Willmes,2009). The model is based on a separate set of assumptions to psychometricmethods belonging to classical test theory. It is expected that:
1. People respond in a probabilistic manner – a person with a higher levelof executive dysfunction will endorse more of the questions on the DEXthan a person with a lower level of executive dysfunction, and peopleare more likely to endorse items relating to symptoms commonlyreported first, than those that are rarely reported.
EXAMINATION OF THE DEX USING RASCH ANALYSIS 5
Dow
nloa
ded
by [
And
rew
Bat
eman
] at
00:
07 0
5 A
pril
2013
2. People respond to categories in an ordered manner that reflects themetric of the underlying construct – for the DEX, the probability ofa person endorsing a response category high on the scale for eachitem is a function of symptom severity.
3. Items are targeted to suit the ability of a specific population – item dif-ficulty should be driven by the ability of the population aiming to bemeasured, to enable the maximum level of measurement precision.
4. Items are locally independent – an answer to one question should notdetermine the answer to another, otherwise they are not contributingto measuring a specific construct in a meaningful way. It is misleadingto assess the same aspect of a construct multiple times as this artificiallyinflates the reliability and suggests the measure is capable of greaterprecision than it actually is (Baghaei, 2008).
5. Differential item functioning is not present – the probability of endor-sing a question should be the same irrespective of individual differenceswithin the sample, for example, factors such as brain injury aetiology,the person reporting the symptoms (i.e., self- or independent-ratings)and the gender of the responder.
6. Scales are unidimensional – all items contribute to providing infor-mation about a single underlying construct. If the measure is unidimen-sional each person can be conceptualised as a point on a singlecontinuum (Andrich, 1982), but this is not always the case, some ques-tionnaires need to be split into subscales which measure separate, albeitrelated, constructs.
If responses on a questionnaire perform as expected by the Rasch model,i.e., fit with the assumptions mentioned above, it can be inferred that it hasgood construct validity, and can function as a true interval-level measure ofa latent variable.
Recently, Chan and Bode (2008) examined whether responses to theChinese self- and independent-rating versions of the DEX from a group of92 people who had suffered a traumatic brain injury (TBI) and an equalnumber of independent informants, fitted the Rasch model. Certain items,such as those aimed at measuring degree of restlessness (item 15), confabula-tion (item 3) and perseveration (item 14), were found to misfit the Raschmodel, suggesting that they were measuring a separate construct to the restof the items in one or both versions of the DEX. Unfortunately, this paperdid not report whether the responses to either version of the questionnairemet all six assumptions of the Rasch model, for example, it was not reportedif the scale was found to be unidimensional, or whether any items displayedlocal dependency. As a result, very little can be concluded about whetherexecutive functioning can be validly measured as a single psychological con-struct by the DEX. Furthermore, by translating the questionnaire into another
6 SIMBLETT AND BATEMAN
Dow
nloa
ded
by [
And
rew
Bat
eman
] at
00:
07 0
5 A
pril
2013
language one risks altering the meaning of each item and thus the constructbeing measured. Given the wide use of the English version of the DEXboth in research and clinical practice, it is important that its validity andreliability is assessed directly rather than relying on the validation of alterna-tive versions. As such, in this paper, we report validation of the Englishversion of the DEX in a sample of 363 people with ABI, using a Rasch analy-sis approach to assess all six assumptions of the Rasch measurement model.
METHODS
Participants
The data used in this analysis were responses to the DEX from 363 clients(255 male and 108 female aged between 18 and 75 years; mean age 37 +13 years; mean age of injury onset 32 + 14 years) assessed at the OliverZangwill Centre for Neuropsychological Rehabilitation over the past 13years. All patients were referred to the centre because they had sustainedan acquired brain injury which had subsequently caused significant problemsto their everyday functioning. The aetiologies of the brain injuries within thesample broke down into traumatic (n ¼ 248; including open and closed trau-matic brain injuries), non-traumatic (n ¼ 103; including the presence of atumour or cyst, exposure to toxins, a cerebrovascular accident, a diagnosisof epilepsy, infection and hydrocephalus), and unknown or unavailable infor-mation about cause (n ¼ 12).
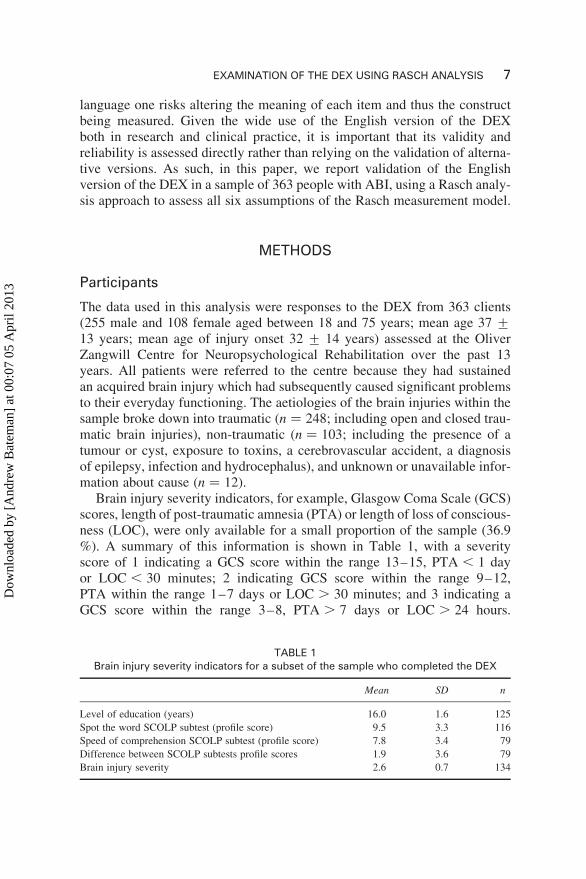
Brain injury severity indicators, for example, Glasgow Coma Scale (GCS)scores, length of post-traumatic amnesia (PTA) or length of loss of conscious-ness (LOC), were only available for a small proportion of the sample (36.9%). A summary of this information is shown in Table 1, with a severityscore of 1 indicating a GCS score within the range 13–15, PTA , 1 dayor LOC , 30 minutes; 2 indicating GCS score within the range 9–12,PTA within the range 1–7 days or LOC . 30 minutes; and 3 indicating aGCS score within the range 3–8, PTA . 7 days or LOC . 24 hours.
TABLE 1Brain injury severity indicators for a subset of the sample who completed the DEX
Mean SD n
Level of education (years) 16.0 1.6 125
Spot the word SCOLP subtest (profile score) 9.5 3.3 116
Speed of comprehension SCOLP subtest (profile score) 7.8 3.4 79
Difference between SCOLP subtests profile scores 1.9 3.6 79
Brain injury severity 2.6 0.7 134
EXAMINATION OF THE DEX USING RASCH ANALYSIS 7
Dow
nloa
ded
by [
And
rew
Bat
eman
] at
00:
07 0
5 A
pril
2013
Indicators of the degree of cognitive change following acquired brain injury,i.e., the difference between scores on the spot-the-word and the speed of com-prehension subtests from the Speed and Capacity of Language Processing(SCOLP) test, were also only available for a small subset of our sample(21.8%), see Table 1.
Data analysis
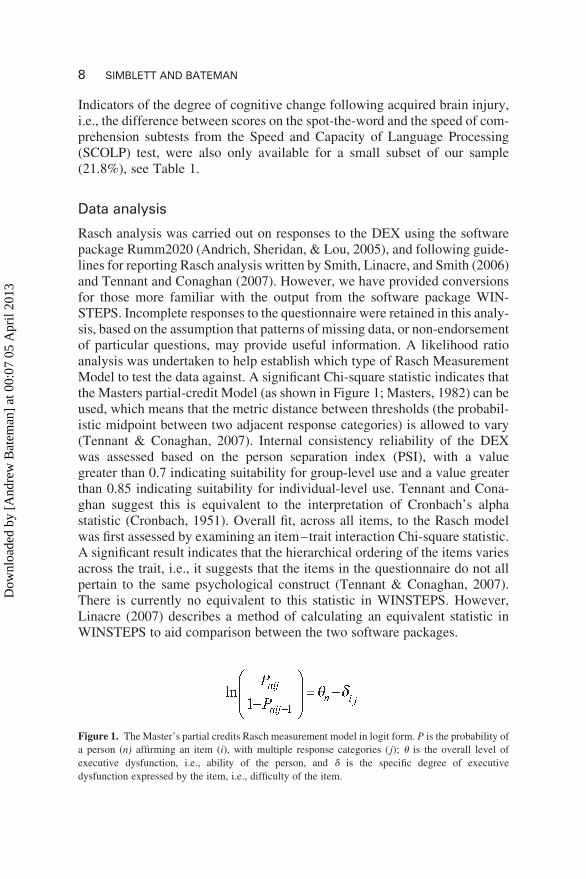
Rasch analysis was carried out on responses to the DEX using the softwarepackage Rumm2020 (Andrich, Sheridan, & Lou, 2005), and following guide-lines for reporting Rasch analysis written by Smith, Linacre, and Smith (2006)and Tennant and Conaghan (2007). However, we have provided conversionsfor those more familiar with the output from the software package WIN-STEPS. Incomplete responses to the questionnaire were retained in this analy-sis, based on the assumption that patterns of missing data, or non-endorsementof particular questions, may provide useful information. A likelihood ratioanalysis was undertaken to help establish which type of Rasch MeasurementModel to test the data against. A significant Chi-square statistic indicates thatthe Masters partial-credit Model (as shown in Figure 1; Masters, 1982) can beused, which means that the metric distance between thresholds (the probabil-istic midpoint between two adjacent response categories) is allowed to vary(Tennant & Conaghan, 2007). Internal consistency reliability of the DEXwas assessed based on the person separation index (PSI), with a valuegreater than 0.7 indicating suitability for group-level use and a value greaterthan 0.85 indicating suitability for individual-level use. Tennant and Cona-ghan suggest this is equivalent to the interpretation of Cronbach’s alphastatistic (Cronbach, 1951). Overall fit, across all items, to the Rasch modelwas first assessed by examining an item–trait interaction Chi-square statistic.A significant result indicates that the hierarchical ordering of the items variesacross the trait, i.e., it suggests that the items in the questionnaire do not allpertain to the same psychological construct (Tennant & Conaghan, 2007).There is currently no equivalent to this statistic in WINSTEPS. However,Linacre (2007) describes a method of calculating an equivalent statistic inWINSTEPS to aid comparison between the two software packages.
Figure 1. The Master’s partial credits Rasch measurement model in logit form. P is the probability of
a person (n) affirming an item (i), with multiple response categories ( j); u is the overall level of
executive dysfunction, i.e., ability of the person, and d is the specific degree of executive
dysfunction expressed by the item, i.e., difficulty of the item.
8 SIMBLETT AND BATEMAN
Dow
nloa
ded
by [
And
rew
Bat
eman
] at
00:
07 0
5 A
pril
2013
Further initial information regarding the fit of both items and persons to theRasch model was gathered using two item–person interaction statistics. Asthese statistics are transformed to approximate z-scores, fit is assessed by con-sidering whether the mean and standard deviation differ from 0 and 1, respect-ively (Pallant & Tennant, 2007). As far as the authors are aware, there iscurrently no equivalent to these statistics in WINSTEPS. Targeting ofitems on the DEX to our sample of people with ABI was examined by com-paring the mean location score of the persons with the value of zero set for theitems, with a small value indicating appropriate targeting.
Individual item fit was then explored in greater depth by comparing theobserved and expected values between groups of respondents representingdifferent ability levels (called class intervals) in terms of executive function-ing. Items were deemed to fit the model if their fit residuals (standardisedsummations of person deviations from the expected pattern of response)were within the range of +2.5 (Pallant & Tennant, 2007; equivalent to theoutfit z-standardised t-statistics produced in WINSTEPS; Linacre, 2007;Tennant & Pallant, 2006), and the associated Chi-square statistic was non-sig-nificant (p-value , .05 or a Bonferroni corrected value to take account ofmultiple testing; Bland & Altman, 1995; Tennant & Conaghan, 2007).Significantly misfitting items based on these statistics may indicate that anitem is over-discriminating (if fit residual is ,22.5), or under-discriminating(if fit residual .2.5) between abilities.
As with each item, the fit residuals for individual persons were examined tosee if they were within the acceptable range of +2.5 (again, this is equivalentto the outfit z-standardised t-statistics produced in WINSTEPS; Linacre, 2007;Tennant & Pallant, 2006). Misfitting individuals based on these residuals mayindicate that the person’s response pattern is either very predictable (if fitresidual ,22.5), or very unpredictable (if fit residual .2.5; Wright, 1995).
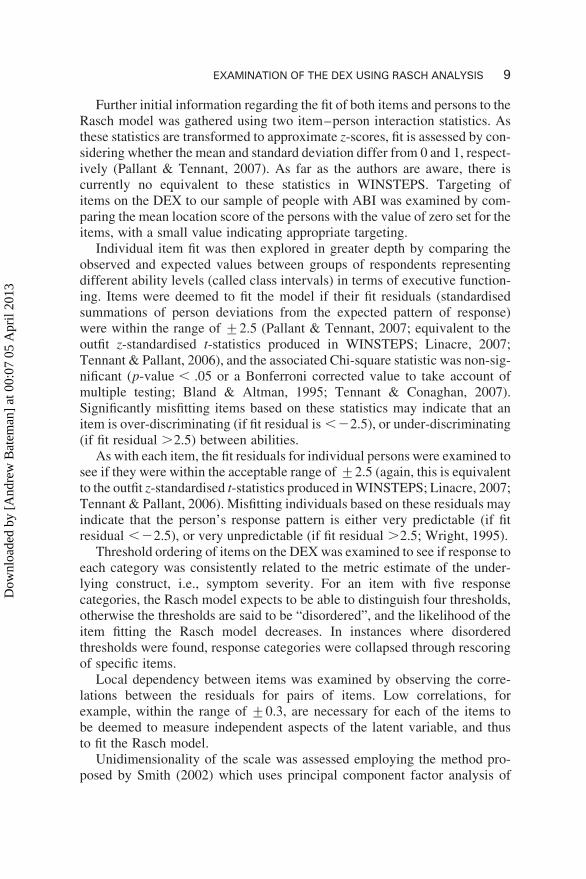
Threshold ordering of items on the DEX was examined to see if response toeach category was consistently related to the metric estimate of the under-lying construct, i.e., symptom severity. For an item with five responsecategories, the Rasch model expects to be able to distinguish four thresholds,otherwise the thresholds are said to be “disordered”, and the likelihood of theitem fitting the Rasch model decreases. In instances where disorderedthresholds were found, response categories were collapsed through rescoringof specific items.
Local dependency between items was examined by observing the corre-lations between the residuals for pairs of items. Low correlations, forexample, within the range of +0.3, are necessary for each of the items tobe deemed to measure independent aspects of the latent variable, and thusto fit the Rasch model.
Unidimensionality of the scale was assessed employing the method pro-posed by Smith (2002) which uses principal component factor analysis of
EXAMINATION OF THE DEX USING RASCH ANALYSIS 9
Dow
nloa
ded
by [
And
rew
Bat
eman
] at
00:
07 0
5 A
pril
2013
the residuals for each item after the contribution of the latent trait, the “Rasch”factor, has been extracted. Two subsets of correlations between the items andthe first residual factor were identified, with each group made up of an equalnumber of values from one or other of the extremes (e.g., items showing thehighest level of correlation with the first residual factor and items showingthe lowest level of correlation with the first residual factor), and an indepen-dent t-test on the person estimates for these two groups was undertaken.Unidimensionality was assumed if less than 5% of the sample displayed asignificant difference (p , .05), and the acceptability of this conclusion wasfurther supported if the lower 95% confidence interval for a binomial test onthe proportion of tests that failed to meet the previous criteria was below 5%.
Items were further assessed for bias or differential item functioning using atwo-way analysis of variance (ANOVA) calculation, with a Bonferroniadjustment for multiple comparisons, on the person–response residuals foreach item, by gender and brain injury aetiology (traumatic vs. non-traumaticcause of brain injury). It was expected that the probability of people fromwithin each severity grouping (class interval) endorsing an item should bethe same regardless of their gender or brain injury aetiology.
The main aim of employing Rasch analysis was to establish what type ofchanges might need to be made to the DEX in order for it to conform to thestrict principles that underlie interval-level measurement. Therefore, an itera-tive process was undertaken during the analysis, whereby it was tested ifrescoring, removal and, sometimes, replacement of both items and persons,on the basis of the fit criteria detailed above, impacted on the overall fit ofthe data to the Rasch model.
If the DEX was still found to violate the assumption of unidimensionalityafter rescoring or removal of misfitting items or persons, possible subscaleswould be identified in two ways. First, we would group together itemswhich have been suggested to form subscales in previous factor analyses.Second, we would perform a principal component analysis on the residualsfor each item, i.e., the variance not explained by the Rasch model (alsoknown as Rasch factor analysis), to help identify alternative subscales. Thesuitability of several alternative subscales would then be assessed by examin-ing the same fit criteria used when testing whether the overall scale fit theRasch model.
RESULTS
Missing data
Of the 363 responses to the DEX, 337 were fully completed. The percentageof the sample who left items unmarked ranged between 0% and 1.9% for each
10 SIMBLETT AND BATEMAN
Dow
nloa
ded
by [
And
rew
Bat
eman
] at
00:
07 0
5 A
pril
2013
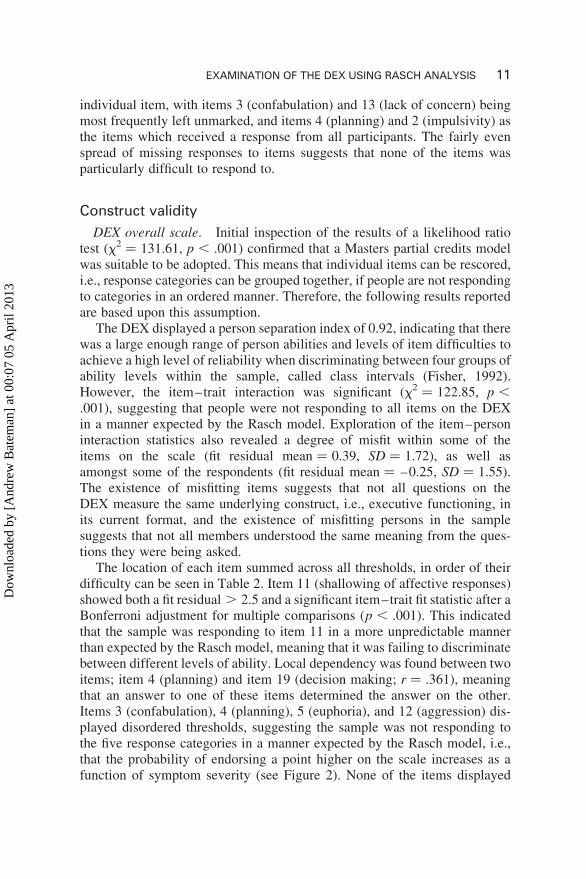
individual item, with items 3 (confabulation) and 13 (lack of concern) beingmost frequently left unmarked, and items 4 (planning) and 2 (impulsivity) asthe items which received a response from all participants. The fairly evenspread of missing responses to items suggests that none of the items wasparticularly difficult to respond to.
Construct validity
DEX overall scale. Initial inspection of the results of a likelihood ratiotest (x2 ¼ 131.61, p , .001) confirmed that a Masters partial credits modelwas suitable to be adopted. This means that individual items can be rescored,i.e., response categories can be grouped together, if people are not respondingto categories in an ordered manner. Therefore, the following results reportedare based upon this assumption.
The DEX displayed a person separation index of 0.92, indicating that therewas a large enough range of person abilities and levels of item difficulties toachieve a high level of reliability when discriminating between four groups ofability levels within the sample, called class intervals (Fisher, 1992).However, the item–trait interaction was significant (x2 ¼ 122.85, p ,
.001), suggesting that people were not responding to all items on the DEXin a manner expected by the Rasch model. Exploration of the item–personinteraction statistics also revealed a degree of misfit within some of theitems on the scale (fit residual mean ¼ 0.39, SD ¼ 1.72), as well asamongst some of the respondents (fit residual mean ¼ –0.25, SD ¼ 1.55).The existence of misfitting items suggests that not all questions on theDEX measure the same underlying construct, i.e., executive functioning, inits current format, and the existence of misfitting persons in the samplesuggests that not all members understood the same meaning from the ques-tions they were being asked.
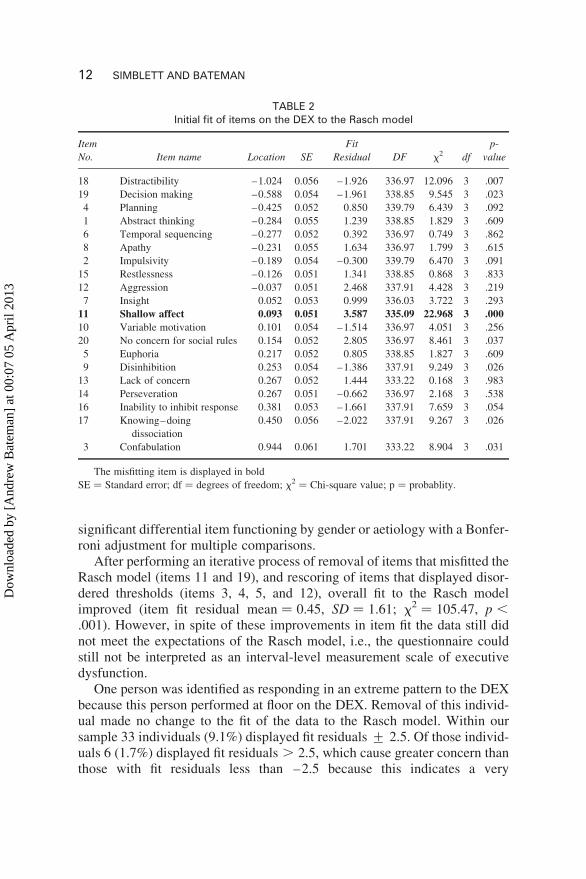
The location of each item summed across all thresholds, in order of theirdifficulty can be seen in Table 2. Item 11 (shallowing of affective responses)showed both a fit residual . 2.5 and a significant item–trait fit statistic after aBonferroni adjustment for multiple comparisons (p , .001). This indicatedthat the sample was responding to item 11 in a more unpredictable mannerthan expected by the Rasch model, meaning that it was failing to discriminatebetween different levels of ability. Local dependency was found between twoitems; item 4 (planning) and item 19 (decision making; r ¼ .361), meaningthat an answer to one of these items determined the answer on the other.Items 3 (confabulation), 4 (planning), 5 (euphoria), and 12 (aggression) dis-played disordered thresholds, suggesting the sample was not responding tothe five response categories in a manner expected by the Rasch model, i.e.,that the probability of endorsing a point higher on the scale increases as afunction of symptom severity (see Figure 2). None of the items displayed
EXAMINATION OF THE DEX USING RASCH ANALYSIS 11
Dow
nloa
ded
by [
And
rew
Bat
eman
] at
00:
07 0
5 A
pril
2013
significant differential item functioning by gender or aetiology with a Bonfer-roni adjustment for multiple comparisons.
After performing an iterative process of removal of items that misfitted theRasch model (items 11 and 19), and rescoring of items that displayed disor-dered thresholds (items 3, 4, 5, and 12), overall fit to the Rasch modelimproved (item fit residual mean ¼ 0.45, SD ¼ 1.61; x2 ¼ 105.47, p ,
.001). However, in spite of these improvements in item fit the data still didnot meet the expectations of the Rasch model, i.e., the questionnaire couldstill not be interpreted as an interval-level measurement scale of executivedysfunction.
One person was identified as responding in an extreme pattern to the DEXbecause this person performed at floor on the DEX. Removal of this individ-ual made no change to the fit of the data to the Rasch model. Within oursample 33 individuals (9.1%) displayed fit residuals + 2.5. Of those individ-uals 6 (1.7%) displayed fit residuals . 2.5, which cause greater concern thanthose with fit residuals less than –2.5 because this indicates a very
TABLE 2Initial fit of items on the DEX to the Rasch model
Item
No. Item name Location SE
Fit
Residual DF x2 df
p-
value
18 Distractibility –1.024 0.056 –1.926 336.97 12.096 3 .007
19 Decision making –0.588 0.054 –1.961 338.85 9.545 3 .023
4 Planning –0.425 0.052 0.850 339.79 6.439 3 .092
1 Abstract thinking –0.284 0.055 1.239 338.85 1.829 3 .609
6 Temporal sequencing –0.277 0.052 0.392 336.97 0.749 3 .862
8 Apathy –0.231 0.055 1.634 336.97 1.799 3 .615
2 Impulsivity –0.189 0.054 –0.300 339.79 6.470 3 .091
15 Restlessness –0.126 0.051 1.341 338.85 0.868 3 .833
12 Aggression –0.037 0.051 2.468 337.91 4.428 3 .219
7 Insight 0.052 0.053 0.999 336.03 3.722 3 .293
11 Shallow affect 0.093 0.051 3.587 335.09 22.968 3 .000
10 Variable motivation 0.101 0.054 –1.514 336.97 4.051 3 .256
20 No concern for social rules 0.154 0.052 2.805 336.97 8.461 3 .037
5 Euphoria 0.217 0.052 0.805 338.85 1.827 3 .609
9 Disinhibition 0.253 0.054 –1.386 337.91 9.249 3 .026
13 Lack of concern 0.267 0.052 1.444 333.22 0.168 3 .983
14 Perseveration 0.267 0.051 –0.662 336.97 2.168 3 .538
16 Inability to inhibit response 0.381 0.053 –1.661 337.91 7.659 3 .054
17 Knowing–doing
dissociation
0.450 0.056 –2.022 337.91 9.267 3 .026
3 Confabulation 0.944 0.061 1.701 333.22 8.904 3 .031
The misfitting item is displayed in bold
SE ¼ Standard error; df ¼ degrees of freedom; x2 ¼ Chi-square value; p ¼ probablity.
12 SIMBLETT AND BATEMAN
Dow
nloa
ded
by [
And
rew
Bat
eman
] at
00:
07 0
5 A
pril
2013
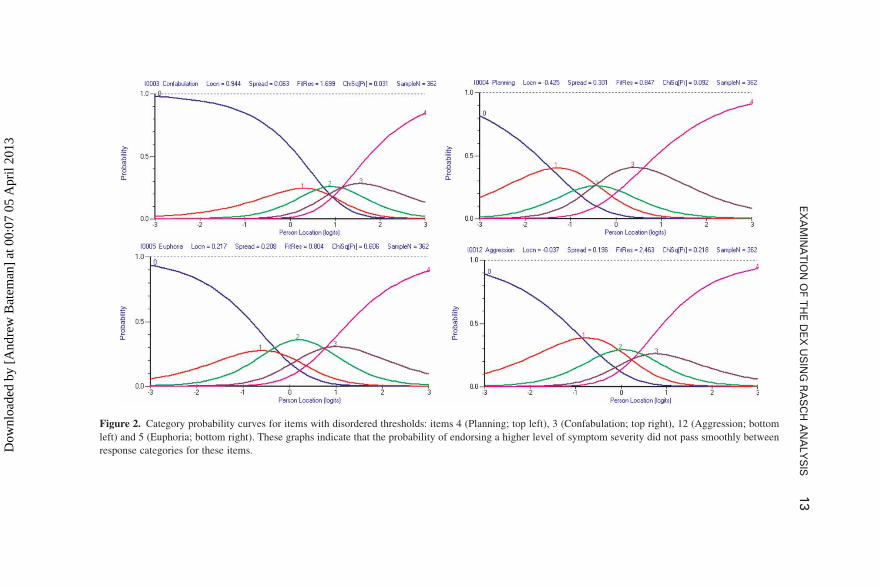
Figure 2. Category probability curves for items with disordered thresholds: items 4 (Planning; top left), 3 (Confabulation; top right), 12 (Aggression; bottom
left) and 5 (Euphoria; bottom right). These graphs indicate that the probability of endorsing a higher level of symptom severity did not pass smoothly between
response categories for these items.
EX
AM
INA
TIO
NO
FT
HE
DE
XU
SIN
GR
AS
CH
AN
ALY
SIS
13
Dow
nloa
ded
by [
And
rew
Bat
eman
] at
00:
07 0
5 A
pril
2013
unpredictable pattern of responding, as opposed to a very predictable patternof responding. Fit of the data to the Rasch model was slightly improved bydeletion of some of the sample (person fit residual mean ¼ –0.24, SD ¼1.47; x2 ¼ 95.83, p , .001). However, again, in spite of these improvementsin item fit the data still did not fit the Rasch model.
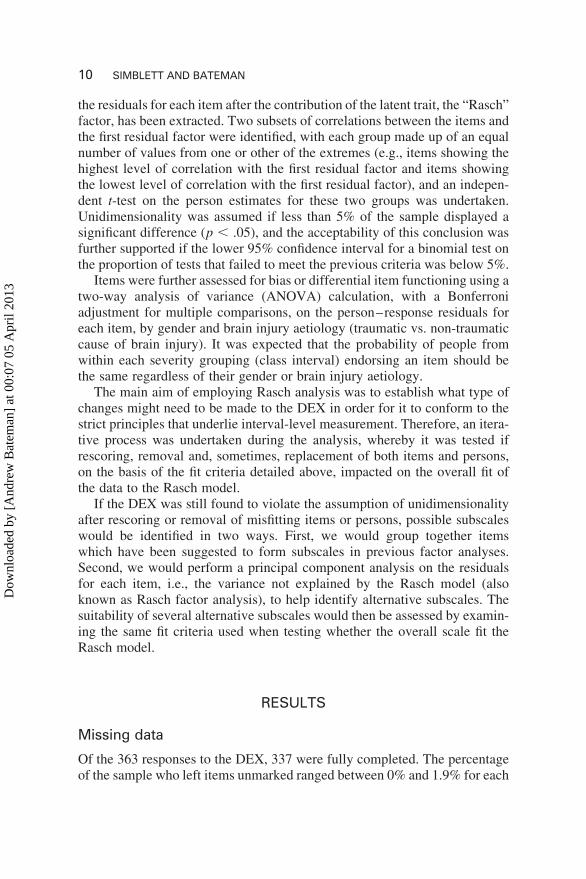
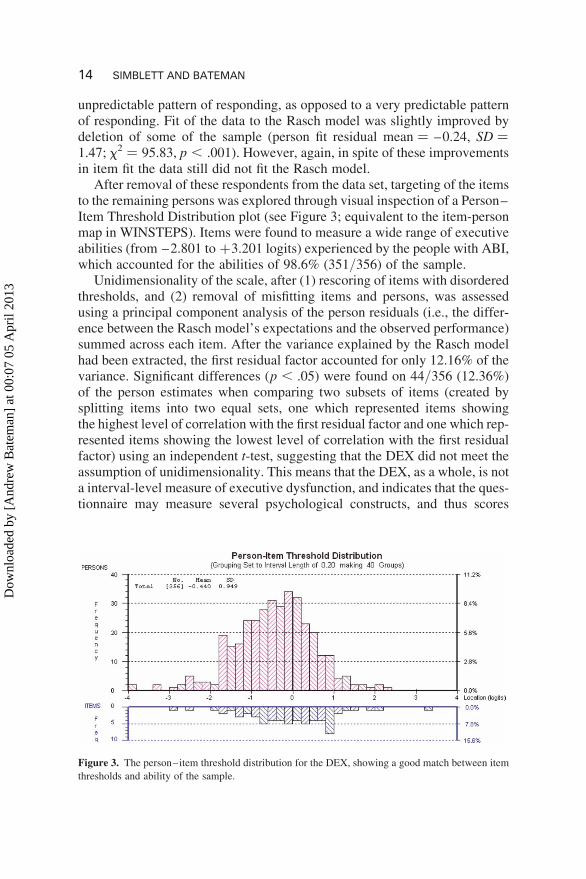
After removal of these respondents from the data set, targeting of the itemsto the remaining persons was explored through visual inspection of a Person–Item Threshold Distribution plot (see Figure 3; equivalent to the item-personmap in WINSTEPS). Items were found to measure a wide range of executiveabilities (from –2.801 to +3.201 logits) experienced by the people with ABI,which accounted for the abilities of 98.6% (351/356) of the sample.
Unidimensionality of the scale, after (1) rescoring of items with disorderedthresholds, and (2) removal of misfitting items and persons, was assessedusing a principal component analysis of the person residuals (i.e., the differ-ence between the Rasch model’s expectations and the observed performance)summed across each item. After the variance explained by the Rasch modelhad been extracted, the first residual factor accounted for only 12.16% of thevariance. Significant differences (p , .05) were found on 44/356 (12.36%)of the person estimates when comparing two subsets of items (created bysplitting items into two equal sets, one which represented items showingthe highest level of correlation with the first residual factor and one which rep-resented items showing the lowest level of correlation with the first residualfactor) using an independent t-test, suggesting that the DEX did not meet theassumption of unidimensionality. This means that the DEX, as a whole, is nota interval-level measure of executive dysfunction, and indicates that the ques-tionnaire may measure several psychological constructs, and thus scores
Figure 3. The person–item threshold distribution for the DEX, showing a good match between item
thresholds and ability of the sample.
14 SIMBLETT AND BATEMAN
Dow
nloa
ded
by [
And
rew
Bat
eman
] at
00:
07 0
5 A
pril
2013
might be better interpreted in terms of several subscales, representing differ-ent dimensions of executive functioning.
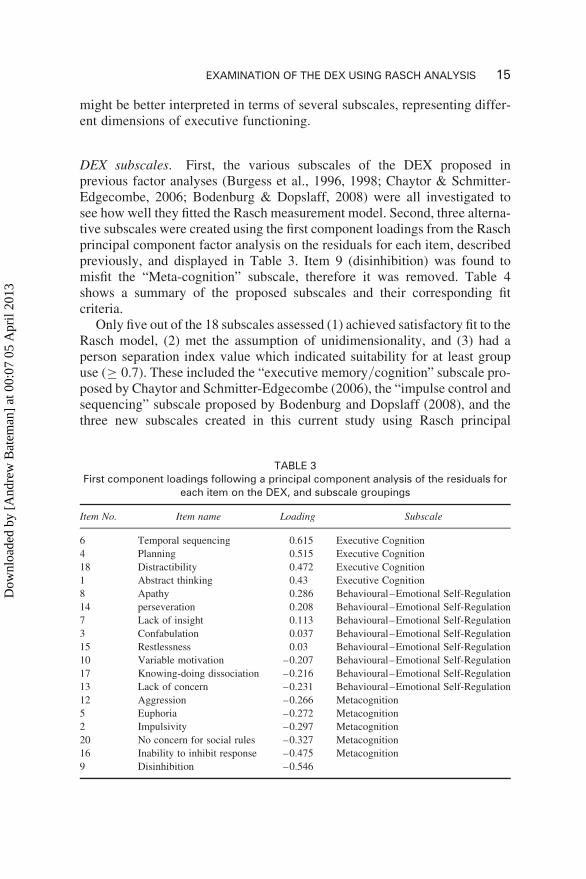
DEX subscales. First, the various subscales of the DEX proposed inprevious factor analyses (Burgess et al., 1996, 1998; Chaytor & Schmitter-Edgecombe, 2006; Bodenburg & Dopslaff, 2008) were all investigated tosee how well they fitted the Rasch measurement model. Second, three alterna-tive subscales were created using the first component loadings from the Raschprincipal component factor analysis on the residuals for each item, describedpreviously, and displayed in Table 3. Item 9 (disinhibition) was found tomisfit the “Meta-cognition” subscale, therefore it was removed. Table 4shows a summary of the proposed subscales and their corresponding fitcriteria.
Only five out of the 18 subscales assessed (1) achieved satisfactory fit to theRasch model, (2) met the assumption of unidimensionality, and (3) had aperson separation index value which indicated suitability for at least groupuse (≥ 0.7). These included the “executive memory/cognition” subscale pro-posed by Chaytor and Schmitter-Edgecombe (2006), the “impulse control andsequencing” subscale proposed by Bodenburg and Dopslaff (2008), and thethree new subscales created in this current study using Rasch principal
TABLE 3First component loadings following a principal component analysis of the residuals for
each item on the DEX, and subscale groupings
Item No. Item name Loading Subscale
6 Temporal sequencing 0.615 Executive Cognition
4 Planning 0.515 Executive Cognition
18 Distractibility 0.472 Executive Cognition
1 Abstract thinking 0.43 Executive Cognition
8 Apathy 0.286 Behavioural–Emotional Self-Regulation
14 perseveration 0.208 Behavioural–Emotional Self-Regulation
7 Lack of insight 0.113 Behavioural–Emotional Self-Regulation
3 Confabulation 0.037 Behavioural–Emotional Self-Regulation
15 Restlessness 0.03 Behavioural–Emotional Self-Regulation
10 Variable motivation –0.207 Behavioural–Emotional Self-Regulation
17 Knowing-doing dissociation –0.216 Behavioural–Emotional Self-Regulation
13 Lack of concern –0.231 Behavioural–Emotional Self-Regulation
12 Aggression –0.266 Metacognition
5 Euphoria –0.272 Metacognition
2 Impulsivity –0.297 Metacognition
20 No concern for social rules –0.327 Metacognition
16 Inability to inhibit response –0.475 Metacognition
9 Disinhibition –0.546
EXAMINATION OF THE DEX USING RASCH ANALYSIS 15
Dow
nloa
ded
by [
And
rew
Bat
eman
] at
00:
07 0
5 A
pril
2013
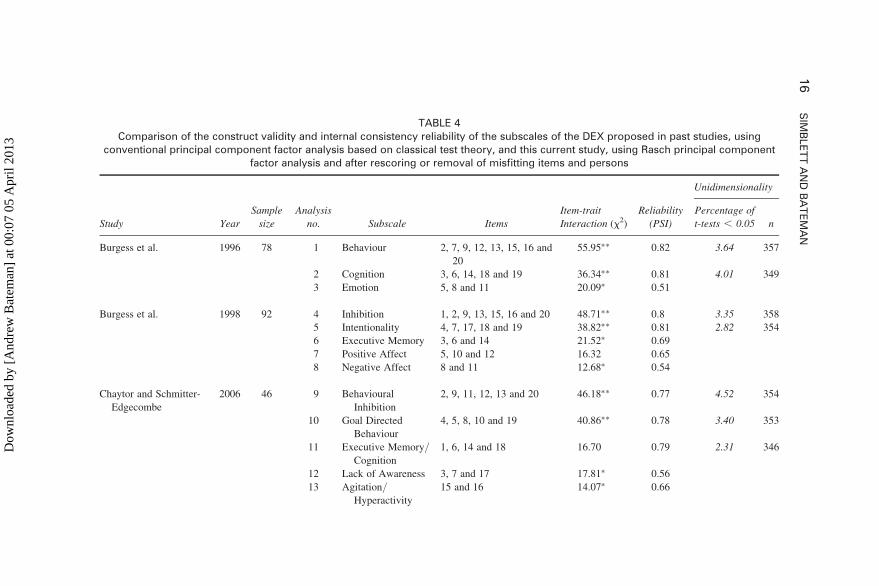
TABLE 4Comparison of the construct validity and internal consistency reliability of the subscales of the DEX proposed in past studies, using
conventional principal component factor analysis based on classical test theory, and this current study, using Rasch principal componentfactor analysis and after rescoring or removal of misfitting items and persons
Unidimensionality
Study Year
Sample
size
Analysis
no. Subscale Items
Item-trait
Interaction (x2)
Reliability
(PSI)
Percentage of
t-tests , 0.05 n
Burgess et al. 1996 78 1 Behaviour 2, 7, 9, 12, 13, 15, 16 and
20
55.95∗∗ 0.82 3.64 357
2 Cognition 3, 6, 14, 18 and 19 36.34∗∗ 0.81 4.01 349
3 Emotion 5, 8 and 11 20.09∗ 0.51
Burgess et al. 1998 92 4 Inhibition 1, 2, 9, 13, 15, 16 and 20 48.71∗∗ 0.8 3.35 358
5 Intentionality 4, 7, 17, 18 and 19 38.82∗∗ 0.81 2.82 354
6 Executive Memory 3, 6 and 14 21.52∗ 0.69
7 Positive Affect 5, 10 and 12 16.32 0.65
8 Negative Affect 8 and 11 12.68∗ 0.54
Chaytor and Schmitter-
Edgecombe
2006 46 9 Behavioural
Inhibition
2, 9, 11, 12, 13 and 20 46.18∗∗ 0.77 4.52 354
10 Goal Directed
Behaviour
4, 5, 8, 10 and 19 40.86∗∗ 0.78 3.40 353
11 Executive Memory/
Cognition
1, 6, 14 and 18 16.70 0.79 2.31 346
12 Lack of Awareness 3, 7 and 17 17.81∗ 0.56
13 Agitation/Hyperactivity
15 and 16 14.07∗ 0.66
16
SIM
BLE
TT
AN
DB
AT
EM
AN
Dow
nloa
ded
by [
And
rew
Bat
eman
] at
00:
07 0
5 A
pril
2013
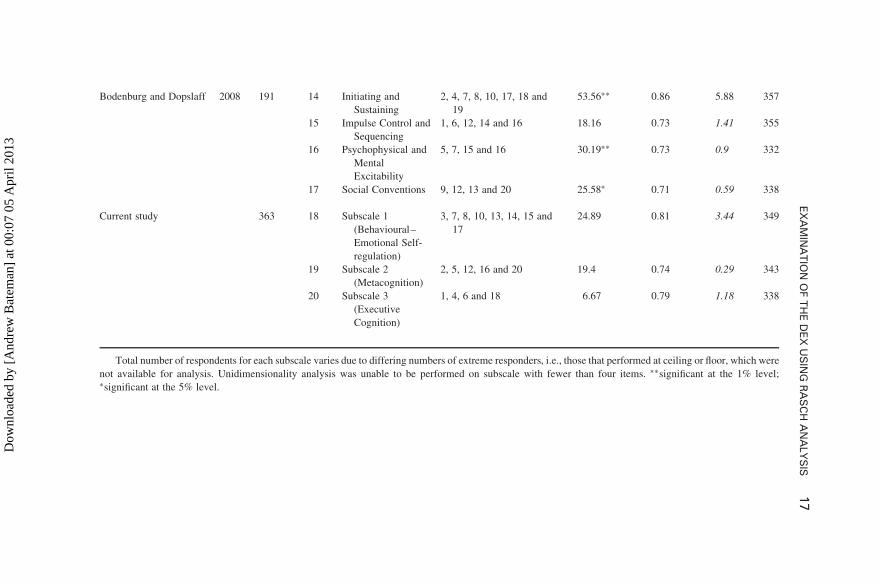
Bodenburg and Dopslaff 2008 191 14 Initiating and
Sustaining
2, 4, 7, 8, 10, 17, 18 and
19
53.56∗∗ 0.86 5.88 357
15 Impulse Control and
Sequencing
1, 6, 12, 14 and 16 18.16 0.73 1.41 355
16 Psychophysical and
Mental
Excitability
5, 7, 15 and 16 30.19∗∗ 0.73 0.9 332
17 Social Conventions 9, 12, 13 and 20 25.58∗ 0.71 0.59 338
Current study 363 18 Subscale 1
(Behavioural–
Emotional Self-
regulation)
3, 7, 8, 10, 13, 14, 15 and
17
24.89 0.81 3.44 349
19 Subscale 2
(Metacognition)
2, 5, 12, 16 and 20 19.4 0.74 0.29 343
20 Subscale 3
(Executive
Cognition)
1, 4, 6 and 18 6.67 0.79 1.18 338
Total number of respondents for each subscale varies due to differing numbers of extreme responders, i.e., those that performed at ceiling or floor, which were
not available for analysis. Unidimensionality analysis was unable to be performed on subscale with fewer than four items. ∗∗significant at the 1% level;∗significant at the 5% level.
EX
AM
INA
TIO
NO
FT
HE
DE
XU
SIN
GR
AS
CH
AN
ALY
SIS
17
Dow
nloa
ded
by [
And
rew
Bat
eman
] at
00:
07 0
5 A
pril
2013
component factor anlaysis and rescoring of several items, labelled “behaviour-al–emotional self-regulation”, “executive cognition” and “metacognition”.
DISCUSSION
Comparison of responses from a sample of people with ABI on the DEX tothe Rasch measurement model revealed that it did not function as a singlescale measuring executive dysfunction. Instead, it was better understood interms of subscales measuring separate underlying psychological constructsor latent traits. The finding that the DEX is multi-dimensional in nature isin concordance with previous factor analyses, despite qualitative differencesbetween the subscales proposed in each study (Bodenburg & Dopslaff, 2008;Burgess et al., 1998; Chaytor & Schmitter-Edgecombe, 2006; Wilson, Alder-man, Burgess, Emslie & Evans, 1996), and supports the theoretical hypothesisthat the psychological concept of executive functioning should be brokendown into several sub-functions or sub-processes (Stuss, 2007).
Before discussing these findings, a limitation of this study should beacknowledged. Responses to the DEX analysed were based on self-ratingsof everyday executive functioning. As people with dysexecutive syndromesometimes display lack of insight into their difficulties, we must bear inmind that responses to items may be biased as a result of this. For instance,in the initial analysis of the data, “confabulation” was the item endorsed bythe least number of people. The concept of confabulation is highlycomplex, requiring a person to understand that they are expressing ideasthat are not true despite believing that they are. Consequently, people maynot recognise that they are engaging in confabulation, particularly if theylack insight into their condition, and thus are unlikely to endorse the itemreferring to this on the DEX. Interestingly, after removal of misfittingpersons from the model, the location of the item “confabulation” significantlyshifted to the eighth most frequently endorsed item. It is possible that thepeople who were removed from the data set were the most unpredictableresponders because they also were the ones who lacked insight into their dif-ficulties the most. Indeed, the one person who reported no difficulties at all, inspite of referral to a specialist neuropsychological rehabilitation centre, couldhave actually been suffering from anosognosia, a syndrome characterised byapparent unawareness, or inability to recognise one’s own functional failings.As it has been the protocol to administer the independent rating version of theDEX alongside the self-rating version, future analysis is planned using Raschanalysis to explore the dimensionality of the DEX using independent ratings,and to compare differences between the structure of the responses betweenthe two rating on this measure, to provide very useful information inregards to this hypothesis. If findings reveal that the person who answers
18 SIMBLETT AND BATEMAN
Dow
nloa
ded
by [
And
rew
Bat
eman
] at
00:
07 0
5 A
pril
2013
the questionnaire affects how scores should be interpreted, a difficult decisionwill have to be made in regards to which is the most accurate assessment ofexecutive functioning. One might assume that independent ratings are themost reliable, especially when patients show very little awareness of their dif-ficulties. However, certain problems may be difficult for anyone else but theperson experiencing the problems, to report. For instance, item 2 (impulsiv-ity) on the independent rater version of the DEX, “Acts without thinking,doing the first thing that comes to mind”, assumes knowledge of cognitiveprocesses that may not be apparent to an independent rater. Furthermore, asone of the main aims of rehabilitation programmes is to help provide strat-egies that are considered by people with ABI to be beneficial and thereforeworth implementing in their daily life, we argue that self-ratings are a vitalpart of assessing the efficacy of clinical interventions.
Of the subscales previously proposed using factor analysis (Bodenburg &Dopslaff, 2008; Burgess et al., 1998; Chaytor & Schmitter-Edgecombe, 2006;Wilson et al., 1996) the majority met the assumption of unidimensionality(excluding subscales made up of less than four items, for which this infor-mation was not able to be obtained), suggesting that all items were measuringthe same underlying psychological construct. However, all but two of thesesubscales misfitted the Rasch model. This may have been for a number ofreasons. First, it may be due to the inclusion of items that lacked discrimin-ability (e.g., item 11), displayed local dependency (e.g., items 19 and 4), orhad disordered thresholds (e.g., items 3, 4, 5, and 12). Second, factor analysisperformed on small sample sizes (n , 100) increases the probability of anunstable correlation matrix, and thus, sample-specific findings. Third, sub-scales such as those proposed by Burgess et al. (1996, 1998) may not functionin a way that fits the Rasch model within our sample because they were orig-inally based upon the independent-rating version of the DEX, which, as men-tioned previously, may have a different optimal structure. Fourth, it is alsopossible that slight differences in the characteristics of each sample, forexample, the inclusion of patients diagnosed with dementia as well as ABIin Burgess et al. (1996, 1998), may have affected the structure of responsesto the DEX. However, as we found no significant difference in respondingon the questionnaire between two groups of people with ABI with differentinjury pathologies (traumatic and non-traumatic injuries), factor structure isunlikely to be driven by the idiosyncrasies of the clinical population inwhich it is used. Further exploration of the dimensionality of the DEXusing Rasch analysis when answered by other clinical populations who alsodisplay executive impairment, such as people with neurodegenerative dis-orders (e.g., dementia or Parkinson’s disease), or psychiatric conditions(e.g., schizophrenia), would be useful for addressing this hypothesis.
Two subscales, other than the new ones created using Rasch factor analysis,“Executive Memory/Cognition” (Chaytor & Schmitter-Edgecombe, 2006;
EXAMINATION OF THE DEX USING RASCH ANALYSIS 19
Dow
nloa
ded
by [
And
rew
Bat
eman
] at
00:
07 0
5 A
pril
2013
see Table 3, analysis 11) and “Impulse Control and Sequencing” (Bodenburg &Dopslaff, 2008, see Table 3, analysis 15), met all the assumptions of the Raschmodel using our dataset. The “Executive Memory/Cognition” subscale over-laps with the third subscale we propose (see Table 3, analysis 11 and 20),suggesting that they are measuring similar constructs. The “Impulse Controland Sequencing” subscale combines a mixture of items for the three newlyproposed subscales, suggesting that some items can be grouped together inalternative ways to measure a slightly different psychological construct.
We have tentatively labelled the new subscales based on the theoreticaldimensions proposed by Stuss (2007), which represent groupings of similarbehaviours that relate to different functional distinctions within the prefrontalcortex (PFC), that are often clustered together under the umbrella term of“executive functions”. Although Stuss made no direct connection to the dys-executive syndrome in this theory, we propose that there is a significantamount of overlap between the two theories considering the optimal segmen-tation of the DEX. We are, however, not claiming that executive functions areconfined to the PFC. We accept that projections to and from other brain regionsalso contribute, such that damage from any number of regions may compro-mise a person’s ability to partake in planning, problem-solving, decisionmaking, etc.
In concordance with Stuss’s (2007) dimension “Executive Cognitive Func-tions” the subscale of the DEX labelled “Executive Cognition” (see Table 4,analysis 20) measures high-level abilities responsible for controlling anddirecting lower level automatic functions through planning, monitoring, acti-vating, switching and inhibiting. Functions measured in the subscale labelled“Behavioural–Emotional Self-Regulation” (see Table 4, analysis 18), whichrelates to Stuss’s dimension “Behavioural-Emotional Self-Regulatory Func-tions”, measures functions involved in emotional and reward processingnecessary for appropriate adaptive responding in the absence of cognitiveanalysis, habit or environmental cues. Functions relating to another dimen-sion suggested by Stuss, “Energisation Regulating Functions”, involved inthe initiation of appropriate behaviour in response to an external situationor internal goals, seem to be integrated within this subscale. This is perhapsbecause the scale was not sensitive enough (i.e., did not contain enoughitems) to distinguish functional differences between these mental processes.The final subscale, “Metacognition” (see Table 4, analysis 19), was labelledbased on Stuss’s fourth dimension “Metacognitive Processes”, which playsthe role of integrating the other three functions previously mentioned, andenables individuals to be consciously aware of their behaviour and intentionsor goals, thus shaping personality and social interaction.
Alongside the finding that the DEX should be interpreted in terms ofsubscales, the Rasch analysis carried out revealed that the items are extremelywell targeted to our sample. This means that clinicians can be confident that
20 SIMBLETT AND BATEMAN
Dow
nloa
ded
by [
And
rew
Bat
eman
] at
00:
07 0
5 A
pril
2013
this tool is sensitive enough to indicate the level of executive dysfunctionamong individuals with similar characteristics to those within our sample,for example, within the age and brain injury severity range of our sample.Further research needs to be carried out in order to establish the sensitivityof the DEX for indentifying executive impairments outside of the rangewhich our sample covers.
Additionally, Rasch analysis revealed that the original scoring method pro-posed by Burgess et al. (1996), functions adequately for the majority of itemson the DEX. Only four items required rescoring, according to the Raschmeasurement model. The decision to collapse the three response categories(occasionally, sometimes, and fairly often) was based on the individual itemcharacteristic curves, and meant that fit of the data to the Rasch modelimproved. However, re-scoring has the disadvantage of reducing discrimin-ability. We suggest that before using the re-scored template of these fouritems research needs to be done to find out if revised wording of items display-ing disordered thresholds could achieve fit to the Rasch model. More specifi-cally, we hypothesise that one reason why people found it hard to judgebetween the categories occasionally, sometimes, and fairly often, is becauseadditional quantifiers were used within some of the items, such as the word“sometimes” in item 3 (confabulation) and 5 (euphoria), and the word“slightest” in item 12 (aggression). Indeed, it does not make grammaticalsense to say “occasionally”, “sometimes” or “fairly often”. . . “I sometimestalk about events or details that never actually happened, but I believe didhappen”. Removal of these additional quantifiers, for example, changingitem 12 (aggression) from “I lose my temper at the slightest thing” to justsimply, “I lose my temper”, could mean that people find it easier to distinguishbetween five response categories. However, we must also be aware that itemsthat are too general may lose their ability to sufficiently discriminate betweenabilities, as was found to be the case for item 11 (shallowing of affectiveresponses – “I have difficulty showing emotion”). In which case, it may bebetter to omit the item altogether than include one that does not provide anymeaningful information about the construct it aims to measure.
Another reason why responding might diverge from the most predictablepattern may be that people understood different meanings from the questionsasked. For item 4 (planning – “I have difficulty thinking ahead or planning forthe future”) “thinking ahead” can be construed as a passive process, whereas“planning for the future” is associated with a more active process. People’sresponses may represent a mixture of reports about these two differentprocesses. Similarly, questions that are double-barrelled, such as item 5(euphoria), should be treated with care, on the basis that people may notrespond to the full contingency. For instance, some people may respond tothe statement, “I sometimes get over-excited about things”, before consideringwhether they also “can be a bit over the top at these times”. Simplifying the
EXAMINATION OF THE DEX USING RASCH ANALYSIS 21
Dow
nloa
ded
by [
And
rew
Bat
eman
] at
00:
07 0
5 A
pril
2013
items by re-phrasing or asking people about one type of behaviour, thought oremotion at a time, may rectify this problem. As the DEX is not available in thepublic domain, a revised version may need to be published. It is essential thateach item on a questionnaire is understood in a similar manner by all, becausemisinterpretation of a person’s difficulties has the potential to result in inap-propriate choices of treatment (Evans, Wilson, & Emslie, 1996).
Recently, Hobart and Cano (2009) argued it is vital that questionnairesemployed as outcome measures in clinical settings are shown to be rigorousmeasures of what they claim to quantify before we rely on them to informdecisions about patient care, health policy making and direction of futureresearch. In a series of studies where they investigated the measurement prop-erties of several questionnaires commonly employed within healthcare set-tings they concluded that Rasch analysis is the superior psychometricmethod for ensuring construct validity and reliability. Furthermore, Hobartand Cano suggest that this is a tool that will, in the future, be able to(1) help with prioritisation of treatment of problems; (2) offer greaterprecision in the identification of people who are struggling with problems,meaning that they may be able to be caught earlier so that rehabilitationcan commence sooner; and (3) monitor change or response to rehabilitationinterventions with greater accuracy than the more traditional psychometricmethods based on classical test theory.
The Rasch analysis of the DEX presented in this paper has provided moreevidence to support the hypothesis that the concept of executive functions isnot unidimensional. Therefore, we would argue that, in future, greater atten-tion will need to be paid to the specific underlying psychological constructthat neuropsychological tests commonly used to measure level of executivefunctioning assess, which is likely to be only a component of the wholeprocess of executive functioning. This will enable clinicians to pinpointmore specifically why a person may be finding it hard to perform tasks thatrequire executive abilities after an acquired brain injury, and help them todecide which compensatory strategies will help that individual to be as inde-pendent and productive as possible in everyday life.
REFERENCES
Alderman, N., Fry, R. K., & Youngson, H. A. (1995). Improvement of self-monitoring skills,
reduction of behaviour disturbance and the dysexecutive syndrome: Comparison of response
cost and a new programme of self-monitoring training. Neuropsychological Rehabilitation,
5(3), 193–221.
Alvarez, J., & Emory, E. (2006). Executive function and the frontal lobes: A meta-analytic
review. Neuropsychology Review, 16(1), 17–42.
Andrich, D. (1982). An extension of the Rasch model for ratings providing both location and
dispersion parameters. Psychometrika, 47(1), 105–113.
22 SIMBLETT AND BATEMAN
Dow
nloa
ded
by [
And
rew
Bat
eman
] at
00:
07 0
5 A
pril
2013
Andrich, D., Sheridan, B., & Lou, G. (2005). Rumm2020 (Version 4 for Windows).
Anson, K., & Ponsford, J. (2006). Evaluation of a coping skills group following traumatic brain
injury. Brain Injury, 20, 167–178.
Baghaei, P. (2008). The effects of the rhetorical organization of texts on the C-Test construct: A
Rasch modelling study. Melbourne Papers in Language and Testing, 13(2), 32–51.
Bateman, A., Teasdale, T. W., & Willmes, K. (2009). Assessing construct validity of the self-
rating version of the European Brain Injury Questionnaire (EBIQ) using Rasch analysis.
Neuropsychological Rehabilitation, 19(6), 941–954.
Bennett, P. C., Ong, B. E. N., & Ponsford, J. (2005). Measuring executive dysfunction in an
acute rehabilitation setting: Using the dysexecutive questionnaire (DEX). Journal of the
International Neuropsychological Society, 11(4), 376–385.
Bland, J. M., & Altman, D. G. (1995). Statistics notes: Multiple significance tests: The Bonfer-
roni method. British Medical Journal, 310(6973), 170.
Bodenburg, S., & Dopslaff, N. (2008). The Dysexecutive Questionnaire Advanced: Item and
rest score characteristics, 4-factor solution, and severity classification. Journal of Nervous
and Mental Disease, 196(1), 75–78.
Burgess, P. W., Alderman, N., Evans, J. J., Emslie, H., & Wilson, B. A. (1998). The ecological
validity of tests of executive function. Journal of the International Neuropsychological
Society, 4, 547–558.
Burgess, P. W., Alderman, N., Wilson, B. A., Evans, J. J., & Emslie, H. (1996). Validity of the
battery: Relationship between performance on the BADS and ratings of executive pro-
blems. In B. A. Wilson (Ed.), BADS: Behavioural assessment of the dysexecutive syndrome
manual (pp. 18–19). Bury St Edmunds, UK: Thames Valley Test Company.
Chan, R. C. K. (2001). Dysexecutive symptoms among a non-clinical sample: A study with the
use of the Dysexecutive Questionnaire. British Journal of Psychology, 92, 551–565.
Chan, R. C. K., & Bode, R. K. (2008). Analysis of patient and proxy ratings on the Dysexecutive
Questionnaire: An application of Rasch analysis. Journal of Neurology, Neurosurgery and
Psychiatry, 79(1), 86–88.
Chaytor, N., Schmitter-Edgecombe, M., & Burr, R. (2006). Improving the ecological validity of
executive functioning assessment. Archives of Clinical Neuropsychology, 21(3), 217–227.
Cronbach, L. (1951). Coefficient alpha and the internal structure of tests. Psychometrika, 16(3),
297–334.
D’Zurilla, T. J., & Nezu, A. M. (1999). Problem Solving Therapy: A Social Competence
Approach to Clinical Intervention (2nd ed.). New York, NY: Springer.
Damasio, A. R. (1994). Descartes’ Error: Emotion, Reason, and the Human Brain. New York,
NY: Grosset/Putnam.
Evans, J. J., Wilson, B. A., & Emslie, H. (1996). Selecting, Administering and Interpreting Cog-
nitive Tests: Guidelines for Clinicians and Therapists. Bury St Edmunds, UK: Thames
Valley Test Company.
Fish, J., Evans, J. J., Nimmo, M., Martin, E., Kersel, D., Bateman, A., et al. (2007). Rehabilita-
tion of executive dysfunction following brain injury: “Content-free” cueing improves every-
day prospective memory performance. Neuropsychologia, 45(6), 1318–1330.
Fisher, W. P., Jr (1992). Reliability statistics. Rasch Measurement Transactions, 6(3), 238.
Gilbert, S. J., Zamenopoulos, T., Alexiou, K., & Johnson, J. H. (2010). Involvement of right
dorsolateral prefrontal cortex in ill-structured design cognition: An fMRI study. Brain
Research, 1312, 79–88.
Hambleton, R. K., Swaminathan, H., & Rogers, H. J. (1991). Fundamentals of Item Response
Theory. California: SAGE Publications, Inc.
Hanks, R. A., Rapport, L. J., Millis, S. R., & Deshpande, S. A. (1999). Measures of executive
functioning as predictors of functional ability and social integration in a rehabilitation
sample. Archives of Physical Medicine and Rehabilitation, 80(9), 1030–1037.
EXAMINATION OF THE DEX USING RASCH ANALYSIS 23
Dow
nloa
ded
by [
And
rew
Bat
eman
] at
00:
07 0
5 A
pril
2013
Hobart, J., & Cano, S. (2009). Improving the evaluation of therapeutic interventions in multiple
sclerosis: The role of new psychometric methods. Health Technology Assessment, 13(12),
1–200.
Levine, B., Robertson, I. H., Clare, L., Carter, G., Hong, J., Wilson, B. A., et al. (2000). Reha-
bilitation of executive functioning: An experimental-clinical validation of Goal Manage-
ment Training. Journal of the International Neuropsychological Society, 6(03), 299–312.
Linacre, J. M. (2007). RUMM2020 Item-Trait Chi-Square and Winsteps DIF Size. Rasch
Measurement Transactions, 21(1), 1096.
Magar, E. C. E., Phillips, L. H., & Hosie, J. A. (2008). Self-regulation and risk-taking. Person-
ality and Individual Differences, 45(2), 153–159.
Manly, T., Hawkins, K., Evans, J., Woldt, K., & Robertson, I. H. (2002). Rehabilitation of
executive function: Facilitation of effective goal management on complex tasks using per-
iodic auditory alerts. Neuropsychologia, 40(3), 271–281.
Masters, G. (1982). A Rasch model for partial credit scoring. Psychometrika, 47(2), 149–174.
McDonald, B. C., Flashman, L. A., & Saykin, A. J. (2002). Executive dysfunction following
traumatic brain injury: Neural substrates and treatment strategies. NeuroRehabilitation,
17(4), 333–344.
Medd, J., & Tate, R. L. (2000). Evaluation of an anger management therapy programme follow-
ing acquired brain injury: A preliminary study. Neuropsychological Rehabilitation: An
International Journal, 10(2), 185–201.
Novick, M. R. (1966). The axioms and principal results of classical test theory. Journal of Math-
ematical Psychology, 3(1), 1–18.
Oikawa, N., Oguri, R., Sato, A., Imamura, T., & Imamura, T. (2006). Executive dysfunction on
activity of daily living (ADL) in Alzheimer’s disease: A study using Dysexecutive Question-
naire (DEX). Japanese Journal of Neuropsychology, 22(2), 138–145.
Pallant, J. F., & Tennant, A. (2007). An introduction to the Rasch measurement model: An
example using the Hospital Anxiety and Depression Scale (HADS). British Journal of Clini-
cal Psychology, 46, 1–18.
Rasch, G. (1960). Probabalistic Models for Some Intelligence and Attainment Tests. Chicago,
IL: University of Chicago.
Rath, J. F., Simon, D., Langenbahn, D. M., Sherr, R. L., & Diller, L. (2003). Group treatment of
problem-solving deficits in outpatients with traumatic brain injury: A randomised outcome
study. Neuropsychological Rehabilitation, 13, 461–488.
Shallice, T., & Burgess, P. W. (1991). Deficits in strategy application following frontal lobe
damage in man. Brain, 114(Pt 2), 727–741.
Smith, E. V. Jr. (2002). Detecting and evaluating the impact of multidimensionality using item
fit statistics and principal component analysis of residuals. Journal of Applied Measurement,
3(2), 205–231.
Smith, R. M., Linacre, J. M., & Smith, E. V. (2006). Guidelines for manuscripts. Journal of
Applied Measurement. Retrieved from http://www.jampress.org
Stuss, D. T. (2007). New approaches to prefrontal lobe testing. In B. L. Miller & J. L. Cummings
(Eds.), The Human Frontal Lobes: Functions and Disorders (2nd ed., pp. 292–305).
New York, NY: Guilford Press.
Stuss, D. T., & Benson, D. (1983). Frontal lobe lesions and behaviour. In A. Kertesz (Ed.),
Localization in Neuropsychology. New York, NY: Academic Press.
Tennant, A., & Pallant, J. F. (2006). Unidimensionality matters! (A tale of two Smiths?). Rasch
Measurement Transactions, 20(1), 1048–1051.
Tennant, A., & Conaghan, P. G. (2007). The Rasch measurement model in rheumatology: What
is it and why use it? When should it be applied, and what should one look for in a Rasch
paper? Arthritis Care & Research, 57(8), 1358–1362.
24 SIMBLETT AND BATEMAN
Dow
nloa
ded
by [
And
rew
Bat
eman
] at
00:
07 0
5 A
pril
2013
von Cramon, D. Y., Cramon, G. M., & Mai, N. (1991). Problem-solving deficits in brain-injured
patients: A therapeutic approach. Neuropsychological Rehabilitation, 1(1), 45–64.
Wilson, B. A., Alderman, N., Burgess, P., Emslie, H., & Evans, J. (1996). Behavioural Assess-
ment of the Dysexecutive Syndrome. Bury St. Edmunds, UK: Thames Valley Test Company.
Wright, B. (1995). Diagnosing person misfit. Rasch Measurement Transactions, 9(2), 430–431.
Manuscript received June 2010
Revised manuscript received September 2010
EXAMINATION OF THE DEX USING RASCH ANALYSIS 25
Dow
nloa
ded
by [
And
rew
Bat
eman
] at
00:
07 0
5 A
pril
2013