computational modeling of cellular signaling processes embedded into dynamic spatial contexts
TRANSCRIPT
Computational Modeling of Cellular Signaling ProcessesEmbedded into Dynamic Spatial Contexts
Bastian R. Angermann1,3, Frederick Klauschen1,2,3, Alex D. Garcia1,3, Thorsten Prustel1,Fengkai Zhang1, Ronald N. Germain1, and Martin Meier-Schellersheim1
1Laboratory of Systems Biology, National Institute of Allergy and Infectious Diseases, NationalInstitutes of Health, Bethesda, MD, USA2Institute of Pathology, Charite University Medicine Berlin, Germany
AbstractCellular signaling processes depend on specific spatiotemporal distributions of their molecularcomponents. Multi-color high-resolution microscopy now permits detailed assessment of suchdistributions, providing the input for fine-grained computational models that explore themechanisms governing dynamic assembly of multi-molecular complexes and their role in shapingcellular behavior. However, incorporating into such models both complex molecular reactioncascades and the spatial localization of signaling components within dynamic cellularmorphologies presents substantial challenges. Here we introduce an approach that addresses thesechallenges by automatically generating computational representations of complex reactionnetworks based on simple bi-molecular interaction rules embedded into detailed, adaptive modelsof cellular morphology. Using examples of receptor-mediated cellular adhesion and signal-induced localized MAPK activation in yeast, we illustrate the capacity of this simulation techniqueto provide insights into cell biological processes. The modeling algorithms, implemented in aversion of the Simmune tool set, are accessible through intuitive graphical interfaces as well asprogramming libraries.
IntroductionThe increasing spatial resolution of optical microscopy, in concert with novel technologiesfor labeling cell constituents, is continuously revealing new details about how cells activelytailor the chemical composition of membrane domains during signaling or generateintracellular concentration gradients in response to localized external signals 1–3. Reflectingthese insights, modern simulation approaches no longer assume well-mixed biochemistrybut instead simulate signaling processes within computational representations of cellulargeometries (see Supplementary Note 1 for a detailed discussion of available approaches). Inparallel, experimentalists and theorists have begun to explore the physiological role of multi-component molecular complexes. Systematic analyses of the spectrum of binding partners ofreceptor tyrosine kinases such as the EGF receptor 4 or of the assembly of ‘signalosomes’
Correspondence: B.R.A. ([email protected]), M.M.S. ([email protected]).3these authors contributed equally.
Author contributionsB.A. wrote the application for designing cellular morphologies. A.D.G wrote the simulator GUI. M.M.S. and F.K. developed thevolume/membrane spatial discretization. B.A. developed the adaptive membrane diffusion discretization. B.A. and T.P. performednumerical tests. F.Z. wrote the application for defining molecular interactions. M.M.S. developed the spatially adaptive networkgenerator. B.A. and M.M.S. developed the integrator drivers. All authors discussed the project on an ongoing basis and wrote themanuscript.
NIH Public AccessAuthor ManuscriptNat Methods. Author manuscript; available in PMC 2012 September 21.
Published in final edited form as:Nat Methods. ; 9(3): 283–289. doi:10.1038/nmeth.1861.
NIH
-PA Author Manuscript
NIH
-PA Author Manuscript
NIH
-PA Author Manuscript
around scaffold proteins 5 have revealed that signaling pathways are intricate factories,dynamically assembling and disassembling molecular complexes with specific functions.
Defining computational models for exploring the reaction dynamics of networks of theselarge multi-molecular complexes requires approaches that differ from the traditional strategyof explicitly formulating all mass-action equations for the complete set of reactants in asystem. The reason is that reaction dynamics in systems with many molecular components,or with components that have many binding sites, may involve very large numbers ofalternative interactions and complexes, a phenomenon sometimes referred to as‘combinatorial explosion’ 6. However, because all the reactions within such networks arebased on interactions between pairs of molecular binding sites, much of the complexity canbe reduced to defining the rules that describe these binary interactions. Taking advantage ofthis underlying reality, ‘rule-based’ approaches leave the task of actually assembling thecomplexes and reaction networks to the computer, once the investigator has defined thefundamental components and their pair-wise interactions 7–12. Rule-based simulationapproaches have, however, so far been limited with regard to their ability to take intoaccount the cellular morphologies in which the molecular networks operate and had toassume static geometries or well-stirred conditions.
Here, we introduce a computational approach that can be used to simulate complex signalingprocesses in the context of realistic and even dynamic cellular morphologies. This novelcapacity is based on the ability to generate reaction networks automatically, taking intoaccount the location-dependent molecular interaction possibilities determined by thedynamic membrane geometries and 3-dimensional shapes of the simulated cells (Fig. 1,Supplementary Note 2). The approach is a major extension and improvement of themodeling tool Simmune7. Most of its functionalities are available to users who prefer agraphical user interface (GUI) to writing model definition scripts. It also permits modelers tosimulate aspects of biology that would be difficult to address with conventional methods,such as the local dynamics of multi-molecular signaling complexes in large networks. Weuse the approach to simulate two well-studied biological systems, the reaction-diffusionprocesses of adhesion receptors at dynamic cell-cell contacts, and the formation of MAPKactivity gradients by intracellular multi-molecular signaling complexes in the yeast matingpheromone response.
ResultsMolecular reaction networks in their spatial contexts
Modeling approaches that focus on phenomena of individual complexes (for instance,receptor clustering 13) and that simulate the motion and reactions performed by discreteparticles incorporate spatial constraints naturally (Methods and Supplementary Fig. 1):complexes can only interact when they share a common location and the rates of theirinteractions depend on their local abundances. However, the computational cost of particle-based simulations increases at least linearly (and typically much faster than linearly) withthe abundance of the complexes. This means that simulating a system with 1,000,000molecules (roughly corresponding to a micromolar concentration in a cell of 10 micronsdiameter) will take at least 1000 times longer than simulating a system with 1000 molecules.Since many cellular signaling phenomena involve large numbers of molecules and do notrequire approaches that track individual particles, they can be investigated far moreefficiently by simulating the dynamics of local molecular concentrations instead of usingparticle-based simulators (Methods and Supplementary Fig. 1).
It should be noted that one of the most computationally expensive aspects of particle-basedsimulations, namely capturing the diffusional motion of particles in between molecular
Angermann et al. Page 2
Nat Methods. Author manuscript; available in PMC 2012 September 21.
NIH
-PA Author Manuscript
NIH
-PA Author Manuscript
NIH
-PA Author Manuscript
encounters and reactions, has recently been addressed with techniques that either avoidtaking single Brownian diffusion steps (GFRD14) or that take large steps and correct for theintroduced error (Smoldyn 15). Nevertheless, these simulations remain very timeconsuming 15 where particle numbers are large; their immediate value lies in applicationswith relatively low numbers of particles to be simulated.
Without taking into account spatial aspects, rule-based approaches to model cellularsignaling networks can translate interaction rules directly into sets of complexes and thereactions between them and simulate them as sets of ordinary differential equations (ODEs).In contrast, for spatially-resolved simulations, the rates of these reactions and even the typesof reactions that will actually occur depend on the morphology within which thebiochemical components of the network operate. The new simulation algorithms inSimmune therefore apply the rules that specify how molecular interactions are translatedinto complexes and reaction networks for each volume or membrane element individually,based on its local biochemical composition. For membrane elements that are in contact withother membranes (for instance, as part of an intercellular contact) the network generationalgorithm additionally determines whether the opposing membrane contains receptorcomplexes that can interact with the local molecular complexes. Each complex is thenassigned a list of reaction processes (associations, dissociations or transformations). Finally,the diffusional exchange among neighboring volume or membrane elements is determinedand added to the list of processes that now can be used to calculate how local concentrationsof molecular complexes will change over time.
Rule-based network creation can be computationally expensive (Supplementary Note 3). Forsimulations with high spatial resolution, Simmune has to generate local networks forthousands of volume and membrane elements and therefore uses a multi-step strategy thatfirst builds a non-spatial reaction network based on all possible interactions among themolecular species in the simulated biological system. This template network is then adaptedto the specific local molecular environment of each volume or membrane element, whichcan be done much faster than creating networks de novo. Additionally, each newlygenerated local network is stored in a network repository that allows reuse when networkshave to be built for locations with identical molecular composition. This strategy is efficientenough to permit the automatic creation of reaction networks even within the context ofchanging cellular shapes, for instance when simulating receptor interactions at dynamic cell-cell contact interfaces. The results of the simulations we report here emphasize thepotentially important differences between morphologically dynamic versus static modelingof reaction-diffusion processes.
Static vs. dynamic simulations of intercellular E-cadherinE-cadherin-mediated cell-cell adhesion is essential for the organization of multicellularorganisms 16. Here we simulate cell-cell contact regulation involving just this one molecularspecies, under conditions in which both membranes express the same adhesion moleculesand in which these molecules form homodimers or larger complexes based on thesedimers 17, 18. Focusing just on this isolated set of interactions allowed us to explore a simplebut important system with well-established phenomenology.
The purely biochemical network resulting from the fundamental interactions between E-cadherin monomers (Fig. 2a) contains only seven biochemically distinct complexes whenspatial issues are ignored (Fig. 2b). In contrast, adding into the analysis the localization ofthe molecular components in two adjacent cell membranes yields a considerably morecomplicated picture (Fig. 2c). This is due to the fact that structurally equivalent complexesnow can differ with regard to which side of the membrane-membrane interface their E-cadherin molecules belong. For example, the tetramer with an open cis-interface (labeled
Angermann et al. Page 3
Nat Methods. Author manuscript; available in PMC 2012 September 21.
NIH
-PA Author Manuscript
NIH
-PA Author Manuscript
NIH
-PA Author Manuscript
with a roman V in Fig. 2b) exists in two versions at the cell-cell interface (labeled (8) and(9) in Fig. 2c), facing either one or the other cell with its ‘open’ end. Even without includinglateral diffusion within the membranes, a mathematical description of the possible reactionsbetween the different types of complexes would require more than 100 reaction terms(Supplementary Note 2b). Incorporating spatial aspects thus transforms generation of thebiochemically simple network of E-cadherin trans- and cis-dimerization into a nontrivialtask, as is illustrated in Fig. 3 for one step of the local network generation process for twoadjacent membrane elements.
We first investigated the accumulation of E-cadherin at the interfaces between models ofmorphologically static cells that were simulated as coming into close proximity prior to theformation of receptor contacts, mimicking cellular crowding that arises when cells enter intoa pre-existing epithelial layer involved in rearrangements or repair. It is currently assumedthat cis interactions are much weaker than trans interactions 19 and that their main functionmay be to stabilize trans interactions 20. Varying the lifespan of cis-bonds within transcomplexes between 1 and 100 seconds, we observed an accumulation of E-cadherin at theperiphery of the contact zones (Fig. 4a), reminiscent of the experimentally observedaccumulation of E-cadherin at the edges of adhesive cell contacts (Fig. 4b,c) 21. Thisaccumulation was markedly modulated by the cis bond lifespan and reached up to 1.5 foldthe concentration of E-cadherin outside of the contact zones (Fig. 4d). These results areconsistent with the findings of a previous computational model of a cell in contact with asmall sphere acting as a completely absorbing surface for E-cadherin 22.
To study the evolution of local concentrations of intercellular E-cadherin complexes duringthe more physiological setting of gradual growth of receptor-mediated cellular adhesivecontacts involving membranes of flexible topology, we performed simulations with receptorinteraction networks embedded into the dynamic morphology of two interacting cells usinga three-dimensional version of the ‘cellular Potts model’ (CPM) method 23 This method hasbeen applied successfully to the study of cellular movement in models of biological 3Denvironments 24. It simulates the dynamic geometries of biological cells as coherentstructures consisting of two- or three-dimensional basic spatial elements (for example,squares, hexagons or, in 3D, cubes) through stochastic updates that calculate theprobabilities for adding or removing volume elements based on their particular states orgeometric neighborhoods. The coupling between biochemistry and morphological dynamicswas implemented through Potts energy terms that describe the binding status of membranereceptors (Methods and Supplementary Note 3). In contrast to simulations with staticmorphologies, combining receptor interactions and morphological dynamics requiresrebuilding the local molecular reaction networks every time the morphology changes to takeinto account new receptor interaction possibilities or to discard those that are no longersupported by the membrane geometry.
The overall simulation flow after the initialization of cellular biochemistry and morphologyproceeded according to the following pattern: 1) local network (reaction-diffusion)generation/adjustment, 2) integration of the corresponding system of coupled differentialequations for the local concentrations of all molecular complexes, 3) Potts model updatestep, repeat until user event or end time point is reached (Supplementary Fig. 2). We notethat the local network generation method introduced here can be embedded into anyalgorithm generating morphological dynamics, not just Potts model simulations. Thenetwork generation could in principle be combined with more sophisticated approaches forshape and surface dynamics (than just cubic extension and retraction) such as finite elementmethods or level sets but the coupling between shape dynamics and biochemistry would behighly nontrivial.
Angermann et al. Page 4
Nat Methods. Author manuscript; available in PMC 2012 September 21.
NIH
-PA Author Manuscript
NIH
-PA Author Manuscript
NIH
-PA Author Manuscript
Cells were simulated as initially coming into contact at small membrane regions. Thesesmall contacts and the shape of the membranes in which the molecules were embedded werethen allowed to evolve, driven by the formation of intercellular E-cadherin contacts. Thesimulations incorporated Potts model parameters chosen to reproduce previous workreporting experimentally determined growth rates of cell-cell contacts, which began at 30microns/hour 21 and resulted over 1.5 hours in cells joined through a contact interfacespanning almost the entire cellular diameter (Fig. 4e and Supplementary Movie 1). Evenfor receptor-interaction parameters that had led to pronounced peripheral cadherinaccumulation along the edges of cellular contacts in the morphologically static case, thesedynamic simulations instead showed an overall increase in cadherin density in the centralcontact zone modulated by the morphological features of the interface (such as regions ofsmooth or rugged, interrupted cell-cell contacts) (Fig. 4f). This qualitatively differentbehavior of the models is a consequence of the rapid (relative to the time scale governing thegrowth of cell-cell contacts) E-cadherin diffusion that allows fast recruitment of receptorsthat stabilize nascent contacts. The results of the simulations thus show that, due to the fastdiffusion of E-cadherin, cells have to employ active transport mechanisms (as opposed topassive diffusion, as modeled here) to generate a high-concentration adhesive ring at theperiphery of cellular contacts by removing receptors from the central contact zone in orderto finally form mature adherens junctions 25. Indeed, performing morphologically dynamicsimulations with a diffusion coefficient typical for larger trans-membrane receptors (tenfoldlower than has been reported for E-cadherin), or with contacts that grew five times fasterthan experimentally reported (thereby shifting the balance between diffusion andmorphological dynamics), we obtained a peripheral accumulation of these receptors(Supplementary Fig. 3a, b). In contrast, just the accumulation of E-cadherin in intercellularcontact zones did not require active transport, in accord with previous experimentalfindings 26.
Computational exploration of MAPK activation in yeastWe next illustrate the application of our modeling method to exploring spatial aspects ofMAPK activation in yeast, which requires the generation of a signaling network with a highdegree of combinatorial complexity within a characteristic cellular morphology. MAPKactivation downstream of the yeast pheromone receptor is organized around the scaffoldprotein Ste5. The scaffold interacts with a variety of partners, among them the G proteinsubunit Gβγ, the phospholipid PIP2 (phosphatidylinositol-(4,5)-bisphosphate), the kinaseSte20 initiating activation of the MAPK cascade, its interaction partner Ste11 (MAPKKK),the MAPKK Ste7 and, finally, the MAP Kinase Fus327. Many of these binding partners mayexist in several different states of activation. Taking into account all possible combinationsof membrane-bound and cytosolic Ste5 molecules in complex with one, two, or three of itsinteraction partners in phosphorylated or unphosphorylated states, as well as interactionswith other membrane-bound components, yields local reaction networks equivalent to morethan 150 coupled differential equations (ODEs) in the membrane regions and 70 coupledODEs in the cytoplasmic regions. Diffusional coupling between the membrane and volumeelements of the discretized cellular morphology has to be handled additionally. Capturingthe large numbers of distinct molecular complexes involved in Fus3 activation is therefore avery difficult task that has been undertaken only a few times 28, 29 using conventionalmodeling techniques that assemble the components of a mathematical model in a non-automated manner.
Importantly, the shape of the yeast cells as they respond to pheromone stimulation has asignificant effect on the signaling events: Saccharomyces cerevisiae responds to pheromoneby assuming a polarized pear-like shape and accumulating signaling molecules in its narrowtip, the so-called ‘shmoo’ 27. Recently, a microscopy study elucidated the spatial distribution
Angermann et al. Page 5
Nat Methods. Author manuscript; available in PMC 2012 September 21.
NIH
-PA Author Manuscript
NIH
-PA Author Manuscript
NIH
-PA Author Manuscript
of the molecular components of the yeast pheromone response with enough quantitativedetail to permit spatially-resolved simulations 30. Note that due to the necessity to accountfor both spatial biochemical inhomogeneity and the influence of intracellular diffusion, anon-spatial rule-based method would require a manual mapping of each one of theautomatically generated sets of reactions – describing the biochemistry at one particularpoint in space – onto the volume elements of the simulated cellular geometry.
Phosphorylated Ste7 (pSte7) is thought to phosphorylate Fus3 in a Ste5-dependent scaffold-guided process (Fig. 5a). Given the low affinity of Fus3 for Ste5 (Kd ~ 1 micromole 30, 31),the concentration of complexes involving pSte7 and Fus3 bound to Ste5 must be low, posingthe question how the cells achieve a phosphorylation of 40% of their Fus3 pool within lessthan an hour after pheromone stimulation30. After initial simulations, we therefore replacedthe classical mechanism of intra-scaffold activation of Fus3 (Fig. 5a), by a mechanismaccording to which Ste5-bound, activated Ste7 directly binds to and activates Fus3 (Fig. 5b),taking advantage of the fact that the modeling GUI makes even such major structuralchanges quite painless. This mechanism was suggested in a recent structural study thatrevealed that binding to Ste5 significantly enhances Ste7 phosphorylation of Fus3 and thatthis does not require direct interaction of Fus3 with Ste5 31. This finding is in accord withthe unexpected previous observation that suppressing the interaction of Fus3 with Ste5actually promotes Fus3 activation 32.
In addition, we included a tip-localized binding partner for pFus3 representing one of thetargets of its kinase activity as suggested by the authors of the experimental study 30. Thisallowed the model to account for an experimentally reported imbalance between Fus3 andSte5 at the tip and to satisfy an additional constraint provided by the experimental data (theshmoo tip contained 1.7 fold less Ste5 than Fus3) that would have been impossible to satisfywithout these Fus3 binding partners (Supplementary Fig. 4). With this second modification,simulations reproduced both the experimentally observed Fus3 concentration andphosphorylation profile (Fig. 5c,d,e) and the phosphorylation of 40% of the total Fus3 pool.As in the original experiments30 the Fus3 concentration profiles were calculated using aspatial averaging over cells with different localizations of the cell nucleus (SupplementaryFig. 5).
Among the advantages of the automated generation of reaction networks is the possibility toidentify molecular complexes with common properties. Summing over the concentrations ofall complexes containing the ‘Ste5-pSte7-Fus3’ pattern we could very efficiently determinethe spatial concentration profile of the complexes that generate pFus3. Even though theconcentration of these complexes was much lower in the body than at the shmoo tip, thetotal number of cytoplasmic sources for pFus3 was greater than those at the tip, since theshmoo tip encompasses only a few percent of the cell’s volume (Fig. 5f). Thus, our spatialrule-based approach was required for the simulation of a complex signaling cascadeembedded into its specific geometry and was also very useful for analyzing theconsequences of the spatial distribution. In this case, the simulations suggested that the factthat much of the pFus3 was produced in the cell body imposes a limit on the steepness of thegradient that can be produced by the highly concentrated source of this active kinase at theshmoo tip (Supplementary Note 4). Finally, the ability to include spatial aspects intoquantitative models of cellular behavior considerably increases the stringency of theconstraints provided by experimental data; this should facilitating instructive simulationseven in cases where the data are less complete than for the yeast MAPK pathway.
Angermann et al. Page 6
Nat Methods. Author manuscript; available in PMC 2012 September 21.
NIH
-PA Author Manuscript
NIH
-PA Author Manuscript
NIH
-PA Author Manuscript
DiscussionIn addition to solving long-standing technical modeling issues through its ability toautomatically generate spatially resolved reaction-diffusion networks, the approachpresented here also offers an opportunity for experimentalists with limited computationalexperience to utilize modeling and simulation in their studies. As demonstrated in the step-by-step guide through the models, (re-) building, modifying and exploring the models andperforming the simulations does not require a strong computational background or thecreation of elaborate computer scripts, but instead can be done with the help of an intuitivegraphical interface. Theorists will furthermore find it useful that the localized generation ofreaction networks performed by our approach permits access to more details of localdynamics than is typically provided by ‘black box’ partial differential equation (PDE)solvers. This makes it straightforward to analyze the different reactions contributing to thekinetics with which local complex concentrations change over time. Finally, computationalmodelers can use the programming interface provided for all algorithms to create single- ormulti-cellular simulations combining biochemical (reaction-diffusion) and morphologicaldynamics, using the different components of our tool set as building blocks for customizedprojects.
MethodsAll models and the tools described here for generating the reported modeling results can bedownloaded from the NIH website at:www.niaid.nih.gov/LabsAndResources/labs/aboutlabs/lsb/Pages/simmuneproject.aspx Thetools run on Linux, MacIntosh®, and Windows® operating systems. The models are storedin SQL (Structured Query Language) databases to allow for flexible and efficientorganization and for detailed queries about molecular properties and interactions. Thedatabase communicates with the simulation software through an API (ApplicationProgramming Interface) that can directly be accessed by computational modelers orprogrammers who want to implement their own simulation engines or supplyprogrammatically generated models to the simulator. Model databases are stored as SQLitedbf files that can be easily exchanged between researchers.
Simulating cellular biochemistry in the context of intercellular receptor-mediated contactsTo illustrate the challenges associated with transitioning from a non-spatial to a spatialrepresentation of a signaling network, we consider a simple model of receptor-mediatedcellular communication with the following rules (Supplementary Fig. 1): R1 and R2 are tworeceptors, each with one extracellular and one intracellular binding site. They can bind toeach other extracellularly and can bind to intracellular components, C1 and C2, respectively.C1 can interact with R1 regardless of the receptor’s extracellular binding state whereas C2can bind to R2 only after this receptor has been bound by R1 (outside-in signaling). R1 canbind to R2 only after C1 has attached itself to intracellular domain of R1 (inside-outsignaling). The network thus incorporates outside-in and inside-out signaling mechanismsrepresenting typical binding event-induced changes in the behavior of transmembraneproteins responsible for transmitting and reacting to cellular contact signals 33.
Whereas the biochemical reaction possibilities resulting from the rules in the model can bedescribed easily as a network graph when the geometry of the system is ignored(Supplementary Fig. 1a), taking into account the spatial localization of the network’smolecular components relative to two cytoplasmic membranes of adjacent cells expressingeither R1 and C1 or R2 and C2 creates an substantial additional layer of complexity.
Angermann et al. Page 7
Nat Methods. Author manuscript; available in PMC 2012 September 21.
NIH
-PA Author Manuscript
NIH
-PA Author Manuscript
NIH
-PA Author Manuscript
To illustrate this we depict components that need to be treated as cytosolic as green for cell 1and as purple for cell 2. Extracellular membrane-bound components are depicted in blue(Supplementary Fig. 1b,c). C1 and C2 perform free 3D diffusion as unbound molecules.After their association with the transmembrane receptors R1 and R2, they are confined to 2Dmembrane-guided diffusion. Another important difference between a non-spatial and aspatially-resolved simulation of the model is that in the latter case molecular complexesneed to be accounted for in multiple locations simultaneously. As one example, the receptor-receptor association (reaction (2)) creates a complex that is ‘visible’ in five distinct spatialregions: cytoplasm 1, membrane 1, intercellular space, membrane 2 and cytoplasm 2. In asimulation that tracks individual complexes, the interaction possibilities of these intercellulartransmembrane complexes would follow naturally from their individual positions in space:complexes that are spatially very close to each other can react (Supplementary Fig. 1c).However, switching to what is usually a far more efficient approach by simulating thedynamics of molecular concentrations in two discretized, grid-like representations of themembranes and adjacent volumes of the two interacting cells means giving up theinformation about locations of individual molecule complexes (Supplementary Fig. 1d). Thealgorithms updating the concentrations over time of molecular complexes that are present inmultiple adjacent membrane and volume elements thus need to be able to model theseinterdependencies on the ensemble level (local concentrations of complex species) eventhough, physically, they arise at the level of individual complexes. For example, theassociation of C1:R1 and R2 in two adjacent membrane grid elements depicted by the redsquares in Fig. 1d increases the concentration of the product complex C1:R1:R2 in the twomembrane grid elements and their associated volumes (sub-membrane and intercellular). Itdecreases the concentration of C1:R1 in the grid element on the left (cell 1) and of R2 in thegrid element on the right (cell 2). Thus, while the rate of this reaction depends only on theconcentrations of C1:R1 and R2 in the intercellular space hosting the interaction, theformation of the larger complex changes the concentrations of complexes in multipleadditional locations.
To address these issues we developed algorithms that construct the computationalrepresentations of reaction networks for individual volume (or membrane) elements basedon their local geometry and the locally available molecular components, as opposed to usinginteraction rules to generate a global reaction network and then mapping it onto discretizedspatial structures. The latter approach would have difficulties simulating situations in whichmultimolecular complexes could exist in multiple versions that, while biochemicallyidentical, nonetheless differ with regard to the roles they play within the modeled cellulargeometry. The adhesion receptors ICAM-1 and LFA-1, both expressed on interacting T- andB-lymphocytes, are biological examples of this situation. Here, both cells express theequivalents of R1 and R2 (ICAM-1 and LFA-1). The complex ICAM-1:LFA-1 can thusmean two things: ICAM-1 is anchored on the T-cell and LFA-1 on the B-cell, or vice versa.The purely biochemical, theoretical interaction possibilities of the intercellular complex aspart of a non-spatial signaling network are identical in both cases but the algorithmsimulating the network’s reaction dynamics in space now needs two representations in eachgrid element with distinct local reaction rules. Using the biochemically simpler system of E-cadherin receptor homodimerization, we discuss in Fig. 1 and Supplementary Note 2a howour approach builds local reaction networks capable of correctly handling such situations byencoding the spatial localization of the components of multi-molecular complexes to be ableto dynamically assemble and disassemble complexes connecting multiple distinct spatialregions. This approach solves the above-mentioned problem: components involved in theformation of trans-membrane complexes ‘know’ where they come from, thereby making itstraightforward to assign target volume (or membrane) elements to the fragments ofdissociating complexes. The information contained in the complexes (origins of theircomponents, list of complex interactions that can generate them, list of decays that
Angermann et al. Page 8
Nat Methods. Author manuscript; available in PMC 2012 September 21.
NIH
-PA Author Manuscript
NIH
-PA Author Manuscript
NIH
-PA Author Manuscript
disintegrate them into fragments) is then translated into sets of equations encoding theconcentration changes (and their kinetic rates) of the complexes in the system(Supplementary Note 3a).
All simulation methods described here are implemented in algorithms that are eitheraccessible through graphical user interfaces or programmatically through applicationprogramming interface (API) files. Examples illustrating how to access the reportedfunctionality in custom programs using the algorithms introduced here are provided in thedocumentation for the modeler/simulator API. The numerical parameters we used are givenin Supplementary Note 5.
Generation of location-dependent reaction networksReactions between molecular complexes are based on binding possibilities between pairs ofmolecular binding sites. The rate constants of these reactions may be determined by thecomplexes to which the interacting molecules belong: Two molecules A and B may havedifferent association (and dissociation) rates depending on whether they interact as mono-molecular ‘complexes’ A and B or are part of larger complexes, for instance, as A bound toC in a complex A:C. These properties of the molecules and the complexes they may formdefine the purely biochemical network mentioned at the beginning of the Results section.The modeler interface provides the functionality to specify these properties using a graphicalinterface. Once the computational representations of the cellular morphologies have beengenerated (see next section), local networks in the volume elements of the spatialdiscretization are generated based on the molecular complexes that are initially placed intothese volume elements (as initial conditions of a particular simulation of the model) andtheir potential interactions and the complexes they can form. The local networks in eachvolume element will generate only those complexes that can actually be formed based on thelocally available initial biochemical make-up in that element. For instance, if A can bind toB and C but a local volume element contains only A and C, the algorithm will generate arepresentation of complex A:C but not A:B instead of generating both and just setting theconcentration of A:B to zero. This distinction ensures a maximally efficient (sparse)representation of the reaction kinetics. In all membrane locations, the molecular complexesare given additional tags that encode their volume element identity. This allows thealgorithm to generate intercellular membrane-membrane complexes and identify whichcomponents of a complex (each belonging to one of two distinct membrane elements) theydecay to when the binding that mediates the membrane-membrane link (in the E-cadherinexample the trans-trans interaction) is lost. With the information about which interactionsare possible locally and the location tagging, the algorithm can finally determine allreactions for each single local molecular complex: associations, where two complexes forma larger complex; dissociations, where a complex decays into two smaller ones; andtransformations, where a complex changes the state of its molecular components, forinstance switching from unphosphorylated to phosphorylated. In spite the overhead resultingfrom the additional information needed to generate localized spatial networks Simmune’snetwork generators compare favorably with other approaches for automated networkgeneration (Supplementary Note 3b and Supplementary Figure 6).
Generation of computational representations of cellular morphologies: Finite volumemethod
Partial differential equations (PDEs) are the continuous mathematical representation of thereaction-diffusion system given by interacting and diffusing molecular complexes. PDEsthat describe the spatio-temporal behavior of conserved quantities such as diffusingmolecules are amenable to discretization by the finite volume method. The method's centralidea is to cover the spatial region on which the PDE is defined with a set of volume elements
Angermann et al. Page 9
Nat Methods. Author manuscript; available in PMC 2012 September 21.
NIH
-PA Author Manuscript
NIH
-PA Author Manuscript
NIH
-PA Author Manuscript
and express the rate of change of the conserved quantity in those elements in terms of theflux through their surface [Finite Volume Methods Robert Eymard, Thierry Gallouet andRaphaele Herbin October 2006. This manuscript is an update of the preprint n0 97-19 duLATP, UMR 6632, Marseille, September 1997 that appeared in Handbook of NumericalAnalysis, P.G. Ciarlet, J.L. Lions eds, vol 7, pp 713–1020]. In the case of diffusion the fluxthrough the surfaces is determined by Fick's law. Cytosolic and extracellular diffusion canbe discretized in a natural way by choosing a piecewise constant approximation ofconcentrations, and an approximation of the gradients through the distances between thecenters of the volume elements (these are cubic in the implementation used here). However,the surface elements of the cubic grid elements that cover a simulated cell do not provide anadequate approximation of the cell's surface. The distances and interface lengths enteringFick's law have to be inferred from the cell's shape. This will be explained in the followingsection.
Generation of modified surface geometry for membrane diffusionThe surface elements of the cubic grid elements that cover a simulated cell provide aninadequate approximation to the cell's surface (cf. Supplementary Note 3d). To illustrate thisissue consider a sphere of radius 1. The circumference of that sphere is 2π and its area 4π.In contrast, the circumference of the discretized sphere at the equator is 8, independent ofthe resolution of the discretization. (Distinct parts of the circumference can be viewed fromfour directions, perpendicular to the front, back, left and right faces of the cubic gridelements defining the sphere. The visible circumference from each of these four viewpointsis 2 for a total of 8.) The surface area of the discretized sphere converges to 6π for a gridconstant approaching 0. By an argument similar to the previous one the area can be viewedfrom 6 directions. In each direction a circle with area π is approximated by the surfaces ofthe grid elements, leading to a total area of 6π. Considering these discrepancies between thediscretized and ideal sphere it is obvious that a naive approach using the surface of the cubicgrid cells to solve the diffusion equation will not yield results converging to the truesolution.
This can be remedied by locally adapting the area and shape as well as the distancesbetween surface elements of the cubic grid elements (Supplementary Fig. 7). The approachtaken here is based on a method 34 that was designed to provide accurate approximations toidealized smooth surfaces that do not change over the course of a simulation. Our simulationscheme is designed to allow for frequent changes of the surface geometry. This requiresrebuilding the surface approximation and redistributing membrane molecules(Supplementary Note 3c and Supplementary Fig. 8) after each change of the surfacegeometry. We therefore modified the original method to reduce the computational cost forcreating the approximation. In numerical tests the error of the much faster modified methodwas still in the sub-percent range (cf. Supplementary Note 6). The Supplementary Movies1 and 2 use the surface normals generated by this method to display the curvature of the cellmembranes.
Potts Model dynamicsWe use a Cellular Potts model (CPM) 23 to simulate dynamic cell morphologies. Duringeach morphology update, which occurs with a user-defined frequency, a subset of thevolume elements that are adjacent to the cell's surface are randomly chosen. The energy costfor the extension of the element in a randomly chosen direction and the retraction of theelement are evaluated. The change with the lower cost is chosen and will be accepted if thecost is smaller than zero or with a probability exp(-E) for a cost E. A volume element of onecell can extend into a volume element occupied by another cell; the total cost will be thesum of the costs for extending one volume element and retracting the other.
Angermann et al. Page 10
Nat Methods. Author manuscript; available in PMC 2012 September 21.
NIH
-PA Author Manuscript
NIH
-PA Author Manuscript
NIH
-PA Author Manuscript
Note that this strategy as implemented here permits the development of models that couplemembrane biochemical and morphological dynamics. However, this coupling isphenomenological in the sense that membrane dynamics are not simulated based onbiomechanical calculations that describe surface deformations in terms of forces generated,for instance, by actin and myosin fibers that interact with the cell’s membrane. Accordingly,Potts model parameters have to be chosen heuristically to reproduce the experimentallyobserved dynamics of cellular morphology.
Our CPM utilizes four different energy terms. The relative strengths sx of the terms aretunable as part of a simulation definition. The total cost E is given by
where Ev and Ea are contribution controlling the cost of volume and surface changes, Ebdetermines the contribution of receptor binding between adjacent membranes and Ecrepresents a phenomenological term that penalizes small thin protrusions. These terms aredefined in detail below. Their proportionality constants have been chosen to result inrealistic behavior of the E-cadherin receptor mediated adhesion model for relative strengthsclose to one.
Additional user defined terms can be added through the programming interface (API), byderiving a new class from the PottsTerm-class and reimplementing its extendCost(Cube* c, DIRECTION d) and retractCost(Cube * c) methods as illustrated by thePottsTermExample class in the smun_PottsTerm.h header file. An implementationexample is provided in the file “PottsExample.cpp”.
The volume term models the effects of an impermeable cell membrane. The potential energyof a cell with volume V and equilibrium Volume V0 is proportional to the squared volumedifference. The energy cost for osmotic swelling of the cell, given the new Vnew and oldVold cell volumes, is thus
where Ve is the volume of a single volume element, n the number of volume elements, andn0 the number of volume elements at which the cell is in equilibrium.
The Volume V0 is specified as a fraction of the initial cell volume. This is done through the“CellDesigner” user interface. In the case of the E-cadherin model the fraction equals one,thus the cell is in equilibrium at the start of the simulation, with a relative strength sv=1.
The area term models energy cost of changes to the cells surface area. The area change ΔAis approximated by change of the area of the surface of the subset of the cubic grid that iscovered by the cell
with Δs=s-s0 being the change of the number of surface elements and Ae the area of a singlesurface element. In analogy to the Volume term we model the energy cost for extending themembrane out of it's relaxed state by a harmonic potential. The energy cost for changing themorphology is thus
Angermann et al. Page 11
Nat Methods. Author manuscript; available in PMC 2012 September 21.
NIH
-PA Author Manuscript
NIH
-PA Author Manuscript
NIH
-PA Author Manuscript
The number of surface elements of the relaxed membrane is specified as a fraction of theinitial cell surface analogous to the relaxed volume. Setting the relaxed fraction to a valuedifferent from one allows the user to model phenomena such as the opening of membranereservoirs. The relaxed surface of the cells used in the E-cadherin model equals their initialsurface, the area term has a relative strength sa=1/2.
The binding term models the energy cost of adhesion due to the breaking of intercellularbonds due to changes of the morphology. The contribution of each type of bond isproportional to the number of bonds that are broken by the morphology change
where the first sum is over all surface elements that are removed and the second sums overall intercellular bonds. The area of a surface element is given by ASurface and the surfaceconcentration of a bond type by CBond. Only bonds that are marked as trans in the modelspecification can be used as bonds that enter the adhesion term, the relative strength of theadhesion term is specified together with the other potts term during the setup of asimulation. Naming the binding sites in the components of the interacting moleculesspecifies bonds. The E-cadherin model has only one type of binding that can enter as abinding term; the trans interaction of the E-cadherin molecules, which is given a relativestrength sb=2.
The bending resistance of the cell membrane is modeled by a phenomenological term thatdepends only on the number of direct neighbors of the changing volume element. Therelative cost for extending a volume element is Erel={1, 0, −1, 10, −25} with one to fiveneighbors. This penalizes the formation of small, thin extensions while it favors closing ofsmall invaginations. The cost terms for retracting a volume element have the opposite costfavoring the retraction of a small protrusion while penalizing the formation of invaginations.The asymmetric nature of the cost terms allow the cell to sample its surroundings whilekeeping the cell's surface from becoming very rough. The only parameter of this purely localterm is its relative contribution to the total cost E. For the E-cadherin model we chose therelative contribution sc=1/2.
Supplementary MaterialRefer to Web version on PubMed Central for supplementary material.
AcknowledgmentsThe authors are grateful for helpful comments from R. Schwartz, R. Varma, A. Nita-Lazar, I. Fraser, J. Tsang, andD. Cioffi as well as for insightful discussions with the members of the Laboratory for Systems Biology (LSB) at theNational Institute of Allergy and Infectious Diseases. The authors also acknowledge comments from the(anonymous) reviewers that helped improving the clarity of the manuscript. The authors thank A. Meier-Schellersheim for creating Figure 2 and Supplementary Figure 1. This work was supported by the IntramuralResearch Program of the National Institute of Allergy and Infectious Diseases of the National Institutes of Health.
Angermann et al. Page 12
Nat Methods. Author manuscript; available in PMC 2012 September 21.
NIH
-PA Author Manuscript
NIH
-PA Author Manuscript
NIH
-PA Author Manuscript
Glossary
MAPK Mitogen-activated protein kinase
References1. Lingwood D, Simons K. Lipid rafts as a membrane-organizing principle. Science. 2010; 327:46–50.
[PubMed: 20044567]
2. Kholodenko BN. Four-dimensional organization of protein kinase signaling cascades: the roles ofdiffusion, endocytosis and molecular motors. J Exp Biol. 2003; 206:2073–2082. [PubMed:12756289]
3. Delon J, Germain RN. Information transfer at the immunological synapse. Curr Biol. 2000;10:R923–R933. [PubMed: 11137031]
4. Jones RB, Gordus A, Krall JA, MacBeath G. A quantitative protein interaction network for the ErbBreceptors using protein microarrays. Nature. 2006; 439:168–174. [PubMed: 16273093]
5. Brown MD, Sacks DB. Protein scaffolds in MAP kinase signalling. Cell Signal. 2009; 21:462–469.[PubMed: 19091303]
6. Hlavacek WS, Faeder JR, Blinov ML, Perelson AS, Goldstein B. The complexity of complexes insignal transduction. Biotechnol Bioeng. 2003; 84:783–794. [PubMed: 14708119]
7. Meier-Schellersheim M, et al. Key role of local regulation in chemosensing revealed by a newmolecular interaction-based modeling method. PLoS Comput Biol. 2006; 2:e82. [PubMed:16854213]
8. Hlavacek WS, et al. Rules for modeling signal-transduction systems. Sci STKE. 2006; 2006:re6.[PubMed: 16849649]
9. Lok L, Brent R. Automatic generation of cellular reaction networks with Moleculizer 1.0. NatBiotechnol. 2005; 23:131–136. [PubMed: 15637632]
10. Feret J, Danos V, Krivine J, Harmer R, Fontana W. Internal coarse-graining of molecular systems.Proc Natl Acad Sci U S A. 2009; 106:6453–6458. [PubMed: 19346467]
11. Koschorreck M, Gilles ED. ALC: automated reduction of rule-based models. BMC Syst Biol.2008; 2:91. [PubMed: 18973705]
12. Mallavarapu A, Thomson M, Ullian B, Gunawardena J. Programming with models: modularity andabstraction provide powerful capabilities for systems biology. J R Soc Interface. 2009; 6:257–270.[PubMed: 18647734]
13. Varma R, Campi G, Yokosuka T, Saito T, Dustin ML. T cell receptor-proximal signals aresustained in peripheral microclusters and terminated in the central supramolecular activationcluster. Immunity. 2006; 25:117–127. [PubMed: 16860761]
14. van Zon JS, ten Wolde PR. Green's-function reaction dynamics: a particle-based approach forsimulating biochemical networks in time and space. J Chem Phys. 2005; 123:234910. [PubMed:16392952]
15. Andrews SS, Addy NJ, Brent R, Arkin AP. Detailed simulations of cell biology with Smoldyn 2.1.PLoS Comput Biol. 2010; 6:e1000705. [PubMed: 20300644]
16. Gumbiner BM. Regulation of cadherin-mediated adhesion in morphogenesis. Nat Rev Mol CellBiol. 2005; 6:622–634. [PubMed: 16025097]
17. Sivasankar S, Zhang Y, Nelson WJ, Chu S. Characterizing the initial encounter complex incadherin adhesion. Structure. 2009; 17:1075–1081. [PubMed: 19646884]
18. Cavey M, Lecuit T. Molecular bases of cell-cell junctions stability and dynamics. Cold SpringHarb Perspect Biol. 2009; 1:a002998. [PubMed: 20066121]
19. Zhang Y, Sivasankar S, Nelson WJ, Chu S. Resolving cadherin interactions and bindingcooperativity at the single-molecule level. Proc Natl Acad Sci U S A. 2009; 106:109–114.[PubMed: 19114658]
20. Troyanovsky S. Cadherin dimers in cell-cell adhesion. Eur J Cell Biol. 2005; 84:225–233.[PubMed: 15819403]
Angermann et al. Page 13
Nat Methods. Author manuscript; available in PMC 2012 September 21.
NIH
-PA Author Manuscript
NIH
-PA Author Manuscript
NIH
-PA Author Manuscript
21. Adams CL, Chen YT, Smith SJ, Nelson WJ. Mechanisms of epithelial cell-cell adhesion and cellcompaction revealed by high-resolution tracking of E-cadherin-green fluorescent protein. J CellBiol. 1998; 142:1105–1119. [PubMed: 9722621]
22. Perez TD, Tamada M, Sheetz MP, Nelson WJ. Immediate-early signaling induced by E-cadherinengagement and adhesion. J Biol Chem. 2008; 283:5014–5022. [PubMed: 18089563]
23. Glazier JA, Graner F. Simulation of the differential adhesion driven rearrangement of biologicalcells. Phys Rev E Stat Phys Plasmas Fluids Relat Interdiscip Topics. 1993; 47:2128–2154.[PubMed: 9960234]
24. Beltman JB, Maree AF, Lynch JN, Miller MJ, de Boer RJ. Lymph node topology dictates T cellmigration behavior. J Exp Med. 2007; 204:771–780. [PubMed: 17389236]
25. Perez-Moreno M, Jamora C, Fuchs E. Sticky business: orchestrating cellular signals at adherensjunctions. Cell. 2003; 112:535–548. [PubMed: 12600316]
26. Hong S, Troyanovsky RB, Troyanovsky SM. Spontaneous assembly and active disassemblybalance adherens junction homeostasis. Proc Natl Acad Sci U S A. 2010; 107:3528–3533.[PubMed: 20133579]
27. Dohlman HG, Thorner JW. Regulation of G protein-initiated signal transduction in yeast:paradigms and principles. Annu Rev Biochem. 2001; 70:703–754. [PubMed: 11395421]
28. Kofahl B, Klipp E. Modelling the dynamics of the yeast pheromone pathway. Yeast. 2004;21:831–850. [PubMed: 15300679]
29. Shao D, Zheng W, Qiu W, Ouyang Q, Tang C. Dynamic studies of scaffold-dependent matingpathway in yeast. Biophys J. 2006; 91:3986–4001. [PubMed: 16980360]
30. Maeder CI, et al. Spatial regulation of Fus3 MAP kinase activity through a reaction-diffusionmechanism in yeast pheromone signalling. Nat Cell Biol. 2007; 9:1319–1326. [PubMed:17952059]
31. Good M, Tang G, Singleton J, Remenyi A, Lim WA. The Ste5 scaffold directs mating signaling bycatalytically unlocking the Fus3 MAP kinase for activation. Cell. 2009; 136:1085–1097. [PubMed:19303851]
32. Bhattacharyya RP, et al. The Ste5 scaffold allosterically modulates signaling output of the yeastmating pathway. Science. 2006; 311:822–826. [PubMed: 16424299]
33. Evans R, et al. Integrins in immunity. J Cell Sci. 2009; 122:215–225. [PubMed: 19118214]
34. Novak IL, et al. Diffusion on a Curved Surface Coupled to Diffusion in the Volume: Application toCell Biology. J Comput Phys. 2007; 226:1271–1290. [PubMed: 18836520]
Angermann et al. Page 14
Nat Methods. Author manuscript; available in PMC 2012 September 21.
NIH
-PA Author Manuscript
NIH
-PA Author Manuscript
NIH
-PA Author Manuscript
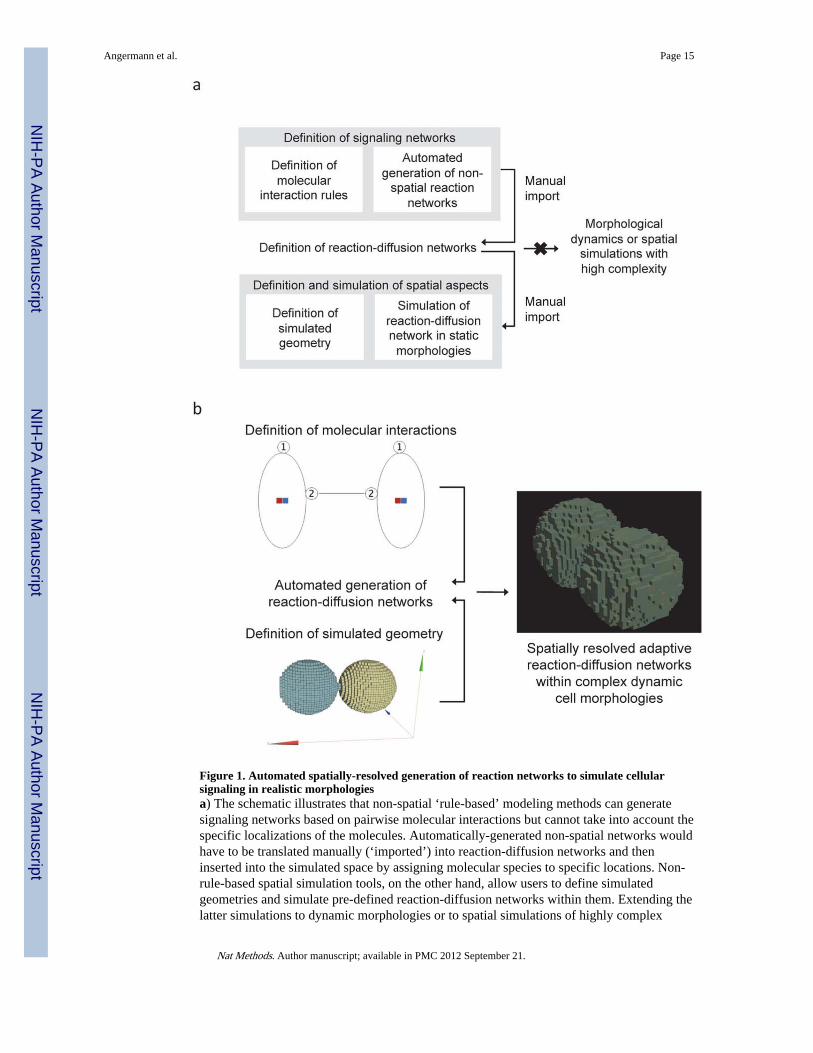
Figure 1. Automated spatially-resolved generation of reaction networks to simulate cellularsignaling in realistic morphologiesa) The schematic illustrates that non-spatial ‘rule-based’ modeling methods can generatesignaling networks based on pairwise molecular interactions but cannot take into account thespecific localizations of the molecules. Automatically-generated non-spatial networks wouldhave to be translated manually (‘imported’) into reaction-diffusion networks and theninserted into the simulated space by assigning molecular species to specific locations. Non-rule-based spatial simulation tools, on the other hand, allow users to define simulatedgeometries and simulate pre-defined reaction-diffusion networks within them. Extending thelatter simulations to dynamic morphologies or to spatial simulations of highly complex
Angermann et al. Page 15
Nat Methods. Author manuscript; available in PMC 2012 September 21.
NIH
-PA Author Manuscript
NIH
-PA Author Manuscript
NIH
-PA Author Manuscript
reaction networks is, however, not possible because the reaction-diffusion networks must befully specified prior to performing the spatially-resolved simulation. b) Simmune’s spatially-resolved automated network generator permits the definition of reaction networks based onmolecular interaction rules and then generates and simulates reaction-diffusion networkswhile adapting them to potentially dynamic cellular morphologies such as shown here forthe simulation of cell-cell contact formation.
Angermann et al. Page 16
Nat Methods. Author manuscript; available in PMC 2012 September 21.
NIH
-PA Author Manuscript
NIH
-PA Author Manuscript
NIH
-PA Author Manuscript
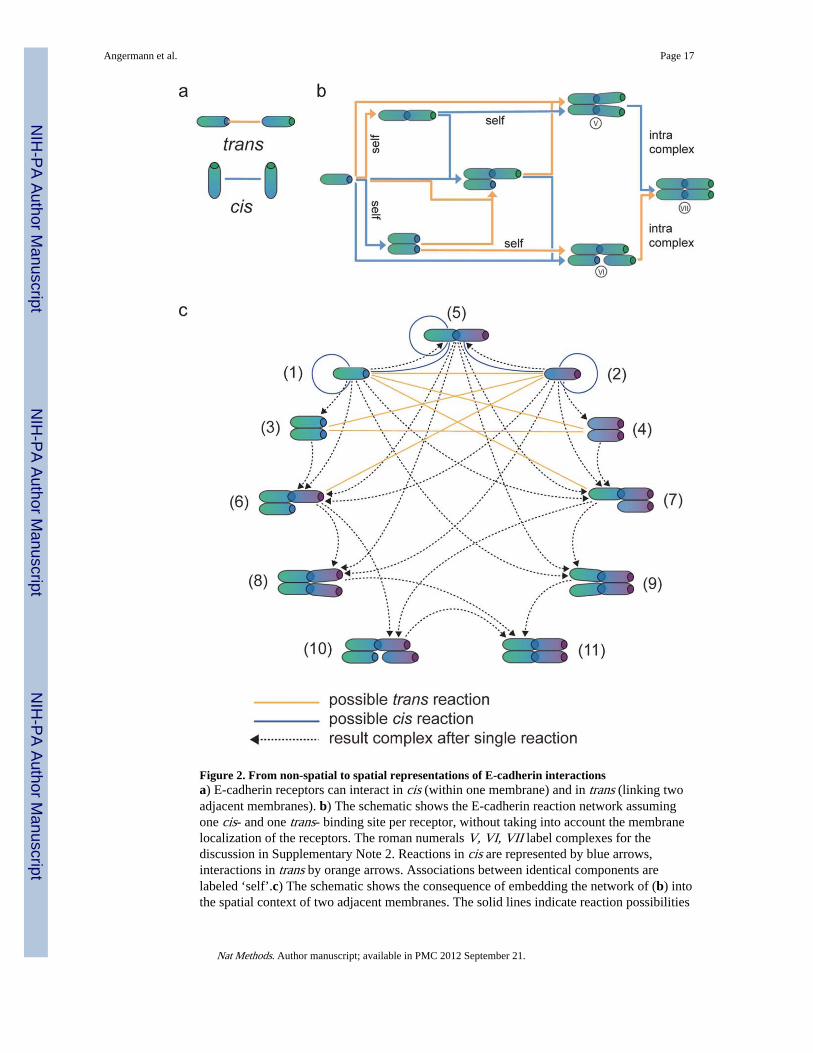
Figure 2. From non-spatial to spatial representations of E-cadherin interactionsa) E-cadherin receptors can interact in cis (within one membrane) and in trans (linking twoadjacent membranes). b) The schematic shows the E-cadherin reaction network assumingone cis- and one trans- binding site per receptor, without taking into account the membranelocalization of the receptors. The roman numerals V, VI, VII label complexes for thediscussion in Supplementary Note 2. Reactions in cis are represented by blue arrows,interactions in trans by orange arrows. Associations between identical components arelabeled ‘self’.c) The schematic shows the consequence of embedding the network of (b) intothe spatial context of two adjacent membranes. The solid lines indicate reaction possibilities
Angermann et al. Page 17
Nat Methods. Author manuscript; available in PMC 2012 September 21.
NIH
-PA Author Manuscript
NIH
-PA Author Manuscript
NIH
-PA Author Manuscript
(blue: cis, yellow: trans), the dotted arrows connect initial and resulting complexes forassociation reactions. For example, complex (1) can associate with (4) (as indicated by asolid yellow line between (1) and (4)) to form (6) (dotted arrow from (1) to (6)). The colorgradients of the E-cadherin molecules (ranging from green to blue or from purple to blue)indicate that the complexes are treated as embedded in two adjacent membranes; blueindicates the intercellular domains. The number labels correspond to the numbering of thedifferential equations in Supplementary Note 2b.
Angermann et al. Page 18
Nat Methods. Author manuscript; available in PMC 2012 September 21.
NIH
-PA Author Manuscript
NIH
-PA Author Manuscript
NIH
-PA Author Manuscript
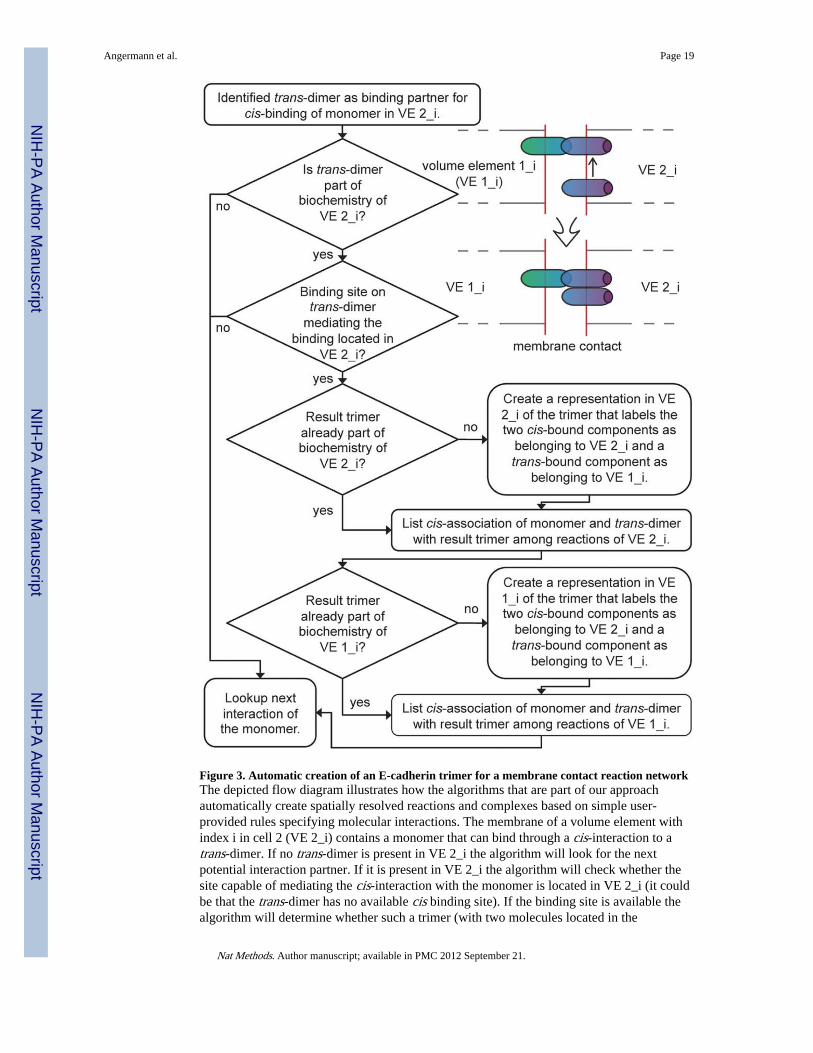
Figure 3. Automatic creation of an E-cadherin trimer for a membrane contact reaction networkThe depicted flow diagram illustrates how the algorithms that are part of our approachautomatically create spatially resolved reactions and complexes based on simple user-provided rules specifying molecular interactions. The membrane of a volume element withindex i in cell 2 (VE 2_i) contains a monomer that can bind through a cis-interaction to atrans-dimer. If no trans-dimer is present in VE 2_i the algorithm will look for the nextpotential interaction partner. If it is present in VE 2_i the algorithm will check whether thesite capable of mediating the cis-interaction with the monomer is located in VE 2_i (it couldbe that the trans-dimer has no available cis binding site). If the binding site is available thealgorithm will determine whether such a trimer (with two molecules located in the
Angermann et al. Page 19
Nat Methods. Author manuscript; available in PMC 2012 September 21.
NIH
-PA Author Manuscript
NIH
-PA Author Manuscript
NIH
-PA Author Manuscript
membrane of VE 2_i and one in the adjacent membrane of VE 1_i) is already represented asa complex within the biochemistry of VE 2_i in which case this complex representation willbe used as the result complex of the association. Otherwise, a result trimer complex will bebuilt within the biochemistry of VE 2_i. Since the result trimer also is ‘visible’ in themembrane element of VE 1_i it has to be inserted or identified in that reaction network aswell. Finally, the reaction information is completed by assembling a code for the associationof the monomer with the trans-dimer resulting in the formation of the trimer as resultcomplex and with the reaction rate as specified by the user-supplied association rate betweenthe involved binding sites.
Angermann et al. Page 20
Nat Methods. Author manuscript; available in PMC 2012 September 21.
NIH
-PA Author Manuscript
NIH
-PA Author Manuscript
NIH
-PA Author Manuscript
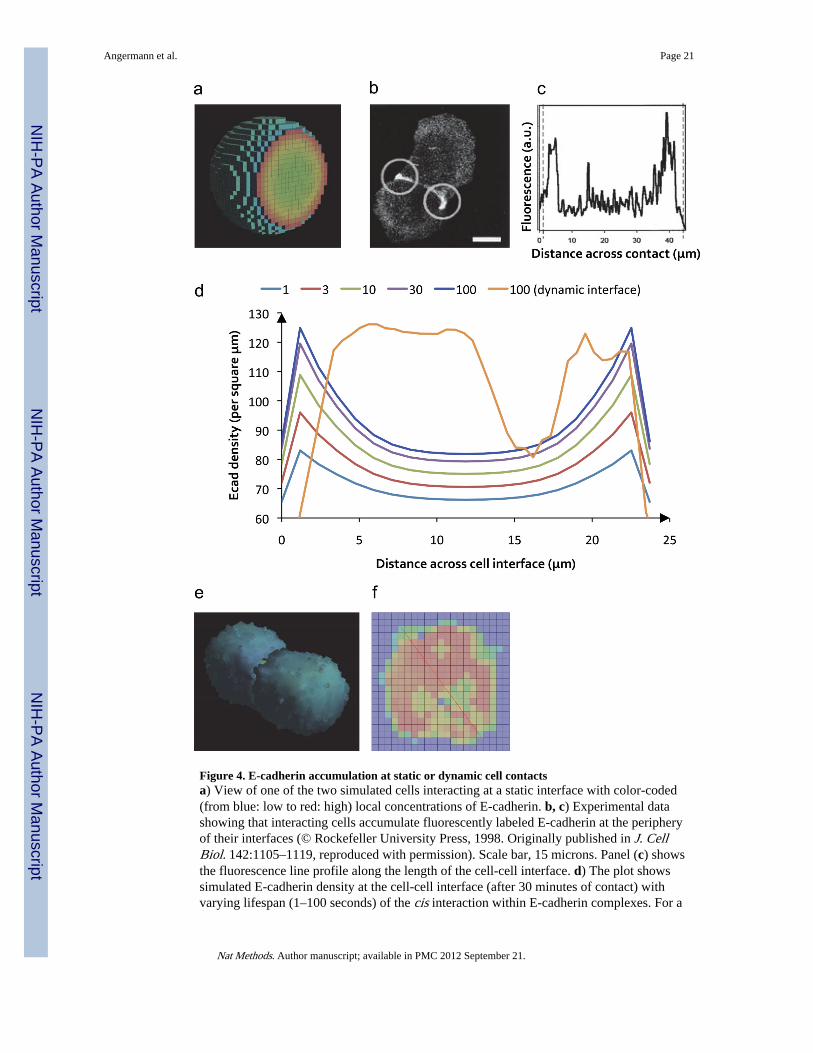
Figure 4. E-cadherin accumulation at static or dynamic cell contactsa) View of one of the two simulated cells interacting at a static interface with color-coded(from blue: low to red: high) local concentrations of E-cadherin. b, c) Experimental datashowing that interacting cells accumulate fluorescently labeled E-cadherin at the peripheryof their interfaces (© Rockefeller University Press, 1998. Originally published in J. CellBiol. 142:1105–1119, reproduced with permission). Scale bar, 15 microns. Panel (c) showsthe fluorescence line profile along the length of the cell-cell interface. d) The plot showssimulated E-cadherin density at the cell-cell interface (after 30 minutes of contact) withvarying lifespan (1–100 seconds) of the cis interaction within E-cadherin complexes. For a
Angermann et al. Page 21
Nat Methods. Author manuscript; available in PMC 2012 September 21.
NIH
-PA Author Manuscript
NIH
-PA Author Manuscript
NIH
-PA Author Manuscript

lifespan of 100 seconds, both a static and dynamic interface are shown. e, f) Cell-cell contactafter 1.5 simulated hours based on cellular Potts model dynamics. Panel (f) shows the color-coded E-cadherin concentration (red: high, blue: low) at the dynamic cellular interface. Thered line was used to determine the concentration profile shown as the orange curve in part(d) of this figure. One voxel has a side length of 1.29 micrometers.
Angermann et al. Page 22
Nat Methods. Author manuscript; available in PMC 2012 September 21.
NIH
-PA Author Manuscript
NIH
-PA Author Manuscript
NIH
-PA Author Manuscript
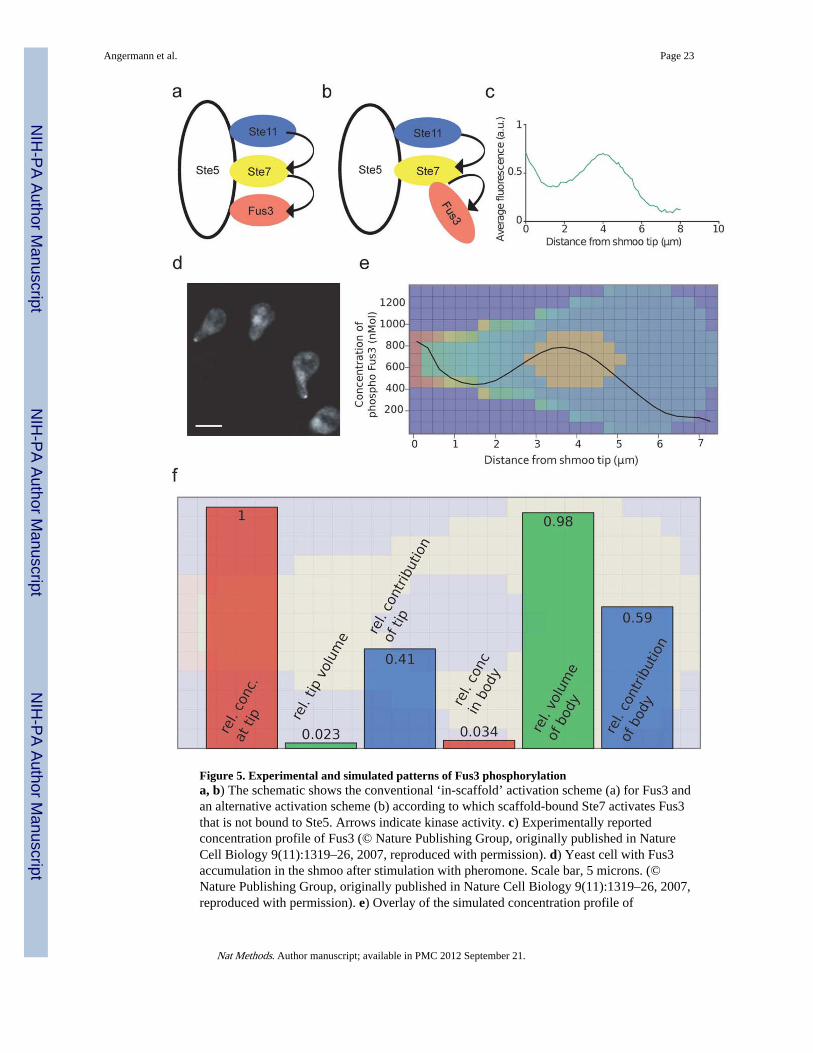
Figure 5. Experimental and simulated patterns of Fus3 phosphorylationa, b) The schematic shows the conventional ‘in-scaffold’ activation scheme (a) for Fus3 andan alternative activation scheme (b) according to which scaffold-bound Ste7 activates Fus3that is not bound to Ste5. Arrows indicate kinase activity. c) Experimentally reportedconcentration profile of Fus3 (© Nature Publishing Group, originally published in NatureCell Biology 9(11):1319–26, 2007, reproduced with permission). d) Yeast cell with Fus3accumulation in the shmoo after stimulation with pheromone. Scale bar, 5 microns. (©Nature Publishing Group, originally published in Nature Cell Biology 9(11):1319–26, 2007,reproduced with permission). e) Overlay of the simulated concentration profile of
Angermann et al. Page 23
Nat Methods. Author manuscript; available in PMC 2012 September 21.
NIH
-PA Author Manuscript
NIH
-PA Author Manuscript
NIH
-PA Author Manuscript
phosphorylated Fus3 as a function of the distance from the shmoo tip and color-codedconcentration (from red: high to blue: low) within a central plane through the simulatedyeast cell. Side length of one square is 0.28 micrometers. f) The schematic shows therelative concentrations of the pFus3 producing complexes at the shmoo tip and in the cellbody (red squares), the relative volumes of the two spatial regions (green squares) and theresulting relative contributions to the total pFus3 production (blue squares).
Angermann et al. Page 24
Nat Methods. Author manuscript; available in PMC 2012 September 21.
NIH
-PA Author Manuscript
NIH
-PA Author Manuscript
NIH
-PA Author Manuscript