comprehensive housing market analysis for detroit-dearborn
TRANSCRIPT
COMPREHENSIVE HOUSING MARKET ANALYSIS
U.S. Department of Housing and Urban Development, Office of Policy Development and Research
As of November 1, 2020
Share on:
Detroit-Dearborn-Livonia, Michigan
The COVID-19 pandemic has resulted in unprecedented large and rapid changes in many data series, and similarly unprecedented large policy responses, making analysis of, and longer run predictions for, the economy and housing markets exceptionally difficult and uncertain. HUD will continue to monitor market conditions in the HMA and provide an updated report/addendum in the future.
Executive Summary 2Detroit-Dearborn-Livonia, Michigan Comprehensive Housing Market Analysis as of November 1, 2020
Comprehensive Housing Market Analysis Detroit-Dearborn-Livonia, MichiganU.S. Department of Housing and Urban Development, Office of Policy Development and Research
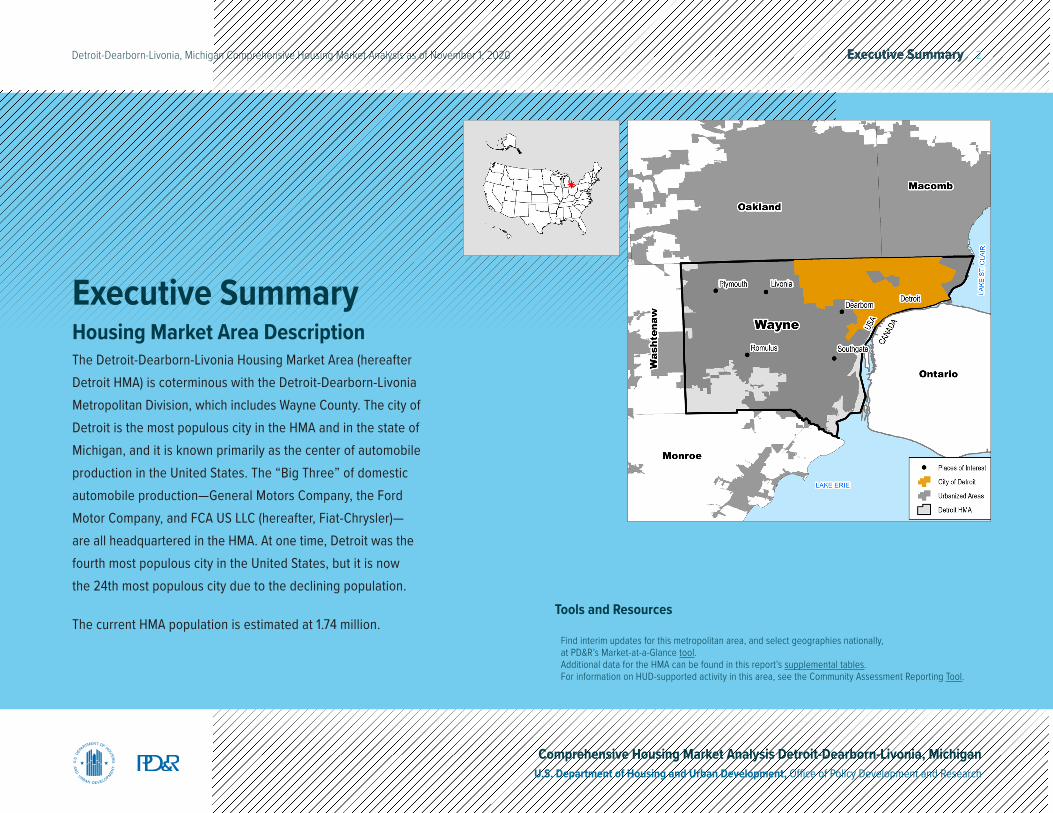
Executive SummaryHousing Market Area DescriptionThe Detroit-Dearborn-Livonia Housing Market Area (hereafter Detroit HMA) is coterminous with the Detroit-Dearborn-Livonia Metropolitan Division, which includes Wayne County. The city of Detroit is the most populous city in the HMA and in the state of Michigan, and it is known primarily as the center of automobile production in the United States. The “Big Three” of domestic automobile production—General Motors Company, the Ford Motor Company, and FCA US LLC (hereafter, Fiat-Chrysler)—are all headquartered in the HMA. At one time, Detroit was the fourth most populous city in the United States, but it is now the 24th most populous city due to the declining population.
The current HMA population is estimated at 1.74 million.Tools and Resources
Find interim updates for this metropolitan area, and select geographies nationally, at PD&R’s Market-at-a-Glance tool.Additional data for the HMA can be found in this report’s supplemental tables.For information on HUD-supported activity in this area, see the Community Assessment Reporting Tool.
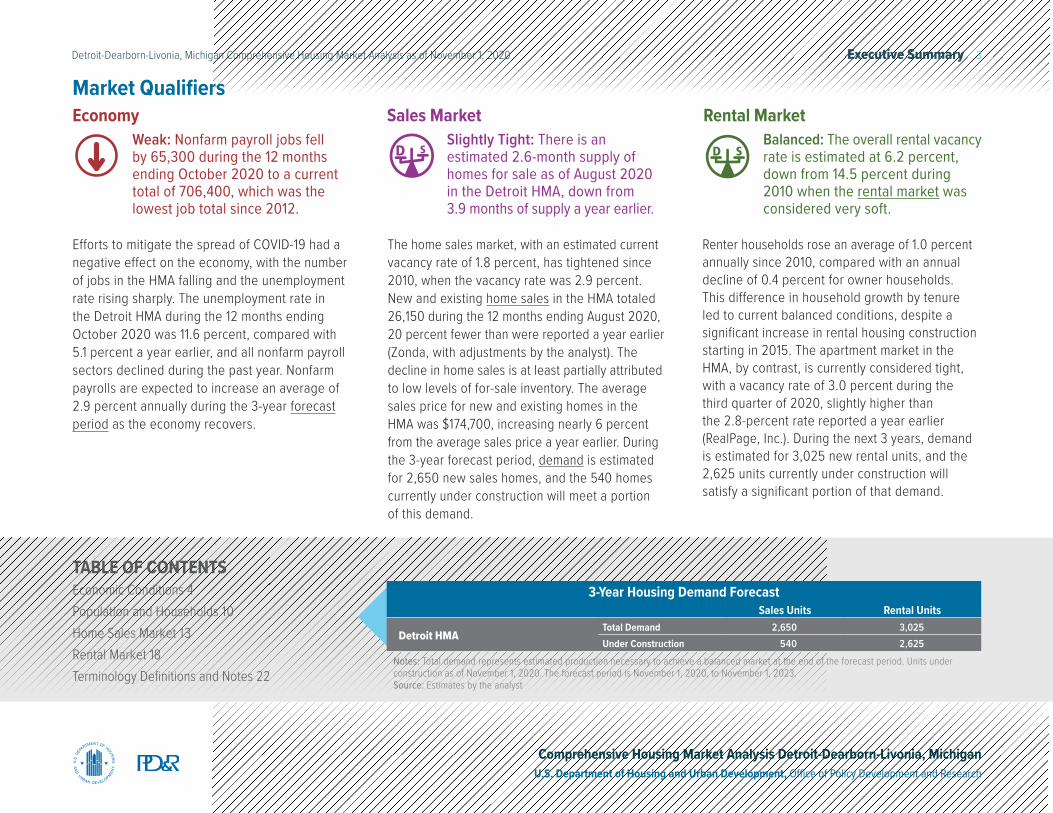
Notes: Total demand represents estimated production necessary to achieve a balanced market at the end of the forecast period. Units under construction as of November 1, 2020. The forecast period is November 1, 2020, to November 1, 2023.Source: Estimates by the analyst
3-Year Housing Demand Forecast Sales Units Rental Units
Detroit HMATotal Demand 2,650 3,025Under Construction 540 2,625
Executive Summary 3Detroit-Dearborn-Livonia, Michigan Comprehensive Housing Market Analysis as of November 1, 2020
Comprehensive Housing Market Analysis Detroit-Dearborn-Livonia, MichiganU.S. Department of Housing and Urban Development, Office of Policy Development and Research
Market Qualifiers
Efforts to mitigate the spread of COVID-19 had a negative effect on the economy, with the number of jobs in the HMA falling and the unemployment rate rising sharply. The unemployment rate in the Detroit HMA during the 12 months ending October 2020 was 11.6 percent, compared with 5.1 percent a year earlier, and all nonfarm payroll sectors declined during the past year. Nonfarm payrolls are expected to increase an average of 2.9 percent annually during the 3-year forecast period as the economy recovers.
The home sales market, with an estimated current vacancy rate of 1.8 percent, has tightened since 2010, when the vacancy rate was 2.9 percent. New and existing home sales in the HMA totaled 26,150 during the 12 months ending August 2020, 20 percent fewer than were reported a year earlier (Zonda, with adjustments by the analyst). The decline in home sales is at least partially attributed to low levels of for-sale inventory. The average sales price for new and existing homes in the HMA was $174,700, increasing nearly 6 percent from the average sales price a year earlier. During the 3-year forecast period, demand is estimated for 2,650 new sales homes, and the 540 homes currently under construction will meet a portion of this demand.
Renter households rose an average of 1.0 percent annually since 2010, compared with an annual decline of 0.4 percent for owner households. This difference in household growth by tenure led to current balanced conditions, despite a significant increase in rental housing construction starting in 2015. The apartment market in the HMA, by contrast, is currently considered tight, with a vacancy rate of 3.0 percent during the third quarter of 2020, slightly higher than the 2.8-percent rate reported a year earlier (RealPage, Inc.). During the next 3 years, demand is estimated for 3,025 new rental units, and the 2,625 units currently under construction will satisfy a significant portion of that demand.
EconomyWeak: Nonfarm payroll jobs fell by 65,300 during the 12 months ending October 2020 to a current total of 706,400, which was the lowest job total since 2012.
Rental MarketBalanced: The overall rental vacancy rate is estimated at 6.2 percent, down from 14.5 percent during 2010 when the rental market was considered very soft.
Sales MarketSlightly Tight: There is an estimated 2.6-month supply of homes for sale as of August 2020 in the Detroit HMA, down from 3.9 months of supply a year earlier.
TABLE OF CONTENTSEconomic Conditions 4Population and Households 10Home Sales Market 13Rental Market 18Terminology Definitions and Notes 22
Economic Conditions 4Detroit-Dearborn-Livonia, Michigan Comprehensive Housing Market Analysis as of November 1, 2020
Comprehensive Housing Market Analysis Detroit-Dearborn-Livonia, MichiganU.S. Department of Housing and Urban Development, Office of Policy Development and Research
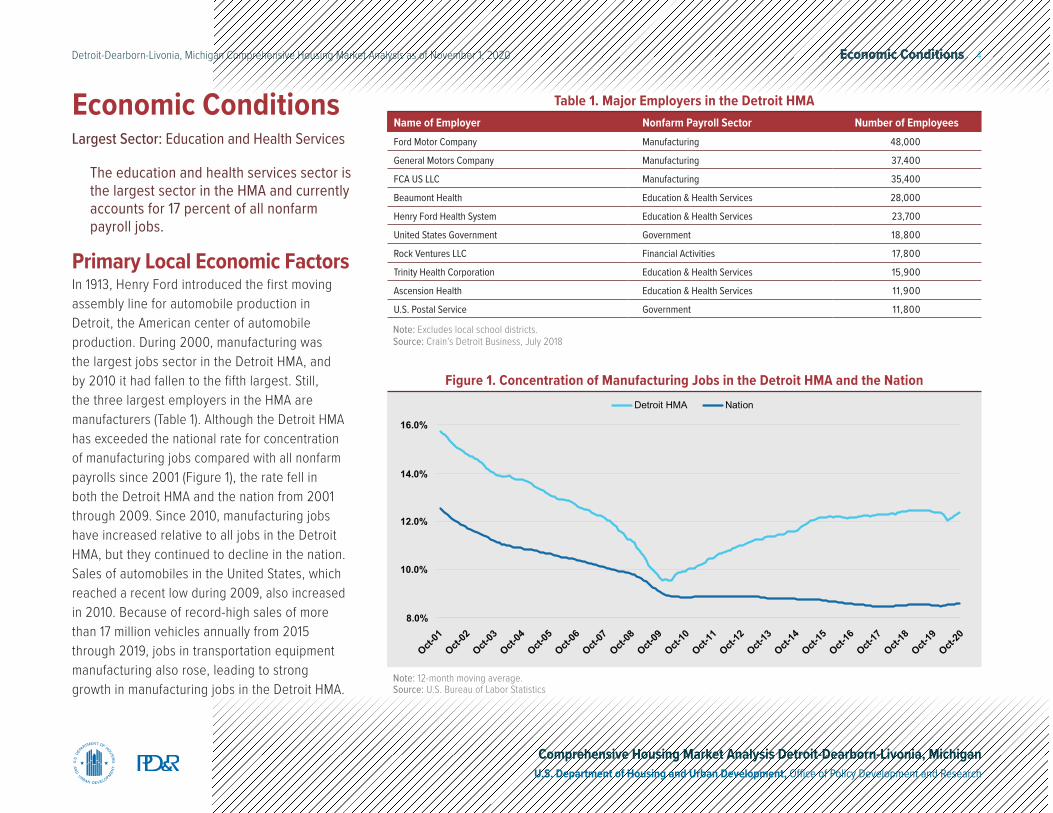
Primary Local Economic FactorsIn 1913, Henry Ford introduced the first moving assembly line for automobile production in Detroit, the American center of automobile production. During 2000, manufacturing was the largest jobs sector in the Detroit HMA, and by 2010 it had fallen to the fifth largest. Still, the three largest employers in the HMA are manufacturers (Table 1). Although the Detroit HMA has exceeded the national rate for concentration of manufacturing jobs compared with all nonfarm payrolls since 2001 (Figure 1), the rate fell in both the Detroit HMA and the nation from 2001 through 2009. Since 2010, manufacturing jobs have increased relative to all jobs in the Detroit HMA, but they continued to decline in the nation. Sales of automobiles in the United States, which reached a recent low during 2009, also increased in 2010. Because of record-high sales of more than 17 million vehicles annually from 2015 through 2019, jobs in transportation equipment manufacturing also rose, leading to strong growth in manufacturing jobs in the Detroit HMA.
Economic ConditionsLargest Sector: Education and Health Services
The education and health services sector is the largest sector in the HMA and currently accounts for 17 percent of all nonfarm payroll jobs.
Name of Employer Nonfarm Payroll Sector Number of EmployeesFord Motor Company Manufacturing 48,000
General Motors Company Manufacturing 37,400
FCA US LLC Manufacturing 35,400
Beaumont Health Education & Health Services 28,000
Henry Ford Health System Education & Health Services 23,700
United States Government Government 18,800
Rock Ventures LLC Financial Activities 17,800
Trinity Health Corporation Education & Health Services 15,900
Ascension Health Education & Health Services 11,900
U.S. Postal Service Government 11,800
Table 1. Major Employers in the Detroit HMA
Note: Excludes local school districts.Source: Crain’s Detroit Business, July 2018
Detroit HMA Nation
8.0%
10.0%
12.0%
14.0%
16.0%
Oct-01
Oct-02
Oct-03
Oct-04
Oct-05
Oct-06
Oct-07
Oct-08
Oct-09
Oct-10
Oct-11
Oct-12
Oct-13
Oct-14
Oct-15
Oct-16
Oct-17
Oct-18
Oct-19
Oct-20
Note: 12-month moving average.Source: U.S. Bureau of Labor Statistics
Figure 1. Concentration of Manufacturing Jobs in the Detroit HMA and the Nation
Economic Conditions 5Detroit-Dearborn-Livonia, Michigan Comprehensive Housing Market Analysis as of November 1, 2020
Comprehensive Housing Market Analysis Detroit-Dearborn-Livonia, MichiganU.S. Department of Housing and Urban Development, Office of Policy Development and Research
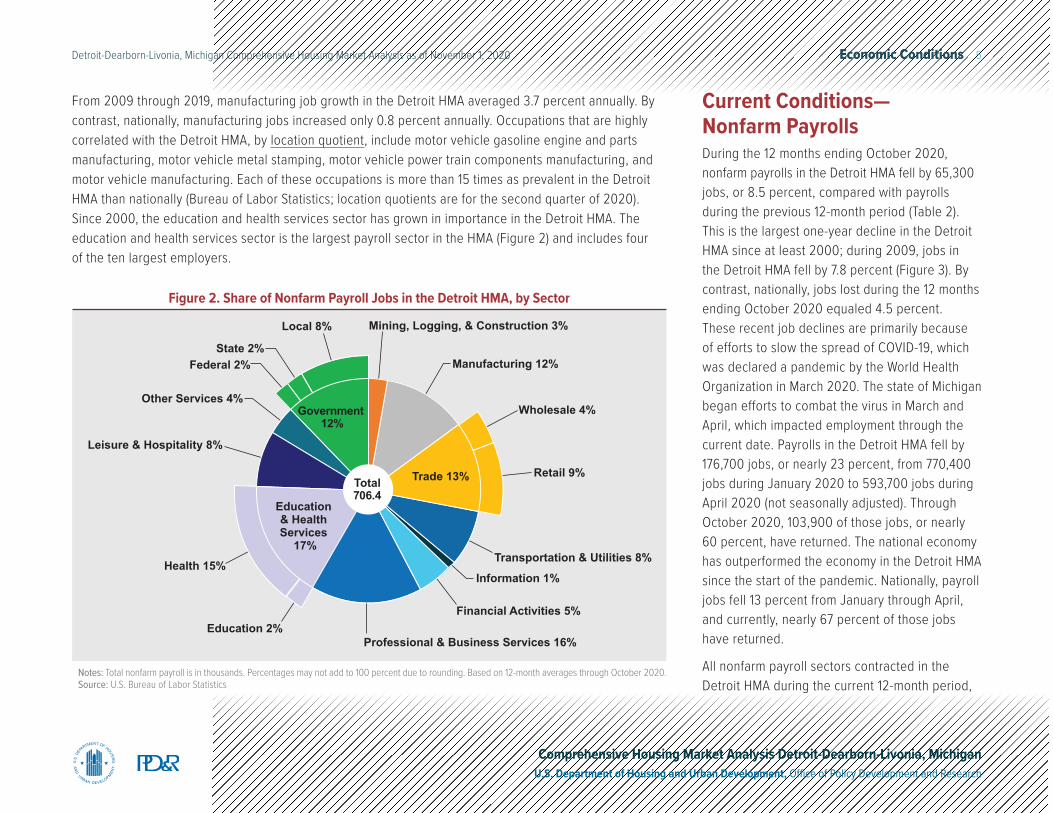
From 2009 through 2019, manufacturing job growth in the Detroit HMA averaged 3.7 percent annually. By contrast, nationally, manufacturing jobs increased only 0.8 percent annually. Occupations that are highly correlated with the Detroit HMA, by location quotient, include motor vehicle gasoline engine and parts manufacturing, motor vehicle metal stamping, motor vehicle power train components manufacturing, and motor vehicle manufacturing. Each of these occupations is more than 15 times as prevalent in the Detroit HMA than nationally (Bureau of Labor Statistics; location quotients are for the second quarter of 2020). Since 2000, the education and health services sector has grown in importance in the Detroit HMA. The education and health services sector is the largest payroll sector in the HMA (Figure 2) and includes four of the ten largest employers.
Mining, Logging, & Construction 3%
Manufacturing 12%
Wholesale 4%
Retail 9%
Transportation & Utilities 8%Information 1%
Financial Activities 5%
Professional & Business Services 16%
Leisure & Hospitality 8%
Other Services 4%
Federal 2%State 2%
Local 8%
Education & Health Services
17%Health 15%
Education 2%
Government 12%
Trade 13%Total706.4
Notes: Total nonfarm payroll is in thousands. Percentages may not add to 100 percent due to rounding. Based on 12-month averages through October 2020.Source: U.S. Bureau of Labor Statistics
Figure 2. Share of Nonfarm Payroll Jobs in the Detroit HMA, by Sector
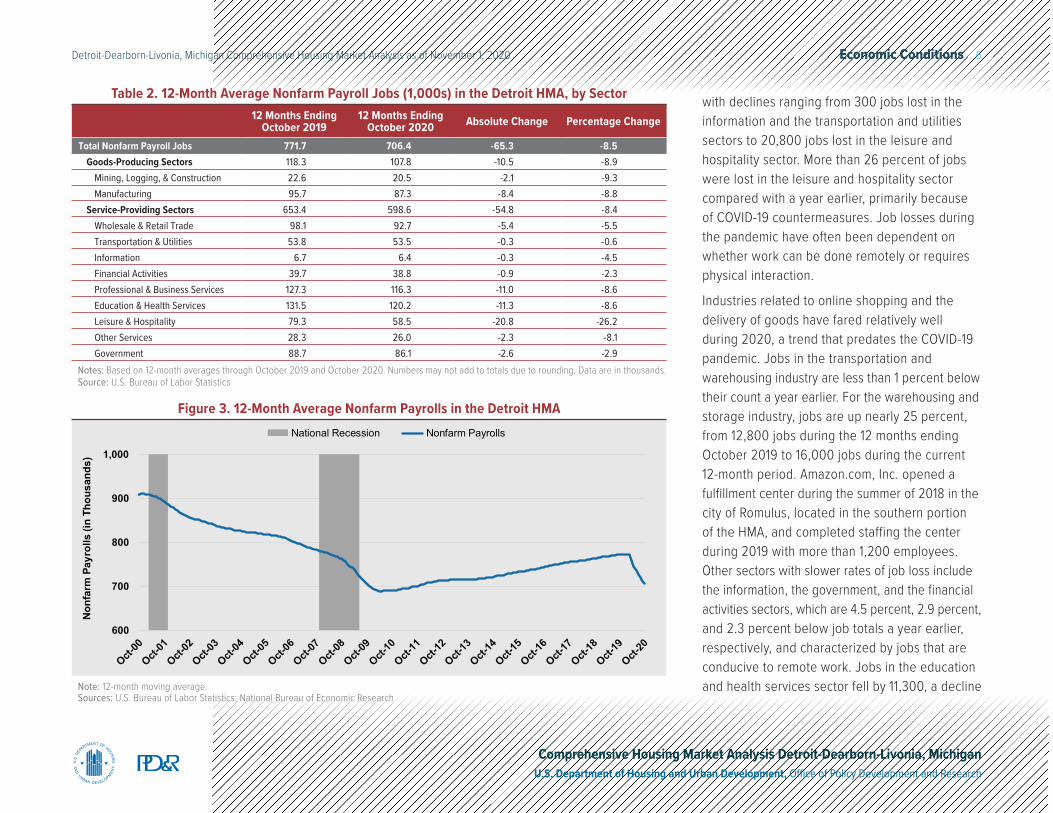
Current Conditions— Nonfarm PayrollsDuring the 12 months ending October 2020, nonfarm payrolls in the Detroit HMA fell by 65,300 jobs, or 8.5 percent, compared with payrolls during the previous 12-month period (Table 2). This is the largest one-year decline in the Detroit HMA since at least 2000; during 2009, jobs in the Detroit HMA fell by 7.8 percent (Figure 3). By contrast, nationally, jobs lost during the 12 months ending October 2020 equaled 4.5 percent. These recent job declines are primarily because of efforts to slow the spread of COVID-19, which was declared a pandemic by the World Health Organization in March 2020. The state of Michigan began efforts to combat the virus in March and April, which impacted employment through the current date. Payrolls in the Detroit HMA fell by 176,700 jobs, or nearly 23 percent, from 770,400 jobs during January 2020 to 593,700 jobs during April 2020 (not seasonally adjusted). Through October 2020, 103,900 of those jobs, or nearly 60 percent, have returned. The national economy has outperformed the economy in the Detroit HMA since the start of the pandemic. Nationally, payroll jobs fell 13 percent from January through April, and currently, nearly 67 percent of those jobs have returned.
All nonfarm payroll sectors contracted in the Detroit HMA during the current 12-month period,
Economic Conditions 6Detroit-Dearborn-Livonia, Michigan Comprehensive Housing Market Analysis as of November 1, 2020
Comprehensive Housing Market Analysis Detroit-Dearborn-Livonia, MichiganU.S. Department of Housing and Urban Development, Office of Policy Development and Research
with declines ranging from 300 jobs lost in the information and the transportation and utilities sectors to 20,800 jobs lost in the leisure and hospitality sector. More than 26 percent of jobs were lost in the leisure and hospitality sector compared with a year earlier, primarily because of COVID-19 countermeasures. Job losses during the pandemic have often been dependent on whether work can be done remotely or requires physical interaction.
Industries related to online shopping and the delivery of goods have fared relatively well during 2020, a trend that predates the COVID-19 pandemic. Jobs in the transportation and warehousing industry are less than 1 percent below their count a year earlier. For the warehousing and storage industry, jobs are up nearly 25 percent, from 12,800 jobs during the 12 months ending October 2019 to 16,000 jobs during the current 12-month period. Amazon.com, Inc. opened a fulfillment center during the summer of 2018 in the city of Romulus, located in the southern portion of the HMA, and completed staffing the center during 2019 with more than 1,200 employees. Other sectors with slower rates of job loss include the information, the government, and the financial activities sectors, which are 4.5 percent, 2.9 percent, and 2.3 percent below job totals a year earlier, respectively, and characterized by jobs that are conducive to remote work. Jobs in the education and health services sector fell by 11,300, a decline Note: 12-month moving average.
Sources: U.S. Bureau of Labor Statistics; National Bureau of Economic Research
Figure 3. 12-Month Average Nonfarm Payrolls in the Detroit HMA
Table 2. 12-Month Average Nonfarm Payroll Jobs (1,000s) in the Detroit HMA, by Sector12 Months Ending
October 201912 Months Ending
October 2020 Absolute Change Percentage Change
Total Nonfarm Payroll Jobs 771.7 706.4 -65.3 -8.5Goods-Producing Sectors 118.3 107.8 -10.5 -8.9
Mining, Logging, & Construction 22.6 20.5 -2.1 -9.3Manufacturing 95.7 87.3 -8.4 -8.8
Service-Providing Sectors 653.4 598.6 -54.8 -8.4Wholesale & Retail Trade 98.1 92.7 -5.4 -5.5Transportation & Utilities 53.8 53.5 -0.3 -0.6Information 6.7 6.4 -0.3 -4.5Financial Activities 39.7 38.8 -0.9 -2.3Professional & Business Services 127.3 116.3 -11.0 -8.6Education & Health Services 131.5 120.2 -11.3 -8.6Leisure & Hospitality 79.3 58.5 -20.8 -26.2Other Services 28.3 26.0 -2.3 -8.1Government 88.7 86.1 -2.6 -2.9
Notes: Based on 12-month averages through October 2019 and October 2020. Numbers may not add to totals due to rounding. Data are in thousands.Source: U.S. Bureau of Labor Statistics
National Recession Nonfarm Payrolls
600
700
800
900
1,000
Oct-00
Oct-01
Oct-02
Oct-03
Oct-04
Oct-05
Oct-06
Oct-07
Oct-08
Oct-09
Oct-10
Oct-11
Oct-12
Oct-13
Oct-14
Oct-15
Oct-16
Oct-17
Oct-18
Oct-19
Oct-20
Nonf
arm
Pay
rolls
(in
Thou
sand
s)
Economic Conditions 7Detroit-Dearborn-Livonia, Michigan Comprehensive Housing Market Analysis as of November 1, 2020
Comprehensive Housing Market Analysis Detroit-Dearborn-Livonia, MichiganU.S. Department of Housing and Urban Development, Office of Policy Development and Research
of nearly 9 percent—the second largest sector job loss after the leisure and hospitality sector. This job loss is due, in part, to elective medical procedures being reduced in number or stopped completely to reserve resources for COVID-19 patients, which has caused a loss of revenue for some health care providers. More than 225 jobs were eliminated at Beaumont Health during 2020, and several hundred jobs were eliminated at the Detroit Medical Center, contributing to the decline in jobs in this sector. In addition to recent COVID-19-related impacts, the healthcare industry is also responding to a declining population; the Detroit Medical Center has eliminated more than 2,000 positions during the past 6 years.
Economic Programs in Response to COVID-19In response to the COVID-19 pandemic, several programs designed to mitigate economic disruptions and assist businesses in the HMA were created in 2020 utilizing federal Coronavirus Aid, Relief, and Economic Security (CARES) Act funding. The Michigan Small Business Restart Program, enacted in July 2020 and administered by the Michigan Economic Development Corporation, is allocating $100 million in CARES Act funding throughout Michigan. Through November 5, 2020, grants in the HMA totaling approximately $14.2 million were awarded to 1,375 small businesses, resulting
in nearly 10,550 jobs being retained. The Wayne County Nonprofit Relief Fund is targeted at nonprofit organizations and awards one-time grants of up to $25,000. The application window for this program will run through November 9, 2020, with the grants award process underway. In addition, the Small Business Grant Program makes grants to eligible small businesses with fewer than 50 full-time employees. Grants of up to $20,000 are currently being processed, and $57.5 million has been allocated to this program for distribution statewide.
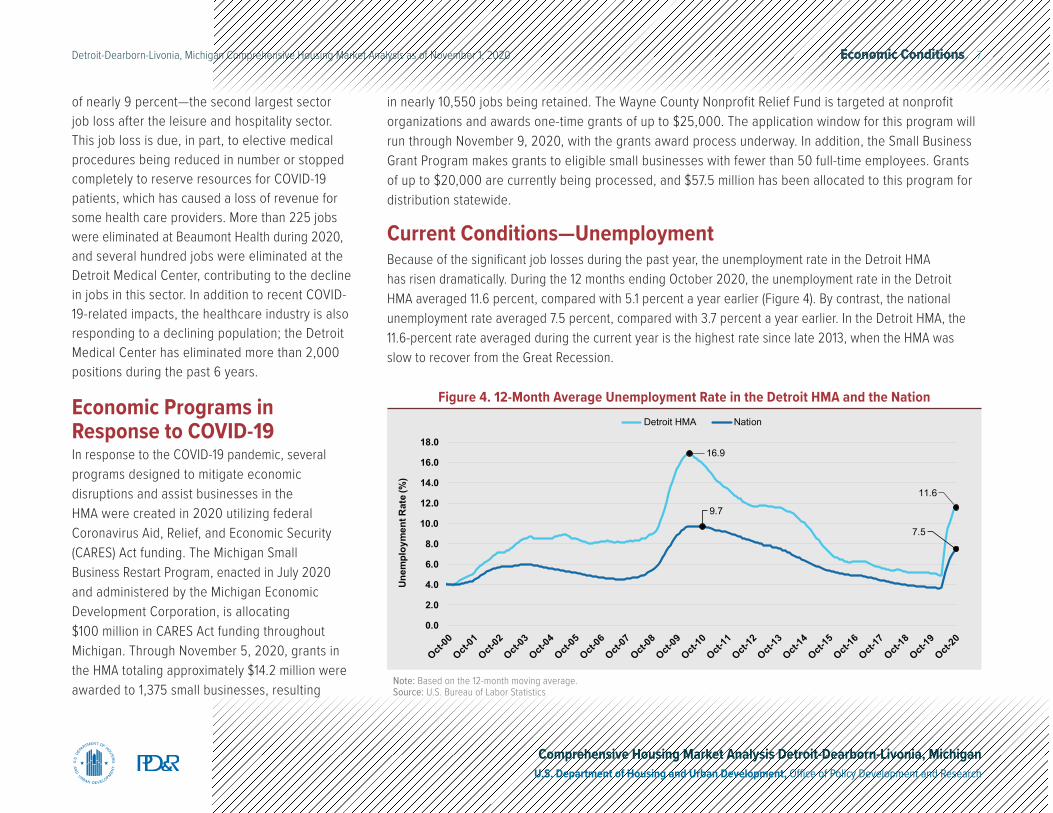
Current Conditions—UnemploymentBecause of the significant job losses during the past year, the unemployment rate in the Detroit HMA has risen dramatically. During the 12 months ending October 2020, the unemployment rate in the Detroit HMA averaged 11.6 percent, compared with 5.1 percent a year earlier (Figure 4). By contrast, the national unemployment rate averaged 7.5 percent, compared with 3.7 percent a year earlier. In the Detroit HMA, the 11.6-percent rate averaged during the current year is the highest rate since late 2013, when the HMA was slow to recover from the Great Recession.
Detroit HMA Nation
16.9
11.6
9.7
7.5
0.0
2.0
4.0
6.0
8.0
10.0
12.0
14.0
16.0
18.0
Oct-00
Oct-01
Oct-02
Oct-03
Oct-04
Oct-05
Oct-06
Oct-07
Oct-08
Oct-09
Oct-10
Oct-11
Oct-12
Oct-13
Oct-14
Oct-15
Oct-16
Oct-17
Oct-18
Oct-19
Oct-20
Unem
ploy
men
t Rat
e (%
)
Note: Based on the 12-month moving average.Source: U.S. Bureau of Labor Statistics
Figure 4. 12-Month Average Unemployment Rate in the Detroit HMA and the Nation
Economic Conditions 8Detroit-Dearborn-Livonia, Michigan Comprehensive Housing Market Analysis as of November 1, 2020
Comprehensive Housing Market Analysis Detroit-Dearborn-Livonia, MichiganU.S. Department of Housing and Urban Development, Office of Policy Development and Research
2001 through 2010Nonfarm payrolls declined during each year from 2001 through 2010 in the Detroit HMA, falling by an average of 21,900 jobs, or 2.7 percent, annually. Nationally, by contrast, payrolls fell an average of 0.1 percent annually during the decade; modest declines in jobs during 2002, 2003, 2008, and 2010, along with a larger loss during 2009, offset job growth during the other years of the decade. By 2010, nearly one-quarter of the jobs in the Detroit HMA during 2000 had been lost. Job losses were most significant in the goods-producing sectors; manufacturing jobs declined by 8,100 each year, equal to 7.4-percent annual declines, while the mining, logging, and construction sector fell 5.2 percent, a loss of 1,300 jobs annually. Among the service-providing sectors, the wholesale and retail trade sector and the professional and business services sector led declines, falling by 3,700 and 3,100 jobs annually, or 3.2 and 2.6 percent, respectively. The government sector also declined, falling by 1,900 jobs, or 1.7 percent annually, primarily because local governments decreased by 1,600 jobs annually. Local governments throughout the HMA, such as townships, cities, and counties, which typically rely on property taxes for operations, were severely impacted by the housing crisis of the late 2000s.
Economic Periods of Significance
2011 through 2013The economy in the Detroit HMA began to recover during 2011. From 2011 through 2013, nonfarm payrolls increased by an average of 8,300 jobs annually, or 1.2 percent, compared with 1.5-percent average annual growth nationally. In the HMA, job gains were led by the professional and business services sector, which rose by 4,200 jobs annually, or 3.8 percent on average. The manufacturing sector increased an average of 4,100 jobs annually or 5.5 percent growth. More than 80 percent of the manufacturing jobs added were in the transportation equipment manufacturing industry because automobile production started to recover following the Great Recession. Continued declines in government sector jobs totaled 4,700 jobs lost annually, on average, or 4.8 percent; government sector jobs were lost primarily at the local government level, but state and federal jobs also fell during this time.
2014 through 2016From 2014 through 2016, job growth, and the rate of job growth, in the Detroit HMA reached a recent peak when nonfarm payroll jobs rose by 9,800 annually, or 1.4 percent growth on average, but below the 1.9-percent rate of increase nationally. During this period, the manufacturing sector was the fastest growing sector in the Detroit HMA, adding 3,100 jobs annually on average, or 3.6 percent annual growth; 68 percent of manufacturing sector jobs added were in transportation equipment manufacturing. All nonfarm payroll sectors except the other services and the government sectors added jobs. The government sector fell by an average of 900 jobs annually because a slight increase in state government jobs was more than offset by continued job losses in local governments.
2017 through 2019Job growth slowed in the Detroit HMA from 2017 through 2019 to an average of 8,700 jobs, or 1.1 percent, annually, and reached 772,400 jobs during 2019, or 85 percent of the total averaged during 2000. By contrast, nationally, jobs increased an average of 1.5 percent, also moderating from the previous period. In the Detroit HMA, job growth was led by the transportation and utilities sector, which increased by an average of 4,300 jobs, or 9.4 percent annually, because of increased online shopping. As consumers shifted to more online shopping and away from brick-and-mortar stores, the wholesale and retail trade sector fell by an average of 500 jobs, or 0.5 percent annually. The manufacturing sector added the second-highest number of jobs, increasing by an average of 1,600 jobs, or 1.7 percent annually. Despite
Economic Conditions 9Detroit-Dearborn-Livonia, Michigan Comprehensive Housing Market Analysis as of November 1, 2020
Comprehensive Housing Market Analysis Detroit-Dearborn-Livonia, MichiganU.S. Department of Housing and Urban Development, Office of Policy Development and Research
9 years of increases, the 95,600 manufacturing jobs averaged during 2019 represented only 64 percent of the manufacturing jobs in the HMA averaged during 2000. The government sector reversed the declines from the previous 6 years and expanded by an average of 1,400 jobs annually, or 1.6 percent annual growth, primarily from increased jobs in local governments, which
added an average of 1,100 jobs annually. In addition to the wholesale and retail trade sector, two other sectors lost jobs during the period. The information sector lost jobs at an average annual rate of 400 jobs, or 5.7 percent, and the other services sector lost jobs at an average annual rate of 200 jobs, or 0.7 percent.
Employment ForecastDuring the 3-year forecast period, the economy of the HMA is expected to recover most of the recent job losses. However, jobs at the end of the 3-year forecast period are expected to be slightly below the 772,400 jobs averaged during 2019. Work is underway at the site of the former Michigan State fairgrounds, in the northwest part of the city of Detroit, where Amazon.com, Inc. is developing its
largest facility in the state of Michigan, with an estimated development cost of more than $400 million. Scheduled for completion during 2022, total jobs are expected to exceed 2,000 at the new Amazon.com, Inc. site. Fiat-Chrysler is in the process of hiring nearly 5,000 new workers at three production plants in the city of Detroit, with an estimated 2,000 hires when completed and 3,000 more jobs expected to be filled thereafter.
Population and Households 10Detroit-Dearborn-Livonia, Michigan Comprehensive Housing Market Analysis as of November 1, 2020
Comprehensive Housing Market Analysis Detroit-Dearborn-Livonia, MichiganU.S. Department of Housing and Urban Development, Office of Policy Development and Research
Population and HouseholdsCurrent Population: 1.74 million
Because of improved economic conditions in the Detroit HMA during the 2010s, net out-migration has slowed significantly, resulting in relatively lower rates of population loss.
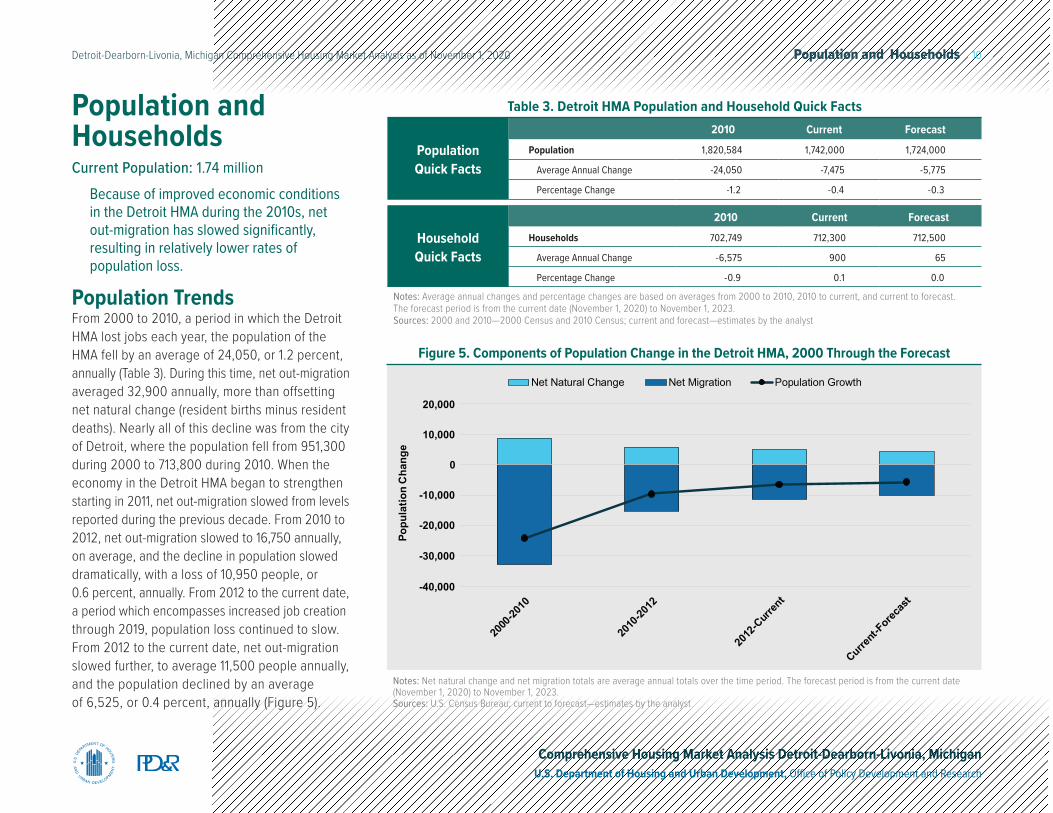
Population TrendsFrom 2000 to 2010, a period in which the Detroit HMA lost jobs each year, the population of the HMA fell by an average of 24,050, or 1.2 percent, annually (Table 3). During this time, net out-migration averaged 32,900 annually, more than offsetting net natural change (resident births minus resident deaths). Nearly all of this decline was from the city of Detroit, where the population fell from 951,300 during 2000 to 713,800 during 2010. When the economy in the Detroit HMA began to strengthen starting in 2011, net out-migration slowed from levels reported during the previous decade. From 2010 to 2012, net out-migration slowed to 16,750 annually, on average, and the decline in population slowed dramatically, with a loss of 10,950 people, or 0.6 percent, annually. From 2012 to the current date, a period which encompasses increased job creation through 2019, population loss continued to slow. From 2012 to the current date, net out-migration slowed further, to average 11,500 people annually, and the population declined by an average of 6,525, or 0.4 percent, annually (Figure 5).
Notes: Net natural change and net migration totals are average annual totals over the time period. The forecast period is from the current date (November 1, 2020) to November 1, 2023.Sources: U.S. Census Bureau; current to forecast—estimates by the analyst
-40,000
-30,000
-20,000
-10,000
0
10,000
20,000
2000
-2010
2010
-2012
2012
-Curr
ent
Current-
Forecas
t
Popu
latio
n C
hang
e
Net Natural Change Net Migration Population Growth
Figure 5. Components of Population Change in the Detroit HMA, 2000 Through the Forecast
Population Quick Facts
2010 Current Forecast
Population 1,820,584 1,742,000 1,724,000
Average Annual Change -24,050 -7,475 -5,775
Percentage Change -1.2 -0.4 -0.3
Household Quick Facts
2010 Current Forecast
Households 702,749 712,300 712,500
Average Annual Change -6,575 900 65
Percentage Change -0.9 0.1 0.0
Notes: Average annual changes and percentage changes are based on averages from 2000 to 2010, 2010 to current, and current to forecast. The forecast period is from the current date (November 1, 2020) to November 1, 2023.Sources: 2000 and 2010—2000 Census and 2010 Census; current and forecast—estimates by the analyst
Table 3. Detroit HMA Population and Household Quick Facts
Population and Households 11Detroit-Dearborn-Livonia, Michigan Comprehensive Housing Market Analysis as of November 1, 2020
Comprehensive Housing Market Analysis Detroit-Dearborn-Livonia, MichiganU.S. Department of Housing and Urban Development, Office of Policy Development and Research
Despite the decline in net out-migration from the Detroit HMA, economic conditions have generally been stronger nationally than in Detroit since 2000. The stronger employment prospects elsewhere have kept people moving out of the HMA.
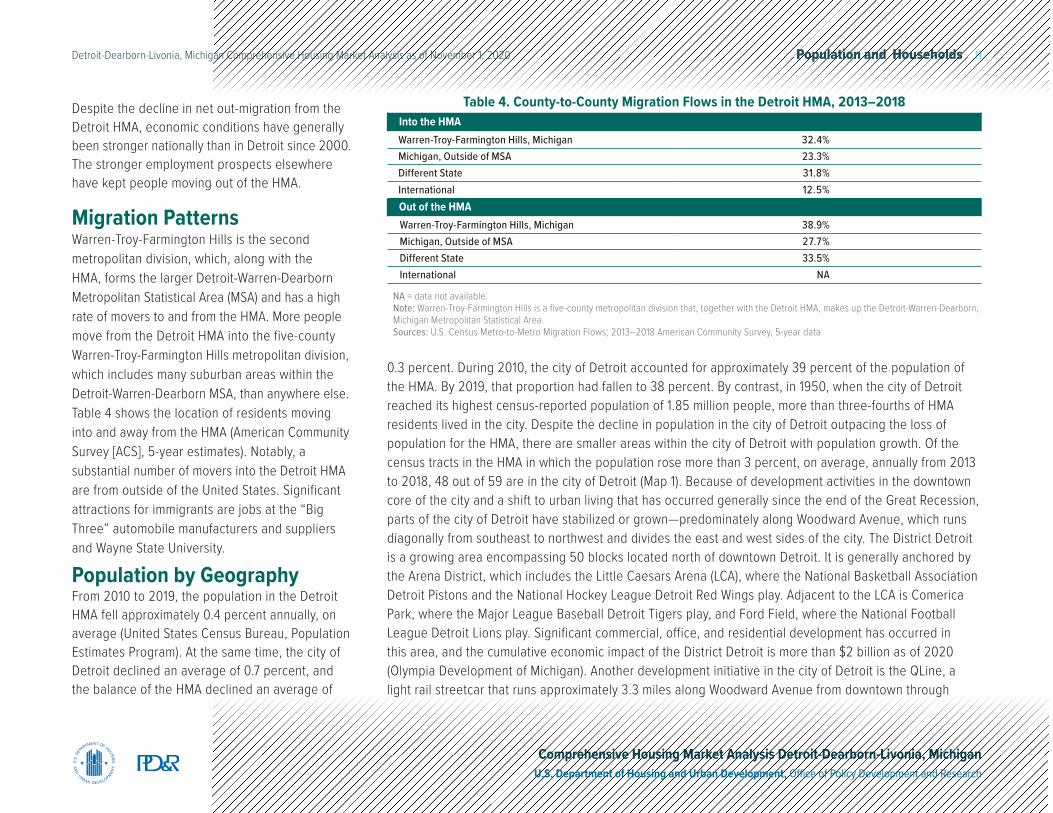
Migration PatternsWarren-Troy-Farmington Hills is the second metropolitan division, which, along with the HMA, forms the larger Detroit-Warren-Dearborn Metropolitan Statistical Area (MSA) and has a high rate of movers to and from the HMA. More people move from the Detroit HMA into the five-county Warren-Troy-Farmington Hills metropolitan division, which includes many suburban areas within the Detroit-Warren-Dearborn MSA, than anywhere else. Table 4 shows the location of residents moving into and away from the HMA (American Community Survey [ACS], 5-year estimates). Notably, a substantial number of movers into the Detroit HMA are from outside of the United States. Significant attractions for immigrants are jobs at the “Big Three” automobile manufacturers and suppliers and Wayne State University.
Population by GeographyFrom 2010 to 2019, the population in the Detroit HMA fell approximately 0.4 percent annually, on average (United States Census Bureau, Population Estimates Program). At the same time, the city of Detroit declined an average of 0.7 percent, and the balance of the HMA declined an average of
Into the HMAWarren-Troy-Farmington Hills, Michigan 32.4%Michigan, Outside of MSA 23.3%Different State 31.8%International 12.5%Out of the HMAWarren-Troy-Farmington Hills, Michigan 38.9%Michigan, Outside of MSA 27.7%Different State 33.5%International NA
Table 4. County-to-County Migration Flows in the Detroit HMA, 2013–2018
NA = data not available. Note: Warren-Troy-Farmington Hills is a five-county metropolitan division that, together with the Detroit HMA, makes up the Detroit-Warren-Dearborn, Michigan Metropolitan Statistical Area.Sources: U.S. Census Metro-to-Metro Migration Flows; 2013–2018 American Community Survey, 5-year data
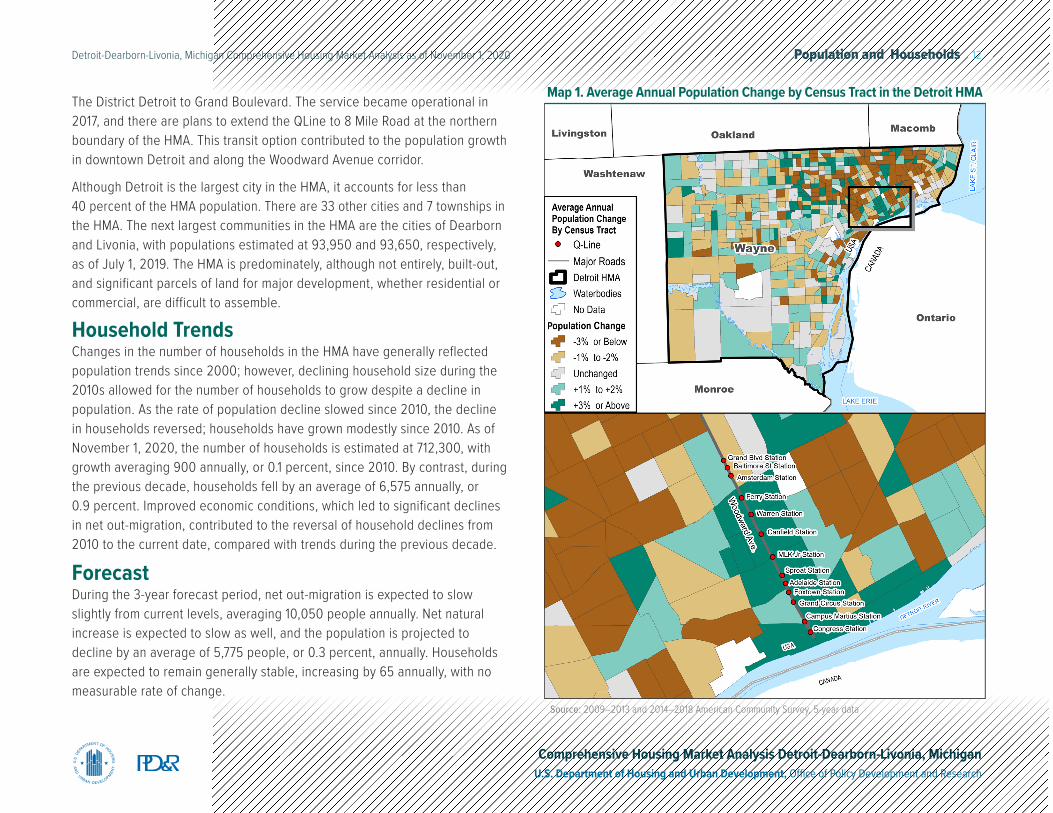
0.3 percent. During 2010, the city of Detroit accounted for approximately 39 percent of the population of the HMA. By 2019, that proportion had fallen to 38 percent. By contrast, in 1950, when the city of Detroit reached its highest census-reported population of 1.85 million people, more than three-fourths of HMA residents lived in the city. Despite the decline in population in the city of Detroit outpacing the loss of population for the HMA, there are smaller areas within the city of Detroit with population growth. Of the census tracts in the HMA in which the population rose more than 3 percent, on average, annually from 2013 to 2018, 48 out of 59 are in the city of Detroit (Map 1). Because of development activities in the downtown core of the city and a shift to urban living that has occurred generally since the end of the Great Recession, parts of the city of Detroit have stabilized or grown—predominately along Woodward Avenue, which runs diagonally from southeast to northwest and divides the east and west sides of the city. The District Detroit is a growing area encompassing 50 blocks located north of downtown Detroit. It is generally anchored by the Arena District, which includes the Little Caesars Arena (LCA), where the National Basketball Association Detroit Pistons and the National Hockey League Detroit Red Wings play. Adjacent to the LCA is Comerica Park, where the Major League Baseball Detroit Tigers play, and Ford Field, where the National Football League Detroit Lions play. Significant commercial, office, and residential development has occurred in this area, and the cumulative economic impact of the District Detroit is more than $2 billion as of 2020 (Olympia Development of Michigan). Another development initiative in the city of Detroit is the QLine, a light rail streetcar that runs approximately 3.3 miles along Woodward Avenue from downtown through
Population and Households 12Detroit-Dearborn-Livonia, Michigan Comprehensive Housing Market Analysis as of November 1, 2020
Comprehensive Housing Market Analysis Detroit-Dearborn-Livonia, MichiganU.S. Department of Housing and Urban Development, Office of Policy Development and Research
The District Detroit to Grand Boulevard. The service became operational in 2017, and there are plans to extend the QLine to 8 Mile Road at the northern boundary of the HMA. This transit option contributed to the population growth in downtown Detroit and along the Woodward Avenue corridor.
Although Detroit is the largest city in the HMA, it accounts for less than 40 percent of the HMA population. There are 33 other cities and 7 townships in the HMA. The next largest communities in the HMA are the cities of Dearborn and Livonia, with populations estimated at 93,950 and 93,650, respectively, as of July 1, 2019. The HMA is predominately, although not entirely, built-out, and significant parcels of land for major development, whether residential or commercial, are difficult to assemble.
Household TrendsChanges in the number of households in the HMA have generally reflected population trends since 2000; however, declining household size during the 2010s allowed for the number of households to grow despite a decline in population. As the rate of population decline slowed since 2010, the decline in households reversed; households have grown modestly since 2010. As of November 1, 2020, the number of households is estimated at 712,300, with growth averaging 900 annually, or 0.1 percent, since 2010. By contrast, during the previous decade, households fell by an average of 6,575 annually, or 0.9 percent. Improved economic conditions, which led to significant declines in net out-migration, contributed to the reversal of household declines from 2010 to the current date, compared with trends during the previous decade.
ForecastDuring the 3-year forecast period, net out-migration is expected to slow slightly from current levels, averaging 10,050 people annually. Net natural increase is expected to slow as well, and the population is projected to decline by an average of 5,775 people, or 0.3 percent, annually. Households are expected to remain generally stable, increasing by 65 annually, with no measurable rate of change.
Source: 2009–2013 and 2014–2018 American Community Survey, 5-year data
Map 1. Average Annual Population Change by Census Tract in the Detroit HMA
Home Sales Market 13Detroit-Dearborn-Livonia, Michigan Comprehensive Housing Market Analysis as of November 1, 2020
Comprehensive Housing Market Analysis Detroit-Dearborn-Livonia, MichiganU.S. Department of Housing and Urban Development, Office of Policy Development and Research
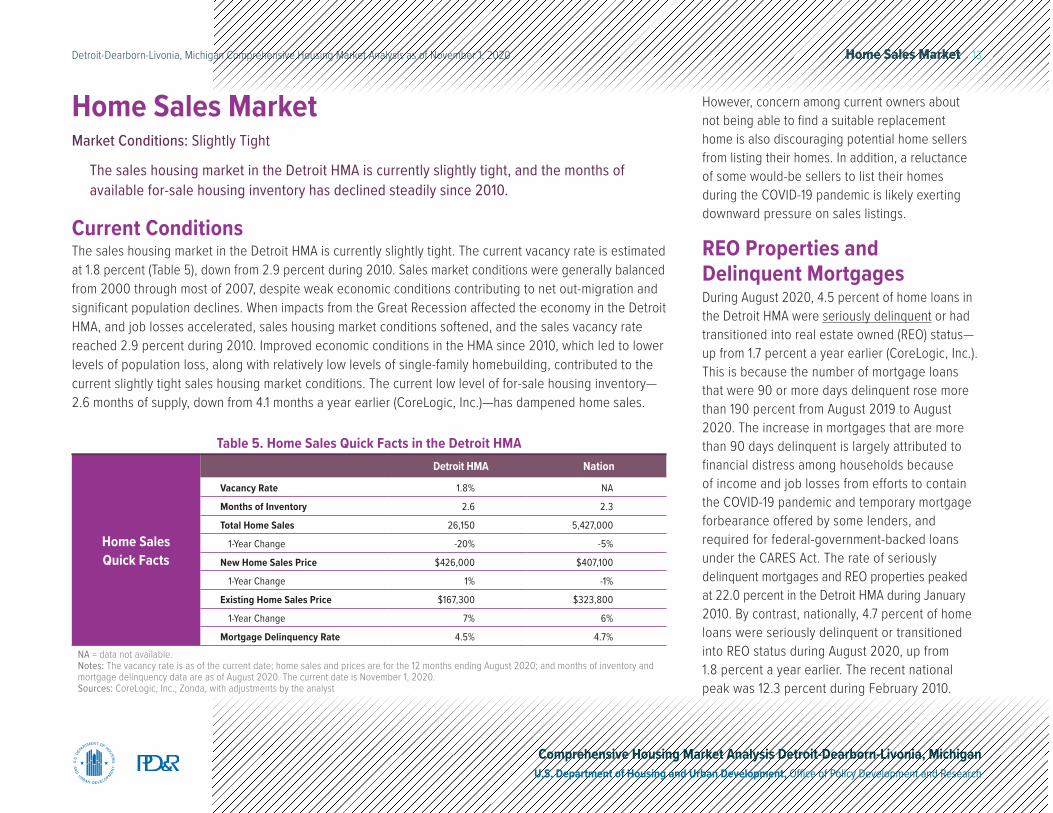
Current ConditionsThe sales housing market in the Detroit HMA is currently slightly tight. The current vacancy rate is estimated at 1.8 percent (Table 5), down from 2.9 percent during 2010. Sales market conditions were generally balanced from 2000 through most of 2007, despite weak economic conditions contributing to net out-migration and significant population declines. When impacts from the Great Recession affected the economy in the Detroit HMA, and job losses accelerated, sales housing market conditions softened, and the sales vacancy rate reached 2.9 percent during 2010. Improved economic conditions in the HMA since 2010, which led to lower levels of population loss, along with relatively low levels of single-family homebuilding, contributed to the current slightly tight sales housing market conditions. The current low level of for-sale housing inventory— 2.6 months of supply, down from 4.1 months a year earlier (CoreLogic, Inc.)—has dampened home sales.
Home Sales MarketMarket Conditions: Slightly Tight
The sales housing market in the Detroit HMA is currently slightly tight, and the months of available for-sale housing inventory has declined steadily since 2010.
Home Sales Quick Facts
Detroit HMA Nation
Vacancy Rate 1.8% NA
Months of Inventory 2.6 2.3
Total Home Sales 26,150 5,427,000
1-Year Change -20% -5%
New Home Sales Price $426,000 $407,100
1-Year Change 1% -1%
Existing Home Sales Price $167,300 $323,800
1-Year Change 7% 6%
Mortgage Delinquency Rate 4.5% 4.7%NA = data not available.Notes: The vacancy rate is as of the current date; home sales and prices are for the 12 months ending August 2020; and months of inventory and mortgage delinquency data are as of August 2020. The current date is November 1, 2020.Sources: CoreLogic, Inc.; Zonda, with adjustments by the analyst
Table 5. Home Sales Quick Facts in the Detroit HMA
However, concern among current owners about not being able to find a suitable replacement home is also discouraging potential home sellers from listing their homes. In addition, a reluctance of some would-be sellers to list their homes during the COVID-19 pandemic is likely exerting downward pressure on sales listings.
REO Properties and Delinquent MortgagesDuring August 2020, 4.5 percent of home loans in the Detroit HMA were seriously delinquent or had transitioned into real estate owned (REO) status—up from 1.7 percent a year earlier (CoreLogic, Inc.). This is because the number of mortgage loans that were 90 or more days delinquent rose more than 190 percent from August 2019 to August 2020. The increase in mortgages that are more than 90 days delinquent is largely attributed to financial distress among households because of income and job losses from efforts to contain the COVID-19 pandemic and temporary mortgage forbearance offered by some lenders, and required for federal-government-backed loans under the CARES Act. The rate of seriously delinquent mortgages and REO properties peaked at 22.0 percent in the Detroit HMA during January 2010. By contrast, nationally, 4.7 percent of home loans were seriously delinquent or transitioned into REO status during August 2020, up from 1.8 percent a year earlier. The recent national peak was 12.3 percent during February 2010.
Home Sales Market 14Detroit-Dearborn-Livonia, Michigan Comprehensive Housing Market Analysis as of November 1, 2020
Comprehensive Housing Market Analysis Detroit-Dearborn-Livonia, MichiganU.S. Department of Housing and Urban Development, Office of Policy Development and Research
Source: Zonda, with adjustments by the analyst
0
5,000
10,000
15,000
20,000
25,000
30,000
35,000
40,000
45,000
Aug-07
Aug-08
Aug-09
Aug-10
Aug-11
Aug-12
Aug-13
Aug-14
Aug-15
Aug-16
Aug-17
Aug-18
Aug-19
Aug-20
Sale
s To
tals
New Home Sales Regular Resale Home Sales Distressed Home Sales
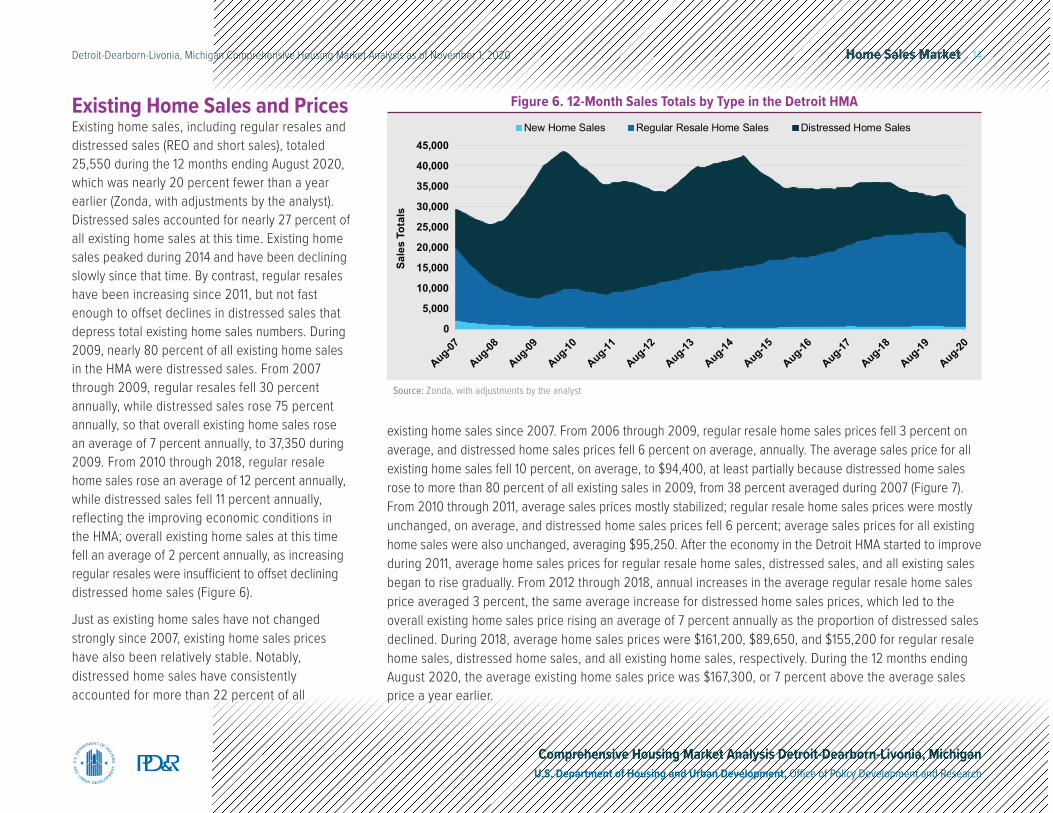
Figure 6. 12-Month Sales Totals by Type in the Detroit HMAExisting Home Sales and PricesExisting home sales, including regular resales and distressed sales (REO and short sales), totaled 25,550 during the 12 months ending August 2020, which was nearly 20 percent fewer than a year earlier (Zonda, with adjustments by the analyst). Distressed sales accounted for nearly 27 percent of all existing home sales at this time. Existing home sales peaked during 2014 and have been declining slowly since that time. By contrast, regular resales have been increasing since 2011, but not fast enough to offset declines in distressed sales that depress total existing home sales numbers. During 2009, nearly 80 percent of all existing home sales in the HMA were distressed sales. From 2007 through 2009, regular resales fell 30 percent annually, while distressed sales rose 75 percent annually, so that overall existing home sales rose an average of 7 percent annually, to 37,350 during 2009. From 2010 through 2018, regular resale home sales rose an average of 12 percent annually, while distressed sales fell 11 percent annually, reflecting the improving economic conditions in the HMA; overall existing home sales at this time fell an average of 2 percent annually, as increasing regular resales were insufficient to offset declining distressed home sales (Figure 6).
Just as existing home sales have not changed strongly since 2007, existing home sales prices have also been relatively stable. Notably, distressed home sales have consistently accounted for more than 22 percent of all
existing home sales since 2007. From 2006 through 2009, regular resale home sales prices fell 3 percent on average, and distressed home sales prices fell 6 percent on average, annually. The average sales price for all existing home sales fell 10 percent, on average, to $94,400, at least partially because distressed home sales rose to more than 80 percent of all existing sales in 2009, from 38 percent averaged during 2007 (Figure 7). From 2010 through 2011, average sales prices mostly stabilized; regular resale home sales prices were mostly unchanged, on average, and distressed home sales prices fell 6 percent; average sales prices for all existing home sales were also unchanged, averaging $95,250. After the economy in the Detroit HMA started to improve during 2011, average home sales prices for regular resale home sales, distressed sales, and all existing sales began to rise gradually. From 2012 through 2018, annual increases in the average regular resale home sales price averaged 3 percent, the same average increase for distressed home sales prices, which led to the overall existing home sales price rising an average of 7 percent annually as the proportion of distressed sales declined. During 2018, average home sales prices were $161,200, $89,650, and $155,200 for regular resale home sales, distressed home sales, and all existing home sales, respectively. During the 12 months ending August 2020, the average existing home sales price was $167,300, or 7 percent above the average sales price a year earlier.
Home Sales Market 15Detroit-Dearborn-Livonia, Michigan Comprehensive Housing Market Analysis as of November 1, 2020
Comprehensive Housing Market Analysis Detroit-Dearborn-Livonia, MichiganU.S. Department of Housing and Urban Development, Office of Policy Development and Research
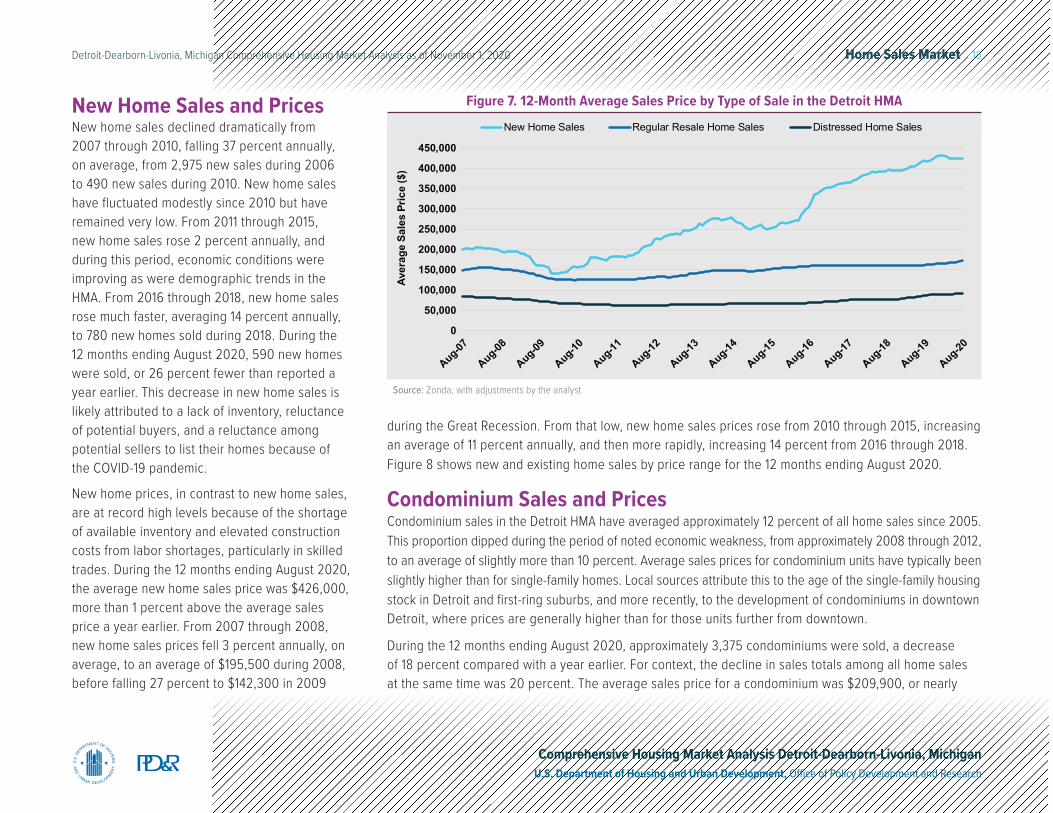
New Home Sales and PricesNew home sales declined dramatically from 2007 through 2010, falling 37 percent annually, on average, from 2,975 new sales during 2006 to 490 new sales during 2010. New home sales have fluctuated modestly since 2010 but have remained very low. From 2011 through 2015, new home sales rose 2 percent annually, and during this period, economic conditions were improving as were demographic trends in the HMA. From 2016 through 2018, new home sales rose much faster, averaging 14 percent annually, to 780 new homes sold during 2018. During the 12 months ending August 2020, 590 new homes were sold, or 26 percent fewer than reported a year earlier. This decrease in new home sales is likely attributed to a lack of inventory, reluctance of potential buyers, and a reluctance among potential sellers to list their homes because of the COVID-19 pandemic.
New home prices, in contrast to new home sales, are at record high levels because of the shortage of available inventory and elevated construction costs from labor shortages, particularly in skilled trades. During the 12 months ending August 2020, the average new home sales price was $426,000, more than 1 percent above the average sales price a year earlier. From 2007 through 2008, new home sales prices fell 3 percent annually, on average, to an average of $195,500 during 2008, before falling 27 percent to $142,300 in 2009
Source: Zonda, with adjustments by the analyst
0
50,000
100,000
150,000
200,000
250,000
300,000
350,000
400,000
450,000
Aug-07
Aug-08
Aug-09
Aug-10
Aug-11
Aug-12
Aug-13
Aug-14
Aug-15
Aug-16
Aug-17
Aug-18
Aug-19
Aug-20
Aver
age
Sale
s Pr
ice
($)
New Home Sales Regular Resale Home Sales Distressed Home Sales
Figure 7. 12-Month Average Sales Price by Type of Sale in the Detroit HMA
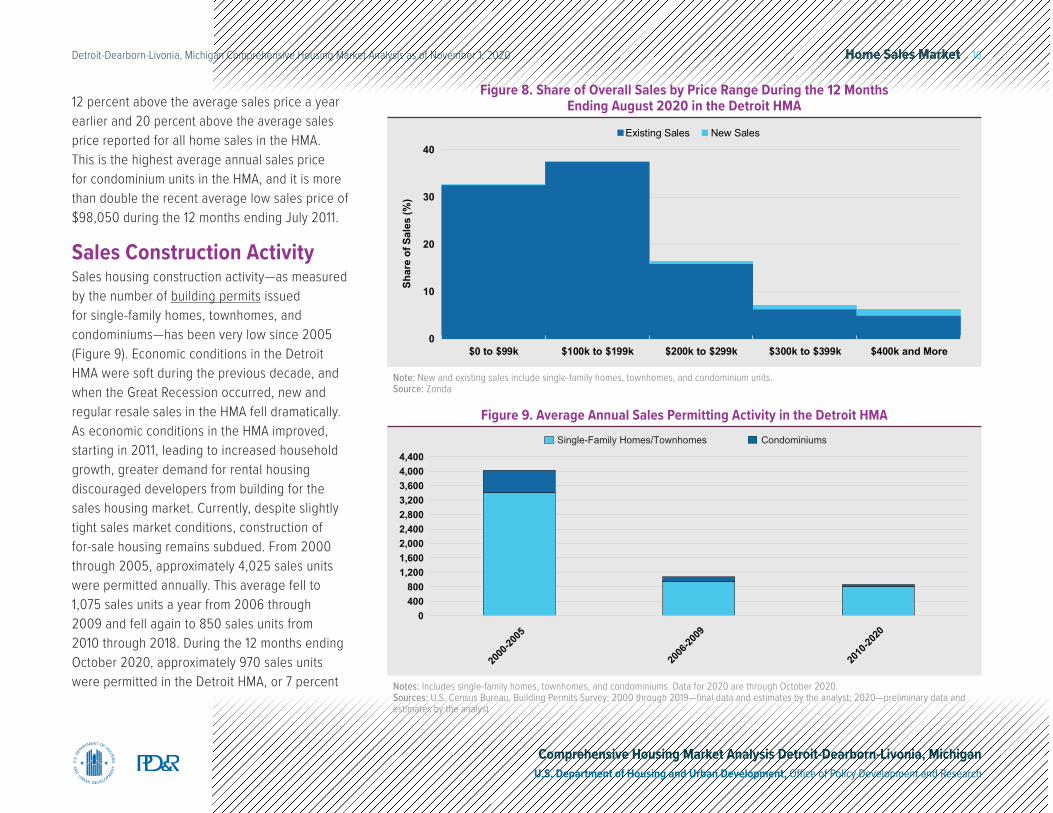
during the Great Recession. From that low, new home sales prices rose from 2010 through 2015, increasing an average of 11 percent annually, and then more rapidly, increasing 14 percent from 2016 through 2018. Figure 8 shows new and existing home sales by price range for the 12 months ending August 2020.
Condominium Sales and PricesCondominium sales in the Detroit HMA have averaged approximately 12 percent of all home sales since 2005. This proportion dipped during the period of noted economic weakness, from approximately 2008 through 2012, to an average of slightly more than 10 percent. Average sales prices for condominium units have typically been slightly higher than for single-family homes. Local sources attribute this to the age of the single-family housing stock in Detroit and first-ring suburbs, and more recently, to the development of condominiums in downtown Detroit, where prices are generally higher than for those units further from downtown.
During the 12 months ending August 2020, approximately 3,375 condominiums were sold, a decrease of 18 percent compared with a year earlier. For context, the decline in sales totals among all home sales at the same time was 20 percent. The average sales price for a condominium was $209,900, or nearly
Home Sales Market 16Detroit-Dearborn-Livonia, Michigan Comprehensive Housing Market Analysis as of November 1, 2020
Comprehensive Housing Market Analysis Detroit-Dearborn-Livonia, MichiganU.S. Department of Housing and Urban Development, Office of Policy Development and Research
Notes: Includes single-family homes, townhomes, and condominiums. Data for 2020 are through October 2020.Sources: U.S. Census Bureau, Building Permits Survey; 2000 through 2019—final data and estimates by the analyst; 2020—preliminary data and estimates by the analyst
CondominiumsSingle-Family Homes/Townhomes
0400800
1,2001,6002,0002,4002,8003,2003,6004,0004,400
2000
-2005
2006
-2009
2010
-2020
Figure 9. Average Annual Sales Permitting Activity in the Detroit HMA
12 percent above the average sales price a year earlier and 20 percent above the average sales price reported for all home sales in the HMA. This is the highest average annual sales price for condominium units in the HMA, and it is more than double the recent average low sales price of $98,050 during the 12 months ending July 2011.
Sales Construction ActivitySales housing construction activity—as measured by the number of building permits issued for single-family homes, townhomes, and condominiums—has been very low since 2005 (Figure 9). Economic conditions in the Detroit HMA were soft during the previous decade, and when the Great Recession occurred, new and regular resale sales in the HMA fell dramatically. As economic conditions in the HMA improved, starting in 2011, leading to increased household growth, greater demand for rental housing discouraged developers from building for the sales housing market. Currently, despite slightly tight sales market conditions, construction of for-sale housing remains subdued. From 2000 through 2005, approximately 4,025 sales units were permitted annually. This average fell to 1,075 sales units a year from 2006 through 2009 and fell again to 850 sales units from 2010 through 2018. During the 12 months ending October 2020, approximately 970 sales units were permitted in the Detroit HMA, or 7 percent
Note: New and existing sales include single-family homes, townhomes, and condominium units.Source: Zonda
0
10
20
30
40
$0 to $99k $100k to $199k $200k to $299k $300k to $399k $400k and More
Shar
e of
Sal
es (%
)
Existing Sales New Sales
Figure 8. Share of Overall Sales by Price Range During the 12 Months Ending August 2020 in the Detroit HMA
Home Sales Market 17Detroit-Dearborn-Livonia, Michigan Comprehensive Housing Market Analysis as of November 1, 2020
Comprehensive Housing Market Analysis Detroit-Dearborn-Livonia, MichiganU.S. Department of Housing and Urban Development, Office of Policy Development and Research
fewer than the 1,050 sales units permitted during the 12 months ending October 2019 (preliminary data, with estimates by the analyst).
New ConstructionIn the city of Detroit, in the Corktown neighborhood located southwest of downtown Detroit, the 10-unit Bagley 10 condominium property has three-bedroom, two-and-one-half bathroom units priced from $599,000 to $725,000. The property was completed during the summer of 2020, although sales have been slow, with only one unit sold as of November 2020. In the suburban city of Plymouth, in the northwest area of the Detroit HMA, the Townes at Mill Street is a new townhome development with 76 three-bedroom, three-bathroom townhomes priced from $338,990 to $418,900. Currently, nine townhomes have been sold, and construction continues on the remaining units, which are expected to be completed by spring 2021.
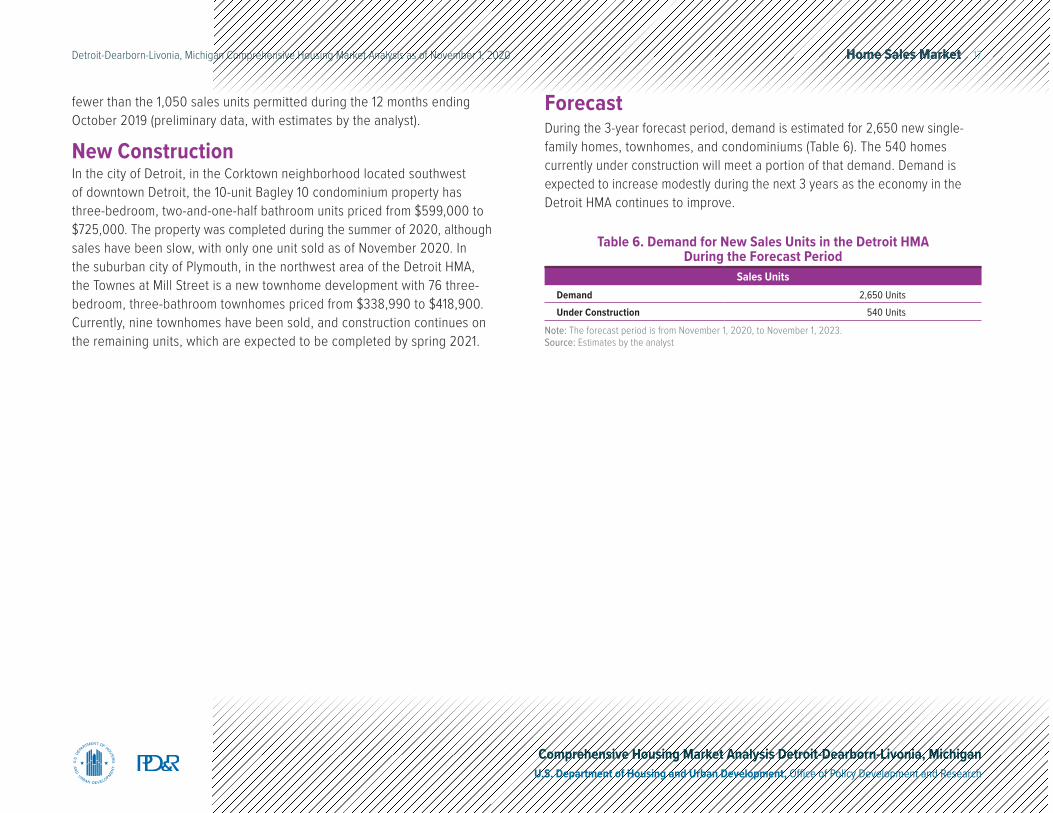
ForecastDuring the 3-year forecast period, demand is estimated for 2,650 new single-family homes, townhomes, and condominiums (Table 6). The 540 homes currently under construction will meet a portion of that demand. Demand is expected to increase modestly during the next 3 years as the economy in the Detroit HMA continues to improve.
Table 6. Demand for New Sales Units in the Detroit HMA During the Forecast Period
Sales UnitsDemand 2,650 UnitsUnder Construction 540 Units
Note: The forecast period is from November 1, 2020, to November 1, 2023.Source: Estimates by the analyst
Rental Market 18Detroit-Dearborn-Livonia, Michigan Comprehensive Housing Market Analysis as of November 1, 2020
Comprehensive Housing Market Analysis Detroit-Dearborn-Livonia, MichiganU.S. Department of Housing and Urban Development, Office of Policy Development and Research
Rental MarketMarket Conditions: Balanced
Growth in renter households since 2010, which far outpaced overall household growth, contributed to the current balanced conditions in the rental market.
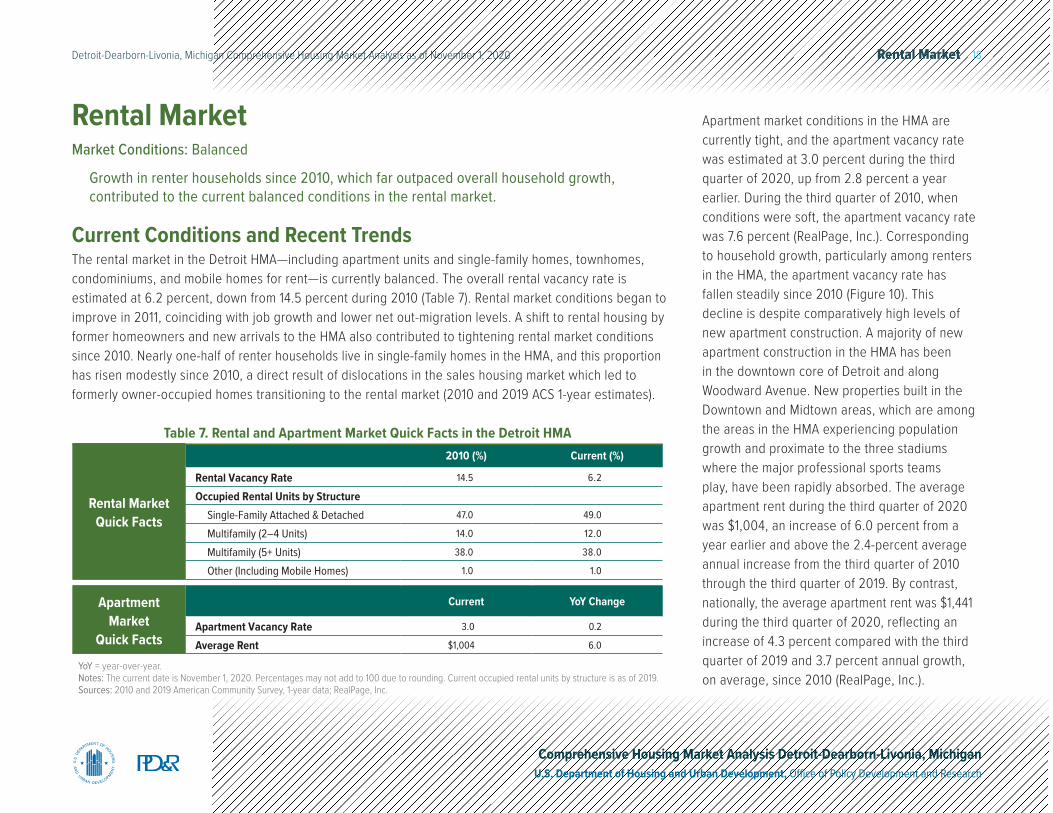
Current Conditions and Recent TrendsThe rental market in the Detroit HMA—including apartment units and single-family homes, townhomes, condominiums, and mobile homes for rent—is currently balanced. The overall rental vacancy rate is estimated at 6.2 percent, down from 14.5 percent during 2010 (Table 7). Rental market conditions began to improve in 2011, coinciding with job growth and lower net out-migration levels. A shift to rental housing by former homeowners and new arrivals to the HMA also contributed to tightening rental market conditions since 2010. Nearly one-half of renter households live in single-family homes in the HMA, and this proportion has risen modestly since 2010, a direct result of dislocations in the sales housing market which led to formerly owner-occupied homes transitioning to the rental market (2010 and 2019 ACS 1-year estimates).
Rental Market Quick Facts
2010 (%) Current (%)
Rental Vacancy Rate 14.5 6.2
Occupied Rental Units by StructureSingle-Family Attached & Detached 47.0 49.0
Multifamily (2–4 Units) 14.0 12.0
Multifamily (5+ Units) 38.0 38.0
Other (Including Mobile Homes) 1.0 1.0
Apartment Market
Quick Facts
Current YoY Change
Apartment Vacancy Rate 3.0 0.2
Average Rent $1,004 6.0
YoY = year-over-year.Notes: The current date is November 1, 2020. Percentages may not add to 100 due to rounding. Current occupied rental units by structure is as of 2019.Sources: 2010 and 2019 American Community Survey, 1-year data; RealPage, Inc.
Table 7. Rental and Apartment Market Quick Facts in the Detroit HMA
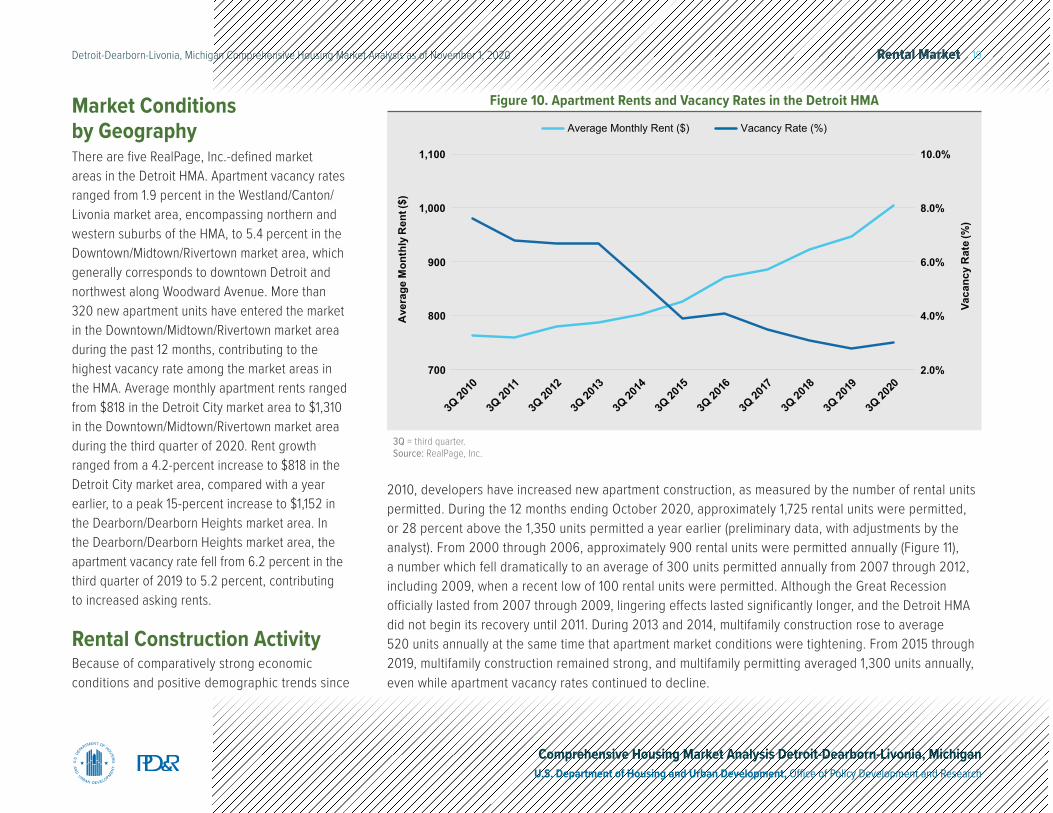
Apartment market conditions in the HMA are currently tight, and the apartment vacancy rate was estimated at 3.0 percent during the third quarter of 2020, up from 2.8 percent a year earlier. During the third quarter of 2010, when conditions were soft, the apartment vacancy rate was 7.6 percent (RealPage, Inc.). Corresponding to household growth, particularly among renters in the HMA, the apartment vacancy rate has fallen steadily since 2010 (Figure 10). This decline is despite comparatively high levels of new apartment construction. A majority of new apartment construction in the HMA has been in the downtown core of Detroit and along Woodward Avenue. New properties built in the Downtown and Midtown areas, which are among the areas in the HMA experiencing population growth and proximate to the three stadiums where the major professional sports teams play, have been rapidly absorbed. The average apartment rent during the third quarter of 2020 was $1,004, an increase of 6.0 percent from a year earlier and above the 2.4-percent average annual increase from the third quarter of 2010 through the third quarter of 2019. By contrast, nationally, the average apartment rent was $1,441 during the third quarter of 2020, reflecting an increase of 4.3 percent compared with the third quarter of 2019 and 3.7 percent annual growth, on average, since 2010 (RealPage, Inc.).
Rental Market 19Detroit-Dearborn-Livonia, Michigan Comprehensive Housing Market Analysis as of November 1, 2020
Comprehensive Housing Market Analysis Detroit-Dearborn-Livonia, MichiganU.S. Department of Housing and Urban Development, Office of Policy Development and Research
3Q = third quarter.Source: RealPage, Inc.
Average Monthly Rent ($) Vacancy Rate (%)
2.0%
4.0%
6.0%
8.0%
10.0%
700
800
900
1,000
1,100
3Q 20
10
3Q 20
11
3Q 20
12
3Q 20
13
3Q 20
14
3Q 20
15
3Q 20
16
3Q 20
17
3Q 20
18
3Q 20
19
3Q 20
20
Vaca
ncy
Rat
e (%
)
Ave
rage
Mon
thly
Ren
t ($)
Figure 10. Apartment Rents and Vacancy Rates in the Detroit HMAMarket Conditions by GeographyThere are five RealPage, Inc.-defined market areas in the Detroit HMA. Apartment vacancy rates ranged from 1.9 percent in the Westland/Canton/Livonia market area, encompassing northern and western suburbs of the HMA, to 5.4 percent in the Downtown/Midtown/Rivertown market area, which generally corresponds to downtown Detroit and northwest along Woodward Avenue. More than 320 new apartment units have entered the market in the Downtown/Midtown/Rivertown market area during the past 12 months, contributing to the highest vacancy rate among the market areas in the HMA. Average monthly apartment rents ranged from $818 in the Detroit City market area to $1,310 in the Downtown/Midtown/Rivertown market area during the third quarter of 2020. Rent growth ranged from a 4.2-percent increase to $818 in the Detroit City market area, compared with a year earlier, to a peak 15-percent increase to $1,152 in the Dearborn/Dearborn Heights market area. In the Dearborn/Dearborn Heights market area, the apartment vacancy rate fell from 6.2 percent in the third quarter of 2019 to 5.2 percent, contributing to increased asking rents.
Rental Construction ActivityBecause of comparatively strong economic conditions and positive demographic trends since
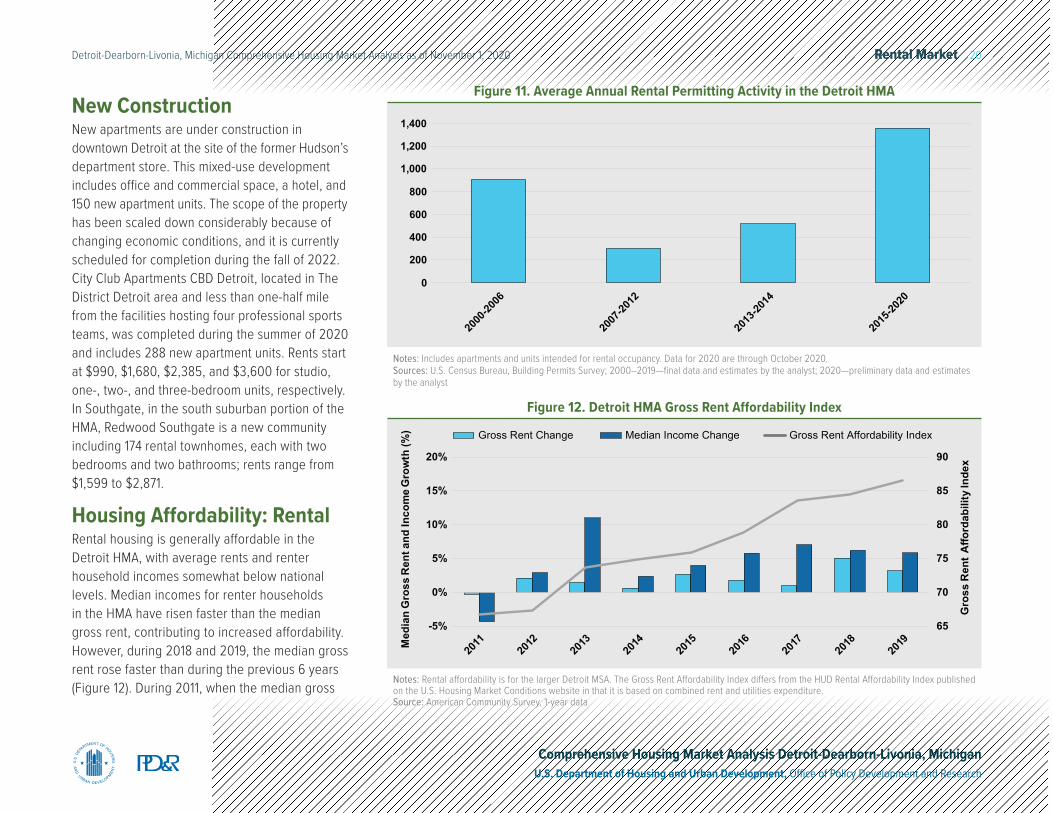
2010, developers have increased new apartment construction, as measured by the number of rental units permitted. During the 12 months ending October 2020, approximately 1,725 rental units were permitted, or 28 percent above the 1,350 units permitted a year earlier (preliminary data, with adjustments by the analyst). From 2000 through 2006, approximately 900 rental units were permitted annually (Figure 11), a number which fell dramatically to an average of 300 units permitted annually from 2007 through 2012, including 2009, when a recent low of 100 rental units were permitted. Although the Great Recession officially lasted from 2007 through 2009, lingering effects lasted significantly longer, and the Detroit HMA did not begin its recovery until 2011. During 2013 and 2014, multifamily construction rose to average 520 units annually at the same time that apartment market conditions were tightening. From 2015 through 2019, multifamily construction remained strong, and multifamily permitting averaged 1,300 units annually, even while apartment vacancy rates continued to decline.
Rental Market 20Detroit-Dearborn-Livonia, Michigan Comprehensive Housing Market Analysis as of November 1, 2020
Comprehensive Housing Market Analysis Detroit-Dearborn-Livonia, MichiganU.S. Department of Housing and Urban Development, Office of Policy Development and Research
Notes: Includes apartments and units intended for rental occupancy. Data for 2020 are through October 2020.Sources: U.S. Census Bureau, Building Permits Survey; 2000–2019—final data and estimates by the analyst; 2020—preliminary data and estimates by the analyst
0
200
400
600
800
1,000
1,200
1,400
2000
-2006
2007
-2012
2013
-2014
2015
-2020
Figure 11. Average Annual Rental Permitting Activity in the Detroit HMANew ConstructionNew apartments are under construction in downtown Detroit at the site of the former Hudson’s department store. This mixed-use development includes office and commercial space, a hotel, and 150 new apartment units. The scope of the property has been scaled down considerably because of changing economic conditions, and it is currently scheduled for completion during the fall of 2022. City Club Apartments CBD Detroit, located in The District Detroit area and less than one-half mile from the facilities hosting four professional sports teams, was completed during the summer of 2020 and includes 288 new apartment units. Rents start at $990, $1,680, $2,385, and $3,600 for studio, one-, two-, and three-bedroom units, respectively. In Southgate, in the south suburban portion of the HMA, Redwood Southgate is a new community including 174 rental townhomes, each with two bedrooms and two bathrooms; rents range from $1,599 to $2,871.
Housing Affordability: RentalRental housing is generally affordable in the Detroit HMA, with average rents and renter household incomes somewhat below national levels. Median incomes for renter households in the HMA have risen faster than the median gross rent, contributing to increased affordability. However, during 2018 and 2019, the median gross rent rose faster than during the previous 6 years (Figure 12). During 2011, when the median gross
Notes: Rental affordability is for the larger Detroit MSA. The Gross Rent Affordability Index differs from the HUD Rental Affordability Index published on the U.S. Housing Market Conditions website in that it is based on combined rent and utilities expenditure.Source: American Community Survey, 1-year data
Gross Rent Change Median Income Change Gross Rent Affordability Index
65
70
75
80
85
90
-5%
0%
5%
10%
15%
20%
2011
2012
2013
2014
2015
2016
2017
2018
2019
Gro
ss R
ent
Affo
rdab
ility
Inde
x
Med
ian
Gro
ss R
ent a
nd In
com
e G
row
th (%
)Figure 12. Detroit HMA Gross Rent Affordability Index
Rental Market 21Detroit-Dearborn-Livonia, Michigan Comprehensive Housing Market Analysis as of November 1, 2020
Comprehensive Housing Market Analysis Detroit-Dearborn-Livonia, MichiganU.S. Department of Housing and Urban Development, Office of Policy Development and Research
rent was nearly stable, but the median income for renter households was down significantly, the affordability index was 67; since 2011, renter incomes have increased faster than gross rents, and the affordability index has risen annually. This is likely because of the composition of job growth in the Detroit HMA; because manufacturing jobs contributed strongly to the growth of nonfarm payrolls, incomes rose at a strong pace. In the Detroit HMA, weekly wages for manufacturing jobs averaged nearly 23 percent higher than for all private sector jobs during 2019 (Quarterly Census of Employment and Wages).
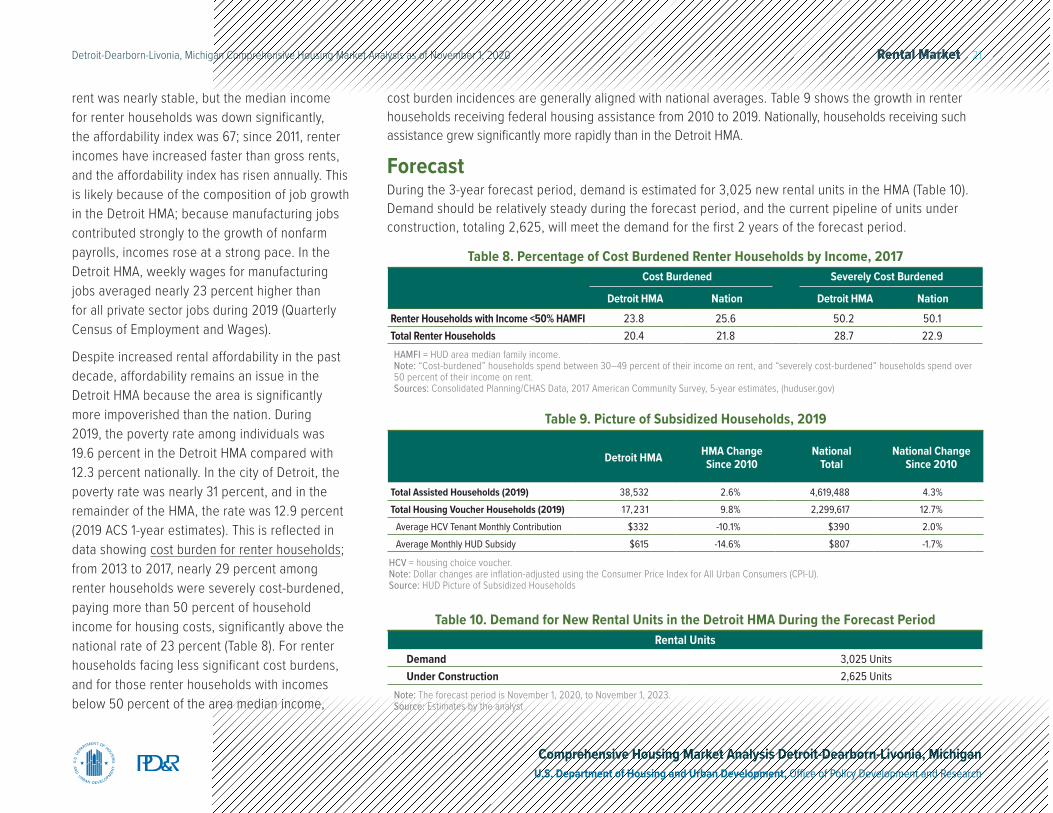
Despite increased rental affordability in the past decade, affordability remains an issue in the Detroit HMA because the area is significantly more impoverished than the nation. During 2019, the poverty rate among individuals was 19.6 percent in the Detroit HMA compared with 12.3 percent nationally. In the city of Detroit, the poverty rate was nearly 31 percent, and in the remainder of the HMA, the rate was 12.9 percent (2019 ACS 1-year estimates). This is reflected in data showing cost burden for renter households; from 2013 to 2017, nearly 29 percent among renter households were severely cost-burdened, paying more than 50 percent of household income for housing costs, significantly above the national rate of 23 percent (Table 8). For renter households facing less significant cost burdens, and for those renter households with incomes below 50 percent of the area median income,
Cost Burdened Severely Cost Burdened
Detroit HMA Nation Detroit HMA NationRenter Households with Income <50% HAMFI 23.8 25.6 50.2 50.1 Total Renter Households 20.4 21.8 28.7 22.9
Table 8. Percentage of Cost Burdened Renter Households by Income, 2017
HAMFI = HUD area median family income.Note: “Cost-burdened” households spend between 30–49 percent of their income on rent, and “severely cost-burdened” households spend over 50 percent of their income on rent.Sources: Consolidated Planning/CHAS Data, 2017 American Community Survey, 5-year estimates, (huduser.gov)
cost burden incidences are generally aligned with national averages. Table 9 shows the growth in renter households receiving federal housing assistance from 2010 to 2019. Nationally, households receiving such assistance grew significantly more rapidly than in the Detroit HMA.
ForecastDuring the 3-year forecast period, demand is estimated for 3,025 new rental units in the HMA (Table 10). Demand should be relatively steady during the forecast period, and the current pipeline of units under construction, totaling 2,625, will meet the demand for the first 2 years of the forecast period.
Detroit HMA HMA Change Since 2010
National Total
National Change Since 2010
Total Assisted Households (2019) 38,532 2.6% 4,619,488 4.3%Total Housing Voucher Households (2019) 17,231 9.8% 2,299,617 12.7%
Average HCV Tenant Monthly Contribution $332 -10.1% $390 2.0%Average Monthly HUD Subsidy $615 -14.6% $807 -1.7%
Table 9. Picture of Subsidized Households, 2019
HCV = housing choice voucher.Note: Dollar changes are inflation-adjusted using the Consumer Price Index for All Urban Consumers (CPI-U).Source: HUD Picture of Subsidized Households
Note: The forecast period is November 1, 2020, to November 1, 2023.Source: Estimates by the analyst
Rental UnitsDemand 3,025 UnitsUnder Construction 2,625 Units
Table 10. Demand for New Rental Units in the Detroit HMA During the Forecast Period
Terminology Definitions and Notes 22Detroit-Dearborn-Livonia, Michigan Comprehensive Housing Market Analysis as of November 1, 2020
Comprehensive Housing Market Analysis Detroit-Dearborn-Livonia, MichiganU.S. Department of Housing and Urban Development, Office of Policy Development and Research
Terminology Definitions and Notes
A. Definitions
Building Permits
Building permits do not necessarily reflect all residential building activity that occurs in an HMA. Some units are constructed or created without a building permit or are issued a different type of building permit. For example, some units classified as commercial structures are not reflected in the residential building permits. As a result, the analyst, through diligent fieldwork, makes an estimate of this additional construction activity. Some of these estimates are included in the discussions of single-family and multifamily building permits.
Cost Burdened Spending more than 30 percent of household income on housing costs.
Demand
The demand estimates in the analysis are not a forecast of building activity. They are the estimates of the total housing production needed to achieve a balanced market at the end of the 3-year forecast period given conditions on the as-of date of the analysis, growth, losses, and excess vacancies. The estimates do not account for units currently under construction or units in the development pipeline.
Distressed Sales Short sales and real estate owned (REO) sales.
Forecast Period 11/1/2020–11/1/2023—Estimates by the analyst.
Home Sales/Home Sales Prices
Includes single-family, townhome, and condominium sales.
Location Quotient The concentration of an industry to that area compared to the concentration of that industry nationwide.
Terminology Definitions and Notes 23Detroit-Dearborn-Livonia, Michigan Comprehensive Housing Market Analysis as of November 1, 2020
Comprehensive Housing Market Analysis Detroit-Dearborn-Livonia, MichiganU.S. Department of Housing and Urban Development, Office of Policy Development and Research
Other Vacant Units
In this analysis conducted by the U.S. Department of Housing and Urban Development (HUD), other vacant units include all vacant units that are not available for sale or for rent. The term, therefore, includes units rented or sold but not occupied; held for seasonal, recreational, or occasional use; used by migrant workers; and the category specified as “other” vacant by the Census Bureau.
Rental Market/Rental Vacancy Rate
Includes apartments and other rental units such as single-family, multifamily, and mobile homes.
Seriously Delinquent Mortgages
Mortgages 90+ days delinquent or in foreclosure.
B. Notes on Geography
1. The metropolitan division definition noted in this report is based on the delineations established by the Office of Management and Budget (OMB) in the OMB Bulletin dated April 10, 2018.
2. Urbanized areas are defined using the U.S. Census Bureau 2010 Census Urban and Rural Classification and the Urban Area Criteria.
3. The census tracts referenced in this report are from the 2010 Census.
4. The Warren-Troy-Farmington Hills Michigan Metropolitan Division, referenced in the Population and Households section of this report is a five-county metropolitan division that, with the Detroit HMA, forms the six-county Detroit-Warren-Dearborn Michigan Metropolitan Statistical Area.
C. Additional Notes
1.This analysis has been prepared for the assistance and guidance of HUD in its operations. The factual information, findings, and conclusions may also be useful to builders, mortgagees, and others concerned with local housing market conditions and trends. The analysis does not purport to make determinations regarding the acceptability of any mortgage insurance proposals that may be under consideration by the Department.
Terminology Definitions and Notes 24Detroit-Dearborn-Livonia, Michigan Comprehensive Housing Market Analysis as of November 1, 2020
Comprehensive Housing Market Analysis Detroit-Dearborn-Livonia, MichiganU.S. Department of Housing and Urban Development, Office of Policy Development and Research
2.
The factual framework for this analysis follows the guidelines and methods developed by the Economic and Market Analysis Division within HUD. The analysis and findings are as thorough and current as possible based on information available on the as-of date from local and national sources. As such, findings or conclusions may be modified by subsequent developments. HUD expresses its appreciation to those industry sources and state and local government officials who provided data and information on local economic and housing market conditions.
D. Photo/Map Credits
Cover Photo iStock
Contact InformationGabriel A. Labovitz, Economist Chicago HUD Regional Office312–913–[email protected]